Exhibit IV 2023 Annual Report
2 ANNUAL REPORT 2023 Contents We finance projects that accelerate the climate and energy transition in the Nordic-Baltic region. Read more on p. 17 16 51 Introduction 3Governance 68 This is NIB 4 Governance Statement 69 Our year 5 Members of the governing bodies and management 73 Message from the President and CEO 7 Strategy 9 Report of the Board of Directors 78 Value creation 12 Financial Reporting 93 Impact and sustainability 13 Financial statements and notes 95 Lending impact 14 Proposal by the Board of Directors 162 Funding in 2023 23 Auditor’s report 163 NIB Environmental Bonds 24 Report of the Control Committee Chairmanship 169 Action for climate 37 Report of the Control Committee 172 Impact from our internal operations 47 Ratio definitions 173 Impactful workplace 51 Sustainability management 55 Sustainability indices 174 About this report: NIB is publishing Our commitments and partnerships 58 GRI content index 175 one combined report covering our Stakeholder engagement 60 PRB content index 181 activities, impact, sustainability, and Defining what matters 63 TCFD disclosure index 191 financial reporting. About this report 65 Independent Assurance Report 66 Glossary is available here NIB’s Integrity Report 2023 Cover images: Scania, Andris Barbans, and Teemu Kuusimurto. is available here. Photo on the right: Ignitis Group.
ANNUAL REPORT 2023 INTRODUCTION INTRODUCTION This is NIB Our year CEO message We provide Strategy Value creation long-term IMPACT & SUSTAINABILITY GOVERNANCE financing BOD REPORT FINANCIALS SUSTAINABILITY INDICES I applied for the Country Lead position in search of new challenges and a more international environment. The position offers me the opportunity to bring NIB closer to new clients in Latvia. When I applied, I already knew NIB was involved in financing green transition projects. By taking the role, I’m helping to find green financing opportunities and supporting Latvia become even more sustainable in the future. Kaspars Piladzis, Senior Banker, Country Lead Latvia
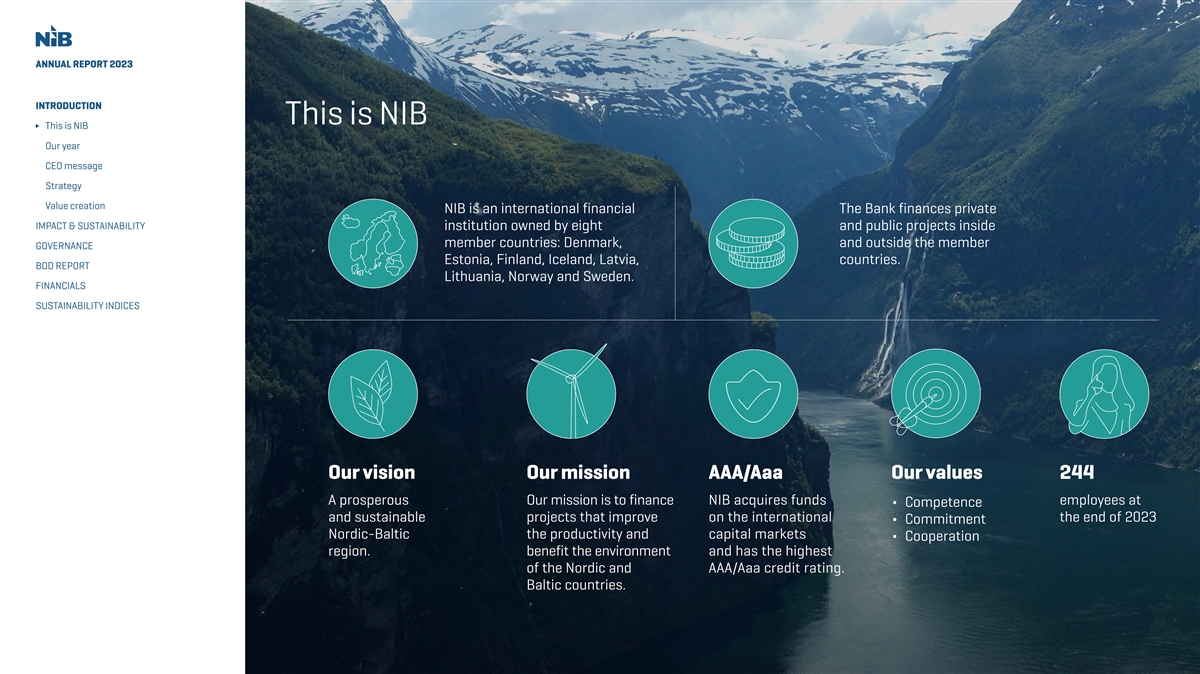
4 ANNUAL REPORT 2023 INTRODUCTION This is NIB This is NIB Our year CEO message Strategy Value creation NIB is an international financial The Bank finances private IMPACT & SUSTAINABILITY institution owned by eight and public projects inside member countries: Denmark, and outside the member GOVERNANCE Estonia, Finland, Iceland, Latvia, countries. BOD REPORT Lithuania, Norway and Sweden. FINANCIALS SUSTAINABILITY INDICES Our vision Our mission AAA/Aaa Our values 244 A prosperous Our mission is to finance NIB acquires funds employees at ∆ Competence and sustainable projects that improve on the international the end of 2023 ∆ Commitment Nordic-Baltic the productivity and capital markets ∆ Cooperation region. benefit the environment and has the highest of the Nordic and AAA/Aaa credit rating. Baltic countries.
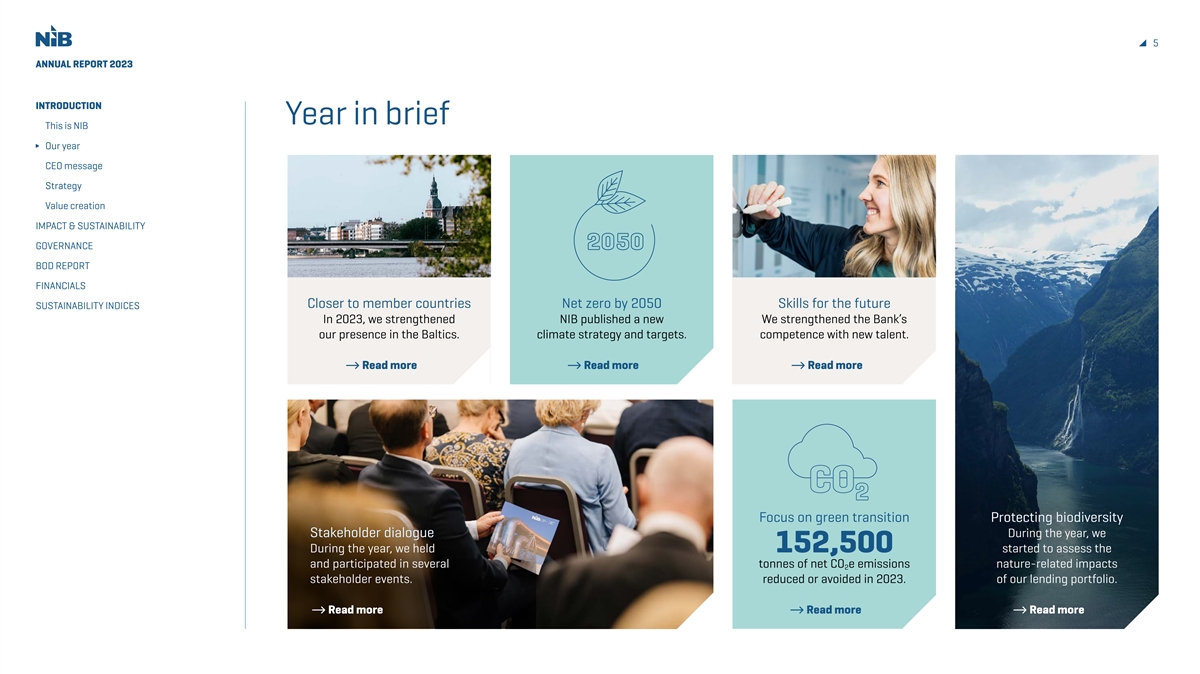
5 ANNUAL REPORT 2023 INTRODUCTION Year in brief This is NIB Our year CEO message Strategy Value creation IMPACT & SUSTAINABILITY GOVERNANCE BOD REPORT FINANCIALS Closer to member countries Net zero by 2050 Skills for the future SUSTAINABILITY INDICES In 2023, we strengthened NIB published a new We strengthened the Bank’s our presence in the Baltics. climate strategy and targets. competence with new talent. Read more Read more Read more Focus on green transition P Prot rotecting biodiv ecting biodiver ersity sity Stak Stakeholder dialogue eholder dialogue During the year, we During the year, we held 152,500 started to assess the and participated in several tonnes of net CO e emissions nature-related impacts 2 stakeholder events. reduced or avoided in 2023. of our lending portfolio. Read more Read more Read more
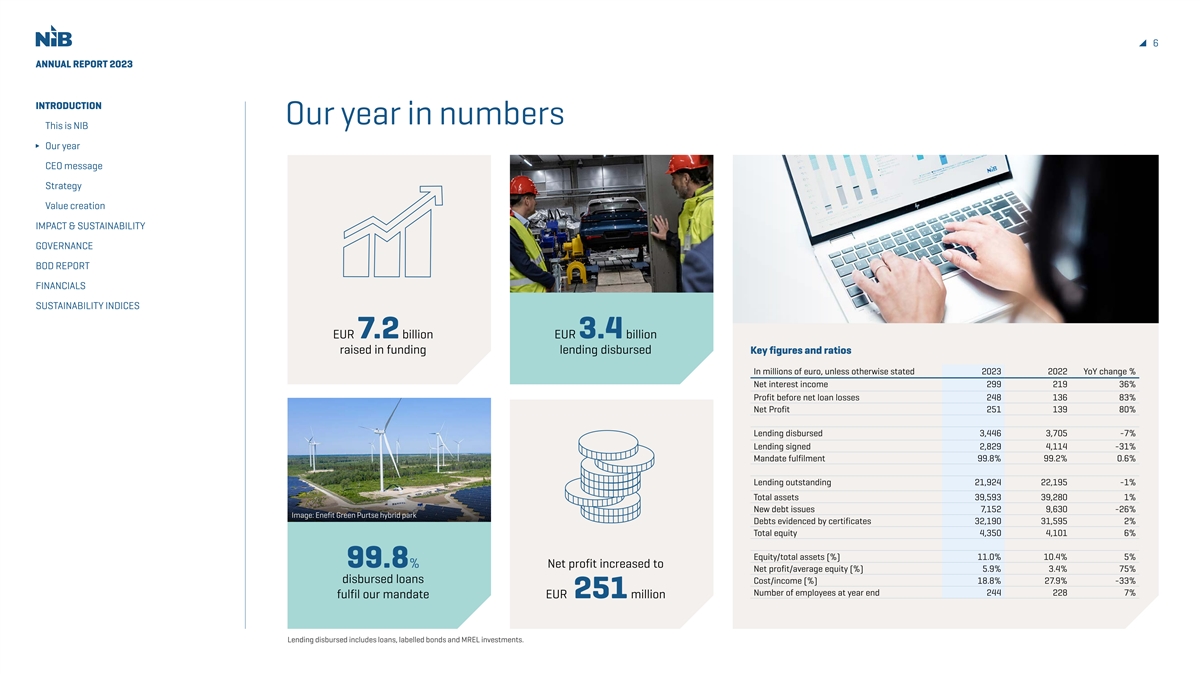
6 ANNUAL REPORT 2023 INTRODUCTION Our year in numbers This is NIB Our year CEO message Strategy Value creation IMPACT & SUSTAINABILITY GOVERNANCE BOD REPORT FINANCIALS SUSTAINABILITY INDICES EUR 7.2 billion EUR 3.4 billion raised in funding lending disbursed Key figures and ratios In millions of euro, unless otherwise stated 2023 2022 YoY change % Net interest income 299 219 36% Profit before net loan losses 248 136 83% Net Profit 251 139 80% Lending disbursed 3,446 3,705 -7% Lending signed 2,829 4,114 -31% Mandate fulfilment 99.8% 99.2% 0.6% Lending outstanding 21,924 22,195 -1% Total assets 39,593 39,280 1% New debt issues 7,152 9,630 -26% Image: Enefit Green Purtse hybrid park Debts evidenced by certificates 32,190 31,595 2% Total equity 4,350 4,101 6% Equity/total assets (%) 11.0% 10.4% 5% 99.8% Net profit increased to Net profit/average equity (%) 5.9% 3.4% 75% disbursed loans Cost/income (%) 18.8% 27.9% -33% Number of employees at year end 244 228 7% fulfil our mandate EUR 251 million Lending disbursed includes loans, labelled bonds and MREL investments.

7 ANNUAL REPORT 2023 INTRODUCTION Message from the President and CEO This is NIB Our year Strengthening our ties CEO message Strategy We opened our Value creation Riga office IMPACT & SUSTAINABILITY The Nordic-Baltic countries entered 2023 While the Bank has recently been helping to enhance our dealing with the consequences of recent our member countries tackle the short-term GOVERNANCE disruptions. Against the backdrop of new shocks, the long-term challenges we face as Baltic presence. BOD REPORT geopolitical realities and past interest rate a region have not disappeared. As the climate FINANCIALS increases, uncertainty remained around and nature crisis is worsening, we must address the future economic development as the both mitigation and adaptation strategies to SUSTAINABILITY INDICES year went on. build resilience. As our societies are ageing, For the Nordic Investment Bank (NIB), we must rejuvenate our economies by investing it was a reminder that international financial in innovation, digitalisation and human capital. institutions like ours play a key role in ensuring Despite this, I remain optimistic. During the stability. Building on NIB’s triple-A credit year, we saw our owners, customers and ratings, we can mobilise private capital investors concentrating even more efforts on and leverage public investments. With NIB’s a green and just transition. Working with you— long-term lending, we can scale up financing our stakeholders—allowed NIB to sharpen the in spite of turbulence. tools that will speed up our journey towards a sustainable future. Closer to our stakeholders As a new addition to this toolbox, we opened an office in Riga to enhance our Baltic presence. Setting up a regional hub is in line with NIB’s strategy of increasing investment in underserved market segments, such as expanding our lending to private sector NIB can mobilise private companies in the Baltics. capital and leverage At the same time, we continued to public investments. build on our partnerships through various

8 ANNUAL REPORT 2023 INTRODUCTION INTRODUCTION events. With NIB’s Board of Directors, environment of the Nordic-Baltic countries. Ready for a sustainable future we held external stakeholder seminars In 2023, we fortified the latter commitment NIB also reinforced its in-house expertise during This is NIB This is NIB in Riga and Stockholm focusing on the with the launch of the NIB Climate Strategy the year. We welcomed two new colleagues to Our y Our year ear green transition and the future of mobility. and targets at COP28. our Executive Committee and saw the entire NIB CEO message CEO message With NIB colleagues, we visited many This significant milestone sets an work community continue to grow, advancing the clients and projects shaping the future actionable plan for driving the sustainable Bank further. To accommodate this growth, NIB’s Strat Strategy egy of our region. transformation. The strategy commits NIB to Climate strategy Board of Directors approved the Bank’s long-term V Value creation alue creation Next year, NIB will continue bringing tangible science-based targets that are aligned targets to guide our operations in this decade and commits NIB to tangible IMP IMPA ACT & SUS CT & SUST TAINABILITY AINABILITY our stakeholders closer. These meetings are not with the Paris Agreement, reducing greenhouse beyond. science-based targets. merely a privilege that we have as a relatively gas emissions through our financing activities Yet while adding new talent and setting GO GOVERNANCE VERNANCE small regional community. They allow us to and operations. By setting NIB’s own climate the right targets are crucial for achieving our BOD REPOR BOD REPORT T identify the priorities of our member countries targets, we are even better placed to support common goals, their realisation does not rest FINANCIAL FINANCIALS S and explore how NIB can best assist them. our member countries’ decarbonisation goals. on our shoulders alone. Having a clear direction enables us to move Here, let me turn back to you. NIB’s strength SUS SUST TAINABILITY INDICES AINABILITY INDICES Ambitious climate targets forward with confidence, steering the region fulfilment also remained high, a record 99.8% lies in the dedication of our employees, the The fundamental ask from our owners towards a more resilient future. We will also of NIB’s disbursements were rated “good” or success of our customers, the trust of prevails in NIB’s mission—financing projects continue to bolster our approach to nature “excellent” in terms of environmental and our investors and the support of our owners. that improve productivity and benefit the action. During the year, we have started to productivity benefits. As the global landscape evolves, those assess nature-related impacts at the portfolio During the year, NIB raised new funding who swiftly adapt to the new conditions will level that will serve as a basis for setting with a nominal value of EUR 7.2 billion, gain an advantage. targets for nature. bringing funds to our region from international We are ready to support our stakeholders capital markets and creating a solid liquidity in this transition. We are committed to Delivering on our mission position. To fund projects accelerating the remaining your reliable partner. Together, Another reason to remain confident is the transition to low-carbon economies, the Bank we are financing the future. continued demand for our long-term lending, issued an equivalent of EUR 757 million in NIB which allowed NIB to prioritise high-impact Environmental Bonds. André Küüsvek, projects. In 2023, we disbursed EUR 3.4 billion NIB’s net profit increased by 80% from EUR President and CEO to facilitate decarbonisation, build renewable 139 million in 2022 to EUR 251 million in 2023 energy generation, upgrade electricity as the Bank recorded its highest ever net NIB’s net profit increased networks, or foster research and development, interest income from a solid loan portfolio and Read the Report of the Board of Directors by 80% to EUR 251 million for example. treasury activities. Increasing the capital NIB’s customer focus on the green accumulation from earnings has strengthened in 2023 as the Bank transition was evident in our environmental the NIB’s financial position and capital ratios, recorded its highest ever mandate result, the share of which reached which are the foundation for continuing to net interest income. historic highs. As the productivity mandate deliver on our mission.
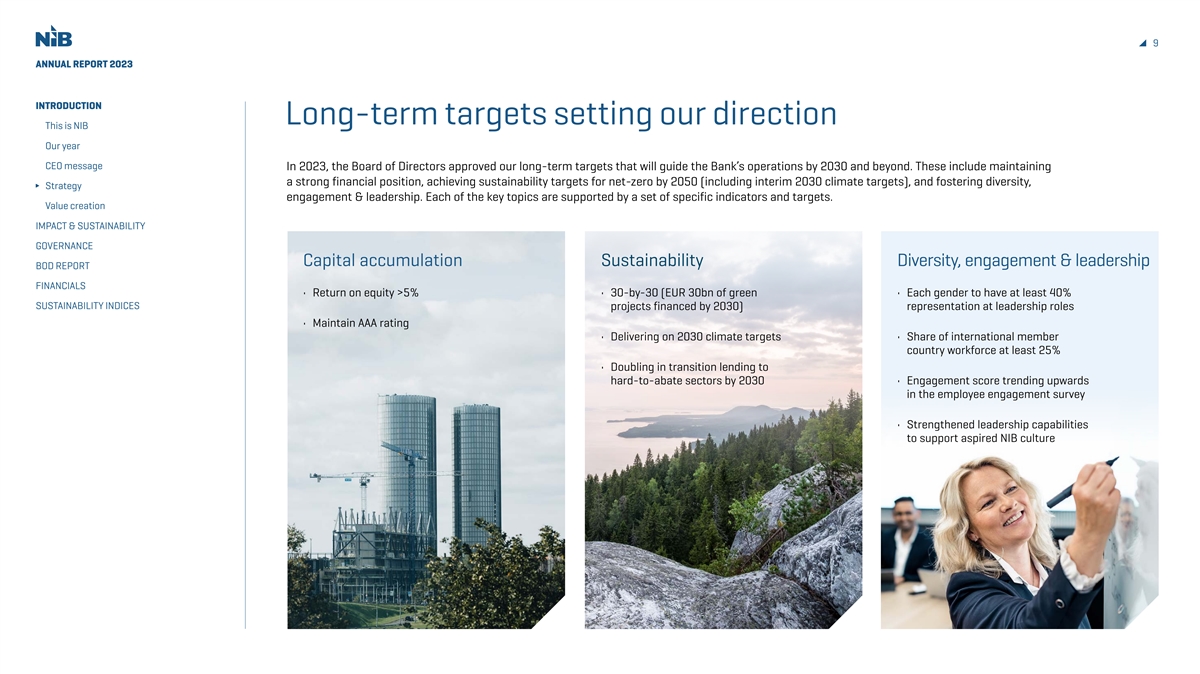
9 ANNUAL REPORT 2023 INTRODUCTION Long-term targets setting our direction This is NIB Our year CEO message In 2023, the Board of Directors approved our long-term targets that will guide the Bank’s operations by 2030 and beyond. These include maintaining a strong financial position, achieving sustainability targets for net-zero by 2050 (including interim 2030 climate targets), and fostering diversity, Strategy engagement & leadership. Each of the key topics are supported by a set of specific indicators and targets. Value creation IMPACT & SUSTAINABILITY GOVERNANCE Capital accumulation Sustainability Diversity, engagement & leadership BOD REPORT FINANCIALS • Return on equity >5% • 30-by-30 (EUR 30bn of green • Each gender to have at least 40% SUSTAINABILITY INDICES projects financed by 2030) representation at leadership roles • Maintain AAA rating • Delivering on 2030 climate targets • Share of international member country workforce at least 25% • Doubling in transition lending to hard-to-abate sectors by 2030 • Engagement score trending upwards in the employee engagement survey • Strengthened leadership capabilities to support aspired NIB culture
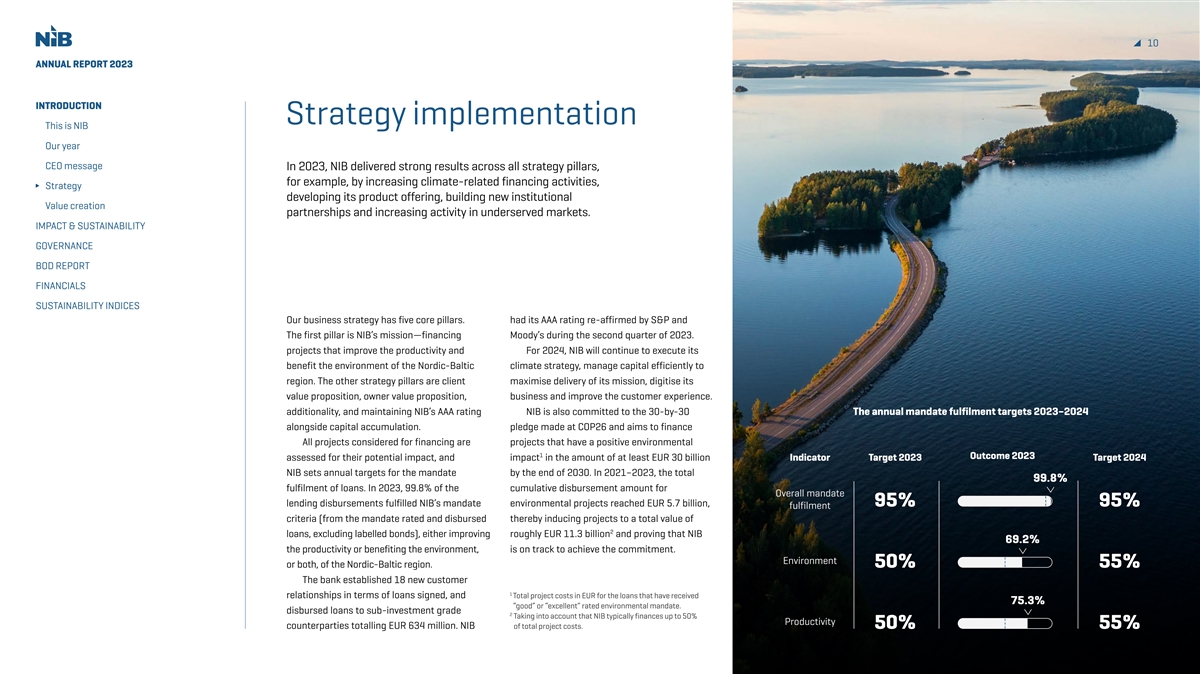
10 ANNUAL REPORT 2023 INTRODUCTION Strategy implementation This is NIB Our year CEO message In 2023, NIB delivered strong results across all strategy pillars, for example, by increasing climate-related financing activities, Strategy developing its product offering, building new institutional Value creation partnerships and increasing activity in underserved markets. IMPACT & SUSTAINABILITY GOVERNANCE BOD REPORT FINANCIALS SUSTAINABILITY INDICES Our business strategy has five core pillars. had its AAA rating re-affirmed by S&P and The first pillar is NIB’s mission—financing Moody’s during the second quarter of 2023. projects that improve the productivity and For 2024, NIB will continue to execute its benefit the environment of the Nordic-Baltic climate strategy, manage capital efficiently to region. The other strategy pillars are client maximise delivery of its mission, digitise its value proposition, owner value proposition, business and improve the customer experience. additionality, and maintaining NIB’s AAA rating NIB is also committed to the 30-by-30 The annual mandate fulfilment targets 2023–2024 alongside capital accumulation. pledge made at COP26 and aims to finance All projects considered for financing are projects that have a positive environmental 1 Outcome 2023 assessed for their potential impact, and impact in the amount of at least EUR 30 billion Indicator Target 2023 Target 2024 NIB sets annual targets for the mandate by the end of 2030. In 2021–2023, the total 99.8% fulfilment of loans. In 2023, 99.8% of the cumulative disbursement amount for Overall mandate lending disbursements fulfilled NIB’s mandate environmental projects reached EUR 5.7 billion, 95% 95% fulfilment criteria (from the mandate rated and disbursed thereby inducing projects to a total value of 2 loans, excluding labelled bonds), either improving roughly EUR 11.3 billion and proving that NIB 69.2% the productivity or benefiting the environment, is on track to achieve the commitment. Environment or both, of the Nordic-Baltic region. 50% 55% The bank established 18 new customer 1 relationships in terms of loans signed, and Total project costs in EUR for the loans that have received 75.3% “good” or “excellent” rated environmental mandate. disbursed loans to sub-investment grade 2 Taking into account that NIB typically finances up to 50% Productivity counterparties totalling EUR 634 million. NIB of total project costs. 50% 55%
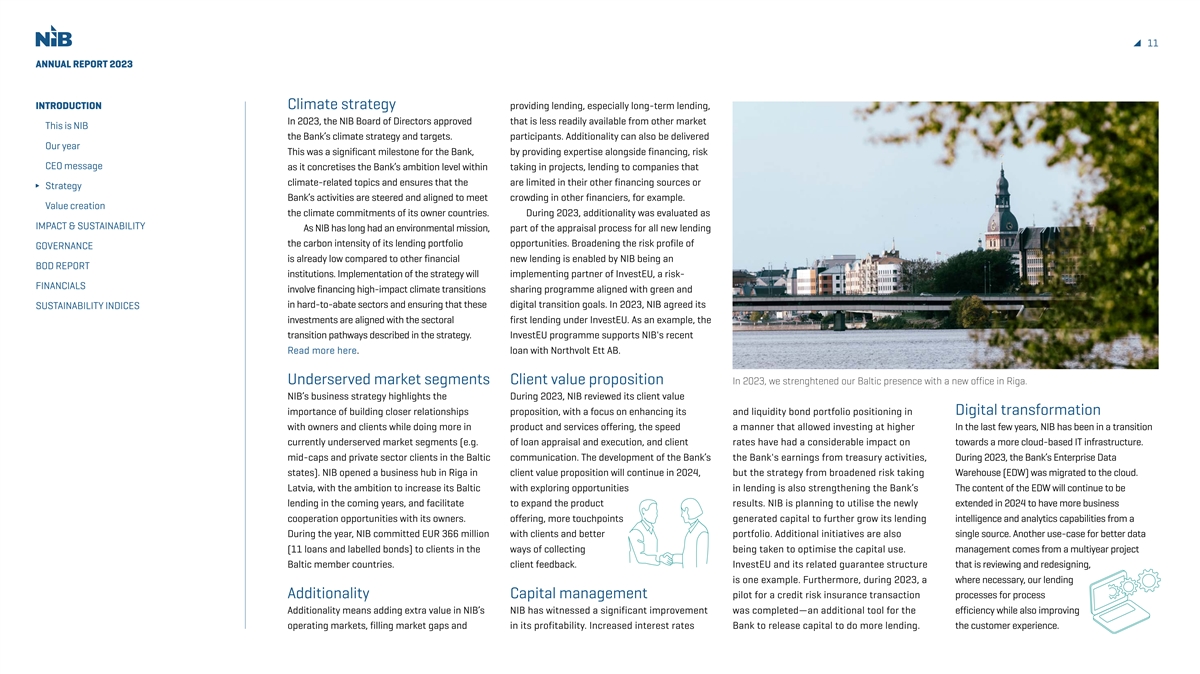
11 ANNUAL REPORT 2023 INTRODUCTION Climate strategy providing lending, especially long-term lending, In 2023, the NIB Board of Directors approved that is less readily available from other market This is NIB the Bank’s climate strategy and targets. participants. Additionality can also be delivered Our year This was a significant milestone for the Bank, by providing expertise alongside financing, risk CEO message as it concretises the Bank’s ambition level within taking in projects, lending to companies that climate-related topics and ensures that the are limited in their other financing sources or Strategy Bank’s activities are steered and aligned to meet crowding in other financiers, for example. Value creation the climate commitments of its owner countries. During 2023, additionality was evaluated as IMPACT & SUSTAINABILITY As NIB has long had an environmental mission, part of the appraisal process for all new lending the carbon intensity of its lending portfolio opportunities. Broadening the risk profile of GOVERNANCE is already low compared to other financial new lending is enabled by NIB being an BOD REPORT institutions. Implementation of the strategy will implementing partner of InvestEU, a risk- FINANCIALS involve financing high-impact climate transitions sharing programme aligned with green and in hard-to-abate sectors and ensuring that these digital transition goals. In 2023, NIB agreed its SUSTAINABILITY INDICES investments are aligned with the sectoral first lending under InvestEU. As an example, the transition pathways described in the strategy. InvestEU programme supports NIB's recent Read more here. loan with Northvolt Ett AB. Underserved market segments Client value proposition In 2023, we strenghtened our Baltic presence with a new office in Riga. NIB’s business strategy highlights the During 2023, NIB reviewed its client value importance of building closer relationships proposition, with a focus on enhancing its and liquidity bond portfolio positioning in Digital transformation with owners and clients while doing more in product and services offering, the speed a manner that allowed investing at higher In the last few years, NIB has been in a transition currently underserved market segments (e.g. of loan appraisal and execution, and client rates have had a considerable impact on towards a more cloud-based IT infrastructure. mid-caps and private sector clients in the Baltic communication. The development of the Bank’s the Bank's earnings from treasury activities, During 2023, the Bank’s Enterprise Data states). NIB opened a business hub in Riga in client value proposition will continue in 2024, but the strategy from broadened risk taking Warehouse (EDW) was migrated to the cloud. Latvia, with the ambition to increase its Baltic with exploring opportunities in lending is also strengthening the Bank’s The content of the EDW will continue to be lending in the coming years, and facilitate to expand the product results. NIB is planning to utilise the newly extended in 2024 to have more business cooperation opportunities with its owners. offering, more touchpoints generated capital to further grow its lending intelligence and analytics capabilities from a During the year, NIB committed EUR 366 million with clients and better portfolio. Additional initiatives are also single source. Another use-case for better data (11 loans and labelled bonds) to clients in the ways of collecting being taken to optimise the capital use. management comes from a multiyear project Baltic member countries. client feedback. InvestEU and its related guarantee structure that is reviewing and redesigning, is one example. Furthermore, during 2023, a where necessary, our lending Additionality Capital management pilot for a credit risk insurance transaction processes for process Additionality means adding extra value in NIB’s NIB has witnessed a significant improvement was completed—an additional tool for the efficiency while also improving operating markets, filling market gaps and in its profitability. Increased interest rates Bank to release capital to do more lending. the customer experience.
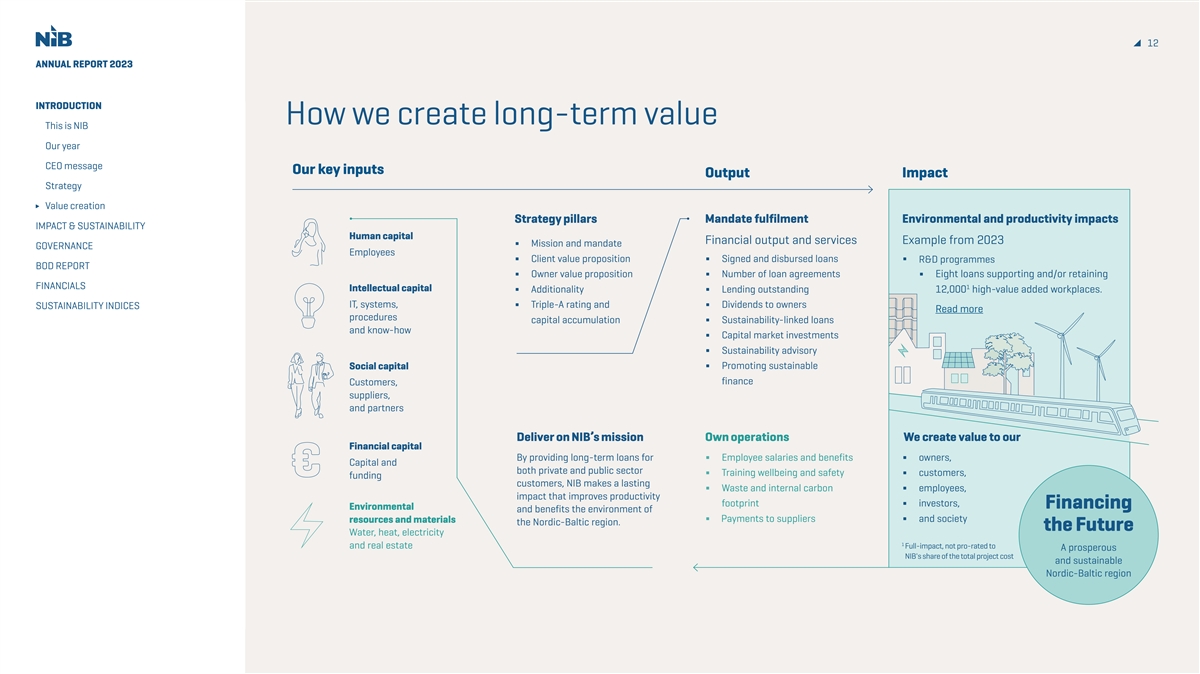
12 ANNUAL REPORT 2023 INTRODUCTION How we create long-term value This is NIB Our year CEO message Our key inputs Output Impact Strategy Value creation Strategy pillars Mandate fulfilment Environmental and productivity impacts IMPACT & SUSTAINABILITY Human capital Financial output and services Example from 2023 Mission and mandate ∆ GOVERNANCE Employees Client value proposition Signed and disbursed loans ∆ ∆ ∆ R&D programmes BOD REPORT Owner value proposition Number of loan agreements Eight loans supporting and/or retaining ∆ ∆ ∆ FINANCIALS 1 Intellectual capital Additionality Lending outstanding 12,000 high-value added workplaces. ∆ ∆ IT, systems, Triple-A rating and Dividends to owners SUSTAINABILITY INDICES ∆ ∆ Read more procedures capital accumulation Sustainability-linked loans ∆ and know-how Capital market investments ∆ Sustainability advisory ∆ Social capital Promoting sustainable ∆ finance Customers, suppliers, and partners Deliver on NIB’s mission Own operations We create value to our Financial capital By providing long-term loans for Employee salaries and benefits owners, ∆ ∆ Capital and both private and public sector Training wellbeing and safety customers, ∆ ∆ funding customers, NIB makes a lasting Waste and internal carbon employees, ∆ ∆ impact that improves productivity footprint investors, ∆ Financing Environmental and benefits the environment of Payments to suppliers and society resources and materials ∆ ∆ the Nordic-Baltic region. the Future Water, heat, electricity 1 and real estate Full-impact, not pro-rated to A prosperous NIB's share of the total project cost and sustainable Nordic-Baltic region
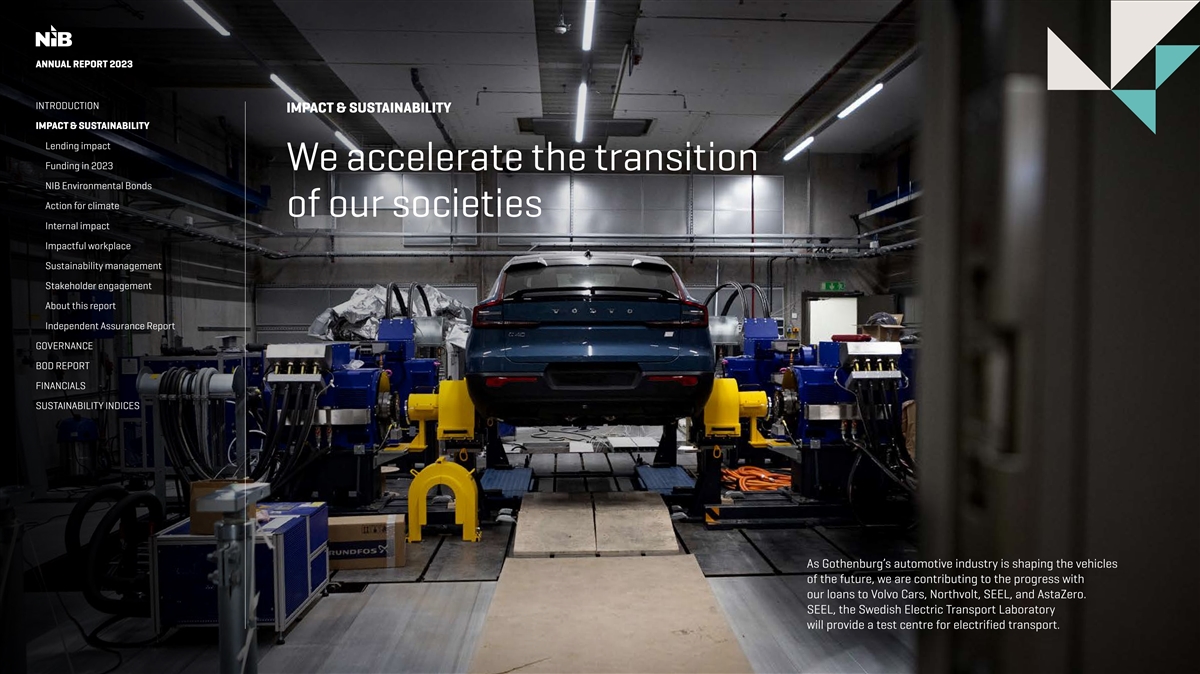
ANNUAL REPORT 2023 INTRODUCTION IMPACT & SUSTAINABILITY IMPACT & SUSTAINABILITY Lending impact Funding in 2023 We accelerate the transition NIB Environmental Bonds Action for climate of our societies Internal impact Impactful workplace Sustainability management Stakeholder engagement About this report Independent Assurance Report GOVERNANCE BOD REPORT FINANCIALS SUSTAINABILITY INDICES As Gothenburg’s automotive industry is shaping the vehicles of the future, we are contributing to the progress with our loans to Volvo Cars, Northvolt, SEEL, and AstaZero. SEEL, the Swedish Electric Transport Laboratory will provide a test centre for electrified transport.
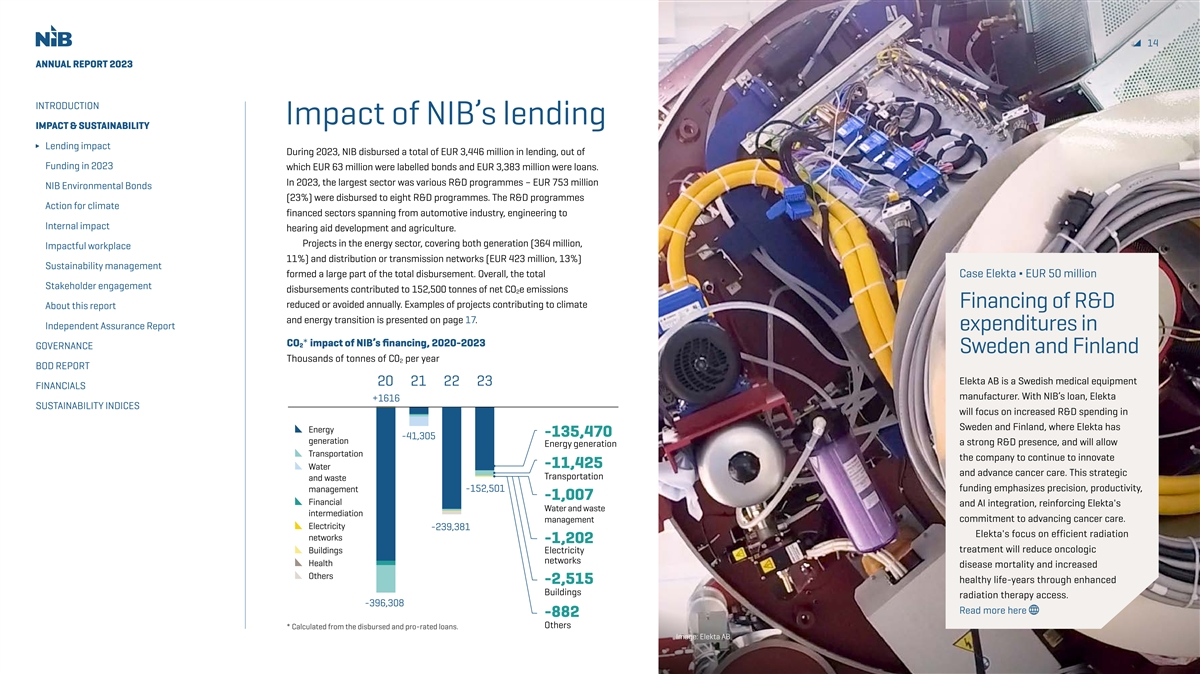
14 ANNUAL REPORT 2023 INTRODUCTION Impact of NIB’s lending IMPACT & SUSTAINABILITY Lending impact During 2023, NIB disbursed a total of EUR 3,446 million in lending, out of Funding in 2023 which EUR 63 million were labelled bonds and EUR 3,383 million were loans. In 2023, the largest sector was various R&D programmes – EUR 753 million NIB Environmental Bonds (23%) were disbursed to eight R&D programmes. The R&D programmes Action for climate financed sectors spanning from automotive industry, engineering to Internal impact hearing aid development and agriculture. Projects in the energy sector, covering both generation (364 million, Impactful workplace 11%) and distribution or transmission networks (EUR 423 million, 13%) Sustainability management formed a large part of the total disbursement. Overall, the total Case Elekta ∆ EUR 50 million Stakeholder engagement disbursements contributed to 152,500 tonnes of net CO e emissions 2 reduced or avoided annually. Examples of projects contributing to climate Financing of R&D About this report and energy transition is presented on page 17. Independent Assurance Report expenditures in CO * impact of NIB’s financing, 2020-2023 2 GOVERNANCE Sweden and Finland Thousands of tonnes of C0 per year 2 BOD REPORT Elekta AB is a Swedish medical equipment 20 21 22 23 FINANCIALS manufacturer. With NIB’s loan, Elekta +1616 SUSTAINABILITY INDICES will focus on increased R&D spending in Sweden and Finland, where Elekta has Energy -135,470 -41,305 generation a strong R&D presence, and will allow Energy generation Transportation the company to continue to innovate -11,425 Water and advance cancer care. This strategic Transportation and waste -152,501 funding emphasizes precision, productivity, management -1,007 Financial and AI integration, reinforcing Elekta's Water and waste intermediation management commitment to advancing cancer care. Electricity -239,381 Elekta's focus on efficient radiation networks -1,202 treatment will reduce oncologic Buildings Electricity networks Health disease mortality and increased Others healthy life-years through enhanced -2,515 Buildings radiation therapy access. -396,308 Read more here -882 Others * Calculated from the disbursed and pro-rated loans. Image: Elekta AB
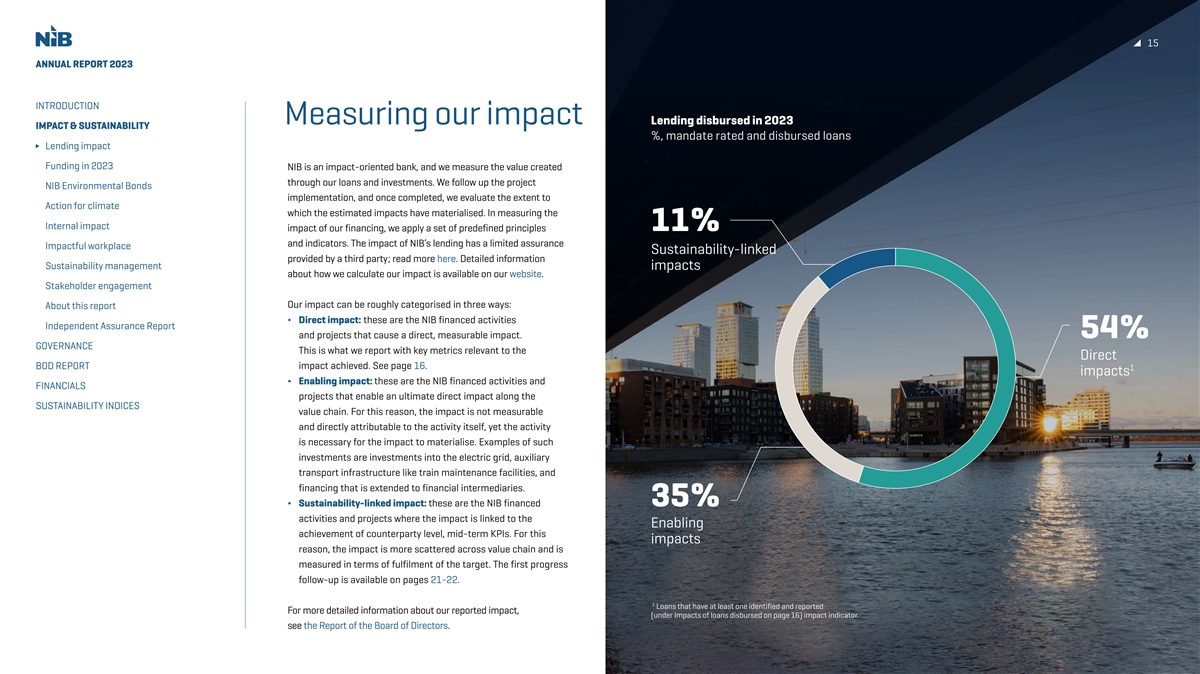
15 ANNUAL REPORT 2023 INTRODUCTION Measuring our impact Lending disbursed in 2023 IMPACT & SUSTAINABILITY %, mandate rated and disbursed loans Lending impact Funding in 2023 NIB is an impact-oriented bank, and we measure the value created through our loans and investments. We follow up the project NIB Environmental Bonds implementation, and once completed, we evaluate the extent to Action for climate which the estimated impacts have materialised. In measuring the Internal impact impact of our financing, we apply a set of predefined principles 11% and indicators. The impact of NIB’s lending has a limited assurance Impactful workplace Sustainability-linked provided by a third party; read more here. Detailed information Sustainability management impacts about how we calculate our impact is available on our website. Stakeholder engagement Our impact can be roughly categorised in three ways: About this report ∆ Direct impact: these are the NIB financed activities Independent Assurance Report and projects that cause a direct, measurable impact. 54% GOVERNANCE This is what we report with key metrics relevant to the Direct BOD REPORT impact achieved. See page 16. 1 impacts ∆ Enabling impact: these are the NIB financed activities and FINANCIALS projects that enable an ultimate direct impact along the SUSTAINABILITY INDICES value chain. For this reason, the impact is not measurable and directly attributable to the activity itself, yet the activity is necessary for the impact to materialise. Examples of such investments are investments into the electric grid, auxiliary transport infrastructure like train maintenance facilities, and financing that is extended to financial intermediaries. ∆ Sustainability-linked impact: these are the NIB financed 35% activities and projects where the impact is linked to the Enabling achievement of counterparty level, mid-term KPIs. For this impacts reason, the impact is more scattered across value chain and is measured in terms of fulfilment of the target. The first progress follow-up is available on pages 21-22. 1 Loans that have at least one identified and reported For more detailed information about our reported impact, (under Impacts of loans disbursed on page 16) impact indicator. see the Report of the Board of Directors.
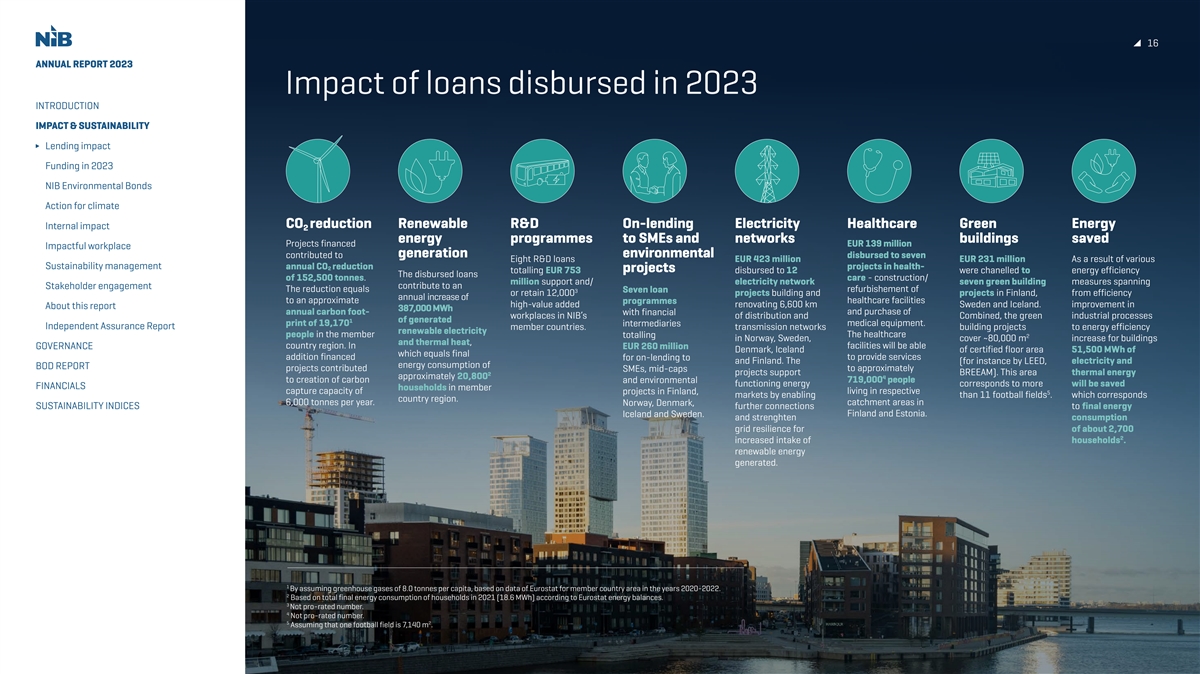
16 ANNUAL REPORT 2023 Impact of loans disbursed in 2023 INTRODUCTION IMPACT & SUSTAINABILITY Lending impact Funding in 2023 NIB Environmental Bonds Action for climate CO reduction Renewable R&D On-lending Electricity Healthcare Green Energy Internal impact 2 energy programmes to SMEs and networks buildings saved Projects financed EUR 139 million Impactful workplace generation environmental contributed to disbursed to seven Eight R&D loans EUR 423 million EUR 231 million As a result of various Sustainability management annual CO reduction projects in health- 2 projects totalling EUR 753 disbursed to 12 were chanelled to energy efficiency The disbursed loans of 152,500 tonnes. care - construction/ million support and/ electricity network seven green building measures spanning Stakeholder engagement contribute to an The reduction equals 3 Seven loan refurbishement of or retain 12,000 projects building and projects in Finland, from efficiency annual increase of to an approximate programmes healthcare facilities high-value added renovating 6,600 km Sweden and Iceland. improvement in About this report 387,000 MWh annual carbon foot- with financial and purchase of workplaces in NIB’s of distribution and Combined, the green industrial processes 1 of generated print of 19,170 intermediaries medical equipment. Independent Assurance Report member countries. transmission networks building projects to energy efficiency renewable electricity people in the member totalling The healthcare 2 in Norway, Sweden, cover ~80,000 m increase for buildings and thermal heat, GOVERNANCE country region. In EUR 260 million facilities will be able Denmark, Iceland of certified floor area 51,500 MWh of which equals final addition financed for on-lending to to provide services and Finland. The (for instance by LEED, electricity and energy consumption of BOD REPORT projects contributed SMEs, mid-caps to approximately projects support BREEAM). This area thermal energy 2 approximately 20,800 4 to creation of carbon and environmental 719,000 people functioning energy corresponds to more will be saved FINANCIALS households in member capture capacity of projects in Finland, living in respective 5 markets by enabling than 11 football fields . which corresponds country region. 6,000 tonnes per year. Norway, Denmark, catchment areas in SUSTAINABILITY INDICES further connections to final energy Iceland and Sweden. Finland and Estonia. and strenghten consumption grid resilience for of about 2,700 2 increased intake of households . renewable energy generated. 1 By assuming greenhouse gases of 8.0 tonnes per capita, based on data of Eurostat for member country area in the years 2020-2022. 2 Based on total final energy consumption of households in 2021 (18.6 MWh) according to Eurostat energy balances. 3 Not pro-rated number. 4 Not pro-rated number. 5 2 Assuming that one football field is 7,140 m .
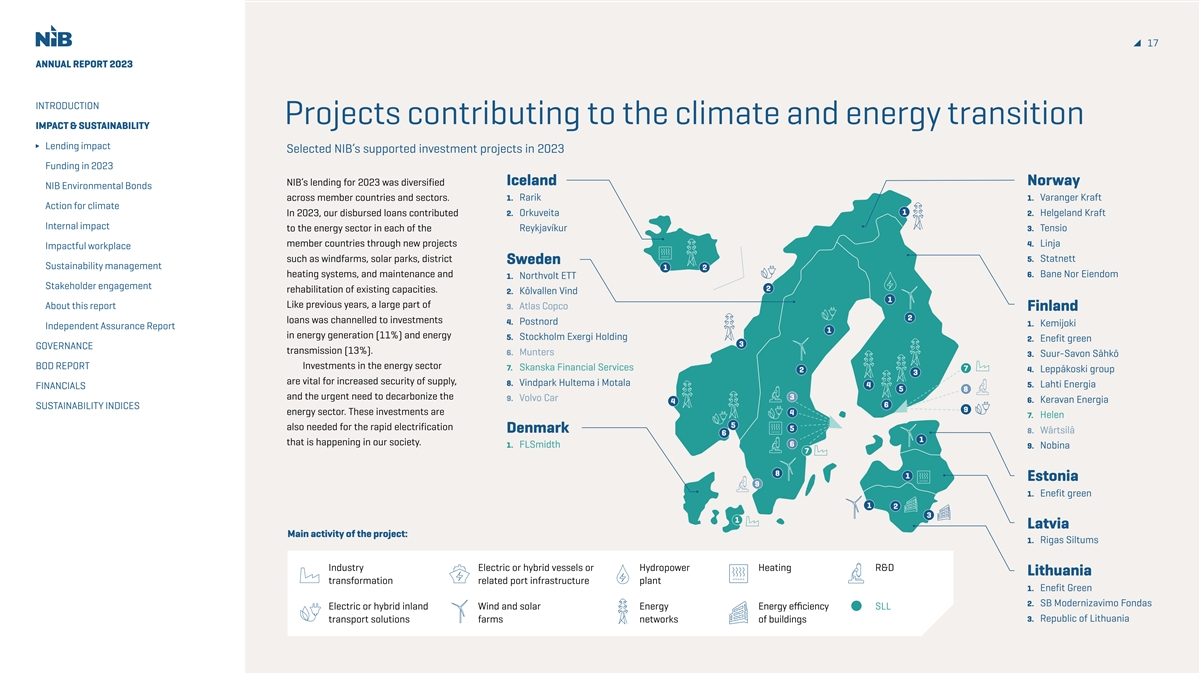
17 ANNUAL REPORT 2023 INTRODUCTION Projects contributing to the climate and energy transition IMPACT & SUSTAINABILITY Lending impact Selected NIB’s supported investment projects in 2023 Funding in 2023 Iceland Norway NIB’s lending for 2023 was diversified NIB Environmental Bonds across member countries and sectors. 1. Rarik 1. Varanger Kraft Action for climate 1 In 2023, our disbursed loans contributed 2. Orkuveita 2. Helgeland Kraft Internal impact to the energy sector in each of the Reykjavíkur 3. Tensio member countries through new projects 4. Linja Impactful workplace such as windfarms, solar parks, district 5. Statnett Sweden Sustainability management 1 2 heating systems, and maintenance and 6. Bane Nor Eiendom 1. Northvolt ETT Stakeholder engagement 2 rehabilitation of existing capacities. 2. Kölvallen Vind 1 Like previous years, a large part of About this report 3. Atlas Copco Finland 2 loans was channelled to investments 4. Postnord 1. Kemijoki Independent Assurance Report 1 in energy generation (11%) and energy 5. Stockholm Exergi Holding 2. Enefit green 3 GOVERNANCE transmission (13%). 6. Munters 3. Suur-Savon Sähkö BOD REPORT Investments in the energy sector 7. Skanska Financial Services 7 2 4. Leppäkoski group 3 are vital for increased security of supply, 8. Vindpark Hultema i Motala 4 5. Lahti Energia FINANCIALS 5 8 and the urgent need to decarbonize the 3 9. Volvo Car 6. Keravan Energia 4 6 SUSTAINABILITY INDICES 9 energy sector. These investments are 4 7. Helen 5 also needed for the rapid electrification 5 Denmark 8. Wärtsilä 6 1 that is happening in our society. 6 1. FLSmidth 9. Nobina 7 8 1 Estonia 9 1. Enefit green 1 2 3 1 Latvia Main activity of the project: 1. Rigas Siltums Industry Electric or hybrid vessels or Hydropower Heating R&D Lithuania transformation related port infrastructure plant 1. Enefit Green 2. SB Modernizavimo Fondas Electric or hybrid inland Wind and solar Energy Energy efficiency SLL 3. Republic of Lithuania transport solutions farms networks of buildings
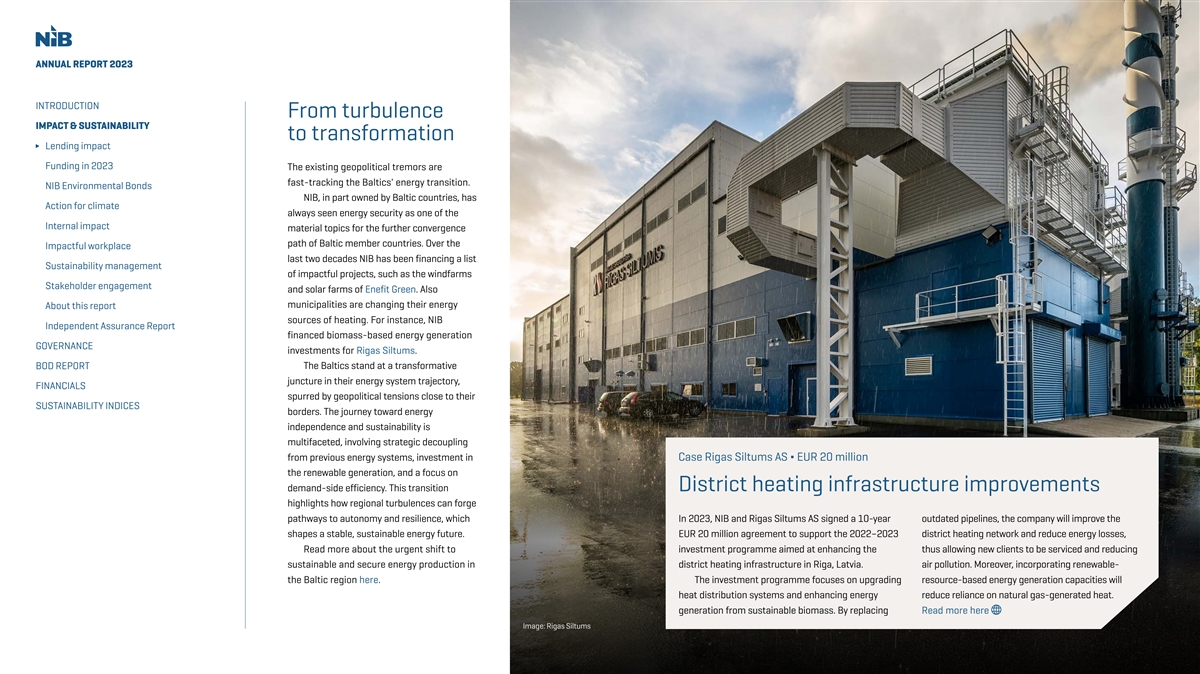
ANNUAL REPORT 2023 INTRODUCTION From turbulence IMPACT & SUSTAINABILITY to transformation Lending impact Funding in 2023 The existing geopolitical tremors are fast-tracking the Baltics' energy transition. NIB Environmental Bonds NIB, in part owned by Baltic countries, has Action for climate always seen energy security as one of the Internal impact material topics for the further convergence path of Baltic member countries. Over the Impactful workplace last two decades NIB has been financing a list Sustainability management of impactful projects, such as the windfarms Stakeholder engagement and solar farms of Enefit Green. Also municipalities are changing their energy About this report sources of heating. For instance, NIB Independent Assurance Report financed biomass-based energy generation GOVERNANCE investments for Rigas Siltums. BOD REPORT The Baltics stand at a transformative juncture in their energy system trajectory, FINANCIALS spurred by geopolitical tensions close to their SUSTAINABILITY INDICES borders. The journey toward energy independence and sustainability is multifaceted, involving strategic decoupling from previous energy systems, investment in Case Rigas Siltums AS ∆ EUR 20 million the renewable generation, and a focus on demand-side efficiency. This transition District heating infrastructure improvements highlights how regional turbulences can forge pathways to autonomy and resilience, which In 2023, NIB and Rigas Siltums AS signed a 10-year outdated pipelines, the company will improve the shapes a stable, sustainable energy future. EUR 20 million agreement to support the 2022–2023 district heating network and reduce energy losses, Read more about the urgent shift to investment programme aimed at enhancing the thus allowing new clients to be serviced and reducing sustainable and secure energy production in district heating infrastructure in Riga, Latvia. air pollution. Moreover, incorporating renewable- the Baltic region here. The investment programme focuses on upgrading resource-based energy generation capacities will heat distribution systems and enhancing energy reduce reliance on natural gas-generated heat. generation from sustainable biomass. By replacing Read more here Image: Rigas Siltums
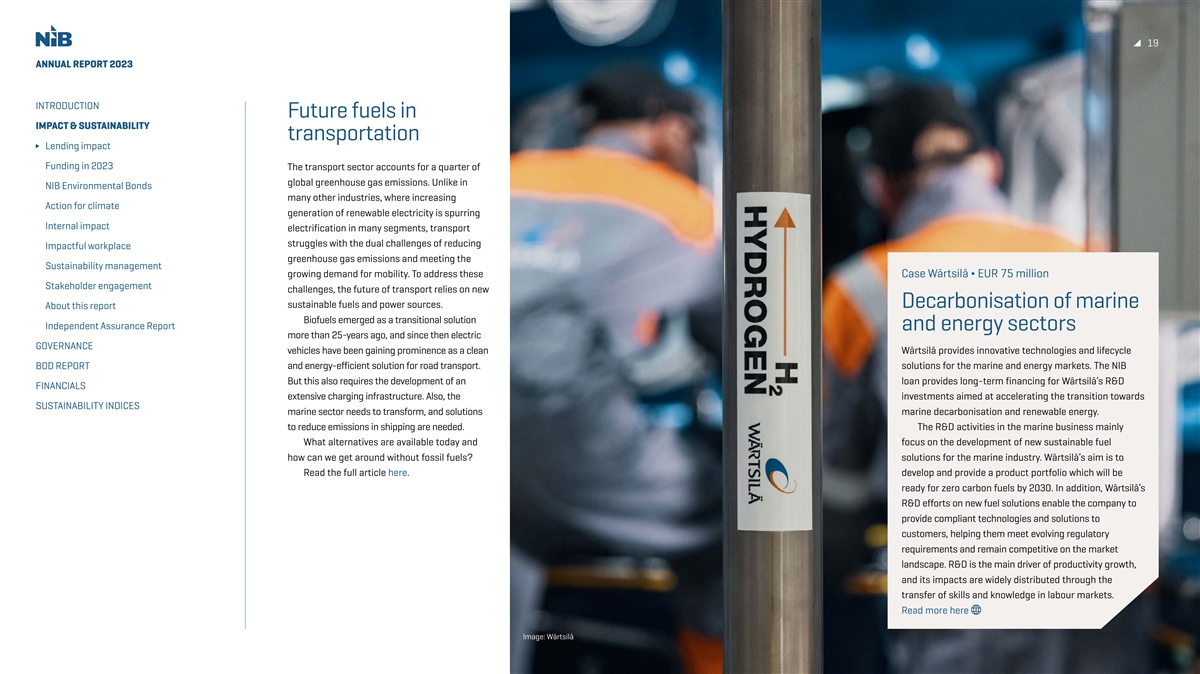
19 19 ANNUAL REPORT 2023 INTRODUCTION Future fuels in IMPACT & SUSTAINABILITY transportation Lending impact Funding in 2023 The transport sector accounts for a quarter of global greenhouse gas emissions. Unlike in NIB Environmental Bonds many other industries, where increasing Action for climate generation of renewable electricity is spurring Internal impact electrification in many segments, transport struggles with the dual challenges of reducing Impactful workplace greenhouse gas emissions and meeting the Sustainability management growing demand for mobility. To address these Case Wärtsilä ∆ EUR 75 million Stakeholder engagement challenges, the future of transport relies on new sustainable fuels and power sources. Decarbonisation of marine About this report Biofuels emerged as a transitional solution Independent Assurance Report and energy sectors more than 25-years ago, and since then electric GOVERNANCE vehicles have been gaining prominence as a clean Wärtsilä provides innovative technologies and lifecycle BOD REPORT and energy-efficient solution for road transport. solutions for the marine and energy markets. The NIB But this also requires the development of an loan provides long-term financing for Wärtsilä’s R&D FINANCIALS extensive charging infrastructure. Also, the investments aimed at accelerating the transition towards SUSTAINABILITY INDICES marine sector needs to transform, and solutions marine decarbonisation and renewable energy. to reduce emissions in shipping are needed. The R&D activities in the marine business mainly What alternatives are available today and focus on the development of new sustainable fuel how can we get around without fossil fuels? solutions for the marine industry. Wärtsilä’s aim is to Read the full article here. develop and provide a product portfolio which will be ready for zero carbon fuels by 2030. In addition, Wärtsilä’s R&D efforts on new fuel solutions enable the company to provide compliant technologies and solutions to customers, helping them meet evolving regulatory requirements and remain competitive on the market landscape. R&D is the main driver of productivity growth, and its impacts are widely distributed through the transfer of skills and knowledge in labour markets. Read more here Image: Wärtsilä
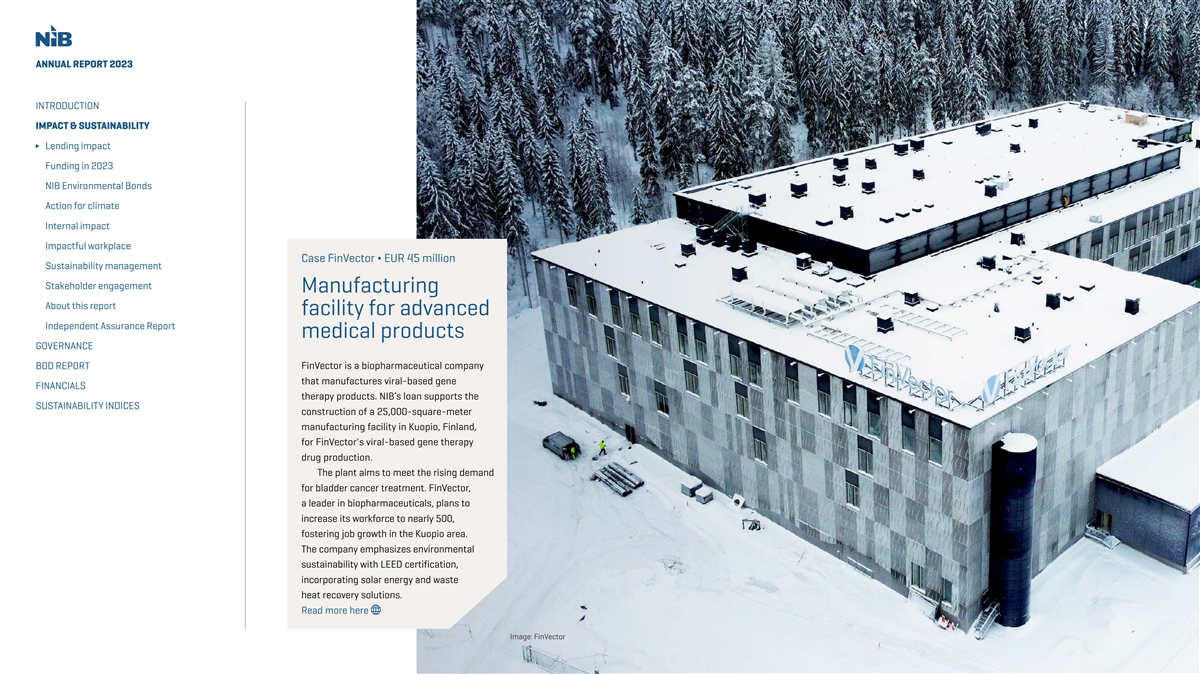
ANNUAL REPORT 2023 INTRODUCTION IMPACT & SUSTAINABILITY Lending impact Funding in 2023 NIB Environmental Bonds Action for climate Internal impact Impactful workplace Case FinVector ∆ EUR 45 million Sustainability management Stakeholder engagement Manufacturing About this report facility for advanced Independent Assurance Report medical products GOVERNANCE BOD REPORT FinVector is a biopharmaceutical company that manufactures viral-based gene FINANCIALS therapy products. NIB’s loan supports the SUSTAINABILITY INDICES construction of a 25,000-square-meter manufacturing facility in Kuopio, Finland, for FinVector's viral-based gene therapy drug production. The plant aims to meet the rising demand for bladder cancer treatment. FinVector, a leader in biopharmaceuticals, plans to increase its workforce to nearly 500, fostering job growth in the Kuopio area. The company emphasizes environmental sustainability with LEED certification, incorporating solar energy and waste heat recovery solutions. Read more here Image: FinVector
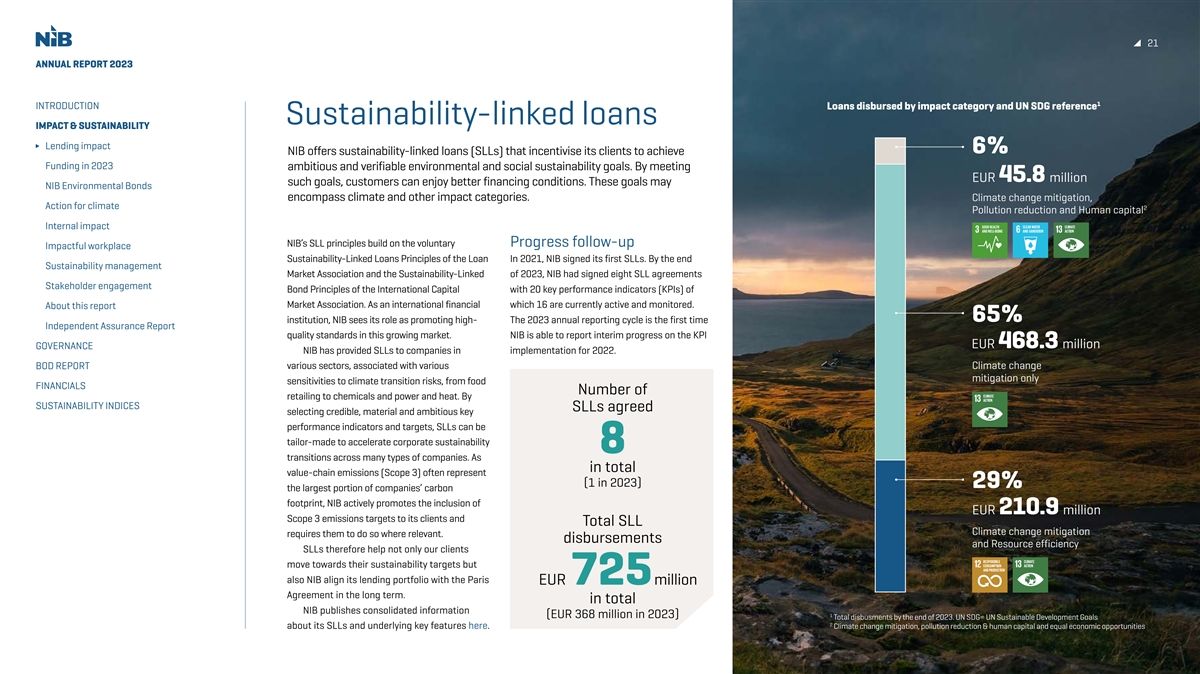
21 ANNUAL REPORT 2023 1 INTRODUCTION Loans disbursed by impact category and UN SDG reference Sustainability-linked loans IMPACT & SUSTAINABILITY Lending impact 6% NIB offers sustainability-linked loans (SLLs) that incentivise its clients to achieve Funding in 2023 ambitious and verifiable environmental and social sustainability goals. By meeting EUR 45.8 million such goals, customers can enjoy better financing conditions. These goals may NIB Environmental Bonds encompass climate and other impact categories. Climate change mitigation, Action for climate 2 Pollution reduction and Human capital Internal impact NIB’s SLL principles build on the voluntary Progress follow-up Impactful workplace Sustainability-Linked Loans Principles of the Loan In 2021, NIB signed its first SLLs. By the end Sustainability management Market Association and the Sustainability-Linked of 2023, NIB had signed eight SLL agreements Stakeholder engagement Bond Principles of the International Capital with 20 key performance indicators (KPIs) of Market Association. As an international financial which 16 are currently active and monitored. About this report 65% institution, NIB sees its role as promoting high- The 2023 annual reporting cycle is the first time Independent Assurance Report quality standards in this growing market. NIB is able to report interim progress on the KPI EUR 468.3 million GOVERNANCE NIB has provided SLLs to companies in implementation for 2022. BOD REPORT various sectors, associated with various Climate change mitigation only sensitivities to climate transition risks, from food FINANCIALS Number of retailing to chemicals and power and heat. By SUSTAINABILITY INDICES SLLs agreed selecting credible, material and ambitious key performance indicators and targets, SLLs can be tailor-made to accelerate corporate sustainability 8 transitions across many types of companies. As in total value-chain emissions (Scope 3) often represent ( ) 1 in 2023 29% the largest portion of companies’ carbon footprint, NIB actively promotes the inclusion of EUR 210.9 million Scope 3 emissions targets to its clients and Total SLL Climate change mitigation requires them to do so where relevant. disbursements and Resource efficiency SLLs therefore help not only our clients move towards their sustainability targets but also NIB align its lending portfolio with the Paris EUR 725 million Agreement in the long term. in total NIB publishes consolidated information ( ) 1 EUR 368 million in 2023 T otal disbusments by the end of 2023. UN SDG= UN Sustainable Development Goals 2 about its SLLs and underlying key features here. Climat e change mitigation, pollution reduction & human capital and equal economic opportunities
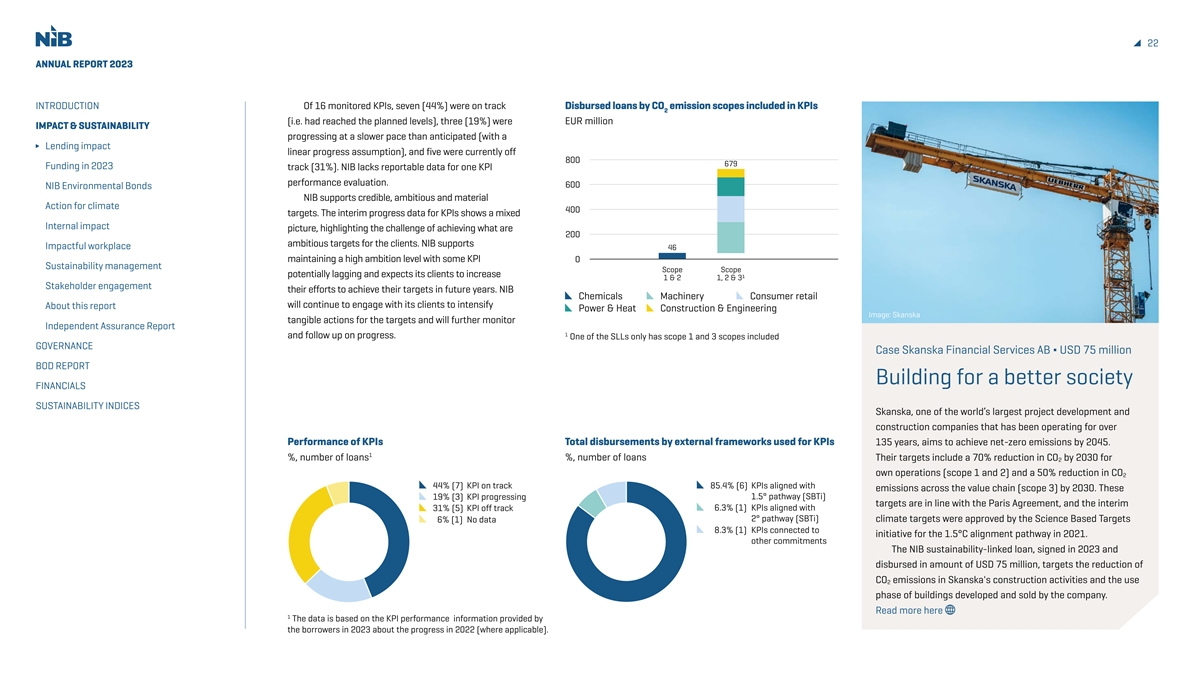
22 ANNUAL REPORT 2023 INTRODUCTION Of 16 monitored KPIs, seven (44%) were on track Disbursed loans by CO emission scopes included in KPIs 2 (i.e. had reached the planned levels), three (19%) were EUR million IMPACT & SUSTAINABILITY progressing at a slower pace than anticipated (with a Lending impact linear progress assumption), and five were currently off 800 679 Funding in 2023 track (31%). NIB lacks reportable data for one KPI performance evaluation. 600 NIB Environmental Bonds NIB supports credible, ambitious and material Action for climate 400 targets. The interim progress data for KPIs shows a mixed Internal impact picture, highlighting the challenge of achieving what are 200 ambitious targets for the clients. NIB supports Impactful workplace 46 maintaining a high ambition level with some KPI 0 Sustainability management Scope Scope potentially lagging and expects its clients to increase 1 & 2 1, 2 & 3¹ Stakeholder engagement their efforts to achieve their targets in future years. NIB Chemicals Machinery Consumer retail will continue to engage with its clients to intensify About this report P ower & Heat Construction & Engineering Image: Skanska tangible actions for the targets and will further monitor Independent Assurance Report 1 and follow up on progress. One of the SLLs only has scope 1 and 3 scopes included GOVERNANCE Case Skanska Financial Services AB ∆ USD 75 million BOD REPORT Building for a better society FINANCIALS SUSTAINABILITY INDICES Skanska, one of the world’s largest project development and construction companies that has been operating for over Performance of KPIs Total disbursements by external frameworks used for KPIs 135 years, aims to achieve net-zero emissions by 2045. 1 %, number of loans %, number of loans Their targets include a 70% reduction in CO by 2030 for 2 own operations (scope 1 and 2) and a 50% reduction in CO 2 44% (7) KPI on track 85.4% (6) KPIs aligned with emissions across the value chain (scope 3) by 2030. These 19% (3) KPI progressing 1.5° pathway (SBTi) targets are in line with the Paris Agreement, and the interim 31% (5) KPI off track 6.3% (1) KPIs aligned with 6% (1) No data 2° pathway (SBTi) climate targets were approved by the Science Based Targets 8.3% (1) KPIs connected to initiative for the 1.5°C alignment pathway in 2021. other commitments The NIB sustainability-linked loan, signed in 2023 and disbursed in amount of USD 75 million, targets the reduction of CO emissions in Skanska's construction activities and the use 2 phase of buildings developed and sold by the company. Read more here 1 The data is based on the KPI performance information provided by the borrowers in 2023 about the progress in 2022 (where applicable).
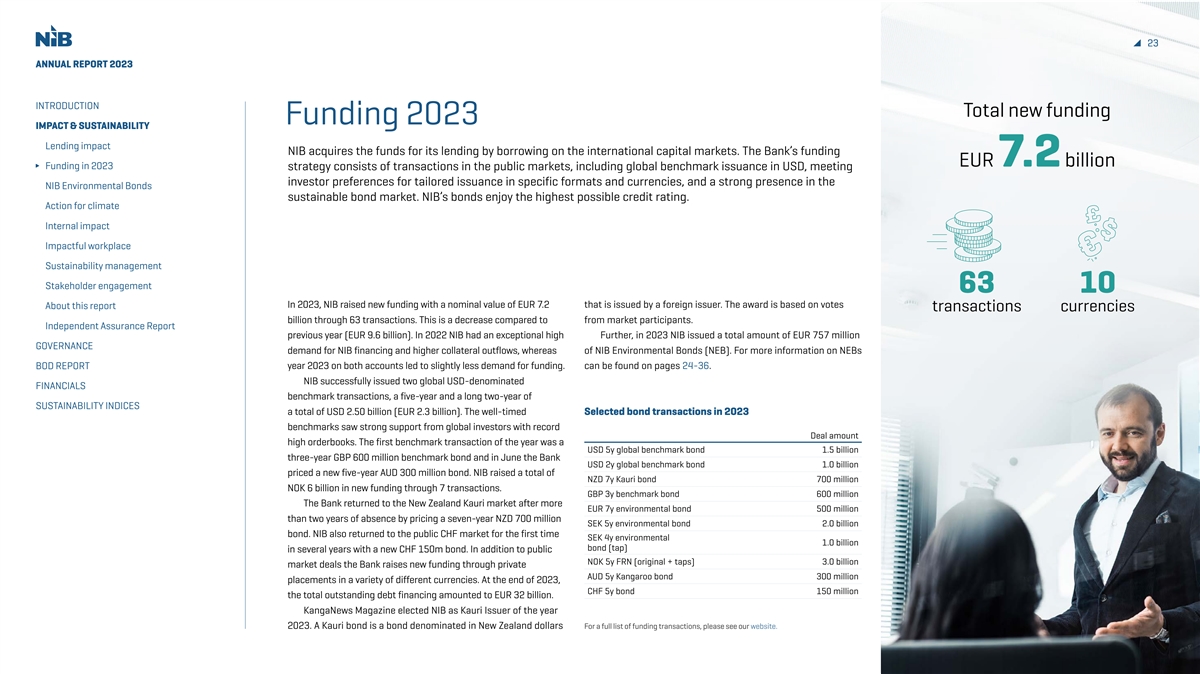
23 23 ANNUAL REPORT 2023 INTRODUCTION Total new funding Funding 2023 IMPACT & SUSTAINABILITY Lending impact NIB acquires the funds for its lending by borrowing on the international capital markets. The Bank’s funding EUR 7.2 billion Funding in 2023 strategy consists of transactions in the public markets, including global benchmark issuance in USD, meeting investor preferences for tailored issuance in specific formats and currencies, and a strong presence in the NIB Environmental Bonds sustainable bond market. NIB’s bonds enjoy the highest possible credit rating. Action for climate Internal impact Impactful workplace Sustainability management Stakeholder engagement 63 10 In 2023, NIB raised new funding with a nominal value of EUR 7.2 that is issued by a foreign issuer. The award is based on votes About this report transactions currencies billion through 63 transactions. This is a decrease compared to from market participants. Independent Assurance Report previous year (EUR 9.6 billion). In 2022 NIB had an exceptional high Further, in 2023 NIB issued a total amount of EUR 757 million GOVERNANCE demand for NIB financing and higher collateral outflows, whereas of NIB Environmental Bonds (NEB). For more information on NEBs BOD REPORT year 2023 on both accounts led to slightly less demand for funding. can be found on pages 24-36. NIB successfully issued two global USD-denominated FINANCIALS benchmark transactions, a five-year and a long two-year of SUSTAINABILITY INDICES a total of USD 2.50 billion (EUR 2.3 billion). The well-timed Selected bond transactions in 2023 benchmarks saw strong support from global investors with record Deal amount high orderbooks. The first benchmark transaction of the year was a USD 5y global benchmark bond 1.5 billion three-year GBP 600 million benchmark bond and in June the Bank USD 2y global benchmark bond 1.0 billion priced a new five-year AUD 300 million bond. NIB raised a total of NZD 7y Kauri bond 700 million NOK 6 billion in new funding through 7 transactions. GBP 3y benchmark bond 600 million The Bank returned to the New Zealand Kauri market after more EUR 7y environmental bond 500 million than two years of absence by pricing a seven-year NZD 700 million SEK 5y environmental bond 2.0 billion bond. NIB also returned to the public CHF market for the first time SEK 4y environmental 1.0 billion bond (tap) in several years with a new CHF 150m bond. In addition to public NOK 5y FRN (original + taps) 3.0 billion market deals the Bank raises new funding through private AUD 5y Kangaroo bond 300 million placements in a variety of different currencies. At the end of 2023, CHF 5y bond 150 million the total outstanding debt financing amounted to EUR 32 billion. KangaNews Magazine elected NIB as Kauri Issuer of the year 2023. A Kauri bond is a bond denominated in New Zealand dollars For a full list of funding transactions, please see our website.

24 ANNUAL REPORT 2023 INTRODUCTION NIB Environmental Bonds 2023 IMPACT & SUSTAINABILITY Lending impact Year 2023 was the thirteenth year in a row that the bank issued NIB Funding in 2023 Environmental Bonds (NEB). The total issuance of NEB since 2011 now stands at EUR 7.6 billion. In 2023, a record amount of NEB eligible NIB Environmental Bonds projects was disbursed, EUR 1.275 billion. Action for climate Internal impact Impactful workplace The NEBs issued in 2023 were denominated in investors in Sweden. Also the third NEB Sustainability management EUR and SEK and totalled the equivalent of of the year, a four-year SEK 1 billion tap was Stakeholder engagement EUR 757 million. The first NIB Environmental placed domestically. Bond of the year was a seven-year EUR 500 By continuing issuing NEBs the Bank About this report million NEB launched in January. The second attracts sustainable bond investors, both loyal Independent Assurance Report green bond for the year, a five-year SEK 2 billion investors but also new investors. GOVERNANCE NEB was priced in September. In December NIB NIB continued the work in The Principles. BOD REPORT increased an outstanding four-year green bond The Principles are a global initiative providing with SEK 1 billion, taking the new total of the support and guidelines to the sustainable bond FINANCIALS bond to SEK 3 billion. market. The International Capital Markets SUSTAINABILITY INDICES The no-grow EUR 500 million NEB issued Association (ICMA) serves as Secretariat to the in January had a solid diversified orderbook Principles. NIB has been committed to this work of almost EUR 1 billion. This is the ninth year since its establishment in 2014 and a member Year 2023 marked a record in a row that NIB issues a EUR 500 million of the Executive Committee since. year of NEB eligible projects benchmark bond. The SEK 2 billion NEB NIB’s framework for issuance of green disbursed. This shows the issued in September had an orderbook of bonds (NEB Framework), is undergoing a review SEK 2.7 billion and was bought by domestic that is expected to be finalised during 2024. commitment from our The update will reflect current market best customers to NIB’s mandate practise and NIB’s intention to gradually align of financing projects itself with the EU taxonomy. Total NEB issuance benefitting the environment. NIB continues to report transparently on 2011-2023 Kim Skov Jensen, the allocation and impact of its environmental CFO bonds, including NIB's estimated alignment with the EU taxonomy for its green fund pool EUR 7.6 billion (see page 34).
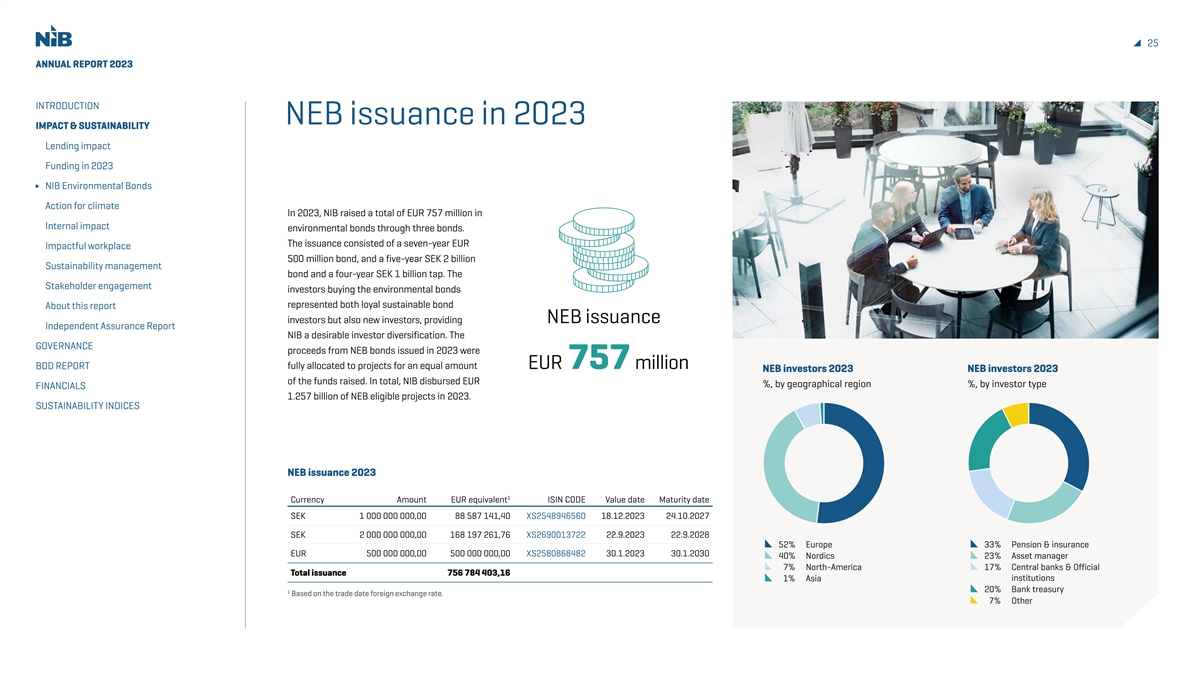
25 ANNUAL REPORT 2023 INTRODUCTION NEB issuance in 2023 IMPACT & SUSTAINABILITY Lending impact Funding in 2023 NIB Environmental Bonds Action for climate In 2023, NIB raised a total of EUR 757 million in Internal impact environmental bonds through three bonds. The issuance consisted of a seven-year EUR Impactful workplace 500 million bond, and a five-year SEK 2 billion Sustainability management bond and a four-year SEK 1 billion tap. The Stakeholder engagement investors buying the environmental bonds represented both loyal sustainable bond About this report investors but also new investors, providing NEB issuance Independent Assurance Report NIB a desirable investor diversification. The GOVERNANCE proceeds from NEB bonds issued in 2023 were BOD REPORT fully allocated to projects for an equal amount EUR 757 million NEB investors 2023 NEB investors 2023 of the funds raised. In total, NIB disbursed EUR %, by geographical region %, by investor type FINANCIALS 1.257 billion of NEB eligible projects in 2023. SUSTAINABILITY INDICES NEB issuance 2023 1 Currency Amount EUR equivalent ISIN CODE Value date Maturity date SEK 1 000 000 000,00 88 587 141,40 XS2548946560 18.12.2023 24.10.2027 SEK 2 000 000 000,00 168 197 261,76 XS2690013722 22.9.2023 22.9.2028 52% Europe 33% Pension & insurance EUR 500 000 000,00 500 000 000,00 XS2580868482 30.1.2023 30.1.2030 40% Nordics 23% Asset manager 7% North-America 17% Central banks & Official Total issuance 756 784 403,16 1% Asia institutions 20% Bank treasury 1 Based on the trade date foreign exchange rate. 7% Other
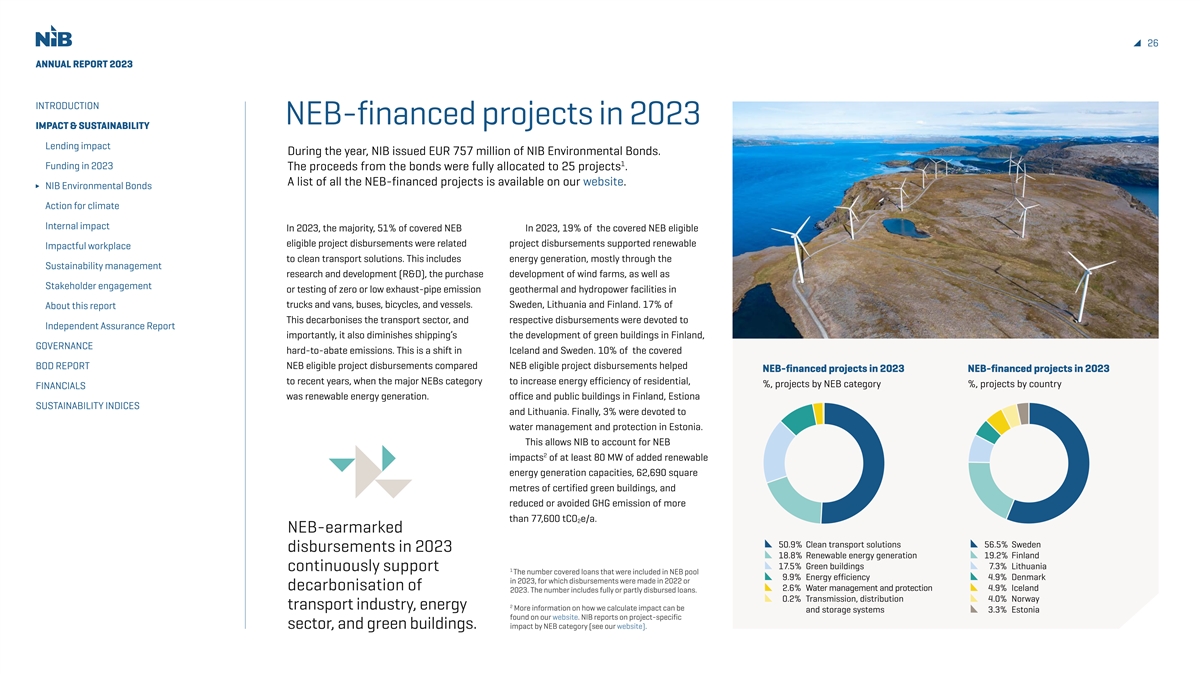
26 ANNUAL REPORT 2023 INTRODUCTION NEB-financed projects in 2023 IMPACT & SUSTAINABILITY Lending impact During the year, NIB issued EUR 757 million of NIB Environmental Bonds. 1 Funding in 2023 The proceeds from the bonds were fully allocated to 25 projects . A list of all the NEB-financed projects is available on our website. NIB Environmental Bonds Action for climate Internal impact In 2023, the majority, 51% of covered NEB In 2023, 19% of the covered NEB eligible eligible project disbursements were related project disbursements supported renewable Impactful workplace to clean transport solutions. This includes energy generation, mostly through the Sustainability management research and development (R&D), the purchase development of wind farms, as well as Stakeholder engagement or testing of zero or low exhaust-pipe emission geothermal and hydropower facilities in trucks and vans, buses, bicycles, and vessels. Sweden, Lithuania and Finland. 17% of About this report This decarbonises the transport sector, and respective disbursements were devoted to Independent Assurance Report importantly, it also diminishes shipping’s the development of green buildings in Finland, GOVERNANCE hard-to-abate emissions. This is a shift in Iceland and Sweden. 10% of the covered BOD REPORT NEB eligible project disbursements compared NEB eligible project disbursements helped NEB-financed projects in 2023 NEB-financed projects in 2023 to recent years, when the major NEBs category to increase energy efficiency of residential, %, projects by NEB category %, projects by country FINANCIALS was renewable energy generation. office and public buildings in Finland, Estiona SUSTAINABILITY INDICES and Lithuania. Finally, 3% were devoted to water management and protection in Estonia. This allows NIB to account for NEB 2 impacts of at least 80 MW of added renewable energy generation capacities, 62,690 square metres of certified green buildings, and reduced or avoided GHG emission of more than 77,600 tCO e/a. 2 NEB-earmarked 50.9% Clean transport solutions56.5% Sweden disbursements in 2023 18.8% Renewable energy generation19.2% Finland 17 .5% Green buildings 7.3% Lithuania continuously support 1 The number covered loans that were included in NEB pool 9.9% Energy efficiency 4.9% Denmark in 2023, for which disbursements were made in 2022 or decarbonisation of 2.6% Water management and protection 4.9% Iceland 2023. The number includes fully or partly disbursed loans. 0.2% Transmission, distribution 4.0% Norway 2 transport industry, energy More information on how we calculate impact can be and storage systems 3.3% Estonia found on our website. NIB reports on project-specific sector, and green buildings. impact by NEB category (see our website).
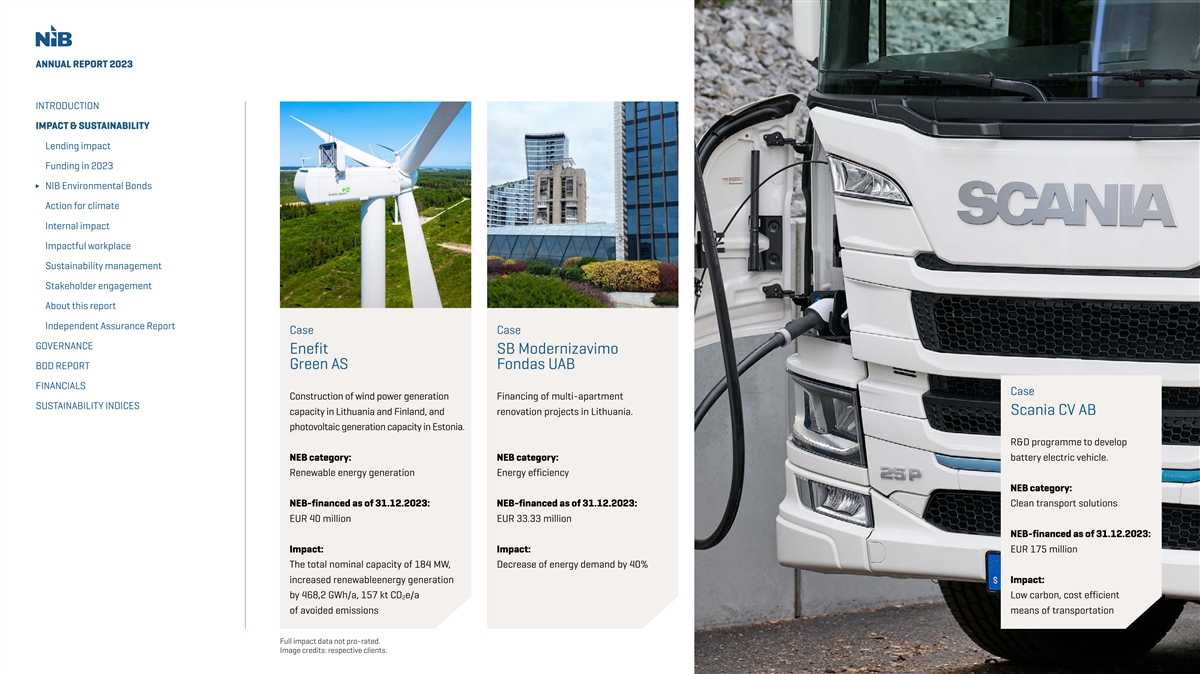
ANNUAL REPORT 2023 INTRODUCTION IMPACT & SUSTAINABILITY Lending impact Funding in 2023 NIB Environmental Bonds Action for climate Internal impact Impactful workplace Sustainability management Stakeholder engagement About this report Independent Assurance Report Case Case GOVERNANCE Enefit SB Modernizavimo BOD REPORT Green AS Fondas UAB FINANCIALS Case Construction of wind power generation Financing of multi-apartment SUSTAINABILITY INDICES capacity in Lithuania and Finland, and renovation projects in Lithuania. Scania CV AB photovoltaic generation capacity in Estonia. R&D programme to develop NEB category: NEB category: battery electric vehicle. Renewable energy generation Energy efficiency NEB category: NEB-financed as of 31.12.2023: NEB-financed as of 31.12.2023: Clean transport solutions EUR 40 million EUR 33.33 million NEB-financed as of 31.12.2023: Impact: Impact: EUR 175 million The total nominal capacity of 184 MW, Decrease of energy demand by 40% increased renewableenergy generation Impact: by 468,2 GWh/a, 157 kt CO e/a Low carbon, cost efficient 2 of avoided emissions means of transportation Full impact data not pro-rated. Image credits: respective clients.
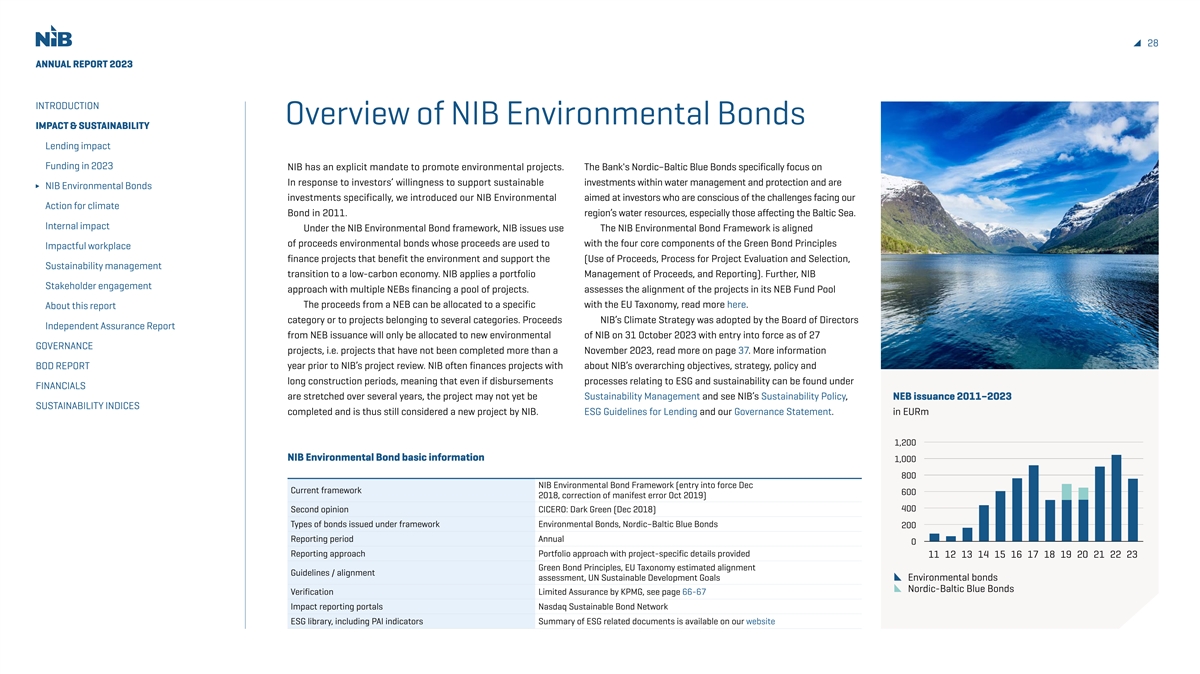
28 ANNUAL REPORT 2023 INTRODUCTION Overview of NIB Environmental Bonds IMPACT & SUSTAINABILITY Lending impact Funding in 2023 NIB has an explicit mandate to promote environmental projects. The Bank's Nordic–Baltic Blue Bonds specifically focus on In response to investors’ willingness to support sustainable investments within water management and protection and are NIB Environmental Bonds investments specifically, we introduced our NIB Environmental aimed at investors who are conscious of the challenges facing our Action for climate Bond in 2011. region’s water resources, especially those affecting the Baltic Sea. Internal impact Under the NIB Environmental Bond framework, NIB issues use The NIB Environmental Bond Framework is aligned of proceeds environmental bonds whose proceeds are used to with the four core components of the Green Bond Principles Impactful workplace finance projects that benefit the environment and support the (Use of Proceeds, Process for Project Evaluation and Selection, Sustainability management transition to a low-carbon economy. NIB applies a portfolio Management of Proceeds, and Reporting). Further, NIB Stakeholder engagement approach with multiple NEBs financing a pool of projects. assesses the alignment of the projects in its NEB Fund Pool The proceeds from a NEB can be allocated to a specific with the EU Taxonomy, read more here. About this report category or to projects belonging to several categories. Proceeds NIB’s Climate Strategy was adopted by the Board of Directors Independent Assurance Report from NEB issuance will only be allocated to new environmental of NIB on 31 October 2023 with entry into force as of 27 GOVERNANCE projects, i.e. projects that have not been completed more than a November 2023, read more on page 37. More information BOD REPORT year prior to NIB’s project review. NIB often finances projects with about NIB’s overarching objectives, strategy, policy and long construction periods, meaning that even if disbursements processes relating to ESG and sustainability can be found under FINANCIALS are stretched over several years, the project may not yet be Sustainability Management and see NIB’s Sustainability Policy, NEB issuance 2011–2023 SUSTAINABILITY INDICES completed and is thus still considered a new project by NIB. ESG Guidelines for Lending and our Governance Statement. in EURm 1,200 NIB Environmental Bond basic information 1,000 800 NIB Environmental Bond Framework (entry into force Dec Current framework 600 2018, correction of manifest error Oct 2019) Second opinion CICERO: Dark Green (Dec 2018) 400 Types of bonds issued under framework Environmental Bonds, Nordic–Baltic Blue Bonds 200 Reporting period Annual 0 Reporting approach Portfolio approach with project-specific details provided 11 12 13 14 15 16 17 18 19 20 21 22 23 Green Bond Principles, EU Taxonomy estimated alignment Guidelines / alignment assessment, UN Sustainable Development Goals Environmental bonds Nordic-Baltic Blue Bonds Verification Limited Assurance by KPMG, see page 66-67 Impact reporting portals Nasdaq Sustainable Bond Network ESG library, including PAI indicators Summary of ESG related documents is available on our website
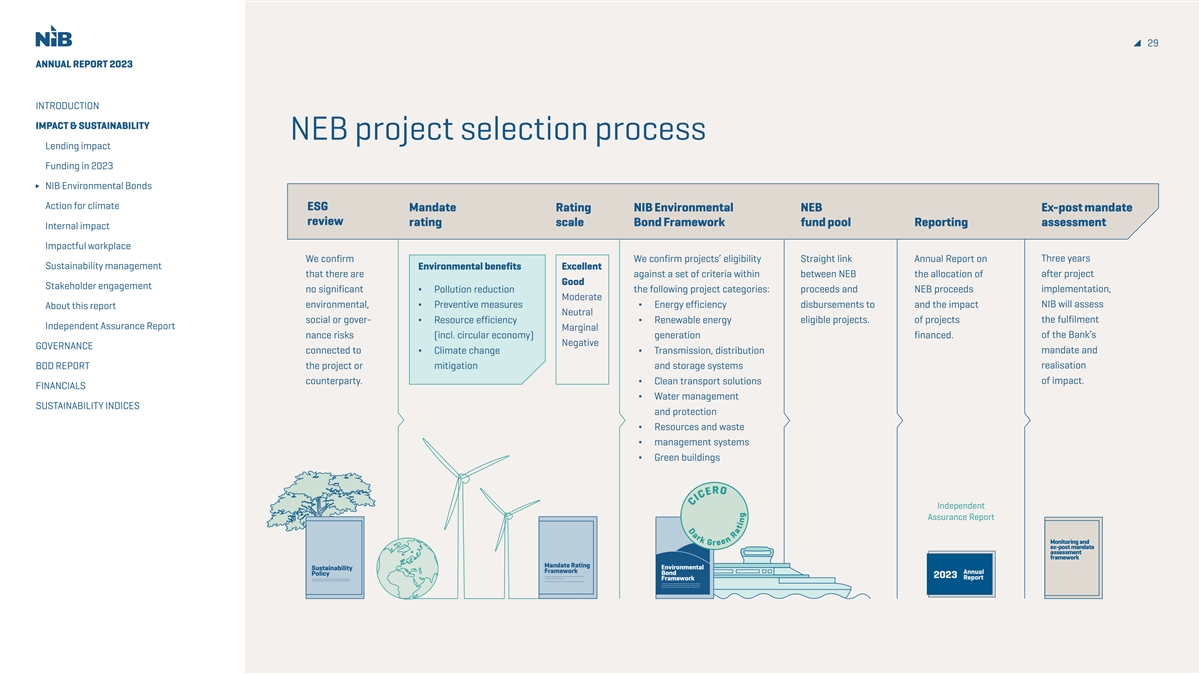
D a r k O G 29 ANNUAL REPORT 2023 INTRODUCTION IMPACT & SUSTAINABILITY NEB project selection process Lending impact Funding in 2023 NIB Environmental Bonds Action for climate ESG Mandate Rating NIB Environmental NEB Ex-post mandate review rating scale Bond Framework fund pool Reporting assessment Internal impact Impactful workplace We confirm We confirm projects’ eligibility Straight link Annual Report on Three years Sustainability management Environmental benefits Excellent after project that there are against a set of criteria within between NEB the allocation of Good Stakeholder engagement no significant ∆ Pollution reduction the following project categories: proceeds and NEB proceeds implementation, Moderate NIB will assess environmental, ∆ Preventive measures ∆ Energy efficiency disbursements to and the impact About this report Neutral social or gover- ∆ Resource efficiency ∆ R enewable energy eligible projects. of projects the fulfilment Independent Assurance Report Marginal of the Bank’s nance risks (incl. circular economy) generation financed. Negative GOVERNANCE connected to ∆ Climate change ∆ T ransmission, distribution mandate and realisation BOD REPORT the project or mitigation and storage systems counterparty. ∆ Clean transport solutions of impact. FINANCIALS ∆ Water management SUSTAINABILITY INDICES and protection ∆ Resources and waste ∆ management systems ∆ Green buildings Independent Assurance Report t NIB Mandate Rating Sustainability Environmental Framework Annual Policy Bond The Nordic Investment Bank is the international financial institution 2023 of the Nordic and Baltic countries. Adopted by the Board of Directors of the Nordic Investment Bank on Report 11 November 2021 with entry into force as of 11 November 2021 Framework We work towards a prosperous and sustainable Nordic–Baltic region. Framework for the undertaking of NIB Environmental Bond issuance – the underlying rationale and methodology for loan selection, and the governance of bond issuance, proceeds management and reporting R r e E e C n I R C a t i n g
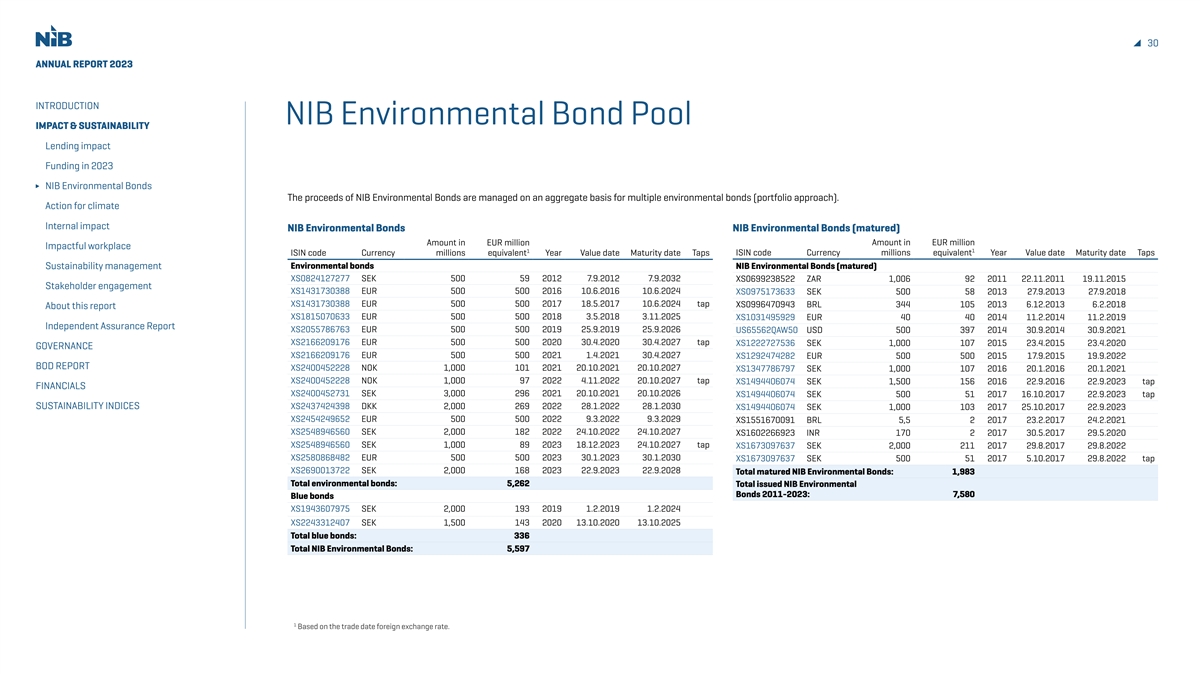
30 ANNUAL REPORT 2023 INTRODUCTION NIB Environmental Bond Pool IMPACT & SUSTAINABILITY Lending impact Funding in 2023 NIB Environmental Bonds The proceeds of NIB Environmental Bonds are managed on an aggregate basis for multiple environmental bonds (portfolio approach). Action for climate Internal impact NIB Environmental Bonds NIB Environmental Bonds (matured) Amount in EUR million Amount in EUR million Impactful workplace 1 1 ISIN code Currency millions equivalent Year Value date Maturity date Taps ISIN code Currency millions equivalent Year Value date Maturity date Taps Environmental bonds NIB Environmental Bonds (matured) Sustainability management XS0824127277 SEK 500 59 2012 7.9.2012 7.9.2032 XS0699238522 ZAR 1,006 92 2011 22.11.2011 19.11.2015 Stakeholder engagement XS1431730388 EUR 500 500 2016 10.6.2016 10.6.2024 XS0975173633 SEK 500 58 2013 27.9.2013 27.9.2018 XS1431730388 EUR 500 500 2017 18.5.2017 10.6.2024 tap XS0996470943 BRL 344 105 2013 6.12.2013 6.2.2018 About this report XS1815070633 EUR 500 500 2018 3.5.2018 3.11.2025 XS1031495929 EUR 40 40 2014 11.2.2014 11.2.2019 Independent Assurance Report XS2055786763 EUR 500 500 2019 25.9.2019 25.9.2026 US65562QAW50 USD 500 397 2014 30.9.2014 30.9.2021 XS2166209176 EUR 500 500 2020 30.4.2020 30.4.2027 tap XS1222727536 SEK 1,000 107 2015 23.4.2015 23.4.2020 GOVERNANCE XS2166209176 EUR 500 500 2021 1.4.2021 30.4.2027 XS1292474282 EUR 500 500 2015 17.9.2015 19.9.2022 BOD REPORT XS2400452228 NOK 1,000 101 2021 20.10.2021 20.10.2027 XS1347786797 SEK 1,000 107 2016 20.1.2016 20.1.2021 XS2400452228 NOK 1,000 97 2022 4.11.2022 20.10.2027 tap XS1494406074 SEK 1,500 156 2016 22.9.2016 22.9.2023 tap FINANCIALS XS2400452731 SEK 3,000 296 2021 20.10.2021 20.10.2026 XS1494406074 SEK 500 51 2017 16.10.2017 22.9.2023 tap SUSTAINABILITY INDICES XS2437424398 DKK 2,000 269 2022 28.1.2022 28.1.2030 XS1494406074 SEK 1,000 103 2017 25.10.2017 22.9.2023 XS2454249652 EUR 500 500 2022 9.3.2022 9.3.2029 XS1551670091 BRL 5,5 2 2017 23.2.2017 24.2.2021 XS2548946560 SEK 2,000 182 2022 24.10.2022 24.10.2027 XS1602266923 INR 170 2 2017 30.5.2017 29.5.2020 XS2548946560 SEK 1,000 89 2023 18.12.2023 24.10.2027 tap XS1673097637 SEK 2,000 211 2017 29.8.2017 29.8.2022 XS2580868482 EUR 500 500 2023 30.1.2023 30.1.2030 XS1673097637 SEK 500 51 2017 5.10.2017 29.8.2022 tap XS2690013722 SEK 2,000 168 2023 22.9.2023 22.9.2028 Total matured NIB Environmental Bonds: 1,983 Total environmental bonds: 5,262 Total issued NIB Environmental Bonds 2011-2023: 7,580 Blue bonds XS1943607975 SEK 2,000 193 2019 1.2.2019 1.2.2024 XS2243312407 SEK 1,500 143 2020 13.10.2020 13.10.2025 Total blue bonds: 336 Total NIB Environmental Bonds: 5,597 1 Based on the trade date foreign exchange rate.
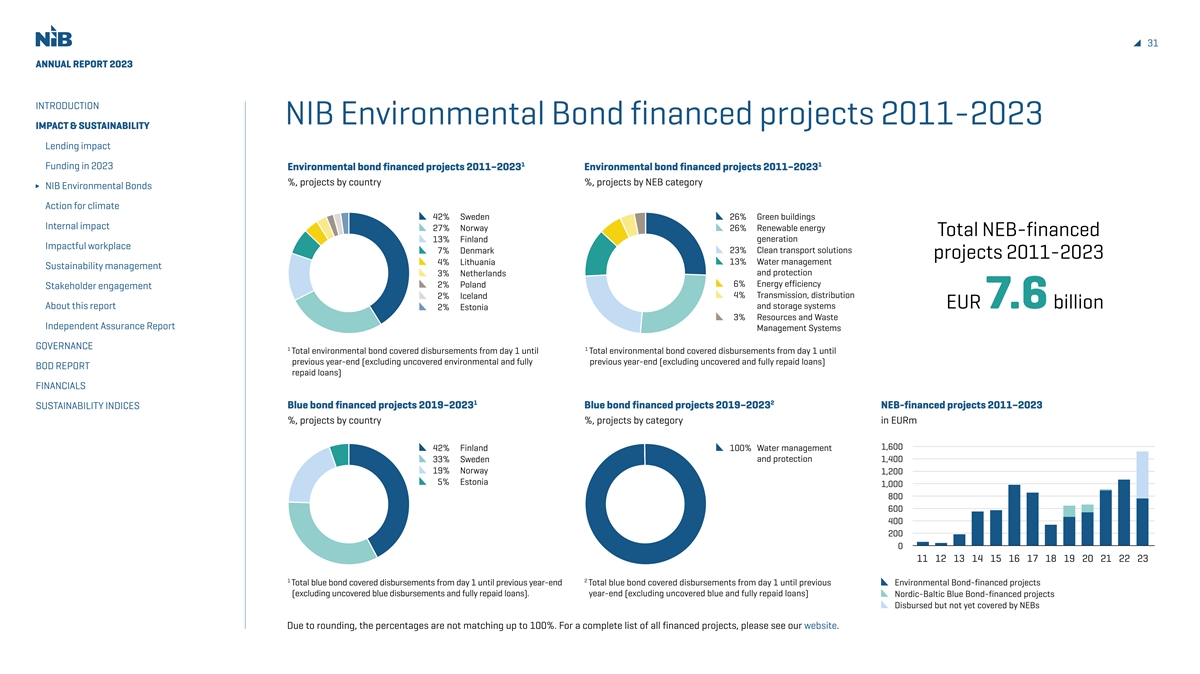
31 ANNUAL REPORT 2023 INTRODUCTION NIB Environmental Bond financed projects 2011-2023 IMPACT & SUSTAINABILITY Lending impact 1 1 Funding in 2023 Environmental bond financed projects 2011–2023 Environmental bond financed projects 2011–2023 %, projects by country %, projects by NEB category NIB Environmental Bonds Action for climate 42% Sweden 26% Green buildings Internal impact 27% Norway 26% Renewable energy Total NEB-financed 13% Finland generation Impactful workplace 7% Denmark 23% Clean transport solutions projects 2011-2023 4% Lithuania 13% Water management Sustainability management and protection 3% Netherlands 6% Energy efficiency 2% Poland Stakeholder engagement 4% Transmission, distribution 2% Iceland EUR 7.6 billion About this report and storage systems 2% Estonia 3% Resources and Waste Independent Assurance Report Management Systems GOVERNANCE 1 1 Total environmental bond covered disbursements from day 1 until Total environmental bond covered disbursements from day 1 until previous year-end (excluding uncovered environmental and fully previous year-end (excluding uncovered and fully repaid loans) BOD REPORT repaid loans) FINANCIALS 1 2 SUSTAINABILITY INDICES Blue bond financed projects 2019–2023 Blue bond financed projects 2019–2023 NEB-financed projects 2011–2023 %, projects by country %, projects by category in EURm 1,600 42% Finland 100% Water management 33% Sweden and protection 1,400 19% Norway 1,200 5% Estonia 1,000 800 600 400 200 0 11 12 13 14 15 16 17 18 19 20 21 22 23 1 2 Total blue bond covered disbursements from day 1 until previous year-end Total blue bond covered disbursements from day 1 until previous Environmental Bond-financed projects (excluding uncovered blue disbursements and fully repaid loans). year-end (excluding uncovered blue and fully repaid loans) Nordic-Baltic Blue Bond-financed projects Disbursed but not yet covered by NEBs Due to rounding, the percentages are not matching up to 100%. For a complete list of all financed projects, please see our website.
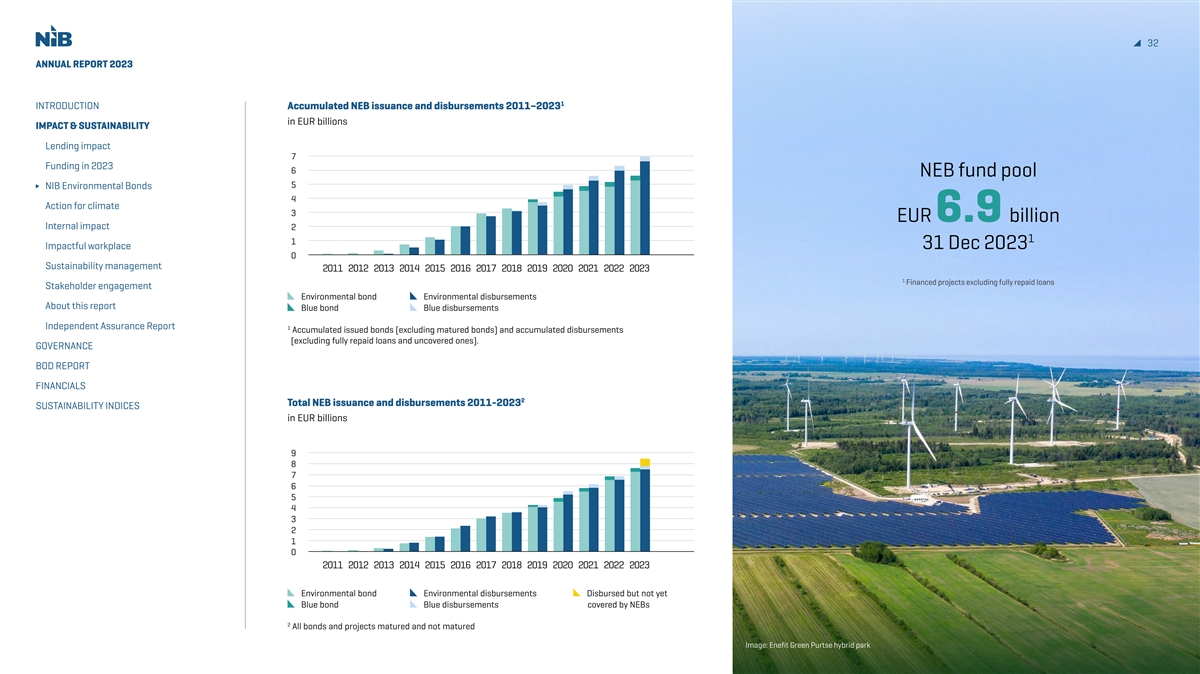
32 ANNUAL REPORT 2023 1 INTRODUCTION Accumulated NEB issuance and disbursements 2011–2023 in EUR billions IMPACT & SUSTAINABILITY Lending impact 7 Funding in 2023 6 NEB fund pool 5 NIB Environmental Bonds 4 Action for climate 3 EUR 6.9 billion Internal impact 2 1 1 Impactful workplace 31 Dec 2023 0 Sustainability management 2011 2012 2013 2014 2015 2016 2017 2018 2019 2020 2021 2022 2023 1 Financed projects excluding fully repaid loans Stakeholder engagement Environmental bond Environmental disbursements About this report Blue bond Blue disbursements Independent Assurance Report 1 Accumulated issued bonds (excluding matured bonds) and accumulated disbursements (excluding fully repaid loans and uncovered ones). GOVERNANCE BOD REPORT FINANCIALS 2 Total NEB issuance and disbursements 2011-2023 SUSTAINABILITY INDICES in EUR billions 9 8 7 6 5 4 3 2 1 0 2011 2012 2013 2014 2015 2016 2017 2018 2019 2020 2021 2022 2023 Environmental bond Environmental disbursements Disbursed but not yet Blue bond Blue disbursements covered by NEBs 2 All bonds and projects matured and not matured Image: Enefit Green Purtse hybrid park
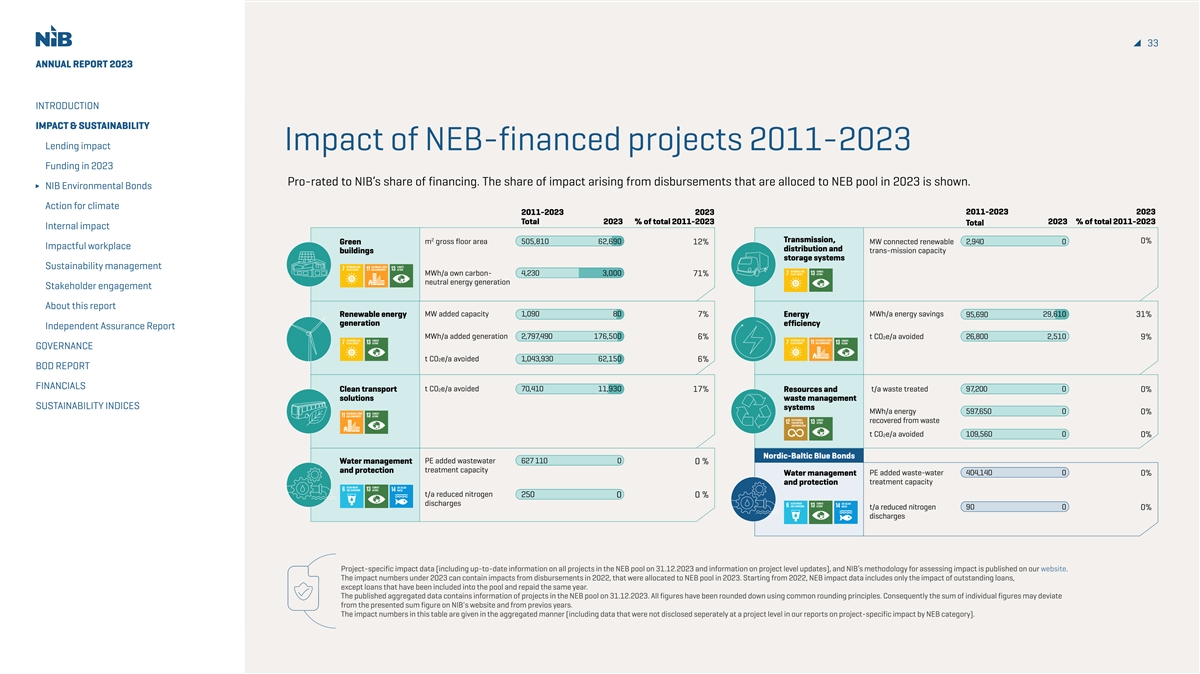
33 ANNUAL REPORT 2023 INTRODUCTION IMPACT & SUSTAINABILITY Lending impact Impact of NEB-financed projects 2011-2023 Funding in 2023 Pro-rated to NIB’s share of financing. The share of impact arising from disbursements that are alloced to NEB pool in 2023 is shown. NIB Environmental Bonds Action for climate 2011-2023 2023 2011-2023 2023 Total 2023 % of total 2011-2023 2023 % of total 2011-2023 Total Internal impact 2 Transmission, m gross floor area 505,810 62,690 0% Green 12% MW connected renewable 2,940 0 Impactful workplace distribution and buildings trans-mission capacity storage systems Sustainability management MWh/a own carbon- 4,230 3,000 71% neutral energy generation Stakeholder engagement About this report MW added capacity 1,090 80 MWh/a energy savings Renewable energy 7% Energy 95,690 29,610 31% generation efficiency Independent Assurance Report MWh/a added generation 2,797,490 176,500 t CO e/a avoided 26,800 2,510 6% 2 9% GOVERNANCE t CO2e/a avoided 1,043,930 62,150 6% BOD REPORT FINANCIALS t CO e/a avoided 70,410 11,930 Clean transport 2 17% Resources and t/a waste treated 97,200 0 0% solutions waste management SUSTAINABILITY INDICES systems MWh/a energy 597,650 0 0% recovered from waste t CO2e/a avoided 109,560 0 0% Nordic-Baltic Blue Bonds Water management PE added wastewater 627 110 0 0 % and protection treatment capacity Water management PE added waste-water 404,140 0 0% and protection treatment capacity t/a reduced nitrogen 250 0 0 % discharges t/a reduced nitrogen 90 0 0% discharges Project-specific impact data (including up-to-date information on all projects in the NEB pool on 31.12.2023 and information on project level updates), and NIB’s methodology for assessing impact is published on our website. The impact numbers under 2023 can contain impacts from disbursements in 2022, that were allocated to NEB pool in 2023. Starting from 2022, NEB impact data includes only the impact of outstanding loans, except loans that have been included into the pool and repaid the same year. The published aggregated data contains information of projects in the NEB pool on 31.12.2023. All figures have been rounded down using common rounding principles. Consequently the sum of individual figures may deviate from the presented sum figure on NIB's website and from previos years. The impact numbers in this table are given in the aggregated manner (including data that were not disclosed seperately at a project level in our reports on project-specific impact by NEB category).
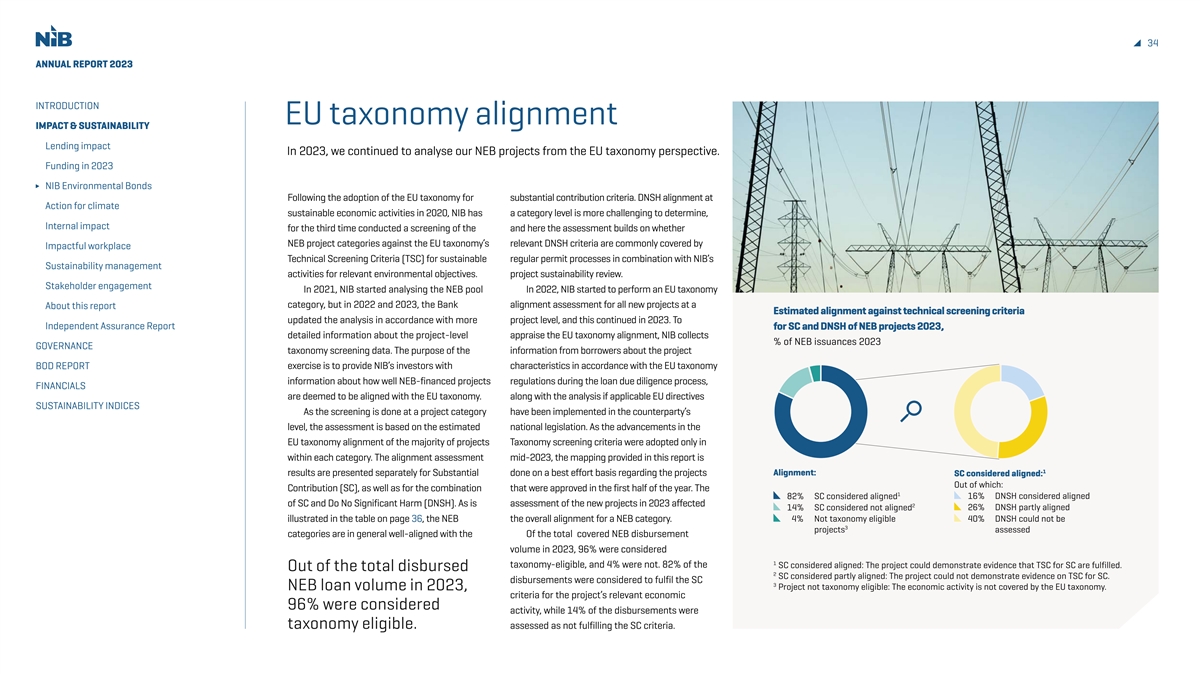
34 ANNUAL REPORT 2023 INTRODUCTION EU taxonomy alignment IMPACT & SUSTAINABILITY Lending impact In 2023, we continued to analyse our NEB projects from the EU taxonomy perspective. Funding in 2023 NIB Environmental Bonds Following the adoption of the EU taxonomy for substantial contribution criteria. DNSH alignment at Action for climate sustainable economic activities in 2020, NIB has a category level is more challenging to determine, Internal impact for the third time conducted a screening of the and here the assessment builds on whether NEB project categories against the EU taxonomy’s relevant DNSH criteria are commonly covered by Impactful workplace Technical Screening Criteria (TSC) for sustainable regular permit processes in combination with NIB’s Sustainability management activities for relevant environmental objectives. project sustainability review. Stakeholder engagement In 2021, NIB started analysing the NEB pool In 2022, NIB started to perform an EU taxonomy category, but in 2022 and 2023, the Bank alignment assessment for all new projects at a About this report Estimated alignment against technical screening criteria updated the analysis in accordance with more project level, and this continued in 2023. To Independent Assurance Report for SC and DNSH of NEB projects 2023, detailed information about the project-level appraise the EU taxonomy alignment, NIB collects % of NEB issuances 2023 GOVERNANCE taxonomy screening data. The purpose of the information from borrowers about the project BOD REPORT exercise is to provide NIB’s investors with characteristics in accordance with the EU taxonomy information about how well NEB-financed projects regulations during the loan due diligence process, FINANCIALS are deemed to be aligned with the EU taxonomy. along with the analysis if applicable EU directives SUSTAINABILITY INDICES As the screening is done at a project category have been implemented in the counterparty’s level, the assessment is based on the estimated national legislation. As the advancements in the EU taxonomy alignment of the majority of projects Taxonomy screening criteria were adopted only in within each category. The alignment assessment mid-2023, the mapping provided in this report is 1 results are presented separately for Substantial done on a best effort basis regarding the projects Alignment: SC considered aligned: Out of which: Contribution (SC), as well as for the combination that were approved in the first half of the year. The 1 82% SC considered aligned 16% DNSH considered aligned of SC and Do No Significant Harm (DNSH). As is assessment of the new projects in 2023 affected 2 14% SC considered not aligned 26% DNSH partly aligned illustrated in the table on page 36, the NEB the overall alignment for a NEB category. 4% Not taxonomy eligible 40% DNSH could not be 3 projects assessed categories are in general well-aligned with the Of the total covered NEB disbursement volume in 2023, 96% were considered 1 taxonomy-eligible, and 4% were not. 82% of the SC considered aligned: The project could demonstrate evidence that TSC for SC are fulfilled. Out of the total disbursed 2 SC considered partly aligned: The project could not demonstrate evidence on TSC for SC. disbursements were considered to fulfil the SC 3 NEB loan volume in 2023, Project not taxonomy eligible: The economic activity is not covered by the EU taxonomy. criteria for the project’s relevant economic 96% were considered activity, while 14% of the disbursements were taxonomy eligible. assessed as not fulfilling the SC criteria.
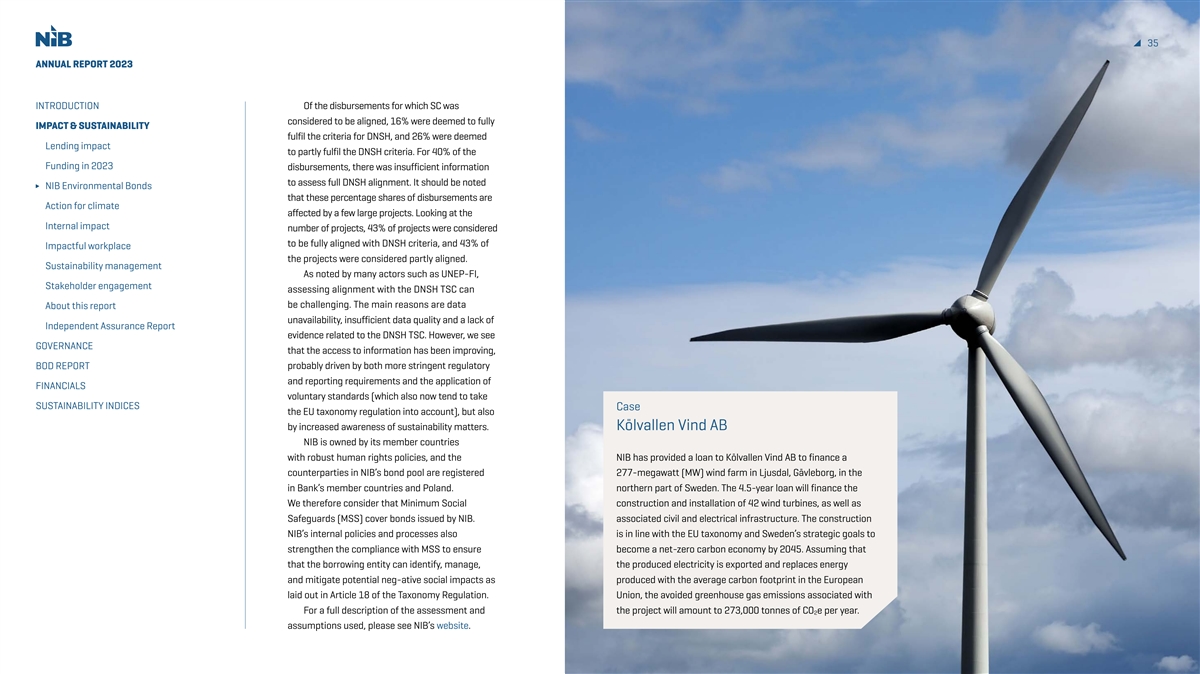
35 ANNUAL REPORT 2023 INTRODUCTION Of the disbursements for which SC was considered to be aligned, 16% were deemed to fully IMPACT & SUSTAINABILITY fulfil the criteria for DNSH, and 26% were deemed Lending impact to partly fulfil the DNSH criteria. For 40% of the Funding in 2023 disbursements, there was insufficient information to assess full DNSH alignment. It should be noted NIB Environmental Bonds that these percentage shares of disbursements are Action for climate affected by a few large projects. Looking at the Internal impact number of projects, 43% of projects were considered to be fully aligned with DNSH criteria, and 43% of Impactful workplace the projects were considered partly aligned. Sustainability management As noted by many actors such as UNEP-FI, Stakeholder engagement assessing alignment with the DNSH TSC can be challenging. The main reasons are data About this report unavailability, insufficient data quality and a lack of Independent Assurance Report evidence related to the DNSH TSC. However, we see GOVERNANCE that the access to information has been improving, BOD REPORT probably driven by both more stringent regulatory and reporting requirements and the application of FINANCIALS voluntary standards (which also now tend to take SUSTAINABILITY INDICES Case the EU taxonomy regulation into account), but also by increased awareness of sustainability matters. Kölvallen Vind AB NIB is owned by its member countries with robust human rights policies, and the NIB has provided a loan to Kölvallen Vind AB to finance a counterparties in NIB’s bond pool are registered 277-megawatt (MW) wind farm in Ljusdal, Gävleborg, in the in Bank’s member countries and Poland. northern part of Sweden. The 4.5-year loan will finance the We therefore consider that Minimum Social construction and installation of 42 wind turbines, as well as Safeguards (MSS) cover bonds issued by NIB. associated civil and electrical infrastructure. The construction NIB’s internal policies and processes also is in line with the EU taxonomy and Sweden’s strategic goals to strengthen the compliance with MSS to ensure become a net-zero carbon economy by 2045. Assuming that that the borrowing entity can identify, manage, the produced electricity is exported and replaces energy and mitigate potential neg-ative social impacts as produced with the average carbon footprint in the European laid out in Article 18 of the Taxonomy Regulation. Union, the avoided greenhouse gas emissions associated with For a full description of the assessment and the project will amount to 273,000 tonnes of CO e per year. 2 assumptions used, please see NIB’s website.
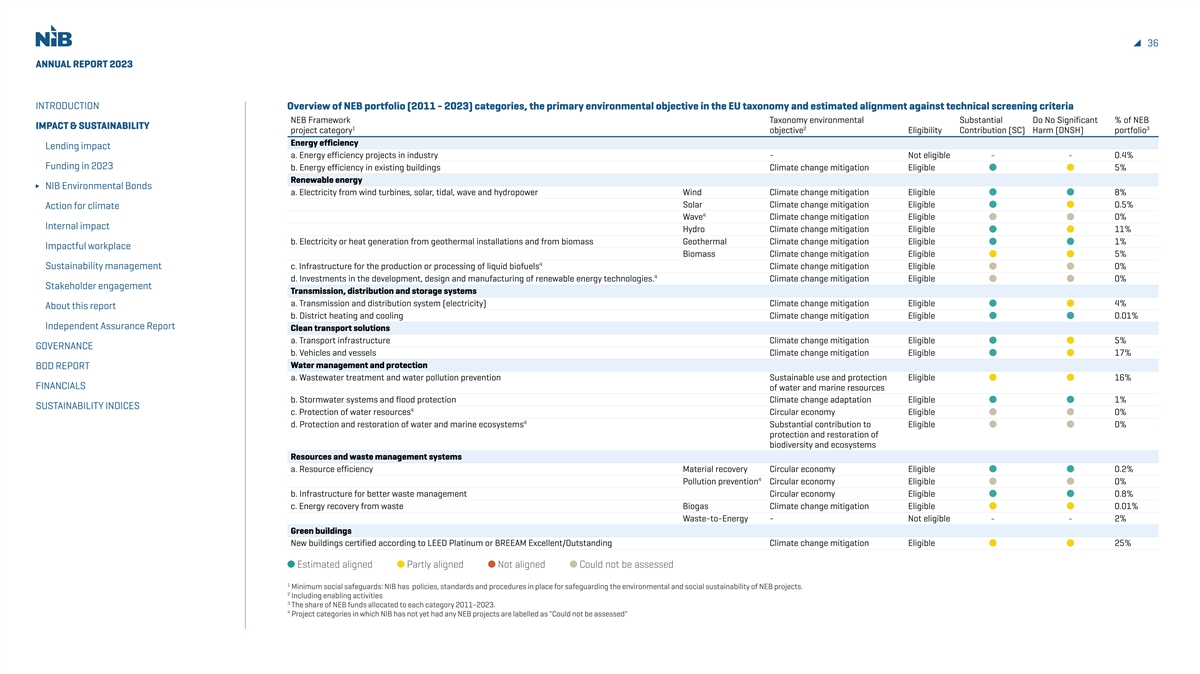
36 ANNUAL REPORT 2023 INTRODUCTION Overview of NEB portfolio (2011 - 2023) categories, the primary environmental objective in the EU taxonomy and estimated alignment against technical screening criteria NEB Framework Taxonomy environmental Substantial Do No Significant % of NEB IMPACT & SUSTAINABILITY 1 2 3 project category objective Eligibility Contribution (SC) Harm (DNSH)portf olio Energy efficiency Lending impact a. Energy efficiency projects in industry - Not eligible 0.4% - - Funding in 2023 b. Energy efficiency in existing buildings Climate change mitigation Eligible 5% Renewable energy NIB Environmental Bonds a. Electricity from wind turbines, solar, tidal, wave and hydropower Wind Climate change mitigation Eligible 8% Solar Climate change mitigation Eligible 0.5% Action for climate 4 Wave Climate change mitigation Eligible 0% Internal impact Hydro Climate change mitigation Eligible 11% b. Electricity or heat generation from geothermal installations and from biomass Geothermal Climate change mitigation Eligible 1% Impactful workplace Biomass Climate change mitigation Eligible 5% 4 Sustainability management c. Infrastructure for the production or processing of liquid biofuels Climate change mitigation Eligible 0% 4 d. Investments in the development, design and manufacturing of renewable energy technologies. Climate change mitigation Eligible 0% Stakeholder engagement Transmission, distribution and storage systems a. Transmission and distribution system (electricity) Climate change mitigation Eligible 4% About this report b. District heating and cooling Climate change mitigation Eligible 0.01% Independent Assurance Report Clean transport solutions a. Transport infrastructure Climate change mitigation Eligible 5% GOVERNANCE b. Vehicles and vessels Climate change mitigation Eligible 17% Water management and protection BOD REPORT a. Wastewater treatment and water pollution prevention Sustainable use and protection Eligible 16% FINANCIALS of water and marine resources b. Stormwater systems and flood protection Climate change adaptation Eligible 1% SUSTAINABILITY INDICES 4 c. Protection of water resources Circular economy Eligible 0% 4 d. Protection and restoration of water and marine ecosystems Substantial contribution to Eligible 0% protection and restoration of biodiversity and ecosystems Resources and waste management systems a. Resource efficiency Material recovery Circular economy Eligible 0.2% 4 Pollution prevention Circular economy Eligible 0% b. Infrastructure for better waste management Circular economy Eligible 0.8% c. Energy recovery from waste Biogas Climate change mitigation Eligible 0.01% Waste-to-Energy - Not eligible 2% - - Green buildings New buildings certified according to LEED Platinum or BREEAM Excellent/Outstanding Climate change mitigation Eligible 25% Estimated aligned Partly aligned Not aligned Could not be assessed 1 Minimum social safeguards: NIB has policies, standards and procedures in place for safeguarding the environmental and social sustainability of NEB projects. 2 Including enabling activities 3 The share of NEB funds allocated to each category 2011-2023. 4 Project categories in which NIB has not yet had any NEB projects are labelled as Could not be assessed
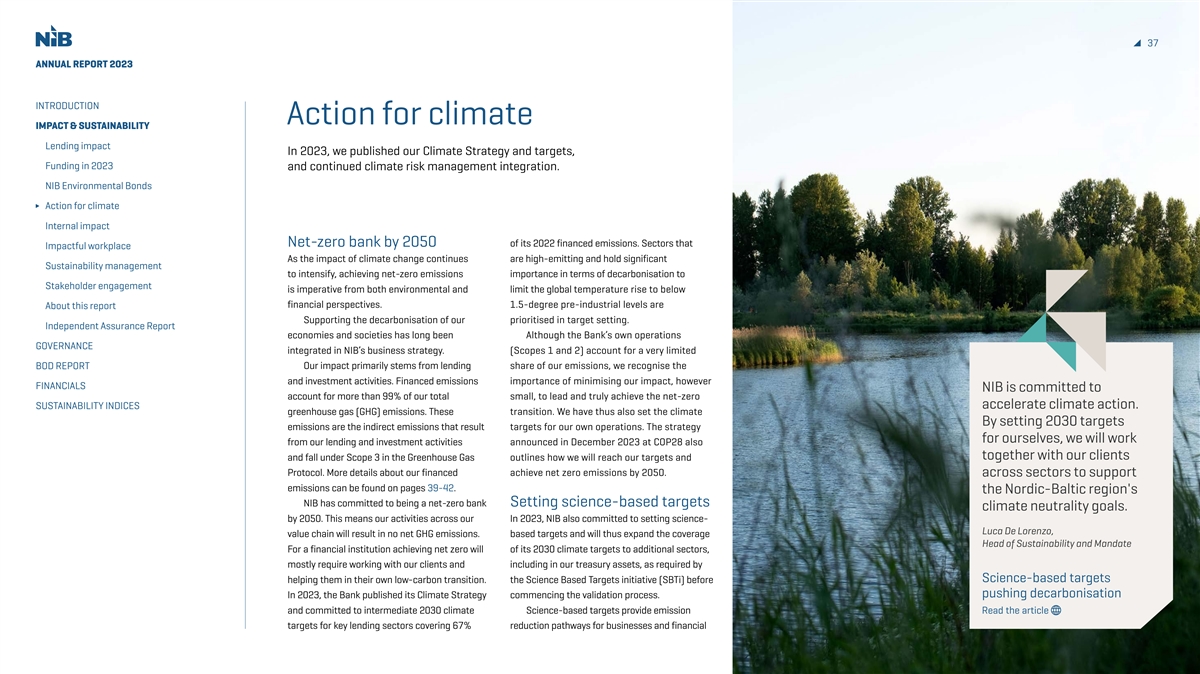
37 ANNUAL REPORT 2023 INTRODUCTION Action for climate IMPACT & SUSTAINABILITY Lending impact In 2023, we published our Climate Strategy and targets, Funding in 2023 and continued climate risk management integration. NIB Environmental Bonds Action for climate Internal impact Net-zero bank by 2050 of its 2022 financed emissions. Sectors that Impactful workplace As the impact of climate change continues are high-emitting and hold significant Sustainability management to intensify, achieving net-zero emissions importance in terms of decarbonisation to Stakeholder engagement is imperative from both environmental and limit the global temperature rise to below financial perspectives. 1.5-degree pre-industrial levels are About this report Supporting the decarbonisation of our prioritised in target setting. Independent Assurance Report economies and societies has long been Although the Bank’s own operations GOVERNANCE integrated in NIB’s business strategy. (Scopes 1 and 2) account for a very limited BOD REPORT Our impact primarily stems from lending share of our emissions, we recognise the and investment activities. Financed emissions importance of minimising our impact, however FINANCIALS NIB is committed to account for more than 99% of our total small, to lead and truly achieve the net-zero SUSTAINABILITY INDICES accelerate climate action. greenhouse gas (GHG) emissions. These transition. We have thus also set the climate By setting 2030 targets emissions are the indirect emissions that result targets for our own operations. The strategy for ourselves, we will work from our lending and investment activities announced in December 2023 at COP28 also together with our clients and fall under Scope 3 in the Greenhouse Gas outlines how we will reach our targets and Protocol. More details about our financed achieve net zero emissions by 2050. across sectors to support emissions can be found on pages 39-42. the Nordic-Baltic region's NIB has committed to being a net-zero bank Setting science-based targets climate neutrality goals. by 2050. This means our activities across our In 2023, NIB also committed to setting science- Luca De Lorenzo, value chain will result in no net GHG emissions. based targets and will thus expand the coverage Head of Sustainability and Mandate For a financial institution achieving net zero will of its 2030 climate targets to additional sectors, mostly require working with our clients and including in our treasury assets, as required by Science-based targets helping them in their own low-carbon transition. the Science Based Targets initiative (SBTi) before In 2023, the Bank published its Climate Strategy commencing the validation process. pushing decarbonisation and committed to intermediate 2030 climate Science-based targets provide emission Read the article targets for key lending sectors covering 67% reduction pathways for businesses and financial
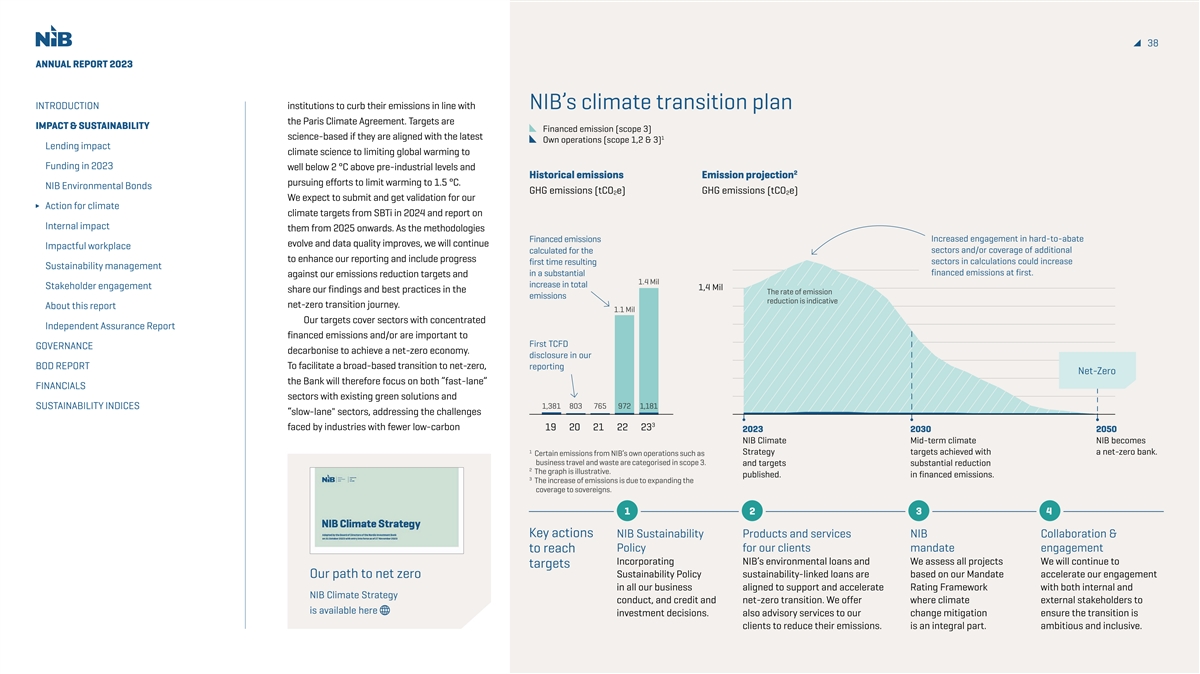
38 ANNUAL REPORT 2023 INTRODUCTION institutions to curb their emissions in line with NIB’s climate transition plan the Paris Climate Agreement. Targets are IMPACT & SUSTAINABILITY Financed emission (scope 3) science-based if they are aligned with the latest 1 Own operations (scope 1,2 & 3) Lending impact climate science to limiting global warming to Funding in 2023 well below 2 °C above pre-industrial levels and 2 Historical emissions Emission projection pursuing efforts to limit warming to 1.5 °C. NIB Environmental Bonds GHG emissions (tCO e) GHG emissions (tCO e) 2 2 We expect to submit and get validation for our Action for climate climate targets from SBTi in 2024 and report on Internal impact them from 2025 onwards. As the methodologies Increased engagement in hard-to-abate Financed emissions evolve and data quality improves, we will continue Impactful workplace sectors and/or coverage of additional calculated for the to enhance our reporting and include progress sectors in calculations could increase first time resulting Sustainability management financed emissions at first. in a substantial against our emissions reduction targets and 1.4 Mil increase in total Stakeholder engagement 1,4 Mil The rate of emission share our findings and best practices in the The rate of emission emissions reduction is indicative reduction is indicative net-zero transition journey. About this report 1.1 Mil Our targets cover sectors with concentrated Independent Assurance Report financed emissions and/or are important to First TCFD GOVERNANCE decarbonise to achieve a net-zero economy. disclosure in our BOD REPORT To facilitate a broad-based transition to net-zero, reporting Net-Zero the Bank will therefore focus on both ”fast-lane” FINANCIALS sectors with existing green solutions and SUSTAINABILITY INDICES 1,381 803 765 972 1,181 “slow-lane sectors, addressing the challenges 3 faced by industries with fewer low-carbon 19 20 21 22 23 2023 2030 2050 NIB Climate Mid-term climate NIB becomes 1 Strategy targets achieved with a net-zero bank. Certain emissions from NIB’s own operations such as business travel and waste are categorised in scope 3. and targets substantial reduction 2 The graph is illustrative. published. in financed emissions. 3 The increase of emissions is due to expanding the coverage to sovereigns. 1 2 3 4 Key actions NIB Sustainability Products and services NIB Collaboration & Policy for our clients mandate engagement to reach Incorporating NIB’s environmental loans and We assess all projects We will continue to targets Our path to net zero Sustainability Policy sustainability-linked loans are based on our Mandate accelerate our engagement in all our business aligned to support and accelerate Rating Framework with both internal and NIB Climate Strategy conduct, and credit and net-zero transition. We offer where climate external stakeholders to is available here investment decisions. also advisory services to our change mitigation ensure the transition is clients to reduce their emissions. is an integral part. ambitious and inclusive.
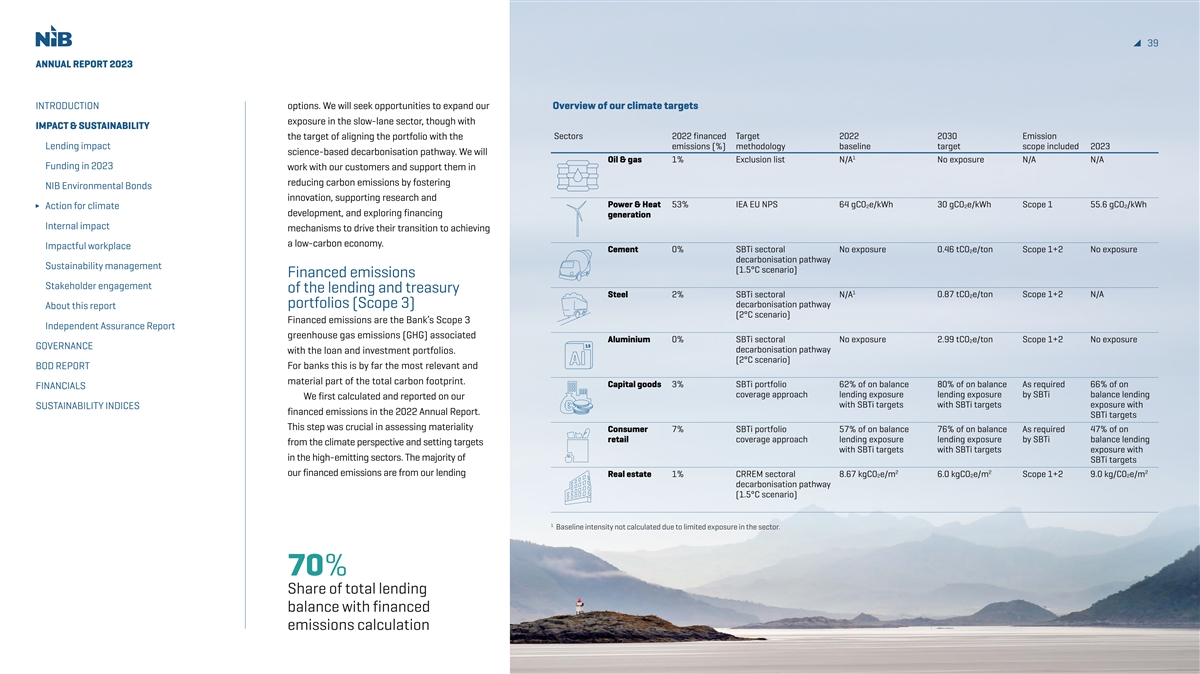
39 ANNUAL REPORT 2023 INTRODUCTION options. We will seek opportunities to expand our Overview of our climate targets exposure in the slow-lane sector, though with IMPACT & SUSTAINABILITY the target of aligning the portfolio with the Sectors 2022 financed Target 2022 2030 Emission Lending impact emissions (%) methodology baseline target scope included 2023 science-based decarbonisation pathway. We will 1 Oil & gas 1% Exclusion list N/A No exposure N/A N/A Funding in 2023 work with our customers and support them in reducing carbon emissions by fostering NIB Environmental Bonds innovation, supporting research and Power & Heat 53% IEA EU NPS 64 gCO e/kWh 30 gCO e/kWh Scope 1 55.6 gCO /kWh 2 2 2 Action for climate development, and exploring financing generation Internal impact mechanisms to drive their transition to achieving a low-carbon economy. Impactful workplace Cement 0% SBTi sectoral No exposure 0.46 tCO2e/ton Scope 1+2 No exposure decarbonisation pathway Sustainability management (1.5°C scenario) Financed emissions Stakeholder engagement of the lending and treasury 1 Steel 2% SBTi sectoral N/A 0.87 tCO e/ton Scope 1+2 N/A 2 decarbonisation pathway portfolios (Scope 3) About this report (2°C scenario) Financed emissions are the Bank’s Scope 3 Independent Assurance Report greenhouse gas emissions (GHG) associated Aluminium 0% SBTi sectoral No exposure 2.99 tCO e/ton Scope 1+2 No exposure 2 GOVERNANCE decarbonisation pathway with the loan and investment portfolios. (2°C scenario) BOD REPORT For banks this is by far the most relevant and material part of the total carbon footprint. Capital goods 3% SBTi portfolio 62% of on balance 80% of on balance As required 66% of on FINANCIALS coverage approach lending exposure lending exposure by SBTi balance lending We first calculated and reported on our with SBTi targets with SBTi targets exposure with SUSTAINABILITY INDICES financed emissions in the 2022 Annual Report. SBTi targets This step was crucial in assessing materiality Consumer 7% SBTi portfolio 57% of on balance 76% of on balance As required 47% of on retail coverage approach lending exposure lending exposure by SBTi balance lending from the climate perspective and setting targets with SBTi targets with SBTi targets exposure with in the high-emitting sectors. The majority of SBTi targets 2 2 2 our financed emissions are from our lending Real estate 1% CRREM sectoral 8.67 kgCO e/m 6.0 kgCO e/m Scope 1+2 9.0 kg/CO e/m 2 2 2 decarbonisation pathway (1.5°C scenario) 1 Baseline intensity not calculated due to limited exposure in the sector. 70% Share of total lending balance with financed emissions calculation
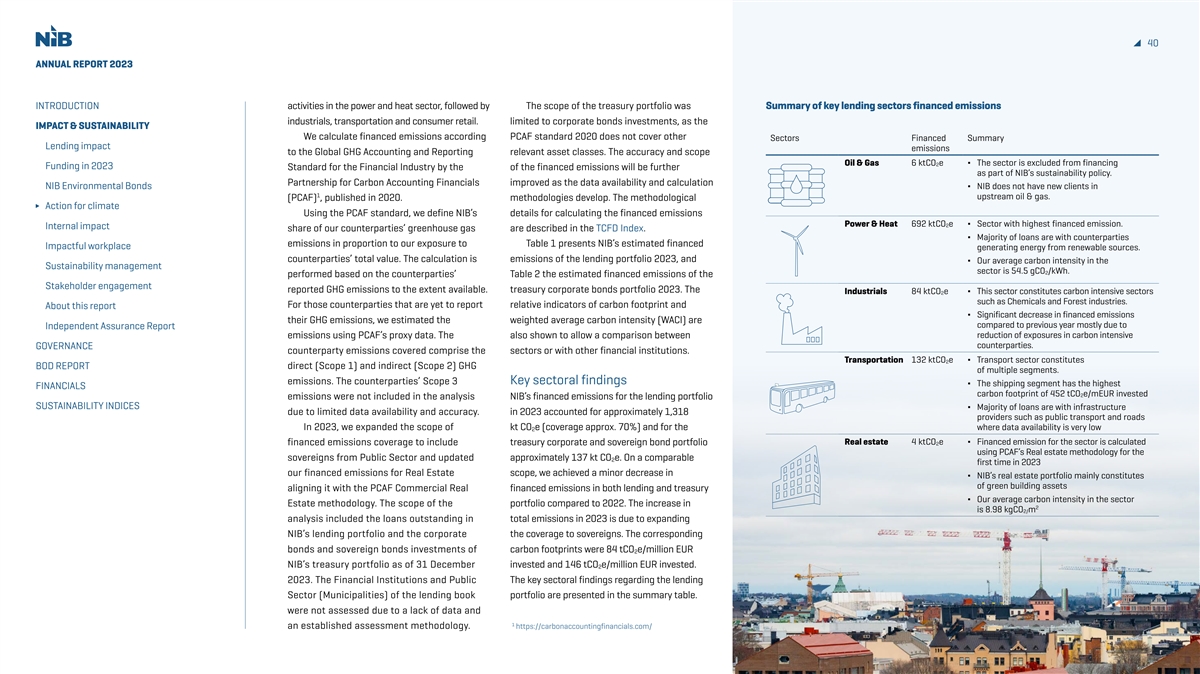
40 ANNUAL REPORT 2023 INTRODUCTION activities in the power and heat sector, followed by The scope of the treasury portfolio was Summary of key lending sectors financed emissions industrials, transportation and consumer retail. limited to corporate bonds investments, as the IMPACT & SUSTAINABILITY We calculate financed emissions according PCAF standard 2020 does not cover other Sectors Financed Summary Lending impact emissions to the Global GHG Accounting and Reporting relevant asset classes. The accuracy and scope Oil & Gas 6 ktCO e ∆ The sector is excluded from financing 2 Funding in 2023 Standard for the Financial Industry by the of the financed emissions will be further as part of NIB’s sustainability policy. Partnership for Carbon Accounting Financials improved as the data availability and calculation NIB Environmental Bonds ∆ NIB does not have new clients in 1 upstream oil & gas. (PCAF) , published in 2020. methodologies develop. The methodological Action for climate Using the PCAF standard, we define NIB’s details for calculating the financed emissions Power & Heat 692 ktCO e ∆ Sector with highest financed emission. 2 Internal impact share of our counterparties’ greenhouse gas are described in the TCFD Index. ∆ Majority of loans are with counterparties emissions in proportion to our exposure to Table 1 presents NIB’s estimated financed Impactful workplace generating energy from renewable sources. counterparties’ total value. The calculation is emissions of the lending portfolio 2023, and ∆ Our average carbon intensity in the Sustainability management sector is 54.5 gCO2/kWh. performed based on the counterparties’ Table 2 the estimated financed emissions of the Stakeholder engagement reported GHG emissions to the extent available. treasury corporate bonds portfolio 2023. The Industrials 84 ktCO2e ∆ This sector constitutes carbon intensive sectors such as Chemicals and Forest industries. For those counterparties that are yet to report relative indicators of carbon footprint and About this report ∆ Significant decrease in financed emissions their GHG emissions, we estimated the weighted average carbon intensity (WACI) are compared to previous year mostly due to Independent Assurance Report reduction of exposures in carbon intensive emissions using PCAF’s proxy data. The also shown to allow a comparison between counterparties. GOVERNANCE counterparty emissions covered comprise the sectors or with other financial institutions. Transportation 132 ktCO e ∆ Transport sector constitutes 2 BOD REPORT direct (Scope 1) and indirect (Scope 2) GHG of multiple segments. emissions. The counterparties’ Scope 3 Key sectoral findings ∆ The shipping segment has the highest FINANCIALS carbon footprint of 452 tCO e/mEUR invested 2 emissions were not included in the analysis NIB’s financed emissions for the lending portfolio SUSTAINABILITY INDICES ∆ Majority of loans are with infrastructure due to limited data availability and accuracy. in 2023 accounted for approximately 1,318 providers such as public transport and roads In 2023, we expanded the scope of kt CO e (coverage approx. 70%) and for the where data availability is very low 2 financed emissions coverage to include treasury corporate and sovereign bond portfolio Real estate 4 ktCO2e ∆ Financed emission for the sector is calculated using PCAF’s Real estate methodology for the sovereigns from Public Sector and updated approximately 137 kt CO e. On a comparable 2 first time in 2023 our financed emissions for Real Estate scope, we achieved a minor decrease in ∆ NIB’s real estate portfolio mainly constitutes of green building assets aligning it with the PCAF Commercial Real financed emissions in both lending and treasury ∆ Our average carbon intensity in the sector Estate methodology. The scope of the portfolio compared to 2022. The increase in 2 is 8.98 kgCO m 2/ analysis included the loans outstanding in total emissions in 2023 is due to expanding NIB’s lending portfolio and the corporate the coverage to sovereigns. The corresponding bonds and sovereign bonds investments of carbon footprints were 84 tCO e/million EUR 2 NIB’s treasury portfolio as of 31 December invested and 146 tCO e/million EUR invested. 2 2023. The Financial Institutions and Public The key sectoral findings regarding the lending Sector (Municipalities) of the lending book portfolio are presented in the summary table. were not assessed due to a lack of data and 1 an established assessment methodology. https://carbonaccountingfinancials.com/
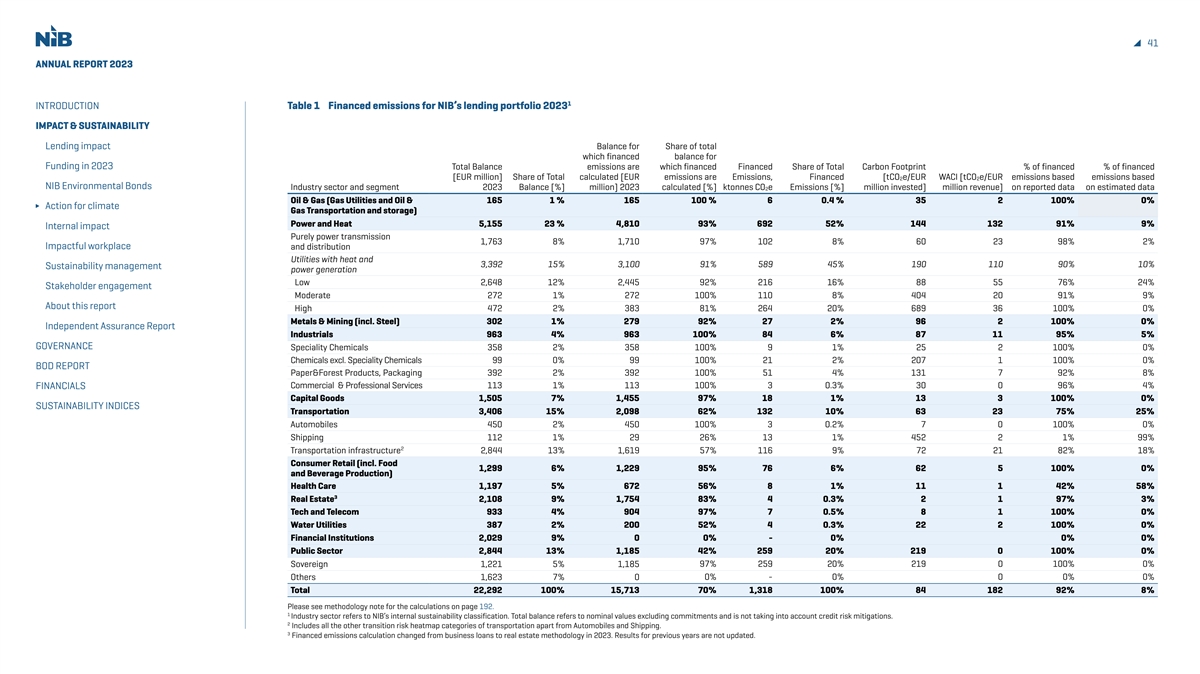
41 ANNUAL REPORT 2023 1 INTRODUCTION Table 1 Financed emissions for NIB’s lending portfolio 2023 IMPACT & SUSTAINABILITY Lending impact Balance for Share of total which financed balance for Funding in 2023 Total Balance emissions are which financed Financed Share of Total Carbon Footprint % of financed % of financed [EUR million] Share of Total calculated [EUR emissions are Emissions, Financed [tCO2e/EUR WACI [tCO2e/EUR emissions based emissions based NIB Environmental Bonds Industry sector and segment 2023 Balance [%] million] 2023 calculated [%] ktonnes CO2e Emissions [%] million invested] million revenue] on reported data on estimated data Oil & Gas (Gas Utilities and Oil & 165 1 % 165 100 % 6 0.4 % 35 2 100% 0% Action for climate Gas Transportation and storage) Power and Heat 5,155 23 % 4,810 93% 692 52% 144 132 91% 9% Internal impact Purely power transmission 1,763 8% 1,710 97% 102 8% 60 23 98% 2% Impactful workplace and distribution Utilities with heat and 3,392 15% 3,100 91% 589 45% 190 110 90% 10% Sustainability management power generation Low 2,648 12% 2,445 92% 216 16% 88 55 76% 24% Stakeholder engagement Moderate 272 1% 272 100% 110 8% 404 20 91% 9% About this report High 472 2% 383 81% 264 20% 689 36 100% 0% Metals & Mining (incl. Steel) 302 1% 279 92% 27 2% 96 2 100% 0% Independent Assurance Report Industrials 963 4% 963 100% 84 6% 87 11 95% 5% GOVERNANCE Speciality Chemicals 358 2% 358 100% 9 1% 25 2 100% 0% Chemicals excl. Speciality Chemicals 99 0% 99 100% 21 2% 207 1 100% 0% BOD REPORT Paper&Forest Products, Packaging 392 2% 392 100% 51 4% 131 7 92% 8% Commercial & Professional Services 113 1% 113 100% 3 0.3% 30 0 96% 4% FINANCIALS Capital Goods 1,505 7% 1,455 97% 18 1% 13 3 100% 0% SUSTAINABILITY INDICES Transportation 3,406 15% 2,098 62% 132 10% 63 23 75% 25% Automobiles 450 2% 450 100% 3 0.2% 7 0 100% 0% Shipping 112 1% 29 26% 13 1% 452 2 1% 99% 2 Transportation infrastructure 2,844 13% 1,619 57% 116 9% 72 21 82% 18% Consumer Retail (incl. Food 1,299 6% 1,229 95% 76 6% 62 5 100% 0% and Beverage Production) Health Care 1,197 5% 672 56% 8 1% 11 1 42% 58% 3 Real Estate 2,108 9% 1,754 83% 4 0.3% 2 1 97% 3% Tech and Telecom 933 4% 904 97% 7 0.5% 8 1 100% 0% Water Utilities 387 2% 200 52% 4 0.3% 22 2 100% 0% Financial Institutions 2,029 9% 0 0% - 0% 0% 0% Public Sector 2,844 13% 1,185 42% 259 20% 219 0 100% 0% 97% 259 20% 219 0 100% 0% Sovereign 1,221 5% 1,185 Others 1,623 7% 0 0% - 0% 0 0% 0% Total 22,292 100% 15,713 70% 1,318 100% 84 182 92% 8% Please see methodology note for the calculations on page 192. 1 Industry sector refers to NIB’s internal sustainability classification. Total balance refers to nominal values excluding commitments and is not taking into account credit risk mitigations. 2 Includes all the other transition risk heatmap categories of transportation apart from Automobiles and Shipping. 3 Financed emissions calculation changed from business loans to real estate methodology in 2023. Results for previous years are not updated.
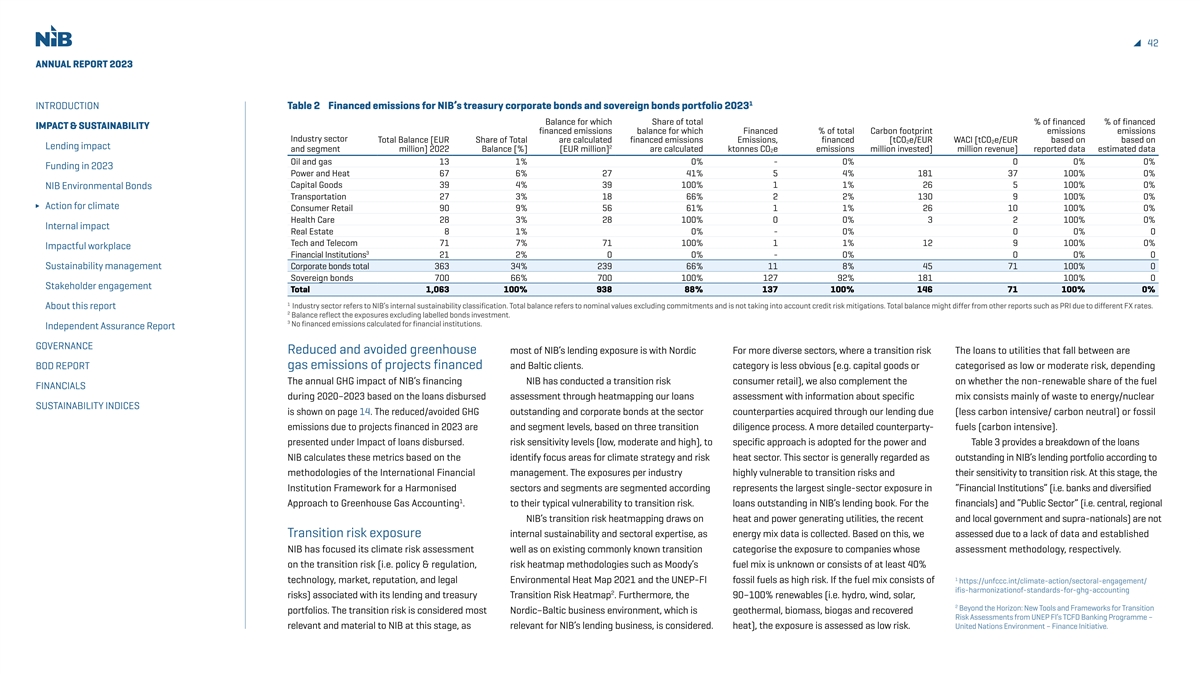
42 ANNUAL REPORT 2023 1 INTRODUCTION Table 2 Financed emissions for NIB’s treasury corporate bonds and sovereign bonds portfolio 2023 Balance for which Share of total % of financed % of financed IMPACT & SUSTAINABILITY financed emissions balance for which Financed % of total Carbon footprint emissions emissions Industry sector Total Balance [EUR Share of Total are calculated financed emissions Emissions, financed [tCO e/EUR WACI [tCO e/EUR based on based on 2 2 2 Lending impact and segment million] 2022 Balance [%] [EUR million] are calculated ktonnes CO e emissions million invested] million revenue] reported data estimated data 2 Oil and gas 13 1% 0% - 0% 0 0% 0% Funding in 2023 Power and Heat 67 6% 27 41% 5 4% 181 37 100% 0% Capital Goods 39 4% 39 100% 1 1% 26 5 100% 0% NIB Environmental Bonds Transportation 27 3% 18 66% 2 2% 130 9 100% 0% Action for climate Consumer Retail 90 9% 56 61% 1 1% 26 10 100% 0% Health Care 28 3% 28 100% 0 0% 3 2 100% 0% Internal impact Real Estate 8 1% 0% - 0% 0 0% 0 Tech and Telecom 71 7% 71 100% 1 1% 12 9 100% 0% Impactful workplace 3 Financial Institutions 21 2% 0 0% - 0% 0 0% 0 Sustainability management Corporate bonds total 363 34% 239 66% 11 8% 45 71 100% 0 Sovereign bonds 700 66% 700 100% 127 92% 181 100% 0 Stakeholder engagement Total 1,063 100% 938 88% 137 100% 146 71 100% 0% 1 Industry sector refers to NIB’s internal sustainability classification. Total balance refers to nominal values excluding commitments and is not taking into account credit risk mitigations. Total balance might differ from other reports such as PRI due to different FX rates. About this report 2 Balance reflect the exposures excluding labelled bonds investment. 3 No financed emissions calculated for financial institutions. Independent Assurance Report GOVERNANCE Reduced and avoided greenhouse most of NIB’s lending exposure is with Nordic For more diverse sectors, where a transition risk The loans to utilities that fall between are BOD REPORT gas emissions of projects financed and Baltic clients. category is less obvious (e.g. capital goods or categorised as low or moderate risk, depending The annual GHG impact of NIB’s financing NIB has conducted a transition risk consumer retail), we also complement the on whether the non-renewable share of the fuel FINANCIALS during 2020–2023 based on the loans disbursed assessment through heatmapping our loans assessment with information about specific mix consists mainly of waste to energy/nuclear SUSTAINABILITY INDICES is shown on page 14. The reduced/avoided GHG outstanding and corporate bonds at the sector counterparties acquired through our lending due (less carbon intensive/ carbon neutral) or fossil emissions due to projects financed in 2023 are and segment levels, based on three transition diligence process. A more detailed counterparty- fuels (carbon intensive). presented under Impact of loans disbursed. risk sensitivity levels (low, moderate and high), to specific approach is adopted for the power and Table 3 provides a breakdown of the loans NIB calculates these metrics based on the identify focus areas for climate strategy and risk heat sector. This sector is generally regarded as outstanding in NIB’s lending portfolio according to methodologies of the International Financial management. The exposures per industry highly vulnerable to transition risks and their sensitivity to transition risk. At this stage, the Institution Framework for a Harmonised sectors and segments are segmented according represents the largest single-sector exposure in “Financial Institutions” (i.e. banks and diversified 1 Approach to Greenhouse Gas Accounting . to their typical vulnerability to transition risk. loans outstanding in NIB’s lending book. For the financials) and “Public Sector” (i.e. central, regional NIB’s transition risk heatmapping draws on heat and power generating utilities, the recent and local government and supra-nationals) are not 1 Beyond the Horizon: New Tools and Frameworks for Transition risk exposure internal sustainability and sectoral expertise, as energy mix data is collected. Based on this, we assessed due to a lack of data and established Transition Risk Assessments from UNEP FI’s TCFD Banking NIB has focused its climate risk assessment well as on existing commonly known transition categorise the exposure to companies whose assessment methodology, respectively. Programme – United Nations Environment – Finance Initiative on the transition risk (i.e. policy & regulation, risk heatmap methodologies such as Moody’s fuel mix is unknown or consists of at least 40% 1 technology, market, reputation, and legal Environmental Heat Map 2021 and the UNEP-FI fossil fuels as high risk. If the fuel mix consists of https://unfccc.int/climate-action/sectoral-engagement/ ifis-harmonizationof-standards-for-ghg-accounting 2 risks) associated with its lending and treasury Transition Risk Heatmap . Furthermore, the 90–100% renewables (i.e. hydro, wind, solar, 2 Beyond the Horizon: New Tools and Frameworks for Transition portfolios. The transition risk is considered most Nordic–Baltic business environment, which is geothermal, biomass, biogas and recovered Risk Assessments from UNEP FI’s TCFD Banking Programme – relevant and material to NIB at this stage, as relevant for NIB’s lending business, is considered. heat), the exposure is assessed as low risk. United Nations Environment – Finance Initiative.
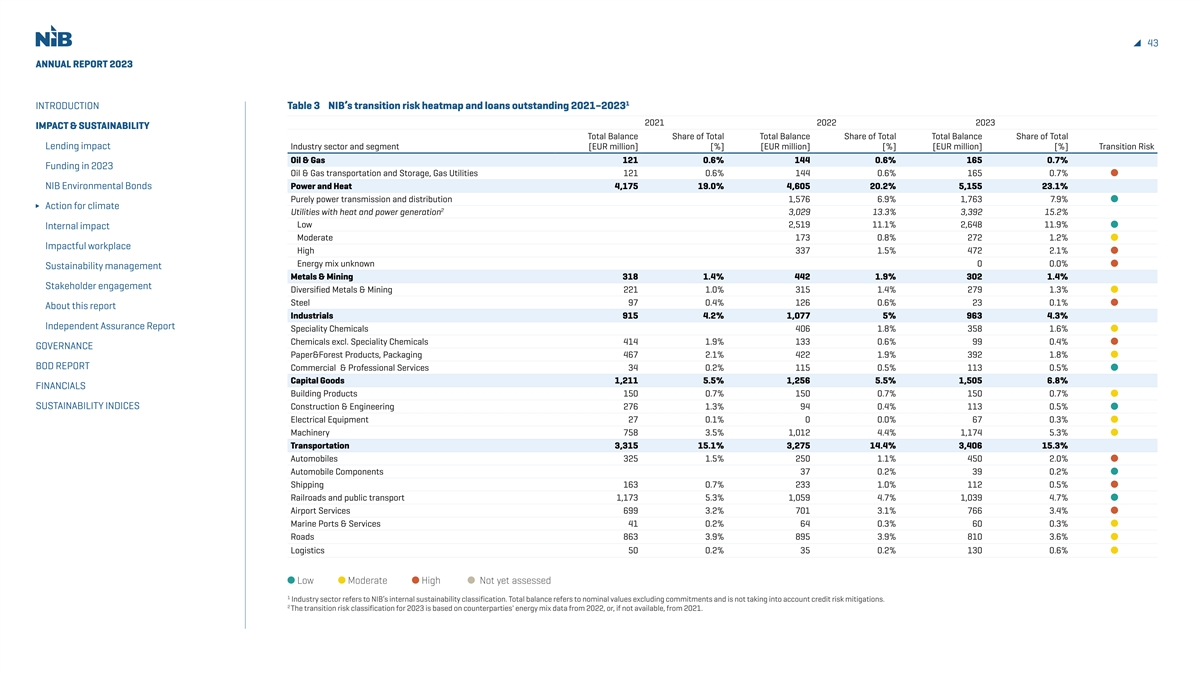
43 ANNUAL REPORT 2023 1 INTRODUCTION Table 3 NIB’s transition risk heatmap and loans outstanding 2021–2023 2021 2022 2023 IMPACT & SUSTAINABILITY Total Balance Share of Total Total Balance Share of Total Total Balance Share of Total Lending impact Industry sector and segment [EUR million] [%] [EUR million] [%] [EUR million] [%] Transition Risk Oil & Gas 121 0.6% 144 0.6% 165 0.7% Funding in 2023 Oil & Gas transportation and Storage, Gas Utilities 121 0.6% 144 0.6% 165 0.7% NIB Environmental Bonds Power and Heat 4,175 19.0% 4,605 20.2% 5,155 23.1% Purely power transmission and distribution 1,576 6.9% 1,763 7.9% Action for climate 2 Utilities with heat and power generation 3,029 13.3% 3,392 15.2% Low 2,519 11.1% 2,648 11.9% Internal impact Moderate 173 0.8% 272 1.2% Impactful workplace High 337 1.5% 472 2.1% Energy mix unknown 0 0.0% Sustainability management Metals & Mining 318 1.4% 442 1.9% 302 1.4% Stakeholder engagement Diversified Metals & Mining 221 1.0% 315 1.4% 279 1.3% Steel 97 0.4% 126 0.6% 23 0.1% About this report Industrials 915 4.2% 1,077 5% 963 4.3% Independent Assurance Report Speciality Chemicals 406 1.8% 358 1.6% Chemicals excl. Speciality Chemicals 414 1.9% 133 0.6% 99 0.4% GOVERNANCE Paper&Forest Products, Packaging 467 2.1% 422 1.9% 392 1.8% BOD REPORT Commercial & Professional Services 34 0.2% 115 0.5% 113 0.5% Capital Goods 1,211 5.5% 1,256 5.5% 1,505 6.8% FINANCIALS Building Products 150 0.7% 150 0.7% 150 0.7% SUSTAINABILITY INDICES Construction & Engineering 276 1.3% 94 0.4% 113 0.5% Electrical Equipment 27 0.1% 0 0.0% 67 0.3% Machinery 758 3.5% 1,012 4.4% 1,174 5.3% Transportation 3,315 15.1% 3,275 14.4% 3,406 15.3% Automobiles 325 1.5% 250 1.1% 450 2.0% Automobile Components 37 0.2% 39 0.2% Shipping 163 0.7% 233 1.0% 112 0.5% Railroads and public transport 1,173 5.3% 1,059 4.7% 1,039 4.7% Airport Services 699 3.2% 701 3.1% 766 3.4% Marine Ports & Services 41 0.2% 64 0.3% 60 0.3% Roads 863 3.9% 895 3.9% 810 3.6% Logistics 50 0.2% 35 0.2% 130 0.6% Low Moderate High Not yet assessed 1 Industry sector refers to NIB’s internal sustainability classification. Total balance refers to nominal values excluding commitments and is not taking into account credit risk mitigations. 2 The transition risk classification for 2023 is based on counterparties' energy mix data from 2022, or, if not available, from 2021.
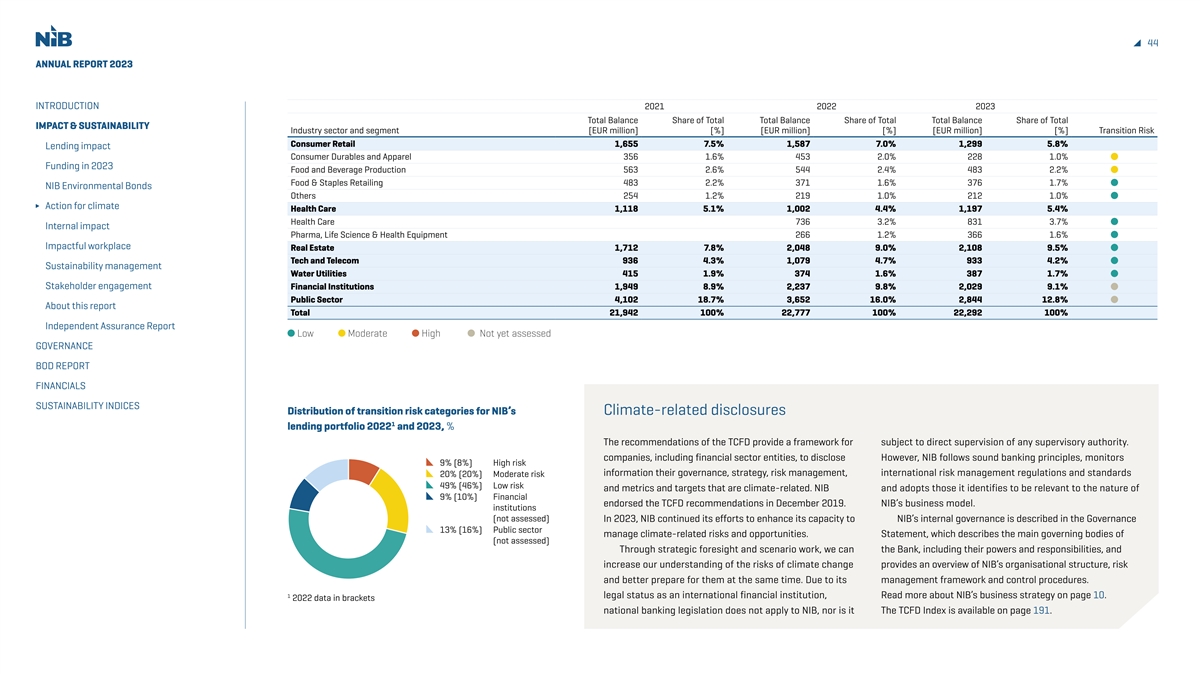
44 ANNUAL REPORT 2023 INTRODUCTION 2021 2022 2023 Total Balance Share of Total Total Balance Share of Total Total Balance Share of Total IMPACT & SUSTAINABILITY Industry sector and segment [EUR million] [%] [EUR million] [%] [EUR million] [%] Transition Risk Consumer Retail 1,655 7.5% 1,587 7.0% 1,299 5.8% Lending impact Consumer Durables and Apparel 356 1.6% 453 2.0% 228 1.0% Funding in 2023 Food and Beverage Production 563 2.6% 544 2.4% 483 2.2% Food & Staples Retailing 483 2.2% 371 1.6% 376 1.7% NIB Environmental Bonds Others 254 1.2% 219 1.0% 212 1.0% Action for climate Health Care 1,118 5.1% 1,002 4.4% 1,197 5.4% Health Care 736 3.2% 831 3.7% Internal impact Pharma, Life Science & Health Equipment 266 1.2% 366 1.6% Impactful workplace Real Estate 1,712 7.8% 2,048 9.0% 2,108 9.5% Tech and Telecom 936 4.3% 1,079 4.7% 933 4.2% Sustainability management Water Utilities 415 1.9% 374 1.6% 387 1.7% Stakeholder engagement Financial Institutions 1,949 8.9% 2,237 9.8% 2,029 9.1% Public Sector 4,102 18.7% 3,652 16.0% 2,844 12.8% About this report Total 21,942 100% 22,777 100% 22,292 100% Independent Assurance Report Low Moderate High Not yet assessed GOVERNANCE BOD REPORT FINANCIALS SUSTAINABILITY INDICES Distribution of transition risk categories for NIB’s Climate-related disclosures 1 lending portfolio 2022 and 2023, % The recommendations of the TCFD provide a framework for subject to direct supervision of any supervisory authority. companies, including financial sector entities, to disclose However, NIB follows sound banking principles, monitors 9% (8%) High risk information their governance, strategy, risk management, international risk management regulations and standards 20% (20%) Moderate risk 49% (46%) Low risk and metrics and targets that are climate-related. NIB and adopts those it identifies to be relevant to the nature of 9% (10%) Financial endorsed the TCFD recommendations in December 2019. NIB’s business model. institutions (not assessed) In 2023, NIB continued its efforts to enhance its capacity to NIB’s internal governance is described in the Governance 13% (16%) Public sector manage climate-related risks and opportunities. Statement, which describes the main governing bodies of (not assessed) Through strategic foresight and scenario work, we can the Bank, including their powers and responsibilities, and increase our understanding of the risks of climate change provides an overview of NIB’s organisational structure, risk and better prepare for them at the same time. Due to its management framework and control procedures. 1 legal status as an international financial institution, Read more about NIB’s business strategy on page 10. 2022 data in brackets national banking legislation does not apply to NIB, nor is it The TCFD Index is available on page 191.
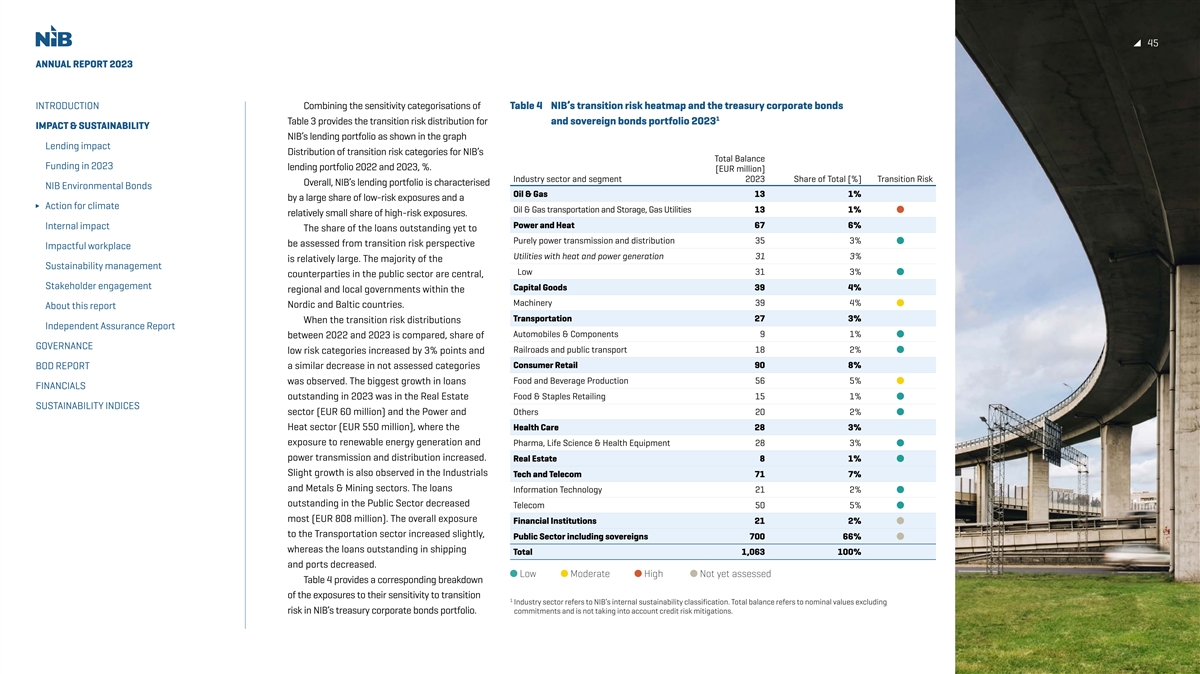
45 ANNUAL REPORT 2023 INTRODUCTION Combining the sensitivity categorisations of Table 4 NIB’s transition risk heatmap and the treasury corporate bonds 1 Table 3 provides the transition risk distribution for and sovereign bonds portfolio 2023 IMPACT & SUSTAINABILITY NIB’s lending portfolio as shown in the graph Lending impact Distribution of transition risk categories for NIB’s Total Balance Funding in 2023 lending portfolio 2022 and 2023, %. [EUR million] Industry sector and segment 2023 Share of Total [%] Transition Risk Overall, NIB’s lending portfolio is characterised NIB Environmental Bonds Oil & Gas 13 1% by a large share of low-risk exposures and a Action for climate Oil & Gas transportation and Storage, Gas Utilities 13 1% relatively small share of high-risk exposures. Power and Heat 67 6% Internal impact The share of the loans outstanding yet to Purely power transmission and distribution 35 3% be assessed from transition risk perspective Impactful workplace Utilities with heat and power generation 31 3% is relatively large. The majority of the Sustainability management Low 31 3% counterparties in the public sector are central, Stakeholder engagement Capital Goods 39 4% regional and local governments within the Machinery 39 4% Nordic and Baltic countries. About this report Transportation 27 3% When the transition risk distributions Independent Assurance Report Automobiles & Components 9 1% between 2022 and 2023 is compared, share of GOVERNANCE Railroads and public transport 18 2% low risk categories increased by 3% points and Consumer Retail 90 8% BOD REPORT a similar decrease in not assessed categories was observed. The biggest growth in loans Food and Beverage Production 56 5% FINANCIALS outstanding in 2023 was in the Real Estate Food & Staples Retailing 15 1% SUSTAINABILITY INDICES sector (EUR 60 million) and the Power and Others 20 2% Heat sector (EUR 550 million), where the Health Care 28 3% exposure to renewable energy generation and Pharma, Life Science & Health Equipment 28 3% power transmission and distribution increased. Real Estate 8 1% Slight growth is also observed in the Industrials Tech and Telecom 71 7% and Metals & Mining sectors. The loans Information Technology 21 2% outstanding in the Public Sector decreased Telecom 50 5% most (EUR 808 million). The overall exposure Financial Institutions 21 2% to the Transportation sector increased slightly, Public Sector including sovereigns 700 66% whereas the loans outstanding in shipping Total 1,063 100% and ports decreased. Low Moderate High Not yet assessed Table 4 provides a corresponding breakdown of the exposures to their sensitivity to transition 1 Industry sector refers to NIB’s internal sustainability classification. Total balance refers to nominal values excluding risk in NIB’s treasury corporate bonds portfolio. commitments and is not taking into account credit risk mitigations.
46 ANNUAL REPORT 2023 INTRODUCTION Climate risk and reporting. The overall aim at the Bank is to gradually build Bank focused on improving the technical aspects of its climate- According to the TCFD recommendations, banks are expected to adequate capacity to manage climate-related risks, subject to its related data collection and management processes, as well as IMPACT & SUSTAINABILITY disclose how they identify, assess, and manage climate-related materiality in the Banks balance sheet. facilitating more efficient calculation of its financed emissions. Lending impact risks. In addition, banks are expected to consider climate-related In general, climate risk identification can take place at Funding in 2023 risks in the context of traditional risk categories in the banking individual project level, counterparty level and portfolio level. Climate risk quantification sector such as credit, market, liquidity and operational risk. Climate risk can be identified using an inside-out perspective, i.e. While climate-related regulations are developing rapidly, and more NIB Environmental Bonds how the operations of an entity affect climate, while in the data and understanding is gathered on climate risk exposure at Action for climate Climate risk in the risk taxonomy traditional risk management procedures focus has been on NIB, the Bank has not yet set a materiality threshold for climate Internal impact During 2023, NIB further developed and implemented its analysing how climate change affects the operations and risk risk. However, NIB has developed an initial set of climate-related bank-wide risk taxonomy. At the highest level, the taxonomy positions of the Bank (outside-in perspective). risk metrics and has started to report on climate risk internally as Impactful workplace makes a distinction between financial and non-financial risks NIB's Sustainability Policy and related Guidelines provide an part of the regular risk reporting. Sustainability management and provides a tool for risk identification, control, reporting and overall framework for our climate-related risk assessments at Given its relatively large share in capital consumption, Stakeholder engagement policy work. ESG-related risks (including climate-related aspects) the project and counterparty levels. Because customers’ climate development efforts have focused on the credit risk associated are categorised under non-financial risks. The risk taxonomy strategies and targets play a central role in the assessments, we with the Bank’s lending portfolio. Out of transition risk and About this report supports overall awareness raising in the Bank and displays how encourage our clients to clearly define and communicate their physical risk, the transition risk has been considered to be more Independent Assurance Report climate risk fits in with the Bank’s overall risk taxonomy and risk climate-related commitments and to develop and execute material than physical risk as the financing the Bank provides GOVERNANCE management framework. effective strategies to mitigate climate risks. While sustainability comes typically with relatively long maturities. NIB has not BOD REPORT assessment of the project (loan) is still a key part of the credit factored in climate risk into its risk category specific economic Risk Appetite Statement granting process, the new climate-related regulations and capital models (like the portfolio credit risk model). However, FINANCIALS In general, the Risk Appetite Statement (RAS) sets the principles market standards place more weight on the counterparty-level climate risk is included in NIB’s Internal Capital Adequacy SUSTAINABILITY INDICES for the Bank’s risk-taking, risk mitigation and risk avoidance. It analyses and risk identification, and portfolio-level analyses. Assessment Process (ICAAP) framework, and initial analyses have aims to align willingness to take risk with statutory requirements, Subsequently, during 2023, NIB continued the testing and been performed. Climate risk was also part of the Bank’s stress strategic business objectives and capital planning. Like the risk evaluation of climate scenario analysis approaches for measuring testing exercise in 2023. The stress test scenarios focus on taxonomy, the RAS also aims to raise risk awareness across the the transition risk especially in its Lending portfolios. climate transition risk and utilise both business sector and Bank. At NIB the RAS includes a specific qualitative section on Furthermore, during 2023, NIB’s development project to macroeconomic data. The annual capital and liquidity climate risk, highlighting the importance of this emerging risk enhance climate risk management capacity continued. The assessment (as summarised in the ICAAP Report), including category. The whole RAS document is reviewed annually and project has focused, in particular and as the second line climate risk elements, is delivered to the Board of Directors for delivered to the Board of Directors for approval. In 2023, the activities, on transition risk within credit risk, climate-related approval, facilitating the discussions on climate-related risks and statement on climate risk was confirmed. The RAS is available on data management activities, methodology development and NIB’s risk profile in general. the Bank’s external website. analysis of how the climate risk should be integrated as a For further details of NIB’s risk management framework risk-driver into traditional risk categories. Further, the regulatory please see Note 2. Climate risk implementation follow-up of climate-related regulations and standards, and Similarly to the risk management methodologies and procedures climate-related scenario analysis and stress testing was also used for the traditional risk categories, climate risk management enhanced. A proper climate-related risk analysis requires good at NIB builds on risk identification, assessment, monitoring quality and coverage of the data. Therefore, and during 2023, the
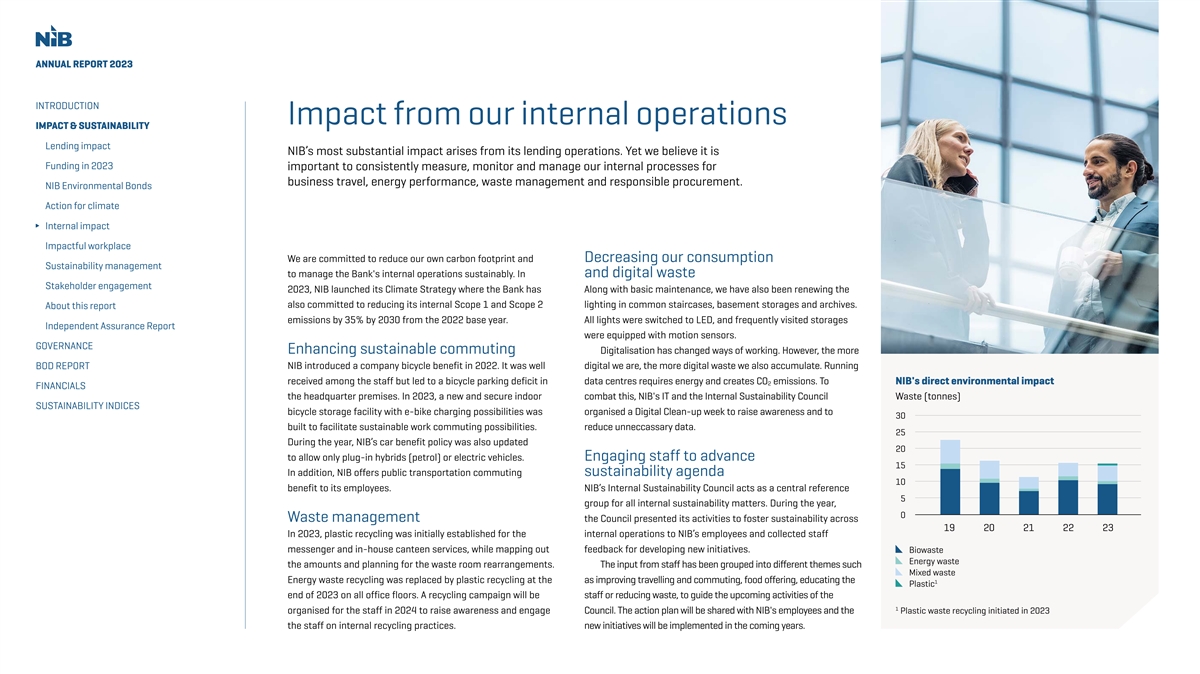
ANNUAL REPORT 2023 INTRODUCTION Impact from our internal operations IMPACT & SUSTAINABILITY Lending impact NIB’s most substantial impact arises from its lending operations. Yet we believe it is Funding in 2023 important to consistently measure, monitor and manage our internal processes for business travel, energy performance, waste management and responsible procurement. NIB Environmental Bonds Action for climate Internal impact Impactful workplace We are committed to reduce our own carbon footprint and Decreasing our consumption Sustainability management to manage the Bank's internal operations sustainably. In and digital waste Stakeholder engagement 2023, NIB launched its Climate Strategy where the Bank has Along with basic maintenance, we have also been renewing the also committed to reducing its internal Scope 1 and Scope 2 lighting in common staircases, basement storages and archives. About this report emissions by 35% by 2030 from the 2022 base year. All lights were switched to LED, and frequently visited storages Independent Assurance Report were equipped with motion sensors. GOVERNANCE Enhancing sustainable commuting Digitalisation has changed ways of working. However, the more BOD REPORT NIB introduced a company bicycle benefit in 2022. It was well digital we are, the more digital waste we also accumulate. Running received among the staff but led to a bicycle parking deficit in data centres requires energy and creates CO emissions. To NIB's direct environmental impact 2 FINANCIALS the headquarter premises. In 2023, a new and secure indoor combat this, NIB's IT and the Internal Sustainability Council Waste (tonnes) SUSTAINABILITY INDICES bicycle storage facility with e-bike charging possibilities was organised a Digital Clean-up week to raise awareness and to 30 built to facilitate sustainable work commuting possibilities. reduce unneccassary data. 25 During the year, NIB’s car benefit policy was also updated 20 to allow only plug-in hybrids (petrol) or electric vehicles. Engaging staff to advance 15 In addition, NIB offers public transportation commuting sustainability agenda 10 benefit to its employees. NIB’s Internal Sustainability Council acts as a central reference 5 group for all internal sustainability matters. During the year, 0 Waste management the Council presented its activities to foster sustainability across 19 20 21 22 23 In 2023, plastic recycling was initially established for the internal operations to NIB’s employees and collected staff messenger and in-house canteen services, while mapping out feedback for developing new initiatives. Bio waste E nergy waste the amounts and planning for the waste room rearrangements. The input from staff has been grouped into different themes such Mix ed waste Energy waste recycling was replaced by plastic recycling at the as improving travelling and commuting, food offering, educating the 1 Plastic end of 2023 on all office floors. A recycling campaign will be staff or reducing waste, to guide the upcoming activities of the 1 organised for the staff in 2024 to raise awareness and engage Council. The action plan will be shared with NIB's employees and the Plastic waste recycling initiated in 2023 the staff on internal recycling practices. new initiatives will be implemented in the coming years.

48 ANNUAL REPORT 2023 INTRODUCTION Responsible procurement Carbon emissions from 1 The services and goods NIB needs to support its operations internal operations IMPACT & SUSTAINABILITY Total CO e emissions 2 and activities are mainly consulting, IT services and devices, Lending impact data, and facility-related services. In addition, NIB uses Funding in 2023 external providers for services such as cleaning, security, 1,222 catering and construction at its premises. NIB Environmental Bonds tCO e from internal operations 2 NIB has established Rules for Internal Procurement, which Action for climate were last updated in 2022. NIB favours sustainable solutions in CO e intensity 2 Internal impact its procurement activities and evaluates the sustainability impact as part of the procurement process. Sustainability is a Impactful workplace 5,3 mandatory evaluation criterion in NIB’s competitive tendering. Sustainability management tonnes per permanent In addition, our active contracted suppliers are regularly subject employee Stakeholder engagement to sustainability screenings. The screenings include both the sustainability of goods and services to be procured, as well as About this report the suppliers’ own sustainability practices, commitments Independent Assurance Report and standards. In 2023, a review process of the Supplier GOVERNANCE Sustainability Questionnaire was initiated in cooperation BOD REPORT with NIB’s Internal Sustainability Council. Read more about how we work with suppliers on our FINANCIALS webpage and see the Legal framework documents. SUSTAINABILITY INDICES Our other administrative expenses are reported in Note 8. Carbon footprint calculation NIB has been calculating its carbon footprint for its internal 1% 1% 97% operations since 2019 according to the Greenhouse Gas 17 tCO e 15 tCO e 1,190 tCO e 2 2 2 Protocol Corporate Accounting and Reporting Standard (GHG Protocol). Having reviewed our emissions in detail Scope 1 (direct): Scope 2 (indirect): Scope 3 (other indirect) : for the last 5 years, including a few Covid-affected years, Emissions from Emissions from Emissions from services we have gained an understanding of which elements combustions of electricity, district (e.g. canteen and cleaning), contribute to our main impact. In 2023, our internal fuels in stationary heating and office paper, capital goods carbon footprint was 1,222 tonnes of CO e, an increase (i.e. generator) and district cooling (e.g. cars, laptops, displays, 2 of 26% from the previous year. This was mainly due mobile (company tablets), waste, business travel, to increased travel. In 2024, NIB will be exploring the cars) sources employee commuting and development of its emission calculation to a more leased mobile phones 1 standardised GHG Protocol calculation model. Due to rounding, the percentages are not matching up to 100%.
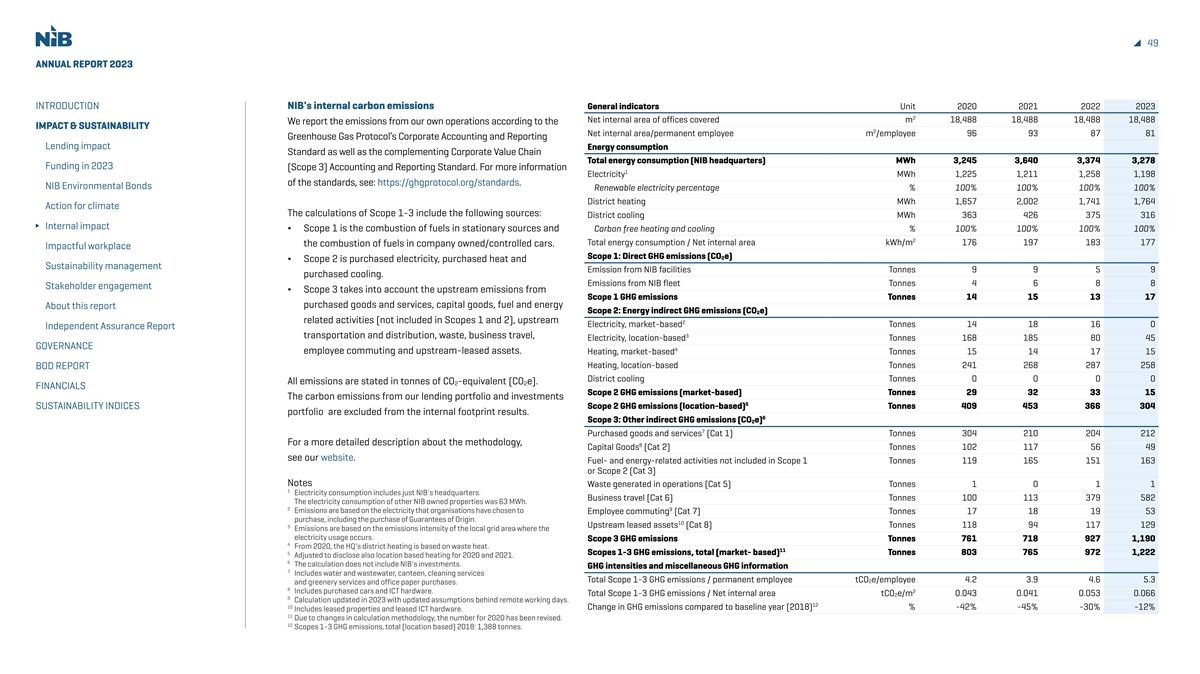
49 ANNUAL REPORT 2023 INTRODUCTION NIB's internal carbon emissions General indicators Unit 2020 2021 2022 2023 2 Net internal area of offices covered m 18,488 18,488 18,488 18,488 We report the emissions from our own operations according to the IMPACT & SUSTAINABILITY 2 Net internal area/permanent employee m /employee 96 93 87 81 Greenhouse Gas Protocol’s Corporate Accounting and Reporting Lending impact Energy consumption Standard as well as the complementing Corporate Value Chain Total energy consumption (NIB headquarters) MWh 3,245 3,640 3,374 3,278 Funding in 2023 (Scope 3) Accounting and Reporting Standard. For more information 1 Electricity MWh 1,225 1,211 1,258 1,198 of the standards, see: https://ghgprotocol.org/standards. NIB Environmental Bonds Renewable electricity percentage % 100% 100% 100% 100% District heating MWh 1,657 2,002 1,741 1,764 Action for climate The calculations of Scope 1-3 include the following sources: District cooling MWh 363 426 375 316 Internal impact ∆ Scope 1 is the combustion of fuels in stationary sources and Carbon free heating and cooling % 100% 100% 100% 100% 2 Total energy consumption / Net internal area kWh/m 176 197 183 177 the combustion of fuels in company owned/controlled cars. Impactful workplace Scope 1: Direct GHG emissions (CO2e) ∆ Scope 2 is purchased electricity, purchased heat and Sustainability management Emission from NIB facilities Tonnes 9 9 5 9 purchased cooling. Emissions from NIB fleet Tonnes 4 6 8 8 Stakeholder engagement ∆ Scope 3 takes into account the upstream emissions from Scope 1 GHG emissions Tonnes 14 15 13 17 purchased goods and services, capital goods, fuel and energy About this report Scope 2: Energy indirect GHG emissions (CO2e) related activities (not included in Scopes 1 and 2), upstream 2 Electricity, market-based Tonnes 14 18 16 0 Independent Assurance Report 3 transportation and distribution, waste, business travel, Electricity, location-based Tonnes 168 185 80 45 GOVERNANCE 4 employee commuting and upstream-leased assets. Heating, market-based Tonnes 15 14 17 15 Heating, location-based Tonnes 241 268 287 258 BOD REPORT District cooling Tonnes 0 0 0 0 All emissions are stated in tonnes of CO -equivalent (CO e). 2 2 FINANCIALS Scope 2 GHG emissions (market-based) Tonnes 29 32 33 15 The carbon emissions from our lending portfolio and investments 5 SUSTAINABILITY INDICES Scope 2 GHG emissions (location-based) Tonnes 409 453 366 304 portfolio are excluded from the internal footprint results. 6 Scope 3: Other indirect GHG emissions (CO e) 2 7 Purchased goods and services (Cat 1) Tonnes 304 210 204 212 For a more detailed description about the methodology, 8 Capital Goods (Cat 2) Tonnes 102 117 56 49 see our website. Fuel- and energy-related activities not included in Scope 1 Tonnes 119 165 151 163 or Scope 2 (Cat 3) Notes Waste generated in operations (Cat 5) Tonnes 1 0 1 1 1 Electricity consumption includes just NIB's headquarters. Business travel (Cat 6) Tonnes 100 113 379 582 The electricity consumption of other NIB owned properties was 63 MWh. 2 9 Emissions are based on the electricity that organisations have chosen to Employee commuting (Cat 7) Tonnes 17 18 19 53 purchase, including the purchase of Guarantees of Origin. 10 3 Upstream leased assets (Cat 8) Tonnes 118 94 117 129 Emissions are based on the emissions intensity of the local grid area where the electricity usage occurs. Scope 3 GHG emissions Tonnes 761 718 927 1,190 4 From 2020, the HQ's district heating is based on waste heat. 11 5 Scopes 1-3 GHG emissions, total (market- based) Tonnes 803 765 972 1,222 Adjusted to disclose also location based heating for 2020 and 2021. 6 The calculation does not include NIB's investments. GHG intensities and miscellaneous GHG information 7 Includes water and wastewater, canteen, cleaning services Total Scope 1-3 GHG emissions / permanent employee tCO e/employee 4.2 3.9 4.6 5.3 2 and greenery services and office paper purchases. 8 Includes purchased cars and ICT hardware. 2 Total Scope 1-3 GHG emissions / Net internal area tCO e/m 0.043 0.041 0.053 0.066 2 9 Calculation updated in 2023 with updated assumptions behind remote working days. 12 10 Change in GHG emissions compared to baseline year (2018) % -42% -45% -30% -12% Includes leased properties and leased ICT hardware. 11 Due to changes in calculation methodology, the number for 2020 has been revised. 12 Scopes 1-3 GHG emissions, total (location based) 2018: 1,388 tonnes.
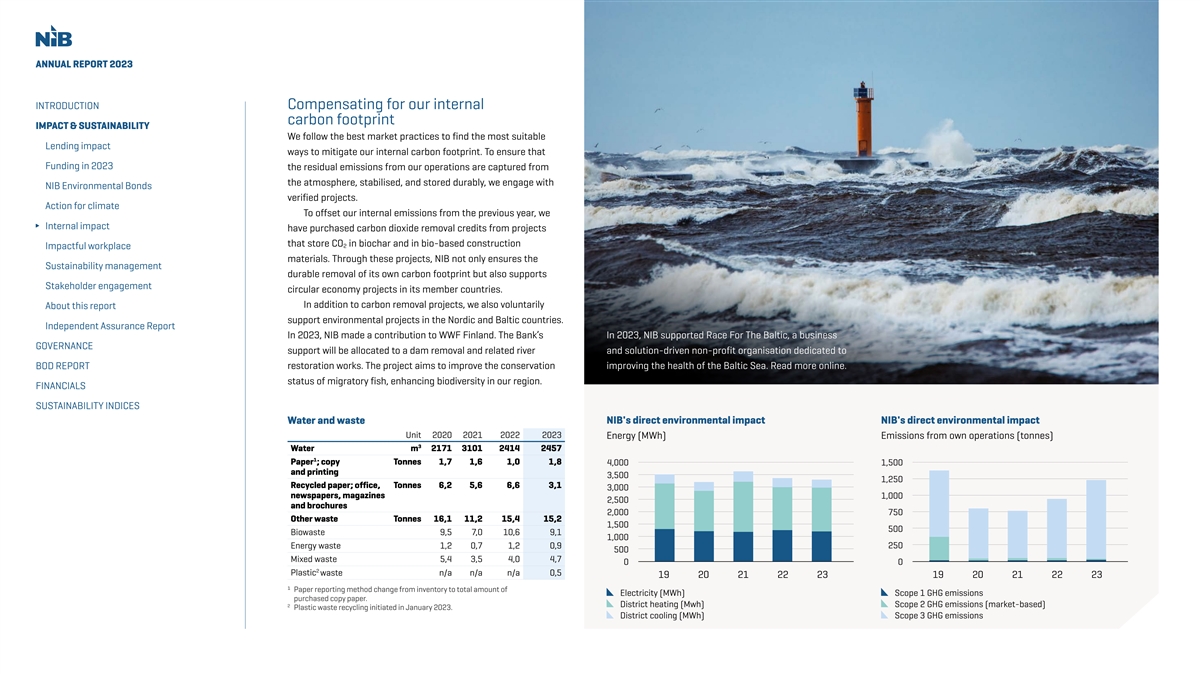
ANNUAL REPORT 2023 INTRODUCTION Compensating for our internal carbon footprint IMPACT & SUSTAINABILITY We follow the best market practices to find the most suitable Lending impact ways to mitigate our internal carbon footprint. To ensure that Funding in 2023 the residual emissions from our operations are captured from the atmosphere, stabilised, and stored durably, we engage with NIB Environmental Bonds verified projects. Action for climate To offset our internal emissions from the previous year, we Internal impact have purchased carbon dioxide removal credits from projects that store CO in biochar and in bio-based construction 2 Impactful workplace materials. Through these projects, NIB not only ensures the Sustainability management durable removal of its own carbon footprint but also supports Stakeholder engagement circular economy projects in its member countries. In addition to carbon removal projects, we also voluntarily About this report support environmental projects in the Nordic and Baltic countries. Independent Assurance Report In 2023, NIB made a contribution to WWF Finland. The Bank’s In 2023, NIB supported Race For The Baltic, a business GOVERNANCE support will be allocated to a dam removal and related river and solution-driven non-profit organisation dedicated to BOD REPORT restoration works. The project aims to improve the conservation improving the health of the Baltic Sea. Read more online. status of migratory fish, enhancing biodiversity in our region. FINANCIALS SUSTAINABILITY INDICES Water and waste NIB's direct environmental impact NIB's direct environmental impact Unit 2020 2021 2022 2023 Energy (MWh) Emissions from own operations (tonnes) 3 Water m 2171 3101 2414 2457 1 Paper ; copy Tonnes 1,7 1,6 1,0 1,8 4,000 1,500 and printing 3,500 1,250 Recycled paper; office, Tonnes 6,2 5,6 6,6 3,1 3,000 newspapers, magazines 1,000 2,500 and brochures 2,000 750 Other waste Tonnes 16,1 11,2 15,4 15,2 1,500 500 Biowaste 9,5 7,0 10,6 9,1 1,000 Energy waste 1,2 0,7 1,2 0,9 250 500 Mixed waste 5,4 3,5 4,0 4,7 0 0 2 Plastic waste n/a n/a n/a 0,5 19 20 21 22 23 19 20 21 22 23 ¹ Paper reporting method change from inventory to total amount of Electricity (MWh) Scope 1 GHG emissions purchased copy paper. 2 District heating (Mwh) Scope 2 GHG emissions (mark et-based) Plastic waste recycling initiated in January 2023. District cooling (MWh) Scope 3 GHG emissions

51 ANNUAL REPORT 2023 INTRODUCTION Impactful IMPACT & SUSTAINABILITY Lending impact workplace Funding in 2023 NIB Environmental Bonds Our goal is to have a culture that Action for climate nurtures business success, leaders Internal impact that make their team members shine, and employees, who have Impactful workplace a growth mindset that helps NIB Sustainability management continuously develop the way we Stakeholder engagement work and create impact. About this report Independent Assurance Report GOVERNANCE BOD REPORT FINANCIALS SUSTAINABILITY INDICES At NIB our top priorities in HR going forward are connected to culture, leadership, and development as they all have a strong impact on our business. Hanna Pajunen, Senior Director, Head of HR
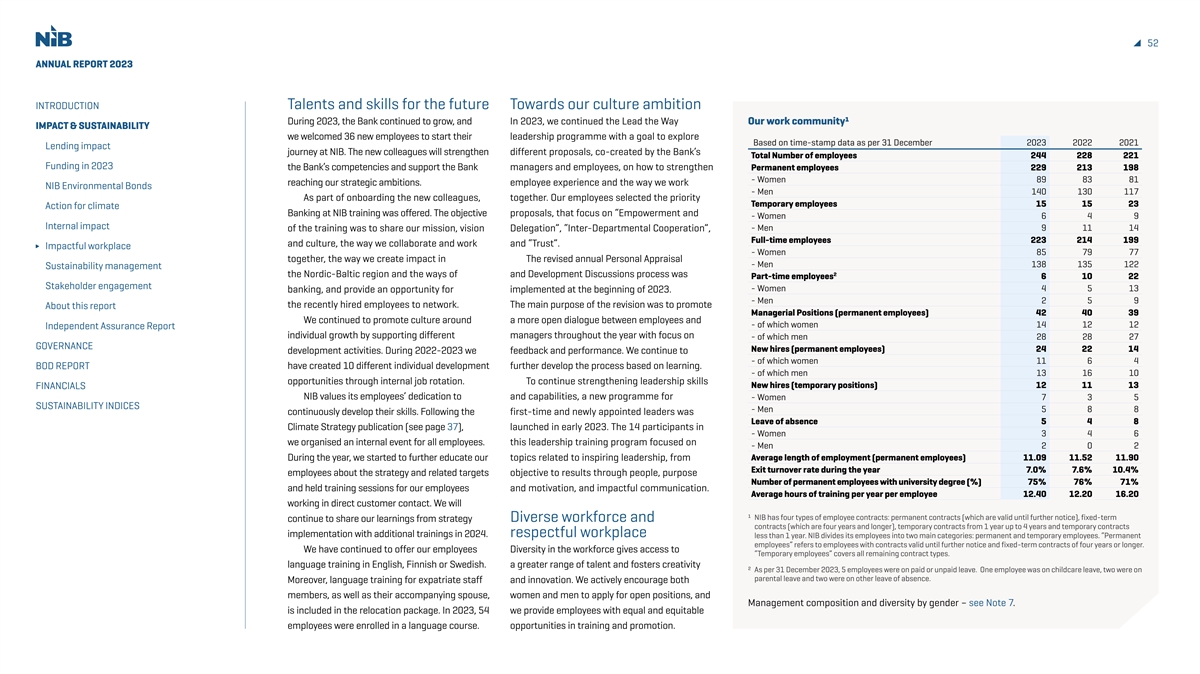
52 ANNUAL REPORT 2023 INTRODUCTION Talents and skills for the future Towards our culture ambition During 2023, the Bank continued to grow, and In 2023, we continued the Lead the Way Our work community¹ IMPACT & SUSTAINABILITY we welcomed 36 new employees to start their leadership programme with a goal to explore Based on time-stamp data as per 31 December 2023 2022 2021 Lending impact journey at NIB. The new colleagues will strengthen different proposals, co-created by the Bank’s Total Number of employees 244 228 221 Funding in 2023 the Bank’s competencies and support the Bank managers and employees, on how to strengthen Permanent employees 229 213 198 - Women 89 83 81 reaching our strategic ambitions. employee experience and the way we work NIB Environmental Bonds - Men 140 130 117 As part of onboarding the new colleagues, together. Our employees selected the priority Temporary employees 15 15 23 Action for climate Banking at NIB training was offered. The objective proposals, that focus on “Empowerment and - Women 6 4 9 Internal impact of the training was to share our mission, vision Delegation”, “Inter-Departmental Cooperation”, - Men 9 11 14 Full-time employees 223 214 199 and culture, the way we collaborate and work and “Trust”. Impactful workplace - Women 85 79 77 together, the way we create impact in The revised annual Personal Appraisal - Men 138 135 122 Sustainability management 2 the Nordic-Baltic region and the ways of and Development Discussions process was 6 10 22 Part-time employees Stakeholder engagement - Women 4 5 13 banking, and provide an opportunity for implemented at the beginning of 2023. - Men 2 5 9 the recently hired employees to network. The main purpose of the revision was to promote About this report Managerial Positions (permanent employees) 42 40 39 We continued to promote culture around a more open dialogue between employees and - of which women 14 12 12 Independent Assurance Report individual growth by supporting different managers throughout the year with focus on - of which men 28 28 27 GOVERNANCE New hires (permanent employees) 24 22 14 development activities. During 2022-2023 we feedback and performance. We continue to - of which women 11 6 4 BOD REPORT have created 10 different individual development further develop the process based on learning. - of which men 13 16 10 opportunities through internal job rotation. To continue strengthening leadership skills New hires (temporary positions) 12 11 13 FINANCIALS NIB values its employees’ dedication to and capabilities, a new programme for - Women 7 3 5 SUSTAINABILITY INDICES - Men 5 8 8 continuously develop their skills. Following the first-time and newly appointed leaders was Leave of absence 5 4 8 Climate Strategy publication (see page 37), launched in early 2023. The 14 participants in - Women 3 4 6 we organised an internal event for all employees. this leadership training program focused on - Men 2 0 2 During the year, we started to further educate our topics related to inspiring leadership, from Average length of employment (permanent employees) 11.09 11.52 11.90 Exit turnover rate during the year 7.0% 7.6% 10.4% employees about the strategy and related targets objective to results through people, purpose Number of permanent employees with university degree (%) 75% 76% 71% and held training sessions for our employees and motivation, and impactful communication. Average hours of training per year per employee 12.40 12.20 16.20 working in direct customer contact. We will ¹ NIB has four types of employee contracts: permanent contracts (which are valid until further notice), fixed-term continue to share our learnings from strategy Diverse workforce and contracts (which are four years and longer), temporary contracts from 1 year up to 4 years and temporary contracts implementation with additional trainings in 2024. respectful workplace less than 1 year. NIB divides its employees into two main categories: permanent and temporary employees. “Permanent employees” refers to employees with contracts valid until further notice and fixed-term contracts of four years or longer. We have continued to offer our employees Diversity in the workforce gives access to “Temporary employees” covers all remaining contract types. language training in English, Finnish or Swedish. a greater range of talent and fosters creativity ² As per 31 December 2023, 5 employees were on paid or unpaid leave. One employee was on childcare leave, two were on parental leave and two were on other leave of absence. Moreover, language training for expatriate staff and innovation. We actively encourage both members, as well as their accompanying spouse, women and men to apply for open positions, and Management composition and diversity by gender – see Note 7. is included in the relocation package. In 2023, 54 we provide employees with equal and equitable employees were enrolled in a language course. opportunities in training and promotion.
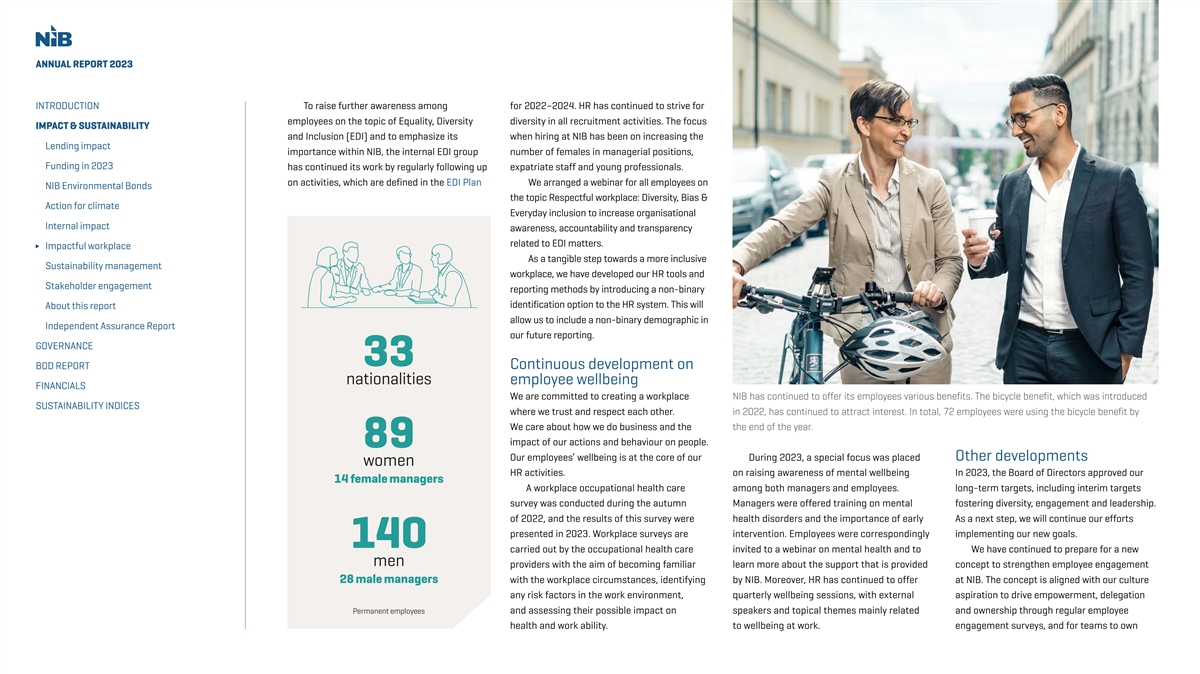
ANNUAL REPORT 2023 INTRODUCTION To raise further awareness among for 2022–2024. HR has continued to strive for employees on the topic of Equality, Diversity diversity in all recruitment activities. The focus IMPACT & SUSTAINABILITY and Inclusion (EDI) and to emphasize its when hiring at NIB has been on increasing the Lending impact importance within NIB, the internal EDI group number of females in managerial positions, Funding in 2023 has continued its work by regularly following up expatriate staff and young professionals. on activities, which are defined in the EDI Plan We arranged a webinar for all employees on NIB Environmental Bonds the topic Respectful workplace: Diversity, Bias & Action for climate Everyday inclusion to increase organisational Internal impact awareness, accountability and transparency related to EDI matters. Impactful workplace As a tangible step towards a more inclusive Sustainability management workplace, we have developed our HR tools and Stakeholder engagement reporting methods by introducing a non-binary identification option to the HR system. This will About this report allow us to include a non-binary demographic in Independent Assurance Report our future reporting. GOVERNANCE 33 BOD REPORT Continuous development on nationalities employee wellbeing FINANCIALS We are committed to creating a workplace NIB has continued to offer its employees various benefits. The bicycle benefit, which was introduced SUSTAINABILITY INDICES where we trust and respect each other. in 2022, has continued to attract interest. In total, 72 employees were using the bicycle benefit by We care about how we do business and the the end of the year. impact of our actions and behaviour on people. 89 Our employees’ wellbeing is at the core of our During 2023, a special focus was placed Other developments women HR activities. on raising awareness of mental wellbeing In 2023, the Board of Directors approved our 14 female managers A workplace occupational health care among both managers and employees. long-term targets, including interim targets survey was conducted during the autumn Managers were offered training on mental fostering diversity, engagement and leadership. of 2022, and the results of this survey were health disorders and the importance of early As a next step, we will continue our efforts presented in 2023. Workplace surveys are intervention. Employees were correspondingly implementing our new goals. 140 carried out by the occupational health care invited to a webinar on mental health and to We have continued to prepare for a new men providers with the aim of becoming familiar learn more about the support that is provided concept to strengthen employee engagement 28 male managers with the workplace circumstances, identifying by NIB. Moreover, HR has continued to offer at NIB. The concept is aligned with our culture any risk factors in the work environment, quarterly wellbeing sessions, with external aspiration to drive empowerment, delegation Permanent employees and assessing their possible impact on speakers and topical themes mainly related and ownership through regular employee health and work ability. to wellbeing at work. engagement surveys, and for teams to own
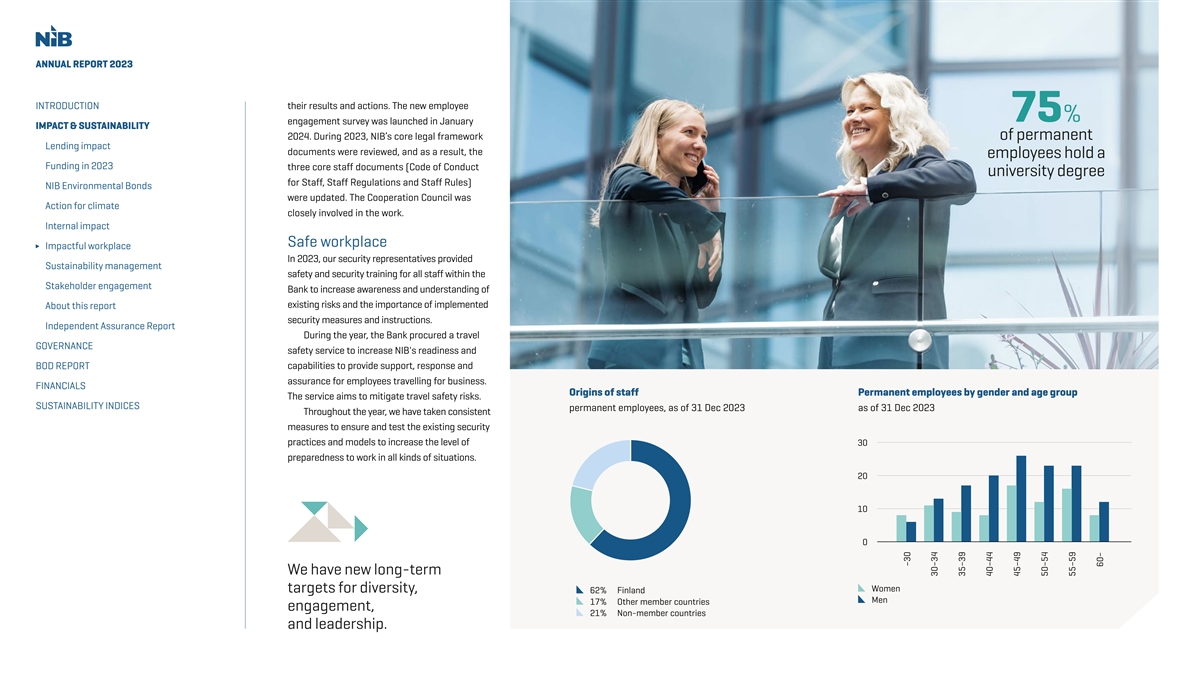
ANNUAL REPORT 2023 INTRODUCTION their results and actions. The new employee 75% engagement survey was launched in January IMPACT & SUSTAINABILITY 2024. During 2023, NIB’s core legal framework of permanent Lending impact documents were reviewed, and as a result, the employees hold a Funding in 2023 three core staff documents (Code of Conduct university degree for Staff, Staff Regulations and Staff Rules) NIB Environmental Bonds were updated. The Cooperation Council was Action for climate closely involved in the work. Internal impact Safe workplace Impactful workplace In 2023, our security representatives provided Sustainability management safety and security training for all staff within the Stakeholder engagement Bank to increase awareness and understanding of existing risks and the importance of implemented About this report security measures and instructions. Independent Assurance Report During the year, the Bank procured a travel GOVERNANCE safety service to increase NIB's readiness and BOD REPORT capabilities to provide support, response and assurance for employees travelling for business. FINANCIALS Origins of staff Permanent employees by gender and age group The service aims to mitigate travel safety risks. SUSTAINABILITY INDICES permanent employees, as of 31 Dec 2023 as of 31 Dec 2023 Throughout the year, we have taken consistent measures to ensure and test the existing security practices and models to increase the level of 30 preparedness to work in all kinds of situations. 20 10 0 We have new long-term Women targets for diversity, 62% Finland Men 17% Other member countries engagement, 21% Non-member countries and leadership. –30 30–34 35–39 40–44 45–49 50–54 55–59 60–
55 ANNUAL REPORT 2023 INTRODUCTION Sustainability management Our principles and commitments IMPACT & SUSTAINABILITY Sustainability is at the core of NIB’s mission and mandate. Lending impact Human activity affects climate and ecosystems more than ever, and we are required to rethink how We are committed to: Funding in 2023 we use environmental, human and financial resources to promote green and just transitions and ∆ Supporting sustainable, ∆ Further developing and opportunities for sustainable economic growth. As a bank, we have a responsibility for what we NIB Environmental Bonds prosperous and well- supplying financial and finance, and how we manage our operations. functioning societies investment products Action for climate by providing long-term that support sustainable Internal impact financing for investments finance and encourage with positive socioeconomic and enable sustainable Impactful workplace and environmental impacts. economic activities. Sustainability management We assess all projects considered for financing ∆ Sharing knowledge and Stakeholder engagement NIB’s Sustainability Policy Agreement, we exclude financing for upstream activities, for their potential impact experience to promote NIB’s Sustainability Policy sets out the principles, commitments transport, the storage or processing of fossil fuels and fossil- on productivity and the sustainable finance About this report environment. collaboratively and framework for sustainability at NIB and is approved by the fuel based energy generation. Nor do we finance companies Independent Assurance Report and inclusively. Board of Directors. Its purpose is to define how sustainability involved in the extraction, processing or transport of coal, peat, ∆ Addressing the climate GOVERNANCE is taken into account in all NIB’s business conduct, credit and or unconventional or Arctic oil and gas. The full exclusion list is challenge in accordance with ∆ Promoting transparency BOD REPORT investment decisions. The policy applies bank-wide and to all available here. the Paris Climate Agreement and integrity and disclosing by limiting global warming to our sustainability NIB’s operations. FINANCIALS 1.5 °C. Read more about NIB performance and impact. The Sustainability Policy should be read with NIB’s Mission, Sustainability governance and climate action here. SUSTAINABILITY INDICES Strategy and Values, as well as other relevant Bank policies and The governance of climate-related risks and opportunities ∆ Actively working to frameworks, such as the Integrity and Compliance Policy, and Environmental, Social, and Governance (ESG) risks in ∆ Supporting the special increase the sustainability Integrity Due Diligence Policy, Codes of Conduct, Mandate Rating general are integrated into NIB’s core governance structure. protected status of the Baltic of NIB’s internal Sea and its importance for operations. Framework, Climate Strategy, and Responsible Investment The Governance Statement is available on pages 69–77, and it sustainable growth in the Framework. As the policy also supports the management of includes information about the management and supporting region. NIB also focuses ∆ Recognising the ESG-related risks and the assessment of their materiality, it committees. A more detailed description of NIB’s sustainability on the protection of the importance of equal should also be read in conjunction with NIB’s risk management governance can be found in NIB’s Sustainability Policy. Arctic region’s unique and opportunities, diversity vulnerable nature. and gender equality, framework (policies and procedures). NIB’s policies and human rights, labour rights frameworks are available on our website. The Bank’s Integrity How we work ∆ Incorporating ESG factors in and freedom, business Policy Framework is explained in the Integrity Report. NIB’s investment and credit ethics, and combating Mandate and sustainability decisions. fraud and corruption. Our exclusion list assessment of projects The Sustainability Policy also lists counterparty-level activities The Bank works for its vision by providing long-term lending to and projects that NIB will not knowingly finance or invest in projects that improve productivity and benefit the environment (“exclusion list”). To support the goals of the Paris Climate of the Nordic and Baltic countries. For this purpose, the

56 ANNUAL REPORT 2023 INTRODUCTION Bank assesses whether the project or activity considered for counterparties’ climate strategies, targets, performance and expectations of sound ESG performance. The framework financing fulfils the requirements set out in our Mandate Rating governance. The ESG assessment gives more information about has been updated during 2023 to further strengthen IMPACT & SUSTAINABILITY Framework. In 2023, NIB further developed the way it applies the how a project financed by NIB supports the client’s overall journey counterparty assessment in cases where there are material Lending impact mandate rating framework in its decision making with the aim of towards more sustainable operations. The review also helps differences in external ESG ratings or cases where limited Funding in 2023 gradually aligning it with the EU taxonomy. identify potentially significant ESG risks. ESG-information is available. All investments proposed for financing also undergo a NIB has a Responsible Investment Framework and NIB is also a signatory of the United Nations Principles NIB Environmental Bonds sustainability review in accordance with NIB’s Sustainability accompanying guidelines and processes to ensure that the for Responsible Banking (PRB) and reports accordingly. Action for climate Policy and ESG Guidelines for Lending. The review ensures that companies NIB invests in, and transacts with, meets its The PRB index is available on page 181. Internal impact the project complies with internationally and nationally recognised environmental and social standards, and that it is Impactful workplace resilient. Assessing the impact of an investment on climate has Sustainability management long been an integral part of NIB’s sustainability due diligence, Sustainability and climate risk management at NIB Stakeholder engagement and we quantify the expected change in GHG emissions resulting from a project. About this report OVERARCHING NIB SUSTAINABILITY POLICY Independent Assurance Report ( ) INCLUDING EXCLUSION LIST Project monitoring and follow-up GOVERNANCE Following project completion, NIB evaluates the realisation of the CLIMATE STRATEGY BOD REPORT estimated productivity gains and/or environmental benefits as agreed during the loan negotiation. When a project has reached LENDING TREASURY FINANCIALS operating maturity (normally, within three years of completion), SUSTAINABILITY INDICES it receives an ex-post evaluation to assess if adherence to NIB’s Supporting tools Supporting tools COUNTERPARTY ESG COUNTERPARTY ESG • ESG Guidelines • Responsible Investment Sustainability Policy and mandate criteria have been fulfilled. ASSESSMENT ASSESSMENT Framework • ESG Questionnaire The principles for this process are set out in NIB’s Monitoring • ESG Guidelines • External ESG Ratings and Ex-Post Mandate Assessment Framework. NIB uses these • External ESG ratings • Dialogue with counterparties • Dialogue with results to further develop its mandate rating methodology and • ESG controversies monitoring counterparties • EU taxonomy apply the lessons learned to the assessment of future projects. In PROJECT ESG INVESTMENT ESG • ESG controversies ASSESSMENT • Extended supply chain ASSESSMENT monitoring 2023, ex-post assessments for 18 projects have been conducted. due diligence Approximately 85% of the impacts identified in the ex-ante stage have been achieved. NIB's Internal Sustainability Council Counterparty ESG assessment In addition to projects, NIB engages with its clients and assesses the environmental, social and governance (ESG) profiles of its lending counterparties at the borrower or risk owner level. In the ESG assessment, NIB especially emphasises reviewing our
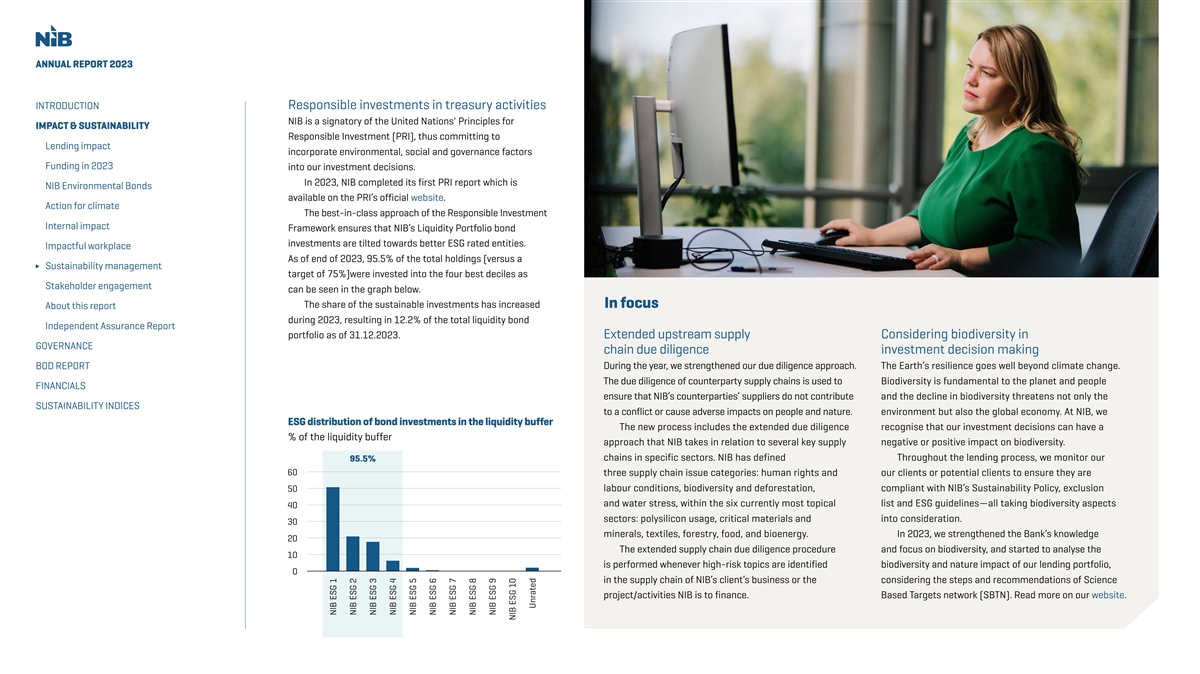
ANNUAL REPORT 2023 INTRODUCTION Responsible investments in treasury activities NIB is a signatory of the United Nations' Principles for IMPACT & SUSTAINABILITY Responsible Investment (PRI), thus committing to Lending impact incorporate environmental, social and governance factors Funding in 2023 into our investment decisions. In 2023, NIB completed its first PRI report which is NIB Environmental Bonds available on the PRI’s official website. Action for climate The best-in-class approach of the Responsible Investment Internal impact Framework ensures that NIB’s Liquidity Portfolio bond investments are tilted towards better ESG rated entities. Impactful workplace As of end of 2023, 95.5% of the total holdings (versus a Sustainability management target of 75%)were invested into the four best deciles as Stakeholder engagement can be seen in the graph below. The share of the sustainable investments has increased In focus About this report during 2023, resulting in 12.2% of the total liquidity bond Independent Assurance Report portfolio as of 31.12.2023. Extended upstream supply Considering biodiversity in GOVERNANCE chain due diligence investment decision making BOD REPORT During the year, we strengthened our due diligence approach. The Earth’s resilience goes well beyond climate change. The due diligence of counterparty supply chains is used to Biodiversity is fundamental to the planet and people FINANCIALS ensure that NIB’s counterparties’ suppliers do not contribute and the decline in biodiversity threatens not only the SUSTAINABILITY INDICES to a conflict or cause adverse impacts on people and nature. environment but also the global economy. At NIB, we ESG distribution of bond investments in the liquidity buffer The new process includes the extended due diligence recognise that our investment decisions can have a % of the liquidity buffer approach that NIB takes in relation to several key supply negative or positive impact on biodiversity. chains in specific sectors. NIB has defined Throughout the lending process, we monitor our 95.5% 60 three supply chain issue categories: human rights and our clients or potential clients to ensure they are 50 labour conditions, biodiversity and deforestation, compliant with NIB’s Sustainability Policy, exclusion and water stress, within the six currently most topical list and ESG guidelines—all taking biodiversity aspects 40 sectors: polysilicon usage, critical materials and into consideration. 30 minerals, textiles, forestry, food, and bioenergy. In 2023, we strengthened the Bank’s knowledge 20 The extended supply chain due diligence procedure and focus on biodiversity, and started to analyse the 10 is performed whenever high-risk topics are identified biodiversity and nature impact of our lending portfolio, 0 in the supply chain of NIB’s client’s business or the considering the steps and recommendations of Science project/activities NIB is to finance. Based Targets network (SBTN). Read more on our website. NIB ESG 1 NIB ESG 2 NIB ESG 3 NIB ESG 4 NIB ESG 5 NIB ESG 6 NIB ESG 7 NIB ESG 8 NIB ESG 9 NIB ESG 10 Unrated
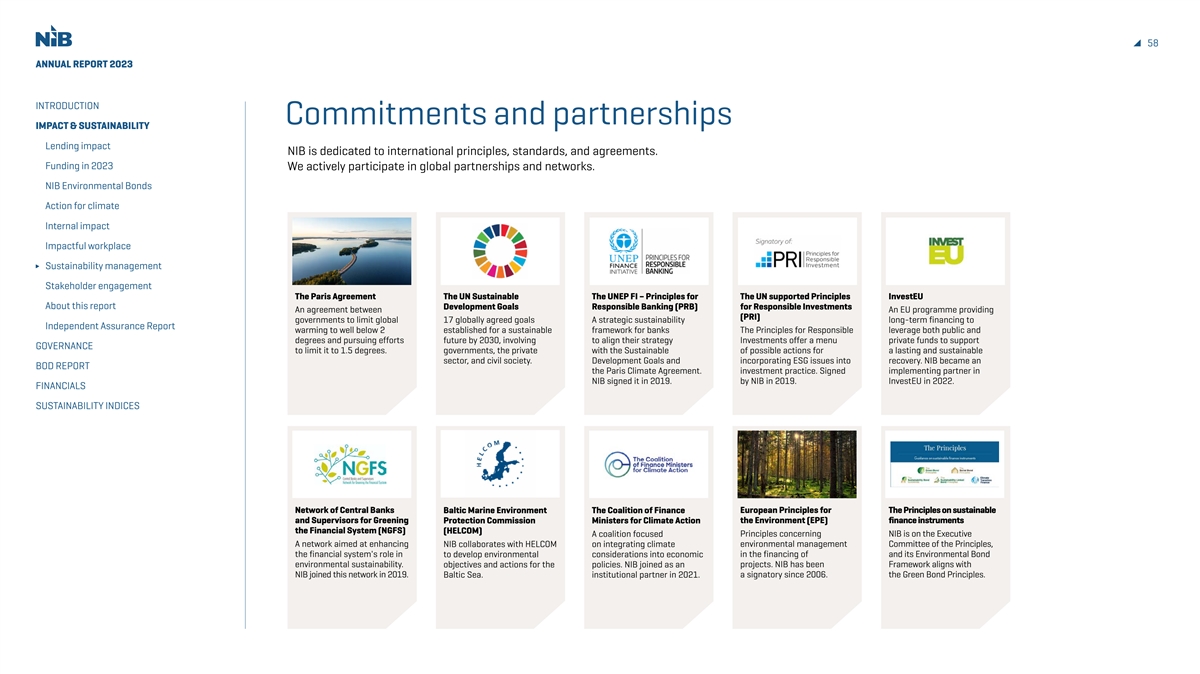
58 ANNUAL REPORT 2023 INTRODUCTION Commitments and partnerships IMPACT & SUSTAINABILITY Lending impact NIB is dedicated to international principles, standards, and agreements. Funding in 2023 We actively participate in global partnerships and networks. NIB Environmental Bonds Action for climate Internal impact Impactful workplace Sustainability management Stakeholder engagement The Paris Agreement The UN Sustainable The UNEP FI – Principles for The UN supported Principles InvestEU About this report Development Goals Responsible Banking (PRB) for Responsible Investments An agreement between An EU programme providing (PRI) governments to limit global 17 globally agreed goals A strategic sustainability long-term financing to Independent Assurance Report warming to well below 2 established for a sustainable framework for banks The Principles for Responsible leverage both public and degrees and pursuing efforts future by 2030, involving to align their strategy Investments offer a menu private funds to support GOVERNANCE to limit it to 1.5 degrees. governments, the private with the Sustainable of possible actions for a lasting and sustainable sector, and civil society. Development Goals and incorporating ESG issues into recovery. NIB became an BOD REPORT the Paris Climate Agreement. investment practice. Signed implementing partner in NIB signed it in 2019. by NIB in 2019. InvestEU in 2022. FINANCIALS SUSTAINABILITY INDICES Network of Central Banks Baltic Marine Environment The Coalition of Finance European Principles for The Principles on sustainable and Supervisors for Greening Protection Commission Ministers for Climate Action the Environment (EPE) finance instruments the Financial System (NGFS) (HELCOM) A coalition focused Principles concerning NIB is on the Executive A network aimed at enhancing NIB collaborates with HELCOM on integrating climate environmental management Committee of the Principles, the financial system's role in to develop environmental considerations into economic in the financing of and its Environmental Bond environmental sustainability. objectives and actions for the policies. NIB joined as an projects. NIB has been Framework aligns with NIB joined this network in 2019. Baltic Sea. institutional partner in 2021. a signatory since 2006. the Green Bond Principles.
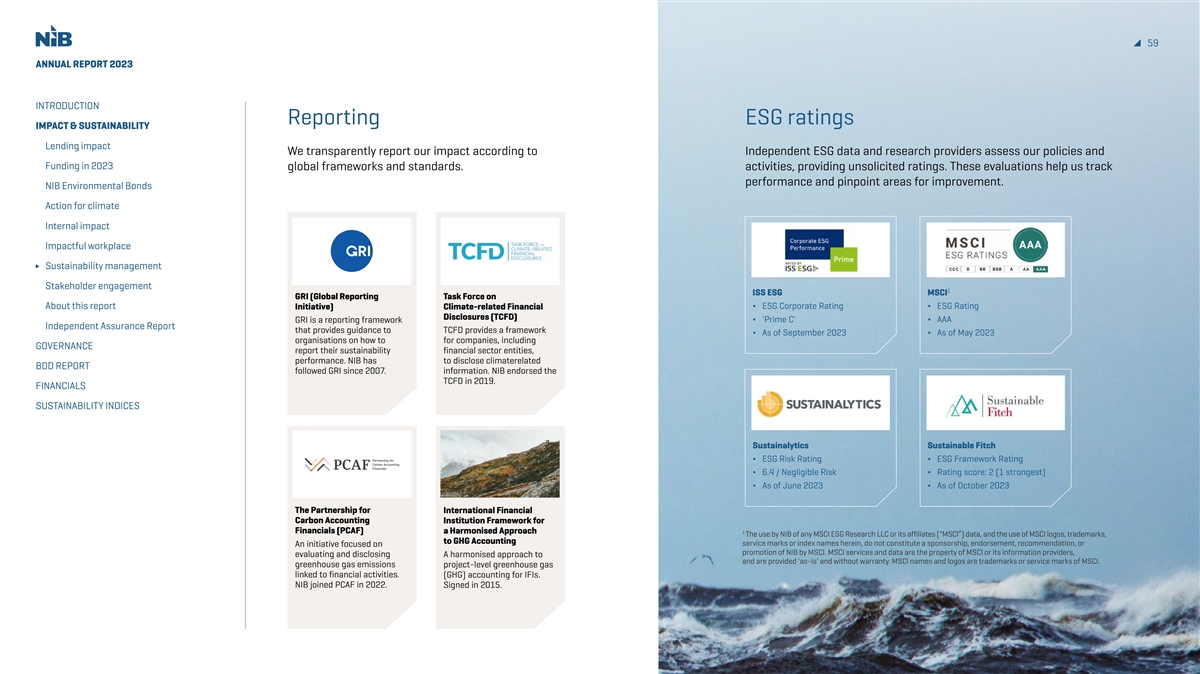
59 ANNUAL REPORT 2023 INTRODUCTION Reporting ESG ratings IMPACT & SUSTAINABILITY Lending impact We transparently report our impact according to Independent ESG data and research providers assess our policies and Funding in 2023 global frameworks and standards. activities, providing unsolicited ratings. These evaluations help us track performance and pinpoint areas for improvement. NIB Environmental Bonds Action for climate Internal impact Impactful workplace Sustainability management Stakeholder engagement 1 ISS ESG MSCI GRI (Global Reporting Task Force on About this report Initiative) Climate-related Financial ∆ ESG Corporate Rating ∆ ESG Rating Disclosures (TCFD) ∆ 'Prime C' ∆ AAA GRI is a reporting framework Independent Assurance Report that provides guidance to TCFD provides a framework ∆ As of September 2023 ∆ As of May 2023 organisations on how to for companies, including GOVERNANCE report their sustainability financial sector entities, performance. NIB has to disclose climaterelated BOD REPORT followed GRI since 2007. information. NIB endorsed the TCFD in 2019. FINANCIALS SUSTAINABILITY INDICES Sustainalytics Sustainable Fitch ∆ ESG Risk Rating ∆ ESG Framework Rating ∆ 6.4 / Negligible Risk ∆ Rating score: 2 (1 strongest) ∆ As of June 2023 ∆ As of October 2023 The Partnership for International Financial Carbon Accounting Institution Framework for Financials (PCAF) a Harmonised Approach 1 The use by NIB of any MSCI ESG Research LLC or its affiliates ( MSCI”) data, and the use of MSCI logos, trademarks, to GHG Accounting service marks or index names herein, do not constitute a sponsorship, endorsement, recommendation, or An initiative focused on promotion of NIB by MSCI. MSCI services and data are the property of MSCI or its information providers, evaluating and disclosing A harmonised approach to and are provided 'as-is' and without warranty. MSCI names and logos are trademarks or service marks of MSCI. greenhouse gas emissions project-level greenhouse gas linked to financial activities. (GHG) accounting for IFIs. NIB joined PCAF in 2022. Signed in 2015.
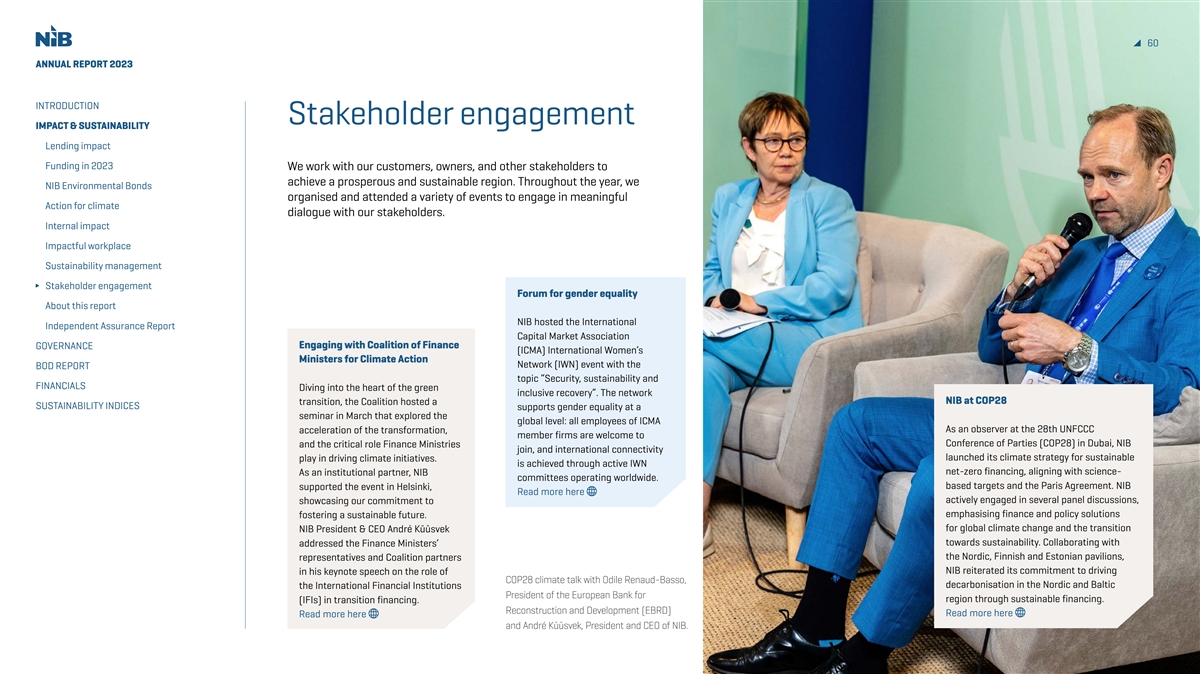
60 ANNUAL REPORT 2023 INTRODUCTION Stakeholder engagement IMPACT & SUSTAINABILITY Lending impact Funding in 2023 We work with our customers, owners, and other stakeholders to achieve a prosperous and sustainable region. Throughout the year, we NIB Environmental Bonds organised and attended a variety of events to engage in meaningful Action for climate dialogue with our stakeholders. Internal impact Impactful workplace Sustainability management Stakeholder engagement Forum for gender equality About this report NIB hosted the International Independent Assurance Report Capital Market Association GOVERNANCE Engaging with Coalition of Finance (ICMA) International Women’s Ministers for Climate Action Network (IWN) event with the BOD REPORT topic “Security, sustainability and FINANCIALS Diving into the heart of the green inclusive recovery”. The network NIB at COP28 transition, the Coalition hosted a SUSTAINABILITY INDICES supports gender equality at a seminar in March that explored the global level: all employees of ICMA As an observer at the 28th UNFCCC acceleration of the transformation, member firms are welcome to Conference of Parties (COP28) in Dubai, NIB and the critical role Finance Ministries join, and international connectivity launched its climate strategy for sustainable play in driving climate initiatives. is achieved through active IWN net-zero financing, aligning with science- As an institutional partner, NIB committees operating worldwide. based targets and the Paris Agreement. NIB supported the event in Helsinki, Read more here actively engaged in several panel discussions, showcasing our commitment to emphasising finance and policy solutions fostering a sustainable future. for global climate change and the transition NIB President & CEO André Küüsvek towards sustainability. Collaborating with addressed the Finance Ministers’ the Nordic, Finnish and Estonian pavilions, representatives and Coalition partners NIB reiterated its commitment to driving in his keynote speech on the role of COP28 climate talk with Odile Renaud-Basso, decarbonisation in the Nordic and Baltic the International Financial Institutions President of the European Bank for region through sustainable financing. (IFIs) in transition financing. Reconstruction and Development (EBRD) Read more here Read more here and André Küüsvek, President and CEO of NIB.
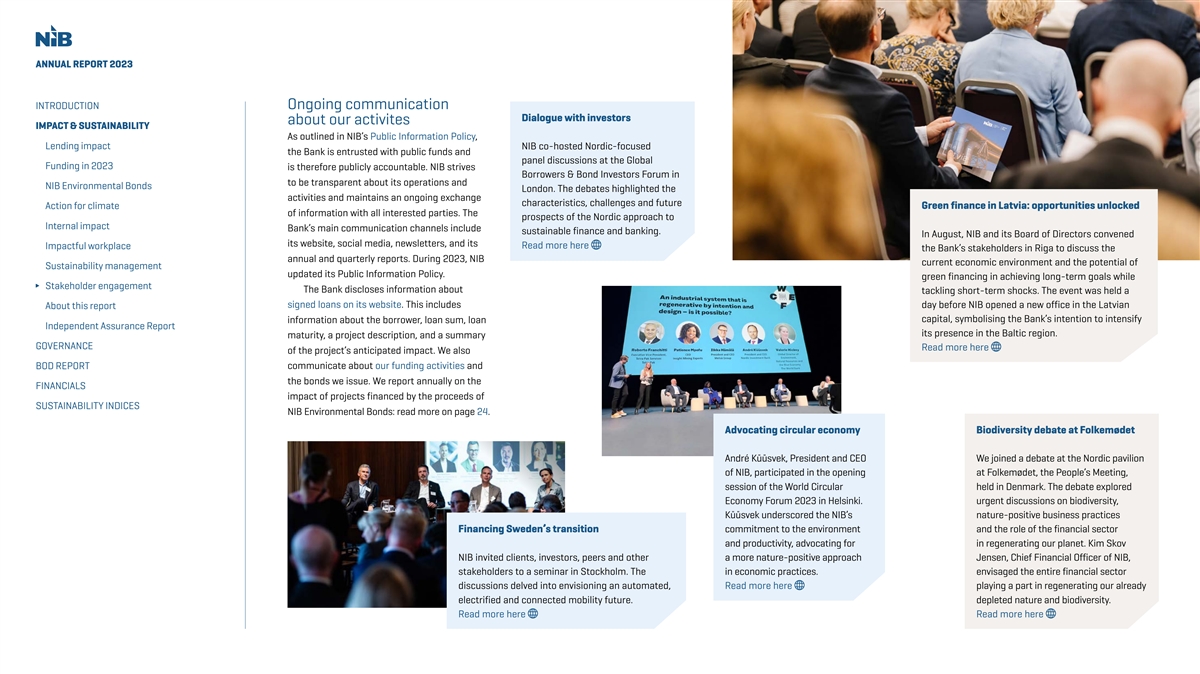
ANNUAL REPORT 2023 INTRODUCTION Ongoing communication Dialogue with investors about our activites IMPACT & SUSTAINABILITY As outlined in NIB’s Public Information Policy, Lending impact NIB co-hosted Nordic-focused the Bank is entrusted with public funds and panel discussions at the Global Funding in 2023 is therefore publicly accountable. NIB strives Borrowers & Bond Investors Forum in to be transparent about its operations and NIB Environmental Bonds London. The debates highlighted the activities and maintains an ongoing exchange characteristics, challenges and future Green finance in Latvia: opportunities unlocked Action for climate of information with all interested parties. The prospects of the Nordic approach to Internal impact Bank’s main communication channels include sustainable finance and banking. In August, NIB and its Board of Directors convened its website, social media, newsletters, and its Read more here Impactful workplace the Bank’s stakeholders in Riga to discuss the annual and quarterly reports. During 2023, NIB current economic environment and the potential of Sustainability management updated its Public Information Policy. green financing in achieving long-term goals while Stakeholder engagement The Bank discloses information about tackling short-term shocks. The event was held a signed loans on its website. This includes day before NIB opened a new office in the Latvian About this report capital, symbolising the Bank’s intention to intensify information about the borrower, loan sum, loan Independent Assurance Report its presence in the Baltic region. maturity, a project description, and a summary GOVERNANCE Read more here of the project’s anticipated impact. We also BOD REPORT communicate about our funding activities and the bonds we issue. We report annually on the FINANCIALS impact of projects financed by the proceeds of SUSTAINABILITY INDICES NIB Environmental Bonds: read more on page 24. Advocating circular economy Biodiversity debate at Folkemødet André Küüsvek, President and CEO We joined a debate at the Nordic pavilion of NIB, participated in the opening at Folkemødet, the People’s Meeting, session of the World Circular held in Denmark. The debate explored Economy Forum 2023 in Helsinki. urgent discussions on biodiversity, Küüsvek underscored the NIB’s nature-positive business practices Financing Sweden’s transition commitment to the environment and the role of the financial sector and productivity, advocating for in regenerating our planet. Kim Skov NIB invited clients, investors, peers and other a more nature-positive approach Jensen, Chief Financial Officer of NIB, stakeholders to a seminar in Stockholm. The in economic practices. envisaged the entire financial sector discussions delved into envisioning an automated, Read more here playing a part in regenerating our already electrified and connected mobility future. depleted nature and biodiversity. Read more here Read more here
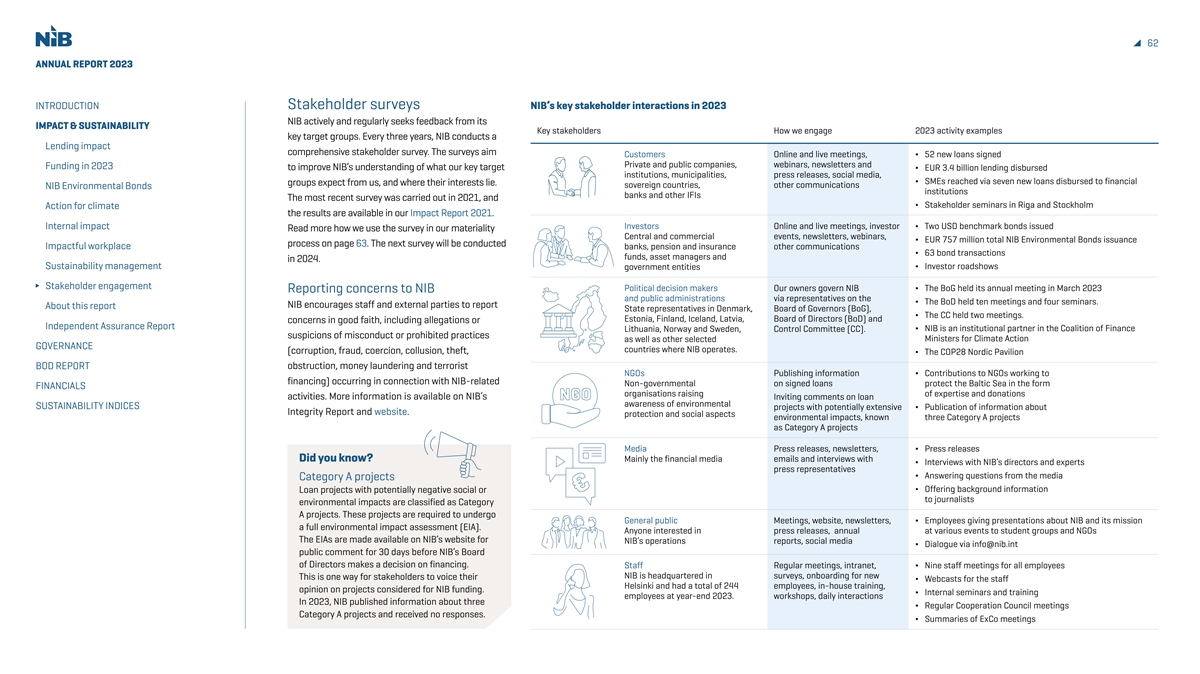
62 ANNUAL REPORT 2023 INTRODUCTION Stakeholder surveys NIB’s key stakeholder interactions in 2023 NIB actively and regularly seeks feedback from its IMPACT & SUSTAINABILITY Key stakeholders How we engage 2023 activity examples key target groups. Every three years, NIB conducts a Lending impact comprehensive stakeholder survey. The surveys aim Customers Online and live meetings, ∆ 52 new loans signed Private and public companies, webinars, newsletters and Funding in 2023 to improve NIB’s understanding of what our key target ∆ EUR 3.4 billion lending disbursed institutions, municipalities, press releases, social media, ∆ SMEs reached via seven new loans disbursed to financial groups expect from us, and where their interests lie. sovereign countries, other communications NIB Environmental Bonds institutions banks and other IFIs The most recent survey was carried out in 2021, and ∆ Stakeholder seminars in Riga and Stockholm Action for climate the results are available in our Impact Report 2021. Internal impact Investors Online and live meetings, investor ∆ Two USD benchmark bonds issued Read more how we use the survey in our materiality Central and commercial events, newsletters, webinars, ∆ EUR 757 million total NIB Environmental Bonds issuance process on page 63. The next survey will be conducted Impactful workplace banks, pension and insurance other communications ∆ 63 bond transactions funds, asset managers and in 2024. Sustainability management government entities ∆ Investor roadshows Stakeholder engagement Political decision makers Our owners govern NIB ∆ The BoG held its annual meeting in March 2023 Reporting concerns to NIB and public administrations via representatives on the ∆ The BoD held ten meetings and four seminars. NIB encourages staff and external parties to report About this report State representatives in Denmark, Board of Governors (BoG), ∆ The CC held two meetings. Estonia, Finland, Iceland, Latvia, Board of Directors (BoD) and concerns in good faith, including allegations or Independent Assurance Report ∆ NIB is an institutional partner in the Coalition of Finance Lithuania, Norway and Sweden, Control Committee (CC). suspicions of misconduct or prohibited practices Ministers for Climate Action as well as other selected GOVERNANCE countries where NIB operates. (corruption, fraud, coercion, collusion, theft, ∆ The COP28 Nordic Pavilion BOD REPORT obstruction, money laundering and terrorist NGOs Publishing information ∆ Contributions to NGOs working to financing) occurring in connection with NIB-related Non-governmental on signed loans protect the Baltic Sea in the form FINANCIALS organisations raising of expertise and donations activities. More information is available on NIB’s Inviting comments on loan awareness of environmental SUSTAINABILITY INDICES projects with potentially extensive ∆ Publication of information about Integrity Report and website. protection and social aspects environmental impacts, known three Category A projects as Category A projects Media Press releases, newsletters, ∆ Press releases Did you know? Mainly the financial media emails and interviews with ∆ Interviews with NIB’s directors and experts press representatives ∆ Answering questions from the media Category A projects ∆ Offering background information Loan projects with potentially negative social or to journalists environmental impacts are classified as Category A projects. These projects are required to undergo General public Meetings, website, newsletters, ∆ Employees giving presentations about NIB and its mission a full environmental impact assessment (EIA). Anyone interested in press releases, annual at various events to student groups and NGOs The EIAs are made available on NIB’s website for NIB’s operations reports, social media ∆ Dialogue via info@nib.int public comment for 30 days before NIB’s Board of Directors makes a decision on financing. Staff Regular meetings, intranet, ∆ Nine staff meetings for all employees NIB is headquartered in surveys, onboarding for new This is one way for stakeholders to voice their ∆ Webcasts for the staff Helsinki and had a total of 244 employees, in-house training, opinion on projects considered for NIB funding. ∆ Internal seminars and training employees at year-end 2023. workshops, daily interactions In 2023, NIB published information about three ∆ Regular Cooperation Council meetings Category A projects and received no responses. ∆ Summaries of ExCo meetings
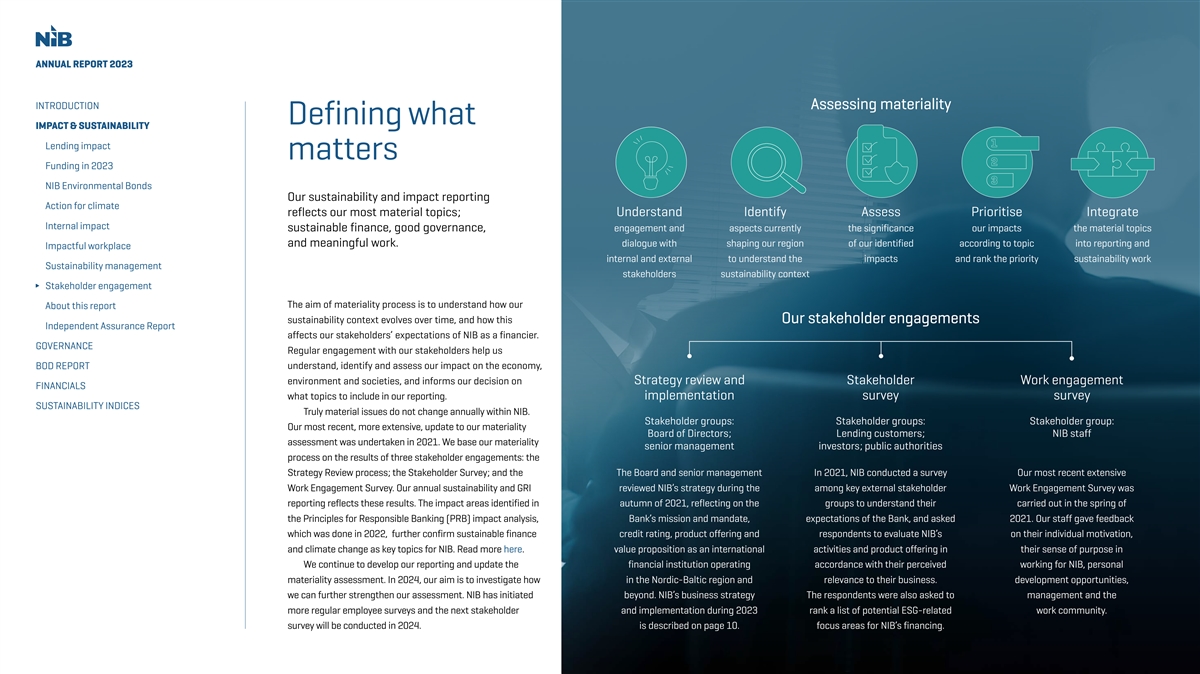
ANNUAL REPORT 2023 INTRODUCTION Assessing Assessing mat materiality eriality Defining what IMPACT & SUSTAINABILITY 1 1 Lending impact matters 2 2 Funding in 2023 3 3 NIB Environmental Bonds Our sustainability and impact reporting Action for climate reflects our most material topics; Understand Identify Assess Prioritise Integrate Internal impact sustainable finance, good governance, engagement and aspects currently the significance our impacts the material topics and meaningful work. dialogue with shaping our region of our identified according to topic into reporting and Impactful workplace internal and external to understand the impacts and rank the priority sustainability work Sustainability management stakeholders sustainability context Stakeholder engagement The aim of materiality process is to understand how our About this report sustainability context evolves over time, and how this Our stak Our stakeholder eholder engagement engagements s Independent Assurance Report affects our stakeholders’ expectations of NIB as a financier. GOVERNANCE Regular engagement with our stakeholders help us BOD REPORT understand, identify and assess our impact on the economy, environment and societies, and informs our decision on Strategy review and Stakeholder Work engagement FINANCIALS what topics to include in our reporting. implementation survey survey SUSTAINABILITY INDICES Truly material issues do not change annually within NIB. Stakeholder groups: Stakeholder groups: Stakeholder group: Our most recent, more extensive, update to our materiality Board of Directors; Lending customers; NIB staff assessment was undertaken in 2021. We base our materiality senior management investors; public authorities process on the results of three stakeholder engagements: the Strategy Review process; the Stakeholder Survey; and the The Board and senior management In 2021, NIB conducted a survey Our most recent extensive Work Engagement Survey. Our annual sustainability and GRI reviewed NIB’s strategy during the among key external stakeholder Work Engagement Survey was reporting reflects these results. The impact areas identified in autumn of 2021, reflecting on the groups to understand their carried out in the spring of the Principles for Responsible Banking (PRB) impact analysis, Bank’s mission and mandate, expectations of the Bank, and asked 2021. Our staff gave feedback which was done in 2022, further confirm sustainable finance credit rating, product offering and respondents to evaluate NIB’s on their individual motivation, and climate change as key topics for NIB. Read more here. value proposition as an international activities and product offering in their sense of purpose in We continue to develop our reporting and update the financial institution operating accordance with their perceived working for NIB, personal materiality assessment. In 2024, our aim is to investigate how in the Nordic-Baltic region and relevance to their business. development opportunities, we can further strengthen our assessment. NIB has initiated beyond. NIB’s business strategy The respondents were also asked to management and the more regular employee surveys and the next stakeholder and implementation during 2023 rank a list of potential ESG-related work community. survey will be conducted in 2024. is described on page 10. focus areas for NIB’s financing.
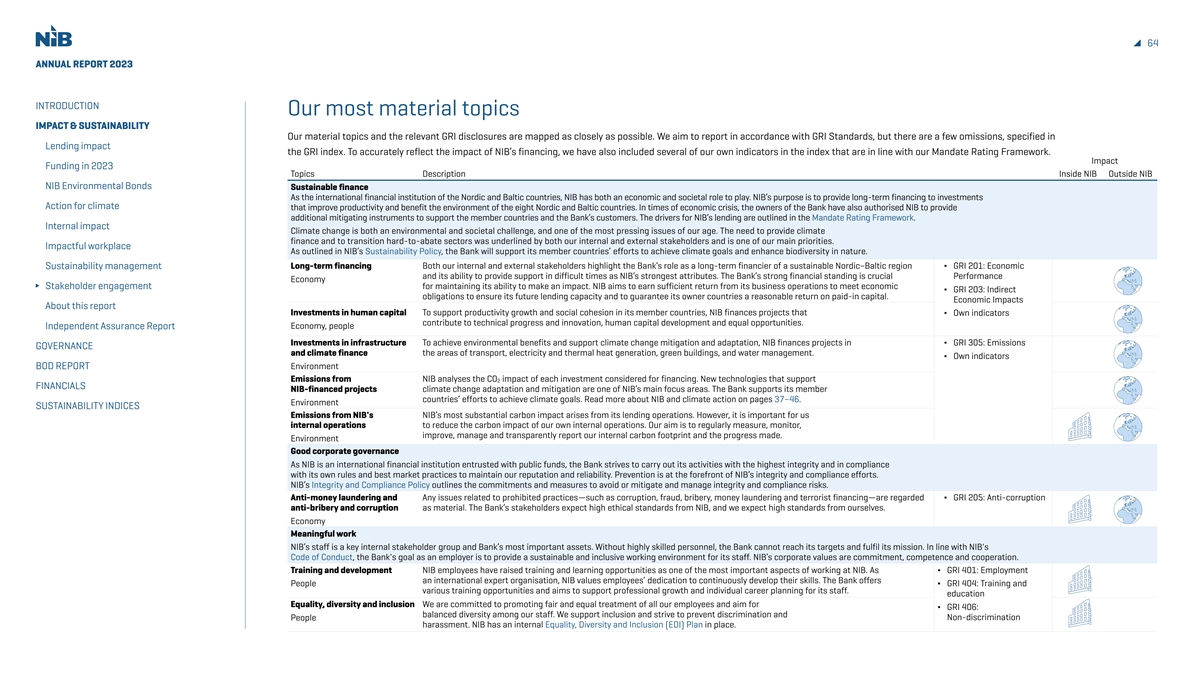
64 ANNUAL REPORT 2023 INTRODUCTION Our most material topics IMPACT & SUSTAINABILITY Our material topics and the relevant GRI disclosures are mapped as closely as possible. We aim to report in accordance with GRI Standards, but there are a few omissions, specified in Lending impact the GRI index. To accurately reflect the impact of NIB’s financing, we have also included several of our own indicators in the index that are in line with our Mandate Rating Framework. Impact Funding in 2023 Topics Description Inside NIB Outside NIB NIB Environmental Bonds Sustainable finance As the international financial institution of the Nordic and Baltic countries, NIB has both an economic and societal role to play. NIB’s purpose is to provide long-term financing to investments Action for climate that improve productivity and benefit the environment of the eight Nordic and Baltic countries. In times of economic crisis, the owners of the Bank have also authorised NIB to provide additional mitigating instruments to support the member countries and the Bank’s customers. The drivers for NIB’s lending are outlined in the Mandate Rating Framework. Internal impact Climate change is both an environmental and societal challenge, and one of the most pressing issues of our age. The need to provide climate finance and to transition hard-to-abate sectors was underlined by both our internal and external stakeholders and is one of our main priorities. Impactful workplace As outlined in NIB’s Sustainability Policy, the Bank will support its member countries’ efforts to achieve climate goals and enhance biodiversity in nature. Long-term financing Both our internal and external stakeholders highlight the Bank’s role as a long-term financier of a sustainable Nordic–Baltic region ∆ GRI 201: Economic Sustainability management and its ability to provide support in difficult times as NIB’s strongest attributes. The Bank’s strong financial standing is crucial Performance Economy Stakeholder engagement for maintaining its ability to make an impact. NIB aims to earn sufficient return from its business operations to meet economic ∆ GRI 203: Indirect obligations to ensure its future lending capacity and to guarantee its owner countries a reasonable return on paid-in capital. Economic Impacts About this report Investments in human capital To support productivity growth and social cohesion in its member countries, NIB finances projects that ∆ Own indicators contribute to technical progress and innovation, human capital development and equal opportunities. Economy, people Independent Assurance Report Investments in infrastructure To achieve environmental benefits and support climate change mitigation and adaptation, NIB finances projects in ∆ GRI 305: Emissions GOVERNANCE and climate finance the areas of transport, electricity and thermal heat generation, green buildings, and water management. ∆ Own indicators BOD REPORT Environment Emissions from NIB analyses the CO impact of each investment considered for financing. New technologies that support 2 FINANCIALS NIB-financed projects climate change adaptation and mitigation are one of NIB’s main focus areas. The Bank supports its member countries’ efforts to achieve climate goals. Read more about NIB and climate action on pages 37–46. Environment SUSTAINABILITY INDICES Emissions from NIB's NIB’s most substantial carbon impact arises from its lending operations. However, it is important for us internal operations to reduce the carbon impact of our own internal operations. Our aim is to regularly measure, monitor, improve, manage and transparently report our internal carbon footprint and the progress made. Environment Good corporate governance As NIB is an international financial institution entrusted with public funds, the Bank strives to carry out its activities with the highest integrity and in compliance with its own rules and best market practices to maintain our reputation and reliability. Prevention is at the forefront of NIB’s integrity and compliance efforts. NIB’s Integrity and Compliance Policy outlines the commitments and measures to avoid or mitigate and manage integrity and compliance risks. Anti-money laundering and Any issues related to prohibited practices—such as corruption, fraud, bribery, money laundering and terrorist financing—are regarded ∆ GRI 205: Anti-corruption anti-bribery and corruption as material. The Bank’s stakeholders expect high ethical standards from NIB, and we expect high standards from ourselves. Economy Meaningful work NIB’s staff is a key internal stakeholder group and Bank’s most important assets. Without highly skilled personnel, the Bank cannot reach its targets and fulfil its mission. In line with NIB's Code of Conduct, the Bank's goal as an employer is to provide a sustainable and inclusive working environment for its staff. NIB’s corporate values are commitment, competence and cooperation. Training and development NIB employees have raised training and learning opportunities as one of the most important aspects of working at NIB. As ∆ GRI 401: Employment an international expert organisation, NIB values employees’ dedication to continuously develop their skills. The Bank offers People ∆ GRI 404: Training and various training opportunities and aims to support professional growth and individual career planning for its staff. education Equality, diversity and inclusion We are committed to promoting fair and equal treatment of all our employees and aim for ∆ GRI 406: balanced diversity among our staff. We support inclusion and strive to prevent discrimination and People Non-discrimination harassment. NIB has an internal Equality, Diversity and Inclusion (EDI) Plan in place.
65 ANNUAL REPORT 2023 INTRODUCTION About this report IMPACT & SUSTAINABILITY Lending impact Funding in 2023 The Nordic Investment Bank (NIB) is an international financial An independent third party has provided limited assurance on or in part, or any disclosure of any of their contents may be institution (IFI), owned by the governments of the eight Nordic selected sustainability information in this report. The scope of prohibited or limited by the laws of certain jurisdictions. By NIB Environmental Bonds and Baltic countries. The Bank’s head office is in Helsinki, Finland. the assured information is indicated in the Independent proceeding to any of the webpages or otherwise accessing Action for climate NIB is publishing one combined Annual Report covering our Assurance Report on page 66. The Report on the Audit of the information in the report, you represent, warrant and agree to Internal impact activities, impact and sustainability reporting, governance, and Financial Statements is available on pages 163–168. your compliance with all such prohibitions or limitations. financials. The annual report of the Board of Directors and By accessing the webpages linked from this report, you Impactful workplace audited financial statements for the year ended 31 December are Disclosure in relation to represent and warrant that you are permitted to do so under the Sustainability management included in the Annual Report and approved by the Board. commitments and initiatives laws of your respective jurisdiction. NIB shall in no case bear Stakeholder engagement Due to NIB’s legal status, national banking legislation does This report reflects our disclosures in the context of several liability for any infringement of any such prohibition or restriction. not apply to the Bank, nor is it subject to the direct supervision of commitments and initiatives in which we are participating, About this report any supervisory authority. NIB monitors international regulations including the following: On forward-looking statements Independent Assurance Report and standards and adopts those that it identifies as relevant. ∆ On an annual basis, NIB reports on the impact of projects This report contains a number of forward-looking statements, GOVERNANCE Subsequently, NIB reports on its sustainability according to the financed by the proceeds of NIB Environmental Bonds (NEBs). which include, but are not limited to, statements related to the BOD REPORT relevant market standards and internationally recognised ∆ This report has been prepared in accordance with GRI Standards. macroeconomic environment in the Nordic-Baltic region, the frameworks. ∆ This report partly covers the disclosures recommended by the expected development of NIB’s lending and the execution of FINANCIALS Task Force on Climate-related Financial Disclosure (TCFD). the Bank’s mission. These statements are typically identified by SUSTAINABILITY INDICES Other reports The TCFD disclosure index is available on page 191. words such as “anticipate”, “estimate”, “expect”, or “foresee”, NIB’s Integrity Report 2023 is available here. All external reports ∆ NIB reports on the implementation of the Principles of and are included to give our stakeholders the opportunity to are available on our website at Our year. Responsible Banking (PRB). See the PRB index on page 181. understand our expectations about the future, and how we intend to address emerging challenges. By their very nature, these Scope of this report Disclaimer statements reflect known and unknown risks and uncertainties This report covers the period of 1 January to 31 December 2023, The historical information presented in this report speaks only as that require us to make assumptions that may not prove to be which is NIB’s financial year. NIB’s main impact stems from its of its respective date. NIB expressly disclaims any intention or accurate. We caution readers of this report about placing undue lending to projects that improve productivity and benefit the obligation to update or revise any such information. This report does reliance on these forward-looking statements, as they are not a environment of the Nordic-Baltic region and other countries. not constitute an offer to sell, or the solicitation of an order to buy, guarantee of future performance. We do not undertake to correct The Bank’s smaller impact arises from the running of its internal any of the securities referred to, and is provided for information any such statements. operations. NIB therefore reports separately on the impact of purposes only. None of the documents or other information NIB-financed activities and on its own internal impact. The lending appearing in this report or on any webpages linked from the Contact impact figures presented in this report are based on disbursed report should be construed as investment, legal or tax advice. We welcome any comments, questions or suggestions regarding loan amounts unless otherwise indicated. More information about Any reproduction or distribution of any of the documents or this report or our performance. These can be addressed to how we calculate impact can be found on our website. other information appearing in or linked from the report, in whole info@nib.int.
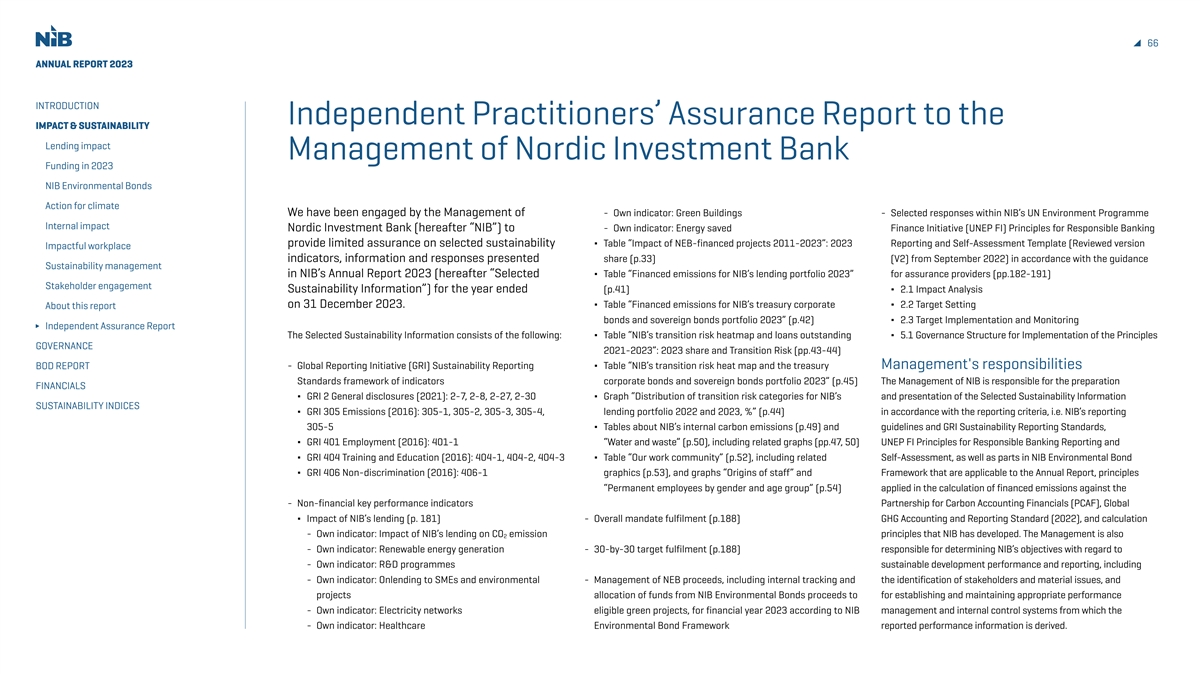
66 ANNUAL REPORT 2023 INTRODUCTION Independent Practitioners’ Assurance Report to the IMPACT & SUSTAINABILITY Lending impact Management of Nordic Investment Bank Funding in 2023 NIB Environmental Bonds Action for climate We have been engaged by the Management of - Own indicator: Green Buildings - Selected responses within NIB’s UN Environment Programme Internal impact Nordic Investment Bank (hereafter “NIB”) to - Own indicator: Energy saved Finance Initiative (UNEP FI) Principles for Responsible Banking provide limited assurance on selected sustainability ∆ Table “Impact of NEB-financed projects 2011-2023”: 2023 Reporting and Self-Assessment Template (Reviewed version Impactful workplace indicators, information and responses presented share (p.33) (V2) from September 2022) in accordance with the guidance Sustainability management in NIB’s Annual Report 2023 (hereafter “Selected ∆ Table “Financed emissions for NIB’s lending portfolio 2023” for assurance providers (pp.182-191) Stakeholder engagement Sustainability Information”) for the year ended (p.41) ∆ 2.1 Impact Analysis on 31 December 2023. ∆ Table “Financed emissions for NIB’s treasury corporate ∆ 2.2 Target Setting About this report bonds and sovereign bonds portfolio 2023” (p.42) ∆ 2.3 Target Implementation and Monitoring Independent Assurance Report The Selected Sustainability Information consists of the following: ∆ Table “NIB’s transition risk heatmap and loans outstanding ∆ 5.1 Governance Structure for Implementation of the Principles GOVERNANCE 2021-2023”: 2023 share and Transition Risk (pp.43-44) BOD REPORT - Global Reporting Initiative (GRI) Sustainability Reporting ∆ Table “NIB’s transition risk heat map and the treasury Management's responsibilities Standards framework of indicators corporate bonds and sovereign bonds portfolio 2023” (p.45) The Management of NIB is responsible for the preparation FINANCIALS ∆ GRI 2 General disclosures (2021): 2-7, 2-8, 2-27, 2-30 ∆ Graph “Distribution of transition risk categories for NIB’s and presentation of the Selected Sustainability Information SUSTAINABILITY INDICES ∆ GRI 305 Emissions (2016): 305-1, 305-2, 305-3, 305-4, lending portfolio 2022 and 2023, %” (p.44) in accordance with the reporting criteria, i.e. NIB’s reporting 305-5 ∆ Tables about NIB’s internal carbon emissions (p.49) and guidelines and GRI Sustainability Reporting Standards, ∆ GRI 401 Employment (2016): 401-1 “Water and waste” (p.50), including related graphs (pp.47, 50) UNEP FI Principles for Responsible Banking Reporting and ∆ GRI 404 Training and Education (2016): 404-1, 404-2, 404-3 ∆ Table “Our work community” (p.52), including related Self-Assessment, as well as parts in NIB Environmental Bond ∆ GRI 406 Non-discrimination (2016): 406-1 graphics (p.53), and graphs “Origins of staff” and Framework that are applicable to the Annual Report, principles “Permanent employees by gender and age group” (p.54) applied in the calculation of financed emissions against the - Non-financial key performance indicators Partnership for Carbon Accounting Financials (PCAF), Global ∆ Impact of NIB’s lending (p. 181) - Overall mandate fulfilment (p.188) GHG Accounting and Reporting Standard (2022), and calculation - Own indicator: Impact of NIB’s lending on CO emission principles that NIB has developed. The Management is also 2 - Own indicator: Renewable energy generation - 30-by-30 target fulfilment (p.188) responsible for determining NIB’s objectives with regard to - Own indicator: R&D programmes sustainable development performance and reporting, including - Own indicator: Onlending to SMEs and environmental - Management of NEB proceeds, including internal tracking and the identification of stakeholders and material issues, and projects allocation of funds from NIB Environmental Bonds proceeds to for establishing and maintaining appropriate performance - Own indicator: Electricity networks eligible green projects, for financial year 2023 according to NIB management and internal control systems from which the - Own indicator: Healthcare Environmental Bond Framework reported performance information is derived.
67 ANNUAL REPORT 2023 INTRODUCTION Our responsibilities - Planned our procedures in relation to the UNEP FI Principles Inherent limitations Our responsibility is to carry out a limited assurance engagement and for Responsible Banking informed by the Assurance Guidance Inherent limitations exist in all assurance engagements due IMPACT & SUSTAINABILITY to express a conclusion based on the work performed. We conducted to undertake limited assurance on Principles reporting Version to the selective testing of the information being examined. Lending impact our assurance engagement on the Selected Sustainability Information 2 (updated October 2022), to be used with the V2 of the Therefore fraud, error or non-compliance may occur and not Funding in 2023 in accordance with International Standard on Assurance Engagements Reporting and Self-Assessment Template (from September be detected. Additionally, non-financial data may be subject to (ISAE) 3000 (Revised), Assurance Engagements other than Audits or 2022), issued by UNEP FI, considering NIB’s stage of more inherent limitations than financial data, given both its NIB Environmental Bonds Reviews of Historical Financial Information, issued by the International implementation of the Principles for Responsible Banking nature and the methods used for determining, calculating Action for climate Auditing and Assurance Standards Board IAASB. That Standard - Assessed the application of NIB’s reporting guidelines and and estimating such data. Internal impact requires that we plan and perform the engagement to obtain limited GRI Sustainability Reporting Standards reporting principles, assurance about whether the Selected Sustainability Information is the Reporting and Self-Assessment Template reporting Conclusion Impactful workplace free from material misstatement. The nature, timing and extent of the principles related to the UNEP FI Principles for Responsible Our conclusion has been formed on the basis of, and is subject Sustainability management assurance procedures selected depend on professional judgement, Banking Reporting and Self-Assessment, as well as parts in NIB to, the matters outlined in this report. Stakeholder engagement including the assessment of material misstatement due to irregularity Environmental Bond Framework that are applicable to the Annual We believe that the evidence we have obtained is sufficient or error. We believe that the evidence we obtain is sufficient and Report, principles applied in the calculation of financed emissions and appropriate to provide a basis for our conclusions. About this report appropriate to provide a basis for our conclusion on limited assurance. against the Partnership for Carbon Accounting Financials (PCAF), Based on the procedures performed and the evidence obtained, Independent Assurance Report We are independent of the company in accordance with the Global GHG Accounting and Reporting Standard (2022), and as described above, nothing has come to our attention that causes GOVERNANCE ethical requirements applicable in Finland to the engagement we calculation principles that NIB has developed; us to believe that the Selected Sustainability Information subject to BOD REPORT have undertaken and have fulfilled our other ethical obligations - Assessed data management processes, information systems the limited assurance engagement is not prepared, in all material under those requirements. and working methods used to gather and consolidate the respects, in accordance with company’s reporting guidelines and FINANCIALS KPMG Oy Ab applies International Standard on Quality Management Selected Sustainability Information; GRI Sustainability Reporting Standards, the UNEP FI Principles for SUSTAINABILITY INDICES ISQM 1, which requires the firm to design, implement and operate a - Reviewed the presented Selected Sustainability Information Responsible Banking Reporting and Self-Assessment Template system of quality management including policies or procedures and assessed its quality and reporting boundary definitions; (Reviewed version (V2) from September 2022), as well as parts regarding compliance with ethical requirements, professional - Assessed the Selected Sustainability Information data in NIB Environmental Bond Framework that are applicable to the standards and applicable legal and regulatory requirements. accuracy and completeness through a review of the original Annual Report, principles of the PCAF Global GHG Accounting and documents and systems on a sample basis and; Reporting Standard (2022) in the calculation of financed emissions, Procedures performed - Conducted a site session to review Selected Sustainability and calculation principles that NIB has developed. A limited assurance engagement on Selected Sustainability Information at NIB premises. Information consists of making inquiries, primarily of persons Helsinki, 27 February 2024 responsible for the preparation of information presented in the The procedures performed in a limited assurance engagement KPMG Oy Ab Selected Sustainability Information, and applying analytical and other vary in nature and timing from, and are less in extent than evidence gathering procedures, as appropriate. In the engagement, for, a reasonable assurance engagement. Consequently, Marcus Tötterman we have performed the following procedures, among others: the level of assurance obtained in a limited assurance Authorised Public Accountant - Interviewed members of NIB’s senior management and relevant engagement is substantially lower than the assurance that staff responsible for providing the Selected Sustainability would have been obtained had a reasonable assurance Tomas Otterström Information; engagement been performed. Partner, Advisory

ANNUAL REPORT 2023 INTRODUCTION GOVERNANCE IMPACT & SUSTAINABILITY GOVERNANCE Governance Statement We are Members of the Governing bodies and management committed BOD REPORT FINANCIALS SUSTAINABILITY INDICES to good governance As sustainability analysts, we get to work with a wide range of projects assessing and advising clients on their ESG issues. We evaluate and engage with customers and their projects, providing support and promoting capital and resource allocation for activities with substantial environmental benefits. Collaborating with a dynamic customer base is highly rewarding, particularly when we achieve a meaningful impact together. Nikunj Pokhrel and Mathilda Walch, Sustainability Advisors

69 ANNUAL REPORT 2023 INTRODUCTION Governance Statement IMPACT & SUSTAINABILITY GOVERNANCE Governance Statement Introduction Members of the Governing NIB was established as an international financial institution on 4 Governing bodies of the Bank bodies and management December 1975 between Denmark, Finland, Iceland, Norway and BOD REPORT Sweden by an international treaty. The Bank commenced operations FINANCIALS on 2 August 1976. As of 1 January 2005, Estonia, Latvia and Lithuania MEMBER COUNTRIES became members on equal terms. NIB is governed by its constituent SUSTAINABILITY INDICES documents, which are available here. The constituent documents currently in force include the Agreement concerning the Nordic BOARD OF GOVERNORS Investment Bank between its member countries of 11 February 2004 (the “Agreement”) and the related Statutes. These entered into force in 2005 and both were last amended in 2020. The constituent BOARD OF DIRECTORS CONTROL COMMITTEE AND CHAIRMANSHIP documents also include the Host Country Agreement between the Government of Finland and the Bank of 20 October 2010. NIB’s governance structure is set out in the Agreement PRESIDENT & CEO INTERNAL AUDIT and the Statutes. The Statutes define the relations between and mandate of the Bank’s governing bodies: the Board of Governors, the Board of Directors and the Control Committee. According to EXECUTIVE COMMITTEE the Statutes, NIB also has a President and the staff necessary Lending Risk and Treasury and Legal IT and Sustainability Communications Human to carry out its operations. Compliance Finance Business and Resources Services Mandate NIB promotes integrity, transparency, predictability, accountability, responsibility and disclosure as general principles enhancing and furthering good governance. NIB aims to follow best practices in the field of corporate governance. OTHER COMMITTEES & COUNCILS Mandate, Credit Asset, Liability Business and Business Trust Fund Internal Cooperation Governing bodies of the Bank and Compliance and Risk Technology Integrity Committee Sustainability Council Committee Committee Committee Council Council The governing bodies of the Bank are established pursuant to the Agreement and Statutes and carry out their functions in accordance with their respective Rules of Procedure. The Rules of Procedures for the Board of Governors, Board of Directors, and the Control Committee are available on the Bank’s website.
70 ANNUAL REPORT 2023 INTRODUCTION Board of Governors To enhance its governance, the Control Committee has Ole Hovland (Norway) continued his term as Chair, with Merle The Board of Governors has the powers granted to it in Section appointed an independent expert to assist the Chairmanship. Wilkinson (Estonia) as Deputy Chair. IMPACT & SUSTAINABILITY 13 of the Statutes. The Board of Governors is composed of The Control Committee holds at least one meeting each GOVERNANCE eight governors. The Minister designated by it as its Governor year where the annual report concerning the previous financial President Governance Statement represents each member country. The Board of Governors year shall be examined. The Chairmanship meets independently The President is responsible for conducting the Bank’s current appoints a Chair for a term of one year according to the rotation at regular intervals each year. operations and is appointed by the Board of Directors for a term Members of the Governing scheme it has adopted. The Board of Governors holds an annual The Control Committee had two ordinary meetings during of five years at a time. André Küüsvek is the President and CEO bodies and management meeting and such other meetings as deemed appropriate. the year. The first was on 24 February 2023 in Helsinki, and the having been appointed by the Board of Directors on 1 April 2021. BOD REPORT Until 31 May 2023 the Governor for Finland, Annika Saarikko, second was on 29 September 2023 in Stockholm. Toomas Vapper FINANCIALS Minister of Finance, has served as Chair. As from 1 June 2023 the (Estonia) continued his term as Chair, with Pentti Hakkarainen Advisory bodies to the President Governor for Estonia, Mr Mart Võrklaev, Minister of Finance, has (Finland) as Deputy Chair. The Control Committee Chairmanship The President is assisted and advised by the Executive SUSTAINABILITY INDICES served as Chair. held six additional meetings in 2023. Committee, the Mandate, Credit and Compliance Committee, The Board of Governors held its annual meeting by written the Asset, Liability and Risk Committee, and the Business and procedure on 31 March 2023. Board of Directors Technology Committee. All the existing committees operate in According to the Statutes, all the powers of the Bank that are accordance with their respective Rules of Procedure. Control Committee not vested with the Board of Governors are vested with the Board The Control Committee is established to monitor that the of Directors. The Board of Directors makes the most significant Executive Committee operations of the Bank are conducted in accordance with the financing decisions and adopts policy decisions concerning The Executive Committee assists and advises the President in Statutes. It is composed of at least ten members with the the operations of the Bank, in particular the general framework general management and decision-making concerning NIB, maximum number of members being twelve. The Nordic Council for financing, borrowing and treasury operations and their including all aspects of the performance, policy and financial and Parliaments of Estonia, Latvia and Lithuania appoint one management. The Board of Directors may delegate its powers soundness of the Bank. The Executive Committee comprises the member from each country and the Board of Governors appoint to the President to the extent it considers appropriate. President and other senior management representatives the two to four members including the chair and deputy chair. The The Board of Directors is composed of eight directors President has appointed as members. The Board of Directors members appointed by the Board of Governors are referred to as and eight alternates appointed by each member country. confirms the appointment of members. The Executive Committee the Chairmanship and administer the responsibilities and tasks The Board of Directors appoints from among its members meets formally approximately twice a month. of the full Committee, monitor the Bank’s financial position, risk a Chair and a Deputy Chair for a term of two years according In 2023, the Executive Committee held twenty-three levels, capital and liquidity position and oversee the performance to the rotation scheme adopted by the Board of Governors. meetings. The meetings are ordinarily chaired by the President, of the audit of the Bank’s financial statements, carried out by NIB’s Board of Directors held ten meetings in 2023. who reaches decisions after having consulted the members. The the external auditors. The full Committee focuses on monitoring The meetings 1/23, 3/23, and 9/23 were held fully online. Executive Committee also meets informally at the fulfilment of NIB’s purpose and in particular its mandate and The remaining meetings were held in person, with some commencement of every working day. mission. The full Committee and the Chairmanship each deliver members participating remotely. The Board meeting 6/23 a report annually to the Board of Governors concerning their was held on 24 August 2023 in Riga to coincide with the Mandate, Credit and Compliance Committee monitoring tasks as set out in the Statutes and in the Rules of opening of NIB’s office there. The Board meeting 7/23 was The Mandate, Credit and Compliance Committee assists and Procedure. The Control Committee appoints the external auditors held on 28 September 2023 in Stockholm. The remaining advises the President in management and decision-making to carry out the audit of the Bank’s financial statements. five meetings were held in Helsinki. concerning mandate, credit and related integrity and

71 ANNUAL REPORT 2023 INTRODUCTION compliance matters. The Committee is responsible for Business and Technology Committee and the staff more effective, in particular in a manner enabling preparation and decision-making related to certain lending The Business and Technology Committee is a body established the Bank to take better account of the staff’s opinions IMPACT & SUSTAINABILITY activities and counterparty ratings for lending and treasury, to facilitate IT’s strategic direction and the digital transformation concerning such matters. The Council consists of four members GOVERNANCE setting treasury business limits and mandate matters. of NIB by prioritising, directing, monitoring and governing representing the Bank and four representing the staff. The Governance Statement The Committee grants loans and approves acquisition of NIB’s enterprise IT architecture, IT projects and development President appoints the representatives of the Bank while the certain bonds within the powers delegated to the President initiatives. It is chaired by the Chief Operating Officer and representatives of the staff are elected by vote. The Cooperation Members of the Governing by the Board of Directors and in line with the guidelines and consist of members of other senior staff. The Committee meets Council meets at least quarterly. In 2023, the Council met bodies and management instructions given by the Board of Directors. on a regular basis approximately ten times a year. In 2023, the four times. BOD REPORT The President exercises his executive powers concerning Committee met twelve times. FINANCIALS lending operations in the Committee. The Mandate, Credit and Sustainability management Compliance Committee is composed of the President and the Other internal committees and councils The Internal Sustainability Council aims to strengthen NIB’s SUSTAINABILITY INDICES Head of Lending, the Chief Financial Officer, the Chief Risk Officer, In addition to the advisory bodies to the President, the Bank sustainability agenda for its in-house activities. The Council has the General Counsel and the Head of Sustainability and Mandate. has the following permanent internal committees and councils: eight members, representing functions dealing with internal The Mandate, Credit and Compliance Committee is chaired by the the Business Integrity Council, the Trust Fund Committee, the sustainability matters. Decisions and action points proposed by President or, in the absence of the President, another member Internal Sustainability Council and the Cooperation Council. the Council are approved by the President. The Council reports to (other than the Chief Risk Officer). The Committee meets at The President is not a member of these internal committees the Executive Committee. In 2023, the Council met four times regular intervals every week. In 2023, the Mandate, Credit and and councils but appoints the members (save for staff Governance of Environmental, Social, and Governance (ESG) Compliance Committee met fifty-six times. representatives on the Cooperation Council who are elected by risks and opportunities in general is integrated in NIB’s core the staff). The internal committees and councils also operate governance structure. The ESG integration in NIB’s business is Asset, Liability and Risk Committee in accordance with their respective Rules of Procedure or other explained on pages 55-57 and more detailed description on NIB’s The Asset, Liability and Risk Committee (“ALR”) is a body applicable rules. sustainability governance can be found from NIB’s Sustainability established to monitor, analyse, discuss and guide the The Business Integrity Council supports awareness raising of Policy. Read more about NIB’s risk governance in general on page development and overall management of NIB’s balance sheet, its integrity and corruption risks among the Bank’s staff and 72 and in the Risk Management Policy. risk and capital, funding and liquidity positions. Treasury related stakeholders. The Council generally meets twice a year. While no risk matters (related to funding, asset and liability management, formal meeting was held in 2023, several members were Remuneration and incentive programmes and portfolio management activities) are also monitored, consulted on specific topics. The members of the Board of Governors are ministers. Their analysed, discussed and guided by the ALR. The Trust Fund Committee ensures that the purposes of the participation in the Board of Governors is considered to be part The ALR comprises some members of the Executive trust funds managed by NIB are fulfilled in the most efficient way. of their ministerial duties. Therefore the Governors receive no Committee and other senior staff that the President has The Committee also approves the activity plan of the trust funds remuneration from the Bank. appointed as members. All decisions at the ALR require as well as proposed allocations from trust funds. The Committee The Board of Governors determines the remuneration and majority support and, at the same time, the Chief Financial gives its recommendations to the respective donor(s) for their attendee allowance for the Board of Directors and for the Control Officer as Chair of ALR and the Chief Risk Officer (or their final decision. In 2023, the Committee met three times. Committee. The President’s terms of employment, including substitutes) both need to be supportive. The ALR meets The purpose of the Cooperation Council is to facilitate a remuneration, are determined by the Board of Directors. The approximately twelve times a year but can convene more cooperation process within NIB with the main aim of improving Control Committee approves the remuneration of the external frequently if necessary. In 2023, the ALR met fifteen times. working conditions and making the interaction between the Bank auditors. The principles for the remuneration of staff are set out
72 ANNUAL REPORT 2023 INTRODUCTION in the Compensation Regulations approved by the Board of Statement (RAS), an Internal Capital Adequacy Assessment relating to compliance and integrity risks. The Chief Compliance Directors. The Bank applies a fixed salary-based system which Process (ICAAP), risk management policies, and a Capital Officer reports to the Chief Risk Officer (CRO), has a dotted IMPACT & SUSTAINABILITY reflects the work profile, qualifications, individual competence and Liquidity Recovery Plan. reporting line to the President and has unrestricted access to the GOVERNANCE and the results that NIB expects the employee to achieve as well The Bank’s risk management framework comprises risk Chair of the Board of Directors and the Chair of the Control Governance Statement as a small performance premium programme that rewards policies and procedures formulated for the identification, Committee. The activities and mandate of the Integrity and excellent and extraordinary performance on a yearly basis. For measurement, monitoring and reporting of risks including a Compliance Office are set forth in the Integrity and Compliance Members of the Governing more information about Personnel expenses, compensation and comprehensive limit system for managing the exposure to Policy. The CRO heads the Risk & Compliance department and bodies and management benefits, see Note 7. quantifiable risks. The Bank recognises that effective risk reports to the President. The CRO is a member of the Executive BOD REPORT management is based on a sound risk culture, which is Committee and the Mandate, Credit and Compliance Committee, FINANCIALS Risk governance characterised, among other things, by a high level of awareness with the role and purpose to ensure that risk considerations are The three-lines-of-defence model provides the basis for concerning risk and risk management in the organisation. properly taken into account, to influence decision-making and, SUSTAINABILITY INDICES NIB’s risk governance. The model aims to provide clear Regular training of staff in risk-related matters is part of the when necessary, challenge decisions that give rise to material segregation of duties between units that enter into business Bank’s risk management practices. risk. The CRO is also a decisive member of the Asset, Liability and transactions with customers or otherwise expose the Bank to risk, The second line of defence consist of functions that monitor Risk Committee with respect to risk-related matters. The CRO and units in charge of risk assessment, risk measurement, and oversee the risk-taking of the first line functions. At NIB, the has unrestricted access to the Chair of the Board of Directors monitoring and control. Risk & Compliance department acts as the second line of and the Chair of the Control Committee. An important objective is defence. It is organisationally separate from the business to engage the senior management, Board of Directors and the Business functions functions but interacts with them in risk matters and is involved Control Committee in constructive dialogue on key risk issues. The business functions, Lending and Treasury, are responsible for in decision-making with the objective to ensure that risk implementing the Bank’s business strategy and act as the first considerations are properly taken into account. Risk & Internal Audit line of defence for the risks in their operations. Lending is Compliance independently monitors and controls the risk NIB’s Internal Audit – the third line of defence - adheres to responsible for loan origination and mandate fulfilment in positions of the Bank and implements the Bank’s risk international professional standards established by the Institute accordance with the Bank’s willingness to take risk. Treasury management related policies and practices as approved by the of Internal Auditors. The task of the Internal Audit function provides support by executing the funding strategy and managing Board of Directors. The Risk & Compliance department has the is to provide assurance on the effectiveness of the Bank’s the liquidity as well as balance sheet risks (asset and liability overall responsibility for identifying, measuring, assessing, internal control, risk management and governance processes, management). monitoring and reporting on risks across risk types and and to make recommendations to the management. Internal organisational units. The department is responsible for the Audit provides an independent evaluation of the controls, Risk management framework Bank’s risk models, tools, policies and frameworks (like ICAAP, risk management and governance processes. The Head of NIB follows sound banking principles, monitors international RAS and capital and liquidity recovery planning and the related Internal Audit reports to the Board of Directors and the Control risk management regulations and standards and adopts those reporting) as well as for designing and maintaining of the Bank’s Committee and works administratively under the auspices of it identifies to be relevant to the nature of NIB’s business risk limit framework. Limit monitoring is conducted on a regular the President. The activities and mandate of the Internal Audit model. The Bank has established a risk, capital and liquidity basis and breaches are reported to the relevant committees, function are set forth in the Internal Audit Charter. management framework, with high-level statutory senior management and to the Board of Directors. requirements stipulated in the Statutes and the Principles for The Compliance function belongs to the second line of Capital and Liquidity Management, supported by a Risk Appetite defence and oversees, coordinates and reports on matters
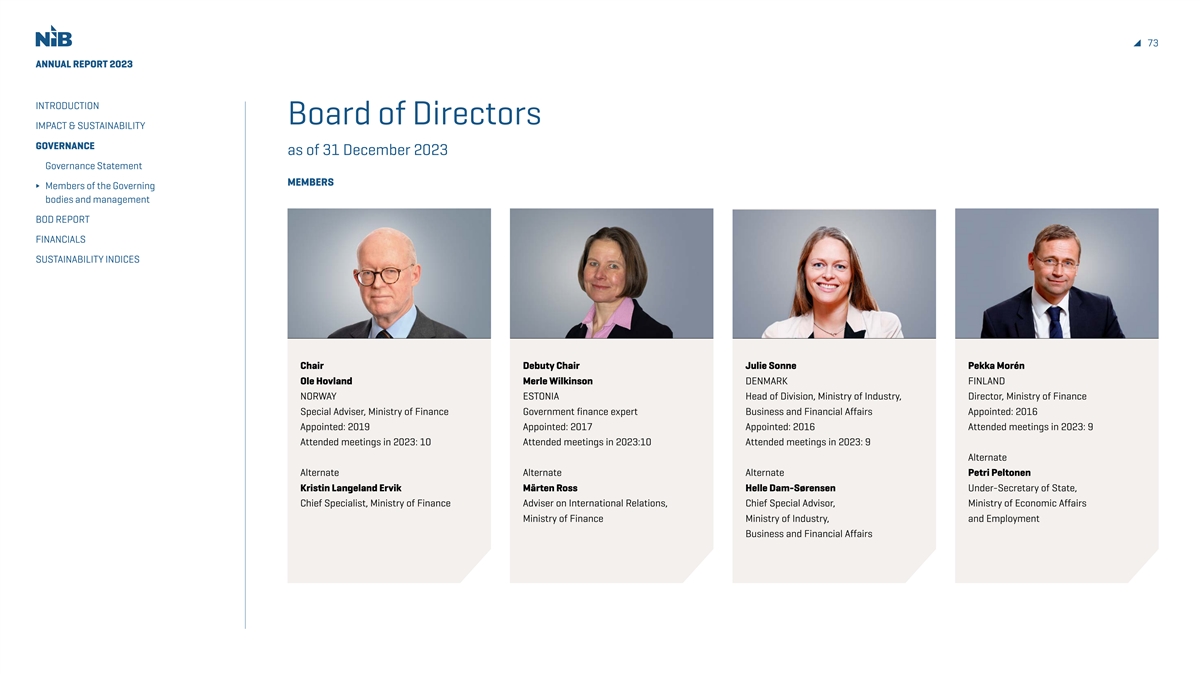
73 ANNUAL REPORT 2023 INTRODUCTION Board of Directors IMPACT & SUSTAINABILITY GOVERNANCE as of 31 December 2023 Governance Statement MEMBERS Members of the Governing bodies and management BOD REPORT FINANCIALS SUSTAINABILITY INDICES Chair Debuty Chair Julie Sonne Pekka Morén Ole Hovland Merle Wilkinson DENMARK FINLAND NORWAY ESTONIA Head of Division, Ministry of Industry, Director, Ministry of Finance Special Adviser, Ministry of Finance Government finance expert Business and Financial Affairs Appointed: 2016 Appointed: 2019 Appointed: 2017 Appointed: 2016 Attended meetings in 2023: 9 Attended meetings in 2023: 10 Attended meetings in 2023:10 Attended meetings in 2023: 9 Alternate Alternate Alternate Alternate Petri Peltonen Kristin Langeland Ervik Märten Ross Helle Dam-Sørensen Under-Secretary of State, Chief Specialist, Ministry of Finance Adviser on International Relations, Chief Special Advisor, Ministry of Economic Affairs Ministry of Finance Ministry of Industry, and Employment Business and Financial Affairs
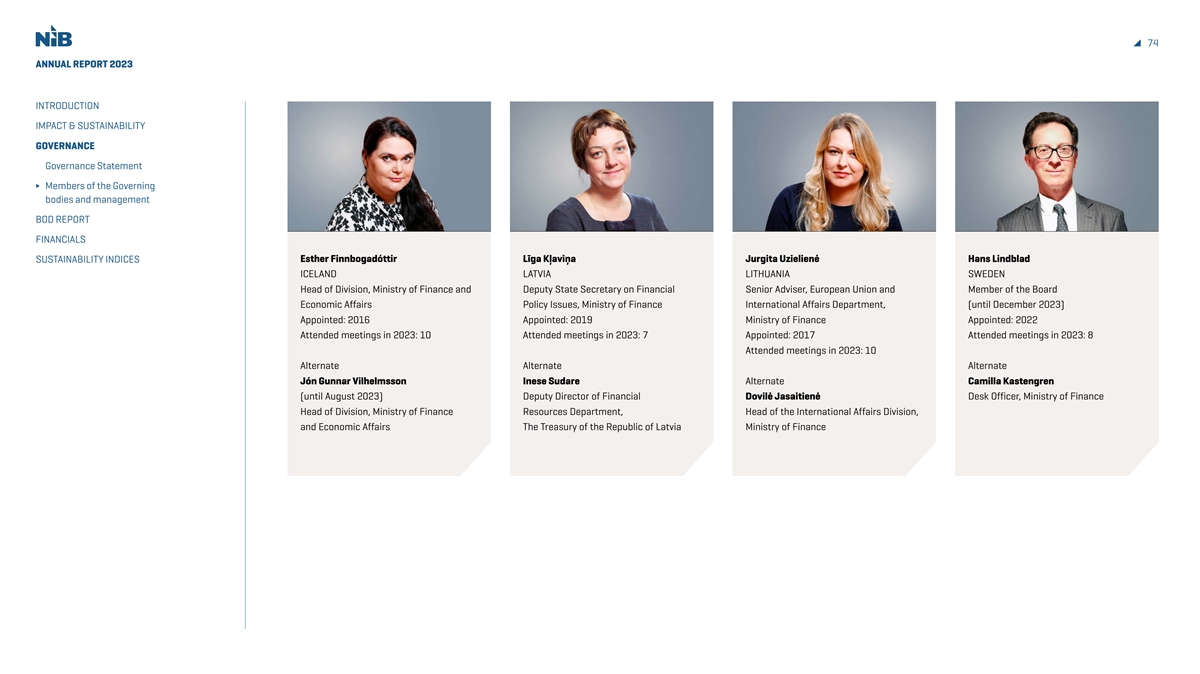
74 ANNUAL REPORT 2023 INTRODUCTION IMPACT & SUSTAINABILITY GOVERNANCE Governance Statement Members of the Governing bodies and management BOD REPORT FINANCIALS Esther Finnbogadóttir Līga Kļaviņa Jurgita Uzielienė Hans Lindblad SUSTAINABILITY INDICES ICELAND LATVIA LITHUANIA SWEDEN Head of Division, Ministry of Finance and Deputy State Secretary on Financial Senior Adviser, European Union and Member of the Board Economic Affairs Policy Issues, Ministry of Finance International Affairs Department, (until December 2023) Appointed: 2016 Appointed: 2019 Ministry of Finance Appointed: 2022 Attended meetings in 2023: 10 Attended meetings in 2023: 7 Appointed: 2017 Attended meetings in 2023: 8 Attended meetings in 2023: 10 Alternate Alternate Alternate Jón Gunnar Vilhelmsson Inese Sudare Alternate Camilla Kastengren (until August 2023) Deputy Director of Financial Dovilė Jasaitienė Desk Officer, Ministry of Finance Head of Division, Ministry of Finance Resources Department, Head of the International Affairs Division, and Economic Affairs The Treasury of the Republic of Latvia Ministry of Finance
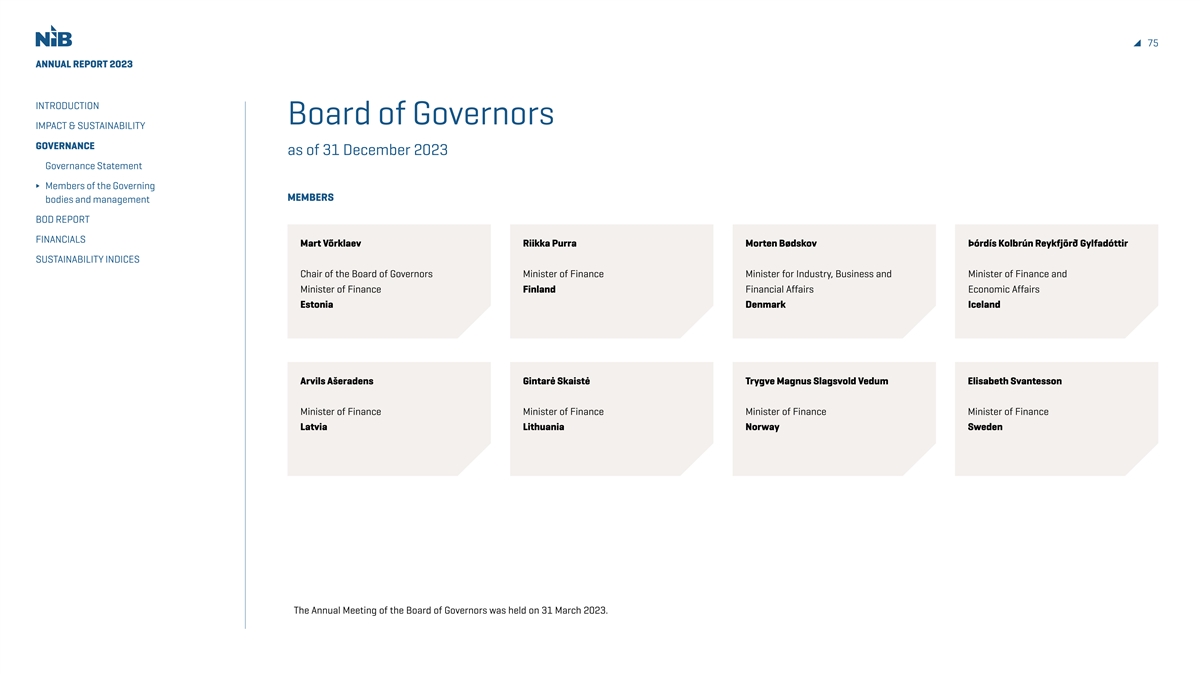
75 ANNUAL REPORT 2023 INTRODUCTION Board of Governors IMPACT & SUSTAINABILITY GOVERNANCE as of 31 December 2023 Governance Statement Members of the Governing MEMBERS bodies and management BOD REPORT FINANCIALS Mart Võrklaev Riikka Purra Morten Bødskov Þórdís Kolbrún Reykfjörð Gylfadóttir SUSTAINABILITY INDICES Chair of the Board of Governors Minister of Finance Minister for Industry, Business and Minister of Finance and Minister of Finance Finland Financial Affairs Economic Affairs Estonia Denmark Iceland Arvils Ašeradens Gintarė Skaistė Trygve Magnus Slagsvold Vedum Elisabeth Svantesson Minister of Finance Minister of Finance Minister of Finance Minister of Finance Latvia Lithuania Norway Sweden The Annual Meeting of the Board of Governors was held on 31 March 2023.
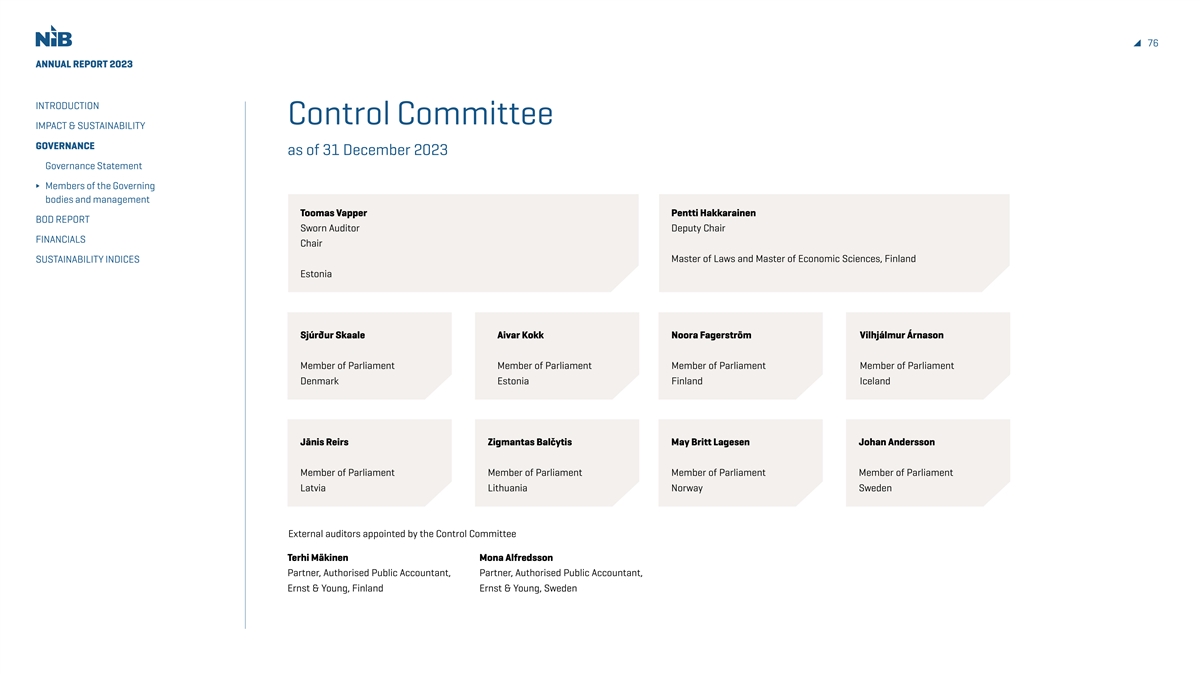
76 ANNUAL REPORT 2023 INTRODUCTION Control Committee IMPACT & SUSTAINABILITY GOVERNANCE as of 31 December 2023 Governance Statement Members of the Governing bodies and management Toomas Vapper Pentti Hakkarainen BOD REPORT Sworn Auditor Deputy Chair FINANCIALS Chair Master of Laws and Master of Economic Sciences, Finland SUSTAINABILITY INDICES Estonia Sjúrður Skaale Aivar Kokk Noora Fagerström Vilhjálmur Árnason Member of Parliament Member of Parliament Member of Parliament Member of Parliament Denmark Estonia Finland Iceland Jānis Reirs Zigmantas Balčytis May Britt Lagesen Johan Andersson Member of Parliament Member of Parliament Member of Parliament Member of Parliament Latvia Lithuania Norway Sweden External auditors appointed by the Control Committee Terhi Mäkinen Mona Alfredsson Partner, Authorised Public Accountant, Partner, Authorised Public Accountant, Ernst & Young, Finland Ernst & Young, Sweden
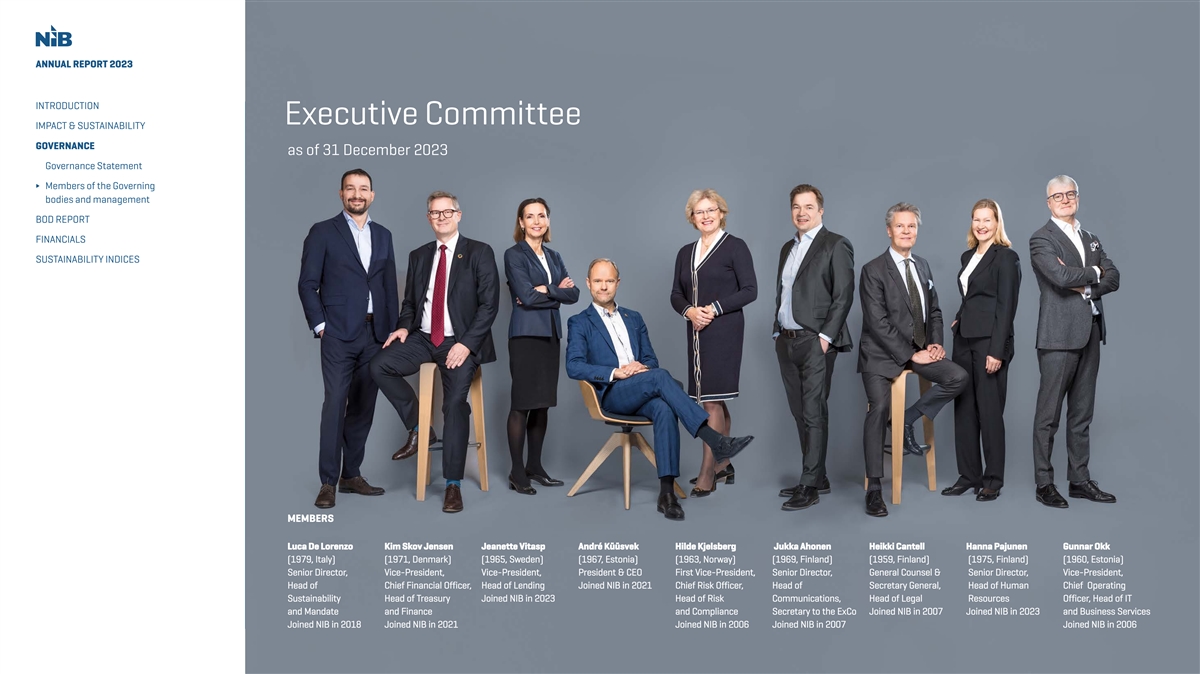
ANNUAL REPORT 2023 INTRODUCTION Executive Committee IMPACT & SUSTAINABILITY GOVERNANCE as of 31 December 2023 Governance Statement Members of the Governing bodies and management BOD REPORT FINANCIALS SUSTAINABILITY INDICES MEMBERS Luca De L Luca De Lorenz orenzo o Kim Sk Kim Sko ov Jensen v Jensen Jeanett Jeanette Vitasp e Vitasp André K André Küüsv üüsvek ek Hilde Kjelsberg Hilde Kjelsberg Jukk Jukka Ahonen a Ahonen Heikki Cant Heikki Cantell ell Hanna P Hanna Pajunen ajunen Gunnar Okk Gunnar Okk (1979, Italy) (1979, Italy) (1971, Denmark) (1971, Denmark) (1965, S (1965, Sw weden) eden) (1967 (1967, E , Est stonia) onia) (1963, Nor (1963, Norw way) ay) (1969, Finland) (1969, Finland) (1959, Finland) (1959, Finland) (1975, Finland) (1975, Finland) (1960, E (1960, Est stonia) onia) Senior Direct Senior Director or, , Vice-P Vice-President, resident, Vice-P Vice-President, resident, P President & CEO resident & CEO Fir First Vice-P st Vice-President, resident, Senior Direct Senior Director or, , General Counsel & General Counsel & Senior Direct Senior Director or, , Vice-P Vice-President, resident, Head of Head of Chief Financial Officer Chief Financial Officer, , Head of L Head of Lending ending Joined NIB in 2021 Joined NIB in 2021 Chief Risk Officer Chief Risk Officer, , Head of Head of Secretar Secretary General, y General, Head of Human Head of Human Chief Operating Chief Operating S Sustainability ustainability Head of T Head of Treasur reasury y Joined NIB in 2023 Joined NIB in 2023 Head of Risk Head of Risk ComComm m uniunications, cations, Head of L Head of Legal egal R Resources esources Officer Officer, Head of IT , Head of IT and Mandat and Mandate e and Finance and Finance and Compliance and Compliance Secretar Secretary t y to the E o the ExCo xCo Joined NIB in 2007 Joined NIB in 2007 Joined NIB in 2023 Joined NIB in 2023 and Business Ser and Business Services vices Joined NIB in 2018 Joined NIB in 2018 Joined NIB in 2021 Joined NIB in 2021 Joined NIB in 2006 Joined NIB in 2006 Joined NIB in 2007 Joined NIB in 2007 Joined NIB in 2006 Joined NIB in 2006
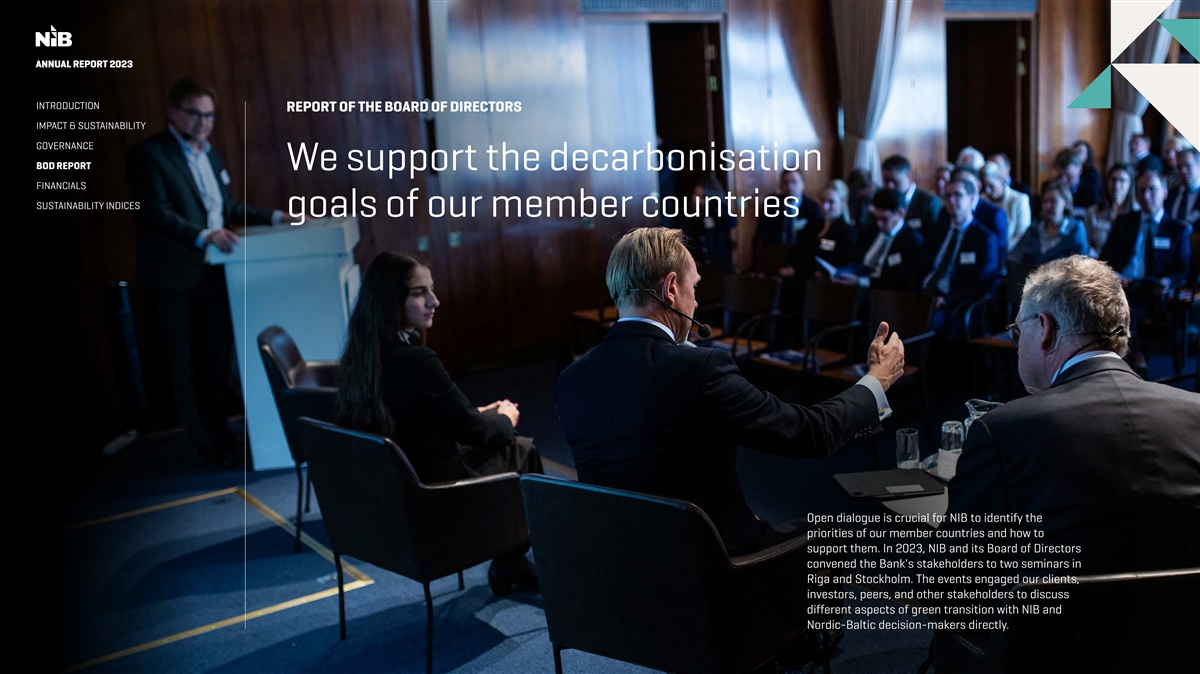
ANNU ANNUAL REPOR AL REPORT 2023 T 2023 INTRODUCTION REPORT OF THE BOARD OF DIRECTORS IMPACT & SUSTAINABILITY GOVERNANCE BOD REPORT We support the decarbonisation FINANCIALS SUSTAINABILITY INDICES goals of our member countries Open dialogue is crucial for NIB to identify the priorities of our member countries and how to support them. In 2023, NIB and its Board of Directors convened the Bank's stakeholders to two seminars in Riga and Stockholm. The events engaged our clients, investors, peers, and other stakeholders to discuss different aspects of green transition with NIB and Nordic-Baltic decision-makers directly.
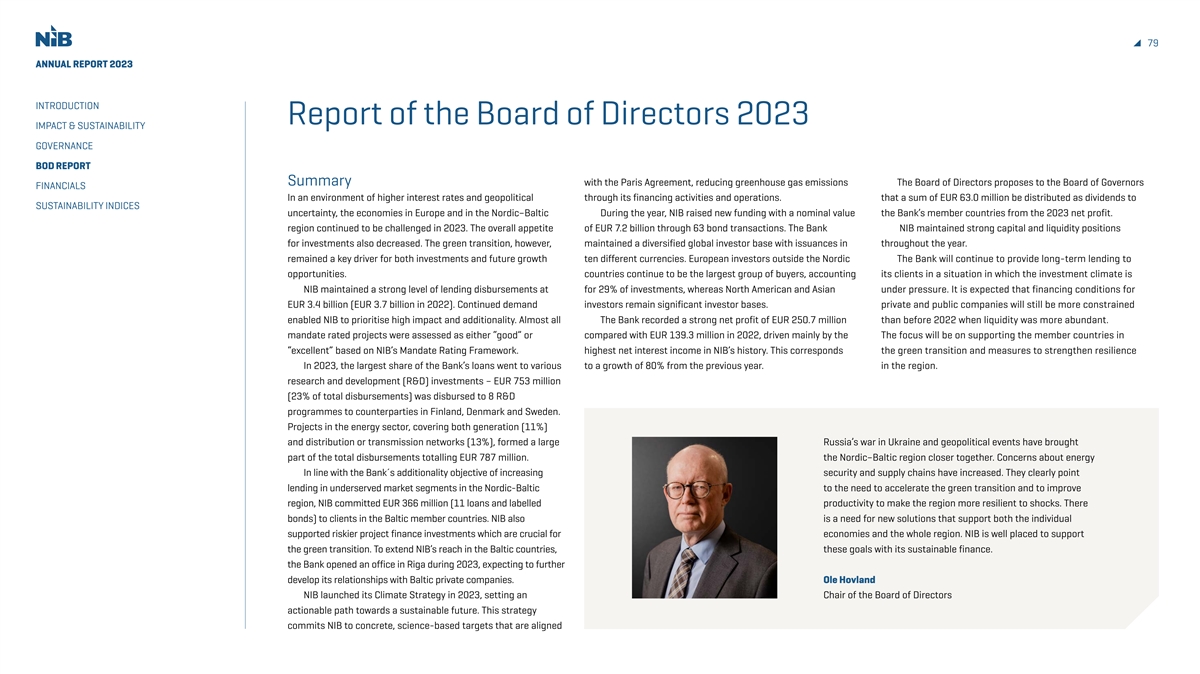
79 ANNUAL REPORT 2023 INTRODUCTION Report of the Board of Directors 2023 IMPACT & SUSTAINABILITY GOVERNANCE BOD REPORT Summary with the Paris Agreement, reducing greenhouse gas emissions The Board of Directors proposes to the Board of Governors FINANCIALS In an environment of higher interest rates and geopolitical through its financing activities and operations. that a sum of EUR 63.0 million be distributed as dividends to SUSTAINABILITY INDICES uncertainty, the economies in Europe and in the Nordic–Baltic During the year, NIB raised new funding with a nominal value the Bank’s member countries from the 2023 net profit. region continued to be challenged in 2023. The overall appetite of EUR 7.2 billion through 63 bond transactions. The Bank NIB maintained strong capital and liquidity positions for investments also decreased. The green transition, however, maintained a diversified global investor base with issuances in throughout the year. remained a key driver for both investments and future growth ten different currencies. European investors outside the Nordic The Bank will continue to provide long-term lending to opportunities. countries continue to be the largest group of buyers, accounting its clients in a situation in which the investment climate is NIB maintained a strong level of lending disbursements at for 29% of investments, whereas North American and Asian under pressure. It is expected that financing conditions for EUR 3.4 billion (EUR 3.7 billion in 2022). Continued demand investors remain significant investor bases. private and public companies will still be more constrained enabled NIB to prioritise high impact and additionality. Almost all The Bank recorded a strong net profit of EUR 250.7 million than before 2022 when liquidity was more abundant. mandate rated projects were assessed as either “good” or compared with EUR 139.3 million in 2022, driven mainly by the The focus will be on supporting the member countries in “excellent” based on NIB’s Mandate Rating Framework. highest net interest income in NIB’s history. This corresponds the green transition and measures to strengthen resilience In 2023, the largest share of the Bank’s loans went to various to a growth of 80% from the previous year. in the region. research and development (R&D) investments – EUR 753 million (23% of total disbursements) was disbursed to 8 R&D programmes to counterparties in Finland, Denmark and Sweden. Projects in the energy sector, covering both generation (11%) and distribution or transmission networks (13%), formed a large Russia’s war in Ukraine and geopolitical events have brought part of the total disbursements totalling EUR 787 million. the Nordic–Baltic region closer together. Concerns about energy In line with the Bank´s additionality objective of increasing security and supply chains have increased. They clearly point lending in underserved market segments in the Nordic-Baltic to the need to accelerate the green transition and to improve region, NIB committed EUR 366 million (11 loans and labelled productivity to make the region more resilient to shocks. There bonds) to clients in the Baltic member countries. NIB also is a need for new solutions that support both the individual supported riskier project finance investments which are crucial for economies and the whole region. NIB is well placed to support the green transition. To extend NIB’s reach in the Baltic countries, these goals with its sustainable finance. the Bank opened an office in Riga during 2023, expecting to further develop its relationships with Baltic private companies. Ole Hovland NIB launched its Climate Strategy in 2023, setting an Chair of the Board of Directors actionable path towards a sustainable future. This strategy commits NIB to concrete, science-based targets that are aligned
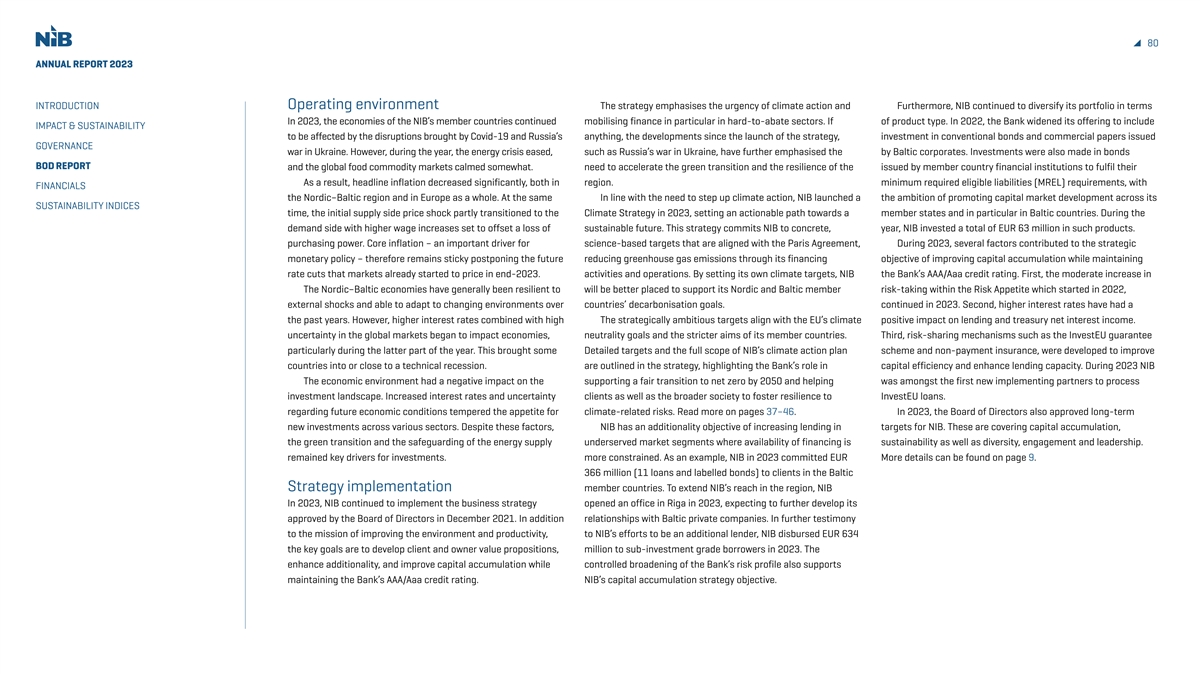
80 ANNUAL REPORT 2023 INTRODUCTION Operating environment The strategy emphasises the urgency of climate action and Furthermore, NIB continued to diversify its portfolio in terms In 2023, the economies of the NIB’s member countries continued mobilising finance in particular in hard-to-abate sectors. If of product type. In 2022, the Bank widened its offering to include IMPACT & SUSTAINABILITY to be affected by the disruptions brought by Covid-19 and Russia’s anything, the developments since the launch of the strategy, investment in conventional bonds and commercial papers issued GOVERNANCE war in Ukraine. However, during the year, the energy crisis eased, such as Russia’s war in Ukraine, have further emphasised the by Baltic corporates. Investments were also made in bonds BOD REPORT and the global food commodity markets calmed somewhat. need to accelerate the green transition and the resilience of the issued by member country financial institutions to fulfil their As a result, headline inflation decreased significantly, both in region. minimum required eligible liabilities (MREL) requirements, with FINANCIALS the Nordic–Baltic region and in Europe as a whole. At the same In line with the need to step up climate action, NIB launched a the ambition of promoting capital market development across its SUSTAINABILITY INDICES time, the initial supply side price shock partly transitioned to the Climate Strategy in 2023, setting an actionable path towards a member states and in particular in Baltic countries. During the demand side with higher wage increases set to offset a loss of sustainable future. This strategy commits NIB to concrete, year, NIB invested a total of EUR 63 million in such products. purchasing power. Core inflation – an important driver for science-based targets that are aligned with the Paris Agreement, During 2023, several factors contributed to the strategic monetary policy – therefore remains sticky postponing the future reducing greenhouse gas emissions through its financing objective of improving capital accumulation while maintaining rate cuts that markets already started to price in end-2023. activities and operations. By setting its own climate targets, NIB the Bank’s AAA/Aaa credit rating. First, the moderate increase in The Nordic–Baltic economies have generally been resilient to will be better placed to support its Nordic and Baltic member risk-taking within the Risk Appetite which started in 2022, external shocks and able to adapt to changing environments over countries’ decarbonisation goals. continued in 2023. Second, higher interest rates have had a the past years. However, higher interest rates combined with high The strategically ambitious targets align with the EU’s climate positive impact on lending and treasury net interest income. uncertainty in the global markets began to impact economies, neutrality goals and the stricter aims of its member countries. Third, risk-sharing mechanisms such as the InvestEU guarantee particularly during the latter part of the year. This brought some Detailed targets and the full scope of NIB’s climate action plan scheme and non-payment insurance, were developed to improve countries into or close to a technical recession. are outlined in the strategy, highlighting the Bank’s role in capital efficiency and enhance lending capacity. During 2023 NIB The economic environment had a negative impact on the supporting a fair transition to net zero by 2050 and helping was amongst the first new implementing partners to process investment landscape. Increased interest rates and uncertainty clients as well as the broader society to foster resilience to InvestEU loans. regarding future economic conditions tempered the appetite for climate-related risks. Read more on pages 37–46. In 2023, the Board of Directors also approved long-term new investments across various sectors. Despite these factors, NIB has an additionality objective of increasing lending in targets for NIB. These are covering capital accumulation, the green transition and the safeguarding of the energy supply underserved market segments where availability of financing is sustainability as well as diversity, engagement and leadership. remained key drivers for investments. more constrained. As an example, NIB in 2023 committed EUR More details can be found on page 9. 366 million (11 loans and labelled bonds) to clients in the Baltic Strategy implementation member countries. To extend NIB’s reach in the region, NIB In 2023, NIB continued to implement the business strategy opened an office in Riga in 2023, expecting to further develop its approved by the Board of Directors in December 2021. In addition relationships with Baltic private companies. In further testimony to the mission of improving the environment and productivity, to NIB’s efforts to be an additional lender, NIB disbursed EUR 634 the key goals are to develop client and owner value propositions, million to sub-investment grade borrowers in 2023. The enhance additionality, and improve capital accumulation while controlled broadening of the Bank’s risk profile also supports maintaining the Bank’s AAA/Aaa credit rating. NIB’s capital accumulation strategy objective.
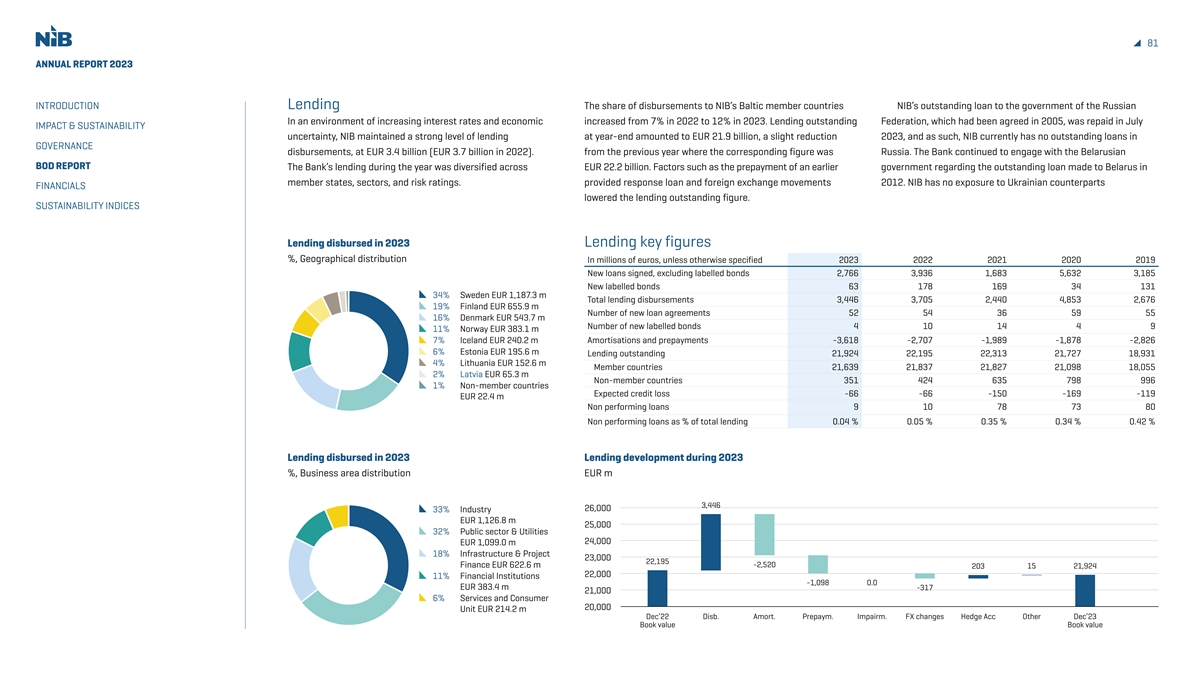
81 ANNUAL REPORT 2023 INTRODUCTION Lending The share of disbursements to NIB’s Baltic member countries NIB’s outstanding loan to the government of the Russian In an environment of increasing interest rates and economic increased from 7% in 2022 to 12% in 2023. Lending outstanding Federation, which had been agreed in 2005, was repaid in July IMPACT & SUSTAINABILITY uncertainty, NIB maintained a strong level of lending at year-end amounted to EUR 21.9 billion, a slight reduction 2023, and as such, NIB currently has no outstanding loans in GOVERNANCE disbursements, at EUR 3.4 billion (EUR 3.7 billion in 2022). from the previous year where the corresponding figure was Russia. The Bank continued to engage with the Belarusian BOD REPORT The Bank’s lending during the year was diversified across EUR 22.2 billion. Factors such as the prepayment of an earlier government regarding the outstanding loan made to Belarus in member states, sectors, and risk ratings. provided response loan and foreign exchange movements 2012. NIB has no exposure to Ukrainian counterparts FINANCIALS lowered the lending outstanding figure. SUSTAINABILITY INDICES Lending disbursed in 2023 Lending key figures %, Geographical distribution In millions of euros, unless otherwise specified 2023 2022 2021 2020 2019 New loans signed, excluding labelled bonds 2,766 3,936 1,683 5,632 3,185 New labelled bonds 63 178 169 34 131 34% Sweden EUR 1,187.3 m Total lending disbursements 3,446 3,705 2,440 4,853 2,676 19% Finland EUR 655.9 m Number of new loan agreements 52 54 36 59 55 16% Denmark EUR 543.7 m Number of new labelled bonds 4 10 14 4 9 11% Norway EUR 383.1 m 7% Iceland EUR 240.2 m Amortisations and prepayments -3,618 -2,707 -1,989 -1,878 -2,826 6% Estonia EUR 195.6 m Lending outstanding 21,924 22,195 22,313 21,727 18,931 4% Lithuania EUR 152.6 m Member countries 21,639 21,837 21,827 21,098 18,055 2% Latvia EUR 65.3 m Non-member countries 351 424 635 798 996 1% Non-member countries Expected credit loss -66 -66 -150 -169 -119 EUR 22.4 m Non performing loans 9 10 78 73 80 Non performing loans as % of total lending 0.04 % 0.05 % 0.35 % 0.34 % 0.42 % Lending disbursed in 2023 Lending development during 2023 %, Business area distribution EUR m 3,446 26,000 33% Industry EUR 1,126.8 m 25,000 32% Public sector & Utilities 24,000 EUR 1,099.0 m 18% Infrastructure & Project 23,000 22,195 Finance EUR 622.6 m -2,520 203 15 21,924 22,000 11% Financial Institutions -1,098 0.0 EUR 383.4 m -317 21,000 6% Services and Consumer 20,000 Unit EUR 214.2 m Dec’22 Disb. Amort. Prepaym. Impairm. FX changes Hedge Acc Other Dec’23 Book value Book value
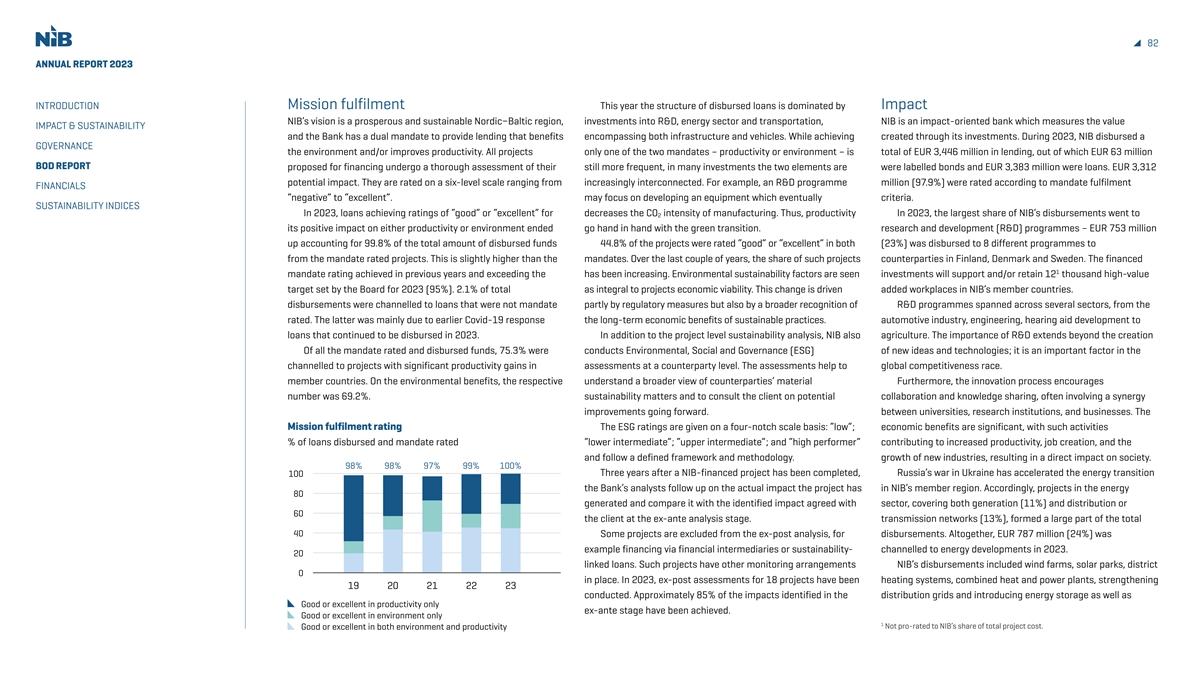
82 ANNUAL REPORT 2023 INTRODUCTION Mission fulfilment This year the structure of disbursed loans is dominated by Impact NIB’s vision is a prosperous and sustainable Nordic−Baltic region, investments into R&D, energy sector and transportation, NIB is an impact-oriented bank which measures the value IMPACT & SUSTAINABILITY and the Bank has a dual mandate to provide lending that benefits encompassing both infrastructure and vehicles. While achieving created through its investments. During 2023, NIB disbursed a GOVERNANCE the environment and/or improves productivity. All projects only one of the two mandates – productivity or environment – is total of EUR 3,446 million in lending, out of which EUR 63 million BOD REPORT proposed for financing undergo a thorough assessment of their still more frequent, in many investments the two elements are were labelled bonds and EUR 3,383 million were loans. EUR 3,312 potential impact. They are rated on a six-level scale ranging from increasingly interconnected. For example, an R&D programme million (97.9%) were rated according to mandate fulfilment FINANCIALS “negative” to “excellent”. may focus on developing an equipment which eventually criteria. SUSTAINABILITY INDICES In 2023, loans achieving ratings of “good” or “excellent” for decreases the CO intensity of manufacturing. Thus, productivity In 2023, the largest share of NIB’s disbursements went to 2 its positive impact on either productivity or environment ended go hand in hand with the green transition. research and development (R&D) programmes – EUR 753 million up accounting for 99.8% of the total amount of disbursed funds 44.8% of the projects were rated “good” or “excellent” in both (23%) was disbursed to 8 different programmes to from the mandate rated projects. This is slightly higher than the mandates. Over the last couple of years, the share of such projects counterparties in Finland, Denmark and Sweden. The financed 1 mandate rating achieved in previous years and exceeding the has been increasing. Environmental sustainability factors are seen investments will support and/or retain 12 thousand high-value target set by the Board for 2023 (95%). 2.1% of total as integral to projects economic viability. This change is driven added workplaces in NIB’s member countries. disbursements were channelled to loans that were not mandate partly by regulatory measures but also by a broader recognition of R&D programmes spanned across several sectors, from the rated. The latter was mainly due to earlier Covid-19 response the long-term economic benefits of sustainable practices. automotive industry, engineering, hearing aid development to loans that continued to be disbursed in 2023. In addition to the project level sustainability analysis, NIB also agriculture. The importance of R&D extends beyond the creation Of all the mandate rated and disbursed funds, 75.3% were conducts Environmental, Social and Governance (ESG) of new ideas and technologies; it is an important factor in the channelled to projects with significant productivity gains in assessments at a counterparty level. The assessments help to global competitiveness race. member countries. On the environmental benefits, the respective understand a broader view of counterparties’ material Furthermore, the innovation process encourages number was 69.2%. sustainability matters and to consult the client on potential collaboration and knowledge sharing, often involving a synergy improvements going forward. between universities, research institutions, and businesses. The Mission fulfilment rating The ESG ratings are given on a four-notch scale basis: “low”; economic benefits are significant, with such activities % of loans disbursed and mandate rated “lower intermediate”; “upper intermediate”; and “high performer” contributing to increased productivity, job creation, and the and follow a defined framework and methodology. growth of new industries, resulting in a direct impact on society. 98% 98% 97% 99% 100% Three years after a NIB-financed project has been completed, Russia’s war in Ukraine has accelerated the energy transition 100 the Bank’s analysts follow up on the actual impact the project has in NIB’s member region. Accordingly, projects in the energy 80 generated and compare it with the identified impact agreed with sector, covering both generation (11%) and distribution or 60 the client at the ex-ante analysis stage. transmission networks (13%), formed a large part of the total 40 Some projects are excluded from the ex-post analysis, for disbursements. Altogether, EUR 787 million (24%) was example financing via financial intermediaries or sustainability- channelled to energy developments in 2023. 20 linked loans. Such projects have other monitoring arrangements NIB’s disbursements included wind farms, solar parks, district 0 in place. In 2023, ex-post assessments for 18 projects have been heating systems, combined heat and power plants, strengthening 19 20 21 22 23 conducted. Approximately 85% of the impacts identified in the distribution grids and introducing energy storage as well as Good or excellent in productivity only ex-ante stage have been achieved. Good or e xcellent in environment only 1 Not pro-rated to NIB’s share of total project cost. Good or excellent in both environment and productivity
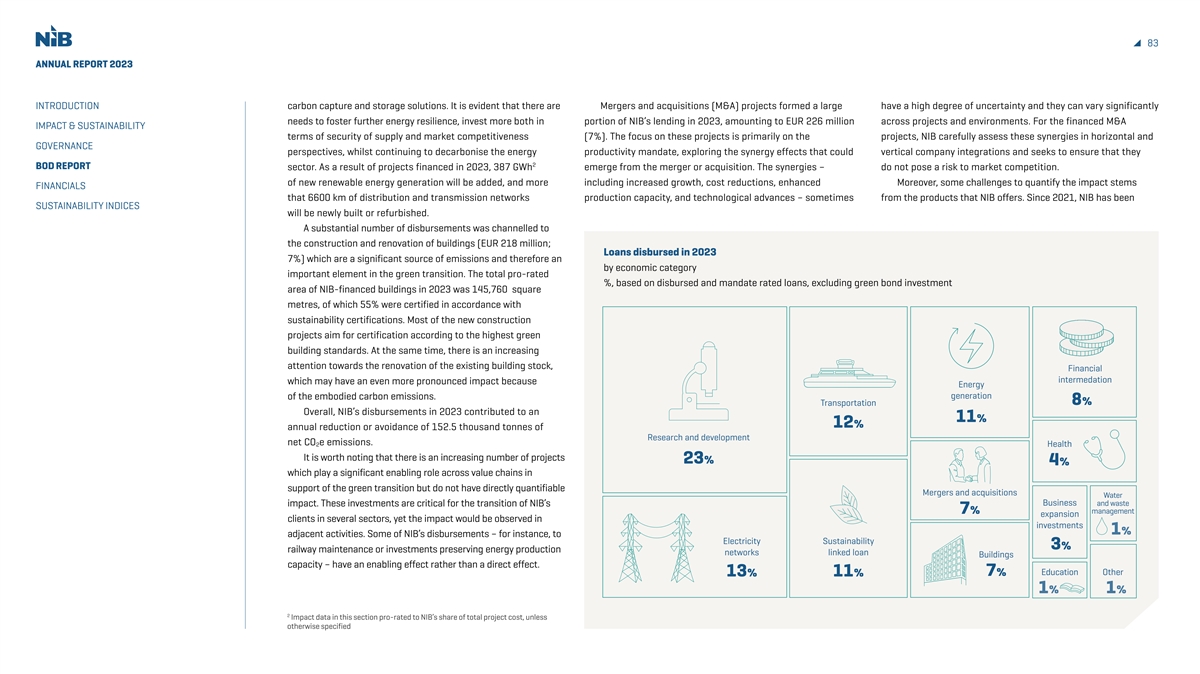
83 ANNUAL REPORT 2023 INTRODUCTION carbon capture and storage solutions. It is evident that there are Mergers and acquisitions (M&A) projects formed a large have a high degree of uncertainty and they can vary significantly needs to foster further energy resilience, invest more both in portion of NIB’s lending in 2023, amounting to EUR 226 million across projects and environments. For the financed M&A IMPACT & SUSTAINABILITY terms of security of supply and market competitiveness (7%). The focus on these projects is primarily on the projects, NIB carefully assess these synergies in horizontal and GOVERNANCE perspectives, whilst continuing to decarbonise the energy productivity mandate, exploring the synergy effects that could vertical company integrations and seeks to ensure that they 2 BOD REPORT sector. As a result of projects financed in 2023, 387 GWh emerge from the merger or acquisition. The synergies – do not pose a risk to market competition. of new renewable energy generation will be added, and more including increased growth, cost reductions, enhanced Moreover, some challenges to quantify the impact stems FINANCIALS that 6600 km of distribution and transmission networks production capacity, and technological advances – sometimes from the products that NIB offers. Since 2021, NIB has been SUSTAINABILITY INDICES will be newly built or refurbished. A substantial number of disbursements was channelled to the construction and renovation of buildings (EUR 218 million; Loans disbursed in 2023 7%) which are a significant source of emissions and therefore an by economic category important element in the green transition. The total pro-rated %, based on disbursed and mandate rated loans, excluding green bond investment area of NIB-financed buildings in 2023 was 145,760 square metres, of which 55% were certified in accordance with sustainability certifications. Most of the new construction projects aim for certification according to the highest green building standards. At the same time, there is an increasing attention towards the renovation of the existing building stock, Financial intermedation which may have an even more pronounced impact because Energy generation of the embodied carbon emissions. Transportation 8% Overall, NIB’s disbursements in 2023 contributed to an 11% 12% annual reduction or avoidance of 152.5 thousand tonnes of Research and development net CO e emissions. 2 Health It is worth noting that there is an increasing number of projects 23% 4% which play a significant enabling role across value chains in support of the green transition but do not have directly quantifiable Mergers and acquisitions Water Business impact. These investments are critical for the transition of NIB’s and waste 7% management expansion clients in several sectors, yet the impact would be observed in investments 1% adjacent activities. Some of NIB’s disbursements – for instance, to Electricity Sustainability 3% railway maintenance or investments preserving energy production networks linked loan Buildings capacity – have an enabling effect rather than a direct effect. 7% Education Other 13% 11% 1% 1% 1% 2 Impact data in this section pro-rated to NIB’s share of total project cost, unless otherwise specified

84 ANNUAL REPORT 2023 INTRODUCTION providing sustainability-linked loans (SLLs). While these loans Value chain approach decisions to be taken. In 2023, these initiatives were strengthened have clearly identified key performance indicators and expected A true sustainability transition requires the pivoting of entire value by the Taskforce on Nature-related Financial Disclosures (TNFD) IMPACT & SUSTAINABILITY outcomes, they are not tied to any specific impact at a project level. chains that form the backbone of current and future economies recommendations for financial institutions and Science Based GOVERNANCE For this reason, SLLs are evaluated on separate reporting where the Nordic countries have been pioneers for a long time. Targets Network (SBTN) guidance on target setting. BOD REPORT principles. In 2023, NIB disbursed EUR 368 million to SLLs, One example is the electrification of transport. The value chain NIB’s principles for biodiversity and nature protection are comprising 11% of total disbursed and mandate rated loans. contains electricity production from renewable sources, battery integrated in its Sustainability Policy. Biodiversity effects are FINANCIALS SLLs are suitable for companies that have strong strategic and storage facilities, strong grids and electric vehicle production considered in the project and counterparty assessments. SUSTAINABILITY INDICES goals for more sustainable production or business model and distribution. By separately evaluating and supporting different However, to further enhance its nature protection and resilience in particular in hard to abate sectors that currently are having a parts of a value chain, NIB strives to allocate capital across several efforts, NIB started to assess the nature-related impacts of its high intensity in their energy consumption and carbon footprint actors in any one sector. This way, the Bank is able to create a lending portfolio in 2023, considering the SBTN’s steps and products. Read more about SLLs on page 21. critical mass for transitions where clients in one industry will work recommendations. with another along the value chain to decarbonise. Sustainability Keeping frameworks up to date In order to increase the impact, NIB continues to create, Resilient and sustainable supply chains NIB constantly follows developments in sustainable finance, support and develop new initiatives to foster greener The last few years have also shown the need to strengthen including the progression of frameworks, references and investments. Despite the short-term challenges the world the understanding along supply chains for resilience as well reporting standards. During 2023, the Bank has integrated new is facing, there is a need to maintain speed and action in the as the environmental and social impact. Increased scrutiny, sectorial topics into its mandate analysis and strengthened ESG long-term sustainability transition. transparency and accountability along supply chains is a regional screening requirements. Among other benefits, this expands ambition and a welcomed development. NIB is increasingly NIB’s approach in several previously unspecified sectors and is Launching climate strategy supporting that with its lending. Further, to strengthen the Bank’s better aligned with the EU Taxonomy. According to the World Meteorological Organization (WMO), approach on adverse environmental and social impacts during new temperature records have again been set in 2023, and the the loan assessment process, NIB has developed a supply chain Reporting and new standards number of extreme events continues to rise, underscoring the extended due diligence procedure. NIB continues to develop its sustainability data and reporting need for urgent climate action. As an international financial Extended due diligence is applied for key supply chains in and monitors developments around international reporting institution, NIB acknowledges its role in addressing regional specific sectors and/or sectors that are deemed to have a high risk standards. The Bank welcomes the new initiatives and the and global challenges. As mentioned above, NIB launched its of human rights violations, labour standards and/or environmental cooperation between Global Reporting Initiative (GRI), the Climate Strategy in 2023, setting an actionable path towards degradation. While such assessments have long been part of NIB’s International Sustainability Standards Board (ISSB), and the decarbonisation. Read more about the strategy here. counterparty assessment, the Bank has developed a common European Sustainability Reporting Standards (ESRS). Hard-to-abate sectors are associated with significant approach understanding such counterparty risk. Comparability of sustainability disclosures helps to direct emission levels and will require financing to develop and public and private finance where it is needed the most. In this deploy technologies for their transition and have defined Nature and biodiversity context, global initiatives introducing harmonised sustainability long-term targets in relation to that (e.g. for cement, aluminium The financial sector is continuously shifting beyond climate reporting standards (ISSB) that complement existing and steel). NIB will increase its engagement to support the change mitigation towards a broader approach on nature international financial reporting standards (IFRS) are crucial. transformation in these sectors. NIB’s lending products, such as protection. Progress in the traceability and accountability of sustainability-linked loans, will be key in this process. nature-related impacts is helping sound and nature-positive
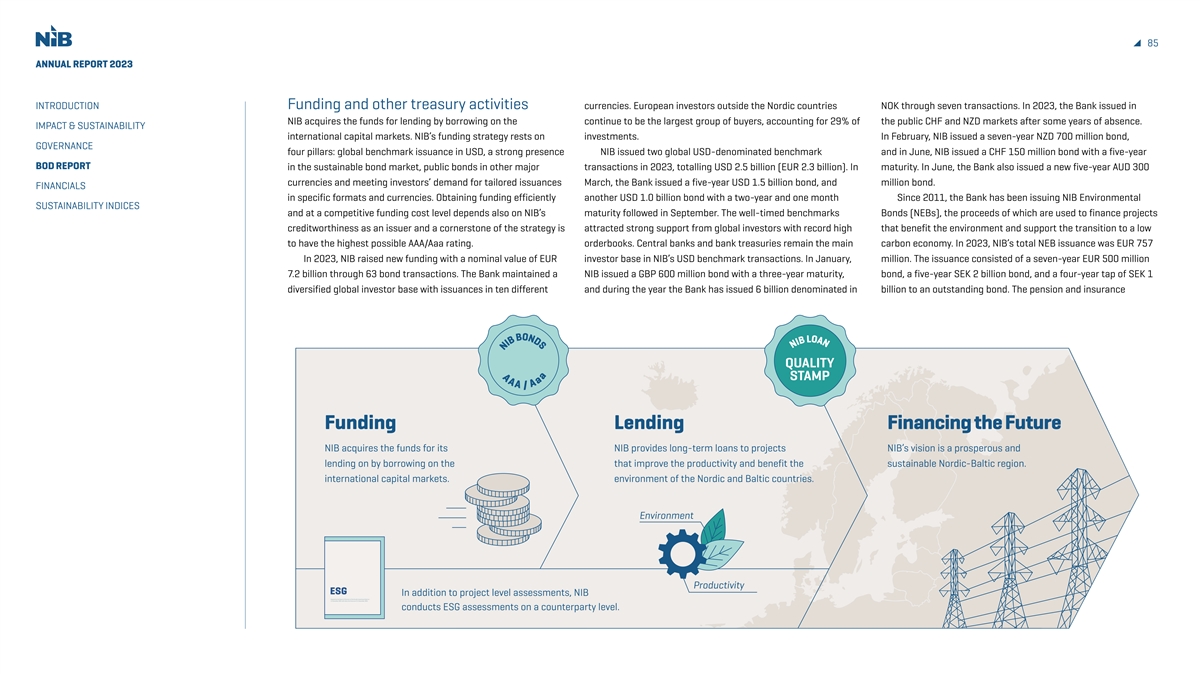
A S D N A N A A O O 85 ANNUAL REPORT 2023 INTRODUCTION Funding and other treasury activities currencies. European investors outside the Nordic countries NOK through seven transactions. In 2023, the Bank issued in NIB acquires the funds for lending by borrowing on the continue to be the largest group of buyers, accounting for 29% of the public CHF and NZD markets after some years of absence. IMPACT & SUSTAINABILITY international capital markets. NIB’s funding strategy rests on investments. In February, NIB issued a seven-year NZD 700 million bond, GOVERNANCE four pillars: global benchmark issuance in USD, a strong presence NIB issued two global USD-denominated benchmark and in June, NIB issued a CHF 150 million bond with a five-year BOD REPORT in the sustainable bond market, public bonds in other major transactions in 2023, totalling USD 2.5 billion (EUR 2.3 billion). In maturity. In June, the Bank also issued a new five-year AUD 300 currencies and meeting investors’ demand for tailored issuances March, the Bank issued a five-year USD 1.5 billion bond, and million bond. FINANCIALS in specific formats and currencies. Obtaining funding efficiently another USD 1.0 billion bond with a two-year and one month Since 2011, the Bank has been issuing NIB Environmental SUSTAINABILITY INDICES and at a competitive funding cost level depends also on NIB’s maturity followed in September. The well-timed benchmarks Bonds (NEBs), the proceeds of which are used to finance projects creditworthiness as an issuer and a cornerstone of the strategy is attracted strong support from global investors with record high that benefit the environment and support the transition to a low to have the highest possible AAA/Aaa rating. orderbooks. Central banks and bank treasuries remain the main carbon economy. In 2023, NIB’s total NEB issuance was EUR 757 In 2023, NIB raised new funding with a nominal value of EUR investor base in NIB’s USD benchmark transactions. In January, million. The issuance consisted of a seven-year EUR 500 million 7.2 billion through 63 bond transactions. The Bank maintained a NIB issued a GBP 600 million bond with a three-year maturity, bond, a five-year SEK 2 billion bond, and a four-year tap of SEK 1 diversified global investor base with issuances in ten different and during the year the Bank has issued 6 billion denominated in billion to an outstanding bond. The pension and insurance Funding Lending Financing the Future NIB acquires the funds for its NIB provides long-term loans to projects NIB’s vision is a prosperous and lending on by borrowing on the that improve the productivity and benefit the sustainable Nordic-Baltic region. international capital markets. environment of the Nordic and Baltic countries. Environment Productivity ESG In addition to project level assessments, NIB Adopted by the Board of Directors of the Nordic Investment Bank on 11 November 2021 with entry into force as of 11 November 2021 conducts ESG assessments on a counterparty level. L / B B A I B N a I N a

86 ANNUAL REPORT 2023 INTRODUCTION companies and asset managers within the Nordic region and and USD against the euro. The impact in 2023 was that the significant hedge accounting adjustments as interest rates rose. Europe remain the largest buyer groups of NIB Environmental reported value in euro of the issued bonds on the balance sheet These hedge accounting adjustments offset the impact from the IMPACT & SUSTAINABILITY Bonds. in these currencies decreased, similar to the development on fair value changes of interest rate swaps that the Bank use to GOVERNANCE Total debts evidenced by certificates increased from EUR NIB’s lending assets in these currencies. The Bank also recorded hedge its interest rate risk. BOD REPORT 31.6 billion to EUR 32.2 billion. To manage its liquidity risk, NIB maintains a significant liquidity buffer, which amounted to EUR FINANCIALS 14.7 billion at year-end. Its size is determined by the Bank’s SUSTAINABILITY INDICES Debt development during 2023 twelve-month target for the survival horizon, which is the EUR m duration for which NIB can continue to fulfil all its payment obligations and continue normal business operations without obtaining any new funding, even in severely stressed market 40,000 conditions. 36,000 The Bank has a very strong liquidity position and the survival -130 -847 828 1 32,190 horizon at the end of 2023 was 461 days. The financial result 31,595 32,000 -6,408 from the liquidity bond portfolio was higher than in recent years 7,152 as the portfolio was well positioned to benefit from the increase 28,000 in market interest rates seen since 2022. 24,000 During the year, the Bank recorded foreign exchange Dec’22 New Issues Amort. Call & Buy FX changes Hedge Acc Other Dec’23 Book Book value backs value movements on the issued debt due to the weakening of SEK, NOK New borrowings in 2023 New borrowings in 2023 New borrowings in 2023 %, Geographical distribution %, Investor distribution %, Currency distribution 50 50 40 40 40 30 30 30 20 20 20 10 10 10 0 0 0 Europe Asia Japan Americas Nordics Oceania Africa & Banks Central banks Asset Pension & Retail & USD EUR SEK NOK GBP NZD HKD AUD DKK CNH CHF Other (excl. Nordic) (excl. Japan) Middle & Official managers Insurance Corporate East Institutions 2022 2022 2022 2023 2023 2023
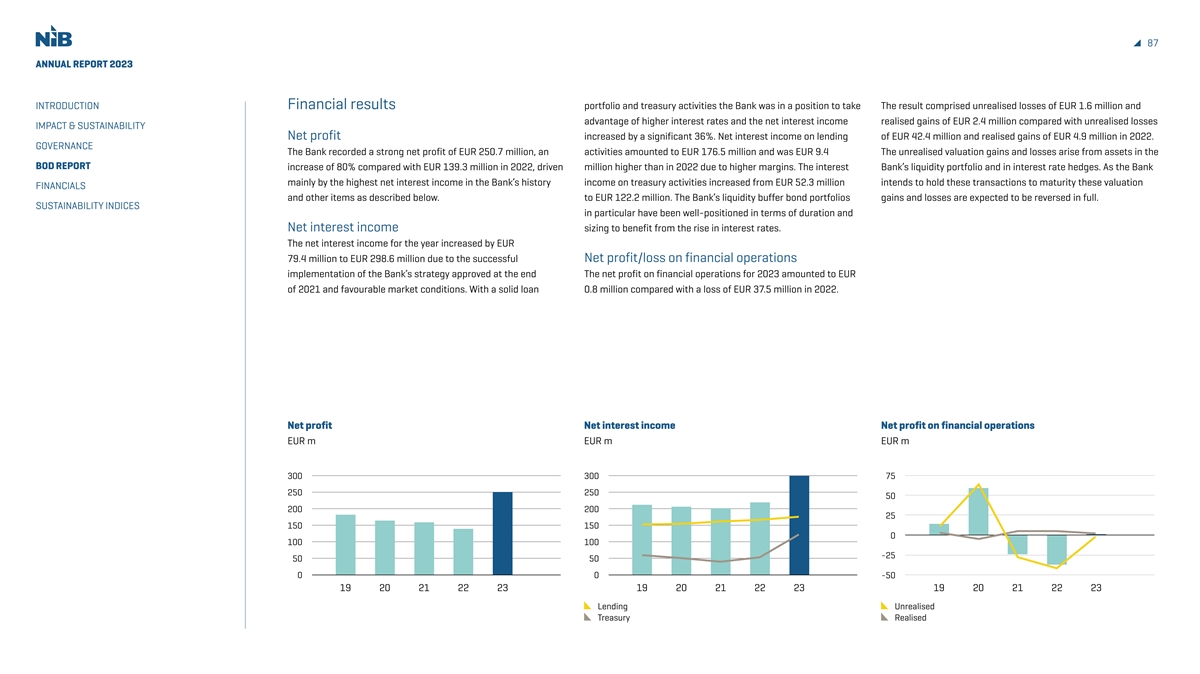
87 ANNUAL REPORT 2023 INTRODUCTION Financial results portfolio and treasury activities the Bank was in a position to take The result comprised unrealised losses of EUR 1.6 million and advantage of higher interest rates and the net interest income realised gains of EUR 2.4 million compared with unrealised losses IMPACT & SUSTAINABILITY Net profit increased by a significant 36%. Net interest income on lending of EUR 42.4 million and realised gains of EUR 4.9 million in 2022. GOVERNANCE The Bank recorded a strong net profit of EUR 250.7 million, an activities amounted to EUR 176.5 million and was EUR 9.4 The unrealised valuation gains and losses arise from assets in the BOD REPORT increase of 80% compared with EUR 139.3 million in 2022, driven million higher than in 2022 due to higher margins. The interest Bank’s liquidity portfolio and in interest rate hedges. As the Bank mainly by the highest net interest income in the Bank’s history income on treasury activities increased from EUR 52.3 million intends to hold these transactions to maturity these valuation FINANCIALS and other items as described below. to EUR 122.2 million. The Bank’s liquidity buffer bond portfolios gains and losses are expected to be reversed in full. SUSTAINABILITY INDICES in particular have been well-positioned in terms of duration and Net interest income sizing to benefit from the rise in interest rates. The net interest income for the year increased by EUR 79.4 million to EUR 298.6 million due to the successful Net profit/loss on financial operations implementation of the Bank’s strategy approved at the end The net profit on financial operations for 2023 amounted to EUR of 2021 and favourable market conditions. With a solid loan 0.8 million compared with a loss of EUR 37.5 million in 2022. Net profit Net interest income Net profit on financial operations EUR m EUR m EUR m 300 300 75 250 250 50 200 200 25 150 150 0 100 100 -25 50 50 0 0 -50 19 20 21 22 23 19 20 21 22 23 19 20 21 22 23 Lending Unrealised Treasury Realised
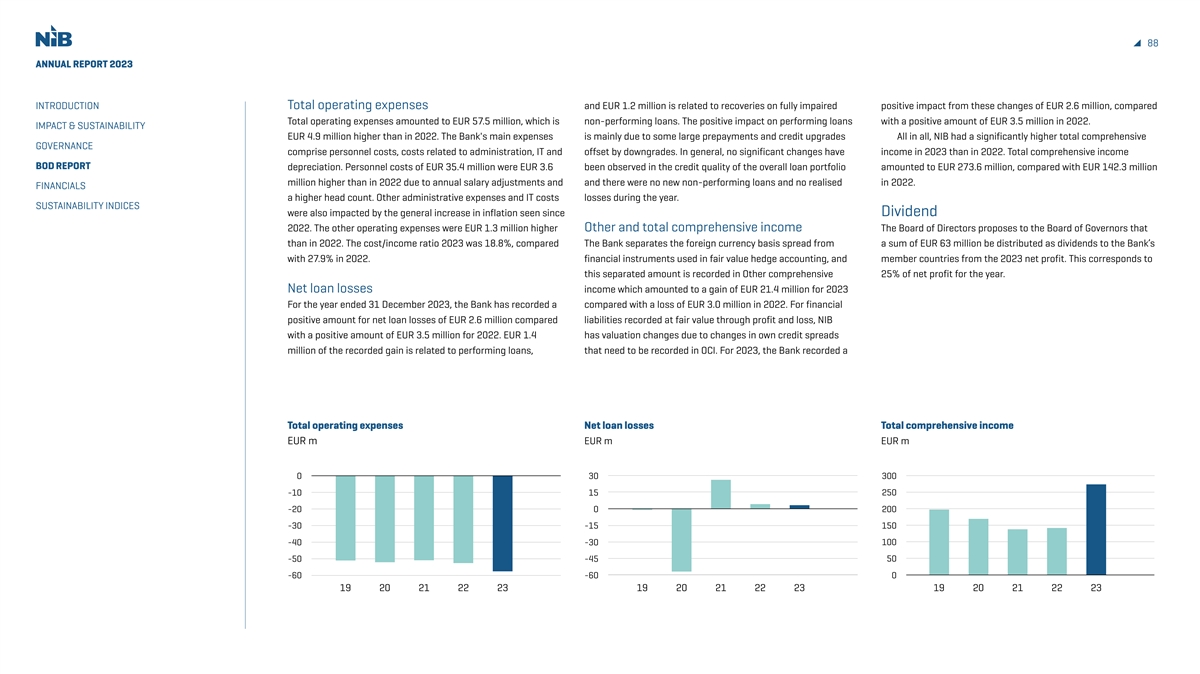
88 ANNUAL REPORT 2023 INTRODUCTION Total operating expenses and EUR 1.2 million is related to recoveries on fully impaired positive impact from these changes of EUR 2.6 million, compared Total operating expenses amounted to EUR 57.5 million, which is non-performing loans. The positive impact on performing loans with a positive amount of EUR 3.5 million in 2022. IMPACT & SUSTAINABILITY EUR 4.9 million higher than in 2022. The Bank's main expenses is mainly due to some large prepayments and credit upgrades All in all, NIB had a significantly higher total comprehensive GOVERNANCE comprise personnel costs, costs related to administration, IT and offset by downgrades. In general, no significant changes have income in 2023 than in 2022. Total comprehensive income BOD REPORT depreciation. Personnel costs of EUR 35.4 million were EUR 3.6 been observed in the credit quality of the overall loan portfolio amounted to EUR 273.6 million, compared with EUR 142.3 million million higher than in 2022 due to annual salary adjustments and and there were no new non-performing loans and no realised in 2022. FINANCIALS a higher head count. Other administrative expenses and IT costs losses during the year. SUSTAINABILITY INDICES were also impacted by the general increase in inflation seen since Dividend 2022. The other operating expenses were EUR 1.3 million higher Other and total comprehensive income The Board of Directors proposes to the Board of Governors that than in 2022. The cost/income ratio 2023 was 18.8%, compared The Bank separates the foreign currency basis spread from a sum of EUR 63 million be distributed as dividends to the Bank’s with 27.9% in 2022. financial instruments used in fair value hedge accounting, and member countries from the 2023 net profit. This corresponds to this separated amount is recorded in Other comprehensive 25% of net profit for the year. Net loan losses income which amounted to a gain of EUR 21.4 million for 2023 For the year ended 31 December 2023, the Bank has recorded a compared with a loss of EUR 3.0 million in 2022. For financial positive amount for net loan losses of EUR 2.6 million compared liabilities recorded at fair value through profit and loss, NIB with a positive amount of EUR 3.5 million for 2022. EUR 1.4 has valuation changes due to changes in own credit spreads million of the recorded gain is related to performing loans, that need to be recorded in OCI. For 2023, the Bank recorded a Total operating expenses Net loan losses Total comprehensive income EUR m EUR m EUR m 0 30 300 -10 15 250 -20 0 200 -30 -15 150 -40 -30 100 -50 -45 50 -60 -60 0 19 20 21 22 23 19 20 21 22 23 19 20 21 22 23

89 ANNUAL REPORT 2023 INTRODUCTION Risk and compliance remained solid. As of year-end 2023, 91% of the lending Capital and Liquidity Management set by the Board of Governors exposure was within the investment-grade category. further specify the Statutory requirements. IMPACT & SUSTAINABILITY Overview In terms of geographical distribution, 97% of the lending The key components of the Bank’s risk, capital and liquidity GOVERNANCE The Bank continued to develop its risk management framework exposure was to counterparties in the Bank’s member countries. management framework are the Risk Appetite Statement BOD REPORT in 2023. NIB follows sound banking principles, monitors As for the treasury portfolio, all exposure was within the (RAS), Risk Management Policy (RMP) and the Internal Capital international risk management regulations and standards and investment-grade category, with 90% within the best risk classes Adequacy Assessment Process (ICAAP). To monitor and FINANCIALS adopts those it identifies to be relevant to the nature of NIB’s (equivalent to ratings of AAA to AA-). In terms of market risk, the manage compliance with statutory requirements, the Board SUSTAINABILITY INDICES business model. Bank is mainly exposed to interest rate, credit spread and of Directors sets limits and monitoring thresholds in the RAS Among other developments, an enterprise-wide risk cross-currency basis risk via its treasury operations. The securely above the minima set by the Principles for Capital and taxonomy was clarified and adopted. Alongside the long-standing underlying risk levels (sensitivities in basis point value terms) Liquidity Management as well as those set out in the Bank’s risk pillar of financial risks, the taxonomy defines and categorises from the aforementioned market risk factors were at slightly management policies and Capital and Liquidity Recovery Plan. non-financial risks. The risk taxonomy is a key tool for supporting higher levels at year end 2023 than in the previous year. The The Bank uses its ICAAP to evaluate the amount of capital the identification, assessment, monitoring and reporting of risks increase was mostly driven by the growth of the held-to-maturity and liquidity needed to cover the risks it is or might be exposed and contributes to enhancing the Bank’s strong risk culture. bond portfolio. to. The ICAAP is conducted on an annual basis. An external Several key policies, codes of conduct, rules of procedure and review was carried out in connection with the ICAAP with a guidelines were updated during 2023 to ensure they remained Capital and liquidity management satisfactory result and without any material findings. The Bank effective and fit-for-purpose. Most modifications were targeted The Statutes require NIB to have adequate capital and liquidity maintains a sufficient amount of capital and liquidity to cover all towards management of non-financial risks, including system management in accordance with sound banking principles. The material risks and to ensure that operations can be continued and reporting developments to improve the monitoring of the Bank shall have in place sound and effective strategies for risk, without disruptions even in extremely adverse situations. operational risk profile. Managing financial risks nevertheless capital and liquidity assessments, which shall be conducted at Moreover, in accordance with Principle 3 of the Principles for remains as critical as ever, where improvements to data and least annually and reviewed regularly. The Bank’s capital and Capital and Liquidity Management, NIB has put contingency systems are continuously ongoing to ensure the Bank maintains liquidity management shall be based on assessed risks in its measures and procedures for capital, leverage and liquidity a reliable infrastructure to enable sound decision making and operations, supplemented by stress testing. The Principles for adequacy in place to safeguard its viability. robust risk management. NIB maintained strong capital and liquidity positions Risk-based (economic) capital throughout the year, despite the challenging macro-financial and TABLE 1. Statutory requirements and year-end values NIB uses an internal economic capital approach and validated geopolitical environment. Financial performance was strong risk models to calculate the risk-based capital requirements Statutory metric Minimum 2022 2023 compared with the previous years, driving an increase in the for credit risk, market risk and operational risk. The amount of 1 Risk-based (economic) 100%* 144% 154% capital headroom to EUR 890 million (from EUR 669 million), or economic capital reserved to cover these risks, also calibrated capital ratio 21% (from 17%) of adjusted common equity. Asset quality to preserve the highest possible (AAA/Aaa) credit rating, Leverage ratio 7.0% 10.8% 11.1% is defined as the minimum economic capital requirement. Leverage ratio with callable capital 20.0% 30.9% 30.9% Potential diversification benefits across the main risk categories 1 Liquidity survival horizon (days) 180 417 461 “Capital headroom” is defined as the available capital supply (adjusted common (credit, market, liquidity, and operational) are not applied. equity) minus capital demand, i.e. the internally assessed risk-based (economic) capital requirement for the current operations covering all identified material risks *The Board of Governors also requires the Board of Directors to observe a monitoring In addition to the minimum economic capital requirement, the Bank is exposed to (i.e., credit, market and operational risk, and buffers for threshold of 110% and the Bank is expected to operate at capital levels well above the macroprudential risks and stress test outcomes). monitoring threshold under normal circumstances. the Bank maintains macroprudential capital buffers and
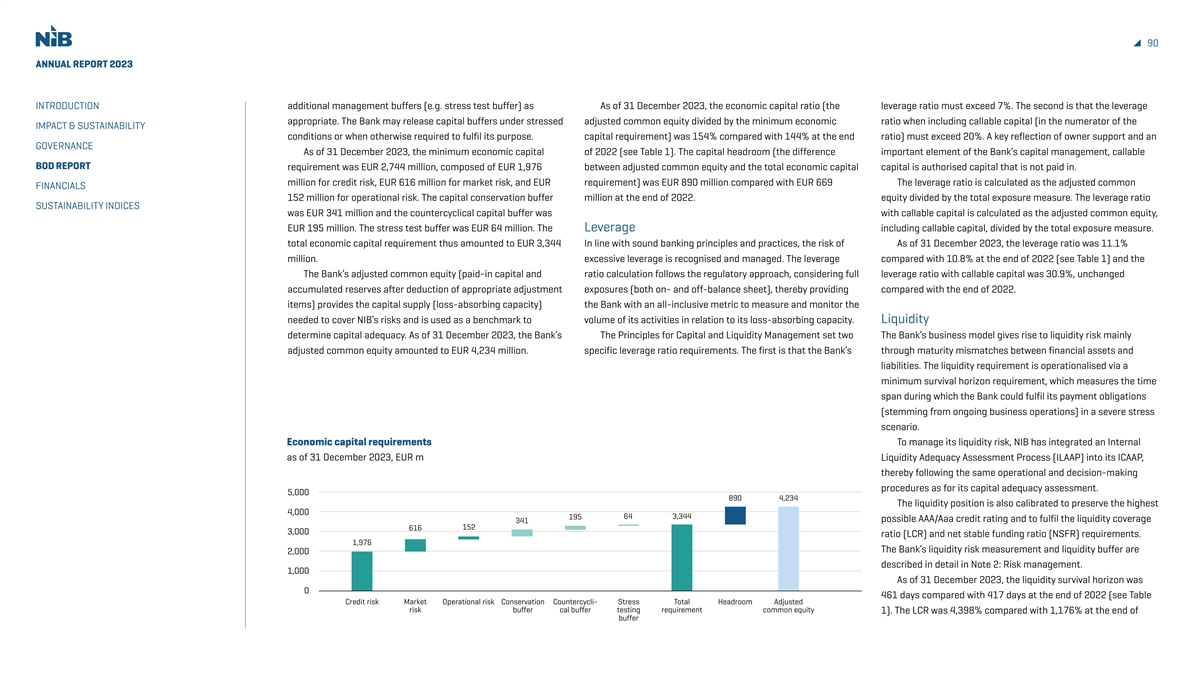
90 ANNUAL REPORT 2023 INTRODUCTION additional management buffers (e.g. stress test buffer) as As of 31 December 2023, the economic capital ratio (the leverage ratio must exceed 7%. The second is that the leverage appropriate. The Bank may release capital buffers under stressed adjusted common equity divided by the minimum economic ratio when including callable capital (in the numerator of the IMPACT & SUSTAINABILITY conditions or when otherwise required to fulfil its purpose. capital requirement) was 154% compared with 144% at the end ratio) must exceed 20%. A key reflection of owner support and an GOVERNANCE As of 31 December 2023, the minimum economic capital of 2022 (see Table 1). The capital headroom (the difference important element of the Bank’s capital management, callable BOD REPORT requirement was EUR 2,744 million, composed of EUR 1,976 between adjusted common equity and the total economic capital capital is authorised capital that is not paid in. million for credit risk, EUR 616 million for market risk, and EUR requirement) was EUR 890 million compared with EUR 669 The leverage ratio is calculated as the adjusted common FINANCIALS 152 million for operational risk. The capital conservation buffer million at the end of 2022. equity divided by the total exposure measure. The leverage ratio SUSTAINABILITY INDICES was EUR 341 million and the countercyclical capital buffer was with callable capital is calculated as the adjusted common equity, EUR 195 million. The stress test buffer was EUR 64 million. The Leverage including callable capital, divided by the total exposure measure. total economic capital requirement thus amounted to EUR 3,344 In line with sound banking principles and practices, the risk of As of 31 December 2023, the leverage ratio was 11.1% million. excessive leverage is recognised and managed. The leverage compared with 10.8% at the end of 2022 (see Table 1) and the The Bank’s adjusted common equity (paid-in capital and ratio calculation follows the regulatory approach, considering full leverage ratio with callable capital was 30.9%, unchanged accumulated reserves after deduction of appropriate adjustment exposures (both on- and off-balance sheet), thereby providing compared with the end of 2022. items) provides the capital supply (loss-absorbing capacity) the Bank with an all-inclusive metric to measure and monitor the needed to cover NIB’s risks and is used as a benchmark to volume of its activities in relation to its loss-absorbing capacity. Liquidity determine capital adequacy. As of 31 December 2023, the Bank’s The Principles for Capital and Liquidity Management set two The Bank’s business model gives rise to liquidity risk mainly adjusted common equity amounted to EUR 4,234 million. specific leverage ratio requirements. The first is that the Bank’s through maturity mismatches between financial assets and liabilities. The liquidity requirement is operationalised via a minimum survival horizon requirement, which measures the time span during which the Bank could fulfil its payment obligations (stemming from ongoing business operations) in a severe stress scenario. Economic capital requirements To manage its liquidity risk, NIB has integrated an Internal as of 31 December 2023, EUR m Liquidity Adequacy Assessment Process (ILAAP) into its ICAAP, thereby following the same operational and decision-making procedures as for its capital adequacy assessment. 5,000 890 4,234 The liquidity position is also calibrated to preserve the highest 4,000 64 3,344 195 possible AAA/Aaa credit rating and to fulfil the liquidity coverage 341 152 616 3,000 ratio (LCR) and net stable funding ratio (NSFR) requirements. 1,976 The Bank’s liquidity risk measurement and liquidity buffer are 2,000 described in detail in Note 2: Risk management. 1,000 As of 31 December 2023, the liquidity survival horizon was 0 461 days compared with 417 days at the end of 2022 (see Table Credit risk Market Operational risk Conservation Countercycli- Stress Total Headroom Adjusted risk buffer cal buffer testing requirement common equity 1). The LCR was 4,398% compared with 1,176% at the end of buffer
91 ANNUAL REPORT 2023 INTRODUCTION 2022 and NSFR was 163% compared with 164% at the end of and work is ongoing to explore how key traditional credit risk forward planning for the in-person Board of Governors meeting in 2 2022. parameters can best incorporate climate risk. NIB monitors 2024; and the InvestEU Guarantee Programme. IMPACT & SUSTAINABILITY disclosure standards, banking practices and supervisory Two NIB stakeholder seminars to which the Board members GOVERNANCE Climate risk guidance, with the expectation that the relevance of climate risk were invited were held before the meetings in Riga and BOD REPORT As part of the establishment of the risk taxonomy, environmental and its management will continue to accelerate, and that Stockholm, on Financing the future of energy efficiency and risk including climate risk was defined and categorised in the adequate resources will be needed to match expectations. Financing Sweden’s green transition, respectively. Clients, FINANCIALS non-financial risk pillar under ESG (or sustainability) risk, which investors, peers, and other stakeholders were also invited to the SUSTAINABILITY INDICES itself is a sub-category of Business & Strategic Risk. As a risk Compliance seminars, both of which had government ministers as speakers. driver (rather than risk type), however, climate risk affects NIB’s efforts to further strengthen its conduct framework Ole Hovland (Norway) continued his term as Chair, with Merle the pre-existing classical banking risk types of credit, market, continued throughout 2023. The Codes of Conduct for Staff, the Wilkinson (Estonia) as Deputy Chair. liquidity, and operational risks. Board of Directors and the President, and the Control Committee The Control Committee (the Bank’s body monitoring that the At the highest level, climate risk is addressed qualitatively in were updated to enhance guidance and accountability. The Bank operates according to the Statutes and responsible for NIB’s Risk Appetite Statement (RAS), which sets the principles for implementation of the Codes was supported with a new appointing the Bank’s external auditors) had two ordinary taking, mitigating and/or avoiding specific risks. Operationally, eLearning course for all staff, alongside a course on speaking up meetings during the year. The first was on 24 February 2023 in the core activities for managing climate risk do not and whistleblowing. Helsinki, and the second was on 29 September 2023 in fundamentally differ from those of traditional risk management Work also focused on supporting the implementation of the Stockholm. Toomas Vapper (Estonia) continued his term as Chair, – namely, the cycle to identify, assess (measure where possible), processes and controls required for NIB’s participation in the with Pentti Hakkarainen (Finland) as Deputy Chair. The Control monitor, and report. What differs is that the assessment InvestEU programme. Committee Chairmanship held six additional meetings in 2023. methodologies – including the underlying data needed to reliably The implementation NIB’s data privacy plan continued in 2023, The Chairmanship of the Control Committee has been assess, monitor, manage and report – are still in their infancy. which included, inter alia, the appointment of departmental privacy considering NIB’s governance and internal control framework. This With sustainability reporting standards becoming more stringent, coordinators. More information about the Integrity & Compliance has been discussed between the Chairmanship and the Board of the Bank remains committed to publicly disclosing as much as it Office’s activities can be found in the Integrity Report 2023. Directors, and interaction between the Chairmanship and the reliably can. Board of Directors has in general increased during the year. A more detailed description of how the Bank applies the Governance To better highlight the activities and ambitions of NIB, the guidance from the Task Force on Climate-related Financial NIB’s Board of Directors held ten meetings in 2023. The meetings President has visited the capitals of most of the member Disclosures (TCFD), the recently adopted climate strategy and 1/23, 3/23, and 9/23 were held fully online. The remaining countries and held in-person meetings with seven of the member the role of the Sustainability Policy (and related Guidelines) is meetings were held in person, with some members participating country finance ministers to date. available on pages 37-46. The section also provides, for the third remotely. The Board meeting 6/23 was held on 24 August 2023 in NIB’s Board of Governors held its annual meeting via a written consecutive year and with increased scope and refinement, a Riga to coincide with the opening of NIB’s office there. The Board procedure, which was concluded on 31 March 2023. climate transition risk exposure assessment expressed as an meeting 7/23 was held on 28 September 2023 in Stockholm. The The Board of Directors confirmed the appointment by the industry-standard “heatmap”. remaining five meetings were held in Helsinki. President of the new Head of Lending and the new Head of Moreover, climate transition risk scenarios which stress test Four separate Board seminars were held prior to Board Human Resources as Executive Committee members. credit risk have been included in the Bank’s ICAAP since 2022, meetings. The seminar topics covered risk and capital planning; a More information can be found in the Governance Statement status update on NIB’s IT, digitalisation, and information security; on pages 69-72. 2 Namely PD (probability of default) and LGD (loss given default).
92 ANNUAL REPORT 2023 INTRODUCTION Digitalisation The economic outlook continues to be shadowed also by its strong asset quality. Based on the risk-based capital During the year, NIB continued its transition to a data-driven Russia’s continued war in Ukraine and geopolitical events in the allocation and pricing that the Bank applies, the capital ratios IMPACT & SUSTAINABILITY organisation. The Bank implemented the previously approved Middle East. These bring uncertainty to the energy markets and and liquidity position as well as earnings are expected to remain GOVERNANCE changes for its IT operations and governance processes. These prices may stay elevated and remain volatile. solid in the coming year. BOD REPORT developments allow for better project prioritisation and alignment Although the general investment climate remains subdued, NIB will continue to provide long-term financing to its clients between different business units as well as further digitalisation the green transition requires significant amounts of investments, in a situation where the investment climate is expected to be FINANCIALS of business processes. In terms of lending operations, these both on the public and private side. In this area investment under pressure. The focus will be on supporting member SUSTAINABILITY INDICES processes continued with new applications and tools for better activity is expected to persist. At the same time, many climate countries in the green transition, as well as measures to customer relationship management and experience. The Bank investment projects are long-term and in capital-intensive strengthen resilience in the region. continued strengthening its cyber security approach, which industries – for example, renewable energy generation or remains amongst the Bank’s highest priorities. infrastructure. These industries are more sensitive to fluctuations in the cost of capital due to their long-term nature. Outlook As a result, the demand for NIB’s lending to finance these The deceleration of inflation and slow-down of real economies investments will bring monetary policy decisions into sharp focus in 2024. will likely remain high. The current market expectations is that central banks will start Covid-19, Russia’s war in Ukraine and geopolitical tensions to loosen monetary policy and cut interest rates during 2024. have emphasised the need for resilient, stable and more efficient However, the credit standards are still tighter than before supply chains. In the current situation, many companies are 2022. This affects the overall demand, spending patterns of reviewing their supply chains, including their energy supply, and households, property valuations and general investment activity. want to invest in strengthening them to become more resilient It is expected that economic activity will stay subdued but a and therefore also more competitive. The adaptation to this new mild rebound may be seen in 2024, driven by possible central situation will also require new investments going forward. bank actions and moderate real-wage increases, that will partly In recent years, especially in NIB’s member countries, a lot of undo the losses in household real disposable income seen in attention was devoted to physical risks to various infrastructure 2022 and 2023. assets. At a time of hybrid warfare, physical assets have become Any deterioration in the labour markets would impact growth potential targets. This is an additional aspect to look out for in 2024. and public finances negatively. Government budgets are already At the same time, the Bank will maintain its focus on its under strain due to the increased crisis response spending and strong credit process and high-quality mandate and impact higher interest rates resulting in increased cost of servicing debt. assessment. The loan portfolio is therefore expected to maintain
ANNUAL REPORT 2023 INTRODUCTION FINANCIAL REPORTING IMPACT & SUSTAINABILITY GOVERNANCE BOD REPORT We have the highest FINANCIALS Financial statements and notes AAA/Aaa credit rating Proposal by the Board of Directors Auditor’s report Report of the Control Committee Chairmanship Report of the Control Committee Ratio definitions SUSTAINABILITY INDICES I work with the InvestEU Fund at NIB. I applied because I was curious about NIB’s mandate and keen to assist in the development of a portfolio in the nexus of shared Nordic, Baltic and EU interests for a sustainable future. Lovisa Sommerholt, Associate Banker
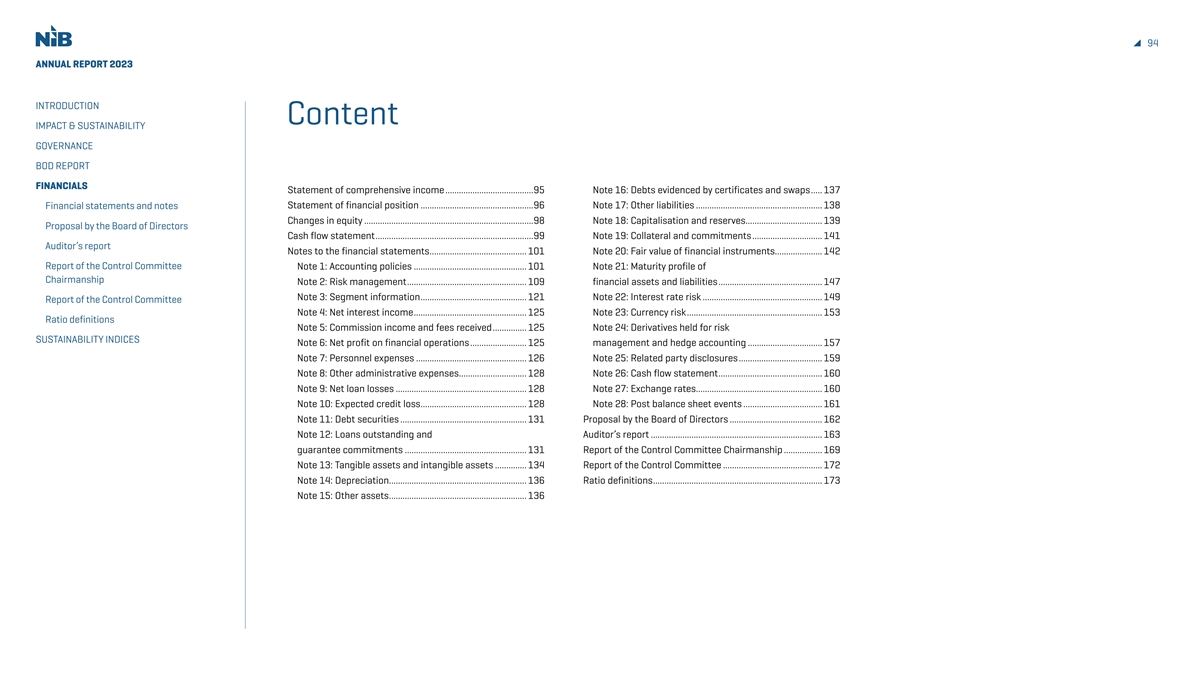
94 ANNUAL REPORT 2023 INTRODUCTION Content IMPACT & SUSTAINABILITY GOVERNANCE BOD REPORT FINANCIALS Statement of comprehensive income .......................................95 Note 16: Debts evidenced by certificates and swaps ..... 137 Statement of financial position ...................................................96 Note 17: Other liabilities ........................................................ 138 Financial statements and notes Changes in equity ............................................................................98 Note 18: Capitalisation and reserves .................................. 139 Proposal by the Board of Directors Cash flow statement .......................................................................99 Note 19: Collateral and commitments ............................... 141 Auditor’s report Notes to the financial statements ........................................... 101 Note 20: Fair value of financial instruments ..................... 142 Report of the Control Committee Note 1: Accounting policies .................................................. 101 Note 21: Maturity profile of Chairmanship Note 2: Risk management ..................................................... 109 financial assets and liabilities .............................................. 147 Note 3: Segment information ............................................... 121 Note 22: Interest rate risk ..................................................... 149 Report of the Control Committee Note 4: Net interest income .................................................. 125 Note 23: Currency risk ............................................................. 153 Ratio definitions Note 5: Commission income and fees received ............... 125 Note 24: Derivatives held for risk SUSTAINABILITY INDICES Note 6: Net profit on financial operations .......................... 125 management and hedge accounting ................................. 157 Note 7: Personnel expenses ................................................. 126 Note 25: Related party disclosures ...................................... 159 Note 8: Other administrative expenses .............................. 128 Note 26: Cash flow statement .............................................. 160 Note 9: Net loan losses ........................................................... 128 Note 27: Exchange rates ........................................................ 160 Note 10: Expected credit loss ............................................... 128 Note 28: Post balance sheet events ................................... 161 Note 11: Debt securities ........................................................ 131 Proposal by the Board of Directors ......................................... 162 Note 12: Loans outstanding and Auditor’s report ............................................................................ 163 guarantee commitments ...................................................... 131 Report of the Control Committee Chairmanship .................. 169 Note 13: Tangible assets and intangible assets .............. 134 Report of the Control Committee ............................................ 172 Note 14: Depreciation .............................................................. 136 Ratio definitions ........................................................................... 173 Note 15: Other assets ............................................................. 136
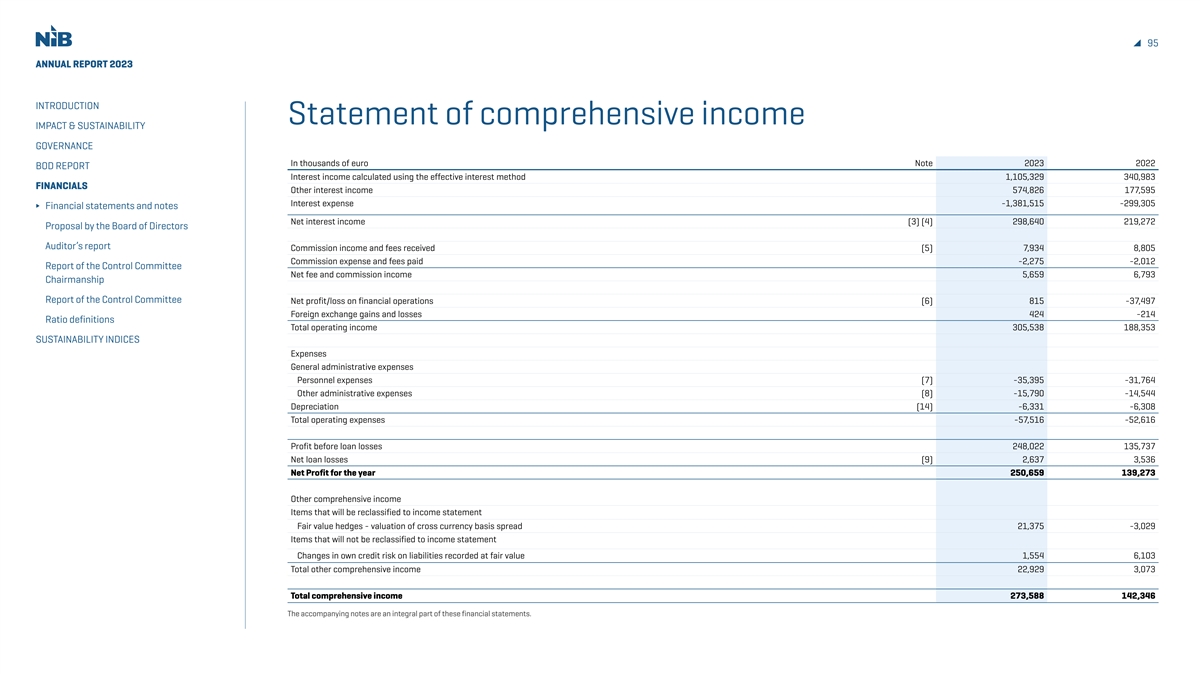
95 ANNUAL REPORT 2023 INTRODUCTION Statement of comprehensive income IMPACT & SUSTAINABILITY GOVERNANCE In thousands of euro Note 2023 2022 BOD REPORT Interest income calculated using the effective interest method 1,105,329 340,983 FINANCIALS Other interest income 574,826 177,595 Interest expense -1,381,515 -299,305 Financial statements and notes Net interest income (3) (4) 298,640 219,272 Proposal by the Board of Directors Auditor’s report Commission income and fees received (5) 7,934 8,805 Commission expense and fees paid -2,275 -2,012 Report of the Control Committee Net fee and commission income 5,659 6,793 Chairmanship Report of the Control Committee Net profit/loss on financial operations (6) 815 -37,497 Foreign exchange gains and losses 424 -214 Ratio definitions Total operating income 305,538 188,353 SUSTAINABILITY INDICES Expenses General administrative expenses Personnel expenses (7) -35,395 -31,764 Other administrative expenses (8) -15,790 -14,544 Depreciation (14) -6,331 -6,308 Total operating expenses -57,516 -52,616 Profit before loan losses 248,022 135,737 Net loan losses (9) 2,637 3,536 Net Profit for the year 250,659 139,273 Other comprehensive income Items that will be reclassified to income statement Fair value hedges - valuation of cross currency basis spread 21,375 -3,029 Items that will not be reclassified to income statement Changes in own credit risk on liabilities recorded at fair value 1,554 6,103 Total other comprehensive income 22,929 3,073 Total comprehensive income 273,588 142,346 The accompanying notes are an integral part of these financial statements.
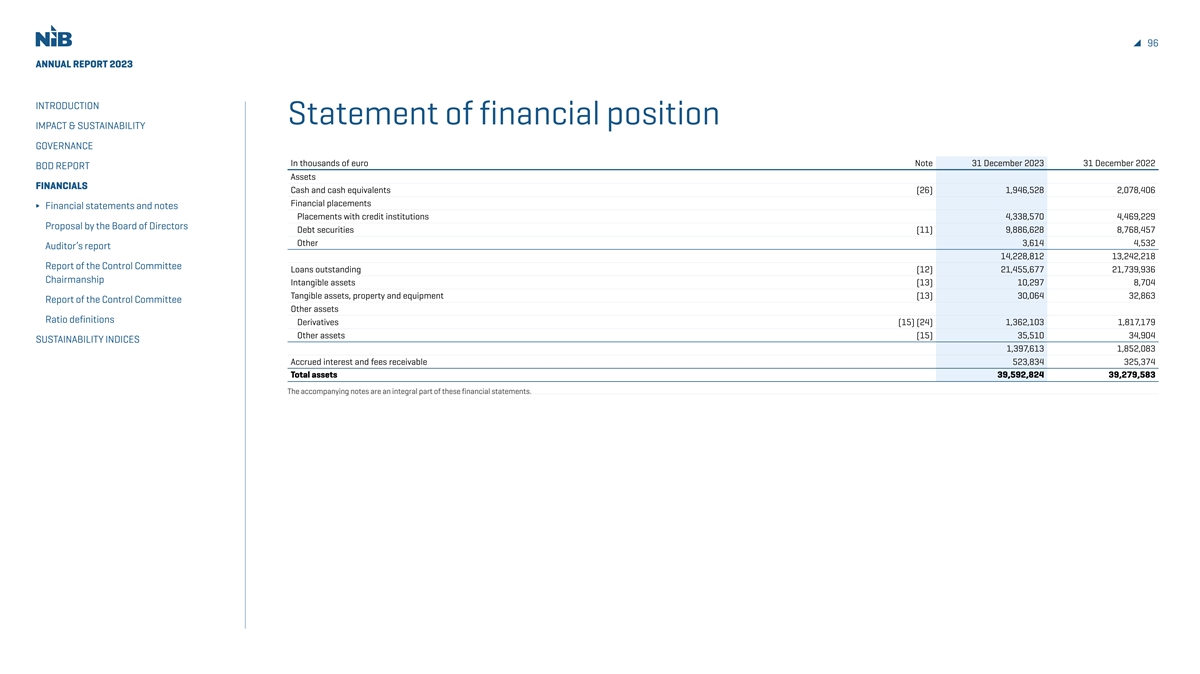
96 ANNUAL REPORT 2023 INTRODUCTION Statement of financial position IMPACT & SUSTAINABILITY GOVERNANCE In thousands of euro Note 31 December 2023 31 December 2022 BOD REPORT Assets FINANCIALS Cash and cash equivalents (26) 1,946,528 2,078,406 Financial placements Financial statements and notes Placements with credit institutions 4,338,570 4,469,229 Proposal by the Board of Directors Debt securities (11) 9,886,628 8,768,457 Other 3,614 4,532 Auditor’s report 14,228,812 13,242,218 Report of the Control Committee Loans outstanding (12) 21,455,677 21,739,936 Chairmanship Intangible assets (13) 10,297 8,704 Tangible assets, property and equipment (13) 30,064 32,863 Report of the Control Committee Other assets Ratio definitions Derivatives (15) (24) 1,362,103 1,817,179 Other assets (15) 35,510 34,904 SUSTAINABILITY INDICES 1,397,613 1,852,083 Accrued interest and fees receivable 523,834 325,374 Total assets 39,592,824 39,279,583 The accompanying notes are an integral part of these financial statements.
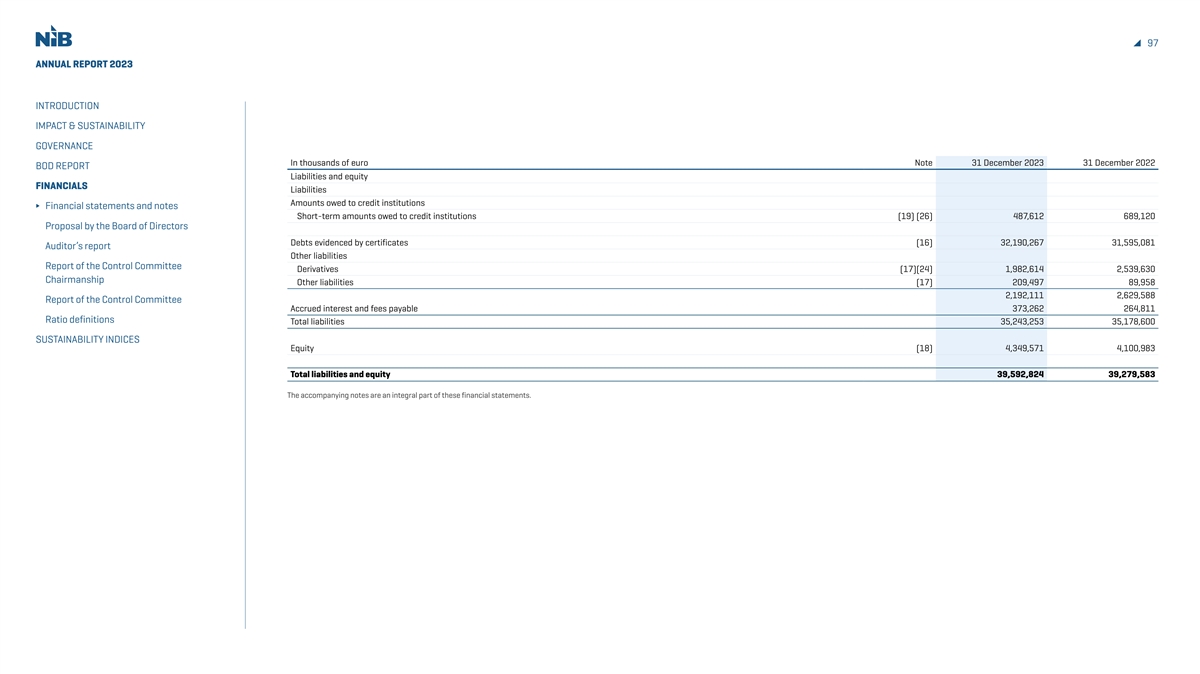
97 ANNUAL REPORT 2023 INTRODUCTION IMPACT & SUSTAINABILITY GOVERNANCE In thousands of euro Note 31 December 2023 31 December 2022 BOD REPORT Liabilities and equity FINANCIALS Liabilities Amounts owed to credit institutions Financial statements and notes Short-term amounts owed to credit institutions (19) (26) 487,612 689,120 Proposal by the Board of Directors Debts evidenced by certificates (16) 32,190,267 31,595,081 Auditor’s report Other liabilities Report of the Control Committee Derivatives (17)(24) 1,982,614 2,539,630 Chairmanship Other liabilities (17) 209,497 89,958 2,192,111 2,629,588 Report of the Control Committee Accrued interest and fees payable 373,262 264,811 Ratio definitions Total liabilities 35,243,253 35,178,600 SUSTAINABILITY INDICES Equity (18) 4,349,571 4,100,983 Total liabilities and equity 39,592,824 39,279,583 The accompanying notes are an integral part of these financial statements.
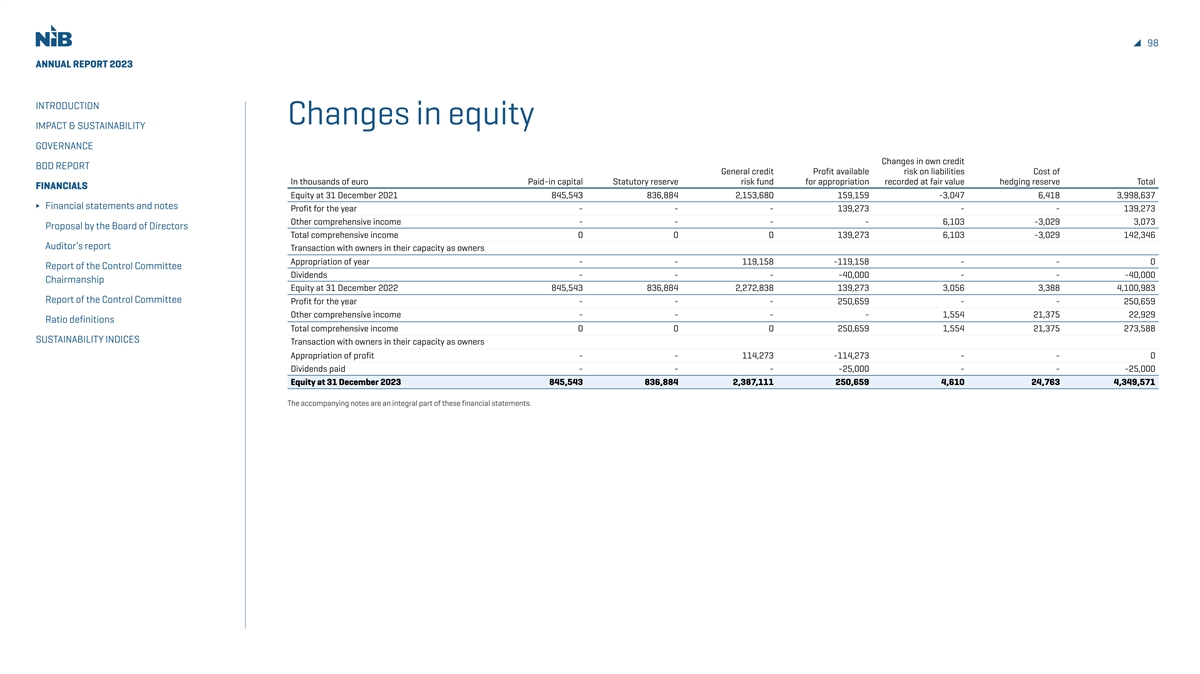
98 ANNUAL REPORT 2023 INTRODUCTION Changes in equity IMPACT & SUSTAINABILITY GOVERNANCE Changes in own credit BOD REPORT General credit Profit available risk on liabilities Cost of In thousands of euro Paid-in capital Statutory reserve risk fund for appropriation recorded at fair value hedging reserve Total FINANCIALS Equity at 31 December 2021 845,543 836,884 2,153,680 159,159 -3,047 6,418 3,998,637 Financial statements and notes Profit for the year - - - 139,273 - - 139,273 Other comprehensive income - - - - 6,103 -3,029 3,073 Proposal by the Board of Directors Total comprehensive income 0 0 0 139,273 6,103 -3,029 142,346 Auditor’s report Transaction with owners in their capacity as owners Appropriation of year - - 119,158 -119,158 - - 0 Report of the Control Committee Dividends - - - -40,000 - - -40,000 Chairmanship Equity at 31 December 2022 845,543 836,884 2,272,838 139,273 3,056 3,388 4,100,983 Report of the Control Committee Profit for the year - - - 250,659 - - 250,659 Other comprehensive income - - - - 1,554 21,375 22,929 Ratio definitions Total comprehensive income 0 0 0 250,659 1,554 21,375 273,588 SUSTAINABILITY INDICES Transaction with owners in their capacity as owners Appropriation of profit - - 114,273 -114,273 - - 0 Dividends paid - - - -25,000 - - -25,000 Equity at 31 December 2023 845,543 836,884 2,387,111 250,659 4,610 24,763 4,349,571 The accompanying notes are an integral part of these financial statements.
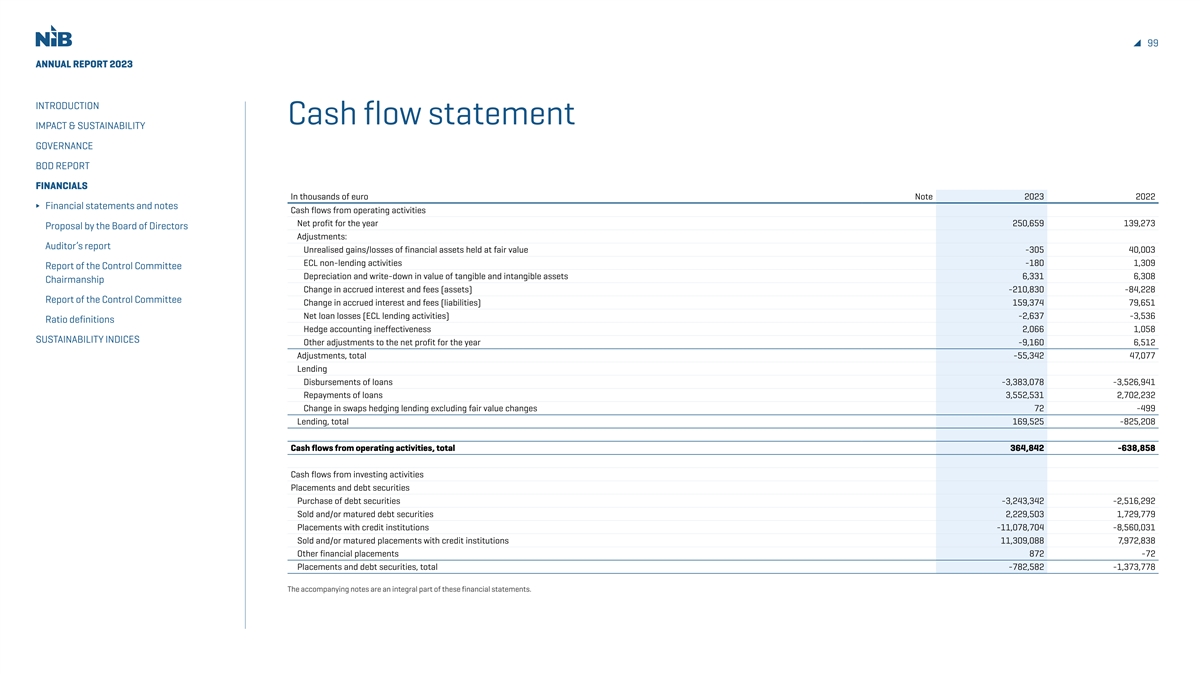
99 ANNUAL REPORT 2023 INTRODUCTION Cash flow statement IMPACT & SUSTAINABILITY GOVERNANCE BOD REPORT FINANCIALS In thousands of euro Note 2023 2022 Financial statements and notes Cash flows from operating activities Net profit for the year 250,659 139,273 Proposal by the Board of Directors Adjustments: Auditor’s report Unrealised gains/losses of financial assets held at fair value -305 40,003 ECL non-lending activities -180 1,309 Report of the Control Committee Depreciation and write-down in value of tangible and intangible assets 6,331 6,308 Chairmanship Change in accrued interest and fees (assets) -210,830 -84,228 Report of the Control Committee Change in accrued interest and fees (liabilities) 159,374 79,651 Net loan losses (ECL lending activities) -2,637 -3,536 Ratio definitions Hedge accounting ineffectiveness 2,066 1,058 SUSTAINABILITY INDICES Other adjustments to the net profit for the year -9,160 6,512 Adjustments, total -55,342 47,077 Lending Disbursements of loans -3,383,078 -3,526,941 Repayments of loans 3,552,531 2,702,232 Change in swaps hedging lending excluding fair value changes 72 -499 Lending, total 169,525 -825,208 Cash flows from operating activities, total 364,842 -638,858 Cash flows from investing activities Placements and debt securities Purchase of debt securities -3,243,342 -2,516,292 Sold and/or matured debt securities 2,229,503 1,729,779 Placements with credit institutions -11,078,704 -8,560,031 Sold and/or matured placements with credit institutions 11,309,088 7,972,838 Other financial placements 872 -72 Placements and debt securities, total -782,582 -1,373,778 The accompanying notes are an integral part of these financial statements.
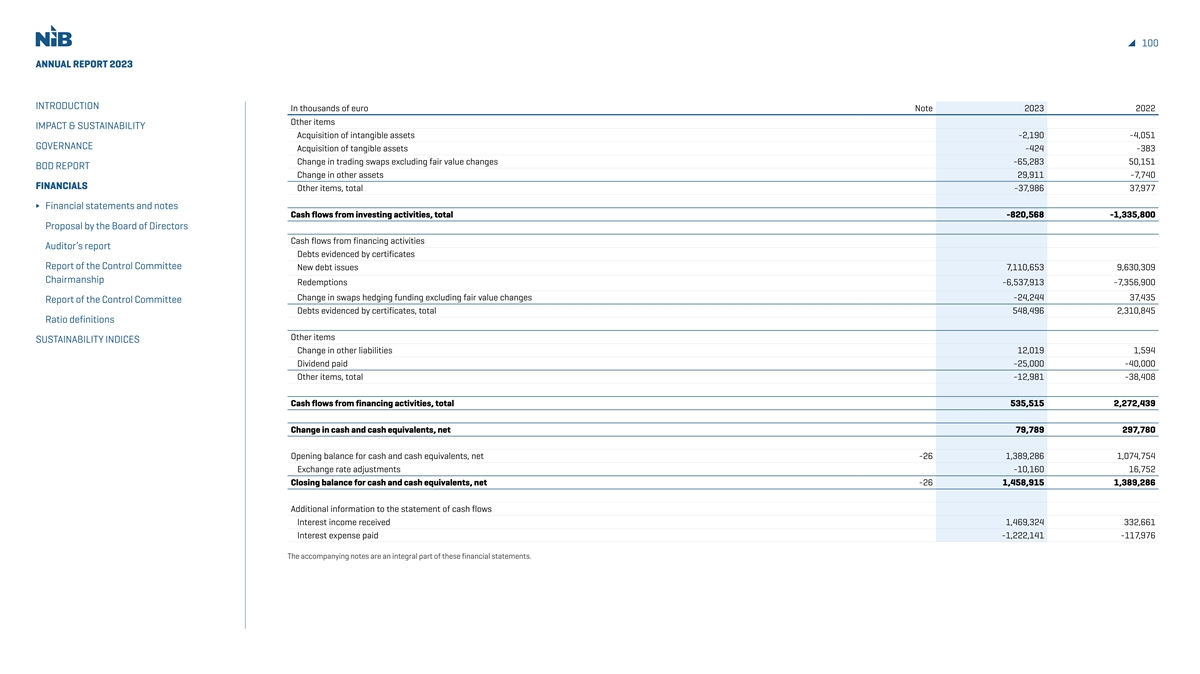
100 ANNUAL REPORT 2023 INTRODUCTION In thousands of euro Note 2023 2022 Other items IMPACT & SUSTAINABILITY Acquisition of intangible assets -2,190 -4,051 GOVERNANCE Acquisition of tangible assets -424 -383 Change in trading swaps excluding fair value changes -65,283 50,151 BOD REPORT Change in other assets 29,911 -7,740 FINANCIALS Other items, total -37,986 37,977 Financial statements and notes Cash flows from investing activities, total -820,568 -1,335,800 Proposal by the Board of Directors Cash flows from financing activities Auditor’s report Debts evidenced by certificates Report of the Control Committee New debt issues 7,110,653 9,630,309 Chairmanship Redemptions -6,537,913 -7,356,900 Change in swaps hedging funding excluding fair value changes -24,244 37,435 Report of the Control Committee Debts evidenced by certificates, total 548,496 2,310,845 Ratio definitions Other items SUSTAINABILITY INDICES Change in other liabilities 12,019 1,594 Dividend paid -25,000 -40,000 Other items, total -12,981 -38,408 Cash flows from financing activities, total 535,515 2,272,439 Change in cash and cash equivalents, net 79,789 297,780 Opening balance for cash and cash equivalents, net -26 1,389,286 1,074,754 Exchange rate adjustments -10,160 16,752 Closing balance for cash and cash equivalents, net -26 1,458,915 1,389,286 Additional information to the statement of cash flows Interest income received 1,469,324 332,661 Interest expense paid -1,222,141 -117,976 The accompanying notes are an integral part of these financial statements.
101 ANNUAL REPORT 2023 INTRODUCTION Note 1: Accounting policies IMPACT & SUSTAINABILITY GOVERNANCE Reporting entity - History of NIB Effective 1 January 1994, the EFTA member countries, with the exclusion of Switzerland, and the BOD REPORT European Union (“EU”) established the European Economic Area (“EEA”), a free trade zone in Europe. Cooperation of Member Countries On 1 January 1995, Finland and Sweden became members of the EU, leaving Norway and Iceland FINANCIALS as the only Nordic countries that presently are EFTA members. At the introduction of the Euro on Financial statements and notes Institutionalised Nordic Cooperation 1 January 1999, Finland was the only Nordic country to participate in the economic and monetary Proposal by the Board of Directors Cooperation among the Nordic countries comprises a wide range of activities, including economic union of the EU (“EMU”). policy, development of industrial technology, communications and the harmonisation of legal Effective 1 May 2004, Estonia, Latvia and Lithuania became members of the EU and Auditor’s report systems. subsequently of the EMU. Estonia joined the EMU on 1 January 2011, Latvia on 1 January 2014 and Report of the Control Committee The most important formal basis for Nordic cooperation is the Helsinki Agreement of 1962. This Lithuania on 1 January 2015. Chairmanship agreement sets out the aims of Nordic cooperation and contains provisions for the Nordic Council Report of the Control Committee and, as subsequently amended, for the Nordic Council of Ministers. Other forms of cooperation Ratio definitions The Nordic Council is a forum for consultation and discussion on issues of common interests at Nordic–Baltic cooperation also includes coordination of policy positions in international a parliamentary level. The Nordic Council of Ministers is empowered to make decisions on matters of organisations. Consultations are held regularly on issues arising within the United Nations and SUSTAINABILITY INDICES cooperation that are considered binding to the governments of the Nordic countries. the United Nations Commission for Trade and Development. The member countries are jointly Since 1992, the three Baltic countries Estonia, Latvia and Lithuania have been cooperating represented in the International Monetary Fund, the International Bank for Reconstruction and closely with the Nordic countries under the framework of the Nordic–Baltic Eight (NB8) format. Development and other international organisations. Under NB8, regular meetings between the Nordic and Baltic prime ministers and foreign ministers are held to discuss questions of regional interest and international issues. Establishment of the Nordic Investment Bank Discussions within the Nordic Council and the Nordic Council of Ministers over a number of years EFTA and EU led to the establishment of the Nordic Investment Bank. The legal basis for NIB is the “Establishing The Nordic countries have steadily broadened their mutual commercial relationships, a development Agreement”, which was signed on 4 December 1975. The signatories of the Establishing Agreement encouraged by the creation of the European Free Trade Association (“EFTA”) in 1960, which were Denmark, Finland, Iceland, Norway and Sweden. established a framework for the development of inter-Nordic trade during the 1960s and 1970s. The Establishing Agreement and the Statutes of NIB became effective on 1 June 1976, and the Following Denmark’s entry into the European Community (the predecessor to the European Bank commenced operations on 2 August of that year. Union) in 1973, the other four Nordic countries concluded bilateral free-trade agreements with the On 15 September 1981, the Nordic Council of Ministers approved a programme to promote European Community in order to promote free trade within the Nordic region. member country cooperation in project exports, primarily to developing countries. The decision, as
102 ANNUAL REPORT 2023 INTRODUCTION amended on 28 February 1982, included, as one major element of the programme, the creation of - Replacing the current statutory gearing limit with a risk-based comprehensive framework for a joint financing facility to grant loans and issue loan guarantees (“project investment loans”). The capital and liquidity management, in accordance with sound banking principles, and introducing IMPACT & SUSTAINABILITY facility became effective on 1 July 1982, and has formed the main part of NIB’s lending activities minimum requirements for capital, liquidity and leverage; GOVERNANCE outside Member countries. See Note 12. - Discontinuing the special loan facilities for Project Investment Loans (PIL) and Environmental BOD REPORT In August 1996, the Nordic prime ministers decided to establish a special environmental loan Investment Loans (MIL). The outstanding amounts under the PIL and MIL facilities have become part facility (the “Environmental Investment Loan Facility”) to finance environmental investments in of NIB’s ordinary lending, and new lending of this type will in future also constitute ordinary lending. FINANCIALS the region neighbouring the Nordic countries. The facility was approved by the Nordic Council of In addition, the special credit risk fund for PIL has been converted into paid-in capital and the Financial statements and notes Ministers on 25 January 1997, and became effective on 28 August 1997. The facility, which was part Member countries’ PIL guarantees into callable capital. The MIL has not been converted; Proposal by the Board of Directors of NIB’s lending activities, comprised loans and guarantees to both the public and private sector for - Improving institutional governance, clarifying the role of the Control Committee and the financing investments aimed at protecting the environment and reducing cross border pollution in external auditors, and strengthening the role of the Chairmanship of the Bank’s Control Committee; Auditor’s report the neighbouring area to the member countries. See Note 12. and Report of the Control Committee The project investment loan and environmental investment loan programmes were incorporated - Allowing for limited equity participation as a new form of financing for the Bank, in addition to Chairmanship into NIB’s normal lending activities as part of the Statutory changes which came into effect on 29 loans and guarantees, with the unanimous approval of the Board of Directors. Report of the Control Committee July 2020 and are described below. Ratio definitions In November 1997, the Nordic Council of Ministers decided that the legal framework of NIB and Implications for NIB’s related parties/sister organisations its sister organisation NEFCO and NDF (each, as defined below) should be revised to reflect their On 19 May 1988, the Nordic Council of Ministers decided to establish the Nordic Development Fund SUSTAINABILITY INDICES status as international institutions. In relation to NIB, this led to the signing of the 1998 Agreement (“NDF”), an international financial institution, for financing projects of Nordic interest in developing on 23 October 1998. countries on concessional terms. The establishing agreement of NDF was signed by the five Nordic On 23 October 1998, the Nordic countries entered into a novation of the Establishing Agreement countries (“NDF member countries”) on 3 November 1988, and NDF commenced operations on (the “1998 Agreement”). The 1998 Agreement came into force on 18 July 1999, and the Establishing 1 February 1989. NDF is a separate legal entity with its own Board of Directors and with a capital Agreement ceased to be effective on the same date. base provided by the NDF member countries. On 1 January 2005, Estonia, Latvia and Lithuania became members of NIB on equal terms with On 2 March 1990, the Nordic Council of Ministers decided to establish the Nordic Environment the original member countries following a policy decision taken by the Nordic prime ministers in Finance Corporation (“NEFCO”), an international financial institution, for promoting investments of June 2003. The new members have the same rights and obligations as the original members. Nordic environmental interest in Eastern and Central Europe. NEFCO is a separate legal entity with The 2004 Agreement mandates a new structure for the governance of the Bank, which was fully its own Board of Directors and with a capital base provided by the NEFCO member countries. implemented as of 1 January 2005. NIB introduced an entirely new body, the Board of Governors, According to the constituent documents of NDF and NEFCO, their principal offices shall be which replaced the Nordic Council of Ministers and its functions in the previous legal framework of located at the principal office of NIB. Furthermore, the Statutes of NDF and NEFCO set out that the Bank. The 2004 Agreement did not change the activities of the Bank. their Control Committee members appointed by the Nordic Council shall be the same persons as At its annual meeting on 24 May 2019, the Board of Governors approved substantial appointed by the Council to the Control Committee of NIB. In addition, the Statutes of NDF and amendments to the Statutes and an amendment to the Agreement was agreed and signed on 28 NEFCO set out that the powers vested in their respective Board of Directors may be delegated to the February 2020. This Amending Agreement and the amendments to the Statues came into effect on President of the respective organisation and/or to NIB. NIB provides administrative services to NDF 29 July 2020. The amendments consisted of the following: and NEFCO the compensation of which is disclosed in Note 8 of the annual financial statements.
103 ANNUAL REPORT 2023 Statutory Purposes INTRODUCTION The 2004 Agreement stipulates that the premises and archives of NIB and all documents The purpose of NIB, according to the 2004 Agreement and the Statutes is to make financing belonging to it or held by it shall be inviolable. IMPACT & SUSTAINABILITY available in accordance with sound banking principles, taking into account socio-economic The 2004 Agreement also states that NIB is exempt from payment restrictions and credit policy GOVERNANCE considerations, to realise investment projects of interest to the Member countries and other measures, which in any manner prevent or impede the fulfilment of its commitments and that NIB, BOD REPORT countries, which receive such financing. NIB is required to make a profit from its operations in order its income, assets and property shall be exempt from all taxation as set forth in the relevant Article. to provide for the accumulation of reserves and a reasonable return on its paid-in capital; however, it Consequently, NIB shall be exempt from taxes on the purchase and transfer of real estate and FINANCIALS is not a profit maximising entity. securities and on the procurement of goods and services in connection with the official activities of Financial statements and notes NIB finances its operations from the capital paid in by Member countries, retained earnings and NIB. Lending and borrowing by NIB is also exempt from all taxes and charges of a similar nature. Proposal by the Board of Directors by borrowing on the international capital markets. On 20 October 2010, a revised Host Country Agreement between NIB and the Government of Finland was signed. The agreement confirms NIB´s status as an international organization and Auditor’s report Legal Status further regulates certain privileges and immunities concerning NIB and its staff as well as social Report of the Control Committee Under the 2004 Agreement, NIB has the status of an international legal person with full legal security for the staff. The agreement was enacted in Finland and came into force on 16 January Chairmanship capacity. In particular, NIB has the capacity to enter into agreements, to acquire and dispose of 2011. Report of the Control Committee immovable and movable property, and to be a party to legal proceedings before courts of law and NIB’s Headquarters is located at Fabianinkatu 34, Helsinki, Finland. Ratio definitions other authorities. The 2004 Agreement further states that NIB, as a common international financial institution to the Member countries, has the same status as other legal persons conducting similar Basis of accounting SUSTAINABILITY INDICES operations within and outside the Member countries. The Bank’s financial statements have been prepared in accordance with International Financial The 2004 Agreement also contains, among others, provisions regarding certain immunities. Reporting Standards (IFRS) issued by the International Accounting Standards Board (IASB). The According to these provisions the Member countries have agreed that actions may be brought financial statements have been prepared in accordance with the historical cost convention with against NIB only in a court of competent jurisdiction in the territory of a country in which NIB has some exceptions described in the policies below. established an office, or has appointed an agent for the purpose of accepting service of process, The cash flow statement has been prepared using the indirect method whereby net profit is or when NIB has otherwise expressly accepted jurisdiction. Actions may, however, be brought by a adjusted for effects of non-cash transactions such as fair valuations, depreciation and loan losses. Member country or by persons acting for or deriving claims from a Member country only if NIB has The cash flows are classified by operating, investing and financing activities. Cash flow items cannot given its express consent thereto. be directly determined from the statement of financial position. In addition, the 2004 Agreement provides that property and assets of NIB wherever located On 26 February 2024, the Board of Directors approved the financial statements for publication. and by whomsoever held shall be immune from execution of judgment or decree by judicial or These financial statements will be submitted for approval to the Annual Meeting of the Board of administrative authority before such judgment or decree is final. The property and assets of the Governors scheduled to be held on 22 March 2024. Bank wherever located and by whomsoever held shall further be immune from search, requisition, confiscation and expropriation by executive or legislative action. The Bank, its property and assets shall also be immune from procedural measures of constraints, such as seizure.
104 ANNUAL REPORT 2023 INTRODUCTION New Accounting Standards adopted in 2022 and New standards The estimates are highly dependent on market data, such as the level of interest rates, currency for financial years beginning on or after 1 January 2023 rates and other factors. The uncertainties related to these estimates are reflected mainly in the IMPACT & SUSTAINABILITY The Bank adopted some new standards and amendments during 2023 however these did not have statement of financial position. NIB undertakes continuous development in order to improve the GOVERNANCE a significant impact. There are no IFRS standards or interpretations that are not yet effective that basis for fair value estimates, with regard to both modelling and market data. Changes in estimates BOD REPORT would be expected to have a material impact on the Bank. resulting from refinements in assumptions and methodologies are reflected in the period in which the enhancements are first applied. FINANCIALS Amendments to IAS 1 - The amendments to IAS 1 provides guidance in applying materiality Significant judgement and estimates are also applied to loan impairment testing in accordance Financial statements and notes judgements to Accounting policy disclosures. The Bank however, did not need to make any changes with IFRS 9. Proposal by the Board of Directors to its policy disclosures as of now. Amendments to IAS 8 - The amendments to IAS 8 clarify the distinction between changes in Foreign currency translation Auditor’s report accounting estimates, changes in accounting policies and correction of errors. The amendments Monetary assets and liabilities denominated in foreign currencies are recognised in the accounts at Report of the Control Committee had no impact on the Bank's financial statements. the exchange rate prevailing on the closing date. Non-monetary assets and liabilities are recognised Chairmanship IFRS 17 Insurance contracts and Amendments to IAS 12 - These changes are not relevant to the in the accounts at the euro rate prevailing on the transaction date. Income and expenses recognised Report of the Control Committee operations of the Bank. in currencies other than the euro are converted on a daily basis to the euro, in accordance with the Ratio definitions euro exchange rate prevailing on that day. Functional and presentation currency Realised and unrealised exchange rate gains and losses are recognised in the statement of SUSTAINABILITY INDICES The Bank’s functional and presentation currency is the euro and the financial statements are comprehensive income. presented in EUR 1,000, unless otherwise indicated. All figures in the accounts have been rounded The Bank uses exchange rates acquired from a leading market data provider based on rates and consequently the sum of individual figures may deviate from the presented sum figure. prevailing at 13:00 GMT at 31 December as disclosed in Note 27. Furthermore, all percentages are subject to possible rounding differences. Recognition and derecognition of financial instruments Significant accounting judgements and estimates Financial assets and liabilities, with the exception of loans to customers are initially recognised in As part of the process of preparing the financial statements in conformity with IFRS, the Bank’s the statement of financial position on the trade date, i.e., the date the Bank becomes party to the management is required to make certain judgements, estimates and assumptions that may affect contractual provisions of the instrument. the Bank’s profits, its financial position and other information presented in the Annual Report. These A financial asset is derecognised when the contractual rights to the cash flows from the financial estimates are based on available information and the judgements made by the Bank’s management. asset expire or when substantially all the risks and rewards of the asset have been transferred. Actual outcomes may deviate from the assessments made, and such deviations may at times be A financial liability is derecognised from the statement of financial position when the obligation significant. specified in the contract is discharged, cancelled or expired. The Bank uses various valuation models and techniques to estimate the fair values of assets and liabilities. There are significant uncertainties related to these estimates, in particular when they Financial assets at amortised cost involve modelling complex financial instruments, such as derivative instruments used for hedging The Bank measures amounts due from banks, loans and advances to customers and other financial activities related to both borrowing and lending. investments at amortised cost only if both of the following conditions are met:
105 ANNUAL REPORT 2023 INTRODUCTION a) The financial asset is held within a business model with the objective to hold financial assets in Determination of fair value order to collect contractual cash flows, The fair value of financial instruments, including derivative instruments that are traded in a liquid IMPACT & SUSTAINABILITY b) The contractual terms of the financial asset give rise on specified dates to cash flows that are market, is the bid or offered closing price on the balance sheet date. Where the fair values cannot GOVERNANCE solely payments of principal and interest (SPPI) on the principal amount outstanding. be derived from active markets, they are determined using a variety of valuation techniques, which BOD REPORT The most significant elements of interest within a lending arrangement are typically the include the use of mathematical models. The input to these models is taken from observable market consideration for the time value of money and credit risk. To make the SPPI assessment, the Bank data where possible. Many of NIB’s financial instruments are not traded in a liquid market, such as FINANCIALS applies judgement and considers relevant factors such as the currency in which the financial asset the Bank’s borrowing transactions with embedded derivative instruments. These are measured at Financial statements and notes is denominated, and the period for which the interest rate is set. In contrast, contractual terms that fair value using different valuation models and techniques. This process involves determining future Proposal by the Board of Directors introduce a more than de minimis exposure to risks or volatility in the contractual cash flows that expected cash flows, which can then be discounted to the balance sheet date. The estimation of are unrelated to a basic lending arrangement do not give rise to contractual cash flows that are future cash flows for these instruments is subject to assumptions on market data, and in some Auditor’s report solely payments of principal and interest on the amount outstanding. In such cases, the financial cases, in particular where options are involved, on the behaviour of the Bank’s counterparties. The Report of the Control Committee asset is required to be measured at fair value through profit and loss (FVTPL). fair value estimate may therefore be subject to variations. Under different market assumptions, the Chairmanship The Bank may issue loans that include features that change the contractual cash flows based values could also differ significantly. Report of the Control Committee on the borrower meeting certain contractually specified environmental, social and governance (ESG) The Bank measures fair values using the following fair value hierarchy, which reflects the Ratio definitions targets. These are known as ESG-linked (or sustainability-linked) loans. For example, the contractual significance of the inputs used in making the measurements: interest rate is reduced if the borrower meets specific targets for reducing carbon emissions. Level 1: Quoted market prices (unadjusted) in an active market for identical instruments. SUSTAINABILITY INDICES In line with the policy outlined above, if the ESG feature is assessed as resulting in a de minimis Level 2: Valuation techniques based on observable inputs, either directly (i.e. as prices) or exposure to risks or volatility in the contractual cash flows, then the ESG feature does not affect the indirectly (i.e. derived from prices). This category includes instruments valued using: quoted market classification of the loan. At present the Bank does not have any loans where the effect of the ESG prices in active markets for similar instruments, quoted prices for identical or similar instruments feature is assessed as being more than de minimis. in markets that are considered less than active or other valuation techniques where all significant inputs are directly or indirectly observable from market data. Financial assets at fair value Level 3: Valuation techniques using significant unobservable inputs. This category includes If the asset fails the amortised cost criteria the financial asset is classified as (FVTPL) or fair value all instruments where the valuation technique includes inputs not based on observable data through other comprehensive income (FVOCI). FVOCI is used to classify assets held for receipt of and where the unobservable inputs have a significant effect on the instrument’s valuation. This principal, interest and to sell. At present the Bank does not hold any FVOCI assets. All other financial category includes instruments that are valued based on quoted prices for similar instruments where assets are classified as FVTPL. significant unobservable adjustments or assumptions are required to reflect differences between the instruments. Financial Liabilities The Bank recognises transfers between levels of the fair value hierarchy as of the end of the Financial liabilities, other than loan commitments are measured at amortised cost or at FVTPL when reporting period during which the change has occurred. All level 2 valuations are based on acquired they are held for trading and derivative instruments or the fair value designation is applied. The Bank market data from external sources using NIB developed models. See Note 20 for further details. applies the fair value option on structured bonds issued as these instruments include embedded derivatives not closely related to the host contract. The change in fair value of these issued Offsetting structured bonds is recognised in the income statement except for changes in own credit risk that A financial asset and a financial liability are offset and the net amount recognised only where there are recognised in other comprehensive income. is a legal right to do so and the intention is to settle on a net basis.

106 ANNUAL REPORT 2023 INTRODUCTION Cash and cash equivalents Stage 1 - includes financial assets that have not had a significant deterioration in credit Cash and cash equivalents comprise monetary assets and placements with original maturities of quality since initial recognition or have a low risk at the reporting date. For these assets, the ECL IMPACT & SUSTAINABILITY three months or less, calculated from the date the acquisition and placements were made. is a probability-weighted result of default events that are possible within next 12 months after the GOVERNANCE Cash and cash equivalents in the cash flow statement refers to the net amount of monetary reporting date. BOD REPORT assets, placements and liabilities with original maturities of three months or less, calculated from Stage 2 - includes financial assets that have had a significant increase in credit risk (SICR) since the time the transaction was entered into. initial recognition, but which are not credit impaired. For these assets, the allowance amount is FINANCIALS calculated based on expected lifetime of the asset. A SICR is considered to have occurred if the life- Financial statements and notes Financial placements time default probability (PD) has increased significantly compared to that at the initial recognition. Proposal by the Board of Directors Items recognised as financial placements in the statement of financial position include placements For assets with an initial PD of 1 to 5 a SICR occurs after a 3-notch downgrade, for assets with an with credit institutions and placements in debt securities, for example, bonds and other debt initial PD of 6 to 10 a SICR occurs after a 2-notch downgrade whereas assets with an initial PD of 11 Auditor’s report certificates, as well as certain placements in instruments with equity features. The placements are to 19 a SICR occurs after a 1 notch downgrade. Stage 1 and 2 assets are categorised as performing Report of the Control Committee initially recognised on trade date. Their subsequent accounting treatment depends on both the assets. Chairmanship Bank’s business model for managing the placements and their contractual cash flow characteristics. Stage 3 - includes assets that have been categorised as non-performing in the Bank’s credit Report of the Control Committee rating processes. For the non-performing assets, assessment is done on an individual basis, as Ratio definitions Loans outstanding opposed to generic calculation rules for the Stage 1 and 2 assets. Exposures in default classes are The Bank’s loan transactions are recognised in the statement of financial position at the time the classified as non-performing. A default occurs with regard to an obligor when either or both of the SUSTAINABILITY INDICES funds are transferred to the borrower. Loans are recognised initially at fair value which corresponds following have taken place: to transferred funds, including transaction costs. Loans outstanding are subsequently carried at (a) NIB considers that the obligor is unlikely to pay its credit obligations in full, amortised cost except for some structured loans that do not meet the amortised cost classification (b) The obligor is past due by more than 90 and in the case of sovereign lending exposure to criteria and are therefore recorded at fair value. If the loans are hedged against changes in fair value member countries 180 days, or countries with which NIB has an existing framework agreement due to the hedged risk, the carrying value of the hedged loans are adjusted by the change in fair in place. value due to the hedged risk. Obligors that satisfy the criteria in (a) above are set to default class D1 and those that satisfy the criteria in (b) above are set to default class D2. If both criteria (a) and (b) are satisfied, the obligor is Impairment of loans set to default class D2. The bank uses an expected credit loss model (ECL) to estimate the provision for potential The Bank reviews its non-performing loans and receivables at each reporting date to assess impairments. The Bank recognises a loss allowance for ECL on financial assets measured at whether an allowance for impairment should be recorded in the statement of comprehensive amortised cost, or at fair value through comprehensive income, and for loan commitments. The income. In particular, the judgement of the management is required in estimating the amount and ECL comprises of a three-stage model based on changes in credit quality since initial recognition. timing of future cash flows when determining the level of allowance required. Such estimates are Impairments are reported based in either twelve month or lifetime expected credit losses, depending based on assumptions about a number of factors, and actual results may differ, resulting in future on the stage allocation of the financial asset. The stage allocation also determines if interest income changes to the allowance. Further details regarding the ECL model, related inputs and governance for the financial asset are reported on gross carrying amount as for Stage 1 and 2 assets or net of can be found in Note 10. impairment allowance for Stage 3 assets.
107 ANNUAL REPORT 2023 INTRODUCTION Intangible assets Fair value hedging Intangible assets mainly consist of investments in software, software licences and right-to use When a derivative is designated as the hedging instrument in a hedge of the change in fair value IMPACT & SUSTAINABILITY assets arising from leasing arrangements. Acquisitions that generate economic benefits exceeding of a recognised asset or liability or a firm commitment that could affect profit or loss, changes in GOVERNANCE costs beyond one year are recognised as intangible assets. The investments are carried at historical the fair value of the derivative are recognised immediately in profit or loss in the same line item as BOD REPORT cost, and are amortised over the assessed useful life of the assets, which is estimated to be between the changes in fair value of the hedged item due to the hedged risk. Currently the Bank's fair value three and five years. The amortisations are made on a straight-line basis. hedges mainly relate to swapping fixed to floating rates on its borrowing and lending transactions. FINANCIALS Financial statements and notes Tangible assets Foreign currency basis spread Proposal by the Board of Directors Tangible assets in the statement of financial position include land, buildings, office equipment and The bank separates the foreign currency basis spread from financial instruments used in hedging other tangible assets owned by the Bank. The assets are recognised at historical cost, less any and this separated amount is recorded in “Other comprehensive income” (OCI). Auditor’s report accumulated depreciation based on their assessed useful life. Land is not depreciated. The Bank’s Report of the Control Committee office building in Helsinki is depreciated on a straight-line basis over a 40-year period. The Bank’s Cash flow hedging Chairmanship other buildings are depreciated over a 30-year period. The depreciation period for office equipment Currently the Bank does not apply cash flow hedge accounting. Report of the Control Committee and other tangible assets is determined by assessing the individual item. The depreciation period is Ratio definitions usually three to five years. The depreciations are calculated on a straight-line basis. Discontinuance of hedge accounting If the hedging derivative expires or is sold, terminated or exercised, or the hedge no longer meets SUSTAINABILITY INDICES Write-downs and impairment of intangible and tangible assets the criteria for fair value hedge accounting, then hedge accounting is discontinued prospectively. The Bank’s assets are reviewed annually for impairment. If there is any objective evidence of Any adjustment up to the point of discontinuation to a hedged item for which the effective interest impairment, the impairment loss is determined based on the recoverable amount of the assets. method is used is amortised to profit or loss as part of the recalculated effective interest rate of the item over its remaining life. If the hedged item is derecognised, the unamortised fair value is Derivative instruments and hedge accounting recognised immediately in profit or loss. The Bank’s derivative instruments used to manage interest rate and currency risk are recognised at trade-date and subsequently measured at fair value in the statement of financial position as Debts evidenced by certificates “Other assets” or “Other liabilities”. The Bank applies hedge accounting in accordance with IFRS 9 The Bank’s borrowing transactions are recognised in the statement of financial position when drawn when the conditions set out by the standard are met. The hedge accounting is based on a clearly up. The borrowing transactions are recognised initially at a cost that comprises the fair value of the documented relationship between the item hedged and the hedging instrument. When there is an funds transferred, less transaction costs. The Bank uses derivative instruments to hedge the fair economic relationship between the hedging instrument on the one hand and the value change of the value of all its fixed rate borrowing transactions. In these instances, the carrying amount is adjusted hedged item or the cash flows generated by the hedged item on the other, the hedge is regarded as for changes in fair value due to the hedged risk, which is recognised in the income statement. effective. The hedging relationship is documented at the time the hedge transaction is entered into, Securities delivered under repurchase agreements are not derecognised from the statement of and the effectiveness of the hedge is continually assessed. Derivatives where hedge accounting is financial position. Cash received under repurchase agreements is recognised in the statement of not applied are recognised at fair value through profit and loss. financial position as “Amounts owed to credit institutions”.
108 ANNUAL REPORT 2023 INTRODUCTION Interest incentives received. Right-of-use assets are depreciated on a straight-line basis over the lease The Bank’s net interest income includes accrued interest on loans, debt securities, placements and term. The right of use assets are presented as part of intangible assets in Note 13. IMPACT & SUSTAINABILITY accruals of the premium or discount value of financial instruments. Net interest income also includes GOVERNANCE interest expenses on debts and borrowing costs measured using the effective interest method. The Lease liabilities BOD REPORT interest income for hedging swaps is classified Interest income calculated using the effective interest At the commencement date of the lease, the Bank recognises lease liabilities measured at the method if the swap is used to hedge interest income for loans. Interest on swaps hedging funding is present value of lease payments to be made over the lease term. FINANCIALS allocated to interest expense. Interest income and expense on financial assets and liabilities measured Financial statements and notes at fair value through the income statement is calculated using the contrual interest rate. Employee benefits Proposal by the Board of Directors Defined contribution plans Fees and commissions The Bank is responsible for arranging pension security for its employees. In accordance with Auditor’s report Fees collected when disbursing loans are recognised as income over the life of the loan using the the Host Country Agreement between the Bank and the Finnish Government and as part of the Report of the Control Committee effective interest rate method. Commitment fees are charged on loans that are agreed but not yet Bank’s pension arrangements, the Bank has decided to apply the Finnish state pension system. Chairmanship disbursed and are recognised in the statement of comprehensive income over the commitment period. Contributions to this pension system, which are paid into the Finnish State Pension Fund, are Report of the Control Committee calculated as a percentage of salaries. The Finnish Ministry of Finance determines the basis for the Ratio definitions Financial transactions contributions and establishes the actual percentage of the contributions in co-operation with the The Bank recognises in “Net profit on financial operations” both realised and unrealised gains and local government pension institution Keva. See Note 7. The Bank’s pension liability is completely SUSTAINABILITY INDICES losses on debt securities and other financial instruments. Adjustments for hedge accounting are covered. NIB also provides its permanent employees with a supplementary pension insurance also included in this item. scheme arranged by a private pension insurance company. This is group pension insurance based on a defined contribution plan. Obligations for contributions to defined contribution plans are expensed Leasing agreements as the related service is provided and recognised as personnel expenses in profit or loss. The Bank applies a single recognition and measurement approach for all leases, except for short-term leases and leases of low-value assets. The Bank recognises lease liabilities to make Short-term employee benefits lease payments and right-of-use assets representing the right to use the underlying assets. Short-term employee benefits are expensed as the related service is provided. The liability and asset are equal at recognition date. Short-term leases and leases of low-value assets are recognised on a straight-line basis over the lease term. Segment information Operating segments are reported in a manner consistent with the internal reporting provided to Right-of-use assets the chief operating decision maker, who is responsible for allocating resources and assessing the The Bank recognises right-of-use assets at the commencement date of the lease (i.e., the date performance of the operating segments. Segment results that are reported to the management the underlying asset is available for use). Right-of-use assets are measured at cost, less any include items directly attributable to that segment as well as other items allocated on a reasonable accumulated depreciation and impairment losses, and adjusted for any remeasurement of lease basis. As the Bank is a single entity in one location there are no unallocated items. liabilities. The cost of right-of-use assets includes the amount of lease liabilities recognised, initial direct costs incurred, and lease payments made at or before the commencement date less any lease
109 ANNUAL REPORT 2023 INTRODUCTION Note 2: Risk management IMPACT & SUSTAINABILITY GOVERNANCE Risk management framework The overall objective of the risk management framework is to maintain the Bank’s financial BOD REPORT The Bank has established a risk, capital and liquidity management framework, with high-level soundness and avoid activities that could threaten the Bank’s reputation. The Bank’s risk statutory requirements stipulated in the Statutes and the Principles for Capital and Liquidity management framework is regularly reviewed and adapted to changing conditions. The Bank’s risk FINANCIALS Management, supported by a Risk Appetite Statement (RAS), risk management policies and limits, taxonomy shows financial and non-financial sources of risk, and it supports the risk identification Financial statements and notes an Internal Capital Adequacy Assessment Process (ICAAP), and a Capital and Liquidity Recovery Plan. and assessment processes. Risk management activities are then tailored at the risk category level in Proposal by the Board of Directors In accordance with the RAS, NIB monitors international risk management regulations and standards accordance with the assessed materiality of risks. and adopts those it identifies to be relevant and represent best practice. The Bank’s risk management framework comprises risk policies and procedures formulated for Auditor’s report The Risk Appetite Statement sets the principles for the Bank’s risk-taking, risk mitigation and the identification, measurement, monitoring and reporting of risks including a comprehensive limit Report of the Control Committee risk avoidance. It aims to align willingness to take risk with the statutory requirements, strategic system for managing the exposure to quantifiable risks. The Bank recognises that effective risk Chairmanship business objectives, and capital planning. In addition, it also helps raise risk awareness across the management is based on a sound risk culture, which is characterised, among other things, by a high Report of the Control Committee organisation. The Risk Appetite Statement is made operational via specific policies and procedures, level of awareness concerning risk and risk management in the organisation. Regular training of Ratio definitions monitoring metrics, a limit system and internal controls. Adherence to the Risk Appetite Statement staff in risk-related matters is part of the Bank’s risk management practices. is continuously monitored and regularly reported to senior management, the Board of Directors SUSTAINABILITY INDICES and the Control Committee Chairmanship. The RAS is reviewed by senior management and the Risk governance Board of Directors at least on an annual basis in order to ensure that risk-taking stays within The three-lines-of-defence model provides the basis for the NIB risk governance. The model aims risk-bearing capacity. As stated in the RAS, NIB strives to maintain its issuer credit rating at to provide clear segregation of duties between units that enter into business transactions with the highest possible level, supported by strong capital and liquidity positions as well as stable customers or otherwise expose the Bank to risks, and units in charge of risk assessment, risk earnings and operational efficiency. measurement, monitoring and control. The Statutes require that NIB has in place sound and effective strategies for risk, capital, and The risk governance model, including the roles and responsibilities of the decision-making liquidity assessments, which shall be conducted at least annually and reviewed regularly. The Bank bodies, is described in more detail in the Bank’s Governance Statement and Risk Management Policy. uses its Internal Capital Adequacy Assessment Process (ICAAP) to evaluate the amount of capital and liquidity needed to cover the risks the Bank is or might be exposed to. The ICAAP is conducted on Credit risk an annual basis. The Bank maintains a sufficient amount of capital and liquidity to cover all material Credit risk is defined as the risk of loss resulting from the failure of the Bank’s borrowers and other risks and to ensure that operations can be continued without disruptions even in extremely adverse counterparties to meet their contractual financial obligations. Following from the NIB mission, most situations. The ICAAP also considers macro-prudential elements and allocates capital buffers as of the credit risk stems from the Bank’s lending operations. The Bank is also exposed to credit risk appropriate. Stress testing is used to provide a forward-looking view on the Bank’s risk exposures. in its treasury operations, where credit risk derives from the financial assets that the Bank uses for The Capital and Liquidity Recovery Plan provides a tool to manage risk, capital and liquidity investing its liquidity, such as fixed-income securities and interbank deposits, and from counterparty positions during severely adverse situations. The Bank has established a monitoring system for its credit risk via derivative instruments used for managing market risks. statutory metrics (capital ratio, leverage ratios, and liquidity survival horizon), defined escalation procedures, and designed a set of action plans to be executed in case any statutory metric is deemed to be at risk of breaching its minimum requirement. The Capital and Liquidity Recovery Plan is approved by the Board of Directors.
110 ANNUAL REPORT 2023 INTRODUCTION Credit risk management Credit risk assessment The Bank’s credit risk management builds on the principles of (1) appropriate risk diversification The counterparty’s debt servicing capacity is a key consideration for credit approval. The assessment IMPACT & SUSTAINABILITY within the scope of the mission; (2) thorough risk assessment at the credit appraisal stage; (3) of a counterparty’s creditworthiness focuses on identifying the main financial and business GOVERNANCE risk-based pricing and risk mitigation; (4) continuous risk monitoring at the individual counterparty risks related to the counterparty. Based on the assessment, a risk rating indicating the probability BOD REPORT level as well as portfolio level; (5) avoidance of undesirable risks to the extent possible. of default (PD) is assigned to the counterparty. The credit risk assessment includes the use of quantitative risk methodologies and models, qualitative assessments based on expert FINANCIALS Credit risk limits judgement, as well as use of credit rating agency ratings when available. The process of Financial statements and notes The maximum credit exposure that the Bank is willing to take is expressed in terms of exposure proposing PD ratings to counterparties is carried out in the first line of defence in the respective Proposal by the Board of Directors limits set by the Board of Directors. business area (lending or treasury). As a general principle, the Bank limits the maximum amount granted as loan or guarantee for A separate expected loss (EL) rating is assigned at the transaction level. The EL rating factors Auditor’s report a single project to 50% of the total project cost. Financing to small and medium-sized enterprises, in the loss given default (LGD), i.e., the loss severity in the event of a counterparty default. The LGD Report of the Control Committee small midcap corporates and mid-cap corporates in the Bank’s member countries can be extended assignment process relies on models that produce LGD estimates based on the type of counterparty, Chairmanship up to 75% of the total project or financing need qualifying for a NIB mandate. its balance sheet and the characteristics of the transaction, such as guarantees, collateral, the Report of the Control Committee Credit exposure is the aggregate of lending and treasury exposure. Limits at counterparty level seniority of the claim and other credit enhancing factors in the transaction. Ratio definitions are scaled to the Bank’s equity and the counterparty’s equity, determined based on the probability The second line of defence Credit function reviews risk rating proposals, providing a second of default and expected loss. The Bank defines a single counterparty as a counterparty or group of opinion (control role). Credit risk ratings (PD, LGD, EL) are ultimately approved by the Mandate, SUSTAINABILITY INDICES counterparties that are legally and/or financially consolidated or otherwise interdependent from a Credit and Compliance Committee. risk perspective. For exposure limit purposes, the Bank considers the entity where the risk resides, The Bank’s risk rating system comprises 20 classes to differentiate the risk of counterparty i.e., the risk-owner, as the counterparty. The risk-owner is the entity that is ultimately responsible for default (PD) and the expected loss (EL) on a transaction. In addition, a separate D class applies the Bank’s claim and may be different from the obligor if the risk is transferred through a guarantee. for non-performing transactions. For reference to external ratings, the internal scales are mapped In order for a guarantee to be eligible for risk transfer, it must cover the full exposure and be a to the ratings of S&P and Moody’s such that classes 1 to 10 correspond to the external rating guarantee undertaking securing the borrower’s debt “as for own debt”, meaning that the Bank can equivalent of the investment grade AAA to BBB- and Aaa to Baa3, respectively. make a claim under the guarantee immediately, unconditionally and irrevocably when the borrower In addition to counterparty and transaction level diligence and credit risk assessments, the Bank has failed to pay on a due date. applies the IFRS 9 standard for estimating expected credit losses (ECL), thereby applying forward- To prevent excessive concentrations, the Bank applies portfolio-level limits for large looking provisioning for all financial assets under scope of the ECL calculation. The ECL methodology, counterparty exposures, sectors and countries. The Bank has not set limits for the aggregate lending including the stage classification of assets, is described in more detail in Note 10: Expected credit loss. exposure in its member countries. Lending in non-member countries is subject to country limits. For the Bank’s treasury operations, country limits apply for exposure in all countries.
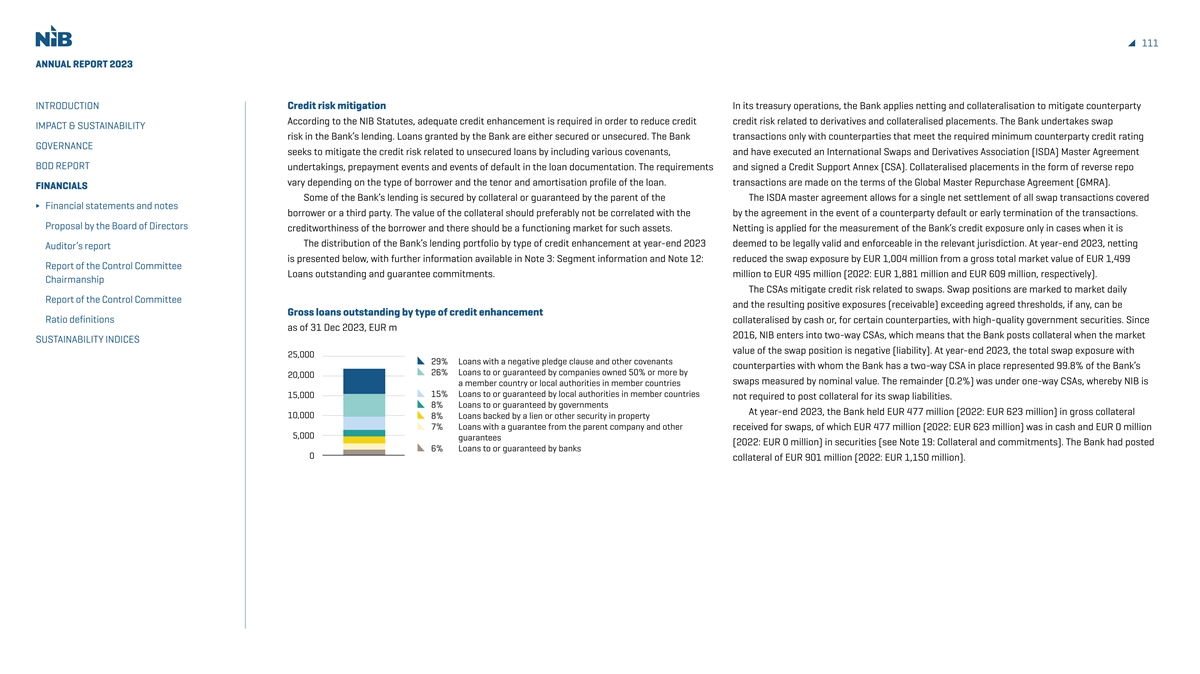
111 ANNUAL REPORT 2023 INTRODUCTION Credit risk mitigation In its treasury operations, the Bank applies netting and collateralisation to mitigate counterparty According to the NIB Statutes, adequate credit enhancement is required in order to reduce credit credit risk related to derivatives and collateralised placements. The Bank undertakes swap IMPACT & SUSTAINABILITY risk in the Bank’s lending. Loans granted by the Bank are either secured or unsecured. The Bank transactions only with counterparties that meet the required minimum counterparty credit rating GOVERNANCE seeks to mitigate the credit risk related to unsecured loans by including various covenants, and have executed an International Swaps and Derivatives Association (ISDA) Master Agreement BOD REPORT undertakings, prepayment events and events of default in the loan documentation. The requirements and signed a Credit Support Annex (CSA). Collateralised placements in the form of reverse repo vary depending on the type of borrower and the tenor and amortisation profile of the loan. transactions are made on the terms of the Global Master Repurchase Agreement (GMRA). FINANCIALS Some of the Bank’s lending is secured by collateral or guaranteed by the parent of the The ISDA master agreement allows for a single net settlement of all swap transactions covered Financial statements and notes borrower or a third party. The value of the collateral should preferably not be correlated with the by the agreement in the event of a counterparty default or early termination of the transactions. Proposal by the Board of Directors creditworthiness of the borrower and there should be a functioning market for such assets. Netting is applied for the measurement of the Bank’s credit exposure only in cases when it is The distribution of the Bank’s lending portfolio by type of credit enhancement at year-end 2023 deemed to be legally valid and enforceable in the relevant jurisdiction. At year-end 2023, netting Auditor’s report is presented below, with further information available in Note 3: Segment information and Note 12: reduced the swap exposure by EUR 1,004 million from a gross total market value of EUR 1,499 Report of the Control Committee Loans outstanding and guarantee commitments. million to EUR 495 million (2022: EUR 1,881 million and EUR 609 million, respectively). Chairmanship The CSAs mitigate credit risk related to swaps. Swap positions are marked to market daily Report of the Control Committee and the resulting positive exposures (receivable) exceeding agreed thresholds, if any, can be Gross loans outstanding by type of credit enhancement Ratio definitions collateralised by cash or, for certain counterparties, with high-quality government securities. Since as of 31 Dec 2023, EUR m 2016, NIB enters into two-way CSAs, which means that the Bank posts collateral when the market SUSTAINABILITY INDICES value of the swap position is negative (liability). At year-end 2023, the total swap exposure with 25,000 29% Loans with a negative pledge clause and other covenants counterparties with whom the Bank has a two-way CSA in place represented 99.8% of the Bank’s 26% Loans to or guaranteed by companies owned 50% or more by 20,000 swaps measured by nominal value. The remainder (0.2%) was under one-way CSAs, whereby NIB is a member country or local authorities in member countries 15,000 15% Loans to or guaranteed by local authorities in member countries not required to post collateral for its swap liabilities. 8% Loans to or guaranteed by governments At year-end 2023, the Bank held EUR 477 million (2022: EUR 623 million) in gross collateral 10,000 8% Loans backed by a lien or other security in property 7% Loans with a guarantee from the parent company and other received for swaps, of which EUR 477 million (2022: EUR 623 million) was in cash and EUR 0 million 5,000 guarantees (2022: EUR 0 million) in securities (see Note 19: Collateral and commitments). The Bank had posted 6% Loans to or guaranteed by banks 0 collateral of EUR 901 million (2022: EUR 1,150 million).
112 ANNUAL REPORT 2023 INTRODUCTION Credit risk monitoring The Bank puts strong emphasis on continuous monitoring of the credit risk development in its Credit risk limits are changed from time to time depending on the available financial resources IMPACT & SUSTAINABILITY lending and treasury operations. Credit risk is monitored both at counterparty level and at portfolio and changes in the risk appetite. The policy level risk limits are approved by the Board of Directors. GOVERNANCE levels (e.g. sector, country as well as total portfolio level). The primary responsibility for credit risk Limit monitoring is conducted on a regular basis and breaches are reported to the relevant BOD REPORT monitoring resides with the department/unit responsible for the client relationship i.e., Lending, committees, senior management and to the Board of Directors. Treasury and/or Special Credits. The Risk & Compliance department independently controls and FINANCIALS monitors the risk positions of the Bank and regularly reports to all relevant committees and Risk-based pricing Financial statements and notes decision-making bodies as needed. The Statutes stipulate that the Bank shall operate according to sound banking principles and aim for Proposal by the Board of Directors All lending exposures are subject to continuous monitoring of contractual compliance a profit allowing the formation of reserves and a reasonable return on capital. Loans and guarantees and events or signals that could potentially lead to or indicate a material change in credit risk. are priced to cover the Bank’s cost of funds, administration costs, the cost of risk involved in the Auditor’s report In addition, an annual follow-up is conducted on the entire loan portfolio. transaction and the cost of capital employed. For loan pricing purposes, the Bank uses a pricing tool Report of the Control Committee Treasury exposures are subject to continuous monitoring of events and market signals which calculates the minimum earnings required on a loan in order to cover all lending-related costs Chairmanship that could potentially lead to or indicate a material change in credit risk. The risk class of the and an appropriate return for the level of risk assumed. Internal credit risk ratings and associated Report of the Control Committee counterparties are reassessed regularly. The follow-up is presented to the Mandate, Credit and risk parameters, as well as the structure of the transaction, are key input factors in the pricing tool. Ratio definitions Compliance Committee. If a counterparty is identified as having seriously deteriorated debt repayment capacity and/or Credit risk exposure SUSTAINABILITY INDICES a serious deterioration in its financial standing, it is placed on the watch-list and becomes subject Tables 1 to 3 below provide an overview of the Bank’s aggregate credit risk exposure at year-end 2023, to specific watch-list monitoring. Watch-listed counterparties are reviewed by the Mandate, Credit distributed by expected loss (EL) ratings. Aggregate credit exposure comprises lending and treasury and Compliance Committee at agreed frequency and reported to the Board of Directors. If a credit exposure. Lending exposure includes loans outstanding and loan commitments, without taking into exposure requires the expertise of specialists in workout and restructuring, it is transferred to the account any collateral or other credit enhancement. Regarding the treasury exposure, capital market Special Credits function. The function’s primary objective is to take over responsibility for distressed investments are included at nominal value, while derivatives are included at market value net of exposures and devote sufficient time and effort to such cases to ensure the Bank recovers as much collateral. The exposure in reverse repo transactions is calculated as a fixed percentage of the nominal as possible from distressed exposures outstanding. value of the transaction, thus reflecting the collateralised nature of these placements. Credit risk monitoring at portfolio level includes, inter alia, an analysis of the aggregate credit risk exposure, credit risk concentrations and changes in the risk profile. The development is reported to the Asset, Liability and Risk Committee, the Executive Committee, and the Board of Directors.

113 ANNUAL REPORT 2023 INTRODUCTION TABLE 1. Credit risk exposure by internal rating based on expected loss (EL) TABLE 2. Geographical distribution of the credit risk exposure (in EUR million) (in EUR million) IMPACT & SUSTAINABILITY GOVERNANCE Risk S&P 31 December 2023 31 December 2022 31 December 2023 31 December 2022 class equivalent Lending Treasury Total Lending Treasury Total Country/Region Lending Treasury Total Lending Treasury Total BOD REPORT 1–2 AAA/AA+ 6,376 8,941 15,318 6,380 7,829 14,208 Denmark 2,933 1,551 4,484 2,845 1,833 4,678 FINANCIALS 3–4 AA/AA- 719 1,530 2,249 1,430 1,787 3,218 Estonia 1,218 85 1,303 1,105 35 1,140 5–6 A+/A 3,135 821 3,956 3,426 1,171 4,597 Finland 4,566 1,846 6,413 4,789 1,630 6,419 Financial statements and notes 7–8 A-/BBB+ 5,721 171 5,892 5,659 217 5,876 Iceland 810 70 880 672 70 742 Proposal by the Board of Directors 9–10 BBB/BBB- 5,542 163 5,705 5,859 157 6,017 Latvia 345 120 465 845 145 990 11–12 BB+/BB 1,757 8 1,765 1,564 0 1,564 Lithuania 1,300 100 1,400 1,284 100 1,384 Auditor’s report 13–14 BB/BB- 164 0 164 398 0 398 Norway 4,805 1,349 6,154 5,350 1,263 6,613 Report of the Control Committee 15–16 BB-/B+ 218 0 218 70 0 70 Sweden 7,001 1,230 8,232 7,208 1,189 8,398 Chairmanship 17–18 B/B- 8 0 8 10 0 10 Africa and Middle East 8 0 8 14 0 14 19–20 B-/CCC 0 0 0 4 0 4 Americas 0 1,301 1,301 1 1,215 1,215 Report of the Control Committee D 0 0 0 0 0 0 Asia-Pacific 180 171 351 198 106 304 Ratio definitions TOTAL 23,640 11,634 35,274 24,800 11,161 35,962 Europe 380 3,032 3,412 310 2,907 3,218 Multilaterals 94 777 871 177 668 846 SUSTAINABILITY INDICES Class D Total 23,640 11,634 35,274 24,800 11,161 35,962 Gross 9 0 9 10 0 10 Impairment 9 0 9 10 0 10 Net 0 0 0 0 0 0 In terms of geographical distribution, the credit risk exposure distribution remained stable across the Nordic and Baltic region. At year-end 2023, the member countries accounted for 97% of the The quality of the Bank’s aggregate credit exposure remained sound in 2023. Lending exposure Bank’s lending exposure (2022: 97%). The largest lending exposure outside the member countries decreased by 5% compared to 2022. Close to 82% of disbursements were to investment-grade was in Poland. Of the treasury exposure, 55% (2022: 56%) was in the member countries, while the (EL 1-10) counterparties and largely driven by the utilities, financials, and industrials sectors. rest of Europe, excluding exposures to multilateral institutions, accounted for 26% (2022: 26%), Treasury exposure increased by 4% compared to the previous year. At year-end 2023, 91% (2022: 92%) dominated by Germany and France. Most of the treasury exposure outside Europe was in Canada. of lending exposure and 100% (2022: 100%) of the treasury exposure were in risk classes EL 1-10, corresponding to investment-grade quality. Exposure in risk class D (non-performing) was down to EUR 9 million (2022: EUR 10 million).
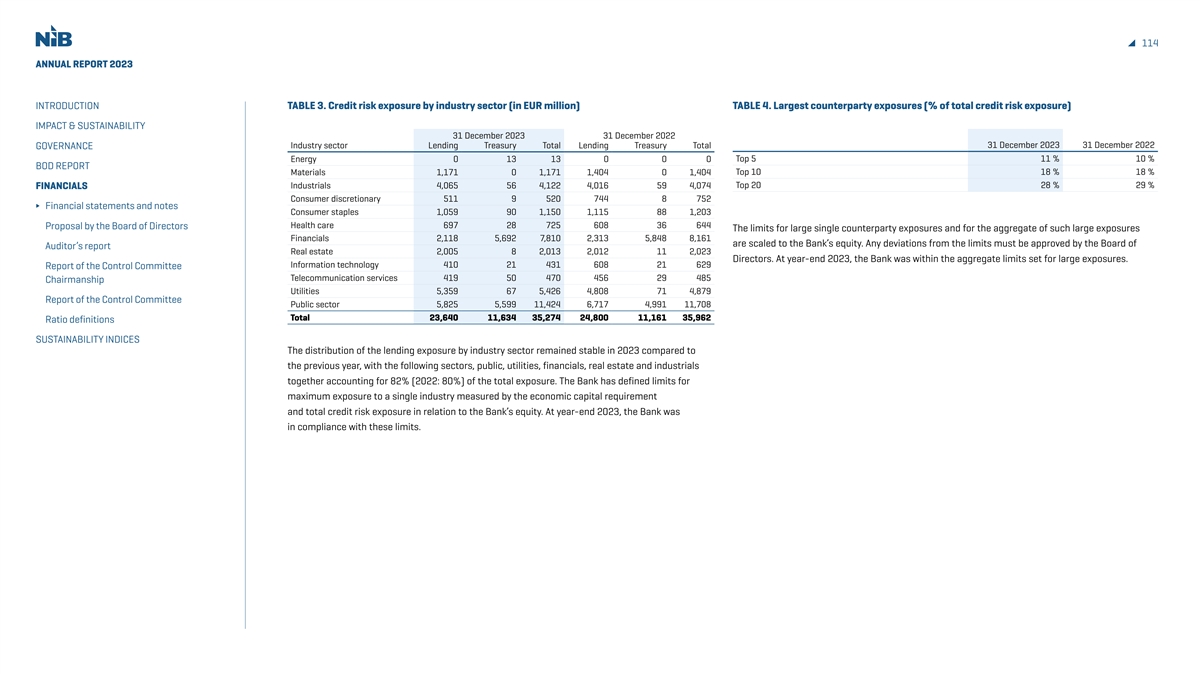
114 ANNUAL REPORT 2023 INTRODUCTION TABLE 3. Credit risk exposure by industry sector (in EUR million) TABLE 4. Largest counterparty exposures (% of total credit risk exposure) IMPACT & SUSTAINABILITY 31 December 2023 31 December 2022 31 December 2023 31 December 2022 Industry sector Lending Treasury Total Lending Treasury Total GOVERNANCE Energy 0 13 13 0 0 0 Top 5 11 % 10 % BOD REPORT Top 10 18 % 18 % Materials 1,171 0 1,171 1,404 0 1,404 Industrials 4,065 56 4,122 4,016 59 4,074 Top 20 28 % 29 % FINANCIALS Consumer discretionary 511 9 520 744 8 752 Financial statements and notes Consumer staples 1,059 90 1,150 1,115 88 1,203 Health care 697 28 725 608 36 644 Proposal by the Board of Directors The limits for large single counterparty exposures and for the aggregate of such large exposures Financials 2,118 5,692 7,810 2,313 5,848 8,161 are scaled to the Bank’s equity. Any deviations from the limits must be approved by the Board of Auditor’s report Real estate 2,005 8 2,013 2,012 11 2,023 Directors. At year-end 2023, the Bank was within the aggregate limits set for large exposures. Information technology 410 21 431 608 21 629 Report of the Control Committee Telecommunication services 419 50 470 456 29 485 Chairmanship Utilities 5,359 67 5,426 4,808 71 4,879 Report of the Control Committee Public sector 5,825 5,599 11,424 6,717 4,991 11,708 Total 23,640 11,634 35,274 24,800 11,161 35,962 Ratio definitions SUSTAINABILITY INDICES The distribution of the lending exposure by industry sector remained stable in 2023 compared to the previous year, with the following sectors, public, utilities, financials, real estate and industrials together accounting for 82% (2022: 80%) of the total exposure. The Bank has defined limits for maximum exposure to a single industry measured by the economic capital requirement and total credit risk exposure in relation to the Bank’s equity. At year-end 2023, the Bank was in compliance with these limits.
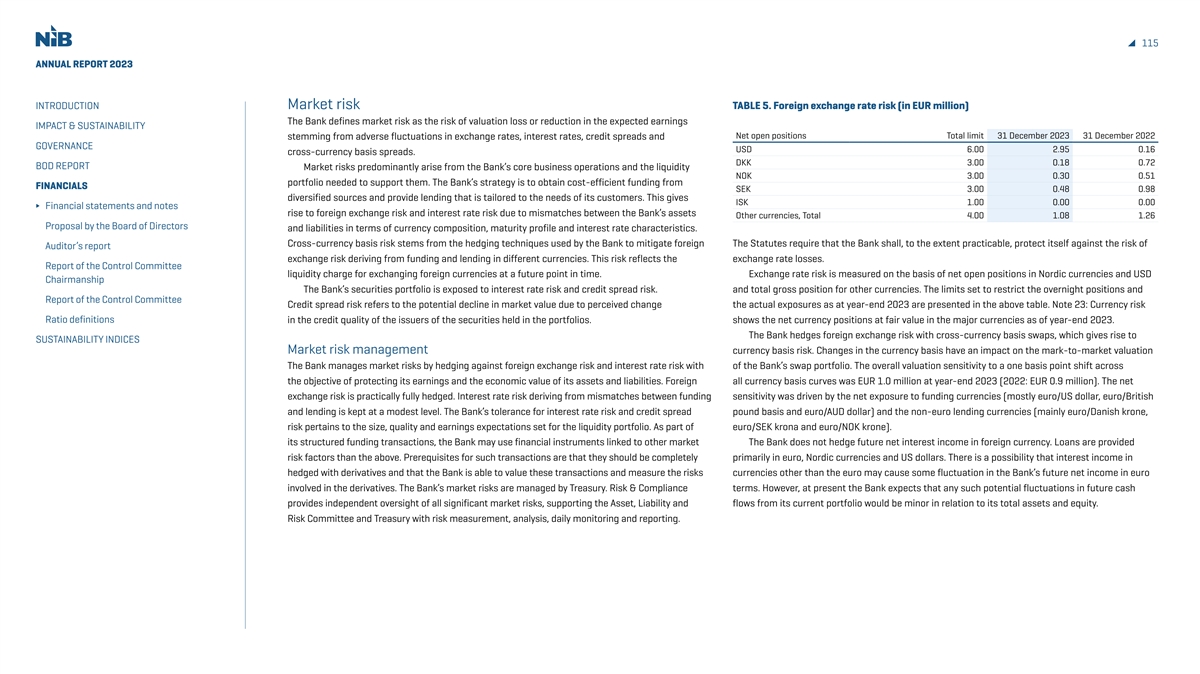
115 ANNUAL REPORT 2023 INTRODUCTION Market risk TABLE 5. Foreign exchange rate risk (in EUR million) The Bank defines market risk as the risk of valuation loss or reduction in the expected earnings IMPACT & SUSTAINABILITY Net open positions Total limit 31 December 2023 31 December 2022 stemming from adverse fluctuations in exchange rates, interest rates, credit spreads and GOVERNANCE USD 6.00 2.95 0.16 cross-currency basis spreads. DKK 3.00 0.18 0.72 BOD REPORT Market risks predominantly arise from the Bank’s core business operations and the liquidity NOK 3.00 0.30 0.51 portfolio needed to support them. The Bank’s strategy is to obtain cost-efficient funding from FINANCIALS SEK 3.00 0.48 0.98 diversified sources and provide lending that is tailored to the needs of its customers. This gives ISK 1.00 0.00 0.00 Financial statements and notes rise to foreign exchange risk and interest rate risk due to mismatches between the Bank’s assets Other currencies, Total 4.00 1.08 1.26 Proposal by the Board of Directors and liabilities in terms of currency composition, maturity profile and interest rate characteristics. Cross-currency basis risk stems from the hedging techniques used by the Bank to mitigate foreign The Statutes require that the Bank shall, to the extent practicable, protect itself against the risk of Auditor’s report exchange risk deriving from funding and lending in different currencies. This risk reflects the exchange rate losses. Report of the Control Committee liquidity charge for exchanging foreign currencies at a future point in time. Exchange rate risk is measured on the basis of net open positions in Nordic currencies and USD Chairmanship The Bank’s securities portfolio is exposed to interest rate risk and credit spread risk. and total gross position for other currencies. The limits set to restrict the overnight positions and Report of the Control Committee Credit spread risk refers to the potential decline in market value due to perceived change the actual exposures as at year-end 2023 are presented in the above table. Note 23: Currency risk Ratio definitions in the credit quality of the issuers of the securities held in the portfolios. shows the net currency positions at fair value in the major currencies as of year-end 2023. The Bank hedges foreign exchange risk with cross-currency basis swaps, which gives rise to SUSTAINABILITY INDICES Market risk management currency basis risk. Changes in the currency basis have an impact on the mark-to-market valuation The Bank manages market risks by hedging against foreign exchange risk and interest rate risk with of the Bank’s swap portfolio. The overall valuation sensitivity to a one basis point shift across the objective of protecting its earnings and the economic value of its assets and liabilities. Foreign all currency basis curves was EUR 1.0 million at year-end 2023 (2022: EUR 0.9 million). The net exchange risk is practically fully hedged. Interest rate risk deriving from mismatches between funding sensitivity was driven by the net exposure to funding currencies (mostly euro/US dollar, euro/British and lending is kept at a modest level. The Bank’s tolerance for interest rate risk and credit spread pound basis and euro/AUD dollar) and the non-euro lending currencies (mainly euro/Danish krone, risk pertains to the size, quality and earnings expectations set for the liquidity portfolio. As part of euro/SEK krona and euro/NOK krone). its structured funding transactions, the Bank may use financial instruments linked to other market The Bank does not hedge future net interest income in foreign currency. Loans are provided risk factors than the above. Prerequisites for such transactions are that they should be completely primarily in euro, Nordic currencies and US dollars. There is a possibility that interest income in hedged with derivatives and that the Bank is able to value these transactions and measure the risks currencies other than the euro may cause some fluctuation in the Bank’s future net income in euro involved in the derivatives. The Bank’s market risks are managed by Treasury. Risk & Compliance terms. However, at present the Bank expects that any such potential fluctuations in future cash provides independent oversight of all significant market risks, supporting the Asset, Liability and flows from its current portfolio would be minor in relation to its total assets and equity. Risk Committee and Treasury with risk measurement, analysis, daily monitoring and reporting.
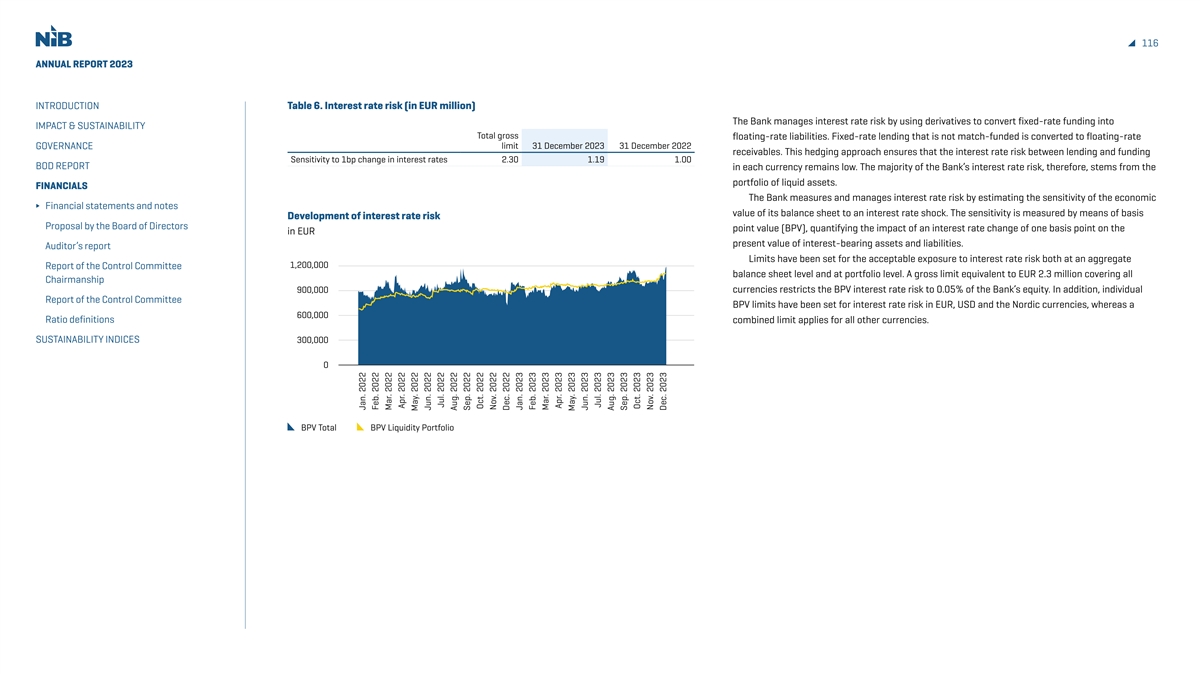
116 ANNUAL REPORT 2023 INTRODUCTION Table 6. Interest rate risk (in EUR million) The Bank manages interest rate risk by using derivatives to convert fixed-rate funding into IMPACT & SUSTAINABILITY Total gross floating-rate liabilities. Fixed-rate lending that is not match-funded is converted to floating-rate limit 31 December 2023 31 December 2022 GOVERNANCE receivables. This hedging approach ensures that the interest rate risk between lending and funding Sensitivity to 1bp change in interest rates 2.30 1.19 1.00 BOD REPORT in each currency remains low. The majority of the Bank’s interest rate risk, therefore, stems from the portfolio of liquid assets. FINANCIALS The Bank measures and manages interest rate risk by estimating the sensitivity of the economic Financial statements and notes value of its balance sheet to an interest rate shock. The sensitivity is measured by means of basis Development of interest rate risk Proposal by the Board of Directors point value (BPV), quantifying the impact of an interest rate change of one basis point on the in EUR present value of interest-bearing assets and liabilities. Auditor’s report Limits have been set for the acceptable exposure to interest rate risk both at an aggregate 1,200,000 Report of the Control Committee balance sheet level and at portfolio level. A gross limit equivalent to EUR 2.3 million covering all Chairmanship currencies restricts the BPV interest rate risk to 0.05% of the Bank’s equity. In addition, individual 900,000 Report of the Control Committee BPV limits have been set for interest rate risk in EUR, USD and the Nordic currencies, whereas a 600,000 Ratio definitions combined limit applies for all other currencies. SUSTAINABILITY INDICES 300,000 0 BPV Total BPV Liquidity Portfolio Jan. 2022 Feb. 2022 Mar. 2022 Apr. 2022 May. 2022 Jun. 2022 Jul. 2022 Aug. 2022 Sep. 2022 Oct. 2022 Nov. 2022 Dec. 2022 Jan. 2023 Feb. 2023 Mar. 2023 Apr. 2023 May. 2023 Jun. 2023 Jul. 2023 Aug. 2023 Sep. 2023 Oct. 2023 Nov. 2023 Dec. 2023

117 ANNUAL REPORT 2023 INTRODUCTION TABLE 7. Credit spread risk (in EUR million) Liquidity risk Liquidity risk is defined as the risk of incurring losses due to an inability to meet payment obligations IMPACT & SUSTAINABILITY Total limit 31 December 2023 31 December 2022 in a timely manner when they become due. The Bank categorises liquidity risk into funding liquidity GOVERNANCE Sensitivity to 1bp change in credit spreads 4.00 2.70 2.22 risk, which occurs when payment obligations cannot be fulfilled because of an inability to obtain new BOD REPORT funding, and market liquidity risk, which occurs when the Bank is unable to sell or transform assets in the liquidity buffer into cash without significant losses. FINANCIALS Development of credit spread risk Financial statements and notes Liquidity risk management in EUR Proposal by the Board of Directors The Bank’s business model gives rise to liquidity risk mainly through maturity mismatches between assets (loans and treasury investments) and liabilities (borrowing and equity). The liquidity position Auditor’s report 3,000,000 and adherence to exposure limits is managed by Treasury and monitored by Risk & Compliance on a 2,500,000 Report of the Control Committee daily basis. Chairmanship 2,000,000 The Asset, Liability and Risk Committee oversees the development of the Bank’s funding and 1,500,000 Report of the Control Committee liquidity positions and decides on liquidity risk-related matters in accordance with its mandate. The 1,000,000 Ratio definitions Board of Directors receives regular reports on the funding and liquidity situation of the Bank. 500,000 The key metric applied for managing liquidity risk is the survival horizon, which measures how SUSTAINABILITY INDICES 0 long the Bank would be able to fulfil its payment obligations in a severe stress scenario. The target value for this metric is twelve months, the Board of Directors minimum accepted value is nine months, while the Bank’s Statutes require a minimum of six months. The stress scenario includes, among other things, the assumption of payment disruptions in the loan portfolio, no access to Sovereign Other public sector Covered bonds Financials Other market funding, early termination of all callable funding transactions, collateral provided for swap exposure and severe decline of asset value in the liquidity buffer. At year-end 2023, the survival horizon was 461 days (2022: 417 days). The Bank manages its exposure to credit spread risk by measuring the sensitivity of its portfolios of In addition, the Bank requires that the liquidity position should be strong enough to maintain the marketable securities to credit spread movements. The sensitivity is measured by means of Credit highest possible issuer credit rating by S&P (AAA) and Moody’s (Aaa) and fulfil the liquidity coverage Spread Basis Point Value (Spread BPV), quantifying the impact of a one basis point increase in credit ratio (LCR) and net stable funding ratio (NSFR) requirements as set in the Liquidity Policy and spreads on the present value of the assets. defined in the European banking sector regulations and standards. At year-end 2023 the LCR was Limits have been defined to restrict the decrease in asset value to an acceptable level in 4,398% (2022: 1,176%) and the NFSR 163% (2022: 164%). accordance with the Bank’s willingness to accept risk in its liquidity portfolio and in the portfolio The Bank’s liquidity buffer comprises unencumbered cash, deposits and securities denominated of labelled bond investments. The Bank has set an overall limit of EUR 4.0 million for credit spread in EUR, USD and the Nordic currencies. In order to ensure that the market value and liquidity of risk, with specific sub-limits defined for various asset classes. To ensure that the liquidity portfolio the buffer is preserved during adverse market conditions, the Bank has set strict rules for the maintains its market value and liquidity under severe market conditions, the assets in the portfolio composition of the buffer. As such, the buffer must include a minimum level of High Quality Liquid must satisfy minimum rating requirements and other quality criteria. Assets (HQLA) as defined in the European banking sector regulations and a minimum level of assets Jan. 2022 Feb. 2022 Mar. 2022 Apr. 2022 May. 2022 Jun. 2022 Jul. 2022 Aug. 2022 Sep. 2022 Oct. 2022 Nov. 2022 Dec. 2022 Jan. 2023 Feb. 2023 Mar. 2023 Apr. 2023 May. 2023 Jun. 2023 Jul. 2023 Aug. 2023 Sep. 2023 Oct. 2023 Nov. 2023 Dec. 2023
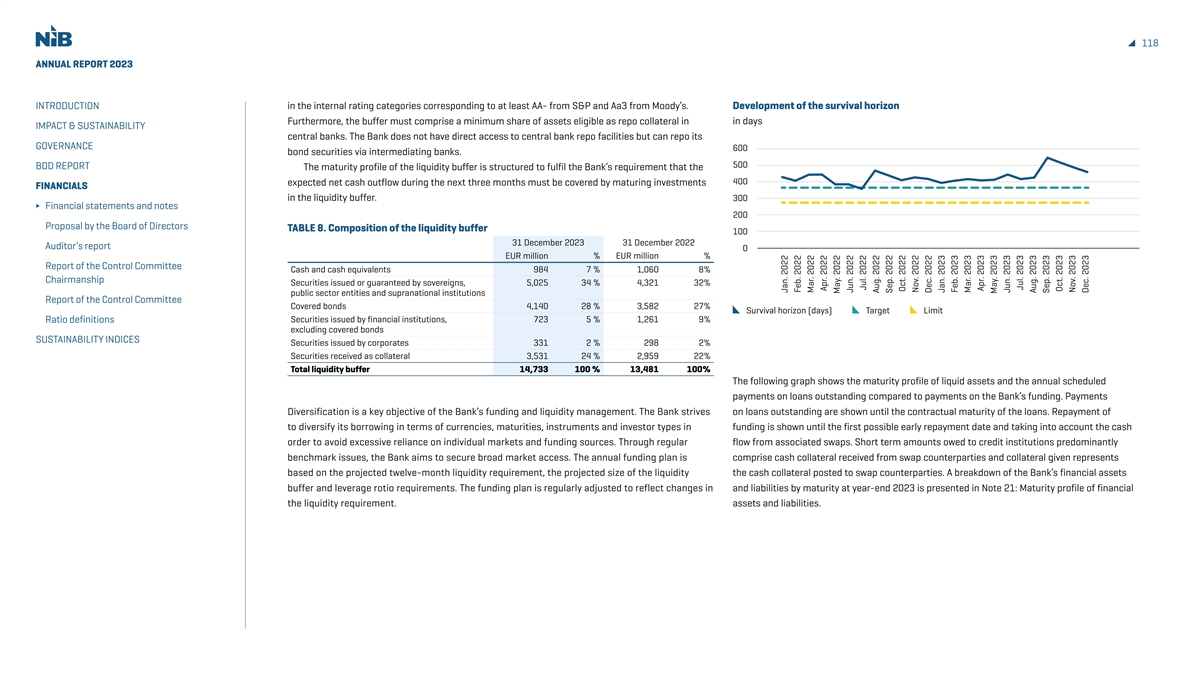
118 ANNUAL REPORT 2023 INTRODUCTION in the internal rating categories corresponding to at least AA- from S&P and Aa3 from Moody’s. Development of the survival horizon Furthermore, the buffer must comprise a minimum share of assets eligible as repo collateral in in days IMPACT & SUSTAINABILITY central banks. The Bank does not have direct access to central bank repo facilities but can repo its GOVERNANCE 600 bond securities via intermediating banks. 500 BOD REPORT The maturity profile of the liquidity buffer is structured to fulfil the Bank’s requirement that the 400 expected net cash outflow during the next three months must be covered by maturing investments FINANCIALS in the liquidity buffer. 300 Financial statements and notes 200 Proposal by the Board of Directors TABLE 8. Composition of the liquidity buffer 100 31 December 2023 31 December 2022 Auditor’s report 0 EUR million % EUR million % Report of the Control Committee Cash and cash equivalents 984 7 % 1,060 8% Chairmanship Securities issued or guaranteed by sovereigns, 5,025 34 % 4,321 32% public sector entities and supranational institutions Report of the Control Committee Covered bonds 4,140 28 % 3,582 27% Survival horizon (days) Target Limit Ratio definitions Securities issued by financial institutions, 723 5 % 1,261 9% excluding covered bonds SUSTAINABILITY INDICES Securities issued by corporates 331 2 % 298 2% Securities received as collateral 3,531 24 % 2,959 22% Total liquidity buffer 14,733 100 % 13,481 100% The following graph shows the maturity profile of liquid assets and the annual scheduled payments on loans outstanding compared to payments on the Bank’s funding. Payments Diversification is a key objective of the Bank’s funding and liquidity management. The Bank strives on loans outstanding are shown until the contractual maturity of the loans. Repayment of to diversify its borrowing in terms of currencies, maturities, instruments and investor types in funding is shown until the first possible early repayment date and taking into account the cash order to avoid excessive reliance on individual markets and funding sources. Through regular flow from associated swaps. Short term amounts owed to credit institutions predominantly benchmark issues, the Bank aims to secure broad market access. The annual funding plan is comprise cash collateral received from swap counterparties and collateral given represents based on the projected twelve-month liquidity requirement, the projected size of the liquidity the cash collateral posted to swap counterparties. A breakdown of the Bank’s financial assets buffer and leverage rotio requirements. The funding plan is regularly adjusted to reflect changes in and liabilities by maturity at year-end 2023 is presented in Note 21: Maturity profile of financial the liquidity requirement. assets and liabilities. Jan. 2022 Feb. 2022 Mar. 2022 Apr. 2022 May. 2022 Jun. 2022 Jul. 2022 Aug. 2022 Sep. 2022 Oct. 2022 Nov. 2022 Dec. 2022 Jan. 2023 Feb. 2023 Mar. 2023 Apr. 2023 May. 2023 Jun. 2023 Jul. 2023 Aug. 2023 Sep. 2023 Oct. 2023 Nov. 2023 Dec. 2023
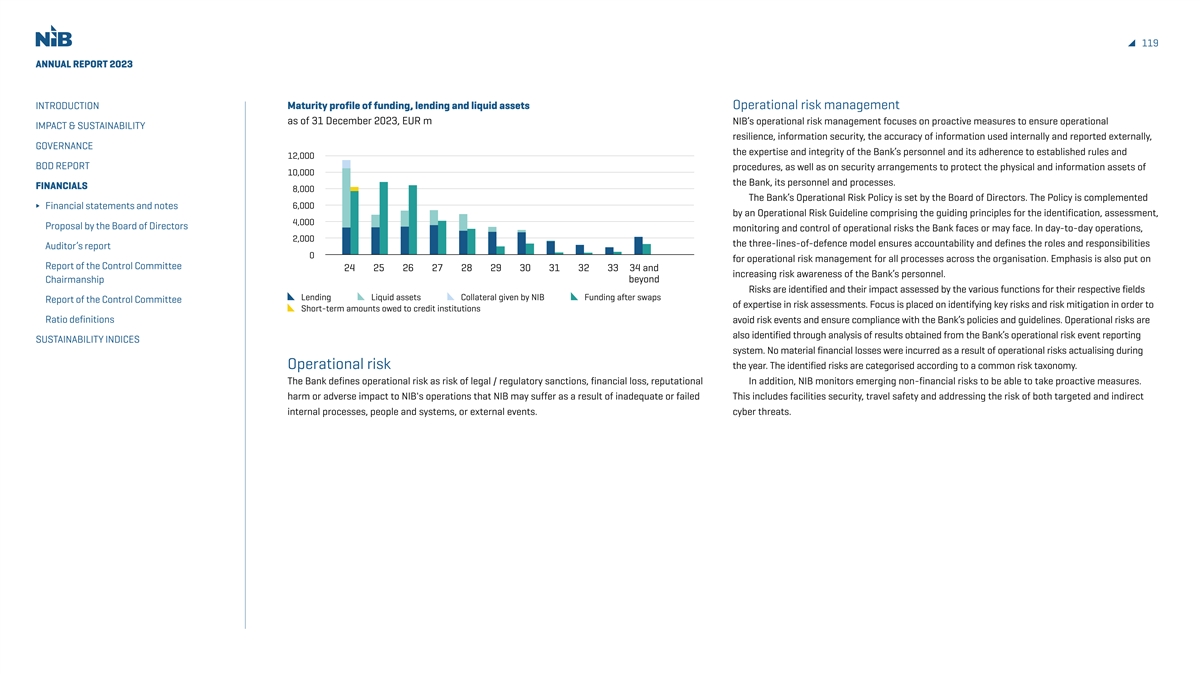
119 ANNUAL REPORT 2023 INTRODUCTION Maturity profile of funding, lending and liquid assets Operational risk management as of 31 December 2023, EUR m NIB’s operational risk management focuses on proactive measures to ensure operational IMPACT & SUSTAINABILITY resilience, information security, the accuracy of information used internally and reported externally, GOVERNANCE the expertise and integrity of the Bank’s personnel and its adherence to established rules and 12,000 BOD REPORT procedures, as well as on security arrangements to protect the physical and information assets of 10,000 the Bank, its personnel and processes. FINANCIALS 8,000 The Bank’s Operational Risk Policy is set by the Board of Directors. The Policy is complemented 6,000 Financial statements and notes by an Operational Risk Guideline comprising the guiding principles for the identification, assessment, 4,000 Proposal by the Board of Directors monitoring and control of operational risks the Bank faces or may face. In day-to-day operations, 2,000 the three-lines-of-defence model ensures accountability and defines the roles and responsibilities Auditor’s report 0 for operational risk management for all processes across the organisation. Emphasis is also put on Report of the Control Committee 24 25 26 27 28 29 30 31 32 33 34 and increasing risk awareness of the Bank’s personnel. beyond Chairmanship Risks are identified and their impact assessed by the various functions for their respective fields L ending Liquid assets Collateral given by NIB Funding after swaps Report of the Control Committee of expertise in risk assessments. Focus is placed on identifying key risks and risk mitigation in order to Short-term amounts owed to credit institutions Ratio definitions avoid risk events and ensure compliance with the Bank’s policies and guidelines. Operational risks are also identified through analysis of results obtained from the Bank’s operational risk event reporting SUSTAINABILITY INDICES system. No material financial losses were incurred as a result of operational risks actualising during Operational risk the year. The identified risks are categorised according to a common risk taxonomy. The Bank defines operational risk as risk of legal / regulatory sanctions, financial loss, reputational In addition, NIB monitors emerging non-financial risks to be able to take proactive measures. harm or adverse impact to NIB's operations that NIB may suffer as a result of inadequate or failed This includes facilities security, travel safety and addressing the risk of both targeted and indirect internal processes, people and systems, or external events. cyber threats.
120 ANNUAL REPORT 2023 INTRODUCTION Integrity and compliance risk The Bank’s Codes of Conduct govern the integrity of its own activities and set the values and Integrity risk at NIB encompasses financial crime risk, meaning loss or reputational risk resulting standards expected from staff and members of the governing bodies. In 2023, NIB updated its IMPACT & SUSTAINABILITY from failure to identify or manage risk of money laundering, sanctions, bribery, or corruption arising Codes to provide clearer guidance around maintaining a respectful workplace, transparency, and GOVERNANCE from the Bank’s operations, and conduct risk, which pertains to risk in terms of conflict of interest, management of conflicts of interest. BOD REPORT insider trading and other issues related to the professional conduct of members of NIB’s governing Further, NIB places particular emphasis on ensuring that it understands the integrity risks bodies and its staff. associated with the third parties it engages with. This is achieved through investing significant FINANCIALS The Bank is committed to following international best practices and market standards in the efforts in the Integrity Due Diligence applicable to customers and other counterparties. Financial statements and notes areas of accountability, governance, corporate social responsibility, transparency and business Allegations of fraud, corruption, collusion or any other prohibited practices related to the Proposal by the Board of Directors ethics. Consequently, the Bank’s policies draw upon relevant market standards; in particular the Bank’s projects and allegations of misconduct by staff are investigated in accordance with NIB’s International Financial Institutions’ Uniform Framework for Preventing and Combating Fraud and Investigation and Enforcement Policy. In 2023, no new investigations of allegations of prohibited Auditor’s report Corruption, which the Bank has endorsed. practices were initiated, and no sanctions decisions were issued. Report of the Control Committee The Integrity & Compliance Office (ICO) oversees and coordinates matters relating to integrity The CCO is also the appointed Data Protection Officer, who monitors the processing of personal Chairmanship risks and provides independent advice to NIB’s staff, management, and the Board of Directors. The data within NIB and acts as the contact point for data subjects in matters regarding the processing Report of the Control Committee Chief Compliance Officer (CCO) reports to the Chief Risk Officer, with a dotted line to the President of their personal data. Ratio definitions and unrestricted access to the chairpersons of the Board and the Control Committee. Once a year, ICO publishes its Integrity Report, which is available on the Bank’s website. SUSTAINABILITY INDICES
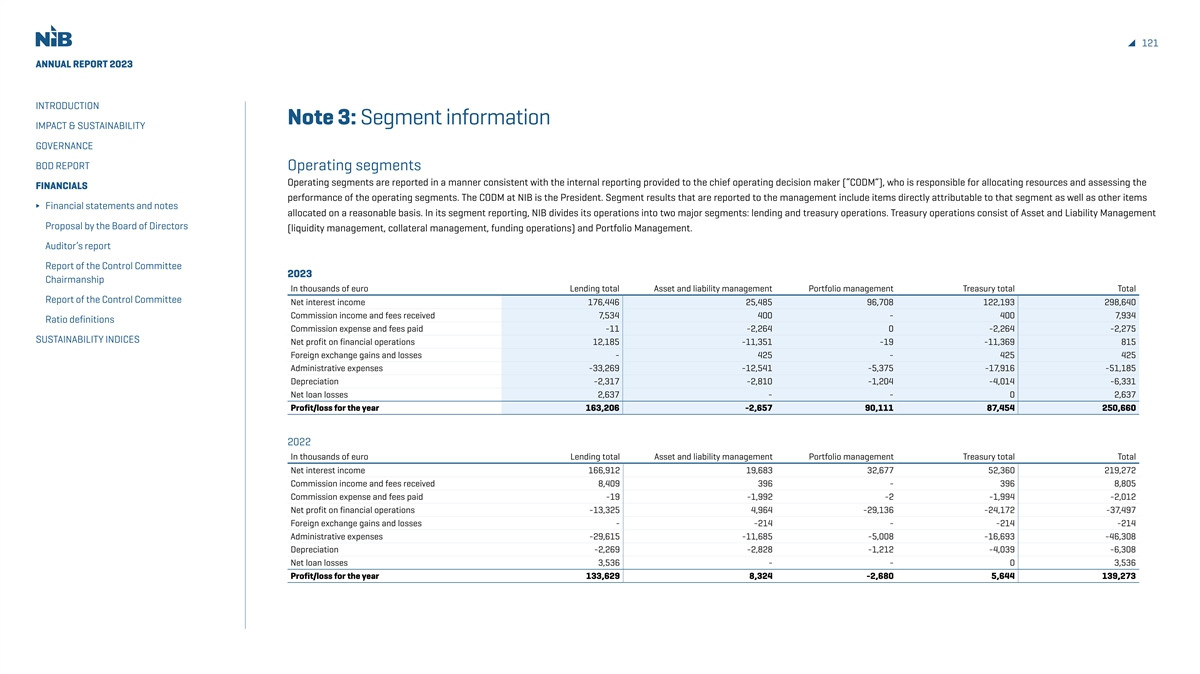
121 ANNUAL REPORT 2023 INTRODUCTION Note 3: Segment information IMPACT & SUSTAINABILITY GOVERNANCE BOD REPORT Operating segments Operating segments are reported in a manner consistent with the internal reporting provided to the chief operating decision maker (“CODM”), who is responsible for allocating resources and assessing the FINANCIALS performance of the operating segments. The CODM at NIB is the President. Segment results that are reported to the management include items directly attributable to that segment as well as other items Financial statements and notes allocated on a reasonable basis. In its segment reporting, NIB divides its operations into two major segments: lending and treasury operations. Treasury operations consist of Asset and Liability Management Proposal by the Board of Directors (liquidity management, collateral management, funding operations) and Portfolio Management. Auditor’s report Report of the Control Committee 2023 Chairmanship In thousands of euro Lending total Asset and liability management Portfolio management Treasury total Total Report of the Control Committee Net interest income 176,446 25,485 96,708 122,193 298,640 Commission income and fees received 7,534 400 - 400 7,934 Ratio definitions Commission expense and fees paid -11 -2,264 0 -2,264 -2,275 SUSTAINABILITY INDICES Net profit on financial operations 12,185 -11,351 -19 -11,369 815 Foreign exchange gains and losses - 425 - 425 425 Administrative expenses -33,269 -12,541 -5,375 -17,916 -51,185 Depreciation -2,317 -2,810 -1,204 -4,014 -6,331 Net loan losses 2,637 - - 0 2,637 Profit/loss for the year 163,206 -2,657 90,111 87,454 250,660 2022 In thousands of euro Lending total Asset and liability management Portfolio management Treasury total Total Net interest income 166,912 19,683 32,677 52,360 219,272 Commission income and fees received 8,409 396 - 396 8,805 Commission expense and fees paid -19 -1,992 -2 -1,994 -2,012 Net profit on financial operations -13,325 4,964 -29,136 -24,172 -37,497 Foreign exchange gains and losses - -214 - -214 -214 Administrative expenses -29,615 -11,685 -5,008 -16,693 -46,308 Depreciation -2,269 -2,828 -1,212 -4,039 -6,308 Net loan losses 3,536 - - 0 3,536 Profit/loss for the year 133,629 8,324 -2,680 5,644 139,273
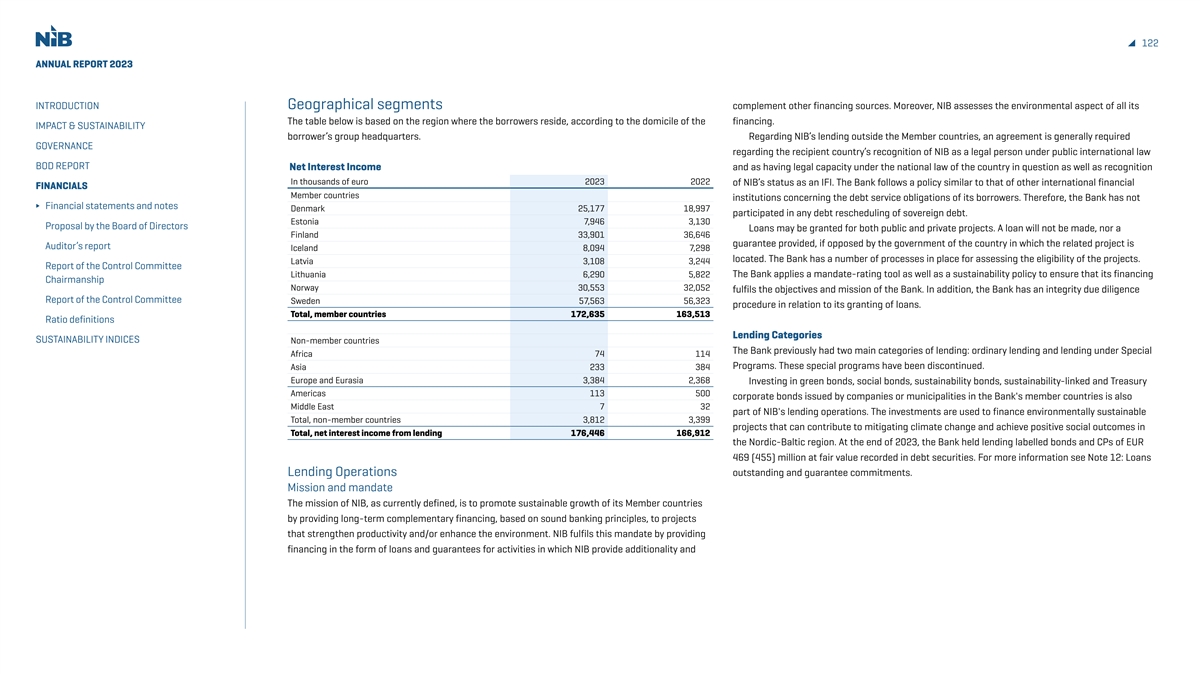
122 ANNUAL REPORT 2023 INTRODUCTION Geographical segments complement other financing sources. Moreover, NIB assesses the environmental aspect of all its The table below is based on the region where the borrowers reside, according to the domicile of the financing. IMPACT & SUSTAINABILITY borrower’s group headquarters. Regarding NIB’s lending outside the Member countries, an agreement is generally required GOVERNANCE regarding the recipient country’s recognition of NIB as a legal person under public international law BOD REPORT Net Interest Income and as having legal capacity under the national law of the country in question as well as recognition In thousands of euro 2023 2022 of NIB’s status as an IFI. The Bank follows a policy similar to that of other international financial FINANCIALS Member countries institutions concerning the debt service obligations of its borrowers. Therefore, the Bank has not Financial statements and notes Denmark 25,177 18,997 participated in any debt rescheduling of sovereign debt. Estonia 7,946 3,130 Proposal by the Board of Directors Loans may be granted for both public and private projects. A loan will not be made, nor a Finland 33,901 36,646 guarantee provided, if opposed by the government of the country in which the related project is Auditor’s report Iceland 8,094 7,298 located. The Bank has a number of processes in place for assessing the eligibility of the projects. Latvia 3,108 3,244 Report of the Control Committee Lithuania 6,290 5,822 The Bank applies a mandate-rating tool as well as a sustainability policy to ensure that its financing Chairmanship Norway 30,553 32,052 fulfils the objectives and mission of the Bank. In addition, the Bank has an integrity due diligence Report of the Control Committee Sweden 57,563 56,323 procedure in relation to its granting of loans. Total, member countries 172,635 163,513 Ratio definitions Lending Categories SUSTAINABILITY INDICES Non-member countries The Bank previously had two main categories of lending: ordinary lending and lending under Special Africa 74 114 Programs. These special programs have been discontinued. Asia 233 384 Europe and Eurasia 3,384 2,368 Investing in green bonds, social bonds, sustainability bonds, sustainability-linked and Treasury Americas 113 500 corporate bonds issued by companies or municipalities in the Bank's member countries is also Middle East 7 32 part of NIB's lending operations. The investments are used to finance environmentally sustainable Total, non-member countries 3,812 3,399 projects that can contribute to mitigating climate change and achieve positive social outcomes in Total, net interest income from lending 176,446 166,912 the Nordic-Baltic region. At the end of 2023, the Bank held lending labelled bonds and CPs of EUR 469 (455) million at fair value recorded in debt securities. For more information see Note 12: Loans Lending Operations outstanding and guarantee commitments. Mission and mandate The mission of NIB, as currently defined, is to promote sustainable growth of its Member countries by providing long-term complementary financing, based on sound banking principles, to projects that strengthen productivity and/or enhance the environment. NIB fulfils this mandate by providing financing in the form of loans and guarantees for activities in which NIB provide additionality and
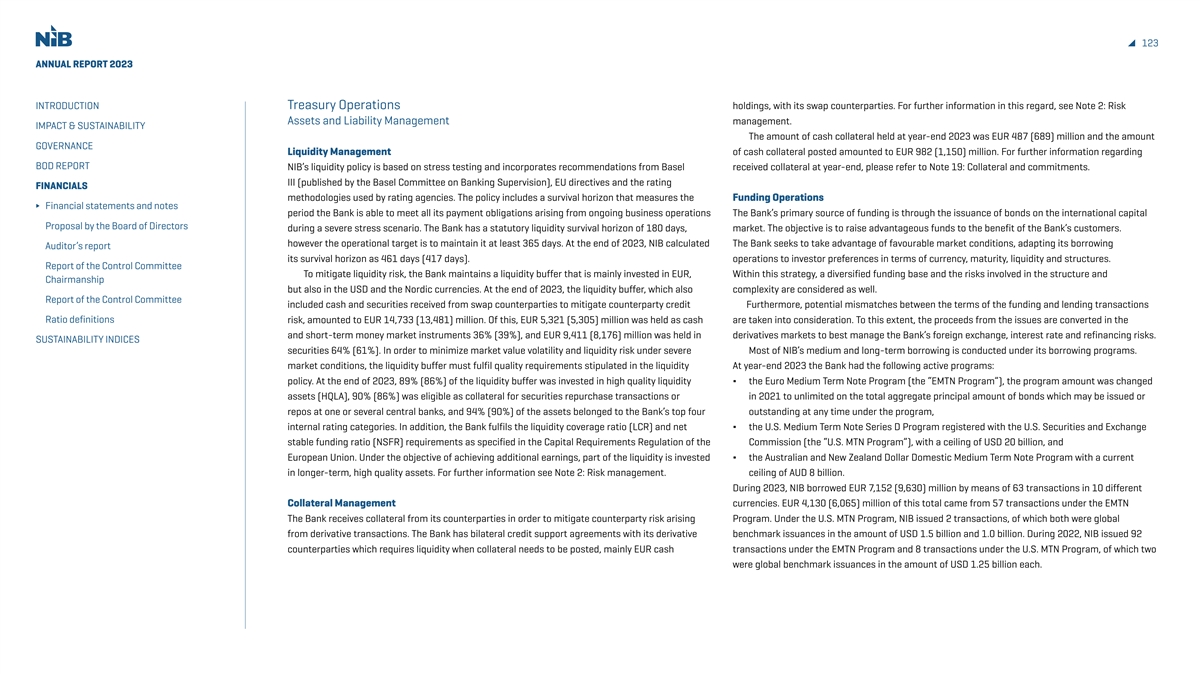
123 ANNUAL REPORT 2023 INTRODUCTION Treasury Operations holdings, with its swap counterparties. For further information in this regard, see Note 2: Risk Assets and Liability Management management. IMPACT & SUSTAINABILITY The amount of cash collateral held at year-end 2023 was EUR 487 (689) million and the amount GOVERNANCE Liquidity Management of cash collateral posted amounted to EUR 982 (1,150) million. For further information regarding BOD REPORT NIB’s liquidity policy is based on stress testing and incorporates recommendations from Basel received collateral at year-end, please refer to Note 19: Collateral and commitments. III (published by the Basel Committee on Banking Supervision), EU directives and the rating FINANCIALS methodologies used by rating agencies. The policy includes a survival horizon that measures the Funding Operations Financial statements and notes period the Bank is able to meet all its payment obligations arising from ongoing business operations The Bank’s primary source of funding is through the issuance of bonds on the international capital Proposal by the Board of Directors during a severe stress scenario. The Bank has a statutory liquidity survival horizon of 180 days, market. The objective is to raise advantageous funds to the benefit of the Bank’s customers. however the operational target is to maintain it at least 365 days. At the end of 2023, NIB calculated The Bank seeks to take advantage of favourable market conditions, adapting its borrowing Auditor’s report its survival horizon as 461 days (417 days). operations to investor preferences in terms of currency, maturity, liquidity and structures. Report of the Control Committee To mitigate liquidity risk, the Bank maintains a liquidity buffer that is mainly invested in EUR, Within this strategy, a diversified funding base and the risks involved in the structure and Chairmanship but also in the USD and the Nordic currencies. At the end of 2023, the liquidity buffer, which also complexity are considered as well. Report of the Control Committee included cash and securities received from swap counterparties to mitigate counterparty credit Furthermore, potential mismatches between the terms of the funding and lending transactions Ratio definitions risk, amounted to EUR 14,733 (13,481) million. Of this, EUR 5,321 (5,305) million was held as cash are taken into consideration. To this extent, the proceeds from the issues are converted in the and short-term money market instruments 36% (39%), and EUR 9,411 (8,176) million was held in derivatives markets to best manage the Bank’s foreign exchange, interest rate and refinancing risks. SUSTAINABILITY INDICES securities 64% (61%). In order to minimize market value volatility and liquidity risk under severe Most of NIB’s medium and long-term borrowing is conducted under its borrowing programs. market conditions, the liquidity buffer must fulfil quality requirements stipulated in the liquidity At year-end 2023 the Bank had the following active programs: policy. At the end of 2023, 89% (86%) of the liquidity buffer was invested in high quality liquidity ∆ the Euro Medium Term Note Program (the “EMTN Program”), the program amount was changed assets (HQLA), 90% (86%) was eligible as collateral for securities repurchase transactions or in 2021 to unlimited on the total aggregate principal amount of bonds which may be issued or repos at one or several central banks, and 94% (90%) of the assets belonged to the Bank’s top four outstanding at any time under the program, internal rating categories. In addition, the Bank fulfils the liquidity coverage ratio (LCR) and net ∆ the U.S. Medium Term Note Series D Program registered with the U.S. Securities and Exchange stable funding ratio (NSFR) requirements as specified in the Capital Requirements Regulation of the Commission (the “U.S. MTN Program”), with a ceiling of USD 20 billion, and European Union. Under the objective of achieving additional earnings, part of the liquidity is invested ∆ the Australian and New Zealand Dollar Domestic Medium Term Note Program with a current in longer-term, high quality assets. For further information see Note 2: Risk management. ceiling of AUD 8 billion. During 2023, NIB borrowed EUR 7,152 (9,630) million by means of 63 transactions in 10 different Collateral Management currencies. EUR 4,130 (6,065) million of this total came from 57 transactions under the EMTN The Bank receives collateral from its counterparties in order to mitigate counterparty risk arising Program. Under the U.S. MTN Program, NIB issued 2 transactions, of which both were global from derivative transactions. The Bank has bilateral credit support agreements with its derivative benchmark issuances in the amount of USD 1.5 billion and 1.0 billion. During 2022, NIB issued 92 counterparties which requires liquidity when collateral needs to be posted, mainly EUR cash transactions under the EMTN Program and 8 transactions under the U.S. MTN Program, of which two were global benchmark issuances in the amount of USD 1.25 billion each.
124 ANNUAL REPORT 2023 INTRODUCTION The weighted average maturity for NIB’s borrowing operations in 2023 was 4.2 years, compared For the years 2023 and 2022, the Board of Directors has authorized the Bank to raise short-term with 4.3 years in 2022. Of debt securities outstanding, the amount of EUR 3,490 (3,238) million is funding, provided that the outstanding amount at any one time in each of these years does not IMPACT & SUSTAINABILITY at floating interest rates, while EUR 29,849 (30,325) million is at fixed interest rates which is mainly exceed EUR 3.0 billion. GOVERNANCE swapped to floating rate. NIB had no commercial paper outstanding under the ECP Program at year-ends 2023 and 2022. BOD REPORT NIB may issue notes as part of NIB’s Environmental Bond (“NEB”) program. NIB has established a framework that allows for the funds raised through issuances of NEB to be directed to its Portfolio Management FINANCIALS environmental lending in NIB’s member countries and EU countries. Lending projects are eligible The Bank’s portfolio management deals with the management of that portion of NIB’s liquidity that Financial statements and notes under the framework if they satisfy strict internal environmental criteria. Payment of principal and is invested in longer term securities. Two types of portfolios have been established: (1) a portfolio Proposal by the Board of Directors interest on such notes is made solely on the credit standing of NIB as a single institution and is with security investments measured at amortized cost issued by highly rated issuers and (2) actively not directly linked to the performance of environmental lending projects. Accordingly, such notes managed portfolios measured at fair value. The return from the portfolios continues to contribute Auditor’s report neither constitute “asset-backed” securities, nor are they otherwise credit-linked to any of NIB’s to NIB’s total results and are at any point in time impacted by the yield environment. NIB has signed Report of the Control Committee environmental lending projects. NIB Environmental Bonds can be issued under any of NIB’s debt the United Nations Principles for Responsible Investment (PRI), in which NIB has committed to Chairmanship issuance programs. incorporate environmental, social and governance factors in its investment and ownership decisions. Report of the Control Committee At year-end 2023, the Bank had a total of EUR 5,529 (5,038) million outstanding in NIB For information regarding accounting treatment and volumes of NIB’s financial placements as of Ratio definitions Environmental Bonds (NEBs). In 2023, NIB’s total NEB issuance was EUR 757 million. The issuance December 31, 2023, please refer to Note 11: Debt securities. The volume of outstanding derivatives consisted of a seven-year EUR 500 million bond, a five-year SEK 2 billion bond, and a four-year as of December 31, 2023 are set forth in Note 24: Derivatives held for risk management and hedge SUSTAINABILITY INDICES tap of SEK 1 billion to an outstanding bond. During 2022, NIB’s total Environmental Bond issuance accounting. surpassed EUR 1 billion – a record-high amount over a course of one year since NIB started issuing environmental bonds in 2011. The issuance consisted of a seven-year EUR 500 million bond, an inaugural eight-year DKK 2 billion bond, a five-year SEK 2 billion bond and an increase of NOK 1 billion to a five-year bond. For the years 2023 and 2022, the Board of Directors of the Bank has authorized the Bank to raise medium and long- term borrowings in an aggregate amount of up to EUR 10.0 billion and EUR 10.0 billion respectively. NIB has a Euro Commercial Paper Program (“ECP Program”) with a ceiling of EUR 2 billion. In addition to borrowings under this program and through short-term transactions under the EMTN Program, NIB can obtain short-term funds in the interbank market through money market loans and through repo transactions. These transactions are undertaken in most of the currencies listed in Note 16: Debts evidenced by certificates and swaps.
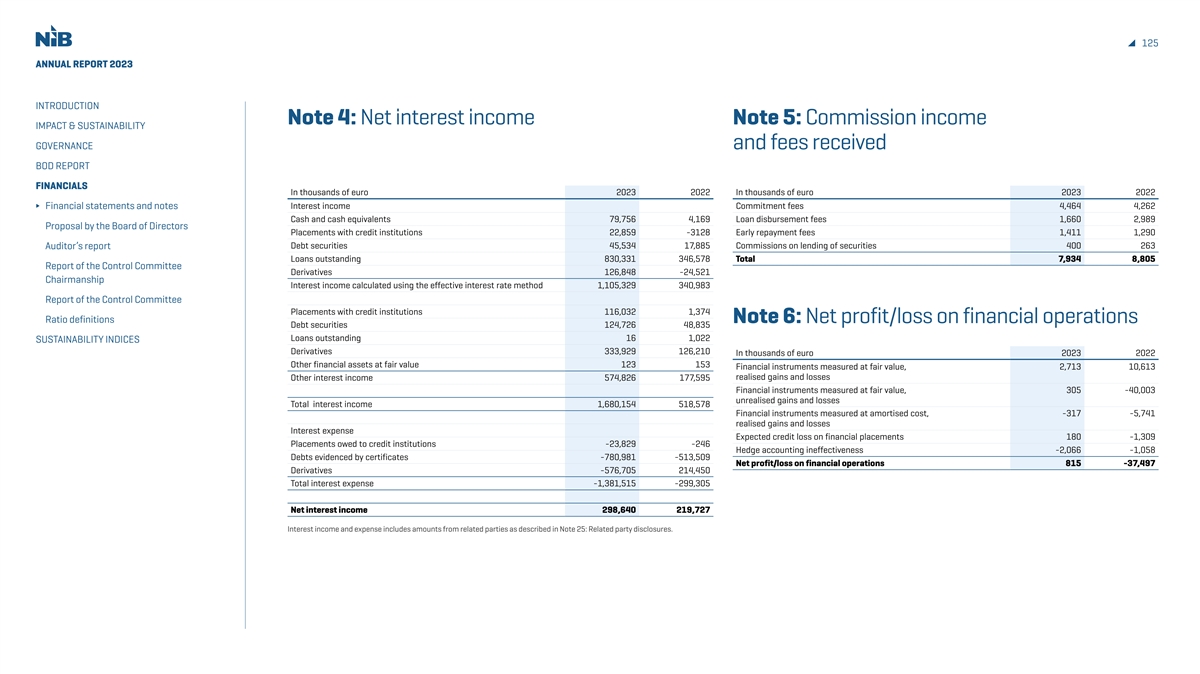
125 ANNUAL REPORT 2023 INTRODUCTION Note 4: Net interest income Note 5: Commission income IMPACT & SUSTAINABILITY GOVERNANCE and fees received BOD REPORT FINANCIALS In thousands of euro 2023 2022 In thousands of euro 2023 2022 Interest income Commitment fees 4,464 4,262 Financial statements and notes Cash and cash equivalents 79,756 4,169 Loan disbursement fees 1,660 2,989 Proposal by the Board of Directors Placements with credit institutions 22,859 -3128 Early repayment fees 1,411 1,290 Debt securities 45,534 17,885 Commissions on lending of securities 400 263 Auditor’s report Loans outstanding 830,331 346,578 Total 7,934 8,805 Report of the Control Committee Derivatives 126,848 -24,521 Chairmanship Interest income calculated using the effective interest rate method 1,105,329 340,983 Report of the Control Committee Placements with credit institutions 116,032 1,374 Ratio definitions Note 6: Net profit/loss on financial operations Debt securities 124,726 48,835 Loans outstanding 16 1,022 SUSTAINABILITY INDICES Derivatives 333,929 126,210 In thousands of euro 2023 2022 Other financial assets at fair value 123 153 Financial instruments measured at fair value, 2,713 10,613 realised gains and losses Other interest income 574,826 177,595 Financial instruments measured at fair value, 305 -40,003 unrealised gains and losses Total interest income 1,680,154 518,578 Financial instruments measured at amortised cost, -317 -5,741 realised gains and losses Interest expense Expected credit loss on financial placements 180 -1,309 Placements owed to credit institutions -23,829 -246 Hedge accounting ineffectiveness -2,066 -1,058 Debts evidenced by certificates -780,981 -513,509 Net profit/loss on financial operations 815 -37,497 Derivatives -576,705 214,450 Total interest expense -1,381,515 -299,305 Net interest income 298,640 219,727 Interest income and expense includes amounts from related parties as described in Note 25: Related party disclosures.
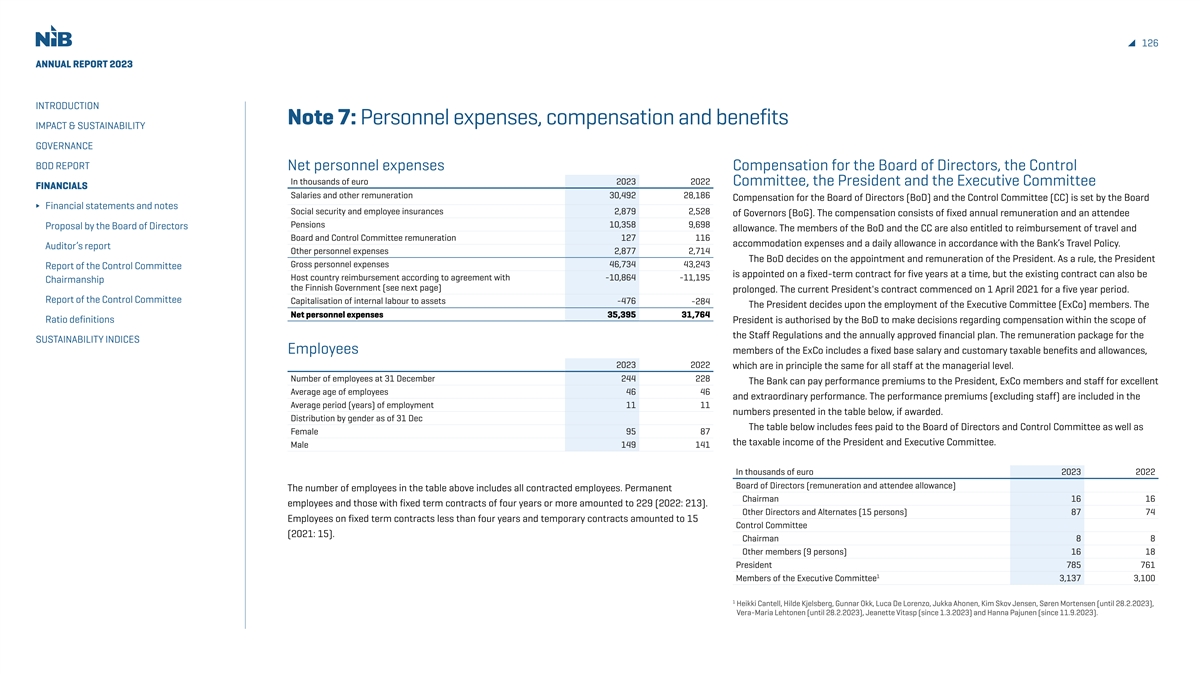
126 ANNUAL REPORT 2023 INTRODUCTION Note 7: Personnel expenses, compensation and benefits IMPACT & SUSTAINABILITY GOVERNANCE BOD REPORT Net personnel expenses Compensation for the Board of Directors, the Control In thousands of euro 2023 2022 Committee, the President and the Executive Committee FINANCIALS Salaries and other remuneration 30,492 28,186 Compensation for the Board of Directors (BoD) and the Control Committee (CC) is set by the Board Financial statements and notes Social security and employee insurances 2,879 2,528 of Governors (BoG). The compensation consists of fixed annual remuneration and an attendee Pensions 10,358 9,698 Proposal by the Board of Directors allowance. The members of the BoD and the CC are also entitled to reimbursement of travel and Board and Control Committee remuneration 127 116 accommodation expenses and a daily allowance in accordance with the Bank’s Travel Policy. Auditor’s report Other personnel expenses 2,877 2,714 The BoD decides on the appointment and remuneration of the President. As a rule, the President Gross personnel expenses 46,734 43,243 Report of the Control Committee is appointed on a fixed-term contract for five years at a time, but the existing contract can also be Host country reimbursement according to agreement with -10,864 -11,195 Chairmanship the Finnish Government (see next page) prolonged. The current President's contract commenced on 1 April 2021 for a five year period. Report of the Control Committee Capitalisation of internal labour to assets -476 -284 The President decides upon the employment of the Executive Committee (ExCo) members. The Net personnel expenses 35,395 31,764 Ratio definitions President is authorised by the BoD to make decisions regarding compensation within the scope of the Staff Regulations and the annually approved financial plan. The remuneration package for the SUSTAINABILITY INDICES Employees members of the ExCo includes a fixed base salary and customary taxable benefits and allowances, 2023 2022 which are in principle the same for all staff at the managerial level. Number of employees at 31 December 244 228 The Bank can pay performance premiums to the President, ExCo members and staff for excellent Average age of employees 46 46 and extraordinary performance. The performance premiums (excluding staff) are included in the Average period (years) of employment 11 11 numbers presented in the table below, if awarded. Distribution by gender as of 31 Dec The table below includes fees paid to the Board of Directors and Control Committee as well as Female 95 87 the taxable income of the President and Executive Committee. Male 149 141 In thousands of euro 2023 2022 Board of Directors (remuneration and attendee allowance) The number of employees in the table above includes all contracted employees. Permanent Chairman 16 16 employees and those with fixed term contracts of four years or more amounted to 229 (2022: 213). Other Directors and Alternates (15 persons) 87 74 Employees on fixed term contracts less than four years and temporary contracts amounted to 15 Control Committee (2021: 15). Chairman 8 8 Other members (9 persons) 16 18 President 785 761 1 Members of the Executive Committee 3,137 3,100 1 Heikki Cantell, Hilde Kjelsberg, Gunnar Okk, Luca De Lorenzo, Jukka Ahonen, Kim Skov Jensen, Søren Mortensen (until 28.2.2023), Vera-Maria Lehtonen (until 28.2.2023), Jeanette Vitasp (since 1.3.2023) and Hanna Pajunen (since 11.9.2023).
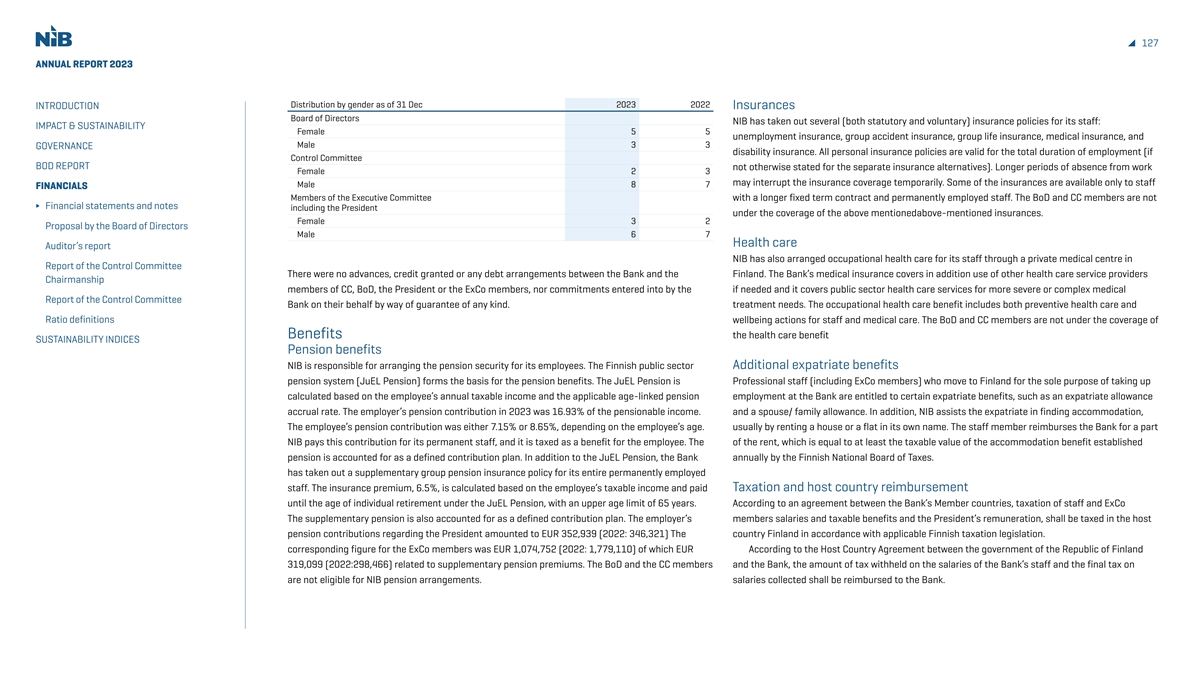
127 ANNUAL REPORT 2023 Distribution by gender as of 31 Dec 2023 2022 INTRODUCTION Insurances Board of Directors NIB has taken out several (both statutory and voluntary) insurance policies for its staff: IMPACT & SUSTAINABILITY Female 5 5 unemployment insurance, group accident insurance, group life insurance, medical insurance, and Male 3 3 GOVERNANCE disability insurance. All personal insurance policies are valid for the total duration of employment (if Control Committee BOD REPORT not otherwise stated for the separate insurance alternatives). Longer periods of absence from work Female 2 3 may interrupt the insurance coverage temporarily. Some of the insurances are available only to staff Male 8 7 FINANCIALS Members of the Executive Committee with a longer fixed term contract and permanently employed staff. The BoD and CC members are not Financial statements and notes including the President under the coverage of the above mentionedabove-mentioned insurances. Female 3 2 Proposal by the Board of Directors Male 6 7 Health care Auditor’s report NIB has also arranged occupational health care for its staff through a private medical centre in Report of the Control Committee There were no advances, credit granted or any debt arrangements between the Bank and the Finland. The Bank’s medical insurance covers in addition use of other health care service providers Chairmanship members of CC, BoD, the President or the ExCo members, nor commitments entered into by the if needed and it covers public sector health care services for more severe or complex medical Report of the Control Committee Bank on their behalf by way of guarantee of any kind. treatment needs. The occupational health care benefit includes both preventive health care and Ratio definitions wellbeing actions for staff and medical care. The BoD and CC members are not under the coverage of Benefits the health care benefit SUSTAINABILITY INDICES Pension benefits NIB is responsible for arranging the pension security for its employees. The Finnish public sector Additional expatriate benefits pension system (JuEL Pension) forms the basis for the pension benefits. The JuEL Pension is Professional staff (including ExCo members) who move to Finland for the sole purpose of taking up calculated based on the employee’s annual taxable income and the applicable age-linked pension employment at the Bank are entitled to certain expatriate benefits, such as an expatriate allowance accrual rate. The employer’s pension contribution in 2023 was 16.93% of the pensionable income. and a spouse/ family allowance. In addition, NIB assists the expatriate in finding accommodation, The employee’s pension contribution was either 7.15% or 8.65%, depending on the employee’s age. usually by renting a house or a flat in its own name. The staff member reimburses the Bank for a part NIB pays this contribution for its permanent staff, and it is taxed as a benefit for the employee. The of the rent, which is equal to at least the taxable value of the accommodation benefit established pension is accounted for as a defined contribution plan. In addition to the JuEL Pension, the Bank annually by the Finnish National Board of Taxes. has taken out a supplementary group pension insurance policy for its entire permanently employed staff. The insurance premium, 6.5%, is calculated based on the employee’s taxable income and paid Taxation and host country reimbursement until the age of individual retirement under the JuEL Pension, with an upper age limit of 65 years. According to an agreement between the Bank’s Member countries, taxation of staff and ExCo The supplementary pension is also accounted for as a defined contribution plan. The employer’s members salaries and taxable benefits and the President’s remuneration, shall be taxed in the host pension contributions regarding the President amounted to EUR 352,939 (2022: 346,321) The country Finland in accordance with applicable Finnish taxation legislation. corresponding figure for the ExCo members was EUR 1,074,752 (2022: 1,779,110) of which EUR According to the Host Country Agreement between the government of the Republic of Finland 319,099 (2022:298,466) related to supplementary pension premiums. The BoD and the CC members and the Bank, the amount of tax withheld on the salaries of the Bank’s staff and the final tax on are not eligible for NIB pension arrangements. salaries collected shall be reimbursed to the Bank.
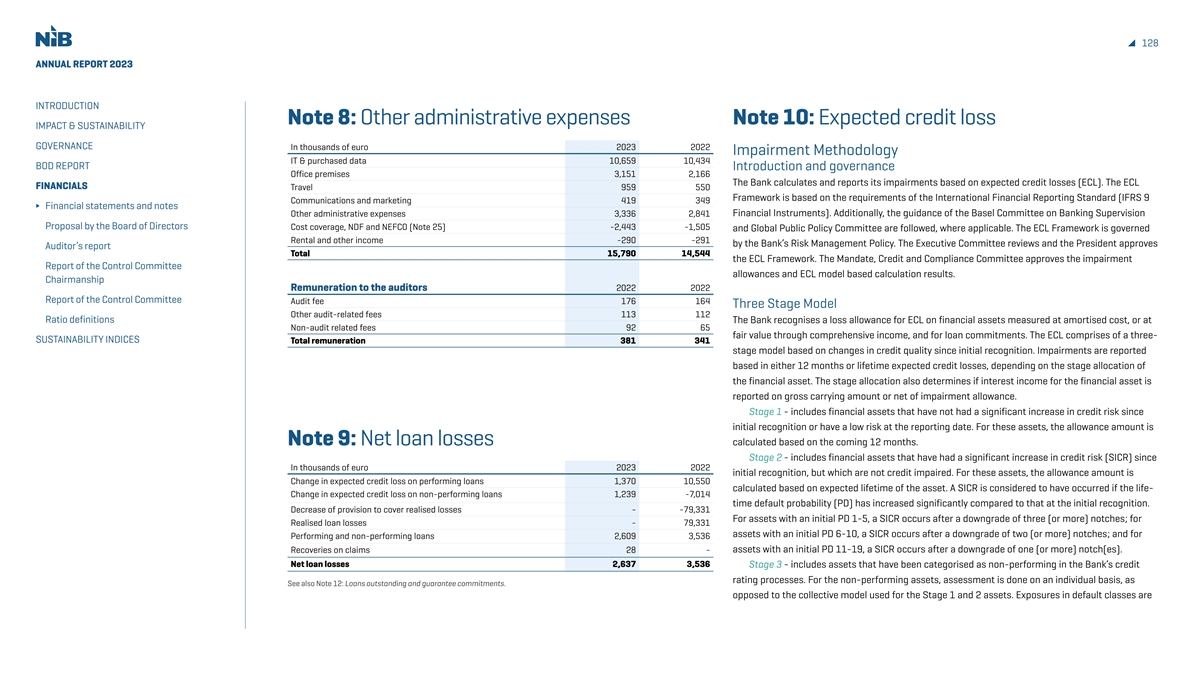
128 ANNUAL REPORT 2023 INTRODUCTION Note 8: Other administrative expenses Note 10: Expected credit loss IMPACT & SUSTAINABILITY GOVERNANCE In thousands of euro 2023 2022 Impairment Methodology IT & purchased data 10,659 10,434 BOD REPORT Introduction and governance Office premises 3,151 2,166 The Bank calculates and reports its impairments based on expected credit losses (ECL). The ECL FINANCIALS Travel 959 550 Framework is based on the requirements of the International Financial Reporting Standard (IFRS 9 Communications and marketing 419 349 Financial statements and notes Other administrative expenses 3,336 2,841 Financial Instruments). Additionally, the guidance of the Basel Committee on Banking Supervision Proposal by the Board of Directors Cost coverage, NDF and NEFCO (Note 25) -2,443 -1,505 and Global Public Policy Committee are followed, where applicable. The ECL Framework is governed Rental and other income -290 -291 by the Bank’s Risk Management Policy. The Executive Committee reviews and the President approves Auditor’s report Total 15,790 14,544 the ECL Framework. The Mandate, Credit and Compliance Committee approves the impairment Report of the Control Committee allowances and ECL model based calculation results. Chairmanship Remuneration to the auditors 2022 2022 Report of the Control Committee Audit fee 176 164 Three Stage Model Other audit-related fees 113 112 Ratio definitions The Bank recognises a loss allowance for ECL on financial assets measured at amortised cost, or at Non-audit related fees 92 65 fair value through comprehensive income, and for loan commitments. The ECL comprises of a three- SUSTAINABILITY INDICES Total remuneration 381 341 stage model based on changes in credit quality since initial recognition. Impairments are reported based in either 12 months or lifetime expected credit losses, depending on the stage allocation of the financial asset. The stage allocation also determines if interest income for the financial asset is reported on gross carrying amount or net of impairment allowance. Stage 1 - includes financial assets that have not had a significant increase in credit risk since initial recognition or have a low risk at the reporting date. For these assets, the allowance amount is Note 9: Net loan losses calculated based on the coming 12 months. Stage 2 - includes financial assets that have had a significant increase in credit risk (SICR) since In thousands of euro 2023 2022 initial recognition, but which are not credit impaired. For these assets, the allowance amount is Change in expected credit loss on performing loans 1,370 10,550 calculated based on expected lifetime of the asset. A SICR is considered to have occurred if the life- Change in expected credit loss on non-performing loans 1,239 -7,014 time default probability (PD) has increased significantly compared to that at the initial recognition. Decrease of provision to cover realised losses - -79,331 For assets with an initial PD 1-5, a SICR occurs after a downgrade of three (or more) notches; for Realised loan losses - 79,331 assets with an initial PD 6-10, a SICR occurs after a downgrade of two (or more) notches; and for Performing and non-performing loans 2,609 3,536 Recoveries on claims 28 - assets with an initial PD 11-19, a SICR occurs after a downgrade of one (or more) notch(es). Net loan losses 2,637 3,536 Stage 3 - includes assets that have been categorised as non-performing in the Bank’s credit rating processes. For the non-performing assets, assessment is done on an individual basis, as See also Note 12: Loans outstanding and guarantee commitments. opposed to the collective model used for the Stage 1 and 2 assets. Exposures in default classes are
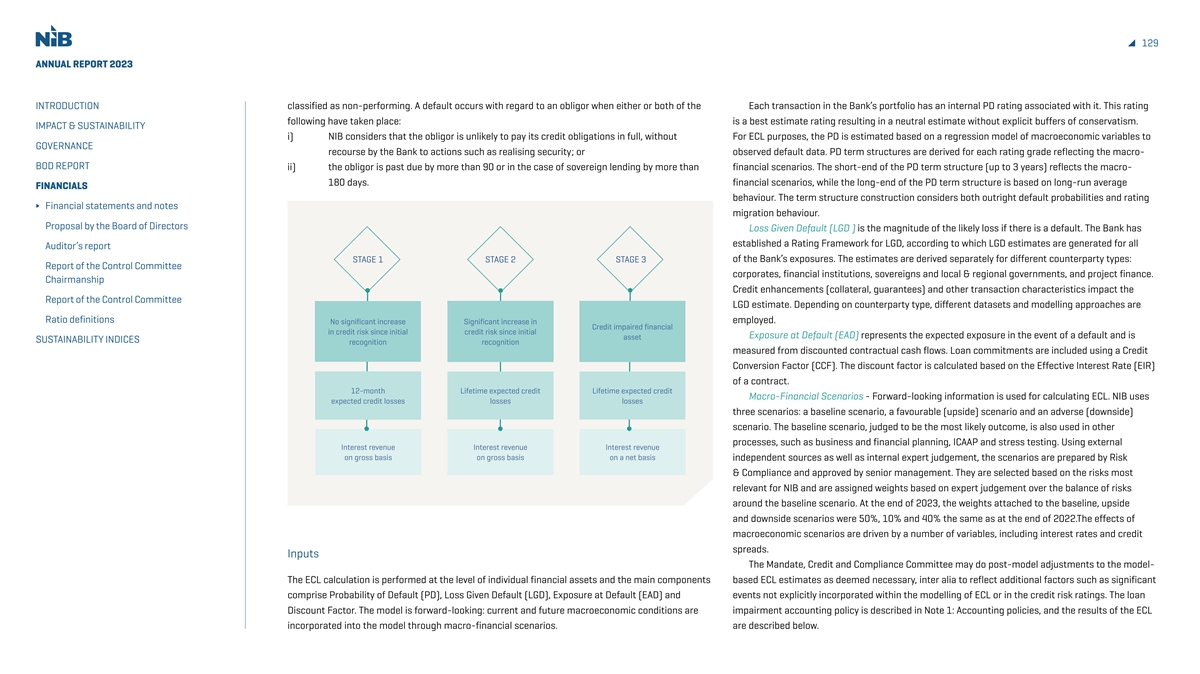
129 ANNUAL REPORT 2023 INTRODUCTION classified as non-performing. A default occurs with regard to an obligor when either or both of the Each transaction in the Bank’s portfolio has an internal PD rating associated with it. This rating following have taken place: is a best estimate rating resulting in a neutral estimate without explicit buffers of conservatism. IMPACT & SUSTAINABILITY i) NIB consider s that the obligor is unlikely to pay its credit obligations in full, without For ECL purposes, the PD is estimated based on a regression model of macroeconomic variables to GOVERNANCE recourse by the Bank to actions such as realising security; or observed default data. PD term structures are derived for each rating grade reflecting the macro- BOD REPORT ii) the obligor is past due by more than 90 or in the case of sovereign lending by more than financial scenarios. The short-end of the PD term structure (up to 3 years) reflects the macro- 180 days. financial scenarios, while the long-end of the PD term structure is based on long-run average FINANCIALS behaviour. The term structure construction considers both outright default probabilities and rating Financial statements and notes migration behaviour. Proposal by the Board of Directors Loss Given Default (LGD ) is the magnitude of the likely loss if there is a default. The Bank has established a Rating Framework for LGD, according to which LGD estimates are generated for all Auditor’s report of the Bank’s exposures. The estimates are derived separately for different counterparty types: STAGE 1 STAGE 2 STAGE 3 Report of the Control Committee corporates, financial institutions, sovereigns and local & regional governments, and project finance. Chairmanship Credit enhancements (collateral, guarantees) and other transaction characteristics impact the Report of the Control Committee LGD estimate. Depending on counterparty type, different datasets and modelling approaches are Ratio definitions employed. No significant increase Significant increase in Credit impaired financial in credit risk since initial credit risk since initial Exposure at Default (EAD) represents the expected exposure in the event of a default and is asset SUSTAINABILITY INDICES recognition recognition measured from discounted contractual cash flows. Loan commitments are included using a Credit Conversion Factor (CCF). The discount factor is calculated based on the Effective Interest Rate (EIR) of a contract. 12-month Lifetime expected credit Lifetime expected credit Macro-Financial Scenarios - Forward-looking information is used for calculating ECL. NIB uses expected credit losses losses losses three scenarios: a baseline scenario, a favourable (upside) scenario and an adverse (downside) scenario. The baseline scenario, judged to be the most likely outcome, is also used in other processes, such as business and financial planning, ICAAP and stress testing. Using external Interest revenue Interest revenue Interest revenue on gross basis on gross basis on a net basis independent sources as well as internal expert judgement, the scenarios are prepared by Risk & Compliance and approved by senior management. They are selected based on the risks most relevant for NIB and are assigned weights based on expert judgement over the balance of risks around the baseline scenario. At the end of 2023, the weights attached to the baseline, upside and downside scenarios were 50%, 10% and 40% the same as at the end of 2022.The effects of macroeconomic scenarios are driven by a number of variables, including interest rates and credit spreads. Inputs The Mandate, Credit and Compliance Committee may do post-model adjustments to the model- The ECL calculation is performed at the level of individual financial assets and the main components based ECL estimates as deemed necessary, inter alia to reflect additional factors such as significant comprise Probability of Default (PD), Loss Given Default (LGD), Exposure at Default (EAD) and events not explicitly incorporated within the modelling of ECL or in the credit risk ratings. The loan Discount Factor. The model is forward-looking: current and future macroeconomic conditions are impairment accounting policy is described in Note 1: Accounting policies, and the results of the ECL incorporated into the model through macro-financial scenarios. are described below.
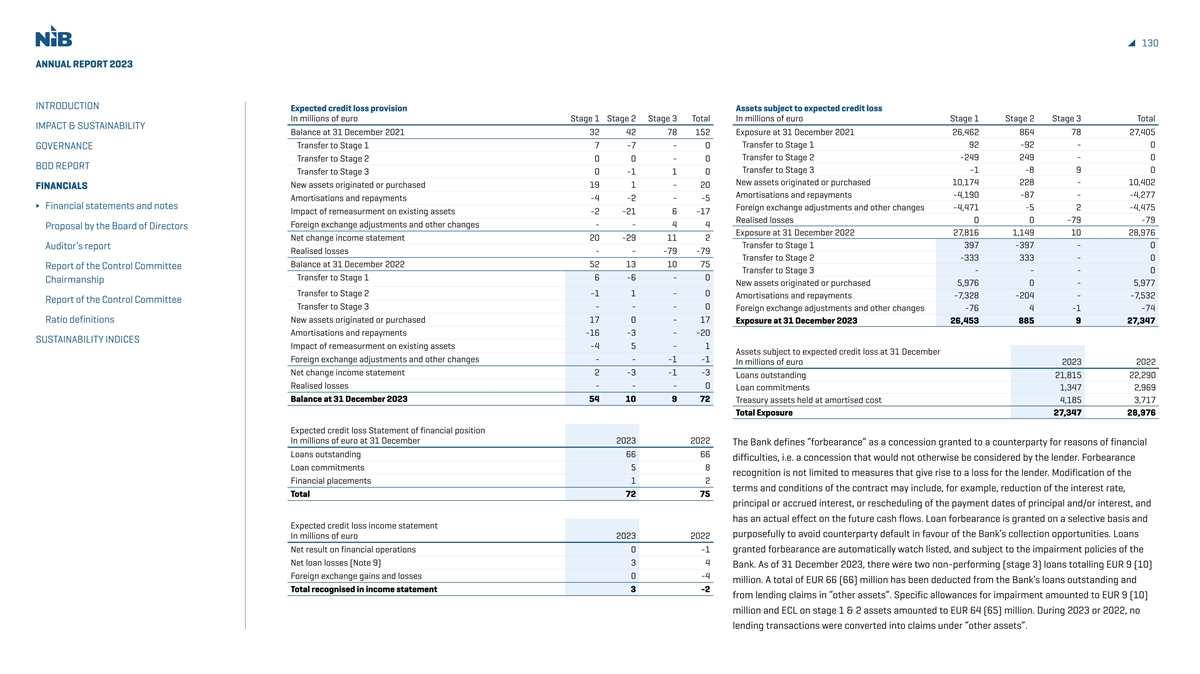
130 ANNUAL REPORT 2023 INTRODUCTION Expected credit loss provision Assets subject to expected credit loss In millions of euro Stage 1 Stage 2 Stage 3 Total In millions of euro Stage 1 Stage 2 Stage 3 Total IMPACT & SUSTAINABILITY Balance at 31 December 2021 32 42 78 152 Exposure at 31 December 2021 26,462 864 78 27,405 Transfer to Stage 1 92 -92 - 0 Transfer to Stage 1 7 -7 - 0 GOVERNANCE Transfer to Stage 2 -249 249 - 0 Transfer to Stage 2 0 0 - 0 BOD REPORT Transfer to Stage 3 -1 -8 9 0 Transfer to Stage 3 0 -1 1 0 New assets originated or purchased 10,174 228 - 10,402 New assets originated or purchased 19 1 - 20 FINANCIALS Amortisations and repayments -4,190 -87 - -4,277 Amortisations and repayments -4 -2 - -5 Financial statements and notes Foreign exchange adjustments and other changes -4,471 -5 2 -4,475 Impact of remeasurment on existing assets -2 -21 6 -17 Realised losses 0 0 -79 -79 Foreign exchange adjustments and other changes - - 4 4 Proposal by the Board of Directors Exposure at 31 December 2022 27,816 1,149 10 28,976 Net change income statement 20 -29 11 2 Transfer to Stage 1 397 -397 - 0 Auditor’s report Realised losses - - -79 -79 Transfer to Stage 2 -333 333 - 0 Balance at 31 December 2022 52 13 10 75 Report of the Control Committee Transfer to Stage 3 - - - 0 Transfer to Stage 1 6 -6 - 0 Chairmanship New assets originated or purchased 5,976 0 - 5,977 Transfer to Stage 2 -1 1 - 0 Amortisations and repayments -7,328 -204 - -7,532 Report of the Control Committee Transfer to Stage 3 - - - 0 Foreign exchange adjustments and other changes -76 4 -1 -74 Ratio definitions New assets originated or purchased 17 0 - 17 Exposure at 31 December 2023 26,453 885 9 27,347 Amortisations and repayments -16 -3 - -20 SUSTAINABILITY INDICES Impact of remeasurment on existing assets -4 5 - 1 Assets subject to expected credit loss at 31 December Foreign exchange adjustments and other changes - - -1 -1 In millions of euro 2023 2022 Net change income statement 2 -3 -1 -3 Loans outstanding 21,815 22,290 Realised losses - - - 0 Loan commitments 1,347 2,969 Balance at 31 December 2023 54 10 9 72 Treasury assets held at amortised cost 4,185 3,717 Total Exposure 27,347 28,976 Expected credit loss Statement of financial position In millions of euro at 31 December 2023 2022 The Bank defines “forbearance” as a concession granted to a counterparty for reasons of financial Loans outstanding 66 66 difficulties, i.e. a concession that would not otherwise be considered by the lender. Forbearance Loan commitments 5 8 recognition is not limited to measures that give rise to a loss for the lender. Modification of the Financial placements 1 2 terms and conditions of the contract may include, for example, reduction of the interest rate, Total 72 75 principal or accrued interest, or rescheduling of the payment dates of principal and/or interest, and has an actual effect on the future cash flows. Loan forbearance is granted on a selective basis and Expected credit loss income statement purposefully to avoid counterparty default in favour of the Bank’s collection opportunities. Loans In millions of euro 2023 2022 Net result on financial operations 0 -1 granted forbearance are automatically watch listed, and subject to the impairment policies of the Net loan losses (Note 9) 3 4 Bank. As of 31 December 2023, there were two non-performing (stage 3) loans totalling EUR 9 (10) Foreign exchange gains and losses 0 -4 million. A total of EUR 66 (66) million has been deducted from the Bank’s loans outstanding and Total recognised in income statement 3 -2 from lending claims in “other assets”. Specific allowances for impairment amounted to EUR 9 (10) million and ECL on stage 1 & 2 assets amounted to EUR 64 (65) million. During 2023 or 2022, no lending transactions were converted into claims under “other assets”.
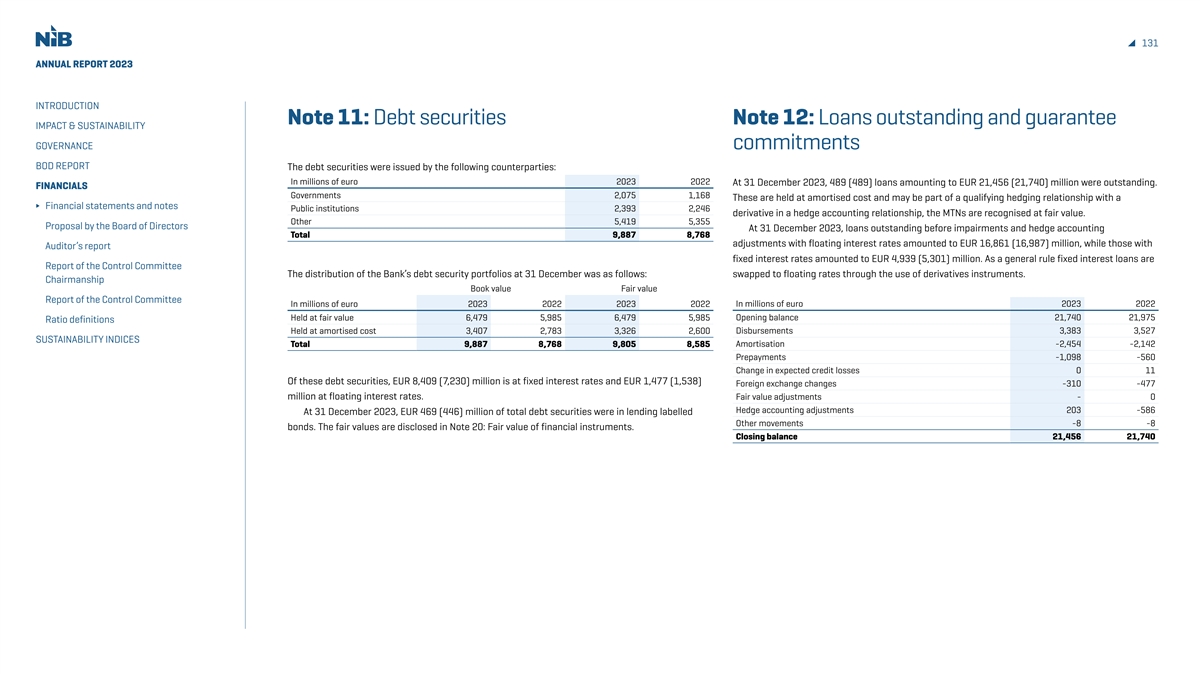
131 ANNUAL REPORT 2023 INTRODUCTION Note 11: Debt securities Note 12: Loans outstanding and guarantee IMPACT & SUSTAINABILITY GOVERNANCE commitments BOD REPORT The debt securities were issued by the following counterparties: In millions of euro 2023 2022 At 31 December 2023, 489 (489) loans amounting to EUR 21,456 (21,740) million were outstanding. FINANCIALS Governments 2,075 1,168 These are held at amortised cost and may be part of a qualifying hedging relationship with a Financial statements and notes Public institutions 2,393 2,246 derivative in a hedge accounting relationship, the MTNs are recognised at fair value. Other 5,419 5,355 Proposal by the Board of Directors At 31 December 2023, loans outstanding before impairments and hedge accounting Total 9,887 8,768 adjustments with floating interest rates amounted to EUR 16,861 (16,987) million, while those with Auditor’s report fixed interest rates amounted to EUR 4,939 (5,301) million. As a general rule fixed interest loans are Report of the Control Committee The distribution of the Bank’s debt security portfolios at 31 December was as follows: swapped to floating rates through the use of derivatives instruments. Chairmanship Book value Fair value Report of the Control Committee In millions of euro 2023 2022 2023 2022 In millions of euro 2023 2022 Held at fair value 6,479 5,985 6,479 5,985 Opening balance 21,740 21,975 Ratio definitions Held at amortised cost 3,407 2,783 3,326 2,600 Disbursements 3,383 3,527 SUSTAINABILITY INDICES Total 9,887 8,768 9,805 8,585 Amortisation -2,454 -2,142 Prepayments -1,098 -560 Change in expected credit losses 0 11 Of these debt securities, EUR 8,409 (7,230) million is at fixed interest rates and EUR 1,477 (1,538) Foreign exchange changes -310 -477 million at floating interest rates. Fair value adjustments - 0 Hedge accounting adjustments 203 -586 At 31 December 2023, EUR 469 (446) million of total debt securities were in lending labelled Other movements -8 -8 bonds. The fair values are disclosed in Note 20: Fair value of financial instruments. Closing balance 21,456 21,740
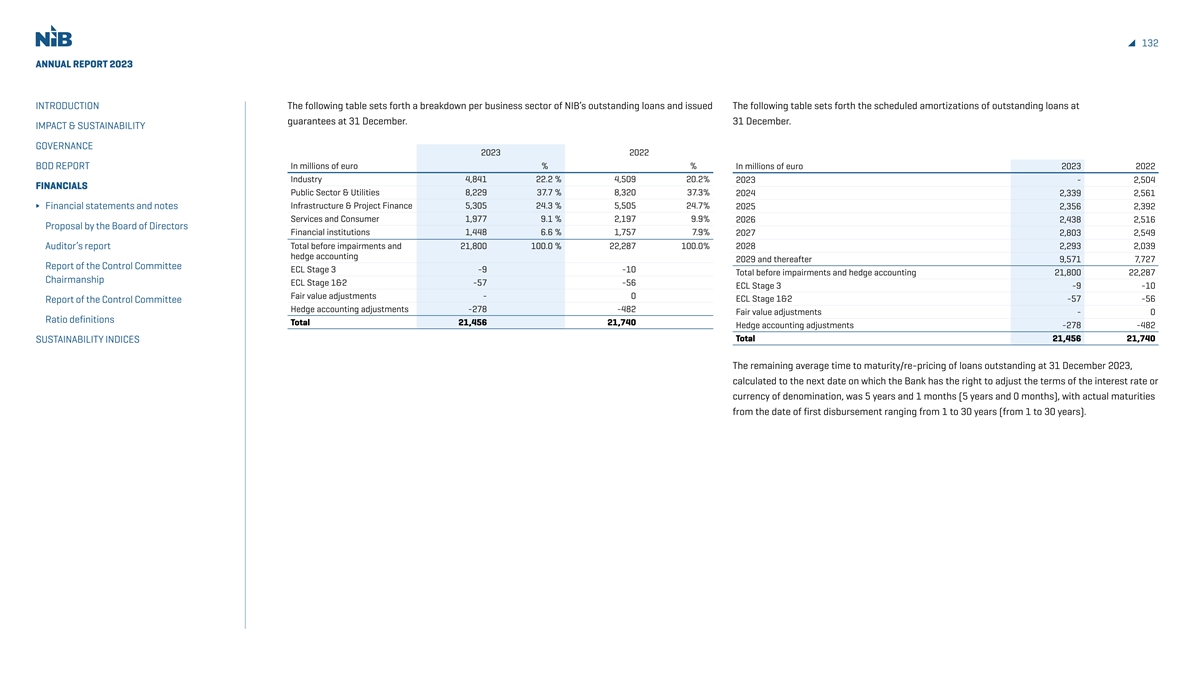
132 ANNUAL REPORT 2023 INTRODUCTION The following table sets forth a breakdown per business sector of NIB’s outstanding loans and issued The following table sets forth the scheduled amortizations of outstanding loans at guarantees at 31 December. 31 December. IMPACT & SUSTAINABILITY GOVERNANCE 2023 2022 BOD REPORT In millions of euro % % In millions of euro 2023 2022 Industry 4,841 22.2 % 4,509 20.2% 2023 - 2,504 FINANCIALS Public Sector & Utilities 8,229 37.7 % 8,320 37.3% 2024 2,339 2,561 Infrastructure & Project Finance 5,305 24.3 % 5,505 24.7% Financial statements and notes 2025 2,356 2,392 Services and Consumer 1,977 9.1 % 2,197 9.9% 2026 2,438 2,516 Proposal by the Board of Directors Financial institutions 1,448 6.6 % 1,757 7.9% 2027 2,803 2,549 Auditor’s report Total before impairments and 21,800 100.0 % 22,287 100.0% 2028 2,293 2,039 hedge accounting 2029 and thereafter 9,571 7,727 Report of the Control Committee ECL Stage 3 -9 -10 Total before impairments and hedge accounting 21,800 22,287 Chairmanship ECL Stage 1&2 -57 -56 ECL Stage 3 -9 -10 Fair value adjustments - 0 ECL Stage 1&2 -57 -56 Report of the Control Committee Hedge accounting adjustments -278 -482 Fair value adjustments - 0 Ratio definitions Total 21,456 21,740 Hedge accounting adjustments -278 -482 Total 21,456 21,740 SUSTAINABILITY INDICES The remaining average time to maturity/re-pricing of loans outstanding at 31 December 2023, calculated to the next date on which the Bank has the right to adjust the terms of the interest rate or currency of denomination, was 5 years and 1 months (5 years and 0 months), with actual maturities from the date of first disbursement ranging from 1 to 30 years (from 1 to 30 years).
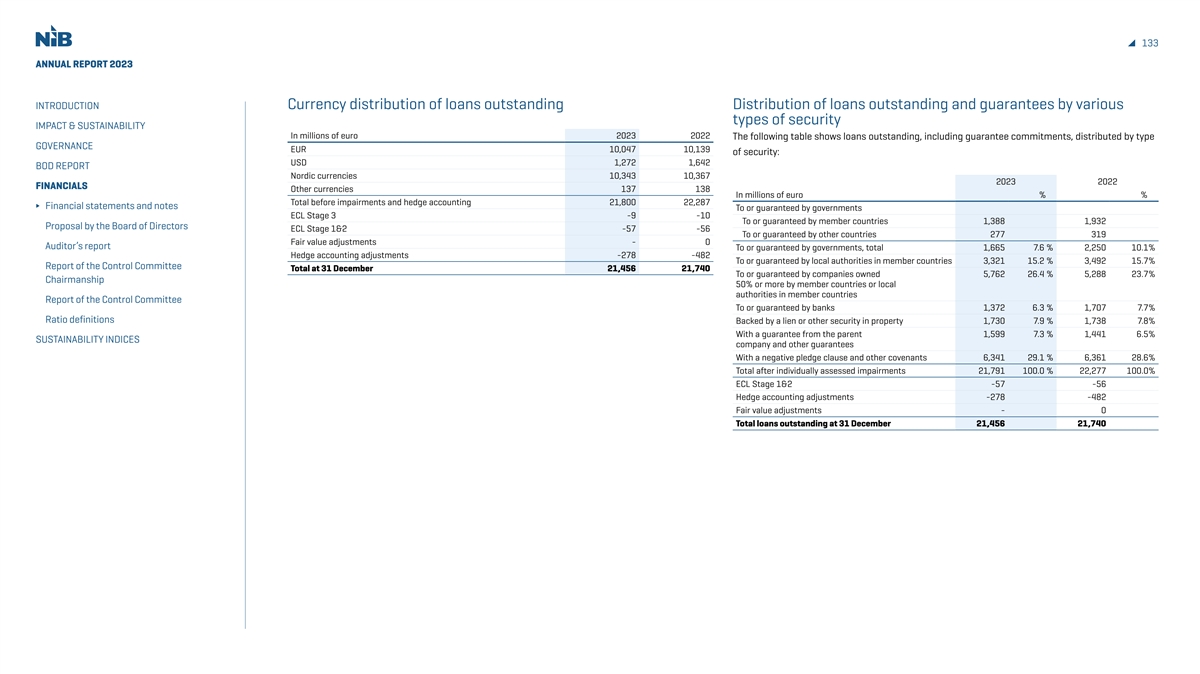
133 ANNUAL REPORT 2023 INTRODUCTION Currency distribution of loans outstanding Distribution of loans outstanding and guarantees by various types of security IMPACT & SUSTAINABILITY In millions of euro 2023 2022 The following table shows loans outstanding, including guarantee commitments, distributed by type GOVERNANCE EUR 10,047 10,139 of security: USD 1,272 1,642 BOD REPORT Nordic currencies 10,343 10,367 2023 2022 FINANCIALS Other currencies 137 138 In millions of euro % % Total before impairments and hedge accounting 21,800 22,287 Financial statements and notes To or guaranteed by governments ECL Stage 3 -9 -10 To or guaranteed by member countries 1,388 1,932 Proposal by the Board of Directors ECL Stage 1&2 -57 -56 To or guaranteed by other countries 277 319 Fair value adjustments - 0 Auditor’s report To or guaranteed by governments, total 1,665 7.6 % 2,250 10.1% Hedge accounting adjustments -278 -482 To or guaranteed by local authorities in member countries 3,321 15.2 % 3,492 15.7% Report of the Control Committee Total at 31 December 21,456 21,740 To or guaranteed by companies owned 5,762 26.4 % 5,288 23.7% Chairmanship 50% or more by member countries or local authorities in member countries Report of the Control Committee To or guaranteed by banks 1,372 6.3 % 1,707 7.7% Ratio definitions Backed by a lien or other security in property 1,730 7.9 % 1,738 7.8% With a guarantee from the parent 1,599 7.3 % 1,441 6.5% SUSTAINABILITY INDICES company and other guarantees With a negative pledge clause and other covenants 6,341 29.1 % 6,361 28.6% Total after individually assessed impairments 21,791 100.0 % 22,277 100.0% ECL Stage 1&2 -57 -56 Hedge accounting adjustments -278 -482 Fair value adjustments - 0 Total loans outstanding at 31 December 21,456 21,740
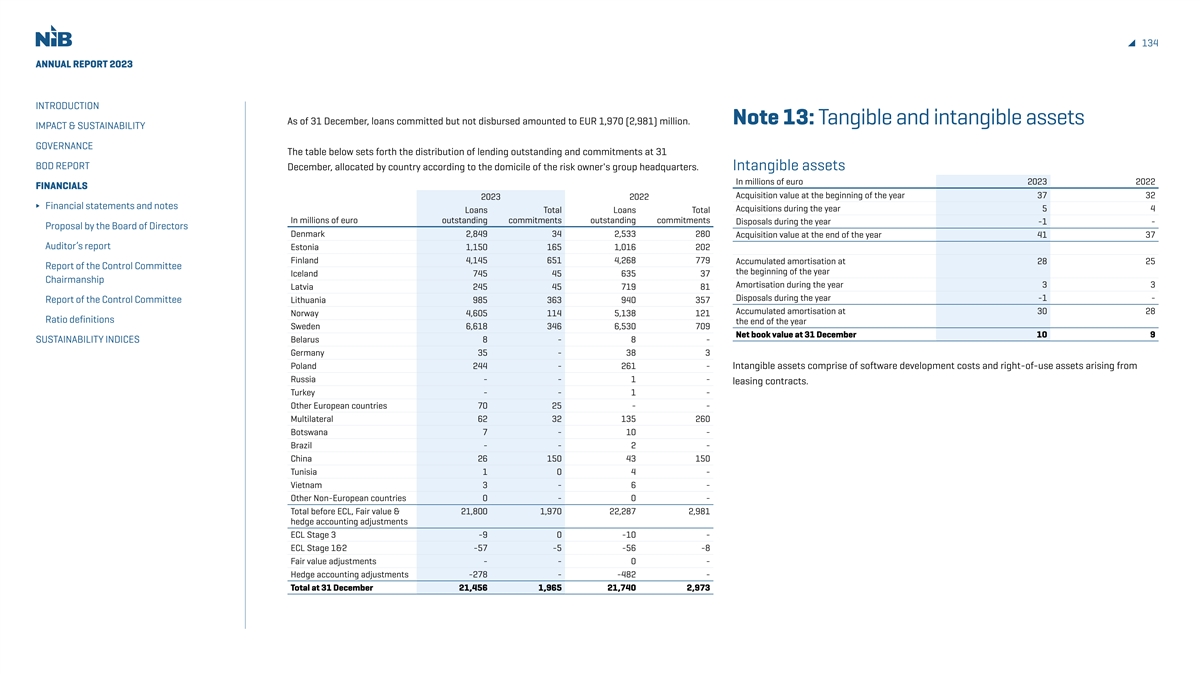
134 ANNUAL REPORT 2023 INTRODUCTION As of 31 December, loans committed but not disbursed amounted to EUR 1,970 (2,981) million. Note 13: Tangible and intangible assets IMPACT & SUSTAINABILITY GOVERNANCE The table below sets forth the distribution of lending outstanding and commitments at 31 BOD REPORT December, allocated by country according to the domicile of the risk owner's group headquarters. Intangible assets In millions of euro 2023 2022 FINANCIALS Acquisition value at the beginning of the year 37 32 2023 2022 Financial statements and notes Acquisitions during the year 5 4 Loans Total Loans Total In millions of euro outstanding commitments outstanding commitments Disposals during the year -1 - Proposal by the Board of Directors Denmark 2,849 34 2,533 280 Acquisition value at the end of the year 41 37 Auditor’s report Estonia 1,150 165 1,016 202 Finland 4,145 651 4,268 779 Accumulated amortisation at 28 25 Report of the Control Committee the beginning of the year Iceland 745 45 635 37 Chairmanship Amortisation during the year 3 3 Latvia 245 45 719 81 Disposals during the year -1 - Report of the Control Committee Lithuania 985 363 940 357 Accumulated amortisation at 30 28 Norway 4,605 114 5,138 121 Ratio definitions the end of the year Sweden 6,618 346 6,530 709 Net book value at 31 December 10 9 Belarus 8 - 8 - SUSTAINABILITY INDICES Germany 35 - 38 3 Poland 244 - 261 - Intangible assets comprise of software development costs and right-of-use assets arising from Russia - - 1 - leasing contracts. Turkey - - 1 - Other European countries 70 25 - - Multilateral 62 32 135 260 Botswana 7 - 10 - Brazil - - 2 - China 26 150 43 150 Tunisia 1 0 4 - Vietnam 3 - 6 - Other Non-European countries 0 - 0 - Total before ECL, Fair value & 21,800 1,970 22,287 2,981 hedge accounting adjustments ECL Stage 3 -9 0 -10 - ECL Stage 1&2 -57 -5 -56 -8 Fair value adjustments - - 0 - Hedge accounting adjustments -278 - -482 - Total at 31 December 21,456 1,965 21,740 2,973
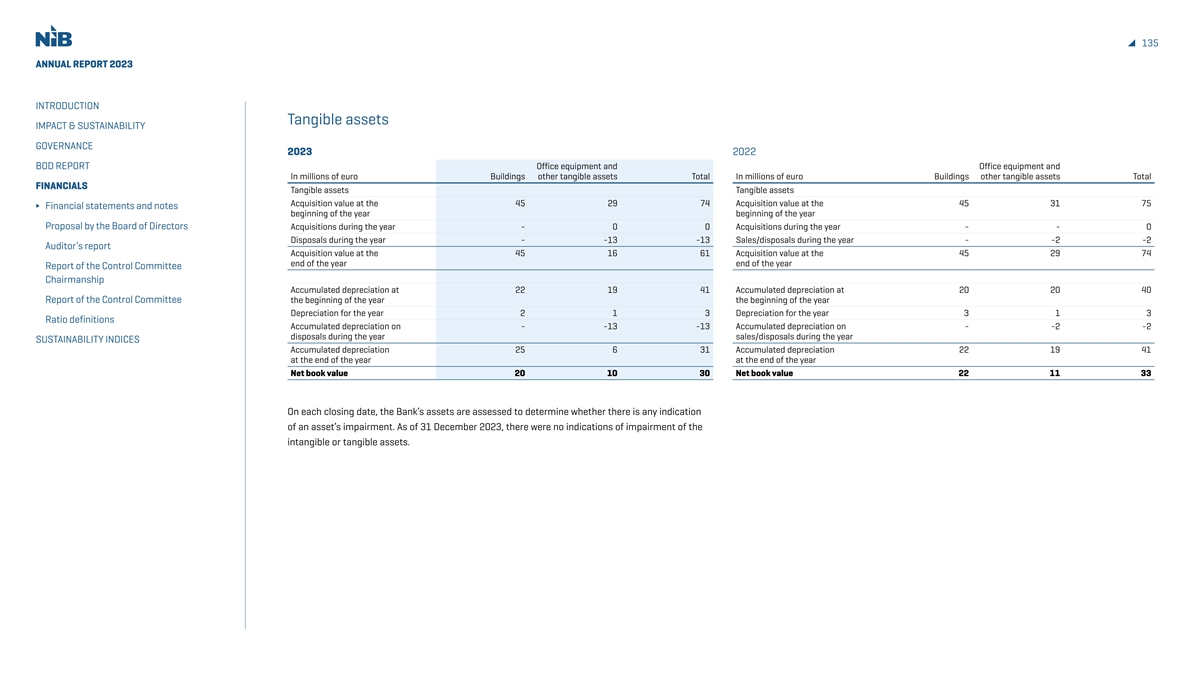
135 ANNUAL REPORT 2023 INTRODUCTION Tangible assets IMPACT & SUSTAINABILITY GOVERNANCE 2023 2022 BOD REPORT Office equipment and Office equipment and In millions of euro Buildings other tangible assets Total In millions of euro Buildings other tangible assets Total FINANCIALS Tangible assets Tangible assets Acquisition value at the 45 29 74 Acquisition value at the 45 31 75 Financial statements and notes beginning of the year beginning of the year Proposal by the Board of Directors Acquisitions during the year - 0 0 Acquisitions during the year - - 0 Disposals during the year - -13 -13 Sales/disposals during the year - -2 -2 Auditor’s report Acquisition value at the 45 16 61 Acquisition value at the 45 29 74 end of the year end of the year Report of the Control Committee Chairmanship Accumulated depreciation at 22 19 41 Accumulated depreciation at 20 20 40 Report of the Control Committee the beginning of the year the beginning of the year Depreciation for the year 2 1 3 Depreciation for the year 3 1 3 Ratio definitions Accumulated depreciation on - -13 -13 Accumulated depreciation on - -2 -2 disposals during the year sales/disposals during the year SUSTAINABILITY INDICES Accumulated depreciation 25 6 31 Accumulated depreciation 22 19 41 at the end of the year at the end of the year Net book value 20 10 30 Net book value 22 11 33 On each closing date, the Bank’s assets are assessed to determine whether there is any indication of an asset’s impairment. As of 31 December 2023, there were no indications of impairment of the intangible or tangible assets.
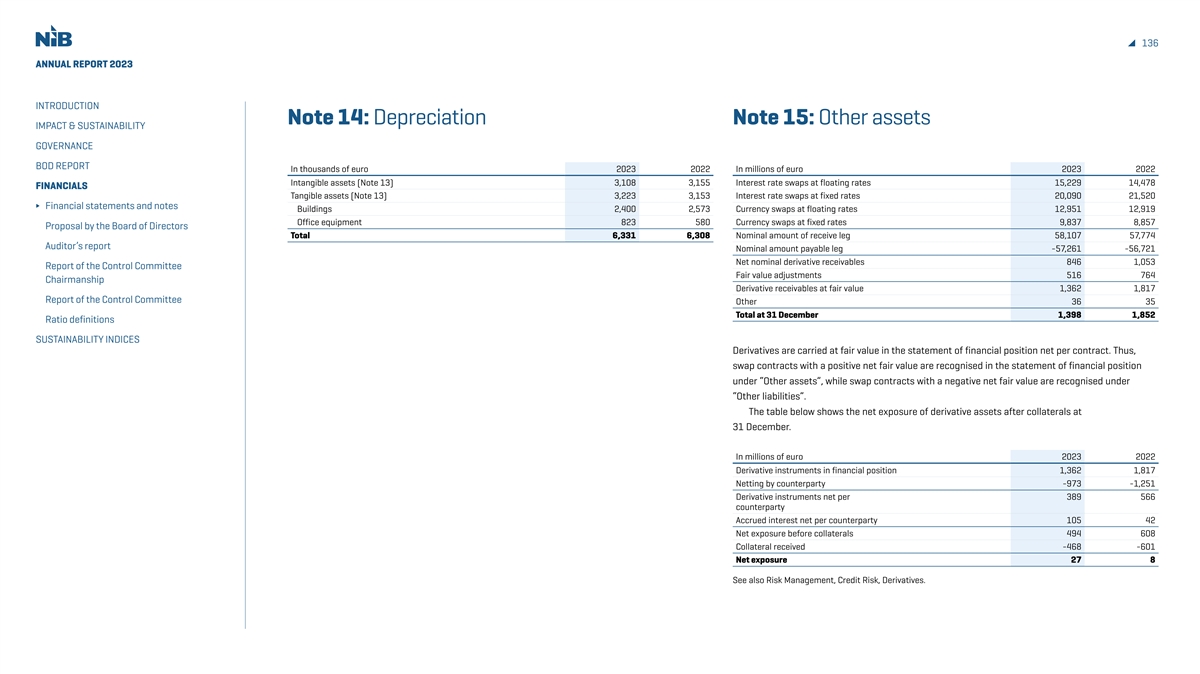
136 ANNUAL REPORT 2023 INTRODUCTION Note 14: Depreciation Note 15: Other assets IMPACT & SUSTAINABILITY GOVERNANCE BOD REPORT In thousands of euro 2023 2022 In millions of euro 2023 2022 Intangible assets (Note 13) 3,108 3,155 Interest rate swaps at floating rates 15,229 14,478 FINANCIALS Tangible assets (Note 13) 3,223 3,153 Interest rate swaps at fixed rates 20,090 21,520 Financial statements and notes Buildings 2,400 2,573 Currency swaps at floating rates 12,951 12,919 Office equipment 823 580 Currency swaps at fixed rates 9,837 8,857 Proposal by the Board of Directors Total 6,331 6,308 Nominal amount of receive leg 58,107 57,774 Auditor’s report Nominal amount payable leg -57,261 -56,721 Net nominal derivative receivables 846 1,053 Report of the Control Committee Fair value adjustments 516 764 Chairmanship Derivative receivables at fair value 1,362 1,817 Report of the Control Committee Other 36 35 Total at 31 December 1,398 1,852 Ratio definitions SUSTAINABILITY INDICES Derivatives are carried at fair value in the statement of financial position net per contract. Thus, swap contracts with a positive net fair value are recognised in the statement of financial position under “Other assets”, while swap contracts with a negative net fair value are recognised under “Other liabilities”. The table below shows the net exposure of derivative assets after collaterals at 31 December. In millions of euro 2023 2022 Derivative instruments in financial position 1,362 1,817 Netting by counterparty -973 -1,251 Derivative instruments net per 389 566 counterparty Accrued interest net per counterparty 105 42 Net exposure before collaterals 494 608 Collateral received -468 -601 Net exposure 27 8 See also Risk Management, Credit Risk, Derivatives.

137 ANNUAL REPORT 2023 INTRODUCTION Note 16: Debts evidenced by certificates and related swaps IMPACT & SUSTAINABILITY GOVERNANCE BOD REPORT In millions of euro 2023 2022 At year-end, the Bank’s debt evidenced by certificates were distributed between the currencies Opening balance 31,595 31,526 shown in the table below. The table also demonstrates the distribution by currency on an after FINANCIALS New debt issues 7,152 9,630 related swap nominal basis. Financial statements and notes Amortisation -6,408 -7,218 Call and buybacks -130 -155 Proposal by the Board of Directors Debt Swap contracts Net balance Foreign exchange movements -847 56 payable/receivable Auditor’s report Fair value adjustment on FVTPL debt -8 -59 In millions of euro 2023 2022 2023 2022 2023 2022 Hedge accounting adjustments 828 -2,202 Currency Report of the Control Committee Other 10 15 USD 11,801 11,809 -493 -332 11,307 11,477 Chairmanship Closing balance 32,190 31,595 EUR 7,131 7,223 9,495 8,268 16,626 15,491 Report of the Control Committee GBP 3,855 3,155 -3,855 -3,155 - - NOK 3,515 3,850 - - 3,515 3,850 Ratio definitions AUD 2,086 2,053 -2,086 -2,053 - - SUSTAINABILITY INDICES SEK 1,733 2,461 - - 1,733 2,461 CNH 938 637 -938 -637 - - NZD 742 818 -742 -818 - - HKD 676 634 -676 -634 - - DKK 349 403 - - 349 403 CHF 216 51 -216 -51 - - RON 189 190 -189 -190 - - PLN 52 48 -52 -48 - - JPY 36 40 -36 -40 - - ZAR 9 9 -9 -9 - - INR 6 11 -6 -11 - - TRY 6 16 -6 -16 - - BRL 3 19 -3 -19 - - MXN - 100 - -100 - - Subtotal 33,344 33,527 186 155 33,530 33,683 Fair value adjustments 3 11 -15 -27 -12 -16 Hedge accounting adjustments -1,152 -1,979 1,169 2,017 17 38 Other -5 36 - - -5 36 Total at 31 December 32,190 31,595 1,340 2,145 33,530 33,740
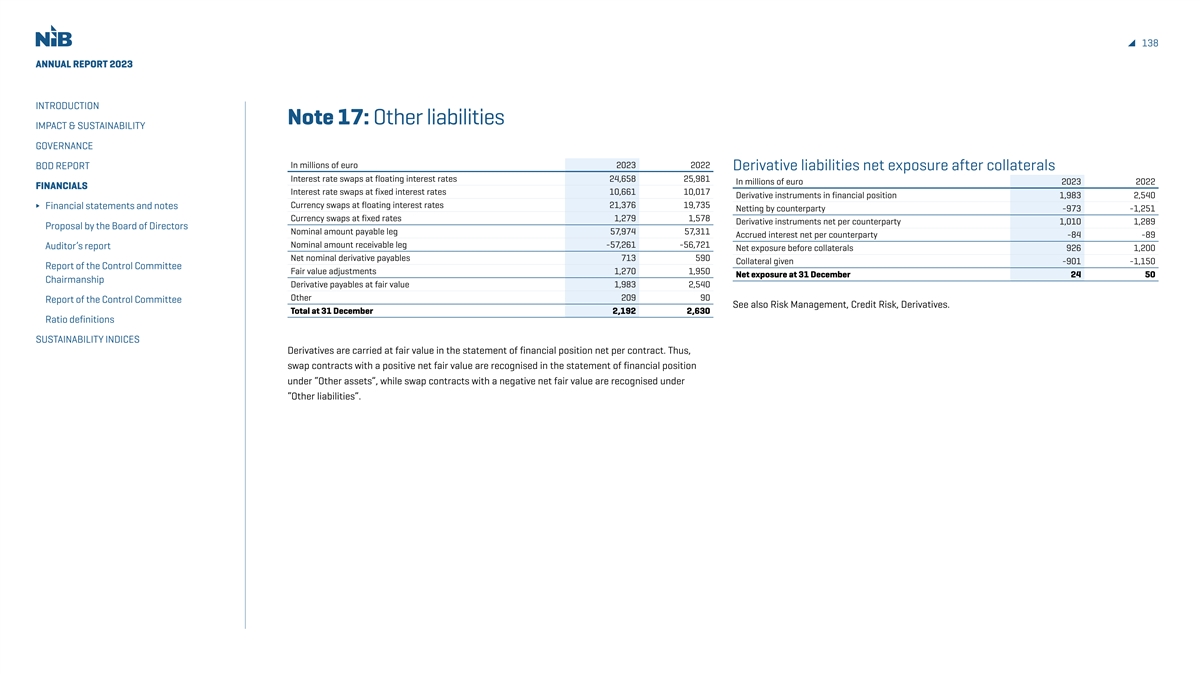
138 ANNUAL REPORT 2023 INTRODUCTION Note 17: Other liabilities IMPACT & SUSTAINABILITY GOVERNANCE In millions of euro 2023 2022 BOD REPORT Derivative liabilities net exposure after collaterals Interest rate swaps at floating interest rates 24,658 25,981 In millions of euro 2023 2022 FINANCIALS Interest rate swaps at fixed interest rates 10,661 10,017 Derivative instruments in financial position 1,983 2,540 Currency swaps at floating interest rates 21,376 19,735 Financial statements and notes Netting by counterparty -973 -1,251 Currency swaps at fixed rates 1,279 1,578 Derivative instruments net per counterparty 1,010 1,289 Proposal by the Board of Directors Nominal amount payable leg 57,974 57,311 Accrued interest net per counterparty -84 -89 Nominal amount receivable leg -57,261 -56,721 Auditor’s report Net exposure before collaterals 926 1,200 Net nominal derivative payables 713 590 Collateral given -901 -1,150 Report of the Control Committee Fair value adjustments 1,270 1,950 Net exposure at 31 December 24 50 Chairmanship Derivative payables at fair value 1,983 2,540 Other 209 90 Report of the Control Committee See also Risk Management, Credit Risk, Derivatives. Total at 31 December 2,192 2,630 Ratio definitions SUSTAINABILITY INDICES Derivatives are carried at fair value in the statement of financial position net per contract. Thus, swap contracts with a positive net fair value are recognised in the statement of financial position under “Other assets”, while swap contracts with a negative net fair value are recognised under “Other liabilities”.
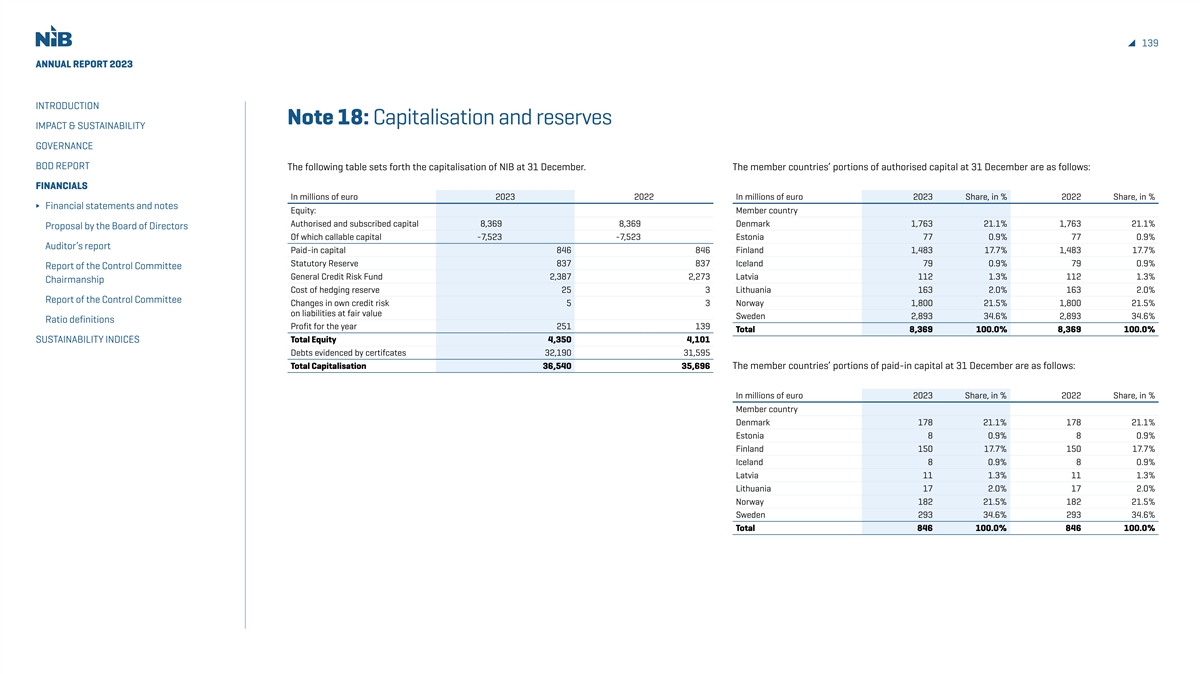
139 ANNUAL REPORT 2023 INTRODUCTION Note 18: Capitalisation and reserves IMPACT & SUSTAINABILITY GOVERNANCE BOD REPORT The following table sets forth the capitalisation of NIB at 31 December. The member countries’ portions of authorised capital at 31 December are as follows: FINANCIALS In millions of euro 2023 2022 In millions of euro 2023 Share, in % 2022 Share, in % Financial statements and notes Equity: Member country Authorised and subscribed capital 8,369 8,369 Denmark 1,763 21.1% 1,763 21.1% Proposal by the Board of Directors Of which callable capital -7,523 -7,523 Estonia 77 0.9% 77 0.9% Auditor’s report Paid-in capital 846 846 Finland 1,483 17.7% 1,483 17.7% Statutory Reserve 837 837 Iceland 79 0.9% 79 0.9% Report of the Control Committee General Credit Risk Fund 2,387 2,273 Latvia 112 1.3% 112 1.3% Chairmanship Cost of hedging reserve 25 3 Lithuania 163 2.0% 163 2.0% Report of the Control Committee Changes in own credit risk 5 3 Norway 1,800 21.5% 1,800 21.5% on liabilities at fair value Sweden 2,893 34.6% 2,893 34.6% Ratio definitions Profit for the year 251 139 Total 8,369 100.0% 8,369 100.0% Total Equity 4,350 4,101 SUSTAINABILITY INDICES Debts evidenced by certifcates 32,190 31,595 Total Capitalisation 36,540 35,696 The member countries’ portions of paid-in capital at 31 December are as follows: In millions of euro 2023 Share, in % 2022 Share, in % Member country Denmark 178 21.1% 178 21.1% Estonia 8 0.9% 8 0.9% Finland 150 17.7% 150 17.7% Iceland 8 0.9% 8 0.9% Latvia 11 1.3% 11 1.3% Lithuania 17 2.0% 17 2.0% Norway 182 21.5% 182 21.5% Sweden 293 34.6% 293 34.6% Total 846 100.0% 846 100.0%
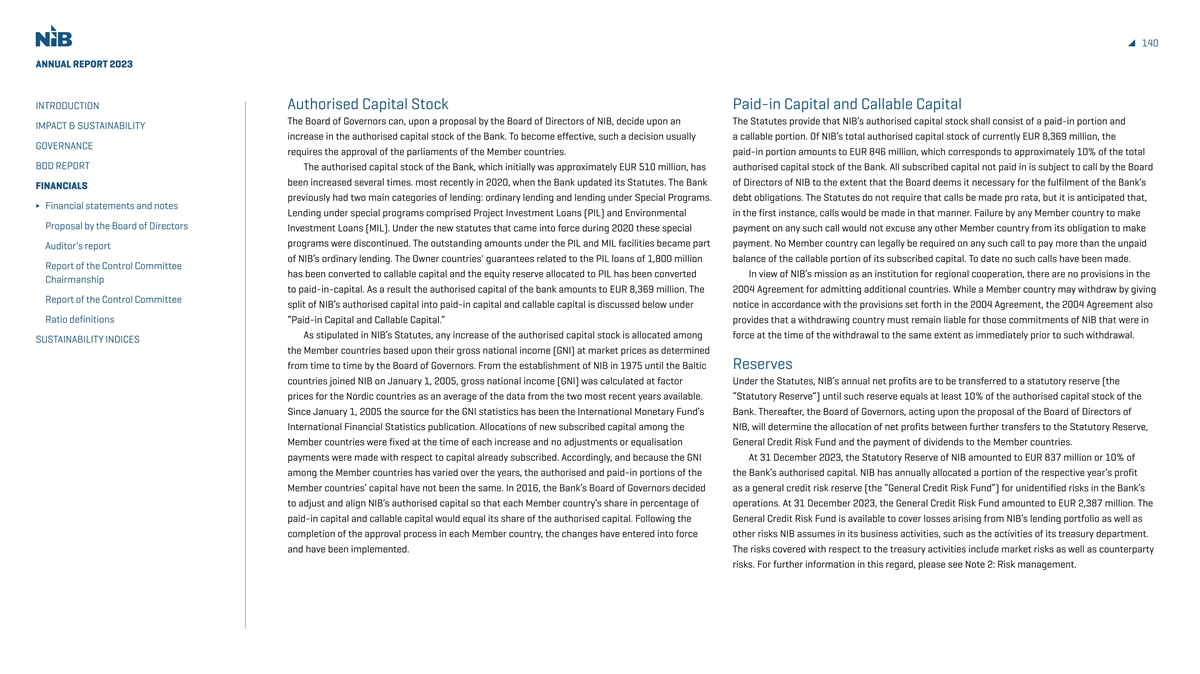
140 ANNUAL REPORT 2023 INTRODUCTION Authorised Capital Stock Paid-in Capital and Callable Capital The Board of Governors can, upon a proposal by the Board of Directors of NIB, decide upon an The Statutes provide that NIB’s authorised capital stock shall consist of a paid-in portion and IMPACT & SUSTAINABILITY increase in the authorised capital stock of the Bank. To become effective, such a decision usually a callable portion. Of NIB’s total authorised capital stock of currently EUR 8,369 million, the GOVERNANCE requires the approval of the parliaments of the Member countries. paid-in portion amounts to EUR 846 million, which corresponds to approximately 10% of the total BOD REPORT The authorised capital stock of the Bank, which initially was approximately EUR 510 million, has authorised capital stock of the Bank. All subscribed capital not paid in is subject to call by the Board been increased several times. most recently in 2020, when the Bank updated its Statutes. The Bank of Directors of NIB to the extent that the Board deems it necessary for the fulfilment of the Bank’s FINANCIALS previously had two main categories of lending: ordinary lending and lending under Special Programs. debt obligations. The Statutes do not require that calls be made pro rata, but it is anticipated that, Financial statements and notes Lending under special programs comprised Project Investment Loans (PIL) and Environmental in the first instance, calls would be made in that manner. Failure by any Member country to make Proposal by the Board of Directors Investment Loans (MIL). Under the new statutes that came into force during 2020 these special payment on any such call would not excuse any other Member country from its obligation to make programs were discontinued. The outstanding amounts under the PIL and MIL facilities became part payment. No Member country can legally be required on any such call to pay more than the unpaid Auditor’s report of NIB’s ordinary lending. The Owner countries' guarantees related to the PIL loans of 1,800 million balance of the callable portion of its subscribed capital. To date no such calls have been made. Report of the Control Committee has been converted to callable capital and the equity reserve allocated to PIL has been converted In view of NIB’s mission as an institution for regional cooperation, there are no provisions in the Chairmanship to paid-in-capital. As a result the authorised capital of the bank amounts to EUR 8,369 million. The 2004 Agreement for admitting additional countries. While a Member country may withdraw by giving Report of the Control Committee split of NIB’s authorised capital into paid-in capital and callable capital is discussed below under notice in accordance with the provisions set forth in the 2004 Agreement, the 2004 Agreement also Ratio definitions “Paid-in Capital and Callable Capital.” provides that a withdrawing country must remain liable for those commitments of NIB that were in As stipulated in NIB’s Statutes, any increase of the authorised capital stock is allocated among force at the time of the withdrawal to the same extent as immediately prior to such withdrawal. SUSTAINABILITY INDICES the Member countries based upon their gross national income (GNI) at market prices as determined from time to time by the Board of Governors. From the establishment of NIB in 1975 until the Baltic Reserves countries joined NIB on January 1, 2005, gross national income (GNI) was calculated at factor Under the Statutes, NIB’s annual net profits are to be transferred to a statutory reserve (the prices for the Nordic countries as an average of the data from the two most recent years available. “Statutory Reserve”) until such reserve equals at least 10% of the authorised capital stock of the Since January 1, 2005 the source for the GNI statistics has been the International Monetary Fund’s Bank. Thereafter, the Board of Governors, acting upon the proposal of the Board of Directors of International Financial Statistics publication. Allocations of new subscribed capital among the NIB, will determine the allocation of net profits between further transfers to the Statutory Reserve, Member countries were fixed at the time of each increase and no adjustments or equalisation General Credit Risk Fund and the payment of dividends to the Member countries. payments were made with respect to capital already subscribed. Accordingly, and because the GNI At 31 December 2023, the Statutory Reserve of NIB amounted to EUR 837 million or 10% of among the Member countries has varied over the years, the authorised and paid-in portions of the the Bank’s authorised capital. NIB has annually allocated a portion of the respective year’s profit Member countries’ capital have not been the same. In 2016, the Bank’s Board of Governors decided as a general credit risk reserve (the “General Credit Risk Fund”) for unidentified risks in the Bank’s to adjust and align NIB’s authorised capital so that each Member country’s share in percentage of operations. At 31 December 2023, the General Credit Risk Fund amounted to EUR 2,387 million. The paid-in capital and callable capital would equal its share of the authorised capital. Following the General Credit Risk Fund is available to cover losses arising from NIB’s lending portfolio as well as completion of the approval process in each Member country, the changes have entered into force other risks NIB assumes in its business activities, such as the activities of its treasury department. and have been implemented. The risks covered with respect to the treasury activities include market risks as well as counterparty risks. For further information in this regard, please see Note 2: Risk management.
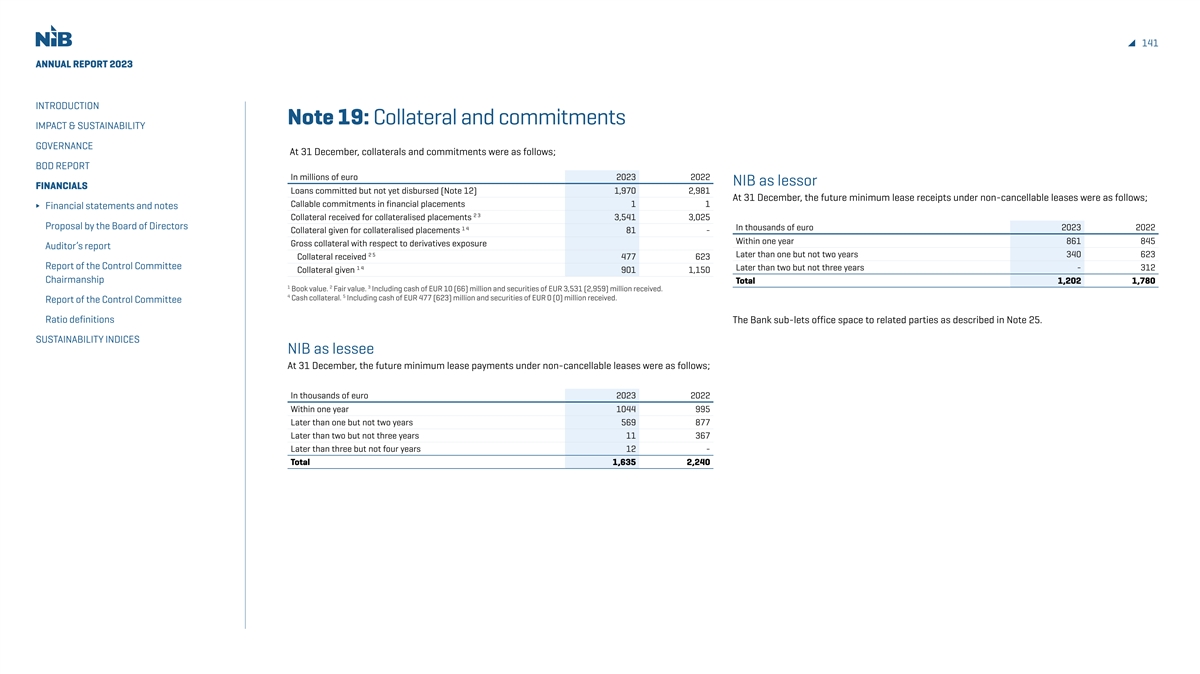
141 ANNUAL REPORT 2023 INTRODUCTION Note 19: Collateral and commitments IMPACT & SUSTAINABILITY GOVERNANCE At 31 December, collaterals and commitments were as follows; BOD REPORT In millions of euro 2023 2022 NIB as lessor FINANCIALS Loans committed but not yet disbursed (Note 12) 1,970 2,981 At 31 December, the future minimum lease receipts under non-cancellable leases were as follows; Callable commitments in financial placements 1 1 Financial statements and notes 2 3 Collateral received for collateralised placements 3,541 3,025 Proposal by the Board of Directors 1 4 In thousands of euro 2023 2022 Collateral given for collateralised placements 81 - Within one year 861 845 Gross collateral with respect to derivatives exposure Auditor’s report 2 5 Later than one but not two years 340 623 Collateral received 477 623 Report of the Control Committee 1 4 Later than two but not three years - 312 Collateral given 901 1,150 Chairmanship Total 1,202 1,780 1 2 3 Book value. Fair value. Including cash of EUR 10 (66) million and securities of EUR 3,531 (2,959) million received. 4 5 Cash collateral. Including cash of EUR 477 (623) million and securities of EUR 0 (0) million received. Report of the Control Committee Ratio definitions The Bank sub-lets office space to related parties as described in Note 25. SUSTAINABILITY INDICES NIB as lessee At 31 December, the future minimum lease payments under non-cancellable leases were as follows; In thousands of euro 2023 2022 Within one year 1044 995 Later than one but not two years 569 877 Later than two but not three years 11 367 Later than three but not four years 12 - Total 1,635 2,240
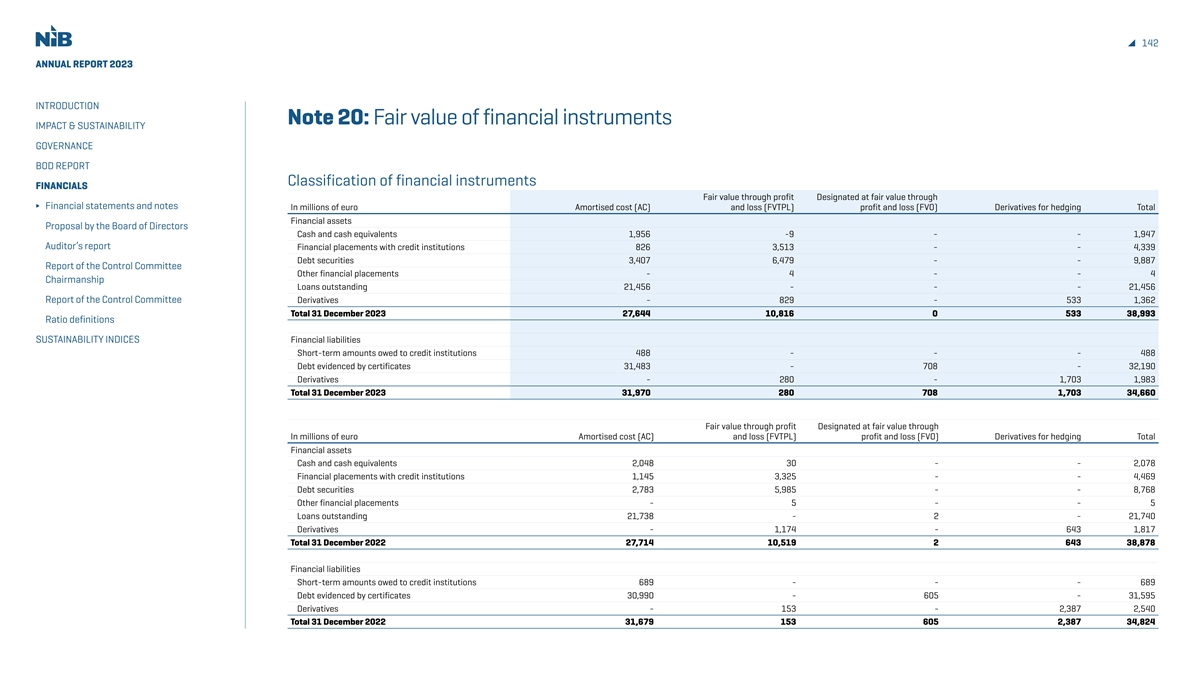
142 ANNUAL REPORT 2023 INTRODUCTION Note 20: Fair value of financial instruments IMPACT & SUSTAINABILITY GOVERNANCE BOD REPORT Classification of financial instruments FINANCIALS Fair value through profit Designated at fair value through Financial statements and notes In millions of euro Amortised cost (AC) and loss (FVTPL) profit and loss (FVO) Derivatives for hedging Total Financial assets Proposal by the Board of Directors Cash and cash equivalents 1,956 -9 - - 1,947 Auditor’s report Financial placements with credit institutions 826 3,513 - - 4,339 Debt securities 3,407 6,479 - - 9,887 Report of the Control Committee Other financial placements - 4 - - 4 Chairmanship Loans outstanding 21,456 - - - 21,456 Report of the Control Committee Derivatives - 829 - 533 1,362 Total 31 December 2023 27,644 10,816 0 533 38,993 Ratio definitions SUSTAINABILITY INDICES Financial liabilities Short-term amounts owed to credit institutions 488 - - - 488 Debt evidenced by certificates 31,483 - 708 - 32,190 Derivatives - 280 - 1,703 1,983 Total 31 December 2023 31,970 280 708 1,703 34,660 Fair value through profit Designated at fair value through In millions of euro Amortised cost (AC) and loss (FVTPL) profit and loss (FVO) Derivatives for hedging Total Financial assets Cash and cash equivalents 2,048 30 - - 2,078 Financial placements with credit institutions 1,145 3,325 - - 4,469 Debt securities 2,783 5,985 - - 8,768 Other financial placements - 5 - - 5 Loans outstanding 21,738 - 2 - 21,740 Derivatives - 1,174 - 643 1,817 Total 31 December 2022 27,714 10,519 2 643 38,878 Financial liabilities Short-term amounts owed to credit institutions 689 - - - 689 Debt evidenced by certificates 30,990 - 605 - 31,595 Derivatives - 153 - 2,387 2,540 Total 31 December 2022 31,679 153 605 2,387 34,824
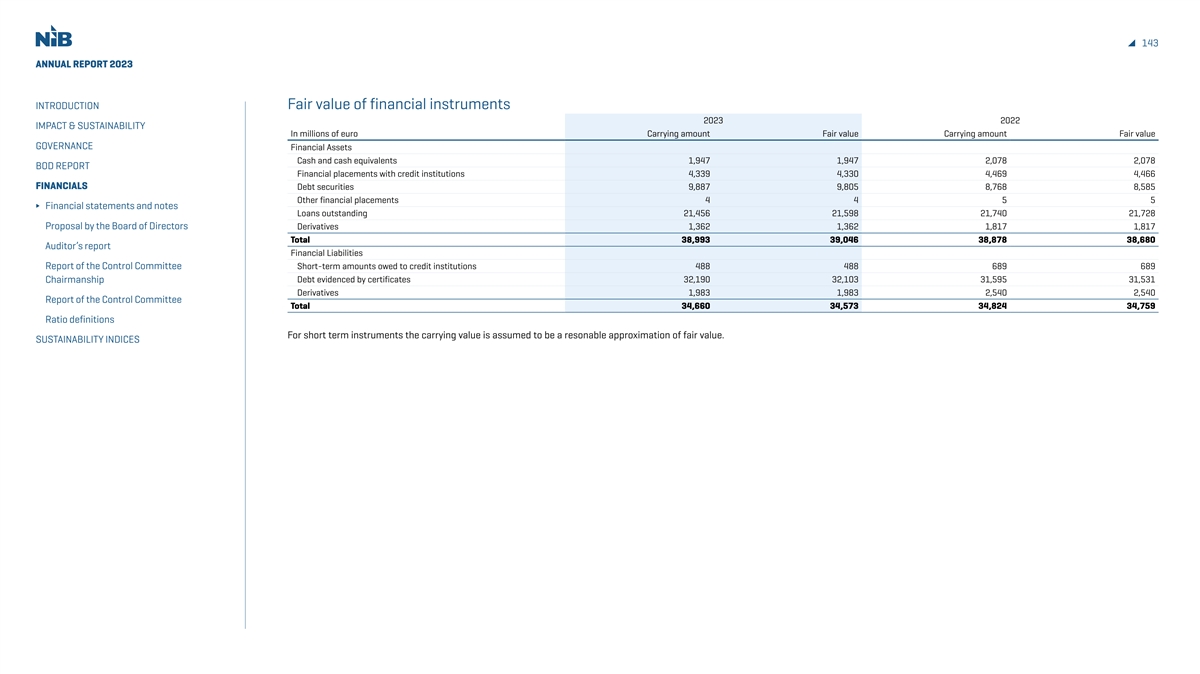
143 ANNUAL REPORT 2023 INTRODUCTION Fair value of financial instruments 2023 2022 IMPACT & SUSTAINABILITY In millions of euro Carrying amount Fair value Carrying amount Fair value GOVERNANCE Financial Assets Cash and cash equivalents 1,947 1,947 2,078 2,078 BOD REPORT Financial placements with credit institutions 4,339 4,330 4,469 4,466 FINANCIALS Debt securities 9,887 9,805 8,768 8,585 Other financial placements 4 4 5 5 Financial statements and notes Loans outstanding 21,456 21,598 21,740 21,728 Proposal by the Board of Directors Derivatives 1,362 1,362 1,817 1,817 Total 38,993 39,046 38,878 38,680 Auditor’s report Financial Liabilities Report of the Control Committee Short-term amounts owed to credit institutions 488 488 689 689 Debt evidenced by certificates 32,190 32,103 31,595 31,531 Chairmanship Derivatives 1,983 1,983 2,540 2,540 Report of the Control Committee Total 34,660 34,573 34,824 34,759 Ratio definitions For short term instruments the carrying value is assumed to be a resonable approximation of fair value. SUSTAINABILITY INDICES
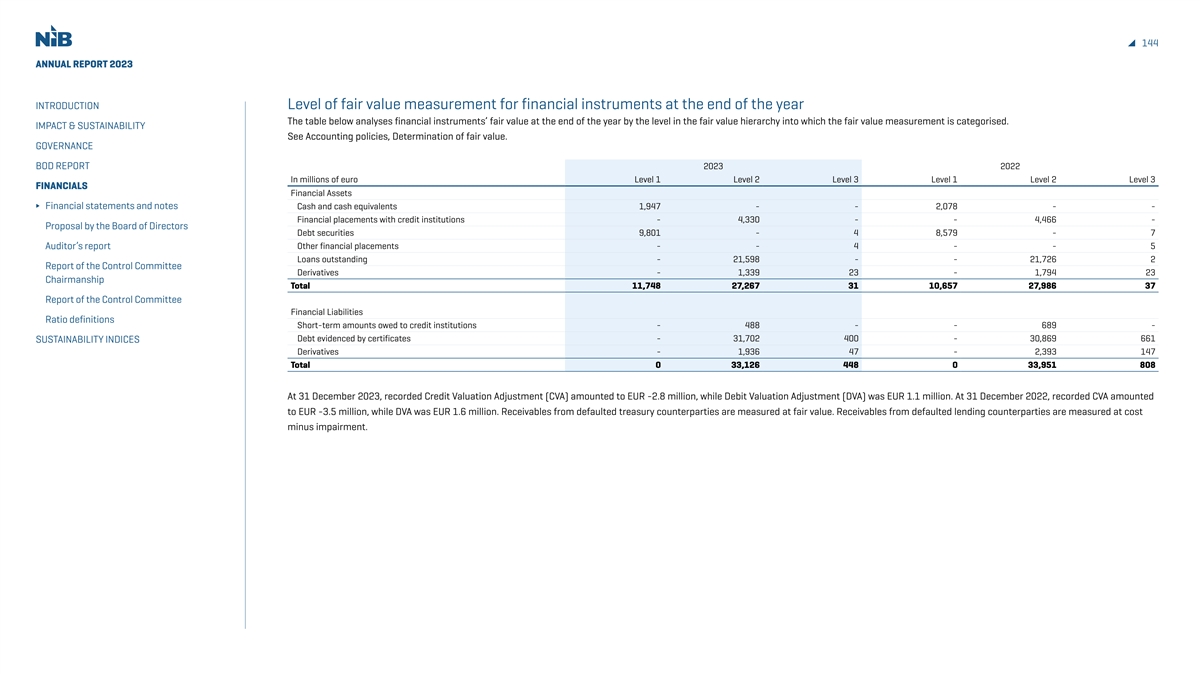
144 ANNUAL REPORT 2023 INTRODUCTION Level of fair value measurement for financial instruments at the end of the year The table below analyses financial instruments’ fair value at the end of the year by the level in the fair value hierarchy into which the fair value measurement is categorised. IMPACT & SUSTAINABILITY See Accounting policies, Determination of fair value. GOVERNANCE BOD REPORT 2023 2022 In millions of euro Level 1 Level 2 Level 3 Level 1 Level 2 Level 3 FINANCIALS Financial Assets Financial statements and notes Cash and cash equivalents 1,947 - - 2,078 - - Financial placements with credit institutions - 4,330 - - 4,466 - Proposal by the Board of Directors Debt securities 9,801 - 4 8,579 - 7 Auditor’s report Other financial placements - - 4 - - 5 Loans outstanding - 21,598 - - 21,726 2 Report of the Control Committee Derivatives - 1,339 23 - 1,794 23 Chairmanship Total 11,748 27,267 31 10,657 27,986 37 Report of the Control Committee Financial Liabilities Ratio definitions Short-term amounts owed to credit institutions - 488 - - 689 - Debt evidenced by certificates - 31,702 400 - 30,869 661 SUSTAINABILITY INDICES Derivatives - 1,936 47 - 2,393 147 Total 0 33,126 448 0 33,951 808 At 31 December 2023, recorded Credit Valuation Adjustment (CVA) amounted to EUR -2.8 million, while Debit Valuation Adjustment (DVA) was EUR 1.1 million. At 31 December 2022, recorded CVA amounted to EUR -3.5 million, while DVA was EUR 1.6 million. Receivables from defaulted treasury counterparties are measured at fair value. Receivables from defaulted lending counterparties are measured at cost minus impairment.
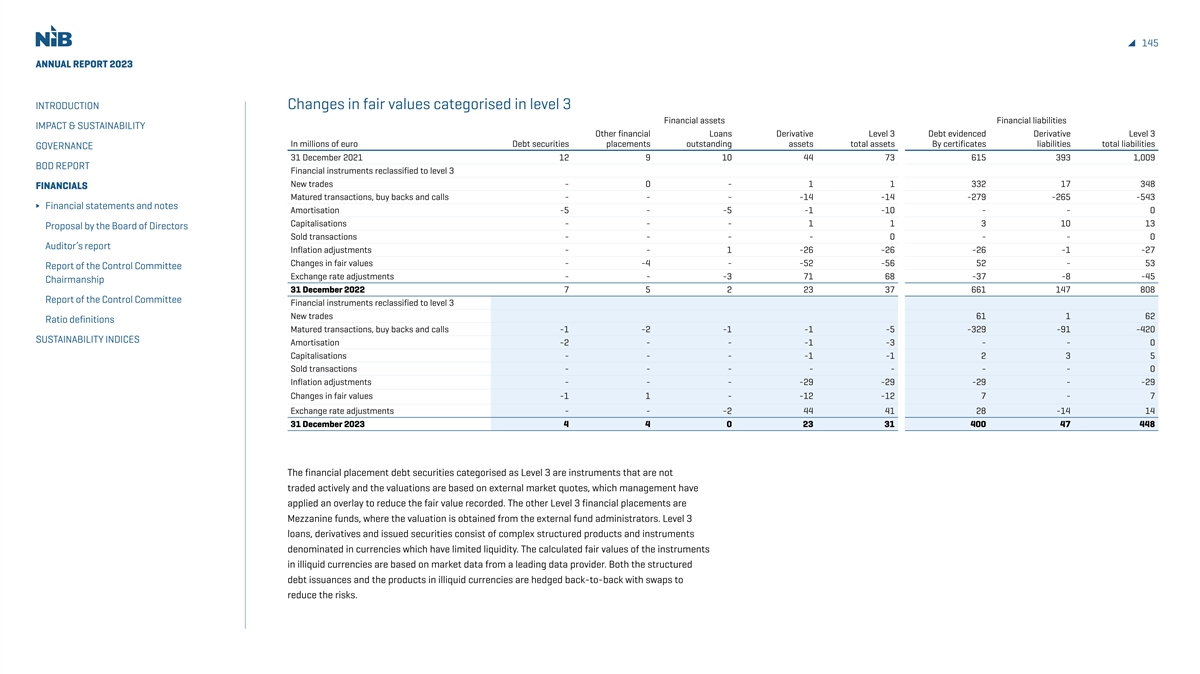
145 ANNUAL REPORT 2023 INTRODUCTION Changes in fair values categorised in level 3 Financial assets Financial liabilities IMPACT & SUSTAINABILITY Other financial Loans Derivative Level 3 Debt evidenced Derivative Level 3 In millions of euro Debt securities placements outstanding assets total assets By certificates liabilities total liabilities GOVERNANCE 31 December 2021 12 9 10 44 73 615 393 1,009 BOD REPORT Financial instruments reclassified to level 3 New trades - 0 - 1 1 332 17 348 FINANCIALS Matured transactions, buy backs and calls - - - -14 -14 -279 -265 -543 Financial statements and notes Amortisation -5 - -5 -1 -10 - - 0 Capitalisations - - - 1 1 3 10 13 Proposal by the Board of Directors Sold transactions - - - - 0 - - 0 Auditor’s report Inflation adjustments - - 1 -26 -26 -26 -1 -27 Changes in fair values - -4 - -52 -56 52 - 53 Report of the Control Committee Exchange rate adjustments - - -3 71 68 -37 -8 -45 Chairmanship 31 December 2022 7 5 2 23 37 661 147 808 Report of the Control Committee Financial instruments reclassified to level 3 New trades 61 1 62 Ratio definitions Matured transactions, buy backs and calls -1 -2 -1 -1 -5 -329 -91 -420 SUSTAINABILITY INDICES Amortisation -2 - - -1 -3 - - 0 Capitalisations - - - -1 -1 2 3 5 Sold transactions - - - - - - - 0 Inflation adjustments - - - -29 -29 -29 - -29 Changes in fair values -1 1 - -12 -12 7 - 7 Exchange rate adjustments - - -2 44 41 28 -14 14 31 December 2023 4 4 0 23 31 400 47 448 The financial placement debt securities categorised as Level 3 are instruments that are not traded actively and the valuations are based on external market quotes, which management have applied an overlay to reduce the fair value recorded. The other Level 3 financial placements are Mezzanine funds, where the valuation is obtained from the external fund administrators. Level 3 loans, derivatives and issued securities consist of complex structured products and instruments denominated in currencies which have limited liquidity. The calculated fair values of the instruments in illiquid currencies are based on market data from a leading data provider. Both the structured debt issuances and the products in illiquid currencies are hedged back-to-back with swaps to reduce the risks.
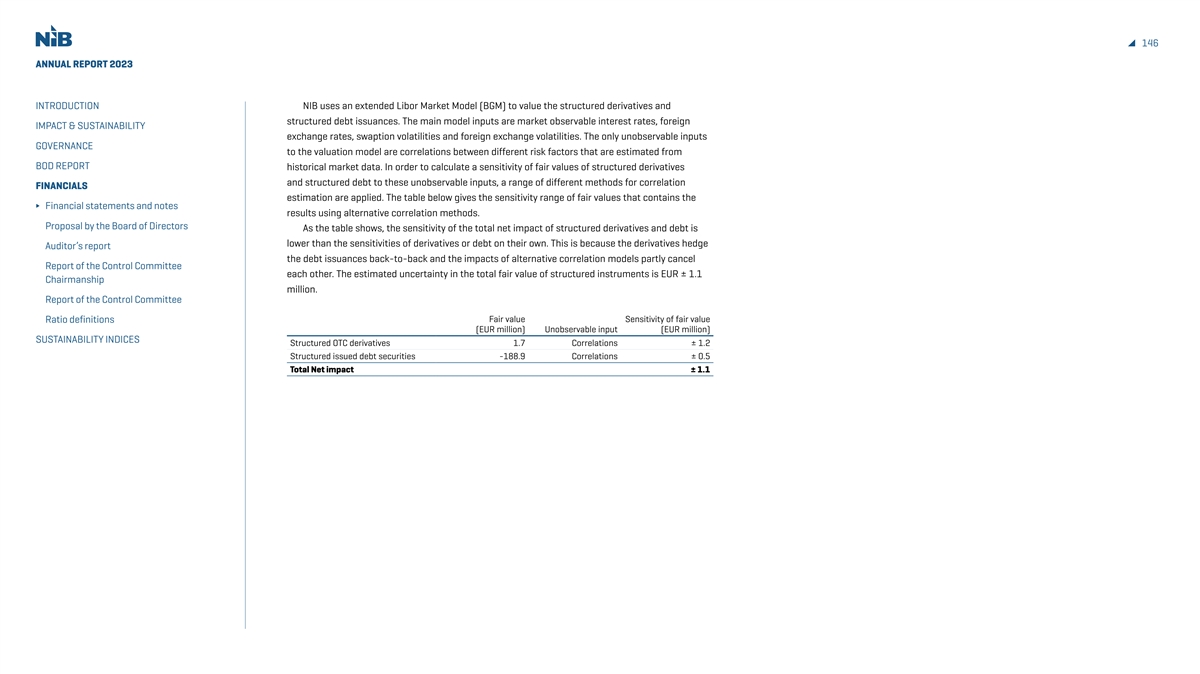
146 ANNUAL REPORT 2023 INTRODUCTION NIB uses an extended Libor Market Model (BGM) to value the structured derivatives and structured debt issuances. The main model inputs are market observable interest rates, foreign IMPACT & SUSTAINABILITY exchange rates, swaption volatilities and foreign exchange volatilities. The only unobservable inputs GOVERNANCE to the valuation model are correlations between different risk factors that are estimated from BOD REPORT historical market data. In order to calculate a sensitivity of fair values of structured derivatives and structured debt to these unobservable inputs, a range of different methods for correlation FINANCIALS estimation are applied. The table below gives the sensitivity range of fair values that contains the Financial statements and notes results using alternative correlation methods. Proposal by the Board of Directors As the table shows, the sensitivity of the total net impact of structured derivatives and debt is lower than the sensitivities of derivatives or debt on their own. This is because the derivatives hedge Auditor’s report the debt issuances back-to-back and the impacts of alternative correlation models partly cancel Report of the Control Committee each other. The estimated uncertainty in the total fair value of structured instruments is EUR ± 1.1 Chairmanship million. Report of the Control Committee Fair value Sensitivity of fair value Ratio definitions (EUR million) Unobservable input (EUR million) SUSTAINABILITY INDICES Structured OTC derivatives 1.7 Correlations ± 1.2 Structured issued debt securities -188.9 Correlations ± 0.5 Total Net impact ± 1.1
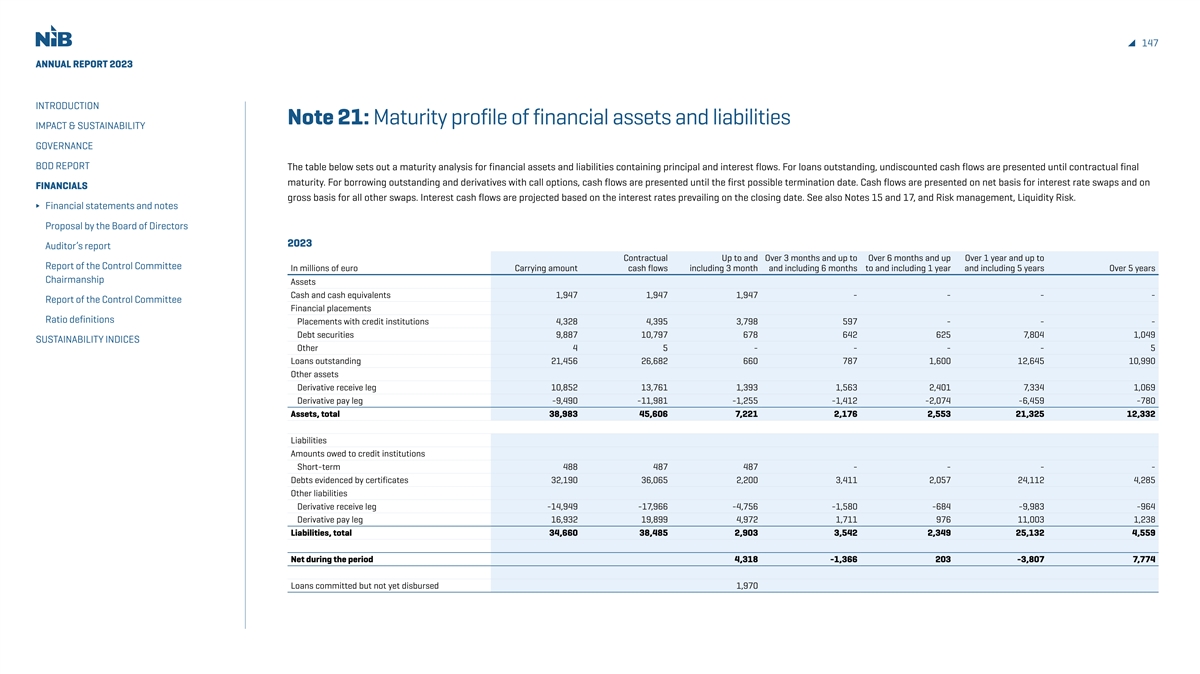
147 ANNUAL REPORT 2023 INTRODUCTION Note 21: Maturity profile of financial assets and liabilities IMPACT & SUSTAINABILITY GOVERNANCE BOD REPORT The table below sets out a maturity analysis for financial assets and liabilities containing principal and interest flows. For loans outstanding, undiscounted cash flows are presented until contractual final maturity. For borrowing outstanding and derivatives with call options, cash flows are presented until the first possible termination date. Cash flows are presented on net basis for interest rate swaps and on FINANCIALS gross basis for all other swaps. Interest cash flows are projected based on the interest rates prevailing on the closing date. See also Notes 15 and 17, and Risk management, Liquidity Risk. Financial statements and notes Proposal by the Board of Directors 2023 Auditor’s report Contractual Up to and Over 3 months and up to Over 6 months and up Over 1 year and up to Report of the Control Committee In millions of euro Carrying amount cash flows including 3 month and including 6 months to and including 1 year and including 5 years Over 5 years Chairmanship Assets Cash and cash equivalents 1,947 1,947 1,947 - - - - Report of the Control Committee Financial placements Ratio definitions Placements with credit institutions 4,328 4,395 3,798 597 - - - Debt securities 9,887 10,797 678 642 625 7,804 1,049 SUSTAINABILITY INDICES Other 4 5 - - - - 5 Loans outstanding 21,456 26,682 660 787 1,600 12,645 10,990 Other assets Derivative receive leg 10,852 13,761 1,393 1,563 2,401 7,334 1,069 Derivative pay leg -9,490 -11,981 -1,255 -1,412 -2,074 -6,459 -780 Assets, total 38,983 45,606 7,221 2,176 2,553 21,325 12,332 Liabilities Amounts owed to credit institutions Short-term 488 487 487 - - - - Debts evidenced by certificates 32,190 36,065 2,200 3,411 2,057 24,112 4,285 Other liabilities Derivative receive leg -14,949 -17,966 -4,756 -1,580 -684 -9,983 -964 Derivative pay leg 16,932 19,899 4,972 1,711 976 11,003 1,238 Liabilities, total 34,660 38,485 2,903 3,542 2,349 25,132 4,559 Net during the period 4,318 -1,366 203 -3,807 7,774 Loans committed but not yet disbursed 1,970
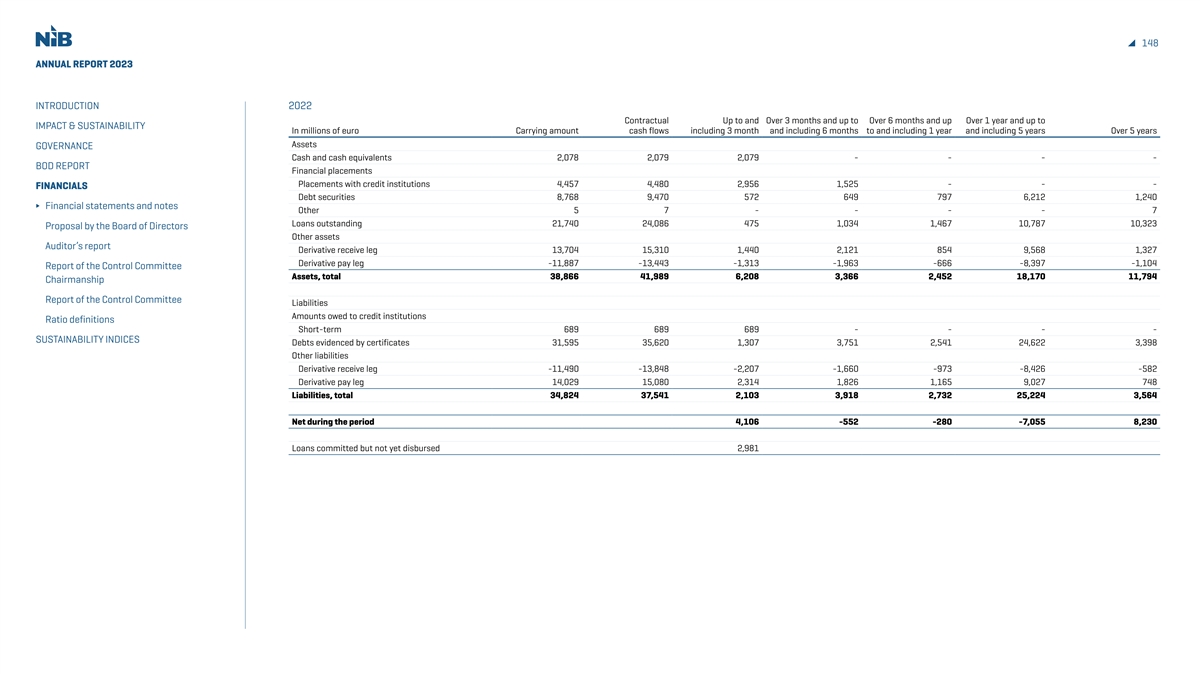
148 ANNUAL REPORT 2023 INTRODUCTION 2022 Contractual Up to and Over 3 months and up to Over 6 months and up Over 1 year and up to IMPACT & SUSTAINABILITY In millions of euro Carrying amount cash flows including 3 month and including 6 months to and including 1 year and including 5 years Over 5 years Assets GOVERNANCE Cash and cash equivalents 2,078 2,079 2,079 - - - - BOD REPORT Financial placements Placements with credit institutions 4,457 4,480 2,956 1,525 - - - FINANCIALS Debt securities 8,768 9,470 572 649 797 6,212 1,240 Financial statements and notes Other 5 7 - - - - 7 Loans outstanding 21,740 24,086 475 1,034 1,467 10,787 10,323 Proposal by the Board of Directors Other assets Auditor’s report Derivative receive leg 13,704 15,310 1,440 2,121 854 9,568 1,327 Derivative pay leg -11,887 -13,443 -1,313 -1,963 -666 -8,397 -1,104 Report of the Control Committee Assets, total 38,866 41,989 6,208 3,366 2,452 18,170 11,794 Chairmanship Report of the Control Committee Liabilities Amounts owed to credit institutions Ratio definitions Short-term 689 689 689 - - - - SUSTAINABILITY INDICES Debts evidenced by certificates 31,595 35,620 1,307 3,751 2,541 24,622 3,398 Other liabilities Derivative receive leg -11,490 -13,848 -2,207 -1,660 -973 -8,426 -582 Derivative pay leg 14,029 15,080 2,314 1,826 1,165 9,027 748 Liabilities, total 34,824 37,541 2,103 3,918 2,732 25,224 3,564 Net during the period 4,106 -552 -280 -7,055 8,230 Loans committed but not yet disbursed 2,981
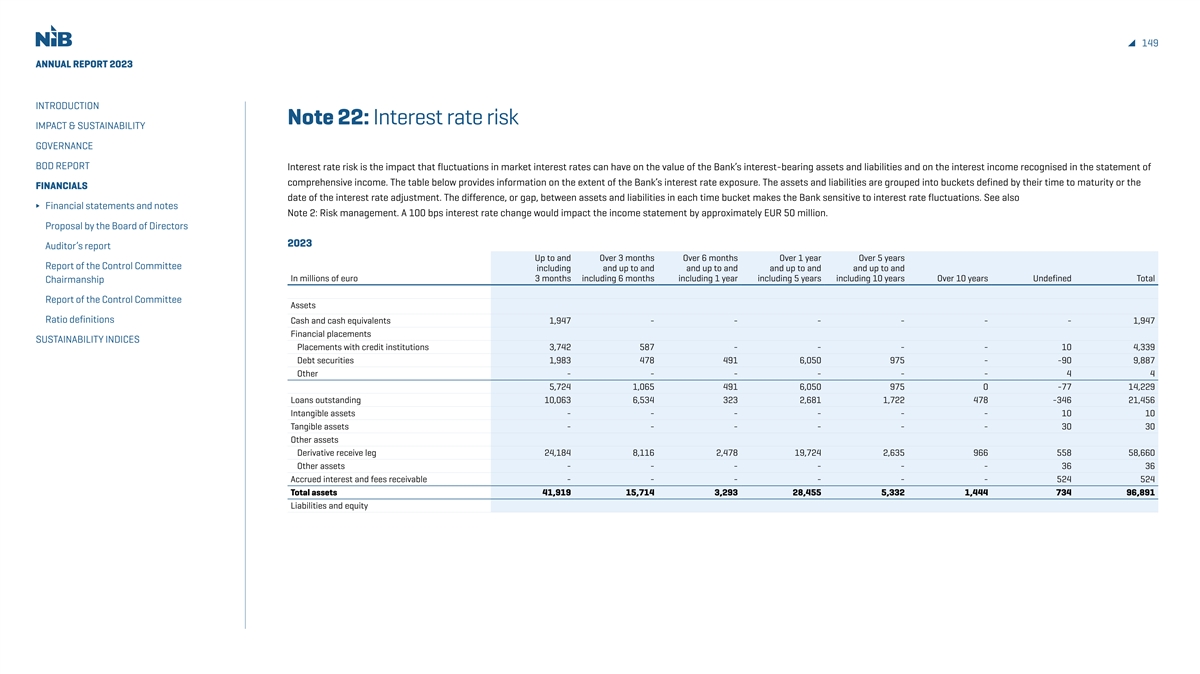
149 ANNUAL REPORT 2023 INTRODUCTION Note 22: Interest rate risk IMPACT & SUSTAINABILITY GOVERNANCE BOD REPORT Interest rate risk is the impact that fluctuations in market interest rates can have on the value of the Bank’s interest-bearing assets and liabilities and on the interest income recognised in the statement of comprehensive income. The table below provides information on the extent of the Bank’s interest rate exposure. The assets and liabilities are grouped into buckets defined by their time to maturity or the FINANCIALS date of the interest rate adjustment. The difference, or gap, between assets and liabilities in each time bucket makes the Bank sensitive to interest rate fluctuations. See also Financial statements and notes Note 2: Risk management. A 100 bps interest rate change would impact the income statement by approximately EUR 50 million. Proposal by the Board of Directors 2023 Auditor’s report Up to and Over 3 months Over 6 months Over 1 year Over 5 years Report of the Control Committee including and up to and and up to and and up to and and up to and In millions of euro 3 months including 6 months including 1 year including 5 years including 10 years Over 10 years Undefined Total Chairmanship Report of the Control Committee Assets Ratio definitions Cash and cash equivalents 1,947 - - - - - - 1,947 Financial placements SUSTAINABILITY INDICES Placements with credit institutions 3,742 587 - - - - 10 4,339 Debt securities 1,983 478 491 6,050 975 - -90 9,887 Other - - - - - - 4 4 5,724 1,065 491 6,050 975 0 -77 14,229 Loans outstanding 10,063 6,534 323 2,681 1,722 478 -346 21,456 Intangible assets - - - - - - 10 10 Tangible assets - - - - - - 30 30 Other assets Derivative receive leg 24,184 8,116 2,478 19,724 2,635 966 558 58,660 Other assets - - - - - - 36 36 Accrued interest and fees receivable - - - - - - 524 524 Total assets 41,919 15,714 3,293 28,455 5,332 1,444 734 96,891 Liabilities and equity
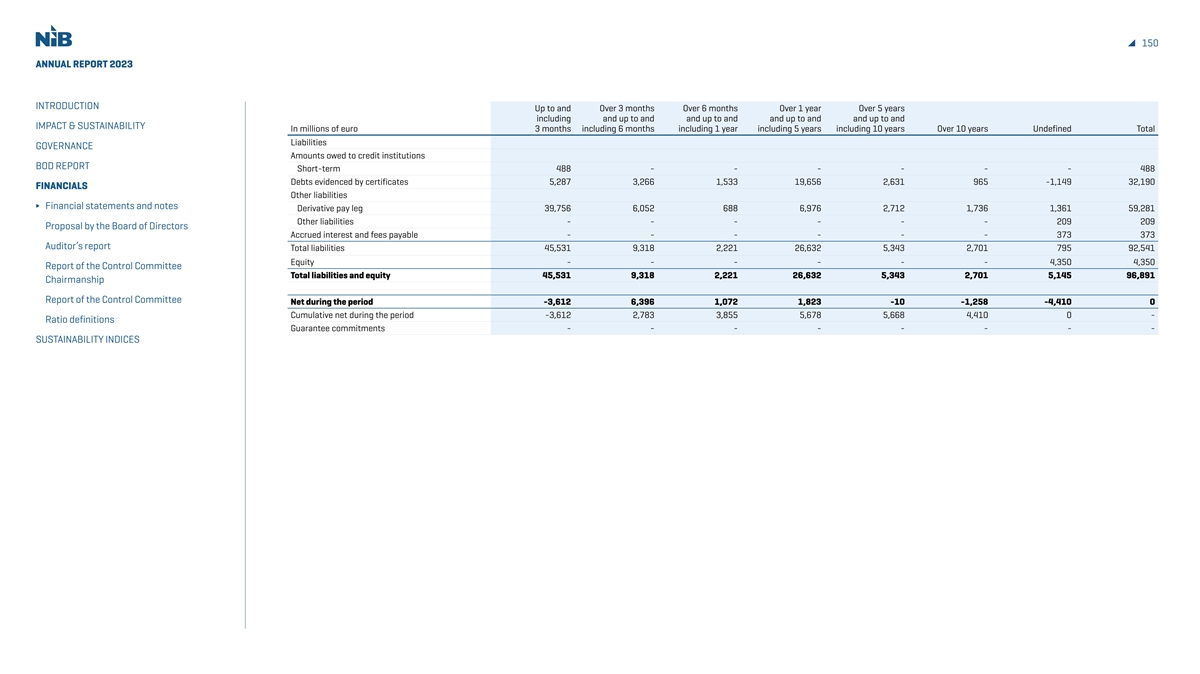
150 ANNUAL REPORT 2023 INTRODUCTION Up to and Over 3 months Over 6 months Over 1 year Over 5 years including and up to and and up to and and up to and and up to and IMPACT & SUSTAINABILITY In millions of euro 3 months including 6 months including 1 year including 5 years including 10 years Over 10 years Undefined Total Liabilities GOVERNANCE Amounts owed to credit institutions BOD REPORT Short-term 488 - - - - - - 488 Debts evidenced by certificates 5,287 3,266 1,533 19,656 2,631 965 -1,149 32,190 FINANCIALS Other liabilities Financial statements and notes Derivative pay leg 39,756 6,052 688 6,976 2,712 1,736 1,361 59,281 Other liabilities - - - - - - 209 209 Proposal by the Board of Directors Accrued interest and fees payable - - - - - - 373 373 Auditor’s report Total liabilities 45,531 9,318 2,221 26,632 5,343 2,701 795 92,541 Equity - - - - - - 4,350 4,350 Report of the Control Committee Total liabilities and equity 45,531 9,318 2,221 26,632 5,343 2,701 5,145 96,891 Chairmanship Report of the Control Committee Net during the period -3,612 6,396 1,072 1,823 -10 -1,258 -4,410 0 Cumulative net during the period -3,612 2,783 3,855 5,678 5,668 4,410 0 - Ratio definitions Guarantee commitments - - - - - - - - SUSTAINABILITY INDICES
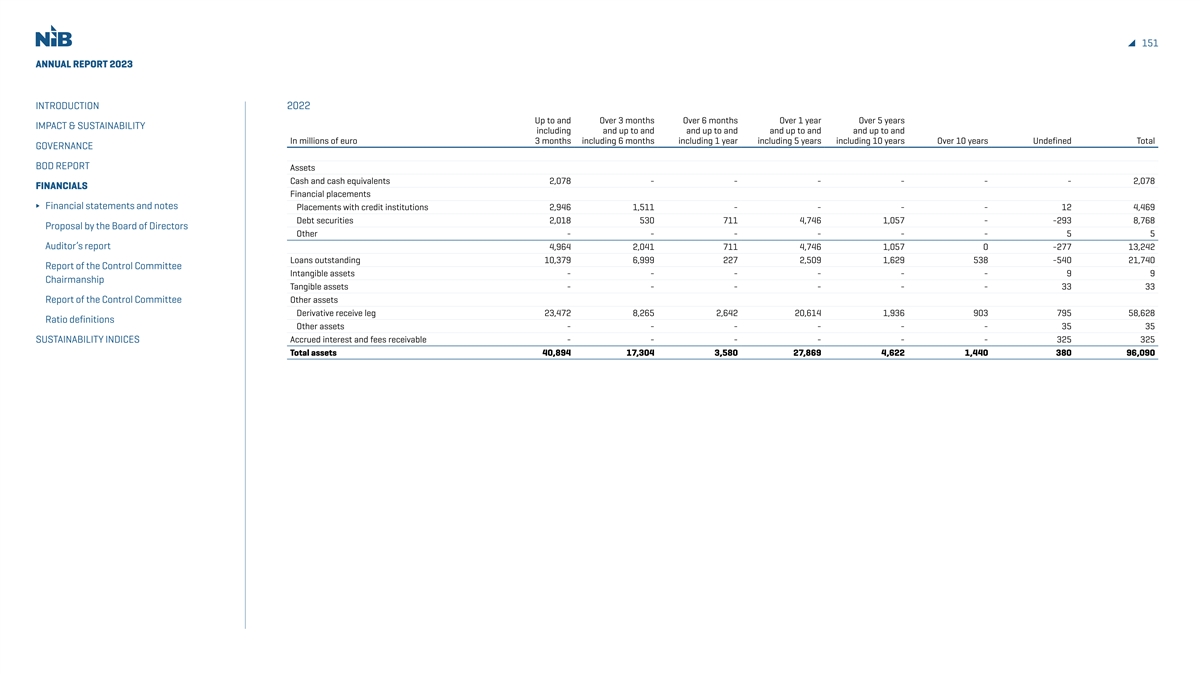
151 ANNUAL REPORT 2023 INTRODUCTION 2022 Up to and Over 3 months Over 6 months Over 1 year Over 5 years IMPACT & SUSTAINABILITY including and up to and and up to and and up to and and up to and In millions of euro 3 months including 6 months including 1 year including 5 years including 10 years Over 10 years Undefined Total GOVERNANCE BOD REPORT Assets Cash and cash equivalents 2,078 - - - - - - 2,078 FINANCIALS Financial placements Financial statements and notes Placements with credit institutions 2,946 1,511 - - - - 12 4,469 Debt securities 2,018 530 711 4,746 1,057 - -293 8,768 Proposal by the Board of Directors Other - - - - - - 5 5 Auditor’s report 4,964 2,041 711 4,746 1,057 0 -277 13,242 Loans outstanding 10,379 6,999 227 2,509 1,629 538 -540 21,740 Report of the Control Committee Intangible assets - - - - - - 9 9 Chairmanship Tangible assets - - - - - - 33 33 Report of the Control Committee Other assets Derivative receive leg 23,472 8,265 2,642 20,614 1,936 903 795 58,628 Ratio definitions Other assets - - - - - - 35 35 Accrued interest and fees receivable - - - - - - 325 325 SUSTAINABILITY INDICES Total assets 40,894 17,304 3,580 27,869 4,622 1,440 380 96,090
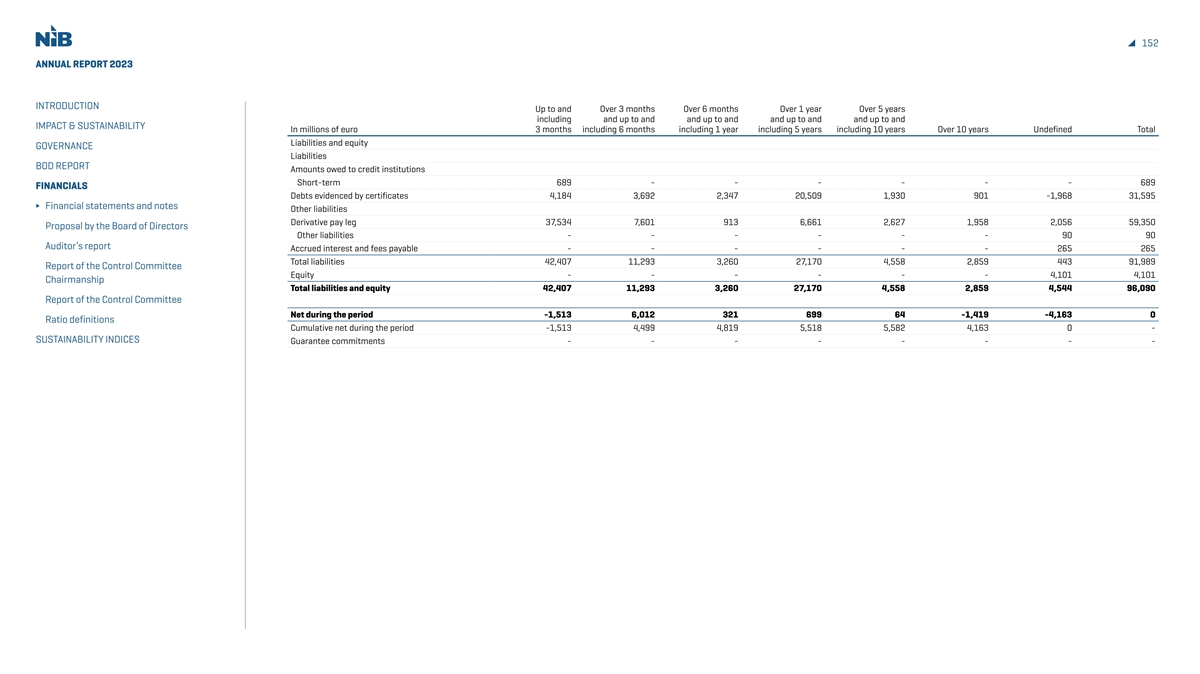
152 ANNUAL REPORT 2023 INTRODUCTION Up to and Over 3 months Over 6 months Over 1 year Over 5 years including and up to and and up to and and up to and and up to and IMPACT & SUSTAINABILITY In millions of euro 3 months including 6 months including 1 year including 5 years including 10 years Over 10 years Undefined Total Liabilities and equity GOVERNANCE Liabilities BOD REPORT Amounts owed to credit institutions Short-term 689 - - - - - - 689 FINANCIALS Debts evidenced by certificates 4,184 3,692 2,347 20,509 1,930 901 -1,968 31,595 Financial statements and notes Other liabilities Derivative pay leg 37,534 7,601 913 6,661 2,627 1,958 2,056 59,350 Proposal by the Board of Directors Other liabilities - - - - - - 90 90 Auditor’s report Accrued interest and fees payable - - - - - - 265 265 Total liabilities 42,407 11,293 3,260 27,170 4,558 2,859 443 91,989 Report of the Control Committee Equity - - - - - - 4,101 4,101 Chairmanship Total liabilities and equity 42,407 11,293 3,260 27,170 4,558 2,859 4,544 96,090 Report of the Control Committee Net during the period -1,513 6,012 321 699 64 -1,419 -4,163 0 Ratio definitions Cumulative net during the period -1,513 4,499 4,819 5,518 5,582 4,163 0 - SUSTAINABILITY INDICES Guarantee commitments - - - - - - - -
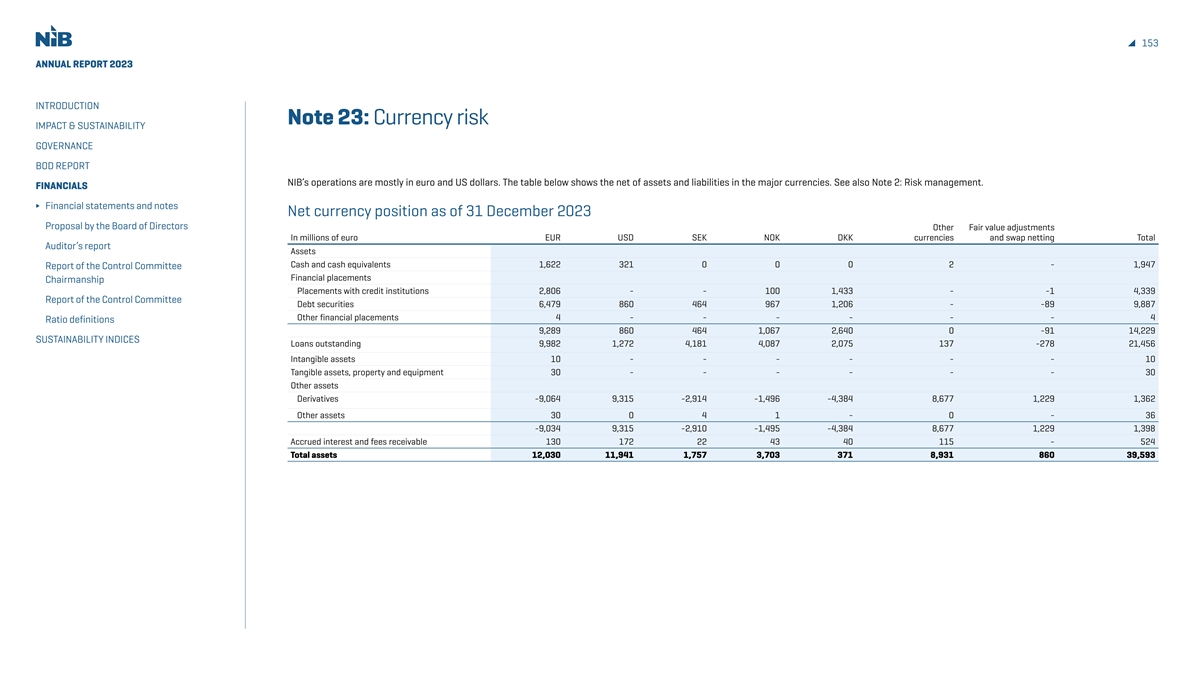
153 ANNUAL REPORT 2023 INTRODUCTION Note 23: Currency risk IMPACT & SUSTAINABILITY GOVERNANCE BOD REPORT NIB’s operations are mostly in euro and US dollars. The table below shows the net of assets and liabilities in the major currencies. See also Note 2: Risk management. FINANCIALS Financial statements and notes Net currency position as of 31 December 2023 Proposal by the Board of Directors Other Fair value adjustments In millions of euro EUR USD SEK NOK DKK currencies and swap netting Total Auditor’s report Assets Cash and cash equivalents 1,622 321 0 0 0 2 - 1,947 Report of the Control Committee Financial placements Chairmanship Placements with credit institutions 2,806 - - 100 1,433 - -1 4,339 Report of the Control Committee Debt securities 6,479 860 464 967 1,206 - -89 9,887 Other financial placements 4 - - - - - - 4 Ratio definitions 9,289 860 464 1,067 2,640 0 -91 14,229 SUSTAINABILITY INDICES Loans outstanding 9,982 1,272 4,181 4,087 2,075 137 -278 21,456 Intangible assets 10 - - - - - - 10 Tangible assets, property and equipment 30 - - - - - - 30 Other assets Derivatives -9,064 9,315 -2,914 -1,496 -4,384 8,677 1,229 1,362 Other assets 30 0 4 1 - 0 - 36 -9,034 9,315 -2,910 -1,495 -4,384 8,677 1,229 1,398 Accrued interest and fees receivable 130 172 22 43 40 115 - 524 Total assets 12,030 11,941 1,757 3,703 371 8,931 860 39,593

154 ANNUAL REPORT 2023 INTRODUCTION Other Fair value adjustments In millions of euro EUR USD SEK NOK DKK currencies and swap netting Total IMPACT & SUSTAINABILITY Liabilities and equity Liabilities GOVERNANCE Amounts owed to credit institutions BOD REPORT Short-term amounts owed to credit institutions 487 - - 0 - - - 488 Debt evidenced by certificates 7,146 11,811 1,733 3,543 348 8,758 -1,149 32,190 FINANCIALS Other Liabilities 0 Financial statements and notes Derivatives - - - - - - 1,983 1,983 Proposal by the Board of Directors Other liabilities 26 13 2 110 1 57 - 209 26 13 2 110 1 57 1,983 2,192 Auditor’s report Accrued interest and fees payable 46 120 22 49 22 114 - 373 Report of the Control Committee Total liabilities 7,705 11,944 1,757 3,703 371 8,930 834 35,243 Chairmanship Equity 4,070 - - - - - 29 4,099 Total liabilities and equity 11,775 11,944 1,757 3,703 371 8,930 863 39,342 Report of the Control Committee Ratio definitions Net of assets and liabilities as of 31 Dec 2023 255 -3 0 0 0 1 -4 251 SUSTAINABILITY INDICES
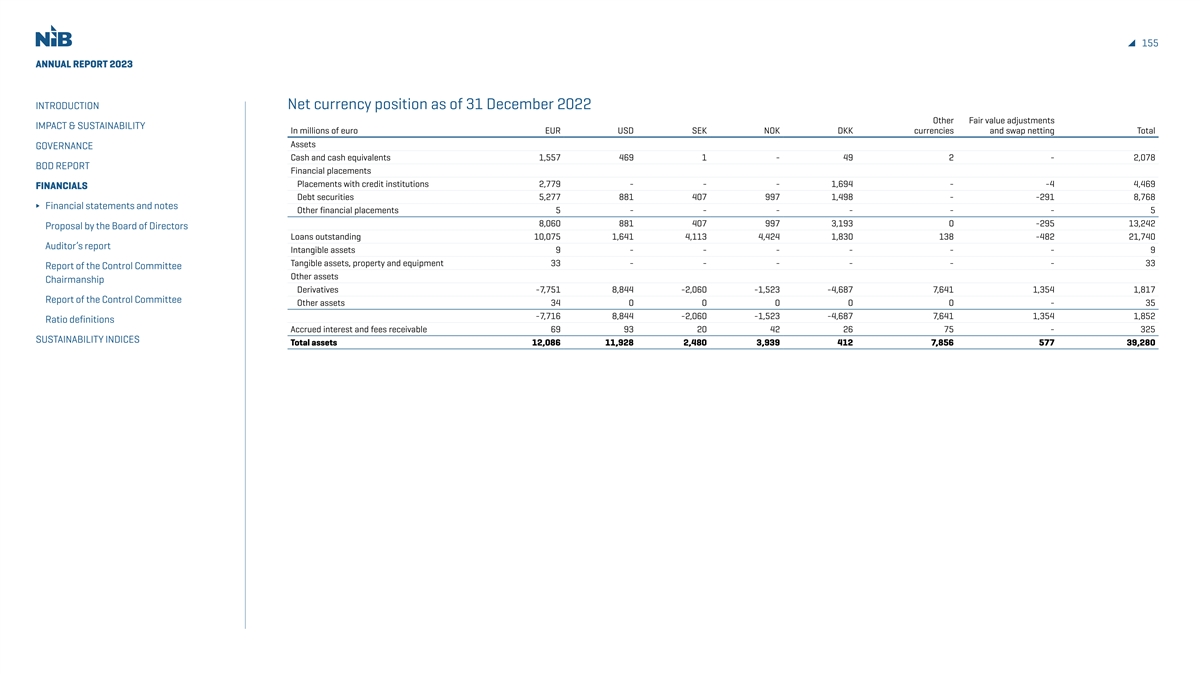
155 ANNUAL REPORT 2023 INTRODUCTION Net currency position as of 31 December 2022 Other Fair value adjustments IMPACT & SUSTAINABILITY In millions of euro EUR USD SEK NOK DKK currencies and swap netting Total Assets GOVERNANCE Cash and cash equivalents 1,557 469 1 - 49 2 - 2,078 BOD REPORT Financial placements Placements with credit institutions 2,779 - - - 1,694 - -4 4,469 FINANCIALS Debt securities 5,277 881 407 997 1,498 - -291 8,768 Financial statements and notes Other financial placements 5 - - - - - - 5 8,060 881 407 997 3,193 0 -295 13,242 Proposal by the Board of Directors Loans outstanding 10,075 1,641 4,113 4,424 1,830 138 -482 21,740 Auditor’s report Intangible assets 9 - - - - - - 9 Tangible assets, property and equipment 33 - - - - - - 33 Report of the Control Committee Other assets Chairmanship Derivatives -7,751 8,844 -2,060 -1,523 -4,687 7,641 1,354 1,817 Report of the Control Committee Other assets 34 0 0 0 0 0 - 35 -7,716 8,844 -2,060 -1,523 -4,687 7,641 1,354 1,852 Ratio definitions Accrued interest and fees receivable 69 93 20 42 26 75 - 325 SUSTAINABILITY INDICES Total assets 12,086 11,928 2,480 3,939 412 7,856 577 39,280
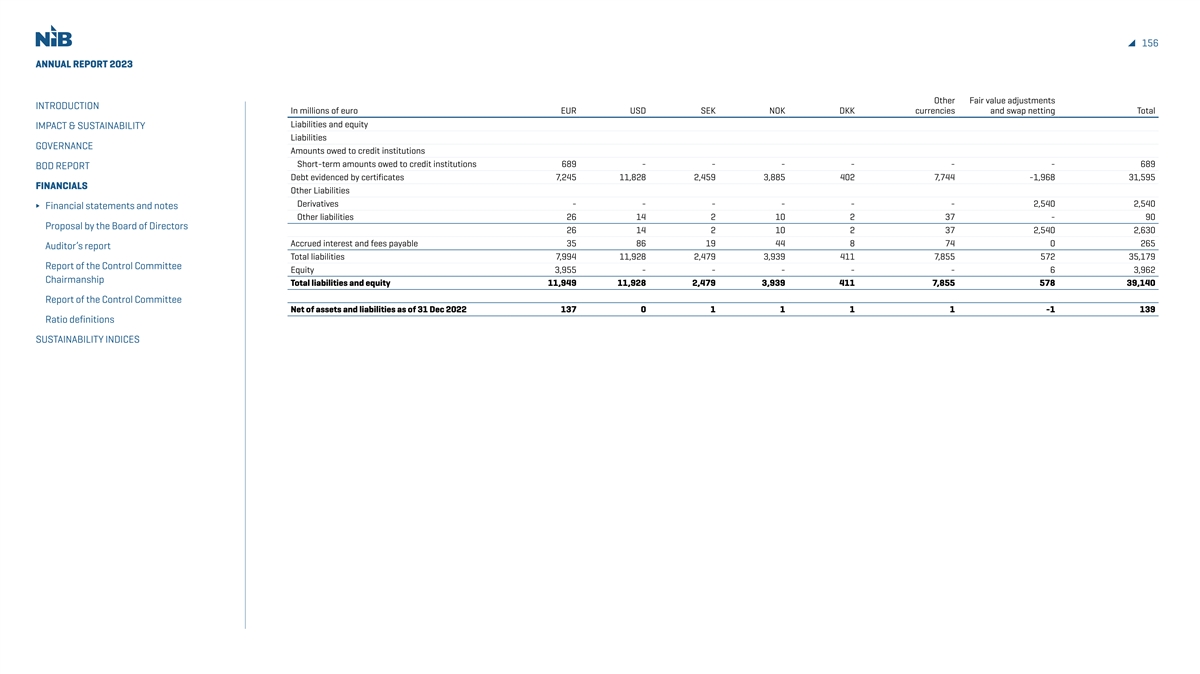
156 ANNUAL REPORT 2023 Other Fair value adjustments INTRODUCTION In millions of euro EUR USD SEK NOK DKK currencies and swap netting Total Liabilities and equity IMPACT & SUSTAINABILITY Liabilities GOVERNANCE Amounts owed to credit institutions Short-term amounts owed to credit institutions 689 - - - - - - 689 BOD REPORT Debt evidenced by certificates 7,245 11,828 2,459 3,885 402 7,744 -1,968 31,595 FINANCIALS Other Liabilities Derivatives - - - - - - 2,540 2,540 Financial statements and notes Other liabilities 26 14 2 10 2 37 - 90 Proposal by the Board of Directors 26 14 2 10 2 37 2,540 2,630 Accrued interest and fees payable 35 86 19 44 8 74 0 265 Auditor’s report Total liabilities 7,994 11,928 2,479 3,939 411 7,855 572 35,179 Report of the Control Committee Equity 3,955 - - - - - 6 3,962 Chairmanship Total liabilities and equity 11,949 11,928 2,479 3,939 411 7,855 578 39,140 Report of the Control Committee Net of assets and liabilities as of 31 Dec 2022 137 0 1 1 1 1 -1 139 Ratio definitions SUSTAINABILITY INDICES
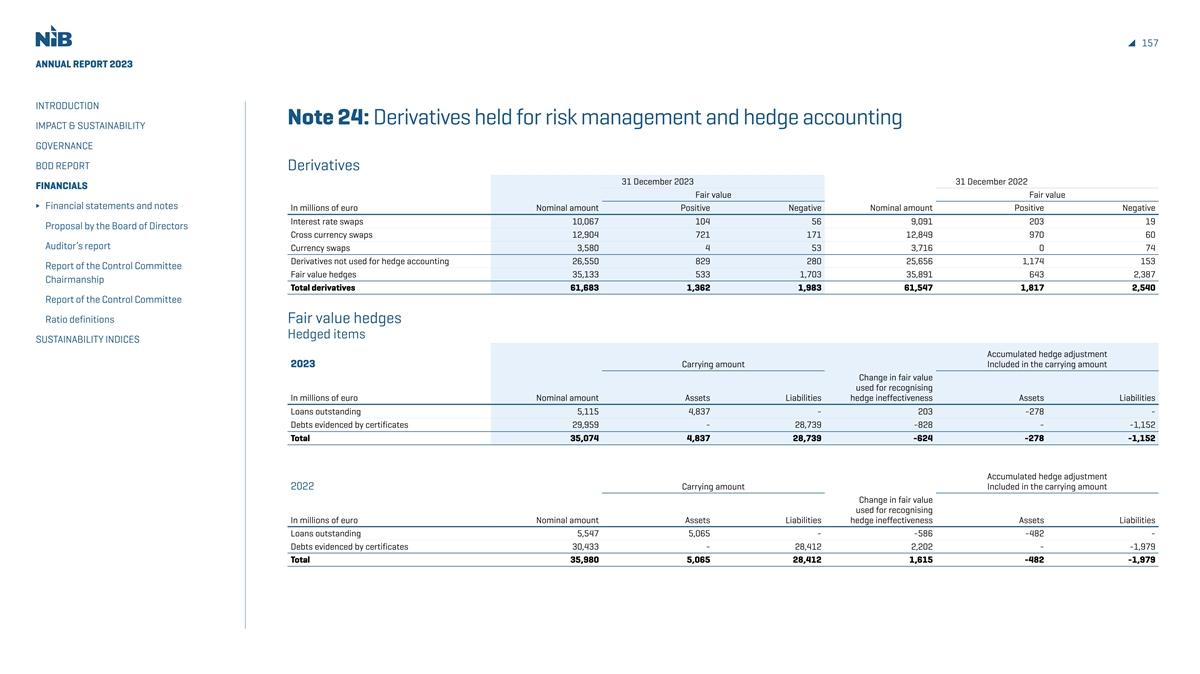
157 ANNUAL REPORT 2023 INTRODUCTION Note 24: Derivatives held for risk management and hedge accounting IMPACT & SUSTAINABILITY GOVERNANCE BOD REPORT Derivatives 31 December 2023 31 December 2022 FINANCIALS Fair value Fair value Financial statements and notes In millions of euro Nominal amount Positive Negative Nominal amount Positive Negative Interest rate swaps 10,067 104 56 9,091 203 19 Proposal by the Board of Directors Cross currency swaps 12,904 721 171 12,849 970 60 Auditor’s report Currency swaps 3,580 4 53 3,716 0 74 Derivatives not used for hedge accounting 26,550 829 280 25,656 1,174 153 Report of the Control Committee Fair value hedges 35,133 533 1,703 35,891 643 2,387 Chairmanship Total derivatives 61,683 1,362 1,983 61,547 1,817 2,540 Report of the Control Committee Ratio definitions Fair value hedges Hedged items SUSTAINABILITY INDICES Accumulated hedge adjustment 2023 Carrying amount Included in the carrying amount Change in fair value used for recognising In millions of euro Nominal amount Assets Liabilities hedge ineffectiveness Assets Liabilities Loans outstanding 5,115 4,837 - 203 -278 - Debts evidenced by certificates 29,959 - 28,739 -828 - -1,152 Total 35,074 4,837 28,739 -624 -278 -1,152 Accumulated hedge adjustment 2022 Carrying amount Included in the carrying amount Change in fair value used for recognising In millions of euro Nominal amount Assets Liabilities hedge ineffectiveness Assets Liabilities Loans outstanding 5,547 5,065 - -586 -482 - Debts evidenced by certificates 30,433 - 28,412 2,202 - -1,979 Total 35,980 5,065 28,412 1,615 -482 -1,979
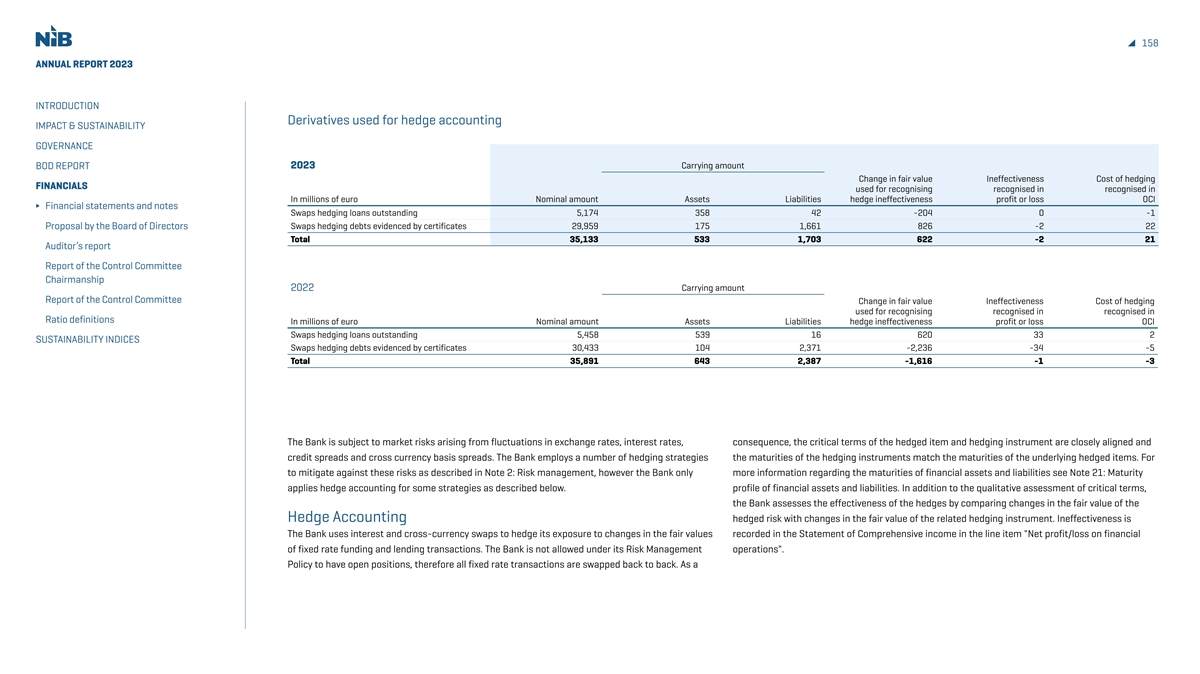
158 ANNUAL REPORT 2023 INTRODUCTION Derivatives used for hedge accounting IMPACT & SUSTAINABILITY GOVERNANCE BOD REPORT 2023 Carrying amount Change in fair value Ineffectiveness Cost of hedging FINANCIALS used for recognising recognised in recognised in In millions of euro Nominal amount Assets Liabilities hedge ineffectiveness profit or loss OCI Financial statements and notes Swaps hedging loans outstanding 5,174 358 42 -204 0 -1 Proposal by the Board of Directors Swaps hedging debts evidenced by certificates 29,959 175 1,661 826 -2 22 Total 35,133 533 1,703 622 -2 21 Auditor’s report Report of the Control Committee Chairmanship 2022 Carrying amount Report of the Control Committee Change in fair value Ineffectiveness Cost of hedging used for recognising recognised in recognised in Ratio definitions In millions of euro Nominal amount Assets Liabilities hedge ineffectiveness profit or loss OCI Swaps hedging loans outstanding 5,458 539 16 620 33 2 SUSTAINABILITY INDICES Swaps hedging debts evidenced by certificates 30,433 104 2,371 -2,236 -34 -5 Total 35,891 643 2,387 -1,616 -1 -3 The Bank is subject to market risks arising from fluctuations in exchange rates, interest rates, consequence, the critical terms of the hedged item and hedging instrument are closely aligned and credit spreads and cross currency basis spreads. The Bank employs a number of hedging strategies the maturities of the hedging instruments match the maturities of the underlying hedged items. For to mitigate against these risks as described in Note 2: Risk management, however the Bank only more information regarding the maturities of financial assets and liabilities see Note 21: Maturity applies hedge accounting for some strategies as described below. profile of financial assets and liabilities. In addition to the qualitative assessment of critical terms, the Bank assesses the effectiveness of the hedges by comparing changes in the fair value of the Hedge Accounting hedged risk with changes in the fair value of the related hedging instrument. Ineffectiveness is The Bank uses interest and cross-currency swaps to hedge its exposure to changes in the fair values recorded in the Statement of Comprehensive income in the line item Net profit/loss on financial of fixed rate funding and lending transactions. The Bank is not allowed under its Risk Management operations . Policy to have open positions, therefore all fixed rate transactions are swapped back to back. As a
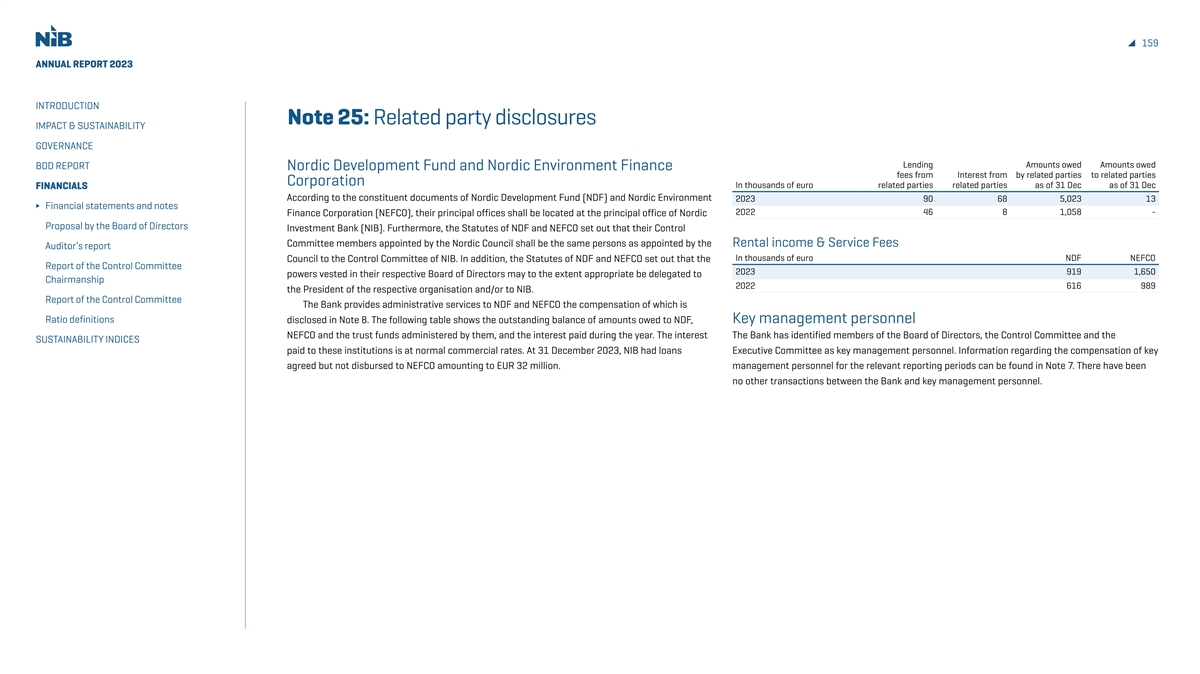
159 ANNUAL REPORT 2023 INTRODUCTION Note 25: Related party disclosures IMPACT & SUSTAINABILITY GOVERNANCE Lending Amounts owed Amounts owed BOD REPORT Nordic Development Fund and Nordic Environment Finance fees from Interest from by related parties to related parties Corporation In thousands of euro related parties related parties as of 31 Dec as of 31 Dec FINANCIALS According to the constituent documents of Nordic Development Fund (NDF) and Nordic Environment 2023 90 68 5,023 13 Financial statements and notes 2022 46 8 1,058 - Finance Corporation (NEFCO), their principal offices shall be located at the principal office of Nordic Proposal by the Board of Directors Investment Bank (NIB). Furthermore, the Statutes of NDF and NEFCO set out that their Control Committee members appointed by the Nordic Council shall be the same persons as appointed by the Rental income & Service Fees Auditor’s report In thousands of euro NDF NEFCO Council to the Control Committee of NIB. In addition, the Statutes of NDF and NEFCO set out that the Report of the Control Committee 2023 919 1,650 powers vested in their respective Board of Directors may to the extent appropriate be delegated to Chairmanship 2022 616 989 the President of the respective organisation and/or to NIB. Report of the Control Committee The Bank provides administrative services to NDF and NEFCO the compensation of which is Ratio definitions disclosed in Note 8. The following table shows the outstanding balance of amounts owed to NDF, Key management personnel NEFCO and the trust funds administered by them, and the interest paid during the year. The interest The Bank has identified members of the Board of Directors, the Control Committee and the SUSTAINABILITY INDICES paid to these institutions is at normal commercial rates. At 31 December 2023, NIB had loans Executive Committee as key management personnel. Information regarding the compensation of key agreed but not disbursed to NEFCO amounting to EUR 32 million. management personnel for the relevant reporting periods can be found in Note 7. There have been no other transactions between the Bank and key management personnel.
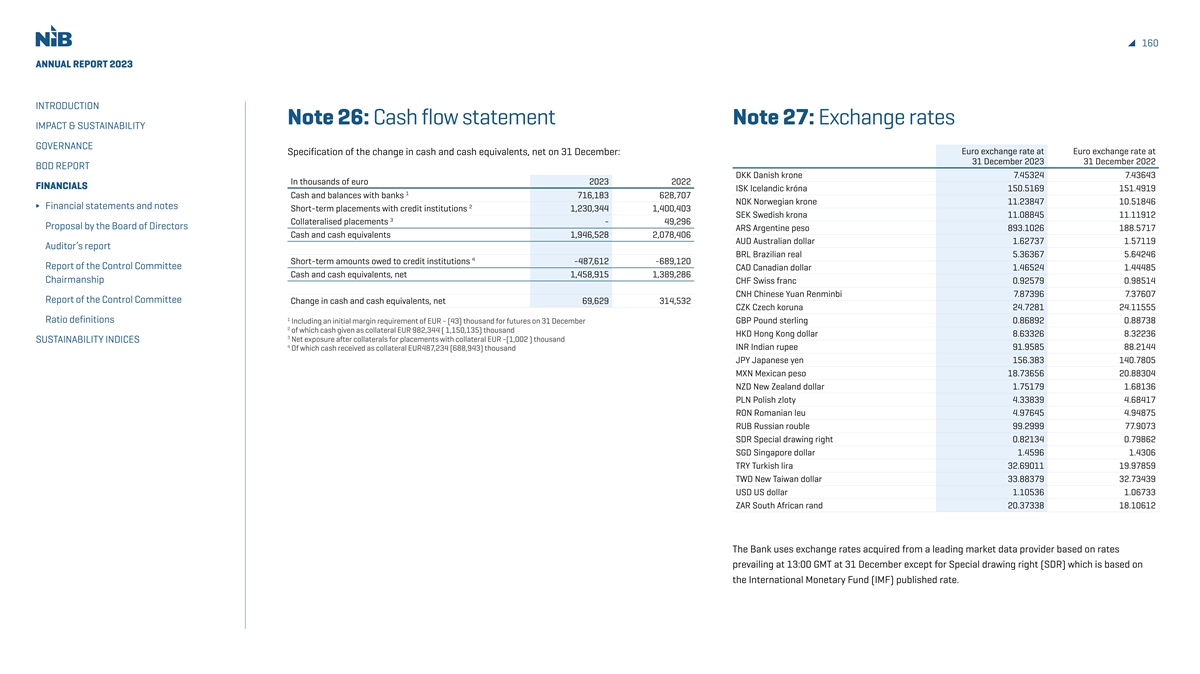
160 ANNUAL REPORT 2023 INTRODUCTION Note 26: Cash flow statement Note 27: Exchange rates IMPACT & SUSTAINABILITY GOVERNANCE Euro exchange rate at Euro exchange rate at Specification of the change in cash and cash equivalents, net on 31 December: 31 December 2023 31 December 2022 BOD REPORT DKK Danish krone 7.45324 7.43643 In thousands of euro 2023 2022 FINANCIALS ISK Icelandic króna 150.5169 151.4919 1 Cash and balances with banks 716,183 628,707 NOK Norwegian krone 11.23847 10.51846 2 Financial statements and notes Short-term placements with credit institutions 1,230,344 1,400,403 SEK Swedish krona 11.08845 11.11912 3 Collateralised placements - 49,296 Proposal by the Board of Directors ARS Argentine peso 893.1026 188.5717 Cash and cash equivalents 1,946,528 2,078,406 AUD Australian dollar 1.62737 1.57119 Auditor’s report BRL Brazilian real 5.36367 5.64246 4 Short-term amounts owed to credit institutions -487,612 -689,120 Report of the Control Committee CAD Canadian dollar 1.46524 1.44485 Cash and cash equivalents, net 1,458,915 1,389,286 Chairmanship CHF Swiss franc 0.92579 0.98514 CNH Chinese Yuan Renminbi 7.87396 7.37607 Report of the Control Committee Change in cash and cash equivalents, net 69,629 314,532 CZK Czech koruna 24.7281 24.11555 1 Ratio definitions Including an initial margin requirement of EUR - (43) thousand for futures on 31 December GBP Pound sterling 0.86892 0.88738 2 of which cash given as collateral EUR 982,344 ( 1,150,135) thousand HKD Hong Kong dollar 8.63326 8.32236 3 Net exposure after collaterals for placements with collateral EUR -(1,002 ) thousand SUSTAINABILITY INDICES 4 INR Indian rupee 91.9585 88.2144 Of which cash received as collateral EUR487,234 (688,943) thousand JPY Japanese yen 156.383 140.7805 MXN Mexican peso 18.73656 20.88304 NZD New Zealand dollar 1.75179 1.68136 PLN Polish zloty 4.33839 4.68417 RON Romanian leu 4.97645 4.94875 RUB Russian rouble 99.2999 77.9073 SDR Special drawing right 0.82134 0.79862 SGD Singapore dollar 1.4596 1.4306 TRY Turkish lira 32.69011 19.97859 TWD New Taiwan dollar 33.88379 32.73439 USD US dollar 1.10536 1.06733 ZAR South African rand 20.37338 18.10612 The Bank uses exchange rates acquired from a leading market data provider based on rates prevailing at 13:00 GMT at 31 December except for Special drawing right (SDR) which is based on the International Monetary Fund (IMF) published rate.
161 ANNUAL REPORT 2023 INTRODUCTION Note 28: Post balance sheet events IMPACT & SUSTAINABILITY GOVERNANCE There have been no material post balance sheet events that would require disclosure or adjustment BOD REPORT to these financial statements. FINANCIALS Financial statements and notes Proposal by the Board of Directors Auditor’s report Report of the Control Committee Chairmanship Report of the Control Committee Ratio definitions SUSTAINABILITY INDICES
162 ANNUAL REPORT 2023 INTRODUCTION Proposal by the Board of Directors to the IMPACT & SUSTAINABILITY GOVERNANCE Board of Governors BOD REPORT FINANCIALS Financial statements and notes In accordance with Section 10 and 11 of the Statutes of the Bank, we propose that the 2023 net profit of EUR 250,659,206.69 be allocated as follows: Proposal by the Board of Directors - EUR 187,659,206.69 will be transferred to the General Credit Risk Fund as a part of equity; and Auditor’s report - EUR 63,000,000.00 will be made available for distribution as dividends to the bank’s member countries. Report of the Control Committee Chairmanship In addition, we recommend to the Board of Governors that the audited financial statements for 2023 be approved. Report of the Control Committee Ratio definitions The Board of Directors’ proposal with regard to the allocation of the Bank's profit takes into account the need to maintain the Bank’s ratio of equity to total risk-weighted assets at a secure level, which is a prerequisite for maintaining the Bank’s high creditworthiness. It maintains the banks status as a dividend-paying entity and provides a return on the capital to the shareholders. SUSTAINABILITY INDICES Helsinki, 26 February 2024 Ole Hovland (Chair of the Board) Merle Wilkinson (Deputy Chair) Julie Sonne Pekka Morén Esther Finnbogadóttir Līga Kļaviņa Jurgita Uzielienė Max Elger
163 ANNUAL REPORT 2023 INTRODUCTION Auditor’s Report IMPACT & SUSTAINABILITY GOVERNANCE To the Control Committee of Nordic Investment Bank BOD REPORT FINANCIALS Report on the Audit of the Financial Statements Financial statements and notes Proposal by the Board of Directors Auditor’s report Opinion Key Audit Matters Report of the Control Committee We have audited the financial statements of Nordic Investment Bank (the Bank) which comprise Key audit matters are those matters that, in our professional judgment, were of most significance Chairmanship the statement of financial position as at 31 December 2023, and the statement of comprehensive in our audit of the financial statements of the current period. These matters were addressed in the Report of the Control Committee income, statement of changes in equity and statement of cash flows for the year then ended, and context of our audit of the financial statements as a whole, and in forming our opinion thereon, and Ratio definitions notes to the financial statements, including material accounting policy information. The financial we do not provide a separate opinion on these matters. For each matter below, our description of statements of the Bank are included on pages 93-162 in this document. how our audit addressed the matter is provided in that context. SUSTAINABILITY INDICES In our opinion the financial statements present fairly, in all material respects, the Nordic We have fulfilled the responsibilities described in the Auditor’s Responsibilities for the Audit of Investment Bank’s financial position as at 31 December 2023 and its financial performance and its the Financial Statements section of our report, including in relation to these matters. Accordingly, cash flows for the year then ended in accordance with IFRS Accounting Standards as issued by the our audit included the performance of procedures designed to respond to our assessment of the International Accounting Standards Board. risks of material misstatement of the financial statements. The results of our audit procedures, including the procedures performed to address the matters below, provide the basis for our audit Basis for Opinion opinion on the accompanying financial statements. We conducted our audit in accordance with International Standards on Auditing (ISAs). Our responsibilities under those standards are further described in the Auditor’s Responsibilities for the Audit of Financial Statements section of our report. We are independent of the Bank in accordance with the International Ethics Standards Board of Accountants’ Code of Ethics for Professional Accountants (IESBA Code) together with the ethical requirements that are relevant to our audit of the financial statements, and we have fulfilled our other ethical responsibilities in accordance with these requirements and the IESBA Code. We believe that the audit evidence we have obtained is sufficient and appropriate to provide a basis for our opinion.

164 ANNUAL REPORT 2023 INTRODUCTION Fair value measurement of financial instruments Description How our audit addressed this key audit matter IMPACT & SUSTAINABILITY GOVERNANCE We refer to the Bank's accounting policies in Note 1 “Determination of fair value” and, Our audit procedures over financial instruments included, among others: BOD REPORT “Significant accounting judgements and estimates” and the notes 11, 15, 17 and 20 ∆ gaining on understanding of the processes and controls put in place As a result of the Bank’s business model, a significant portion of the Bank’s balance by the Bank to identify, measure and recognize financial instruments FINANCIALS sheet comprise of financial instruments valued at fair value, these financial instruments ∆ testing the general IT controls, including the handling of authorisation and user Financial statements and notes consist of bonds and derivatives. access regarding the most significant systems used for valuing financial Proposal by the Board of Directors The Bank has financial instruments where no market price is available, and in instruments at year end these cases, fair value is determined using valuation models based on market data. ∆ testing the valuation of financial instruments at fair value by comparing the values Auditor’s report These financial instruments are categorised as level 2 in the IFRS fair value valuation recorded to independently obtained market prices on input data on a sample basis Report of the Control Committee hierarchy. The Bank also has financial instruments for which the fair value measurement ∆ including valuation specialists in our audit team to carry out independent Chairmanship has been determined using valuation models where the value is affected by input data valuations on a sample basis for various types of financial instruments Report of the Control Committee that cannot be verified by external market data. These financial instruments are across the entire fair value hierarchy of financial assets and liabilities categorised as level 3 in the IFRS fair value valuation hierarchy. ∆ examining the assumptions, methodologies and models used by the Bank Ratio definitions The Bank has financial assets and financial liabilities categorised as level 2 totalling to estimate value of complex derivative financial instruments using internal SUSTAINABILITY INDICES EUR 27 267 million and EUR 33 126 million respectively. Financial assets and liabilities models and/or unobservable data. categorised as level 3 totalling EUR 31 million and EUR 448 million respectively. ∆ compared the assumptions made with appropriate benchmarks and price The measurement of financial instruments includes assessments made by the Bank, sources and examined any significant deviations since valuation models are used. The valuation of these financial instruments is therefore ∆ assessing the Bank’s disclosures with presentation requirements in applicable deemed to be a key audit matter. accounting standards.
165 ANNUAL REPORT 2023 INTRODUCTION Hedge accounting Description How our audit addressed this key audit matter IMPACT & SUSTAINABILITY GOVERNANCE We refer to the Bank’s accounting policies in Note 1 “Derivative instruments and hedge Our audit procedures over hedge accounting included, among others: BOD REPORT accounting” and the notes 2, 20 and 24 ∆ gaining on understanding of the processes and controls put in place by The Bank enters into derivative financial instruments to manage its exposure to interest the Bank to identify, measure and recognize hedge accounting relationships FINANCIALS rate and foreign currency risk. Interest rate related derivatives are identified as hedging ∆ inspecting, on a sample basis, the Bank’s hedge documentation and contracts Financial statements and notes instruments in fair value hedge accounting relationships. Since hedge accounting is applied, ∆ including specialists in our audit team to carry out independent valuations Proposal by the Board of Directors such gains and losses arising from fair value changes on the derivatives are recognized in on a sample basis for fair value hedges profit and loss. The change in fair value of hedged borrowing and lending transactions ∆ assessing the Bank’ disclosures with presentation requirements in applicable Auditor’s report due to the hedged risk is recognized in profit and loss. At December 31, 2023 the Bank has accounting standards. Report of the Control Committee EUR 4 837 million of loans identified as hedged instruments, and EUR 28 739 million of Chairmanship borrowing. The hedging derivatives have fair values of net EUR 316 million for assets of Report of the Control Committee which EUR -1 million is recognized in OCI for the year and net EUR - 1 486 million for liabilities of which EUR 22 million is recognized in OCI for the year. Ratio definitions The application of hedge accounting is deemed to be a key audit matter as the large SUSTAINABILITY INDICES number of contracts necessitates a system to record and track each contract and consideration of hedge effectiveness can involve a significant degree of both complexity and management judgement and are subject to an inherent risk of error.
166 ANNUAL REPORT 2023 INTRODUCTION Granting of loans and provisioning for loan losses Description How our audit addressed this key audit matter IMPACT & SUSTAINABILITY GOVERNANCE We refer to the Bank’s accounting policies in Note 1 “Impairment of loans” and “Significant Our audit procedures on granting of loans and provisioning for loan losses included among BOD REPORT accounting judgements and estimates” and the notes 9, 10 and 12 others: Loans outstanding represent EUR 21 456 million (54 %) of total assets of the Bank which ∆ gaining on understanding of the processes and controls put in place by the Bank FINANCIALS is net of impairment of loans of EUR 66 million. The credit reserve for loan commitments is to grant new loans and to identify, measure and recognize impairment of loans Financial statements and notes EUR 5 million. ∆ testing the design and efficiency of key controls in both the credit process Proposal by the Board of Directors The impairment requirements are based on an expected credit loss (ECL) model. The and credit decisions, credit review rating classification as well as identifying and Bank is required to recognise an allowance for either 12-month or lifetime ECLs, depending determining credits for which provisions should be made Auditor’s report on whether there has been a significant increase in credit risk since initial recognition. ∆ testing the general IT controls, including the handling of authorisation and user Report of the Control Committee The calculation of expected credit loss is a complex process which included calculations access regarding these systems Chairmanship reflecting a probability-weighted outcome, the time value of money and the best available ∆ evaluating the key input variables and assumptions in the ECL model including Report of the Control Committee forward-looking information. Further, the model incorporates forward-looking information management judgment and estimates and where relevant, compared data and through the inclusion of macroeconomic factors and can include management judgement assumptions to external benchmark Ratio definitions and estimates. ∆ testing the mathematical accuracy of the model SUSTAINABILITY INDICES Since the outstanding loans are material and the credit risk represents the largest risk for ∆ inspecting the key governance meetings including Credit Committee and Board the Bank and the related impairment are subject to judgement and estimates, we have to ensure that there are governance controls in place and assessed the granting of loans and provisioning of loan losses as a key audit matter. ∆ assessing the Bank’ disclosures with presentation requirements in applicable accounting standards. Other Information than the Annual Accounts The Board of Directors and the President are responsible for the other information. The other In connection with our audit of the financial statements, our responsibility is to read the other information comprises information included in the report on pages 1-92 and 169-195, but information identified above and, in doing so, consider whether the other information is materially does not include the financial statements and our auditor’s report thereon. We have obtained inconsistent with the financial statements or our knowledge obtained in the audit, or otherwise this other information prior to the date of this auditor’s report. appears to be materially misstated. Our opinion on the financial statements does not cover the other information and we If, based on the work we have performed on the other information that we obtained prior to the do not express any form of assurance conclusion regarding this other information. date of this auditor’s report, we conclude that there is a material misstatement of this other information, we are required to report that fact. We have nothing to report in this regard.
167 ANNUAL REPORT 2023 . INTRODUCTION Responsibilities of the Board of Directors and the President for ∆ Obtain an understanding of internal control relevant to the audit in order to design audit the Financial Statements procedures that are appropriate in the circumstances, but not for the purpose of expressing an IMPACT & SUSTAINABILITY The Board of Directors and the President are responsible for the preparation and fair presentation opinion on the effectiveness of the Bank’s internal control. GOVERNANCE of the financial statements in accordance with IFRS Accounting Standards, and for such internal ∆ Evaluate the appropriateness of accounting policies used and the reasonableness of accounting BOD REPORT control as they determine is necessary to enable the preparation of financial statements that are estimates and related disclosures made by management. free from material misstatement, whether due to fraud or error. ∆ Conclude on the appropriateness of the Board of Directors’ and the President’s use of the going FINANCIALS In preparing the financial statements, the Board of Directors and the President are responsible for concern basis of accounting and based on the audit evidence obtained, whether a material Financial statements and notes assessing the Bank’s ability to continue as going concern, disclosing, as applicable, matters relating to uncertainty exists related to events or conditions that may cast significant doubt on the Bank’s Proposal by the Board of Directors going concern and using the going concern basis of accounting unless management either intends ability to continue as a going concern. If we conclude that a material uncertainty exists, we to liquidate the Bank or to cease operations, or has no realistic alternative but to do so. are required to draw attention in our auditor’s report to the related disclosures in the financial Auditor’s report Those charged with governance are responsible for overseeing the Bank’s financial statements or, if such disclosures are inadequate, to modify our opinion. Our conclusions are Report of the Control Committee reporting process. based on the audit evidence obtained up to the date of our auditor’s report. However, future Chairmanship events or conditions may cause the Bank to cease to continue as a going concern. Report of the Control Committee Auditor’s Responsibilities for the Audit of the Financial ∆ Evaluate the overall presentation, structure and content of the financial statements, including Ratio definitions Statements the disclosures, and whether the financial statements represent the underlying transactions and Our objectives are to obtain reasonable assurance about whether the financial statements as events so in a manner that achieves fair presentation. SUSTAINABILITY INDICES a whole are free from material misstatement, whether due to fraud or error, and to issue an auditor’s report that includes our opinion. Reasonable assurance is a high level of assurance, but We communicate with those charged with governance regarding, among other matters, the planned is not a guarantee that an audit conducted in accordance with ISAs will always detect a material scope and timing of the audit and significant audit findings, including any significant deficiencies in misstatement when it exists. Misstatements can arise from fraud or error and are considered internal control that we identify during our audit. material if, individually or in aggregate, they could reasonably be expected to influence the economic We also provide those charged with governance with a statement that we have complied decisions of users taken on the basis of the financial statements. with relevant ethical requirements regarding independence, and to communicate with them all As part of an audit in accordance with ISAs, we exercise professional judgment and maintain relationships and other matters that may reasonably be thought to bear on our independence, professional skepticism throughout the audit. We also: and where applicable, related safeguards. ∆ Identify and assess the risks of material misstatement of the financial statements, whether From the matters communicated with those charged with governance, we determine those due to fraud or error, design and perform audit procedures responsive to those risks, and obtain matters that were of most significance in the audit of the financial statements of the current audit evidence that is sufficient and appropriate to provide a basis for our opinion. The risk of period and are therefore the key audit matters. We describe these matters in our auditor’s report not detecting a material misstatement resulting from fraud is higher than for one resulting from unless law or regulation precludes public disclosure about the matter or when, in extremely rare error, as fraud may involve collusion, forgery, intentional omissions, misrepresentations, or the circumstances, we determine that a matter should not be communicated in our report because override of internal control. the adverse consequences of doing so would reasonably be expected to outweigh the public interest benefits of such communication.
168 ANNUAL REPORT 2023 INTRODUCTION Report on other requirements IMPACT & SUSTAINABILITY GOVERNANCE BOD REPORT Opinion Reasonable assurance is a high level of assurance but is not a guarantee that an audit FINANCIALS In addition to our audit of the financial statements, we have also audited the administration of the conducted in accordance with International Standards on Auditing will always detect actions or Financial statements and notes Board of Directors and the President of Nordic Investment Bank for the year 2023 in accordance omissions that can give rise to liability to the Bank. Proposal by the Board of Directors with the Terms of the Engagement. In our opinion the administration of the Board of Directors and As part of an audit in accordance with International Standards on Auditing, we exercise the President, in all material aspects, complied with the Statutes of the Bank. professional judgment and maintain professional skepticism throughout the audit. The examination Auditor’s report of the administration is based primarily on the audit of the accounts. Additional audit procedures Report of the Control Committee Basis for Opinion performed are based on our professional judgment with starting point in risk and materiality. This Chairmanship We conducted the audit in accordance with generally accepted auditing standards. Our means that we focus the examination on such actions, areas and relationships that are material for Report of the Control Committee responsibilities under those standards are further described in the Auditor’s Responsibilities section. the operations and where deviations and violations would have particular importance for the Bank’s Ratio definitions We are independent of the Bank in accordance with professional ethics for accountants and have situation. We examine and test decisions undertaken, support for decisions, actions taken and other otherwise fulfilled our ethical responsibilities in accordance with these requirements. circumstances that are relevant to our opinion. SUSTAINABILITY INDICES We believe that the audit evidence we have obtained is sufficient and appropriate to provide a basis for our opinions. Auditor’s Appointment Ernst & Young Oy and Ernst & Young AB have been appointed auditors by the Control Committee Responsibilities of the Board of Directors and the President since the financial year 2018. The undersigned auditors have acted as responsible auditors since All the powers of the Bank are vested in the Board of Directors except as what is vested in the Board financial year 2018. of Governors provided for in Section 13 of the Statutes. The Board of Directors may delegate these powers to the President to the extent considered appropriate. Helsinki, 27 February 2024 The President is responsible for the conduct of the current operations of the bank and shall follow the guidelines and instructions given by the Board of Directors. Ernst & Young Oy Ernst & Young AB Authorized Public Authorized Public Auditor’s Responsibilities Accountant Firm Accountant Firm Our objective concerning the audit of whether the Board of Director’s and the President’s administration have complied with the Statutes of the bank, is to obtain audit evidence to assess Terhi Mäkinen Mona Alfredsson with a reasonable degree of assurance whether any member of the Board of Directors or the Authorized Public Authorized Public President in any material respect has acted in contravention of the Statutes. Accountant Accountant
169 ANNUAL REPORT 2023 INTRODUCTION Report of the Control Committee Chairmanship IMPACT & SUSTAINABILITY GOVERNANCE BOD REPORT To the Board of Governors of the Nordic Investment Bank FINANCIALS This report from the Chairmanship has been presented to the Control Committee at its meeting on Financial statements and notes February 27, 2024. Proposal by the Board of Directors The Control Committee and its Chairmanship Chairmanship mandate fulfilment Auditor’s report The Control Committee is comprised of ten members, of which eight have been appointed by Report of the Control Committee the Nordic Council and the Parliaments of Estonia, Latvia, and Lithuania. The remaining two The Chairmanship met on six occasions in 2023 in fulfilling its obligations. Chairmanship members have been appointed as Chair and Deputy Chair by the Board of Governors to act as the Report of the Control Committee Chairmanship, which administers the responsibilities and tasks of the Committee. 1. Administering the responsibilities and tasks of the Control Committee Ratio definitions The composition of the Chairmanship was unchanged in 2023, with Mr Toomas Vapper as Chair We, the Chairmanship, reported our activities, findings and recommendations twice during the year, and Mr Pentti Hakkarainen as Deputy Chair. The Chairmanship extended the engagement of the including the status of the external audit to the Control Committee. The Control Committee has SUSTAINABILITY INDICES external independent expert Mr Claes Norgren, with in-depth knowledge of the banking industry, to also received the Independent Auditor’s Report on the 2023 financial statements, submitted on 27 assist the Chairmanship. February 2024 by the authorised public accountants. The Bank’s management has provided us with information, documents, and administrative support to fulfil the mandate of Chairmanship. The mandate of the Control Committee and its Chairmanship In accordance with Section 16 of the Statutes of the Nordic Investment Bank, the Control Committee 2. Overseeing the performance of the audit of the Bank’s (“Committee”), including the Chairmanship, was established to monitor that the operations of financial statements and of the internal control functions the Bank are conducted in accordance with its Statutes. The Control Committee is responsible for We meet with the external auditors on a regular basis to agree on the audit plan and reporting the appointing the external auditors to carry out the audit of the Bank’s financial statements. results of their work. In addition to the audit of the annual financial statements, the external auditors In accordance with the Section 16 of the Statutes of the Nordic Investment Bank, the also review the half-year interim financial statements. They perform additional reviews and audit Chairmanship focuses on overseeing the performance of the audit of the Bank’s financial assignments whenever required on certain areas. In accordance with the Rules of Procedure, a new statements, carried out by the external auditors, and the monitoring of the Bank’s financial position, external auditing firm was selected beginning from the 2025 financial year. risk levels, and capital and liquidity positions. Besides the audit of the Bank’s financial statements, the Chairmanship is also overseeing the The Rules of Procedures for the Control Committee were updated in September 2023 as part of performance of the internal audit. The Head of Internal Audit presents the Bank’s internal audit plan the regular review cycle. and results thereof on a regular basis to the Chairmanship. In addition to these recurring items,
170 ANNUAL REPORT 2023 INTRODUCTION the Chief Compliance Officer, the Head of Operational Risk & Security Control, as well as the Head Considering the prevailing geopolitical and economic situation, the related risks to the Bank’s of Credit report their activities to us at least annually. Further the Chief Risk Officer (CRO) provides asset quality and operations were discussed – including the inflation outlook, prevalence of higher IMPACT & SUSTAINABILITY regular risk updates. The Chairmanship meets with both external and internal auditors without interest rates, disruptions in energy markets and the potential impact on the Bank’s counterparties GOVERNANCE senior management presence during the year. and financial performance. In this connection the Treasury operations were discussed in several BOD REPORT meetings. It was communicated that non-financial risks continued to be a priority with several 3. Monitoring the Bank’s financial position, targeted activities to improve resilience within the Bank. FINANCIALS risk levels, and capital and liquidity positions Further, the Chairmanship discussed the Bank’s governance and control frameworks in its Financial statements and notes meetings and in joint sessions with the Board of Directors, with the aim to improve and ensure that Proposal by the Board of Directors 3.1. General the frameworks are effective and fit-for-purpose considering developments in regulatory and The Chairmanship meetings have several recurring agenda items. In each meeting, the President or supervisory standards. The Chairmanship welcomes the Board of Directors’ intentions to increase its Auditor’s report the Chief Financial Officer (CFO) provides a business update. This is followed by the presentation of collaboration with the Chairmanship, strengthen the Bank’s internal audit function, and develop Report of the Control Committee the financial position, results and developments by the Chief Financial Officer (CFO) and the Risk & further the Bank’s internal control framework to facilitate enhanced monitoring. In the view of the Chairmanship Capital Report by the Chief Risk Officer (CRO). Chairmanship, however, the capacity of the Chairmanship needs to be enhanced to enable it to carry Report of the Control Committee The Chairmanship receives and takes note of multiple reports and updates throughout the year out its obligations set out in the Statutes. Ratio definitions covering business & financial developments, audit, risk management and compliance. The items included during 2023 were: 3.2. Monitoring risk management SUSTAINABILITY INDICES Monitoring of the limits and thresholds set in the Statutes and by the Board of Governors is the ∆ Revised Integrity Due Diligence Policy and related rules for Lending, Treasury and Internal responsibility of the Board of Directors, who have fulfilled this obligation through the establishment Procurement of necessary frameworks, policies and procedures for the Banks’s risk, capital, leverage and liquidity ∆ Revised Codes of Conduct (for Staff, Board of Directors, and Control Committee) management, as well as detailed policies for contingency measures and procedures. The main ∆ Governance effectiveness and revision of the Rules of Procedure for the Control Committee framework document in this regard is the Risk Appetite Statement (RAS), which was adopted ∆ Internal Capital (and Liquidity) Adequacy Assessment Process (ICAAP) in its most recent version by the Board of Directors on 8 June 2023. The RAS outlines the main - Report for FY2022 including stress test outcomes considerations for the Bank’s risk-taking, risk mitigation and risk avoidance. The Bank’s risk appetite - External review of ICAAP practices (by KPMG) is reviewed annually by the Board of Directors with the goal of aligning risk-taking with the statutory ∆ Annual review of the Risk Appetite Statement and Risk Management Policy & limits requirements, strategic business objectives, and capital planning. The qualitative statements in ∆ Updates to Credit Enhancement Guidelines the Bank’s RAS are complemented with a set of key risk indicators and their respective monitoring ∆ Watch list and development in Expected Credit losses (ECL) thresholds, including (amongst others) economic capital consumption, leverage ratios, external ∆ Establishment of an enterprise-wide Risk Taxonomy indicators (e.g. credit rating agencies), and liquidity survival horizon. The purpose of the indicators and ∆ Operational Risk and Security Control report 2023 thresholds is to support the evaluation of whether the Bank operates within its risk appetite. Risk limits ∆ Information security roadmap follow-up are used to allocate the aggregate risk-taking mandate to business lines and portfolios. The main risk ∆ Remote work risk assessment limits are decided by the Board of Directors and established in the Bank’s risk management policies, ∆ Rating reports by Credit Rating Agencies which were updated during 2023 according to the established annual review cycle. ∆ Reports from the model validation function including development of model risk ratings The risk profile assessment is based on the Bank’s Internal Capital Adequacy Assessment ∆ Climate strategy and climate project activities Process (ICAAP), which also includes an assessment of liquidity adequacy. While the Bank is
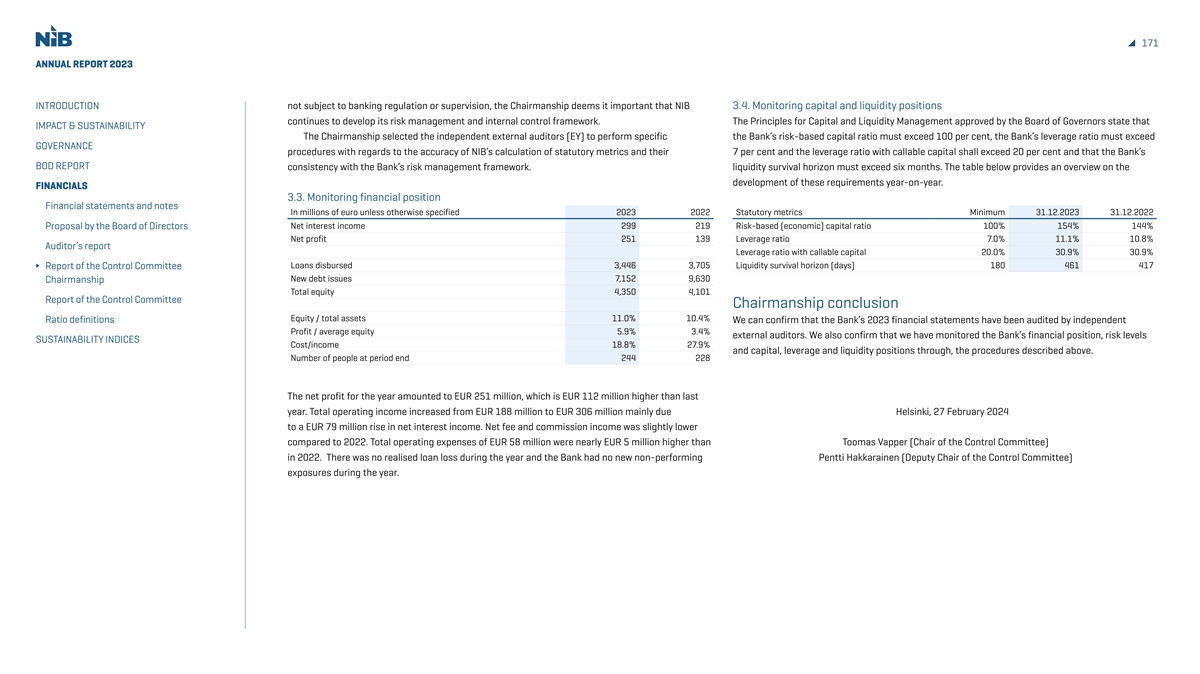
171 ANNUAL REPORT 2023 INTRODUCTION not subject to banking regulation or supervision, the Chairmanship deems it important that NIB 3.4. Monitoring capital and liquidity positions continues to develop its risk management and internal control framework. The Principles for Capital and Liquidity Management approved by the Board of Governors state that IMPACT & SUSTAINABILITY The Chairmanship selected the independent external auditors (EY) to perform specific the Bank’s risk-based capital ratio must exceed 100 per cent, the Bank’s leverage ratio must exceed GOVERNANCE procedures with regards to the accuracy of NIB’s calculation of statutory metrics and their 7 per cent and the leverage ratio with callable capital shall exceed 20 per cent and that the Bank’s BOD REPORT consistency with the Bank’s risk management framework. liquidity survival horizon must exceed six months. The table below provides an overview on the development of these requirements year-on-year. FINANCIALS 3.3. Monitoring financial position Financial statements and notes In millions of euro unless otherwise specified 2023 2022 Statutory metrics Minimum 31.12.2023 31.12.2022 Proposal by the Board of Directors Net interest income 299 219 Risk-based (economic) capital ratio 100% 154% 144% Net profit 251 139 Leverage ratio 7.0% 11.1% 10.8% Auditor’s report Leverage ratio with callable capital 20.0% 30.9% 30.9% Loans disbursed 3,446 3,705 Liquidity survival horizon (days) 180 461 417 Report of the Control Committee New debt issues 7,152 9,630 Chairmanship Total equity 4,350 4,101 Report of the Control Committee Chairmanship conclusion Equity / total assets 11.0% 10.4% Ratio definitions We can confirm that the Bank’s 2023 financial statements have been audited by independent Profit / average equity 5.9% 3.4% external auditors. We also confirm that we have monitored the Bank’s financial position, risk levels SUSTAINABILITY INDICES Cost/income 18.8% 27.9% and capital, leverage and liquidity positions through, the procedures described above. Number of people at period end 244 228 The net profit for the year amounted to EUR 251 million, which is EUR 112 million higher than last year. Total operating income increased from EUR 188 million to EUR 306 million mainly due Helsinki, 27 February 2024 to a EUR 79 million rise in net interest income. Net fee and commission income was slightly lower compared to 2022. Total operating expenses of EUR 58 million were nearly EUR 5 million higher than Toomas Vapper (Chair of the Control Committee) in 2022. There was no realised loan loss during the year and the Bank had no new non-performing Pentti Hakkarainen (Deputy Chair of the Control Committee) exposures during the year.
172 ANNUAL REPORT 2023 INTRODUCTION Report of the Control Committee IMPACT & SUSTAINABILITY GOVERNANCE BOD REPORT To the Board of Governors of the Nordic Investment Bank. FINANCIALS Financial statements and notes In accordance with Section 16 of the Statutes of the Nordic Investment Bank, the Control Committee projects are evaluated and rated against the mandate criteria developed based on the Bank’s Proposal by the Board of Directors (“Committee”) has been established to monitor that the operations of the Bank are conducted in mission. During 2023, mandate-rated projects achieving a “good” or “excellent” mandate rating accordance with its Statutes and to be responsible for appointing the external auditors to carry out accounted for 99.8% of the total amount of loans disbursed, exceeding the target level of 95%. Auditor’s report the audit of the Bank’s financial statements. During 2023, the Committee selected a new external We can confirm that the Bank’s 2023 financial statements have been audited by Report of the Control Committee auditor who will commence their audit from the 2025 financial year onwards. The change in auditor independent external auditors. We also confirm that we have monitored the Bank’s financial Chairmanship is in compliance with NIB's external audit rotation process. position, risk levels and capital, leverage and liquidity positions. Report of the Control Committee The Committee comprises ten members of which eight have been appointed by the Nordic Ratio definitions Council and the Parliaments of Estonia, Latvia and Lithuania. The remaining two members have We recommend to the Board of Governors that: been appointed as Chair and Deputy Chair by the Board of Governors to act as the Chairmanship, ∆ the audited financial statements for 2023 be approved; SUSTAINABILITY INDICES which administers the responsibilities and tasks of the Committee. The Chairmanship oversees the ∆ the allocation of the Bank's profit as proposed by the Board of Directors, be approved. performance of the audit of the Bank’s financial statements, carried out by the external auditors, and monitors the Bank’s financial position, risk levels and capital and liquidity position. Having completed our assignment for the year 2023, the Committee hereby submit the following report. Helsinki, 27 February 2024 The Committee met twice in 2023 and its Chairmanship met on six occasions. The Chairmanship has reported its activities, findings and recommendations including the status of the external audit Toomas Vapper Pentti Hakkarainen (Chair) (Deputy Chair) to us. We have also received the Independent Auditors’ Report on the 2023 financial statements, submitted on 27 February 2024 by the authorised public accountants. The Bank’s management has provided us with information, documents, and administrative support to fulfil the mandate of the Sjúrður Skaale Aivar Kokk Noora Fagerström Control Committee. The Bank’s mission is to finance projects that improve the productivity and benefit the Vilhjálmur Árnason Jānis Reirs Zigmantas Balčytis environment of the Nordic and Baltic countries. During 2023, a total of EUR 2,829 million in new lending was signed and EUR 3,446 million was disbursed. Before approval is given, all eligible May Britt Lagesen Johan Andersson
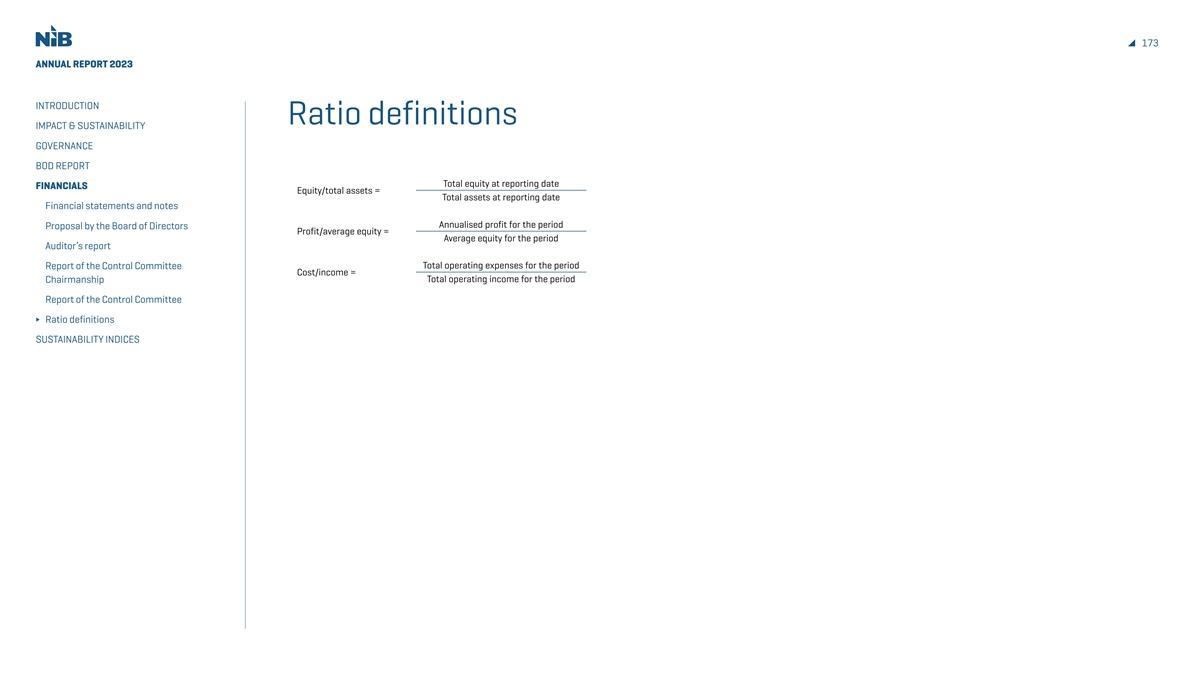
173 ANNUAL REPORT 2023 INTRODUCTION Ratio definitions IMPACT & SUSTAINABILITY GOVERNANCE BOD REPORT Total equity at reporting date FINANCIALS Equity/total assets = Total assets at reporting date Financial statements and notes Annualised profit for the period Proposal by the Board of Directors Profit/average equity = Average equity for the period Auditor’s report Total operating expenses for the period Report of the Control Committee Cost/income = Total operating income for the period Chairmanship Report of the Control Committee Ratio definitions SUSTAINABILITY INDICES
ANNUAL REPORT 2023 INTRODUCTION SUSTAINABILITY INDICES IMPACT & SUSTAINABILITY GOVERNANCE BOD REPORT We track and report FINANCIALS SUSTAINABILITY INDICES our impact GRI content index PRB content index TCFD disclosure index Intrigued b Intrigued by NIB's mandat y NIB's mandate and sustainability agenda, my primar e and sustainability agenda, my primary y driv drive is t e is to support NIB in eff o support NIB in effectiv ectively managing and lev ely managing and leveraging eraging our data. I am delight our data. I am delighted t ed to play a role in ensuring it o play a role in ensuring its reliability s reliability, , security security, and consist , and consistency across all department ency across all departments, contributing t s, contributing to o our journey t our journey to ow ward becoming a fully data-driv ard becoming a fully data-driven organisation. en organisation. Carlos Martínez, Data E Carlos Martínez, Data Engineer ngineer
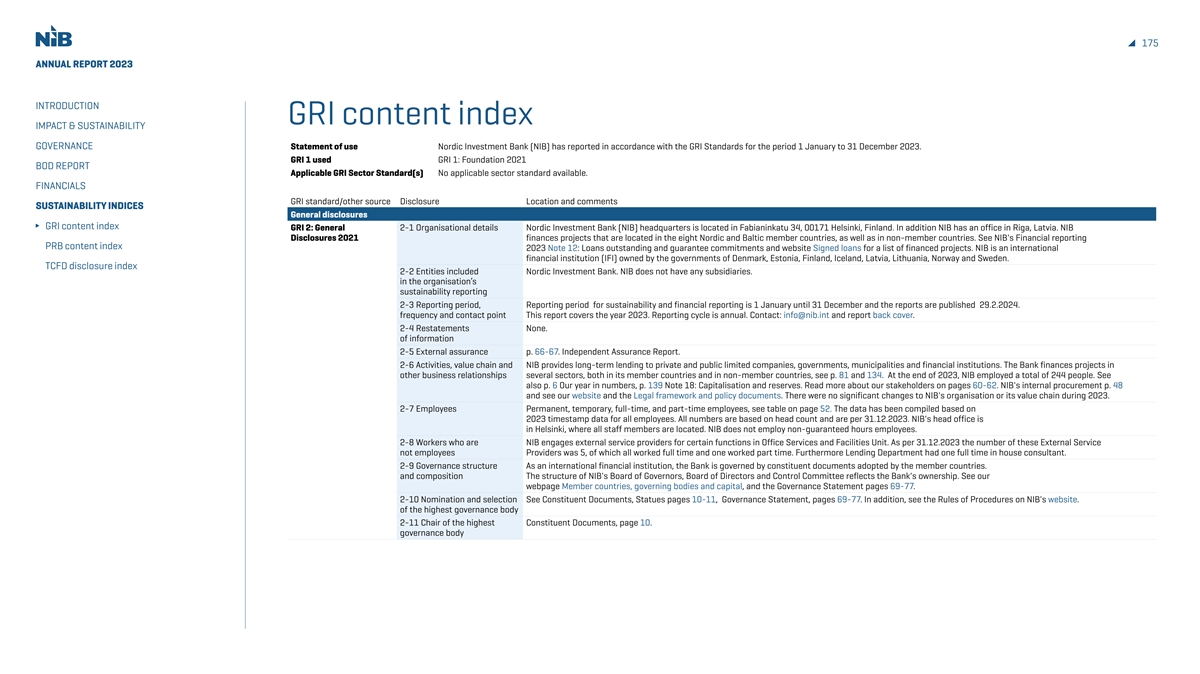
175 ANNUAL REPORT 2023 INTRODUCTION GRI content index IMPACT & SUSTAINABILITY GOVERNANCE Statement of use Nordic Investment Bank (NIB) has reported in accordance with the GRI Standards for the period 1 January to 31 December 2023. GRI 1 used GRI 1: Foundation 2021 BOD REPORT Applicable GRI Sector Standard(s) No applicable sector standard available. FINANCIALS GRI standard/other source Disclosure Location and comments SUSTAINABILITY INDICES General disclosures GRI content index GRI 2: General 2-1 Organisational details Nordic Investment Bank (NIB) headquarters is located in Fabianinkatu 34, 00171 Helsinki, Finland. In addition NIB has an office in Riga, Latvia. NIB Disclosures 2021 finances projects that are located in the eight Nordic and Baltic member countries, as well as in non-member countries. See NIB's Financial reporting PRB content index 2023 Note 12: Loans outstanding and guarantee commitments and website Signed loans for a list of financed projects. NIB is an international financial institution (IFI) owned by the governments of Denmark, Estonia, Finland, Iceland, Latvia, Lithuania, Norway and Sweden. TCFD disclosure index 2-2 Entities included Nordic Investment Bank. NIB does not have any subsidiaries. in the organisation’s sustainability reporting 2-3 Reporting period, Reporting period for sustainability and financial reporting is 1 January until 31 December and the reports are published 29.2.2024. frequency and contact point This report covers the year 2023. Reporting cycle is annual. Contact: info@nib.int and report back cover. 2-4 Restatements None. of information 2-5 External assurance p. 66-67. Independent Assurance Report. 2-6 Activities, value chain and NIB provides long-term lending to private and public limited companies, governments, municipalities and financial institutions. The Bank finances projects in other business relationships several sectors, both in its member countries and in non-member countries, see p. 81 and 134. At the end of 2023, NIB employed a total of 244 people. See also p. 6 Our year in numbers, p. 139 Note 18: Capitalisation and reserves. Read more about our stakeholders on pages 60-62. NIB's internal procurement p. 48 and see our website and the Legal framework and policy documents. There were no significant changes to NIB's organisation or its value chain during 2023. 2-7 Employees Permanent, temporary, full-time, and part-time employees, see table on page 52. The data has been compiled based on 2023 timestamp data for all employees. All numbers are based on head count and are per 31.12.2023. NIB's head office is in Helsinki, where all staff members are located. NIB does not employ non-guaranteed hours employees. 2-8 Workers who are NIB engages external service providers for certain functions in Office Services and Facilities Unit. As per 31.12.2023 the number of these External Service not employees Providers was 5, of which all worked full time and one worked part time. Furthermore Lending Department had one full time in house consultant. 2-9 Governance structure As an international financial institution, the Bank is governed by constituent documents adopted by the member countries. and composition The structure of NIB's Board of Governors, Board of Directors and Control Committee reflects the Bank's ownership. See our webpage Member countries, governing bodies and capital, and the Governance Statement pages 69-77. 2-10 Nomination and selection See Constituent Documents, Statues pages 10-11, Governance Statement, pages 69-77. In addition, see the Rules of Procedures on NIB's website. of the highest governance body 2-11 Chair of the highest Constituent Documents, page 10. governance body
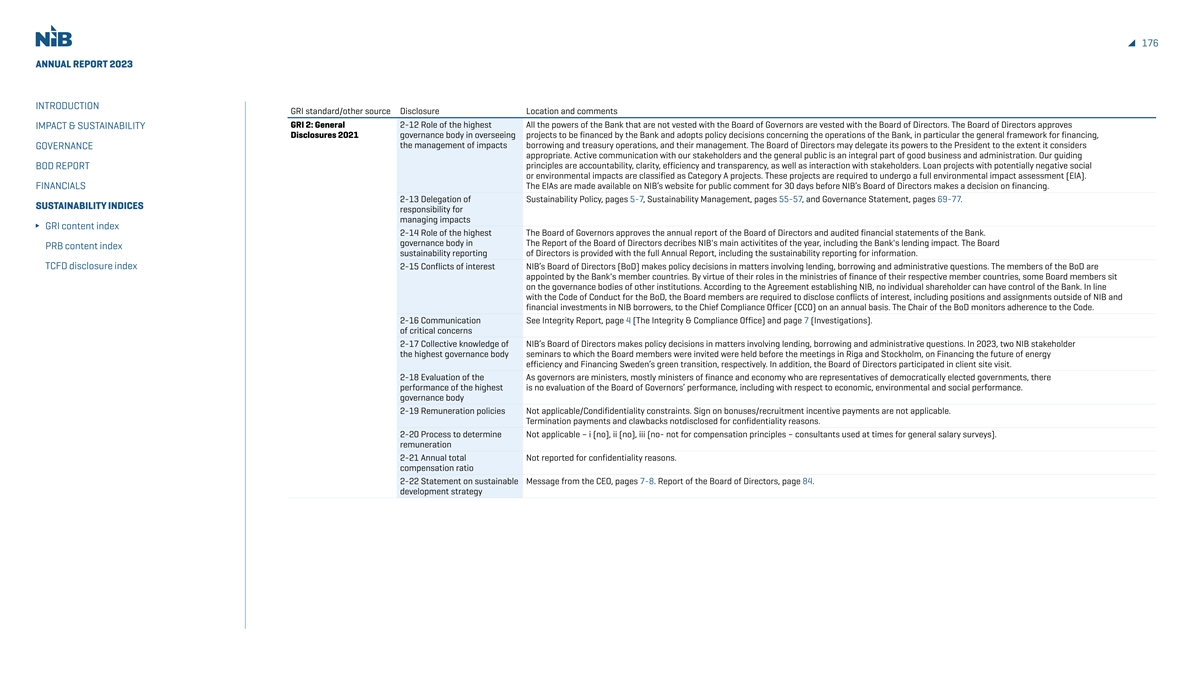
176 ANNUAL REPORT 2023 INTRODUCTION GRI standard/other source Disclosure Location and comments GRI 2: General 2-12 Role of the highest All the powers of the Bank that are not vested with the Board of Governors are vested with the Board of Directors. The Board of Directors approves IMPACT & SUSTAINABILITY Disclosures 2021 governance body in overseeing projects to be financed by the Bank and adopts policy decisions concerning the operations of the Bank, in particular the general framework for financing, the management of impacts borrowing and treasury operations, and their management. The Board of Directors may delegate its powers to the President to the extent it considers GOVERNANCE appropriate. Active communication with our stakeholders and the general public is an integral part of good business and administration. Our guiding BOD REPORT principles are accountability, clarity, efficiency and transparency, as well as interaction with stakeholders. Loan projects with potentially negative social or environmental impacts are classified as Category A projects. These projects are required to undergo a full environmental impact assessment (EIA). FINANCIALS The EIAs are made available on NIB’s website for public comment for 30 days before NIB’s Board of Directors makes a decision on financing. 2-13 Delegation of Sustainability Policy, pages 5-7, Sustainability Management, pages 55-57, and Governance Statement, pages 69-77. SUSTAINABILITY INDICES responsibility for managing impacts GRI content index 2-14 Role of the highest The Board of Governors approves the annual report of the Board of Directors and audited financial statements of the Bank. governance body in The Report of the Board of Directors decribes NIB's main activitites of the year, including the Bank's lending impact. The Board PRB content index sustainability reporting of Directors is provided with the full Annual Report, including the sustainability reporting for information. TCFD disclosure index 2-15 Conflicts of interest NIB’s Board of Directors (BoD) makes policy decisions in matters involving lending, borrowing and administrative questions. The members of the BoD are appointed by the Bank's member countries. By virtue of their roles in the ministries of finance of their respective member countries, some Board members sit on the governance bodies of other institutions. According to the Agreement establishing NIB, no individual shareholder can have control of the Bank. In line with the Code of Conduct for the BoD, the Board members are required to disclose conflicts of interest, including positions and assignments outside of NIB and financial investments in NIB borrowers, to the Chief Compliance Officer (CCO) on an annual basis. The Chair of the BoD monitors adherence to the Code. 2-16 Communication See Integrity Report, page 4 (The Integrity & Compliance Office) and page 7 (Investigations). of critical concerns 2-17 Collective knowledge of NIB’s Board of Directors makes policy decisions in matters involving lending, borrowing and administrative questions. In 2023, two NIB stakeholder the highest governance body seminars to which the Board members were invited were held before the meetings in Riga and Stockholm, on Financing the future of energy efficiency and Financing Sweden’s green transition, respectively. In addition, the Board of Directors participated in client site visit. 2-18 Evaluation of the As governors are ministers, mostly ministers of finance and economy who are representatives of democratically elected governments, there performance of the highest is no evaluation of the Board of Governors’ performance, including with respect to economic, environmental and social performance. governance body 2-19 Remuneration policies Not applicable/Condifidentiality constraints. Sign on bonuses/recruitment incentive payments are not applicable. Termination payments and clawbacks notdisclosed for confidentiality reasons. 2-20 Process to determine Not applicable – i (no), ii (no), iii (no- not for compensation principles – consultants used at times for general salary surveys). remuneration 2-21 Annual total Not reported for confidentiality reasons. compensation ratio 2-22 Statement on sustainable Message from the CEO, pages 7-8. Report of the Board of Directors, page 84. development strategy
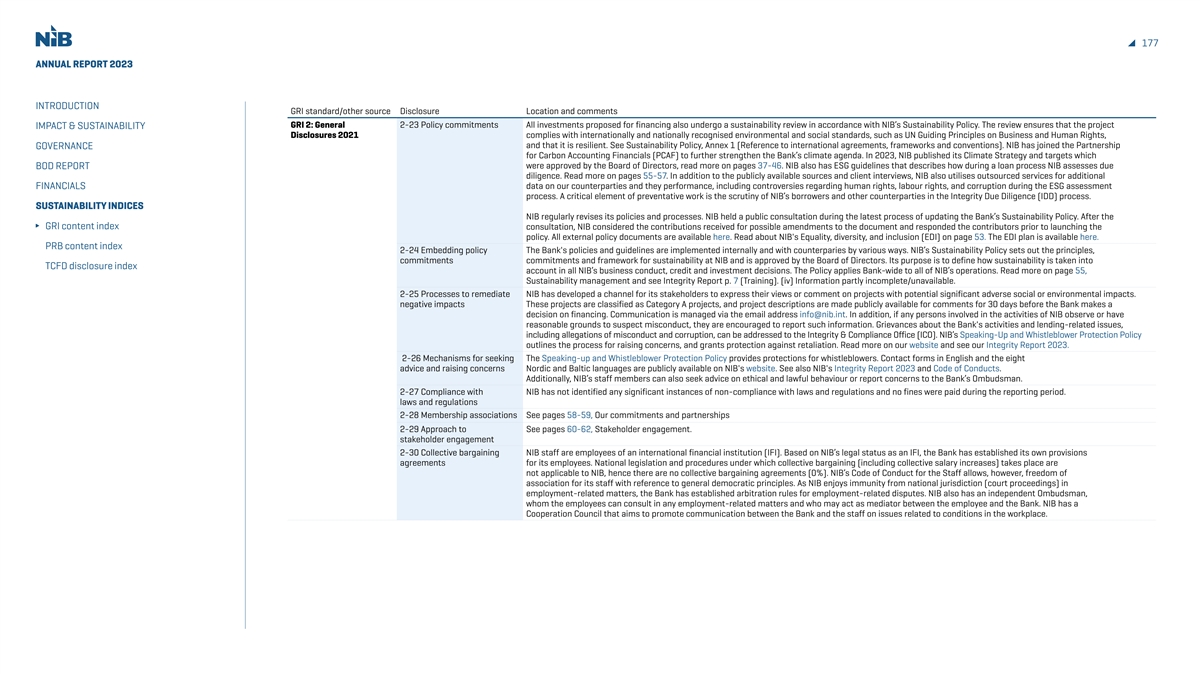
177 ANNUAL REPORT 2023 INTRODUCTION GRI standard/other source Disclosure Location and comments GRI 2: General 2-23 Policy commitments All investments proposed for financing also undergo a sustainability review in accordance with NIB’s Sustainability Policy. The review ensures that the project IMPACT & SUSTAINABILITY Disclosures 2021 complies with internationally and nationally recognised environmental and social standards, such as UN Guiding Principles on Business and Human Rights, and that it is resilient. See Sustainability Policy, Annex 1 (Reference to international agreements, frameworks and conventions). NIB has joined the Partnership GOVERNANCE for Carbon Accounting Financials (PCAF) to further strengthen the Bank’s climate agenda. In 2023, NIB published its Climate Strategy and targets which BOD REPORT were approved by the Board of Directors, read more on pages 37-46. NIB also has ESG guidelines that describes how during a loan process NIB assesses due diligence. Read more on pages 55-57. In addition to the publicly available sources and client interviews, NIB also utilises outsourced services for additional FINANCIALS data on our counterparties and they performance, including controversies regarding human rights, labour rights, and corruption during the ESG assessment process. A critical element of preventative work is the scrutiny of NIB’s borrowers and other counterparties in the Integrity Due Diligence (IDD) process. SUSTAINABILITY INDICES NIB regularly revises its policies and processes. NIB held a public consultation during the latest process of updating the Bank’s Sustainability Policy. After the GRI content index consultation, NIB considered the contributions received for possible amendments to the document and responded the contributors prior to launching the policy. All external policy documents are available here. Read about NIB's Equality, diversity, and inclusion (EDI) on page 53. The EDI plan is available here. PRB content index 2-24 Embedding policy The Bank's policies and guidelines are implemented internally and with counterparies by various ways. NIB’s Sustainability Policy sets out the principles, commitments commitments and framework for sustainability at NIB and is approved by the Board of Directors. Its purpose is to define how sustainability is taken into TCFD disclosure index account in all NIB’s business conduct, credit and investment decisions. The Policy applies Bank-wide to all of NIB’s operations. Read more on page 55, Sustainability management and see Integrity Report p. 7 (Training). (iv) Information partly incomplete/unavailable. 2-25 Processes to remediate NIB has developed a channel for its stakeholders to express their views or comment on projects with potential significant adverse social or environmental impacts. negative impacts These projects are classified as Category A projects, and project descriptions are made publicly available for comments for 30 days before the Bank makes a decision on financing. Communication is managed via the email address info@nib.int. In addition, if any persons involved in the activities of NIB observe or have reasonable grounds to suspect misconduct, they are encouraged to report such information. Grievances about the Bank's activities and lending-related issues, including allegations of misconduct and corruption, can be addressed to the Integrity & Compliance Office (ICO). NIB’s Speaking-Up and Whistleblower Protection Policy outlines the process for raising concerns, and grants protection against retaliation. Read more on our website and see our Integrity Report 2023. 2-26 Mechanisms for seeking The Speaking-up and Whistleblower Protection Policy provides protections for whistleblowers. Contact forms in English and the eight advice and raising concerns Nordic and Baltic languages are publicly available on NIB's website. See also NIB's Integrity Report 2023 and Code of Conducts. Additionally, NIB’s staff members can also seek advice on ethical and lawful behaviour or report concerns to the Bank’s Ombudsman. 2-27 Compliance with NIB has not identified any significant instances of non-compliance with laws and regulations and no fines were paid during the reporting period. laws and regulations 2-28 Membership associations See pages 58-59, Our commitments and partnerships 2-29 Approach to See pages 60-62, Stakeholder engagement. stakeholder engagement 2-30 Collective bargaining NIB staff are employees of an international financial institution (IFI). Based on NIB’s legal status as an IFI, the Bank has established its own provisions agreements for its employees. National legislation and procedures under which collective bargaining (including collective salary increases) takes place are not applicable to NIB, hence there are no collective bargaining agreements (0%). NIB’s Code of Conduct for the Staff allows, however, freedom of association for its staff with reference to general democratic principles. As NIB enjoys immunity from national jurisdiction (court proceedings) in employment-related matters, the Bank has established arbitration rules for employment-related disputes. NIB also has an independent Ombudsman, whom the employees can consult in any employment-related matters and who may act as mediator between the employee and the Bank. NIB has a Cooperation Council that aims to promote communication between the Bank and the staff on issues related to conditions in the workplace.
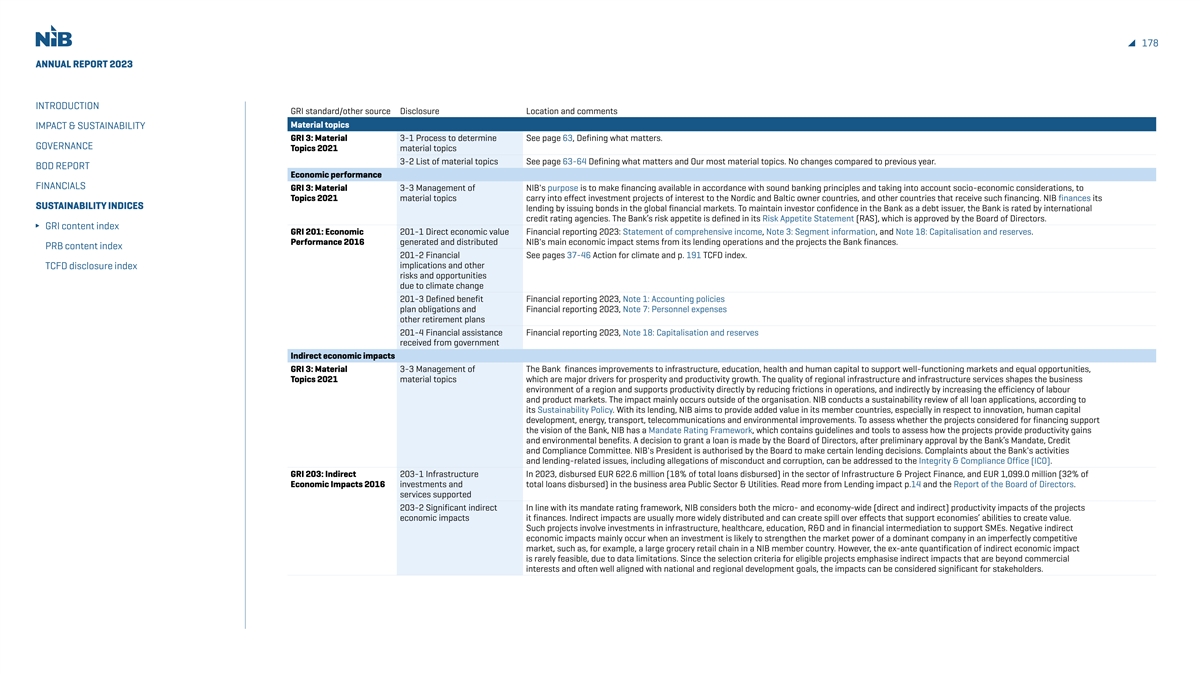
178 ANNUAL REPORT 2023 INTRODUCTION GRI standard/other source Disclosure Location and comments Material topics IMPACT & SUSTAINABILITY GRI 3: Material 3-1 Process to determine See page 63, Defining what matters. GOVERNANCE Topics 2021 material topics 3-2 List of material topics See page 63-64 Defining what matters and Our most material topics. No changes compared to previous year. BOD REPORT Economic performance FINANCIALS GRI 3: Material 3-3 Management of NIB's purpose is to make financing available in accordance with sound banking principles and taking into account socio-economic considerations, to Topics 2021 material topics carry into effect investment projects of interest to the Nordic and Baltic owner countries, and other countries that receive such financing. NIB finances its SUSTAINABILITY INDICES lending by issuing bonds in the global financial markets. To maintain investor confidence in the Bank as a debt issuer, the Bank is rated by international credit rating agencies. The Bank’s risk appetite is defined in its Risk Appetite Statement (RAS), which is approved by the Board of Directors. GRI content index GRI 201: Economic 201-1 Direct economic value Financial reporting 2023: Statement of comprehensive income, Note 3: Segment information, and Note 18: Capitalisation and reserves. Performance 2016 generated and distributed NIB's main economic impact stems from its lending operations and the projects the Bank finances. PRB content index 201-2 Financial See pages 37-46 Action for climate and p. 191 TCFD index. implications and other TCFD disclosure index risks and opportunities due to climate change 201-3 Defined benefit Financial reporting 2023, Note 1: Accounting policies plan obligations and Financial reporting 2023, Note 7: Personnel expenses other retirement plans 201-4 Financial assistance Financial reporting 2023, Note 18: Capitalisation and reserves received from government Indirect economic impacts GRI 3: Material 3-3 Management of The Bank finances improvements to infrastructure, education, health and human capital to support well-functioning markets and equal opportunities, Topics 2021 material topics which are major drivers for prosperity and productivity growth. The quality of regional infrastructure and infrastructure services shapes the business environment of a region and supports productivity directly by reducing frictions in operations, and indirectly by increasing the efficiency of labour and product markets. The impact mainly occurs outside of the organisation. NIB conducts a sustainability review of all loan applications, according to its Sustainability Policy. With its lending, NIB aims to provide added value in its member countries, especially in respect to innovation, human capital development, energy, transport, telecommunications and environmental improvements. To assess whether the projects considered for financing support the vision of the Bank, NIB has a Mandate Rating Framework, which contains guidelines and tools to assess how the projects provide productivity gains and environmental benefits. A decision to grant a loan is made by the Board of Directors, after preliminary approval by the Bank’s Mandate, Credit and Compliance Committee. NIB's President is authorised by the Board to make certain lending decisions. Complaints about the Bank's activities and lending-related issues, including allegations of misconduct and corruption, can be addressed to the Integrity & Compliance Office (ICO). GRI 203: Indirect 203-1 Infrastructure In 2023, disbursed EUR 622.6 million (18% of total loans disbursed) in the sector of Infrastructure & Project Finance, and EUR 1,099.0 million (32% of Economic Impacts 2016 investments and total loans disbursed) in the business area Public Sector & Utilities. Read more from Lending impact p.14 and the Report of the Board of Directors. services supported 203-2 Significant indirect In line with its mandate rating framework, NIB considers both the micro- and economy-wide (direct and indirect) productivity impacts of the projects economic impacts it finances. Indirect impacts are usually more widely distributed and can create spill over effects that support economies’ abilities to create value. Such projects involve investments in infrastructure, healthcare, education, R&D and in financial intermediation to support SMEs. Negative indirect economic impacts mainly occur when an investment is likely to strengthen the market power of a dominant company in an imperfectly competitive market, such as, for example, a large grocery retail chain in a NIB member country. However, the ex-ante quantification of indirect economic impact is rarely feasible, due to data limitations. Since the selection criteria for eligible projects emphasise indirect impacts that are beyond commercial interests and often well aligned with national and regional development goals, the impacts can be considered significant for stakeholders.
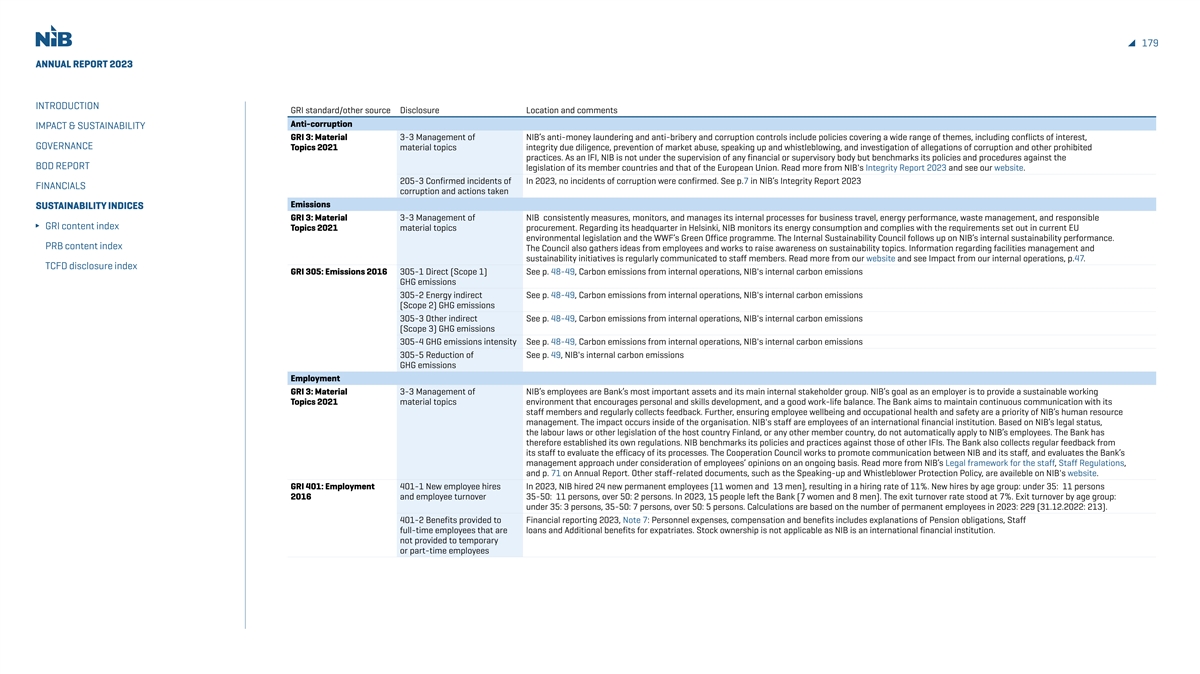
179 ANNUAL REPORT 2023 INTRODUCTION GRI standard/other source Disclosure Location and comments Anti-corruption IMPACT & SUSTAINABILITY GRI 3: Material 3-3 Management of NIB’s anti-money laundering and anti-bribery and corruption controls include policies covering a wide range of themes, including conflicts of interest, GOVERNANCE Topics 2021 material topics integrity due diligence, prevention of market abuse, speaking up and whistleblowing, and investigation of allegations of corruption and other prohibited practices. As an IFI, NIB is not under the supervision of any financial or supervisory body but benchmarks its policies and procedures against the BOD REPORT legislation of its member countries and that of the European Union. Read more from NIB's Integrity Report 2023 and see our website. 205-3 Confirmed incidents of In 2023, no incidents of corruption were confirmed. See p.7 in NIB’s Integrity Report 2023 FINANCIALS corruption and actions taken Emissions SUSTAINABILITY INDICES GRI 3: Material 3-3 Management of NIB consistently measures, monitors, and manages its internal processes for business travel, energy performance, waste management, and responsible GRI content index Topics 2021 material topics procurement. Regarding its headquarter in Helsinki, NIB monitors its energy consumption and complies with the requirements set out in current EU environmental legislation and the WWF’s Green Office programme. The Internal Sustainability Council follows up on NIB’s internal sustainability performance. PRB content index The Council also gathers ideas from employees and works to raise awareness on sustainability topics. Information regarding facilities management and sustainability initiatives is regularly communicated to staff members. Read more from our website and see Impact from our internal operations, p.47. TCFD disclosure index GRI 305: Emissions 2016 305-1 Direct (Scope 1) See p. 48-49, Carbon emissions from internal operations, NIB's internal carbon emissions GHG emissions 305-2 Energy indirect See p. 48-49, Carbon emissions from internal operations, NIB's internal carbon emissions (Scope 2) GHG emissions 305-3 Other indirect See p. 48-49, Carbon emissions from internal operations, NIB's internal carbon emissions (Scope 3) GHG emissions 305-4 GHG emissions intensity See p. 48-49, Carbon emissions from internal operations, NIB's internal carbon emissions 305-5 Reduction of See p. 49, NIB's internal carbon emissions GHG emissions Employment GRI 3: Material 3-3 Management of NIB’s employees are Bank’s most important assets and its main internal stakeholder group. NIB’s goal as an employer is to provide a sustainable working Topics 2021 material topics environment that encourages personal and skills development, and a good work-life balance. The Bank aims to maintain continuous communication with its staff members and regularly collects feedback. Further, ensuring employee wellbeing and occupational health and safety are a priority of NIB’s human resource management. The impact occurs inside of the organisation. NIB's staff are employees of an international financial institution. Based on NIB’s legal status, the labour laws or other legislation of the host country Finland, or any other member country, do not automatically apply to NIB’s employees. The Bank has therefore established its own regulations. NIB benchmarks its policies and practices against those of other IFIs. The Bank also collects regular feedback from its staff to evaluate the efficacy of its processes. The Cooperation Council works to promote communication between NIB and its staff, and evaluates the Bank’s management approach under consideration of employees’ opinions on an ongoing basis. Read more from NIB’s Legal framework for the staff, Staff Regulations, and p. 71 on Annual Report. Other staff-related documents, such as the Speaking-up and Whistleblower Protection Policy, are availeble on NIB's website. GRI 401: Employment 401-1 New employee hires In 2023, NIB hired 24 new permanent employees (11 women and 13 men), resulting in a hiring rate of 11%. New hires by age group: under 35: 11 persons 2016 and employee turnover 35-50: 11 persons, over 50: 2 persons. In 2023, 15 people left the Bank (7 women and 8 men). The exit turnover rate stood at 7%. Exit turnover by age group: under 35: 3 persons, 35-50: 7 persons, over 50: 5 persons. Calculations are based on the number of permanent employees in 2023: 229 (31.12.2022: 213). 401-2 Benefits provided to Financial reporting 2023, Note 7: Personnel expenses, compensation and benefits includes explanations of Pension obligations, Staff full-time employees that are loans and Additional benefits for expatriates. Stock ownership is not applicable as NIB is an international financial institution. not provided to temporary or part-time employees
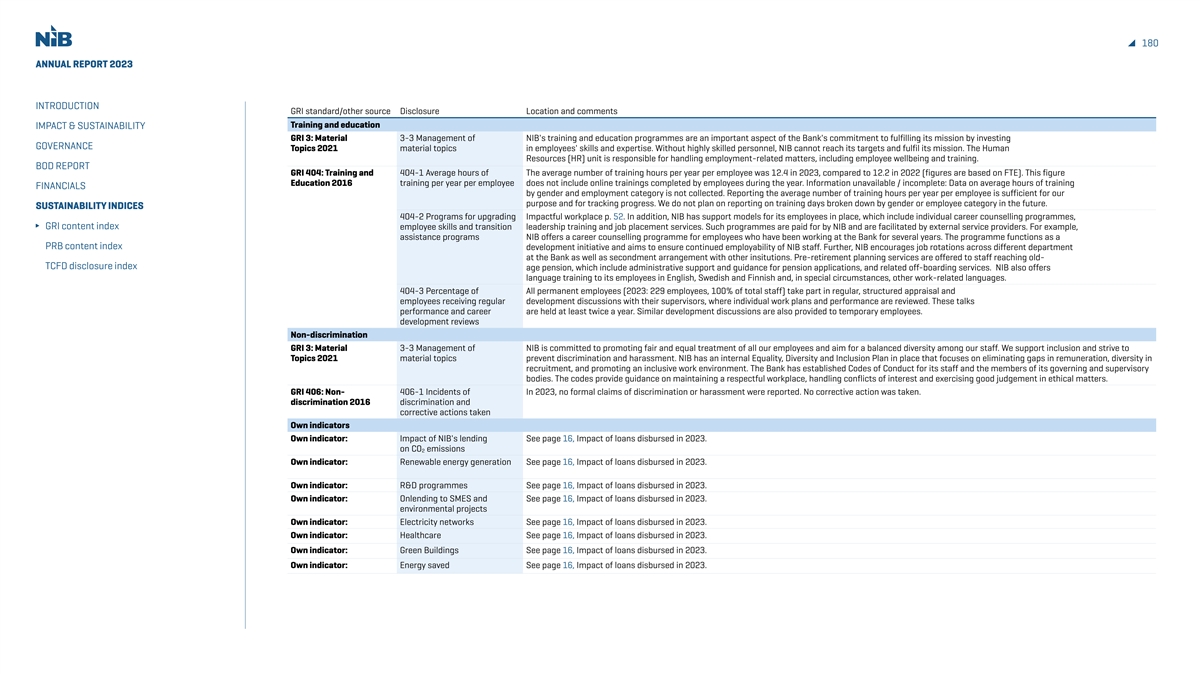
180 ANNUAL REPORT 2023 INTRODUCTION GRI standard/other source Disclosure Location and comments Training and education IMPACT & SUSTAINABILITY GRI 3: Material 3-3 Management of NIB's training and education programmes are an important aspect of the Bank's commitment to fulfilling its mission by investing GOVERNANCE Topics 2021 material topics in employees' skills and expertise. Without highly skilled personnel, NIB cannot reach its targets and fulfil its mission. The Human Resources (HR) unit is responsible for handling employment-related matters, including employee wellbeing and training. BOD REPORT GRI 404: Training and 404-1 Average hours of The average number of training hours per year per employee was 12.4 in 2023, compared to 12.2 in 2022 (figures are based on FTE). This figure Education 2016 training per year per employee does not include online trainings completed by employees during the year. Information unavailable / incomplete: Data on average hours of training FINANCIALS by gender and employment category is not collected. Reporting the average number of training hours per year per employee is sufficient for our purpose and for tracking progress. We do not plan on reporting on training days broken down by gender or employee category in the future. SUSTAINABILITY INDICES 404-2 Programs for upgrading Impactful workplace p. 52. In addition, NIB has support models for its employees in place, which include individual career counselling programmes, GRI content index employee skills and transition leadership training and job placement services. Such programmes are paid for by NIB and are facilitated by external service providers. For example, assistance programs NIB offers a career counselling programme for employees who have been working at the Bank for several years. The programme functions as a PRB content index development initiative and aims to ensure continued employability of NIB staff. Further, NIB encourages job rotations across different department at the Bank as well as secondment arrangement with other insitutions. Pre-retirement planning services are offered to staff reaching old- TCFD disclosure index age pension, which include administrative support and guidance for pension applications, and related off-boarding services. NIB also offers language training to its employees in English, Swedish and Finnish and, in special circumstances, other work-related languages. 404-3 Percentage of All permanent employees (2023: 229 employees, 100% of total staff) take part in regular, structured appraisal and employees receiving regular development discussions with their supervisors, where individual work plans and performance are reviewed. These talks performance and career are held at least twice a year. Similar development discussions are also provided to temporary employees. development reviews Non-discrimination GRI 3: Material 3-3 Management of NIB is committed to promoting fair and equal treatment of all our employees and aim for a balanced diversity among our staff. We support inclusion and strive to Topics 2021 material topics prevent discrimination and harassment. NIB has an internal Equality, Diversity and Inclusion Plan in place that focuses on eliminating gaps in remuneration, diversity in recruitment, and promoting an inclusive work environment. The Bank has established Codes of Conduct for its staff and the members of its governing and supervisory bodies. The codes provide guidance on maintaining a respectful workplace, handling conflicts of interest and exercising good judgement in ethical matters. GRI 406: Non- 406-1 Incidents of In 2023, no formal claims of discrimination or harassment were reported. No corrective action was taken. discrimination 2016 discrimination and corrective actions taken Own indicators Own indicator: Impact of NIB's lending See page 16, Impact of loans disbursed in 2023. on CO2 emissions Own indicator: Renewable energy generation See page 16, Impact of loans disbursed in 2023. Own indicator: R&D programmes See page 16, Impact of loans disbursed in 2023. Own indicator: Onlending to SMES and See page 16, Impact of loans disbursed in 2023. environmental projects Own indicator: Electricity networks See page 16, Impact of loans disbursed in 2023. Own indicator: Healthcare See page 16, Impact of loans disbursed in 2023. Own indicator: Green Buildings See page 16, Impact of loans disbursed in 2023. Own indicator: Energy saved See page 16, Impact of loans disbursed in 2023.
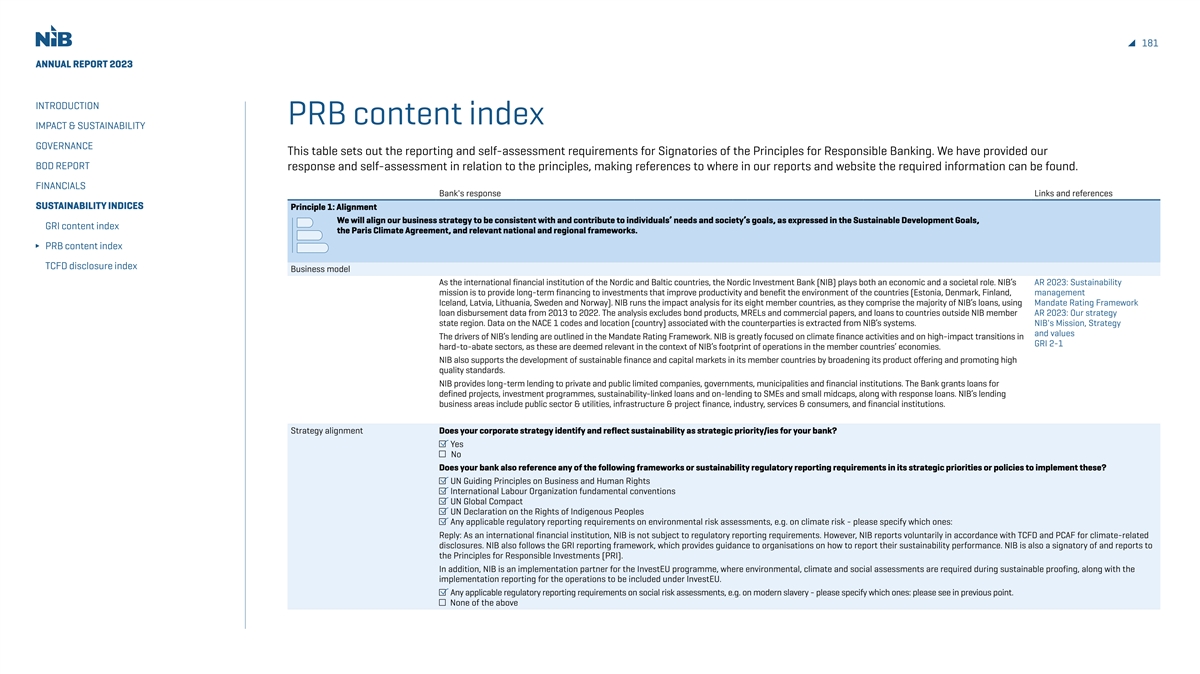
181 ANNUAL REPORT 2023 INTRODUCTION PRB content index IMPACT & SUSTAINABILITY GOVERNANCE This table sets out the reporting and self-assessment requirements for Signatories of the Principles for Responsible Banking. We have provided our BOD REPORT response and self-assessment in relation to the principles, making references to where in our reports and website the required information can be found. FINANCIALS Bank's response Links and references SUSTAINABILITY INDICES Principle 1: Alignment We will align our business strategy to be consistent with and contribute to individuals’ needs and society’s goals, as expressed in the Sustainable Development Goals, GRI content index the Paris Climate Agreement, and relevant national and regional frameworks. PRB content index TCFD disclosure index Business model As the international financial institution of the Nordic and Baltic countries, the Nordic Investment Bank (NIB) plays both an economic and a societal role. NIB’s AR 2023: Sustainability mission is to provide long-term financing to investments that improve productivity and benefit the environment of the countries (Estonia, Denmark, Finland, management Iceland, Latvia, Lithuania, Sweden and Norway). NIB runs the impact analysis for its eight member countries, as they comprise the majority of NIB’s loans, using Mandate Rating Framework loan disbursement data from 2013 to 2022. The analysis excludes bond products, MRELs and commercial papers, and loans to countries outside NIB member AR 2023: Our strategy state region. Data on the NACE 1 codes and location (country) associated with the counterparties is extracted from NIB’s systems. NIB's Mission, Strategy and values The drivers of NIB’s lending are outlined in the Mandate Rating Framework. NIB is greatly focused on climate finance activities and on high-impact transitions in GRI 2-1 hard-to-abate sectors, as these are deemed relevant in the context of NIB’s footprint of operations in the member countries’ economies. NIB also supports the development of sustainable finance and capital markets in its member countries by broadening its product offering and promoting high quality standards. NIB provides long-term lending to private and public limited companies, governments, municipalities and financial institutions. The Bank grants loans for defined projects, investment programmes, sustainability-linked loans and on-lending to SMEs and small midcaps, along with response loans. NIB’s lending business areas include public sector & utilities, infrastructure & project finance, industry, services & consumers, and financial institutions. Strategy alignment Does your corporate strategy identify and reflect sustainability as strategic priority/ies for your bank? Yes No Does your bank also reference any of the following frameworks or sustainability regulatory reporting requirements in its strategic priorities or policies to implement these? UN Guiding Principles on Business and Human Rights International Labour Organization fundamental conventions UN Global Compact UN Declaration on the Rights of Indigenous Peoples Any applicable regulatory reporting requirements on environmental risk assessments, e.g. on climate risk - please specify which ones: Reply: As an international financial institution, NIB is not subject to regulatory reporting requirements. However, NIB reports voluntarily in accordance with TCFD and PCAF for climate-related disclosures. NIB also follows the GRI reporting framework, which provides guidance to organisations on how to report their sustainability performance. NIB is also a signatory of and reports to the Principles for Responsible Investments (PRI). In addition, NIB is an implementation partner for the InvestEU programme, where environmental, climate and social assessments are required during sustainable proofing, along with the implementation reporting for the operations to be included under InvestEU. Any applicable regulatory reporting requirements on social risk assessments, e.g. on modern slavery - please specify which ones: please see in previous point. None of the above

182 ANNUAL REPORT 2023 Bank's response Links and references INTRODUCTION NIB is committed to building resilient, prosperous, and well-functioning societies, taking into account the relevant sustainability- and productivity-related AR 2023: Our commitments IMPACT & SUSTAINABILITY challenges and action plans of its member countries in the region of NIB’s member countries and tackling the climate challenge in line with the Paris and partnerships Agreement. AR 2023: NEB GOVERNANCE AR 2023: Sustainability The Bank bases its core sustainability principles on international agreements, frameworks and conventions supporting sustainable business conduct. They management are defined in NIB’s Sustainability policy. NIB’s Sustainability Policy, Mandate Rating Framework and relevant ESG frameworks guide all credit decisions. In BOD REPORT AR 2022: PRB content index the productivity mandate, drivers such as human capital and equal opportunities and technical progress and innovation align well with SDGs 3, 4, 5, 8 and 9. Mandate Rating Framework In the environmental mandate, drivers such as climate change mitigation, resource efficiency and pollution reduction align well with SDGs 6, 7, 11, 12, 13, 14 FINANCIALS Sustainability Policy and 15. Environmental, Social and The NIB Environmental Bond programme focuses on climate action and environmental issues, and the NIB Blue Bond programme targets water and sea SUSTAINABILITY INDICES Governance guidance for lending pollution reduction. Both programmes address relevant sustainability challenges for the NIB’s member countries and direct the impact to areas of particular GRI 2-22 GRI content index interest to the economies and societies in which NIB operates. In its NIB Environmental Bond reporting, NIB maps the project categories financed for the relevant SDGs. PRB content index Principle 2: Impact and Target Setting We will continuously increase our positive impacts while reducing the negative impacts on, and managing the risks to, people and environment resulting from our activities, products and services. TCFD disclosure index To this end, we will set and publish targets where we can have the most significant impacts. 2.1 Impact Analysis (Key Step 1) Scope In 2022, NIB carried out its portfolio impact analysis, using the UNEP-FI Impact assessment tool and considering disbursement data and information Portfolio Impact analysis tool about the economic activity for NIB’s eight member states (NIB8) during a ten-year span, that is, from 2013 to 2022. This allowed NIB to identify the most for banks (version 2) https:// significant impacts in relation to NIB’s core business in terms of the economic activities and geographies of its counterparties. www.unepfi.org/impact/ unep-fi-impact-analysis- NIB used the UNEP FI impact assessment tool’s functionalities to assess the Bank’s cartography on the best effort basis. NIB used the tool’s inbuilt data tools/portfolio-tool/ sources and automatically calculated values. NIB runs the analysis for its eight member countries, as they comprise the majority of NIB’s loans, using loan disbursement data from 2013 to 2022. The analysis excludes bond products, MRELs and commercial papers, and loans to countries outside NIB member state region. Data on the NACE 1 codes and location (country) associated with the counterparties is extracted from NIB’s systems. Portfolio composition The data used for impact analysis covers disbursements to the NIB8 countries and was associated with over 94% of the lending portfolio or over 98% from AR 2022, PRB content index the disbursements in categories ordinary lending, international lending, and project investment loans in the period of 2012 – 2022. The analysis in accordance with the methodology explained above shows that the top disbursements are associated with the NACE codes: ∆ D 35.1 Electric power generation, transmission and distribution & D 35 Electricity, gas, steam and air conditioning supply; ∆ K 64 Financial service activities, except insurance and pension funding; ∆ O 84.1 Administration of the State and the economic and social policy of the community; ∆ M 72 Scientific research and development; ∆ H.49.1: Passenger rail transport, interurban. ∆ E.37: Sewerage; ∆ F.41.2: Construction of residential and non-residential buildings.
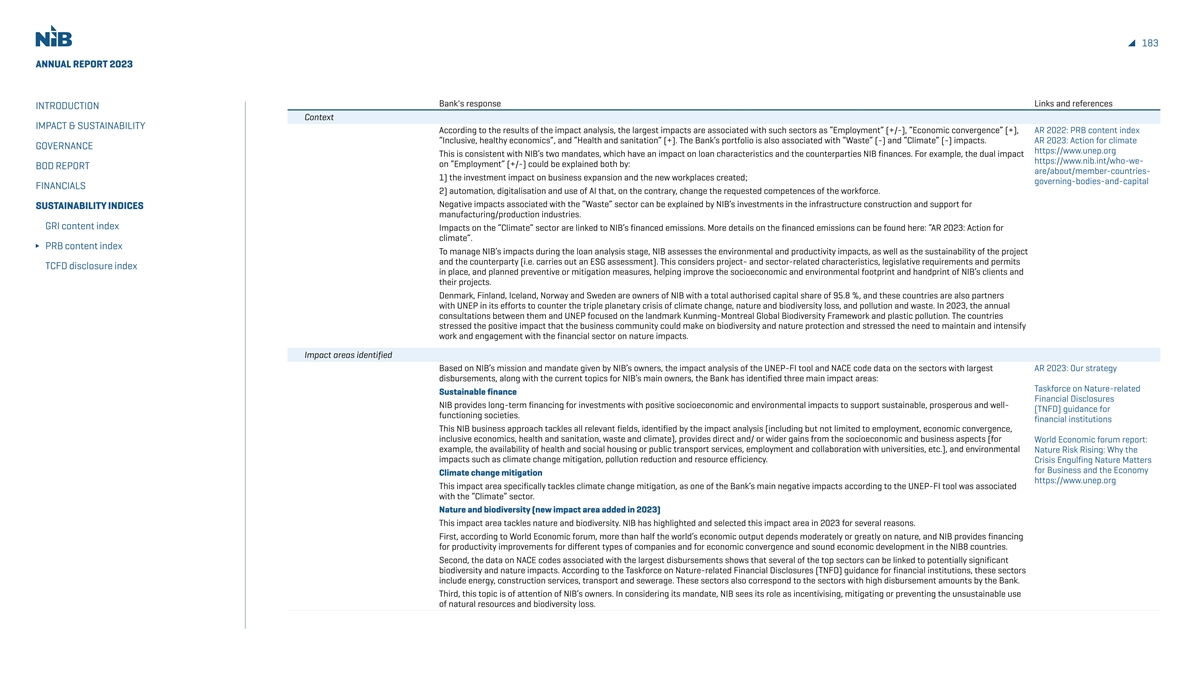
183 ANNUAL REPORT 2023 Bank's response Links and references INTRODUCTION Context IMPACT & SUSTAINABILITY According to the results of the impact analysis, the largest impacts are associated with such sectors as “Employment” (+/-), “Economic convergence” (+), AR 2022: PRB content index “Inclusive, healthy economics”, and “Health and sanitation” (+). The Bank’s portfolio is also associated with “Waste” (-) and “Climate” (-) impacts. AR 2023: Action for climate GOVERNANCE https://www.unep.org This is consistent with NIB’s two mandates, which have an impact on loan characteristics and the counterparties NIB finances. For example, the dual impact https://www.nib.int/who-we- on “Employment” (+/-) could be explained both by: BOD REPORT are/about/member-countries- 1) the investment impact on business expansion and the new workplaces created; governing-bodies-and-capital FINANCIALS 2) automation, digitalisation and use of AI that, on the contrary, change the requested competences of the workforce. Negative impacts associated with the “Waste” sector can be explained by NIB’s investments in the infrastructure construction and support for SUSTAINABILITY INDICES manufacturing/production industries. GRI content index Impacts on the “Climate” sector are linked to NIB’s financed emissions. More details on the financed emissions can be found here: “AR 2023: Action for climate”. PRB content index To manage NIB’s impacts during the loan analysis stage, NIB assesses the environmental and productivity impacts, as well as the sustainability of the project and the counterparty (i.e. carries out an ESG assessment). This considers project- and sector-related characteristics, legislative requirements and permits TCFD disclosure index in place, and planned preventive or mitigation measures, helping improve the socioeconomic and environmental footprint and handprint of NIB’s clients and their projects. Denmark, Finland, Iceland, Norway and Sweden are owners of NIB with a total authorised capital share of 95.8 %, and these countries are also partners with UNEP in its efforts to counter the triple planetary crisis of climate change, nature and biodiversity loss, and pollution and waste. In 2023, the annual consultations between them and UNEP focused on the landmark Kunming-Montreal Global Biodiversity Framework and plastic pollution. The countries stressed the positive impact that the business community could make on biodiversity and nature protection and stressed the need to maintain and intensify work and engagement with the financial sector on nature impacts. Impact areas identified Based on NIB’s mission and mandate given by NIB’s owners, the impact analysis of the UNEP-FI tool and NACE code data on the sectors with largest AR 2023: Our strategy disbursements, along with the current topics for NIB’s main owners, the Bank has identified three main impact areas: Taskforce on Nature-related Sustainable finance Financial Disclosures NIB provides long-term financing for investments with positive socioeconomic and environmental impacts to support sustainable, prosperous and well- (TNFD) guidance for functioning societies. financial institutions This NIB business approach tackles all relevant fields, identified by the impact analysis (including but not limited to employment, economic convergence, inclusive economics, health and sanitation, waste and climate), provides direct and/ or wider gains from the socioeconomic and business aspects (for World Economic forum report: example, the availability of health and social housing or public transport services, employment and collaboration with universities, etc.), and environmental Nature Risk Rising: Why the impacts such as climate change mitigation, pollution reduction and resource efficiency. Crisis Engulfing Nature Matters for Business and the Economy Climate change mitigation https://www.unep.org This impact area specifically tackles climate change mitigation, as one of the Bank’s main negative impacts according to the UNEP-FI tool was associated with the “Climate” sector. Nature and biodiversity (new impact area added in 2023) This impact area tackles nature and biodiversity. NIB has highlighted and selected this impact area in 2023 for several reasons. First, according to World Economic forum, more than half the world’s economic output depends moderately or greatly on nature, and NIB provides financing for productivity improvements for different types of companies and for economic convergence and sound economic development in the NIB8 countries. Second, the data on NACE codes associated with the largest disbursements shows that several of the top sectors can be linked to potentially significant biodiversity and nature impacts. According to the Taskforce on Nature-related Financial Disclosures (TNFD) guidance for financial institutions, these sectors include energy, construction services, transport and sewerage. These sectors also correspond to the sectors with high disbursement amounts by the Bank. Third, this topic is of attention of NIB’s owners. In considering its mandate, NIB sees its role as incentivising, mitigating or preventing the unsustainable use of natural resources and biodiversity loss.
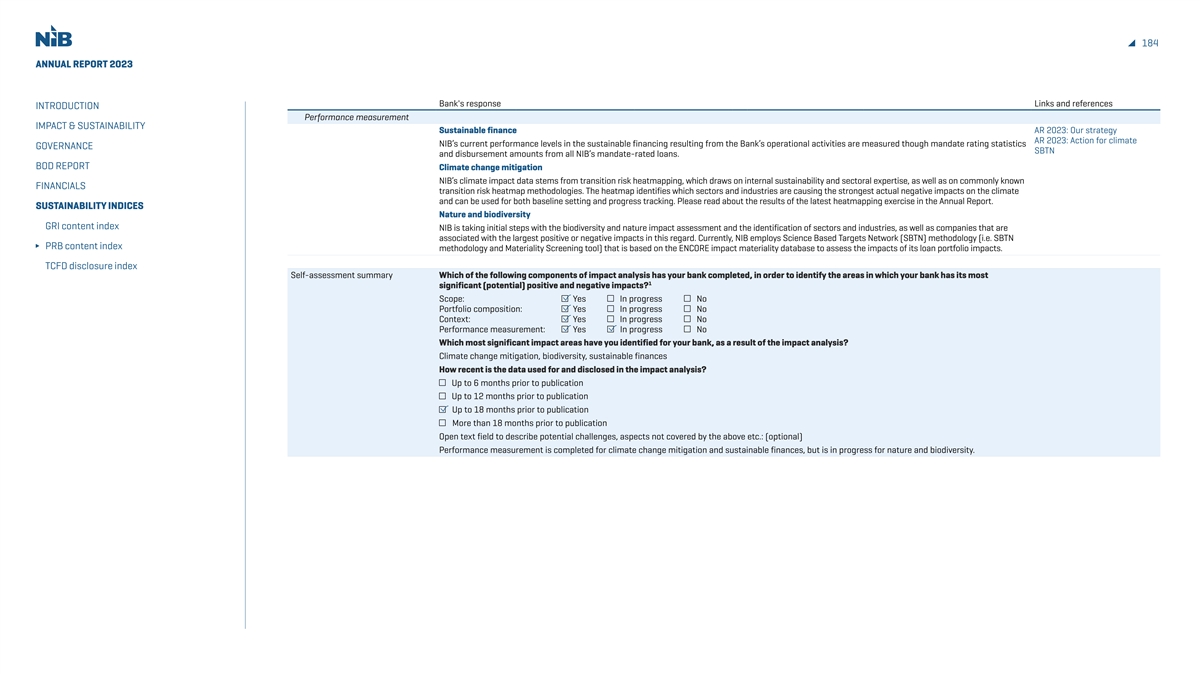
184 ANNUAL REPORT 2023 Bank's response Links and references INTRODUCTION Performance measurement IMPACT & SUSTAINABILITY Sustainable finance AR 2023: Our strategy AR 2023: Action for climate NIB’s current performance levels in the sustainable financing resulting from the Bank’s operational activities are measured though mandate rating statistics GOVERNANCE SBTN and disbursement amounts from all NIB’s mandate-rated loans. BOD REPORT Climate change mitigation NIB’s climate impact data stems from transition risk heatmapping, which draws on internal sustainability and sectoral expertise, as well as on commonly known FINANCIALS transition risk heatmap methodologies. The heatmap identifies which sectors and industries are causing the strongest actual negative impacts on the climate and can be used for both baseline setting and progress tracking. Please read about the results of the latest heatmapping exercise in the Annual Report. SUSTAINABILITY INDICES Nature and biodiversity GRI content index NIB is taking initial steps with the biodiversity and nature impact assessment and the identification of sectors and industries, as well as companies that are associated with the largest positive or negative impacts in this regard. Currently, NIB employs Science Based Targets Network (SBTN) methodology (i.e. SBTN PRB content index methodology and Materiality Screening tool) that is based on the ENCORE impact materiality database to assess the impacts of its loan portfolio impacts. TCFD disclosure index Self-assessment summary Which of the following components of impact analysis has your bank completed, in order to identify the areas in which your bank has its most 1 significant (potential) positive and negative impacts? Scope: Yes In progress No Portfolio composition: Yes In progress No Context: Yes In progress No Performance measurement: Yes In progress No Which most significant impact areas have you identified for your bank, as a result of the impact analysis? Climate change mitigation, biodiversity, sustainable finances How recent is the data used for and disclosed in the impact analysis? Up to 6 months prior to publication Up to 12 months prior to publication Up to 18 months prior to publication More than 18 months prior to publication Open text field to describe potential challenges, aspects not covered by the above etc.: (optional) Performance measurement is completed for climate change mitigation and sustainable finances, but is in progress for nature and biodiversity.
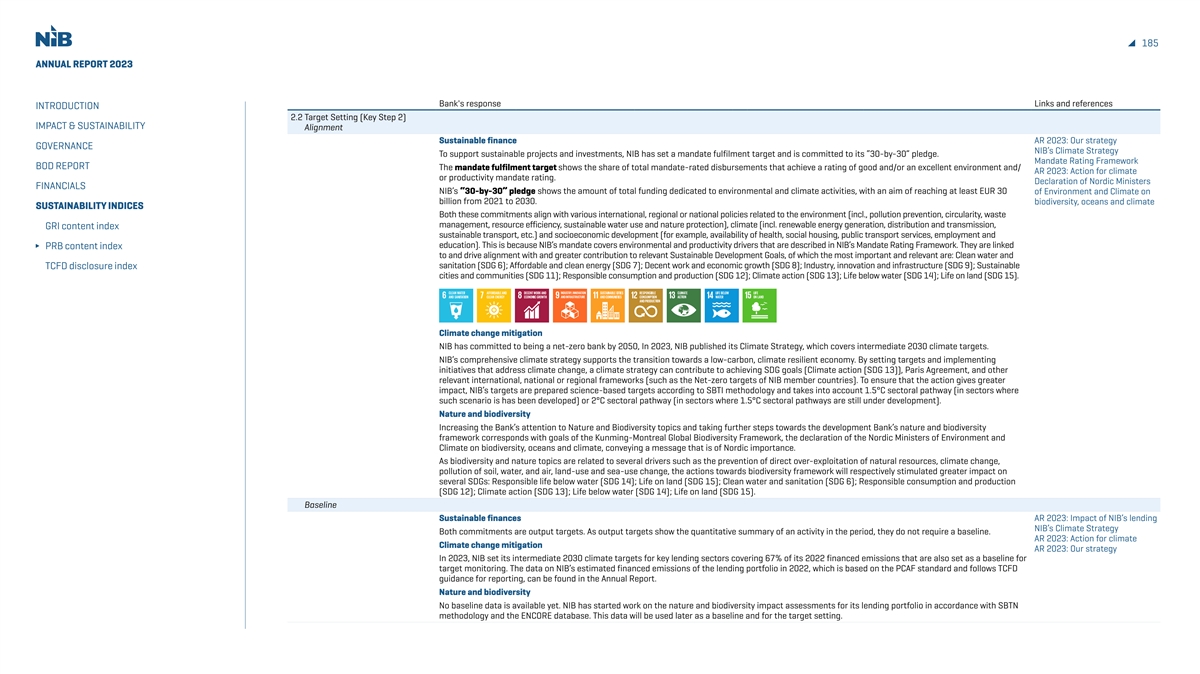
185 ANNUAL REPORT 2023 Bank's response Links and references INTRODUCTION 2.2 Target Setting (Key Step 2) IMPACT & SUSTAINABILITY Alignment Sustainable finance AR 2023: Our strategy GOVERNANCE NIB’s Climate Strategy To support sustainable projects and investments, NIB has set a mandate fulfilment target and is committed to its “30-by-30” pledge. Mandate Rating Framework BOD REPORT The mandate fulfilment target shows the share of total mandate-rated disbursements that achieve a rating of good and/or an excellent environment and/ AR 2023: Action for climate or productivity mandate rating. Declaration of Nordic Ministers FINANCIALS NIB’s “30-by-30” pledge shows the amount of total funding dedicated to environmental and climate activities, with an aim of reaching at least EUR 30 of Environment and Climate on billion from 2021 to 2030. biodiversity, oceans and climate SUSTAINABILITY INDICES Both these commitments align with various international, regional or national policies related to the environment (incl., pollution prevention, circularity, waste management, resource efficiency, sustainable water use and nature protection), climate (incl. renewable energy generation, distribution and transmission, GRI content index sustainable transport, etc.) and socioeconomic development (for example, availability of health, social housing, public transport services, employment and education). This is because NIB’s mandate covers environmental and productivity drivers that are described in NIB’s Mandate Rating Framework. They are linked PRB content index to and drive alignment with and greater contribution to relevant Sustainable Development Goals, of which the most important and relevant are: Clean water and sanitation (SDG 6); Affordable and clean energy (SDG 7); Decent work and economic growth (SDG 8); Industry, innovation and infrastructure (SDG 9); Sustainable TCFD disclosure index cities and communities (SDG 11); Responsible consumption and production (SDG 12); Climate action (SDG 13); Life below water (SDG 14); Life on land (SDG 15). Climate change mitigation NIB has committed to being a net-zero bank by 2050, In 2023, NIB published its Climate Strategy, which covers intermediate 2030 climate targets. NIB’s comprehensive climate strategy supports the transition towards a low-carbon, climate resilient economy. By setting targets and implementing initiatives that address climate change, a climate strategy can contribute to achieving SDG goals (Climate action (SDG 13)), Paris Agreement, and other relevant international, national or regional frameworks (such as the Net-zero targets of NIB member countries). To ensure that the action gives greater impact, NIB’s targets are prepared science-based targets according to SBTI methodology and takes into account 1.5°C sectoral pathway (in sectors where such scenario is has been developed) or 2°C sectoral pathway (in sectors where 1.5°C sectoral pathways are still under development). Nature and biodiversity Increasing the Bank’s attention to Nature and Biodiversity topics and taking further steps towards the development Bank’s nature and biodiversity framework corresponds with goals of the Kunming-Montreal Global Biodiversity Framework, the declaration of the Nordic Ministers of Environment and Climate on biodiversity, oceans and climate, conveying a message that is of Nordic importance. As biodiversity and nature topics are related to several drivers such as the prevention of direct over-exploitation of natural resources, climate change, pollution of soil, water, and air, land-use and sea-use change, the actions towards biodiversity framework will respectively stimulated greater impact on several SDGs: Responsible life below water (SDG 14); Life on land (SDG 15); Clean water and sanitation (SDG 6); Responsible consumption and production (SDG 12); Climate action (SDG 13); Life below water (SDG 14); Life on land (SDG 15). Baseline Sustainable finances AR 2023: Impact of NIB’s lending NIB’s Climate Strategy Both commitments are output targets. As output targets show the quantitative summary of an activity in the period, they do not require a baseline. AR 2023: Action for climate Climate change mitigation AR 2023: Our strategy In 2023, NIB set its intermediate 2030 climate targets for key lending sectors covering 67% of its 2022 financed emissions that are also set as a baseline for target monitoring. The data on NIB’s estimated financed emissions of the lending portfolio in 2022, which is based on the PCAF standard and follows TCFD guidance for reporting, can be found in the Annual Report. Nature and biodiversity No baseline data is available yet. NIB has started work on the nature and biodiversity impact assessments for its lending portfolio in accordance with SBTN methodology and the ENCORE database. This data will be used later as a baseline and for the target setting.

186 ANNUAL REPORT 2023 Bank's response Links and references INTRODUCTION SMART targets IMPACT & SUSTAINABILITY Sustainable finance AR 2023: Impact of NIB’s lending NIB’s Climate Strategy The mandate fulfilment target shows the share of total mandate-rated disbursements that achieves a good or excellent rating regarding the environmental GOVERNANCE AR 2023: Action for climate impact from the climate, pollution reduction, resource efficiency or preventive (adaptive) perspectives, and/or were assessed to have good or excellent direct AR 2023: Our strategy and/or wider gains from the socioeconomic and business perspective (e.g. the availability of health and social housing or public transport services, employment, BOD REPORT Mandate Rating Framework and collaboration with universities). The target stems from NIB’s mission, and it is approved every year as NIB’s annual business target. Sustainability Policy FINANCIALS The mandate rating target shows the percentage of “good” and/or “excellent” rated projects (from the productivity and/or environmental mandates Environmental, Social and perspective) from all mandate-rated projects. The fulfilment of the mandate rating target is calculated from the data on the disbursed loan amounts in Governance guidance for lending SUSTAINABILITY INDICES the respective reporting year and the mandate rating data associated with the loan. Mandate rating is carried out as part of the loan due diligence process, employing Mandate Rating Framework, Sustainability Policy and ESG guidance documents. The mandate fulfilment is reviewed in NIB’s Mandate, Credit and GRI content index Compliance committee and is reported regularly to the Board of Directors. In previous years, the target for mandate fulfilment has been 90%, but the new target for 2023 was increased and set at 95%. For 2024, the mandate rating PRB content index target has also been set at 95%. NIB’s “30-by-30” pledge means the amount of total funding dedicated to environmental and climate activities would cumulatively amount to at least EUR 30 billion TCFD disclosure index between 2021 and 2030. It is calculated as total project costs in EUR for the loans that have received a good or excellent rating in the environmental mandate. The calculation takes NIB’s disbursements starting from 2021 and the general rule that NIB typically finances up to 50% of a total project cost into account. Climate change mitigation NIB has set intermediate 2030 climate targets for key lending sectors covering 67% of its 2022 financed emissions. Detailed targets per sector and the full scope of NIB’s climate action plan are outlined in NIB’s Climate Strategy, highlighting the Bank’s role in supporting a fair transition to net zero by 2050 and fostering resilience to climate-related risks. Please see more details about the respective sectorial targets in the Annual Report and Climate Strategy. How NIB will track progress and report on the implementation of the Climate Strategy and targets is described in Chapter 5 of NIB’s Climate Strategy. Nature and biodiversity NIB will take further steps towards a nature and biodiversity framework - work on the nature- related impact assessment of the Bank’s portfolio, plan for nature- related target setting and respective reporting. Action plan Sustainable finance NIB’s Climate Strategy AR 2023: Impact of NIB’s lending The mandate rating target has been achieved every year so far, as reported in NIB’s Annual Reports. NIB is also on track to achieve the “30-by-30” pledge. AR 2023: Our strategy NIB will therefore continue its business development and mandate rating assessments in accordance with its practices and guidance documents. Environmental, Social and Climate change mitigation Governance guidance for lending NIB has incorporated the climate target alignment assessment into its credit decision process and documentation package, which is important for the sectors the Climate Strategy covers. NIB will also start to track the Climate Strategy progress. How NIB will track the progress and report on the implementation of the Climate Strategy and targets is described in Chapter 5 of NIB’s Climate Strategy. Nature and biodiversity NIB’s plan to finalise the analysis of the nature- and biodiversity-related impact data of NIB’s lending portfolio in accordance with SBTN guidance. NIB also plans to work on nature - related target setting and take further steps towards a nature and biodiversity framework. Impacts of the target implementation The above targets will have mostly positive impacts on greenhouse gas emissions reduction, environmental protection and productivity gains. However, negative impacts of these targers can be associated with need of process and policy changes and costs. For example: ∆ one of the potential indirect impacts of client climate strategies are their associated implementation costs. ∆ some actions may also lead to overall changes in processes that may lead to the displacement of people or the loss of jobs. However, these downsides can lead to opportunities in business development related to productivity increase and new needs for human resources, for example. Moreover, the green transition, combined with raising customer awareness, will help in green product market development. To mitigate negative impacts from our lending, NIB during credit analysis stage, carries out ESG assessment of a project, identifying also associated risks, oportunities, resilience to changes, etc.
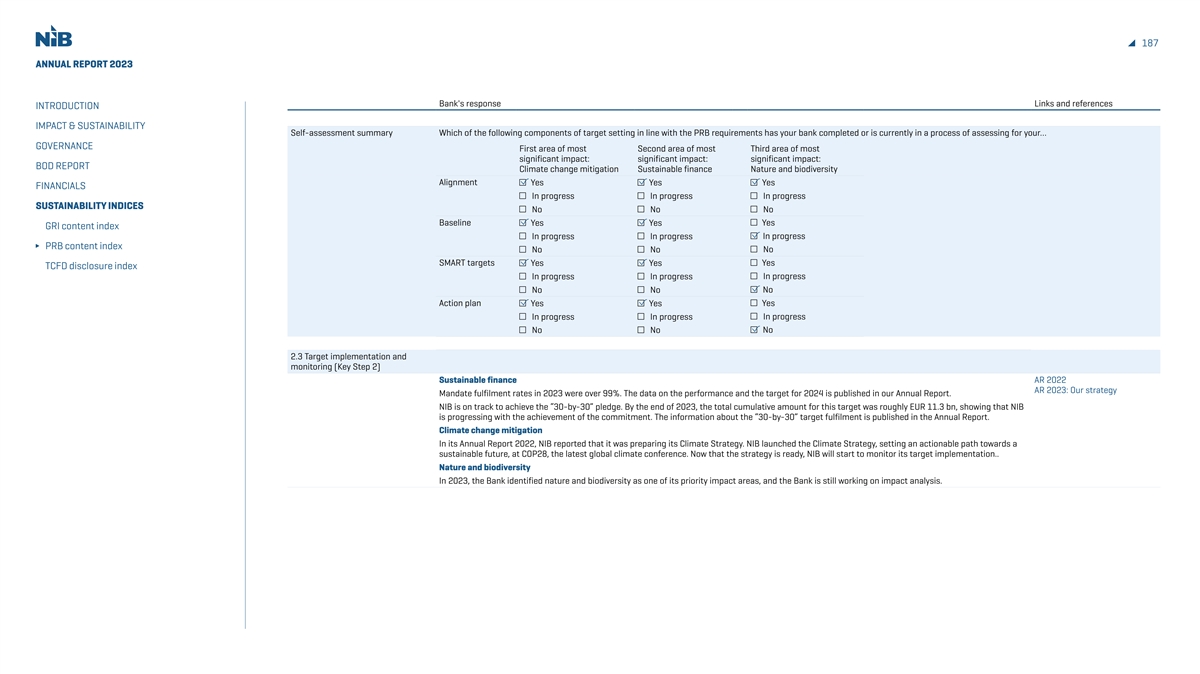
187 ANNUAL REPORT 2023 Bank's response Links and references INTRODUCTION IMPACT & SUSTAINABILITY Self-assessment summary Which of the following components of target setting in line with the PRB requirements has your bank completed or is currently in a process of assessing for your… GOVERNANCE First area of most Second area of most Third area of most significant impact: significant impact: significant impact: BOD REPORT Climate change mitigation Sustainable finance Nature and biodiversity Alignment Yes Yes Yes FINANCIALS In progress In progress In progress SUSTAINABILITY INDICES No No No Baseline Yes Yes Yes GRI content index In progress In progress In progress PRB content index No No No SMART targets Yes Yes Yes TCFD disclosure index In progress In progress In progress No No No Action plan Yes Yes Yes In progress In progress In progress No No No 2.3 Target implementation and monitoring (Key Step 2) Sustainable finance AR 2022 AR 2023: Our strategy Mandate fulfilment rates in 2023 were over 99%. The data on the performance and the target for 2024 is published in our Annual Report. NIB is on track to achieve the “30-by-30” pledge. By the end of 2023, the total cumulative amount for this target was roughly EUR 11.3 bn, showing that NIB is progressing with the achievement of the commitment. The information about the “30-by-30” target fulfilment is published in the Annual Report. Climate change mitigation In its Annual Report 2022, NIB reported that it was preparing its Climate Strategy. NIB launched the Climate Strategy, setting an actionable path towards a sustainable future, at COP28, the latest global climate conference. Now that the strategy is ready, NIB will start to monitor its target implementation.. Nature and biodiversity In 2023, the Bank identified nature and biodiversity as one of its priority impact areas, and the Bank is still working on impact analysis.
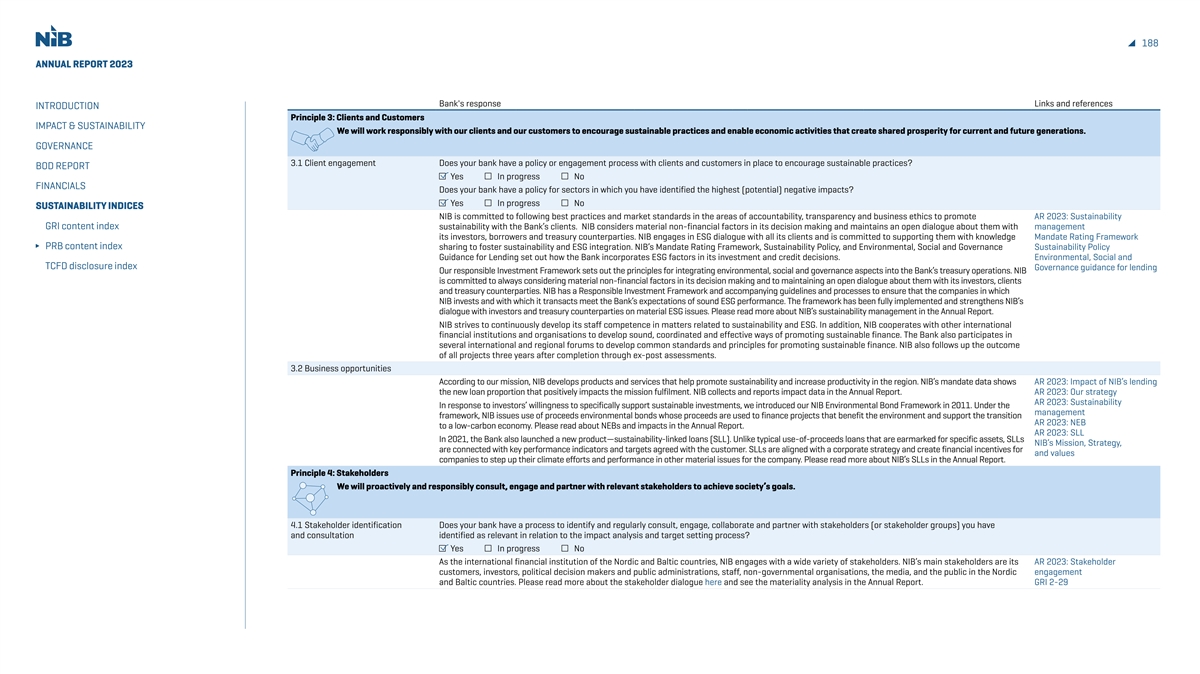
188 ANNUAL REPORT 2023 Bank's response Links and references INTRODUCTION Principle 3: Clients and Customers IMPACT & SUSTAINABILITY We will work responsibly with our clients and our customers to encourage sustainable practices and enable economic activities that create shared prosperity for current and future generations. GOVERNANCE 3.1 Client engagement Does your bank have a policy or engagement process with clients and customers in place to encourage sustainable practices? BOD REPORT Yes In progress No FINANCIALS Does your bank have a policy for sectors in which you have identified the highest (potential) negative impacts? Yes In progress No SUSTAINABILITY INDICES NIB is committed to following best practices and market standards in the areas of accountability, transparency and business ethics to promote AR 2023: Sustainability GRI content index sustainability with the Bank’s clients. NIB considers material non-financial factors in its decision making and maintains an open dialogue about them with management its investors, borrowers and treasury counterparties. NIB engages in ESG dialogue with all its clients and is committed to supporting them with knowledge Mandate Rating Framework PRB content index sharing to foster sustainability and ESG integration. NIB’s Mandate Rating Framework, Sustainability Policy, and Environmental, Social and Governance Sustainability Policy Guidance for Lending set out how the Bank incorporates ESG factors in its investment and credit decisions. Environmental, Social and TCFD disclosure index Governance guidance for lending Our responsible Investment Framework sets out the principles for integrating environmental, social and governance aspects into the Bank’s treasury operations. NIB is committed to always considering material non-financial factors in its decision making and to maintaining an open dialogue about them with its investors, clients and treasury counterparties. NIB has a Responsible Investment Framework and accompanying guidelines and processes to ensure that the companies in which NIB invests and with which it transacts meet the Bank’s expectations of sound ESG performance. The framework has been fully implemented and strengthens NIB’s dialogue with investors and treasury counterparties on material ESG issues. Please read more about NIB’s sustainability management in the Annual Report. NIB strives to continuously develop its staff competence in matters related to sustainability and ESG. In addition, NIB cooperates with other international financial institutions and organisations to develop sound, coordinated and effective ways of promoting sustainable finance. The Bank also participates in several international and regional forums to develop common standards and principles for promoting sustainable finance. NIB also follows up the outcome of all projects three years after completion through ex-post assessments. 3.2 Business opportunities According to our mission, NIB develops products and services that help promote sustainability and increase productivity in the region. NIB’s mandate data shows AR 2023: Impact of NIB’s lending the new loan proportion that positively impacts the mission fulfilment. NIB collects and reports impact data in the Annual Report. AR 2023: Our strategy AR 2023: Sustainability In response to investors’ willingness to specifically support sustainable investments, we introduced our NIB Environmental Bond Framework in 2011. Under the management framework, NIB issues use of proceeds environmental bonds whose proceeds are used to finance projects that benefit the environment and support the transition AR 2023: NEB to a low-carbon economy. Please read about NEBs and impacts in the Annual Report. AR 2023: SLL In 2021, the Bank also launched a new product—sustainability-linked loans (SLL). Unlike typical use-of-proceeds loans that are earmarked for specific assets, SLLs NIB’s Mission, Strategy, are connected with key performance indicators and targets agreed with the customer. SLLs are aligned with a corporate strategy and create financial incentives for and values companies to step up their climate efforts and performance in other material issues for the company. Please read more about NIB’s SLLs in the Annual Report. Principle 4: Stakeholders We will proactively and responsibly consult, engage and partner with relevant stakeholders to achieve society’s goals. 4.1 Stakeholder identification Does your bank have a process to identify and regularly consult, engage, collaborate and partner with stakeholders (or stakeholder groups) you have and consultation identified as relevant in relation to the impact analysis and target setting process? Yes In progress No As the international financial institution of the Nordic and Baltic countries, NIB engages with a wide variety of stakeholders. NIB’s main stakeholders are its AR 2023: Stakeholder customers, investors, political decision makers and public administrations, staff, non-governmental organisations, the media, and the public in the Nordic engagement and Baltic countries. Please read more about the stakeholder dialogue here and see the materiality analysis in the Annual Report. GRI 2-29
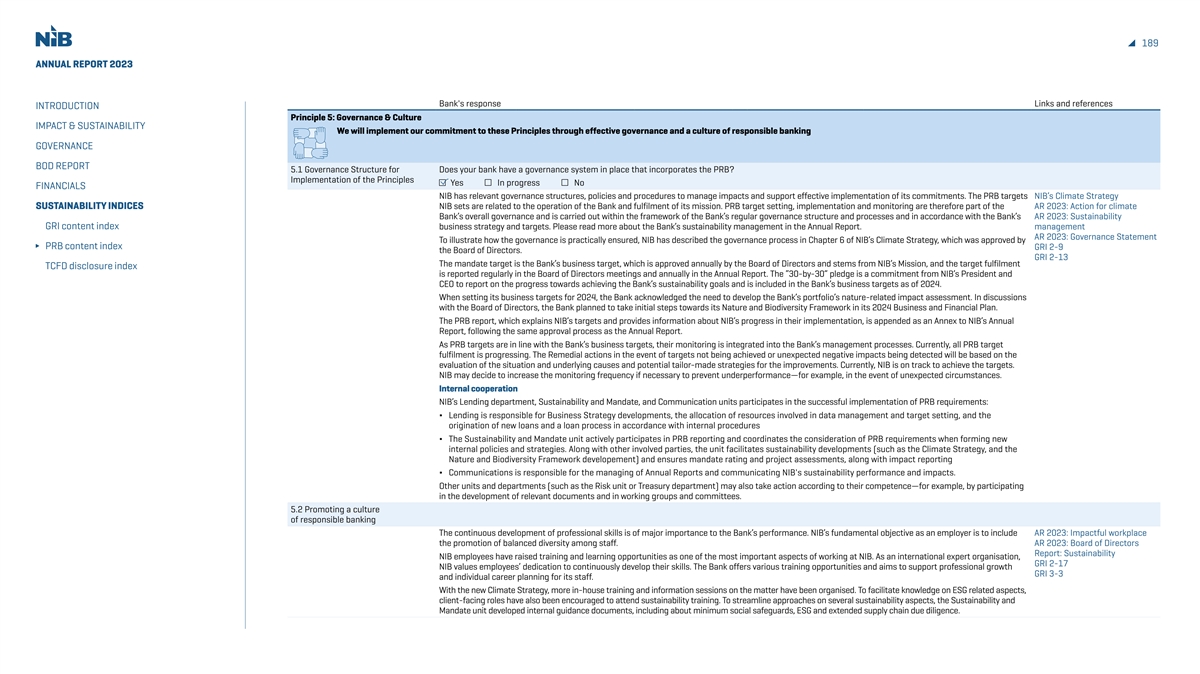
189 ANNUAL REPORT 2023 Bank's response Links and references INTRODUCTION Principle 5: Governance & Culture IMPACT & SUSTAINABILITY We will implement our commitment to these Principles through effective governance and a culture of responsible banking GOVERNANCE BOD REPORT 5.1 Governance Structure for Does your bank have a governance system in place that incorporates the PRB? Implementation of the Principles Yes In progress No FINANCIALS NIB has relevant governance structures, policies and procedures to manage impacts and support effective implementation of its commitments. The PRB targets NIB’s Climate Strategy SUSTAINABILITY INDICES NIB sets are related to the operation of the Bank and fulfilment of its mission. PRB target setting, implementation and monitoring are therefore part of the AR 2023: Action for climate Bank’s overall governance and is carried out within the framework of the Bank’s regular governance structure and processes and in accordance with the Bank’s AR 2023: Sustainability GRI content index business strategy and targets. Please read more about the Bank’s sustainability management in the Annual Report. management AR 2023: Governance Statement To illustrate how the governance is practically ensured, NIB has described the governance process in Chapter 6 of NIB’s Climate Strategy, which was approved by PRB content index GRI 2-9 the Board of Directors. GRI 2-13 The mandate target is the Bank’s business target, which is approved annually by the Board of Directors and stems from NIB’s Mission, and the target fulfilment TCFD disclosure index is reported regularly in the Board of Directors meetings and annually in the Annual Report. The “30-by-30” pledge is a commitment from NIB’s President and CEO to report on the progress towards achieving the Bank’s sustainability goals and is included in the Bank’s business targets as of 2024. When setting its business targets for 2024, the Bank acknowledged the need to develop the Bank’s portfolio’s nature-related impact assessment. In discussions with the Board of Directors, the Bank planned to take initial steps towards its Nature and Biodiversity Framework in its 2024 Business and Financial Plan. The PRB report, which explains NIB’s targets and provides information about NIB’s progress in their implementation, is appended as an Annex to NIB’s Annual Report, following the same approval process as the Annual Report. As PRB targets are in line with the Bank’s business targets, their monitoring is integrated into the Bank’s management processes. Currently, all PRB target fulfilment is progressing. The Remedial actions in the event of targets not being achieved or unexpected negative impacts being detected will be based on the evaluation of the situation and underlying causes and potential tailor-made strategies for the improvements. Currently, NIB is on track to achieve the targets. NIB may decide to increase the monitoring frequency if necessary to prevent underperformance—for example, in the event of unexpected circumstances. Internal cooperation NIB’s Lending department, Sustainability and Mandate, and Communication units participates in the successful implementation of PRB requirements: ∆ Lending is responsible for Business Strategy developments, the allocation of resources involved in data management and target setting, and the origination of new loans and a loan process in accordance with internal procedures ∆ The Sustainability and Mandate unit actively participates in PRB reporting and coordinates the consideration of PRB requirements when forming new internal policies and strategies. Along with other involved parties, the unit facilitates sustainability developments (such as the Climate Strategy, and the Nature and Biodiversity Framework developement) and ensures mandate rating and project assessments, along with impact reporting ∆ Communications is responsible for the managing of Annual Reports and communicating NIB's sustainability performance and impacts. Other units and departments (such as the Risk unit or Treasury department) may also take action according to their competence—for example, by participating in the development of relevant documents and in working groups and committees. 5.2 Promoting a culture of responsible banking The continuous development of professional skills is of major importance to the Bank’s performance. NIB’s fundamental objective as an employer is to include AR 2023: Impactful workplace the promotion of balanced diversity among staff. AR 2023: Board of Directors Report: Sustainability NIB employees have raised training and learning opportunities as one of the most important aspects of working at NIB. As an international expert organisation, GRI 2-17 NIB values employees’ dedication to continuously develop their skills. The Bank offers various training opportunities and aims to support professional growth GRI 3-3 and individual career planning for its staff. With the new Climate Strategy, more in-house training and information sessions on the matter have been organised. To facilitate knowledge on ESG related aspects, client-facing roles have also been encouraged to attend sustainability training. To streamline approaches on several sustainability aspects, the Sustainability and Mandate unit developed internal guidance documents, including about minimum social safeguards, ESG and extended supply chain due diligence.
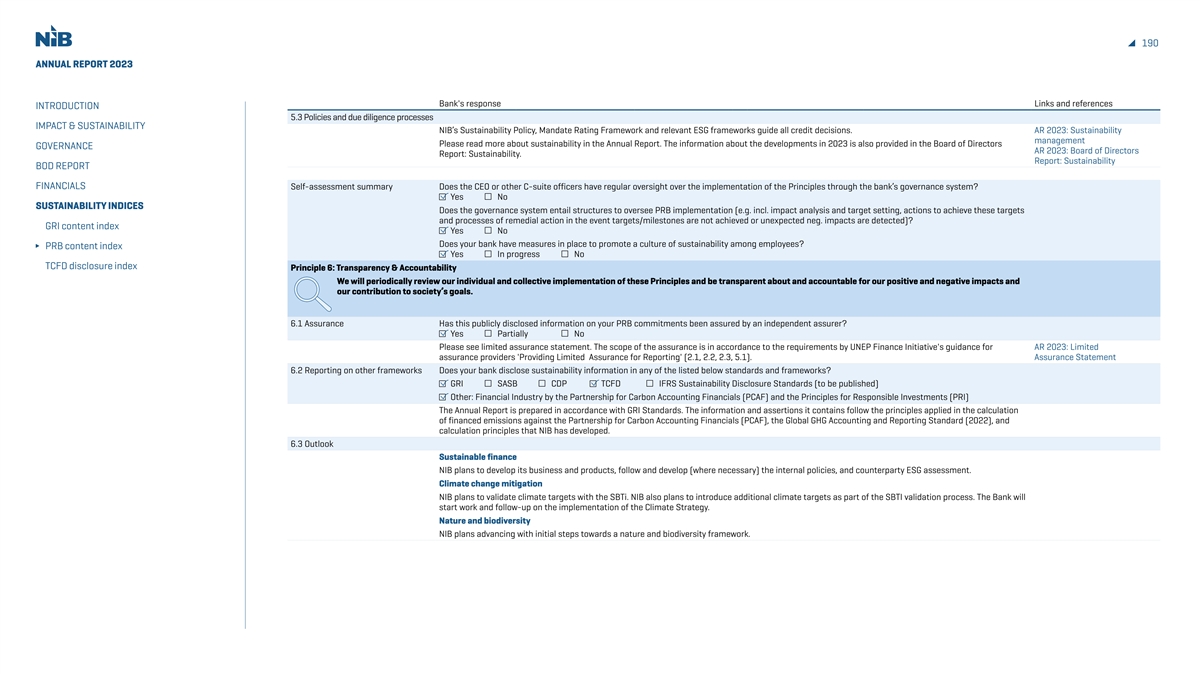
190 ANNUAL REPORT 2023 Bank's response Links and references INTRODUCTION 5.3 Policies and due diligence processes IMPACT & SUSTAINABILITY NIB’s Sustainability Policy, Mandate Rating Framework and relevant ESG frameworks guide all credit decisions. AR 2023: Sustainability management Please read more about sustainability in the Annual Report. The information about the developments in 2023 is also provided in the Board of Directors GOVERNANCE AR 2023: Board of Directors Report: Sustainability. Report: Sustainability BOD REPORT FINANCIALS Self-assessment summary Does the CEO or other C-suite officers have regular oversight over the implementation of the Principles through the bank’s governance system? Yes No SUSTAINABILITY INDICES Does the governance system entail structures to oversee PRB implementation (e.g. incl. impact analysis and target setting, actions to achieve these targets and processes of remedial action in the event targets/milestones are not achieved or unexpected neg. impacts are detected)? GRI content index Yes No Does your bank have measures in place to promote a culture of sustainability among employees? PRB content index Yes In progress No TCFD disclosure index Principle 6: Transparency & Accountability We will periodically review our individual and collective implementation of these Principles and be transparent about and accountable for our positive and negative impacts and our contribution to society’s goals. 6.1 Assurance Has this publicly disclosed information on your PRB commitments been assured by an independent assurer? Yes Partially No Please see limited assurance statement. The scope of the assurance is in accordance to the requirements by UNEP Finance Initiative's guidance for AR 2023: Limited assurance providers 'Providing Limited Assurance for Reporting' (2.1, 2.2, 2.3, 5.1). Assurance Statement 6.2 Reporting on other frameworks Does your bank disclose sustainability information in any of the listed below standards and frameworks? GRI SASB CDP TCFD IFRS Sustainability Disclosure Standards (to be published) Other: Financial Industry by the Partnership for Carbon Accounting Financials (PCAF) and the Principles for Responsible Investments (PRI) The Annual Report is prepared in accordance with GRI Standards. The information and assertions it contains follow the principles applied in the calculation of financed emissions against the Partnership for Carbon Accounting Financials (PCAF), the Global GHG Accounting and Reporting Standard (2022), and calculation principles that NIB has developed. 6.3 Outlook Sustainable finance NIB plans to develop its business and products, follow and develop (where necessary) the internal policies, and counterparty ESG assessment. Climate change mitigation NIB plans to validate climate targets with the SBTi. NIB also plans to introduce additional climate targets as part of the SBTI validation process. The Bank will start work and follow-up on the implementation of the Climate Strategy. Nature and biodiversity NIB plans advancing with initial steps towards a nature and biodiversity framework.
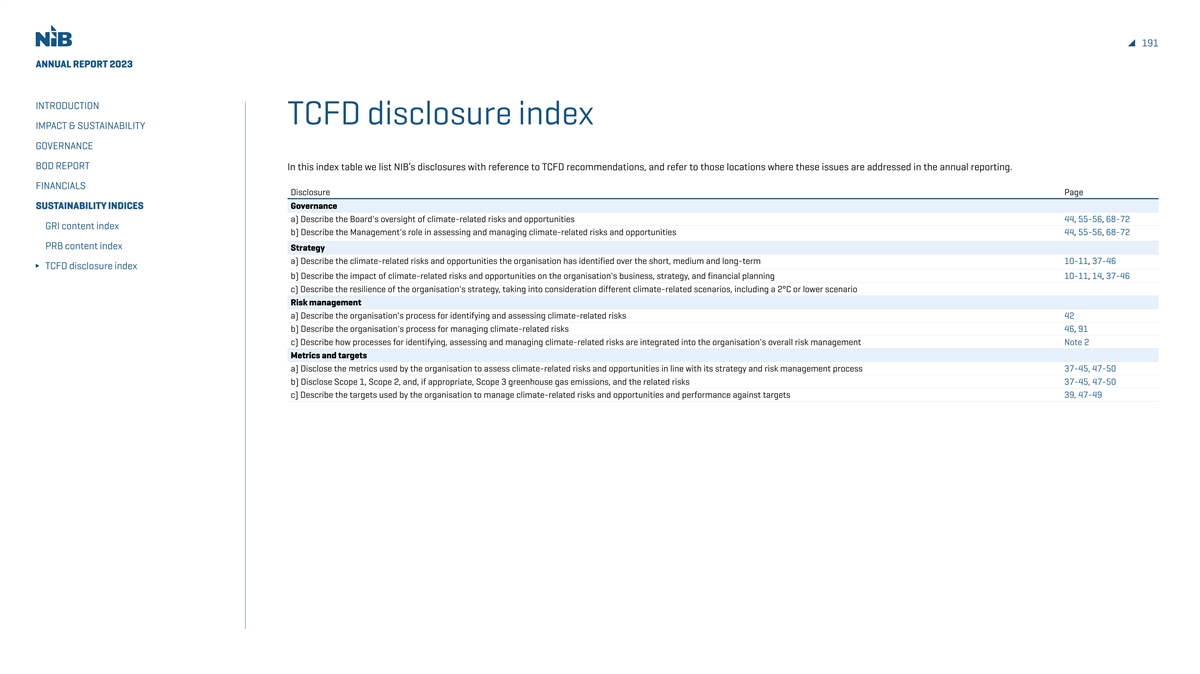
191 ANNUAL REPORT 2023 INTRODUCTION TCFD disclosure index IMPACT & SUSTAINABILITY GOVERNANCE BOD REPORT In this index table we list NIB’s disclosures with reference to TCFD recommendations, and refer to those locations where these issues are addressed in the annual reporting. FINANCIALS Disclosure Page Governance SUSTAINABILITY INDICES a) Describe the Board's oversight of climate-related risks and opportunities 44, 55-56, 68-72 GRI content index b) Describe the Management's role in assessing and managing climate-related risks and opportunities 44, 55-56, 68-72 PRB content index Strategy a) Describe the climate-related risks and opportunities the organisation has identified over the short, medium and long-term 10-11, 37-46 TCFD disclosure index b) Describe the impact of climate-related risks and opportunities on the organisation's business, strategy, and financial planning 10-11, 14, 37-46 c) Describe the resilience of the organisation's strategy, taking into consideration different climate-related scenarios, including a 2°C or lower scenario Risk management a) Describe the organisation's process for identifying and assessing climate-related risks 42 b) Describe the organisation's process for managing climate-related risks 46, 91 c) Describe how processes for identifying, assessing and managing climate-related risks are integrated into the organisation's overall risk management Note 2 Metrics and targets a) Disclose the metrics used by the organisation to assess climate-related risks and opportunities in line with its strategy and risk management process 37-45, 47-50 b) Disclose Scope 1, Scope 2, and, if appropriate, Scope 3 greenhouse gas emissions, and the related risks 37-45, 47-50 c) Describe the targets used by the organisation to manage climate-related risks and opportunities and performance against targets 39, 47-49
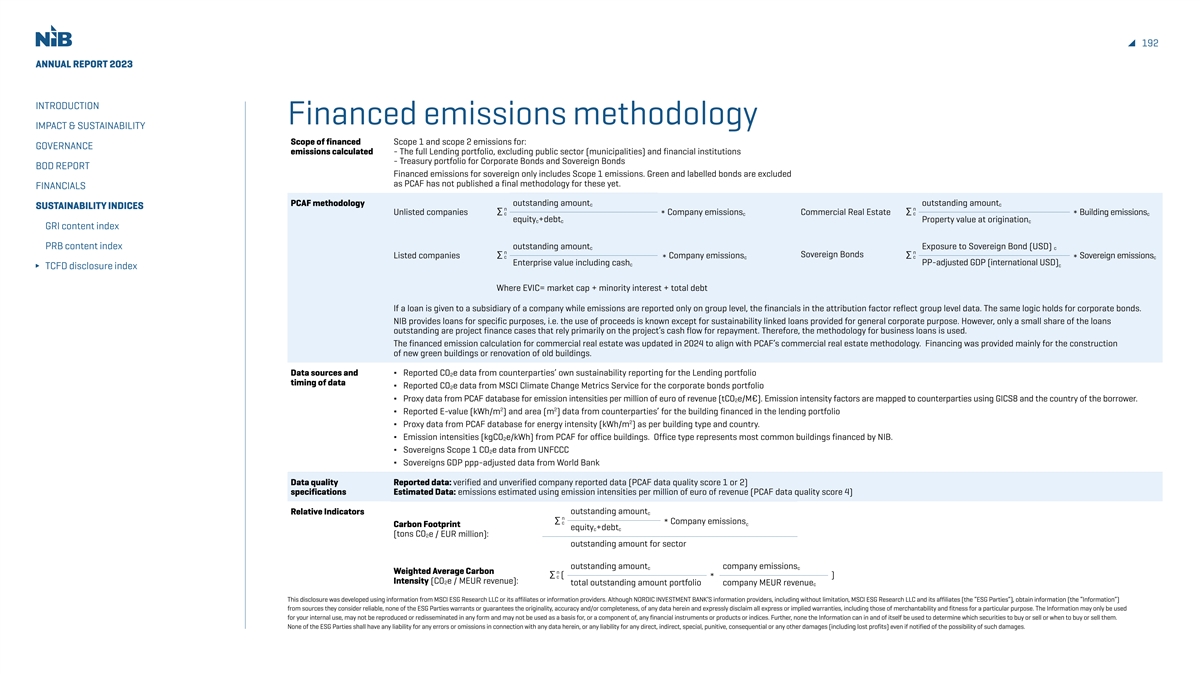
192 ANNUAL REPORT 2023 INTRODUCTION Financed emissions methodology IMPACT & SUSTAINABILITY Scope of financed Scope 1 and scope 2 emissions for: GOVERNANCE emissions calculated - The full Lending portfolio, excluding public sector (municipalities) and financial institutions - Treasury portfolio for Corporate Bonds and Sovereign Bonds BOD REPORT Financed emissions for sovereign only includes Scope 1 emissions. Green and labelled bonds are excluded as PCAF has not published a final methodology for these yet. FINANCIALS PCAF methodology outstanding amountc outstanding amountc SUSTAINABILITY INDICES Unlisted companies Company emissionsc Commercial Real Estate Building emissionsc * * equity +debt Property value at origination c c c GRI content index PRB content index outstanding amount Exposure to Sovereign Bond (USD) c c Sovereign Bonds Listed companies Company emissions Sovereign emissions c c * * Enterprise value including cash PP-adjusted GDP (international USD) c c TCFD disclosure index Where EVIC= market cap + minority interest + total debt If a loan is given to a subsidiary of a company while emissions are reported only on group level, the financials in the attribution factor reflect group level data. The same logic holds for corporate bonds. NIB provides loans for specific purposes, i.e. the use of proceeds is known except for sustainability linked loans provided for general corporate purpose. However, only a small share of the loans outstanding are project finance cases that rely primarily on the project’s cash flow for repayment. Therefore, the methodology for business loans is used. The financed emission calculation for commercial real estate was updated in 2024 to align with PCAF’s commercial real estate methodology. Financing was provided mainly for the construction of new green buildings or renovation of old buildings. Data sources and ∆ Reported CO2e data from counterparties’ own sustainability reporting for the Lending portfolio timing of data ∆ Reported CO e data from MSCI Climate Change Metrics Service for the corporate bonds portfolio 2 ∆ Proxy data from PCAF database for emission intensities per million of euro of revenue (tCO e/M€). Emission intensity factors are mapped to counterparties using GICS8 and the country of the borrower. 2 2 2 ∆ Reported E-value (kWh/m ) and area (m ) data from counterparties’ for the building financed in the lending portfolio 2 ∆ Proxy data from PCAF database for energy intensity (kWh/m ) as per building type and country. ∆ Emission intensities (kgCO e/kWh) from PCAF for office buildings. Office type represents most common buildings financed by NIB. 2 ∆ Sovereigns Scope 1 CO2e data from UNFCCC ∆ Sovereigns GDP ppp-adjusted data from World Bank Data quality Reported data: verified and unverified company reported data (PCAF data quality score 1 or 2) specifications Estimated Data: emissions estimated using emission intensities per million of euro of revenue (PCAF data quality score 4) Relative Indicators outstanding amount c Company emissions * c Carbon Footprint equity +debt c c (tons CO e / EUR million): 2 outstanding amount for sector outstanding amount company emissions c c Weighted Average Carbon ( ) * Intensity (CO e / MEUR revenue): 2 total outstanding amount portfolio company MEUR revenue c This disclosure was developed using information from MSCI ESG Research LLC or its affiliates or information providers. Although NORDIC INVESTMENT BANK’S information providers, including without limitation, MSCI ESG Research LLC and its affiliates (the “ESG Parties”), obtain information (the “Information”) from sources they consider reliable, none of the ESG Parties warrants or guarantees the originality, accuracy and/or completeness, of any data herein and expressly disclaim all express or implied warranties, including those of merchantability and fitness for a particular purpose. The Information may only be used for your internal use, may not be reproduced or redisseminated in any form and may not be used as a basis for, or a component of, any financial instruments or products or indices. Further, none the Information can in and of itself be used to determine which securities to buy or sell or when to buy or sell them. None of the ESG Parties shall have any liability for any errors or omissions in connection with any data herein, or any liability for any direct, indirect, special, punitive, consequential or any other damages (including lost profits) even if notified of the possibility of such damages.
193 ANNUAL REPORT 2023 INTRODUCTION Glossary IMPACT & SUSTAINABILITY GOVERNANCE BOD REPORT A EIR Effective interest rate ISSB International Sustainability PD Probability of Default ALR Asset, Liability, and Risk EL Expected Loss Standards Board PRI Principles for Responsible Investment FINANCIALS EMTN Euro Medium Term Note (Program) IT Information technology PRB Principles for Responsible Banking SUSTAINABILITY INDICES B EMU Monetary union of the EU BREEAM Building Research Establishment ESG Environmental, Social and Governance K R Environmental Assessment Method ESRS European Sustainability Reporting KPIs Key Performance Indicators RAS Risk Appetite Statement BOD Board of Directors Standards RMP Risk Management Policy BOG Board of Governors EU European Union L BPV Basis Point Value EXCO Executive Committee LEED Leadership in Energy and S Environmental Design SBTi Science Based Targets initiative C G LCR Liquidity Coverage Ratio SBTN Science Based Targets network CC Control Committee GHG Greenhouse gas LGD Loss Given Default SC Substantial Contribution CCO Chief Compliance Officer GRI Global Reporting Initiative SDGs Sustainable Development Goals CEO Chief Executive Officer GMRA Global Master Repurchase Agreement M SICR Significant increase in credit risk CFO Chief Financial Officer MREL Minimum required eligible liabilities SLLs Sustainability-linked Loans CODM Chief Operating Decision Maker H MSS Minimum Social Safeguards SMEs Small and medium sized enterprises CRO Chief Risk Officer HQLA High Quality Liquid Assets CSA Credit Support Annex N T I NDF Nordic Development Bank TCFD Task Force on Climate-related D ICAAP Internal Capital Adequacy NEFCO Nordic Environmental Finance Financial Disclosures DNSH Do No Significant Harm Assessment Process Corporation TNFD Taskforce on Nature-related ILAAP Internal Liquidity Adequacy NIB the Nordic Investment Bank Financial Disclosures E Assessment Process NEB NIB Environmental Bond TSC Technical Screening Criteria EAD Exposure at Default ICMA International Capital Markets NSFR Net Stable Funding Ratio ECL Expected Credit Losses Association U ECP Euro Commercial Paper (Program) ICO Integrity & Compliance Office O USMTN United States medium term note EDI Equality, Diversity and Inclusion IFI International Financial Institution OCI Other comprehensive income EDW Enterprise Data Warehouse IFRS International Financial W EEA European Economic Area Reporting Standards P WACI Weighted average carbon intensity EFTA European Free Trade Association ISDA International Swaps and PCAF Partnership for Carbon EIA Environmental Impact Assessment Derivatives Association Accounting Financials

CONTACT Kim Skov Jensen Jens Hellerup Luca De Lorenzo Jukka Ahonen Vice President & CFO Senior Director, Senior Director, Senior Director, kim.jensen@nib.int Head of Funding Head of Sustainability Head of Communications & Investor Relations & Mandate jukka.ahonen@nib.int jens.hellerup@nib.int luca.delorenzo@nib.int For more information about the Nordic Investment Bank, visit www.nib.int