
Exhibit VIII Interim Management Statement January –March ( ) Q1 2024 Unaudited
INTERIM MANAGEMENT STATEMENT / 1 Table of contents 2 President and CEO's comments 3 Key figures and ratios 4 Operating and financial review 4 Total comprehensive income 7 Financial position 9 Financial statements 9 Statement of comprehensive income 10 Statement of financial position 12 Statement of changes in equity The Board of Governors of 13 Cash flow statement NIB held its annual meeting in Tallinn. They agreed to 15 Notes to the interim financial statements distribute EUR 63 million 15 Note 1 - Net interest income as dividends to the owner 15 Note 2 - Net profit/loss on financial operations countries and discussed with stakeholders how NIB 16 Note 3 - Expected credit loss can best assist the region 16 Note 4 - Net loan losses and deliver on the priorities 17 Note 5 - Lending outstanding of its owners. 17 Note 6 - Debts evidenced by certificates 18 Note 7 - Basis of preparation 18 Ratio definitions
INTERIM MANAGEMENT STATEMENT / 2 President and CEO’s comments The strong financial performance NIB saw in 2023 continued into 2024 with 26% higher quarterly net profit than for the same period in 2023. Although the Bank is mission-driven, capital accumulation is crucial in order to create the foundation to fulfil the Bank’s mandate and make an impact in the member countries in the future. I am pleased to say, that demand for NIB lending remains strong with close to EUR 1 billion in new lending signed so far in 2024 and with a 100% mandate fulfilment. In March, we held our annual meeting in Tallinn. This was the first physical meeting in years, reflecting the desire of the Nordic and Baltic countries to further strengthen cooperation in the current geopolitical reality. For NIB, it is important to identify the priorities of our owners. Therefore, it was very rewarding to be able to meet our Board of Governors in person to discuss how the Bank can best assist its member countries. At the meeting, the Board of Governors of NIB approved the Bank’s audited financial statements for 2023 and a dividend payment of EUR 63 million to the Nordic and Baltic member countries. The Governors also issued a statement calling for the Bank to maximise its contribution for climate and nature, productivity guarantee now extends across all Nordic and Baltic member countries of NIB. This expansion enables us and innovation, as well as the security and resilience of the Nordic-Baltic region. The statement in full can to enhance our financing activities, particularly in driving the green transition. The Bank signed its first be found here. InvestEU loans at the end of 2023 and the first disbursements occurred in the first quarter of 2024. Further information on InvestEU can be found here. In the first quarter, a total of EUR 643 million was disbursed. The disbursed loans were distributed across various sectors and countries, more details of which can be found here. Total assets at the end of the To meet the demand for our financing, the Bank has raised EUR 4 billion in new funding so far in 2024. On quarter amounted to EUR 42 billion which is the same as at 31 March 2023. The total lending outstanding 21 February, NIB priced a five-year USD 1.5 billion global benchmark bond, its first USD benchmark of the amounted to EUR 22 billion at 31 March 2024 which is also comparable. year. The issue had a final orderbook of more than USD 4.5 billion, the largest ever for NIB. The threefold oversubscription demonstrates strong global trust in the Bank's strong financial position. The net profit for the period January to March amounted to EUR 82 million compared to EUR 65 million in 2023. The increase in net profit is mainly due to higher net interest income and unrealised profits on Looking forward, NIB remains committed to maximise its contribution to a sustainable and prosperous financial operations. Nordic-Baltic region. I would like to conclude by sharing what was also the message from our Governors. The Nordic-Baltic region is stronger together. During the quarter, the European Commission and NIB signed an InvestEU guarantee amendment whereby NIB becomes implementing partner also for Norway and Iceland. With Norway and Iceland joining, the André Küüsvek, President & CEO
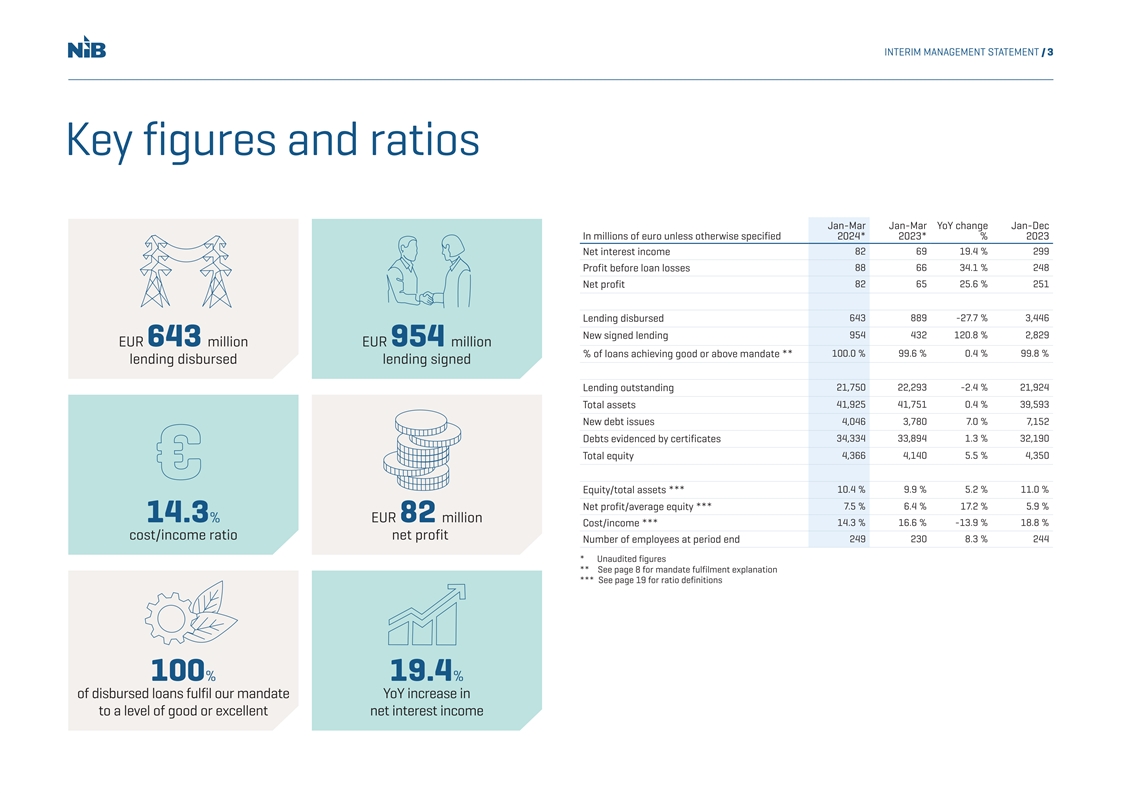
INTERIM MANAGEMENT STATEMENT / 3 Key figures and ratios Jan-Mar Jan-Mar YoY change Jan-Dec In millions of euro unless otherwise specified 2024* 2023* % 2023 Net interest income 82 69 19.4 % 299 88 66 34.1 % 248 Profit before loan losses Net profit 82 65 25.6 % 251 Lending disbursed 643 889 -27.7 % 3,446 New signed lending 954 432 120.8 % 2,829 EUR 643 million EUR 954 million % of loans achieving good or above mandate ** 100.0 % 99.6 % 0.4 % 99.8 % lending disbursed lending signed 21,750 22,293 -2.4 % 21,924 Lending outstanding Total assets 41,925 41,751 0.4 % 39,593 New debt issues 4,046 3,780 7.0 % 7,152 Debts evidenced by certificates 34,334 33,894 1.3 % 32,190 4,366 4,140 5.5 % 4,350 Total equity Equity/total assets *** 10.4 % 9.9 % 5.2 % 11.0 % Net profit/average equity *** 7.5 % 6.4 % 17.2 % 5.9 % 14.3% EUR 82 million Cost/income *** 14.3 % 16.6 % -13.9 % 18.8 % cost/income ratio net profit Number of employees at period end 249 230 8.3 % 244 * Unaudited figures ** See page 8 for mandate fulfilment explanation *** See page 19 for ratio definitions 100% 19.4% of disbursed loans fulfil our mandate YoY increase in to a level of good or excellent net interest income
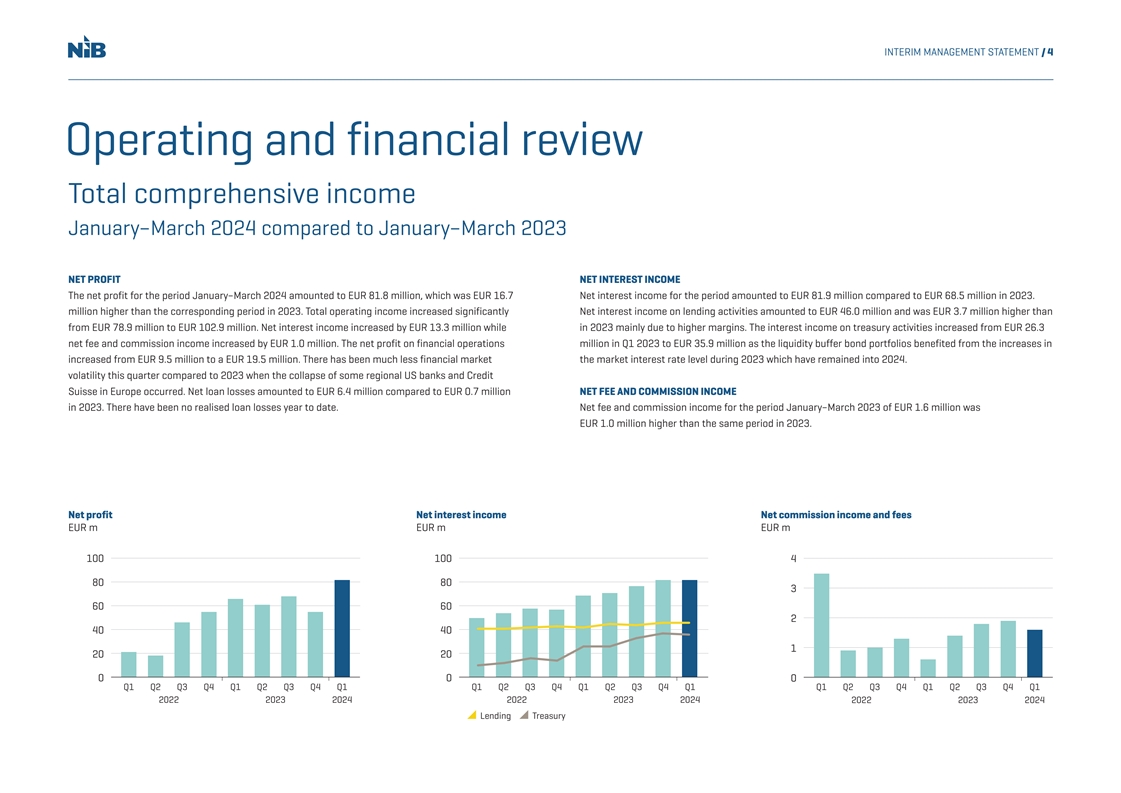
INTERIM MANAGEMENT STATEMENT / 4 Operating and financial review Total comprehensive income January–March 2024 compared to January–March 2023 NET PROFIT NET INTEREST INCOME The net profit for the period January–March 2024 amounted to EUR 81.8 million, which was EUR 16.7 Net interest income for the period amounted to EUR 81.9 million compared to EUR 68.5 million in 2023. million higher than the corresponding period in 2023. Total operating income increased significantly Net interest income on lending activities amounted to EUR 46.0 million and was EUR 3.7 million higher than from EUR 78.9 million to EUR 102.9 million. Net interest income increased by EUR 13.3 million while in 2023 mainly due to higher margins. The interest income on treasury activities increased from EUR 26.3 net fee and commission income increased by EUR 1.0 million. The net profit on financial operations million in Q1 2023 to EUR 35.9 million as the liquidity buffer bond portfolios benefited from the increases in increased from EUR 9.5 million to a EUR 19.5 million. There has been much less financial market the market interest rate level during 2023 which have remained into 2024. volatility this quarter compared to 2023 when the collapse of some regional US banks and Credit Suisse in Europe occurred. Net loan losses amounted to EUR 6.4 million compared to EUR 0.7 million NET FEE AND COMMISSION INCOME in 2023. There have been no realised loan losses year to date. Net fee and commission income for the period January–March 2023 of EUR 1.6 million was EUR 1.0 million higher than the same period in 2023. Net profit Net interest income Net commission income and fees EUR m EUR m EUR m 100 100 4 80 80 3 60 60 2 40 40 1 20 20 0 0 0 Q1 Q2 Q3 Q4 Q1 Q2 Q3 Q4 Q1 Q1 Q2 Q3 Q4 Q1 Q2 Q3 Q4 Q1 Q1 Q2 Q3 Q4 Q1 Q2 Q3 Q4 Q1 2022 2023 2024 2022 2023 2024 2022 2023 2024 Lending T reasury

INTERIM MANAGEMENT STATEMENT / 5 NET PROFIT/LOSS ON FINANCIAL OPERATIONS The net profit on financial operations for the first quarter amounted to EUR 19.5 million compared to EUR Bank intends to hold these hedging transactions to maturity these valuation gains and losses are expected 9.5 million in the same period last year. The result comprised of unrealised profits of EUR 19.4 million and to reverse in full. realised gains of EUR 0.2 million compared to EUR 9.4 million and EUR 0.9 million respectively in 2023. Financial markets have been calm with positive equity markets and tightening of credit spreads compared TOTAL OPERATING EXPENSES to the volatility experienced during the first quarter of 2023 as inflation levels have come down and with Total operating expenses amounted to EUR 14.8 million which is EUR 1.7 million higher than for the some expectation for central bank rate cuts in 2024. corresponding period in 2023. The Bank continues to invest in people and technology in order to remain relevant and fulfil the Bank's mandate. It should be noted that even with the increase in cost the Bank's Unrealised valuation gains and losses on assets in the Bank’s liquidity portfolio of high quality bonds arise cost/income ratio improved and costs in Q1 were less than planned. The Bank's main expenses comprise from changes in credit spreads. When credit spreads tighten as in Q1, this results in positive valuations on personnel costs, cost related to IT and depreciation. Personnel costs of EUR 9.3 million were EUR 0.6 the bonds. When the Bank holds the bonds to maturity, so that they are not sold based on the current exit million higher in Q1 2024 compared to Q1 2023 due to the annual salary adjustments and a higher head market value, any valuation gains and losses are expected to reverse, as the bonds will settle at par. count. The other operating expenses were EUR 1.1 million higher in the first quarter of 2024 compared to the same period in 2023, due to increased depreciation when some assets became operational, increased Other unrealised valuation gains and losses relates to the interest rate hedges of the Bank’s funding and development activity and inflationary pressures in some cost types. lending transactions. When the Bank raises funds with fixed rates or offers borrowers fixed rate loans, it hedges the resulting interest rate risk using swaps, in which the fixed rate is swapped to short term money market floating rates. The valuation of the swaps and underlying transactions use different rates which gives rise to unrealised valuation gains and losses when the spread between those rates changes. As the Net profit/loss on financial operations Personnel expenses Other operating expenses EUR m EUR m EUR m 30 0 0 20 -2 -2 10 -4 -4 0 -6 -6 -8 -10 -8 -10 -20 -12 -10 -30 Q1 Q2 Q3 Q4 Q1 Q2 Q3 Q4 Q1 Q1 Q2 Q3 Q4 Q1 Q2 Q3 Q4 Q1 Q1 Q2 Q3 Q4 Q1 Q2 Q3 Q4 Q1 2022 2023 2024 2022 2023 2024 2022 2023 2024 Realised Unrealised
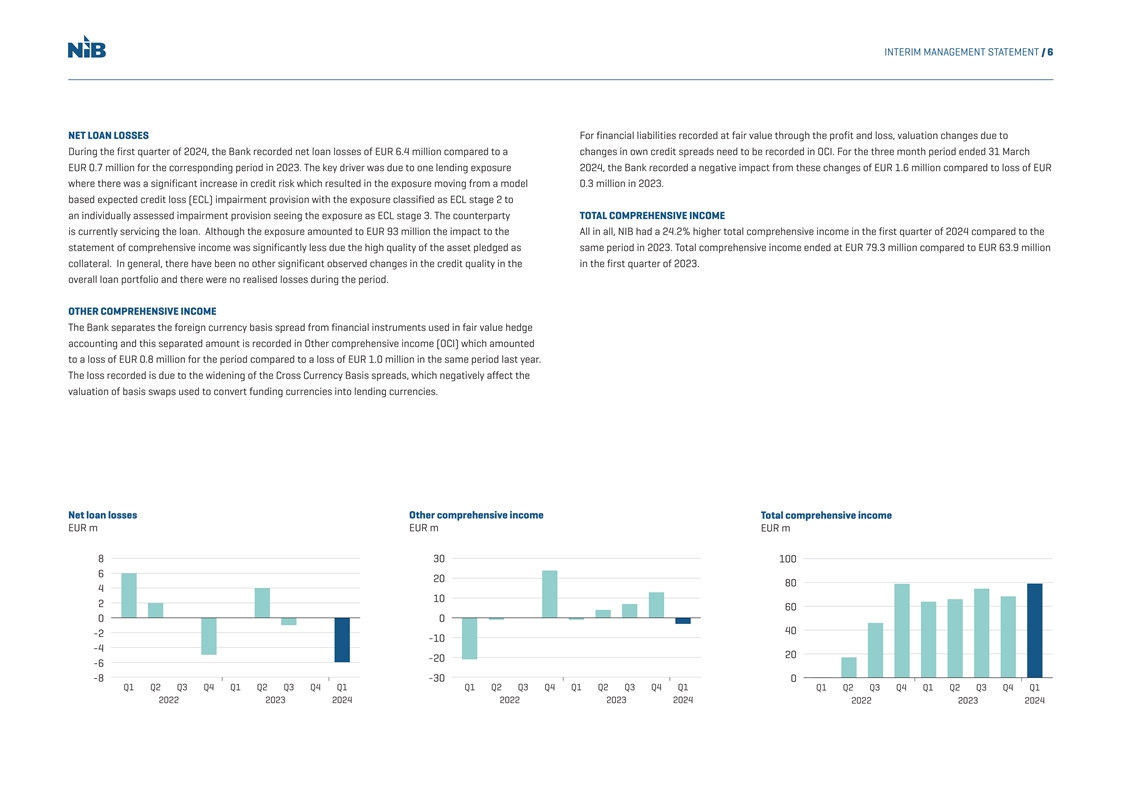
INTERIM MANAGEMENT STATEMENT / 6 NET LOAN LOSSES For financial liabilities recorded at fair value through the profit and loss, valuation changes due to During the first quarter of 2024, the Bank recorded net loan losses of EUR 6.4 million compared to a changes in own credit spreads need to be recorded in OCI. For the three month period ended 31 March EUR 0.7 million for the corresponding period in 2023. The key driver was due to one lending exposure 2024, the Bank recorded a negative impact from these changes of EUR 1.6 million compared to loss of EUR where there was a significant increase in credit risk which resulted in the exposure moving from a model 0.3 million in 2023. based expected credit loss (ECL) impairment provision with the exposure classified as ECL stage 2 to an individually assessed impairment provision seeing the exposure as ECL stage 3. The counterparty TOTAL COMPREHENSIVE INCOME is currently servicing the loan. Although the exposure amounted to EUR 93 million the impact to the All in all, NIB had a 24.2% higher total comprehensive income in the first quarter of 2024 compared to the statement of comprehensive income was significantly less due the high quality of the asset pledged as same period in 2023. Total comprehensive income ended at EUR 79.3 million compared to EUR 63.9 million collateral. In general, there have been no other significant observed changes in the credit quality in the in the first quarter of 2023. overall loan portfolio and there were no realised losses during the period. OTHER COMPREHENSIVE INCOME The Bank separates the foreign currency basis spread from financial instruments used in fair value hedge accounting and this separated amount is recorded in Other comprehensive income (OCI) which amounted to a loss of EUR 0.8 million for the period compared to a loss of EUR 1.0 million in the same period last year. The loss recorded is due to the widening of the Cross Currency Basis spreads, which negatively affect the valuation of basis swaps used to convert funding currencies into lending currencies. Net loan losses Other comprehensive income Total comprehensive income EUR m EUR m EUR m 8 30 100 6 20 80 4 10 2 60 0 0 40 -2 -10 -4 20 -20 -6 -8 -30 0 Q1 Q2 Q3 Q4 Q1 Q2 Q3 Q4 Q1 Q1 Q2 Q3 Q4 Q1 Q2 Q3 Q4 Q1 Q1 Q2 Q3 Q4 Q1 Q2 Q3 Q4 Q1 2022 2023 2024 2022 2023 2024 2022 2023 2024
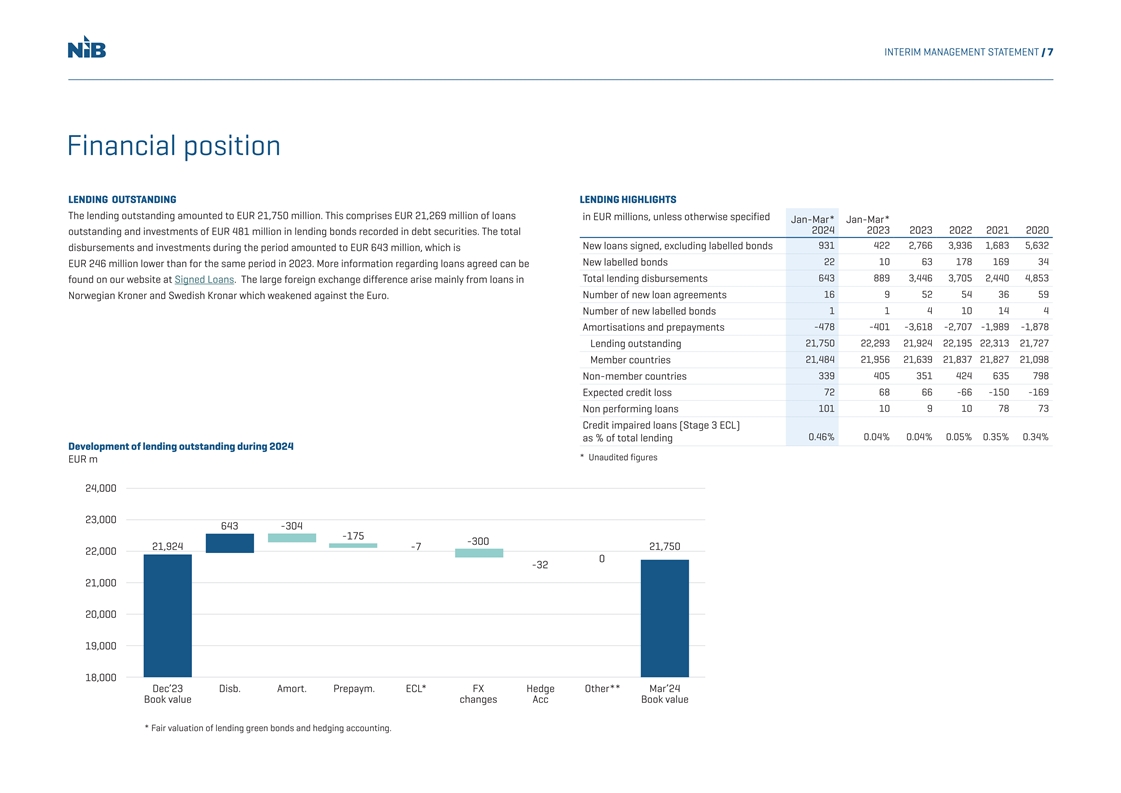
INTERIM MANAGEMENT STATEMENT / 7 Financial position LENDING OUTSTANDING LENDING HIGHLIGHTS The lending outstanding amounted to EUR 21,750 million. This comprises EUR 21,269 million of loans in EUR millions, unless otherwise specified Jan-Mar* Jan-Mar* 2024 2023 2023 2022 2021 2020 outstanding and investments of EUR 481 million in lending bonds recorded in debt securities. The total New loans signed, excluding labelled bonds 931 422 2,766 3,936 1,683 5,632 disbursements and investments during the period amounted to EUR 643 million, which is New labelled bonds 22 10 63 178 169 34 EUR 246 million lower than for the same period in 2023. More information regarding loans agreed can be 643 889 3,446 3,705 2,440 4,853 found on our website at Signed Loans. The large foreign exchange difference arise mainly from loans in Total lending disbursements 16 9 52 54 36 59 Norwegian Kroner and Swedish Kronar which weakened against the Euro. Number of new loan agreements Number of new labelled bonds 1 1 4 10 14 4 Amortisations and prepayments -478 -401 -3,618 -2,707 -1,989 -1,878 Lending outstanding 21,750 22,293 21,924 22,195 22,313 21,727 21,484 21,956 21,639 21,837 21,827 21,098 Member countries Non-member countries 339 405 351 424 635 798 Expected credit loss 72 68 66 -66 -150 -169 Non performing loans 101 10 9 10 78 73 Credit impaired loans (Stage 3 ECL) 0.46% 0.04% 0.04% 0.05% 0.35% 0.34% as % of total lending Development of lending outstanding during 2024 * Unaudited figures EUR m 24,000 23,000 643 -304 -175 -300 21,924 -7 21,750 22,000 0 -32 21,000 20,000 19,000 18,000 Dec’23 Disb. Amort. Prepaym. ECL* FX Hedge Other** Mar’24 Book value changes Acc Book value * Fair valuation of lending green bonds and hedging accounting.
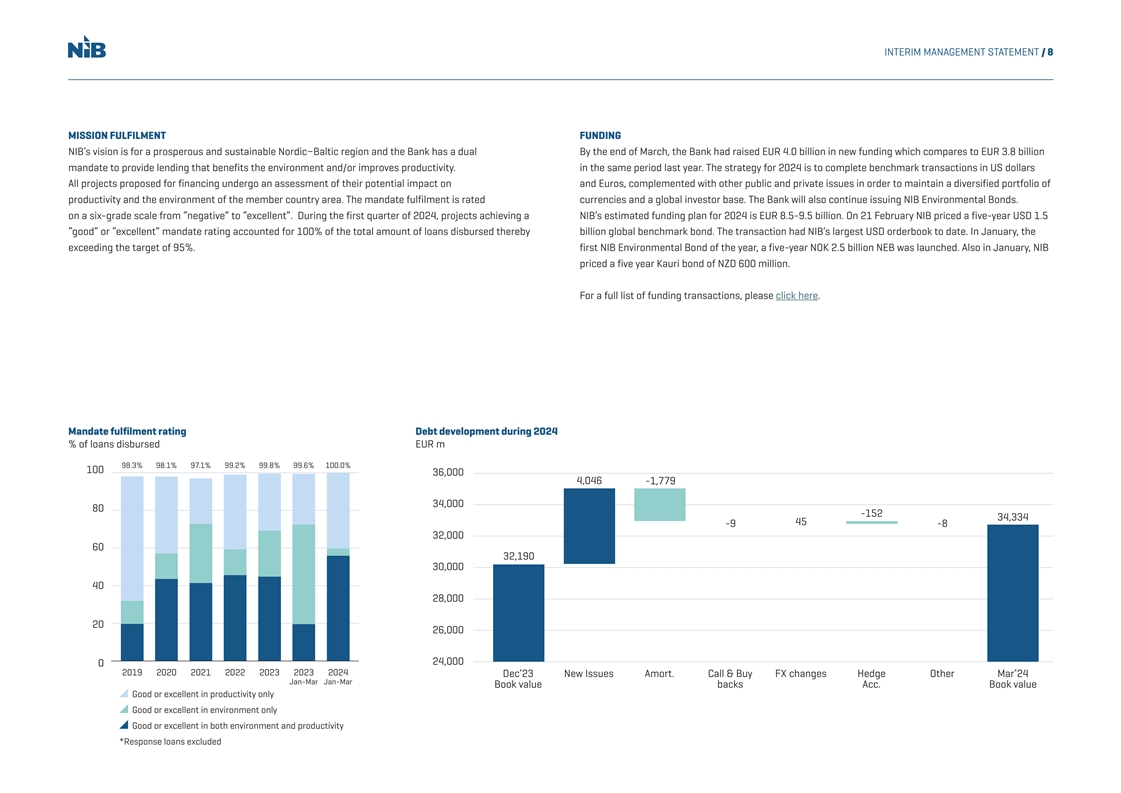
INTERIM MANAGEMENT STATEMENT / 8 MISSION FULFILMENT FUNDING NIB’s vision is for a prosperous and sustainable Nordic−Baltic region and the Bank has a dual By the end of March, the Bank had raised EUR 4.0 billion in new funding which compares to EUR 3.8 billion mandate to provide lending that benefits the environment and/or improves productivity. in the same period last year. The strategy for 2024 is to complete benchmark transactions in US dollars All projects proposed for financing undergo an assessment of their potential impact on and Euros, complemented with other public and private issues in order to maintain a diversified portfolio of productivity and the environment of the member country area. The mandate fulfilment is rated currencies and a global investor base. The Bank will also continue issuing NIB Environmental Bonds. on a six-grade scale from “negative” to “excellent”. During the first quarter of 2024, projects achieving a NIB’s estimated funding plan for 2024 is EUR 8.5-9.5 billion. On 21 February NIB priced a five-year USD 1.5 “good” or “excellent” mandate rating accounted for 100% of the total amount of loans disbursed thereby billion global benchmark bond. The transaction had NIB’s largest USD orderbook to date. In January, the exceeding the target of 95%. first NIB Environmental Bond of the year, a five-year NOK 2.5 billion NEB was launched. Also in January, NIB priced a five year Kauri bond of NZD 600 million. For a full list of funding transactions, please click here. Mandate fulfilment rating Debt development during 2024 % of loans disbursed EUR m 98.3% 98.1% 97.1% 99.2% 99.8% 99.6% 100.0% 100 36,000 4,046 -1,779 34,000 80 -152 34,334 45 -8 -9 32,000 60 32,190 30,000 40 28,000 20 26,000 24,000 0 2019 2020 2021 2022 2023 2023 2024 Dec’23 New Issues Amort. Call & Buy FX changes Hedge Other Mar’24 Jan-Mar Jan-Mar Book value backs Acc. Book value Good or excellent in productivity only Good or excellent in environment only Good or excellent in both environment and productivity *Response loans excluded
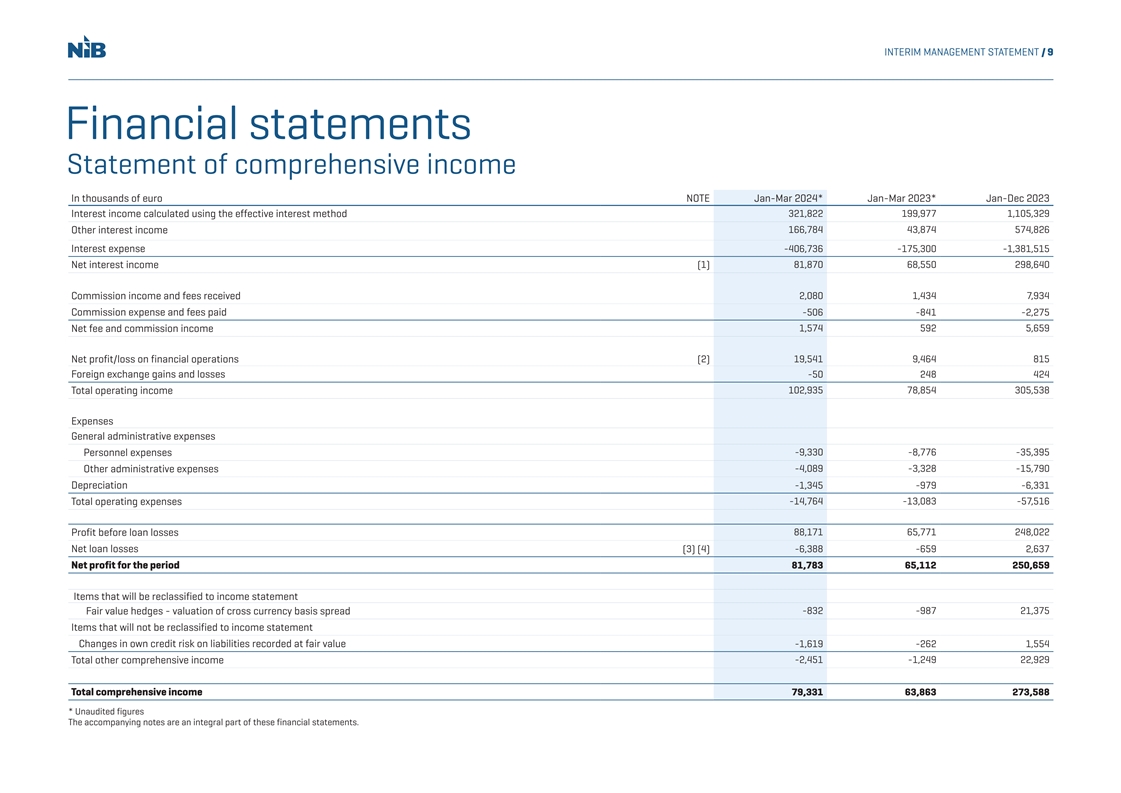
INTERIM MANAGEMENT STATEMENT / 9 Financial statements Statement of comprehensive income In thousands of euro NOTE Jan-Mar 2024* Jan-Mar 2023* Jan-Dec 2023 Interest income calculated using the effective interest method 321,822 199,977 1,105,329 Other interest income 166,784 43,874 574,826 Interest expense -406,736 -175,300 -1,381,515 Net interest income (1) 81,870 68,550 298,640 2,080 1,434 7,934 Commission income and fees received Commission expense and fees paid -506 -841 -2,275 Net fee and commission income 1,574 592 5,659 Net profit/loss on financial operations (2) 19,541 9,464 815 Foreign exchange gains and losses -50 248 424 102,935 78,854 305,538 Total operating income Expenses General administrative expenses Personnel expenses -9,330 -8,776 -35,395 Other administrative expenses -4,089 -3,328 -15,790 Depreciation -1,345 -979 -6,331 Total operating expenses -14,764 -13,083 -57,516 Profit before loan losses 88,171 65,771 248,022 Net loan losses (3) (4) -6,388 -659 2,637 Net profit for the period 81,783 65,112 250,659 Items that will be reclassified to income statement Fair value hedges - valuation of cross currency basis spread -832 -987 21,375 Items that will not be reclassified to income statement Changes in own credit risk on liabilities recorded at fair value -1,619 -262 1,554 Total other comprehensive income -2,451 -1,249 22,929 Total comprehensive income 79,331 63,863 273,588 * Unaudited figures The accompanying notes are an integral part of these financial statements.

INTERIM MANAGEMENT STATEMENT / 10 Statement of financial position In thousands of euro NOTE 31 Mar 2024* 31 Mar 2023* 31 Dec 2023 Assets 4,654,784 3,315,528 1,946,528 Cash and cash equivalents Financial placements Placements with credit institutions 3,657,338 5,157,179 4,338,570 Debt securities 10,128,757 9,161,406 9,886,628 Other 154 4,667 3,614 13,786,249 14,323,252 14,228,812 Loans outstanding (5) 21,268,701 21,865,123 21,455,677 Intangible assets 10,767 9,477 10,297 29,331 32,135 30,064 Tangible assets, property and equipment Other assets Derivatives 1,546,085 1,785,684 1,362,103 Other assets 107,323 37,394 35,510 1,653,408 1,823,077 1,397,613 Accrued interest and fees receivable 521,786 382,154 523,834 Total assets 41,925,026 41,750,746 39,592,824 * Unaudited figures The accompanying notes are an integral part of these financial statements.
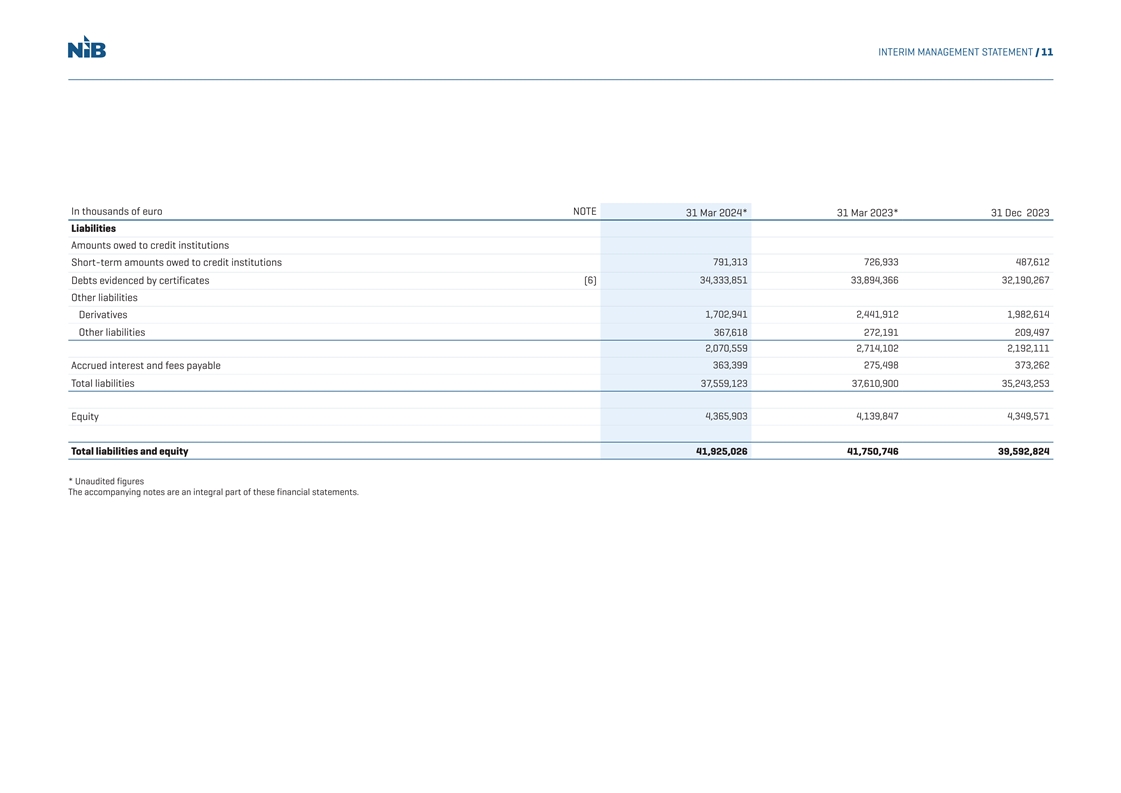
INTERIM MANAGEMENT STATEMENT / 11 In thousands of euro NOTE 31 Mar 2024* 31 Mar 2023* 31 Dec 2023 Liabilities Amounts owed to credit institutions Short-term amounts owed to credit institutions 791,313 726,933 487,612 Debts evidenced by certificates (6) 34,333,851 33,894,366 32,190,267 Other liabilities 1,702,941 2,441,912 1,982,614 Derivatives Other liabilities 367,618 272,191 209,497 2,070,559 2,714,102 2,192,111 Accrued interest and fees payable 363,399 275,498 373,262 Total liabilities 37,559,123 37,610,900 35,243,253 Equity 4,365,903 4,139,847 4,349,571 Total liabilities and equity 41,925,026 41,750,746 39,592,824 * Unaudited figures The accompanying notes are an integral part of these financial statements.
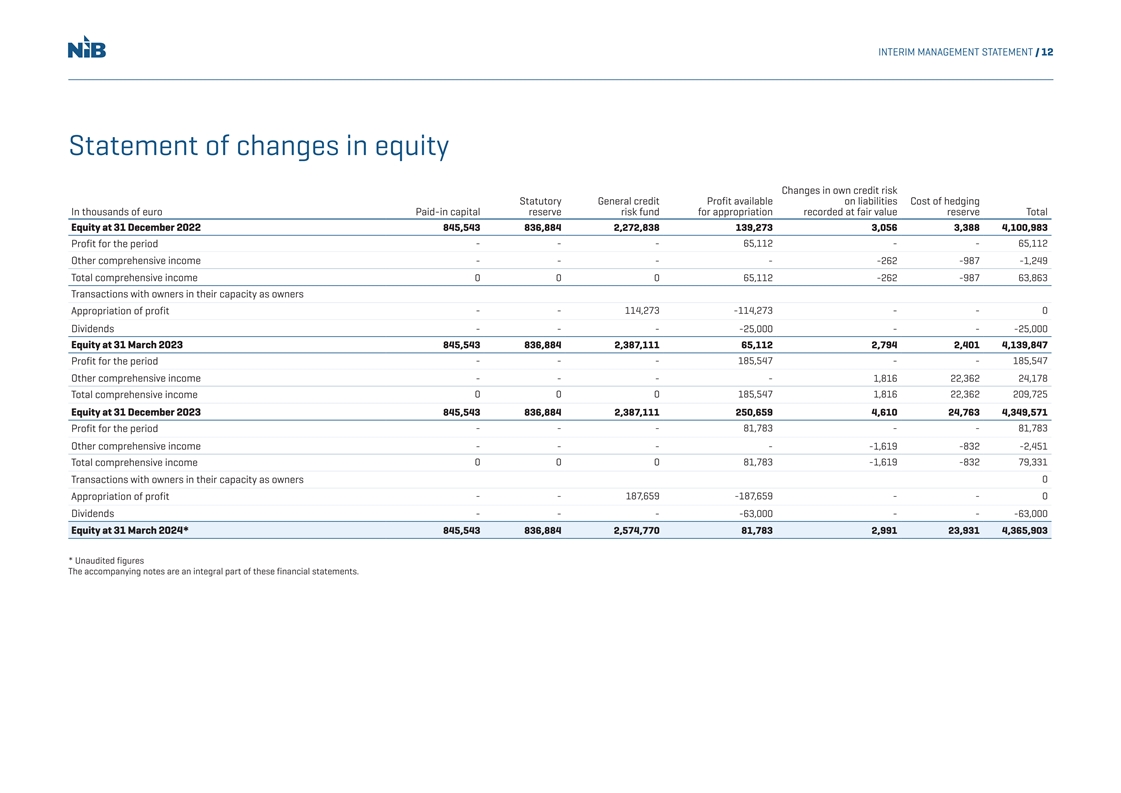
INTERIM MANAGEMENT STATEMENT / 12 Statement of changes in equity Changes in own credit risk Statutory General credit Profit available on liabilities Cost of hedging In thousands of euro Paid-in capital reserve risk fund for appropriation recorded at fair value reserve Total Equity at 31 December 2022 845,543 836,884 2,272,838 139,273 3,056 3,388 4,100,983 Profit for the period - - - 65,112 - - 65,112 Other comprehensive income - - - - -262 -987 -1,249 Total comprehensive income 0 0 0 65,112 -262 -987 63,863 Transactions with owners in their capacity as owners Appropriation of profit - - 114,273 -114,273 - - 0 Dividends - - - -25,000 - - -25,000 Equity at 31 March 2023 845,543 836,884 2,387,111 65,112 2,794 2,401 4,139,847 - - - 185,547 - - 185,547 Profit for the period Other comprehensive income - - - - 1,816 22,362 24,178 0 0 0 185,547 1,816 22,362 209,725 Total comprehensive income Equity at 31 December 2023 845,543 836,884 2,387,111 250,659 4,610 24,763 4,349,571 Profit for the period - - - 81,783 - - 81,783 Other comprehensive income - - - - -1,619 -832 -2,451 0 0 0 81,783 -1,619 -832 79,331 Total comprehensive income Transactions with owners in their capacity as owners 0 Appropriation of profit - - 187,659 -187,659 - - 0 Dividends - - - -63,000 - - -63,000 Equity at 31 March 2024* 845,543 836,884 2,574,770 81,783 2,991 23,931 4,365,903 * Unaudited figures The accompanying notes are an integral part of these financial statements.

INTERIM MANAGEMENT STATEMENT / 13 Cash flow statement In thousands of euro Jan-Mar 2024* Jan-Mar 2023* Jan-Dec 2022 Cash flows from operating activities 81,783 65,112 250,659 Net profit for the period Adjustments: Unrealised gains/losses of financial assets and liabilities measured at fair value -6,717 -5,283 -305 ECL non-lending activities -30 -483 -180 1,345 979 6,331 Depreciation and write-down in value of tangible and intangible assets Change in accrued interest and fees (assets) 2,304 -47,239 -210,830 3,741 2,134 159,374 Change in accrued interest and fees (liabilities) Net loan losses (ECL lending activities) 6,388 659 -2,637 Hedge accounting ineffectiveness -12,638 -3,658 2,066 Other adjustments to the period´s profit -2,038 -7,482 -9,160 -7,647 -60,374 -55,342 Adjustments, total Lending Disbursements of loans -620,161 -879,196 -3,383,078 Repayments of loans 478,137 367,460 3,552,531 Change in swaps hedging lending excluding fair value changes -20 -5 72 Lending, total -142,043 -511,741 169,525 Cash flows from operating activities, total -67,907 -507,003 364,842 Cash flows from investing activities Placements and debt securities Purchase of debt securities -781,966 -1,003,575 -3,243,342 577,444 601,296 2,229,503 Sold and/or matured debt securities -3,272,439 -4,604,084 -11,078,704 Placements with credit institutions Sold and/or matured placements with credit institutions 3,843,431 3,916,095 11,309,088 Other financial placements 3,583 702 872 Placements and debt securities, total 370,053 -1,089,566 -782,582 * Unaudited figures The accompanying notes are an integral part of these financial statements.
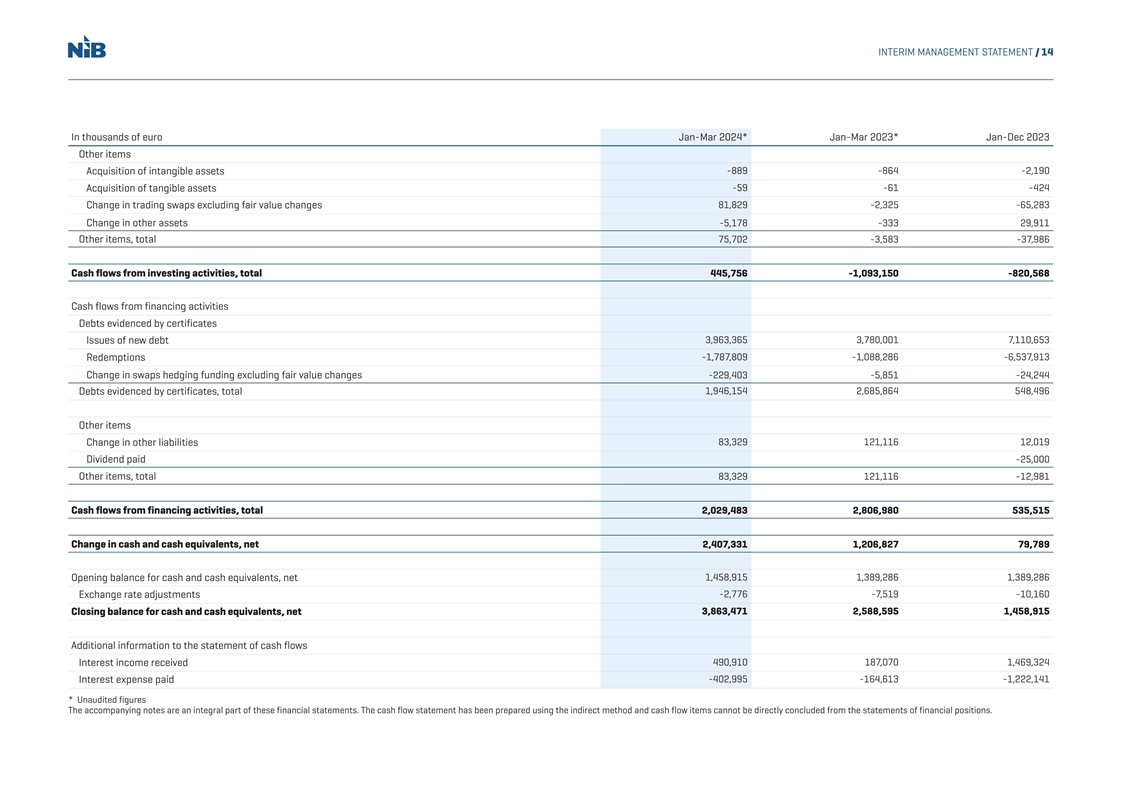
INTERIM MANAGEMENT STATEMENT / 14 In thousands of euro Jan-Mar 2024* Jan-Mar 2023* Jan-Dec 2023 Other items Acquisition of intangible assets -889 -864 -2,190 -59 -61 -424 Acquisition of tangible assets Change in trading swaps excluding fair value changes 81,829 -2,325 -65,283 Change in other assets -5,178 -333 29,911 Other items, total 75,702 -3,583 -37,986 Cash flows from investing activities, total 445,756 -1,093,150 -820,568 Cash flows from financing activities Debts evidenced by certificates Issues of new debt 3,963,365 3,780,001 7,110,653 -1,787,809 -1,088,286 -6,537,913 Redemptions Change in swaps hedging funding excluding fair value changes -229,403 -5,851 -24,244 Debts evidenced by certificates, total 1,946,154 2,685,864 548,496 Other items 83,329 121,116 12,019 Change in other liabilities Dividend paid -25,000 Other items, total 83,329 121,116 -12,981 Cash flows from financing activities, total 2,029,483 2,806,980 535,515 Change in cash and cash equivalents, net 2,407,331 1,206,827 79,789 Opening balance for cash and cash equivalents, net 1,458,915 1,389,286 1,389,286 -2,776 -7,519 -10,160 Exchange rate adjustments 3,863,471 2,588,595 1,458,915 Closing balance for cash and cash equivalents, net Additional information to the statement of cash flows 490,910 187,070 1,469,324 Interest income received -402,995 -164,613 -1,222,141 Interest expense paid * Unaudited figures The accompanying notes are an integral part of these financial statements. The cash flow statement has been prepared using the indirect method and cash flow items cannot be directly concluded from the statements of financial positions.
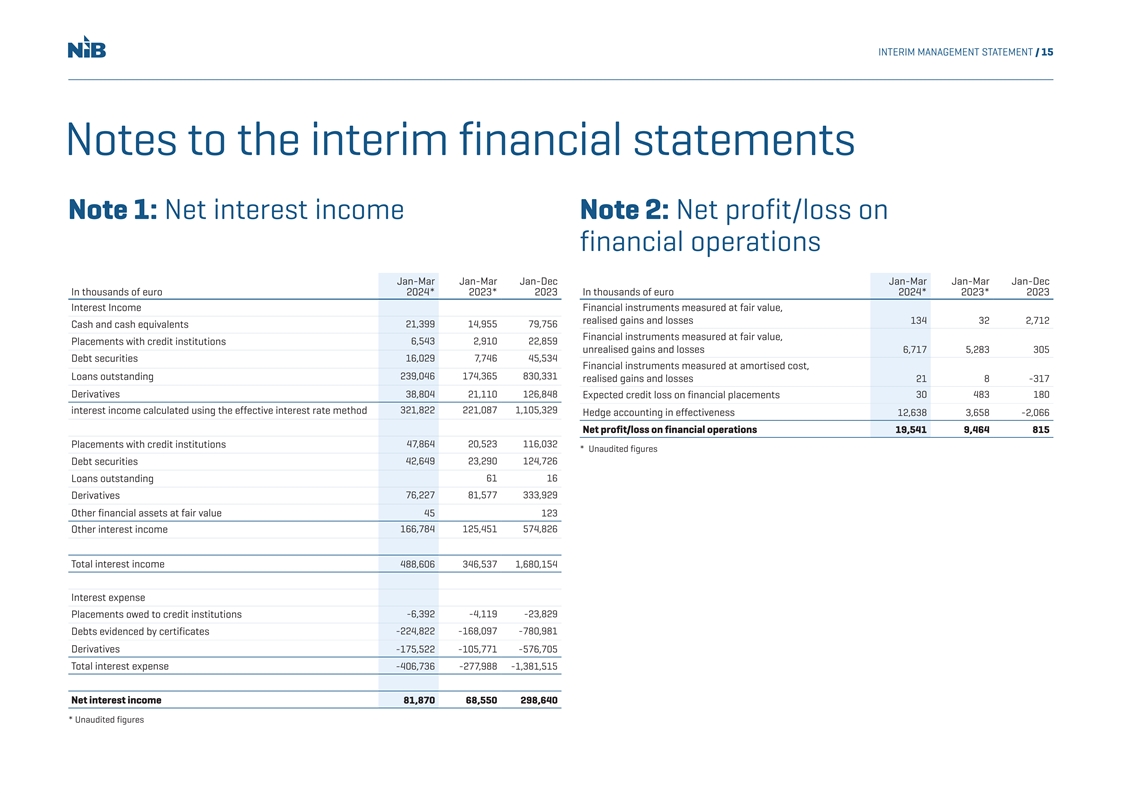
INTERIM MANAGEMENT STATEMENT / 15 Notes to the interim financial statements Note 1: Net interest income Note 2: Net profit/loss on financial operations Jan-Mar Jan-Mar Jan-Dec Jan-Mar Jan-Mar Jan-Dec In thousands of euro 2024* 2023* 2023 In thousands of euro 2024* 2023* 2023 Interest Income Financial instruments measured at fair value, realised gains and losses 134 32 2,712 Cash and cash equivalents 21,399 14,955 79,756 Financial instruments measured at fair value, 6,543 2,910 22,859 Placements with credit institutions unrealised gains and losses 6,717 5,283 305 16,029 7,746 45,534 Debt securities Financial instruments measured at amortised cost, Loans outstanding 239,046 174,365 830,331 realised gains and losses 21 8 -317 Derivatives 38,804 21,110 126,848 30 483 180 Expected credit loss on financial placements 321,822 221,087 1,105,329 interest income calculated using the effective interest rate method Hedge accounting in effectiveness 12,638 3,658 -2,066 Net profit/loss on financial operations 19,541 9,464 815 Placements with credit institutions 47,864 20,523 116,032 * Unaudited figures Debt securities 42,649 23,290 124,726 61 16 Loans outstanding Derivatives 76,227 81,577 333,929 Other financial assets at fair value 45 123 Other interest income 166,784 125,451 574,826 Total interest income 488,606 346,537 1,680,154 Interest expense -6,392 -4,119 -23,829 Placements owed to credit institutions Debts evidenced by certificates -224,822 -168,097 -780,981 Derivatives -175,522 -105,771 -576,705 Total interest expense -406,736 -277,988 -1,381,515 Net interest income 81,870 68,550 298,640 * Unaudited figures
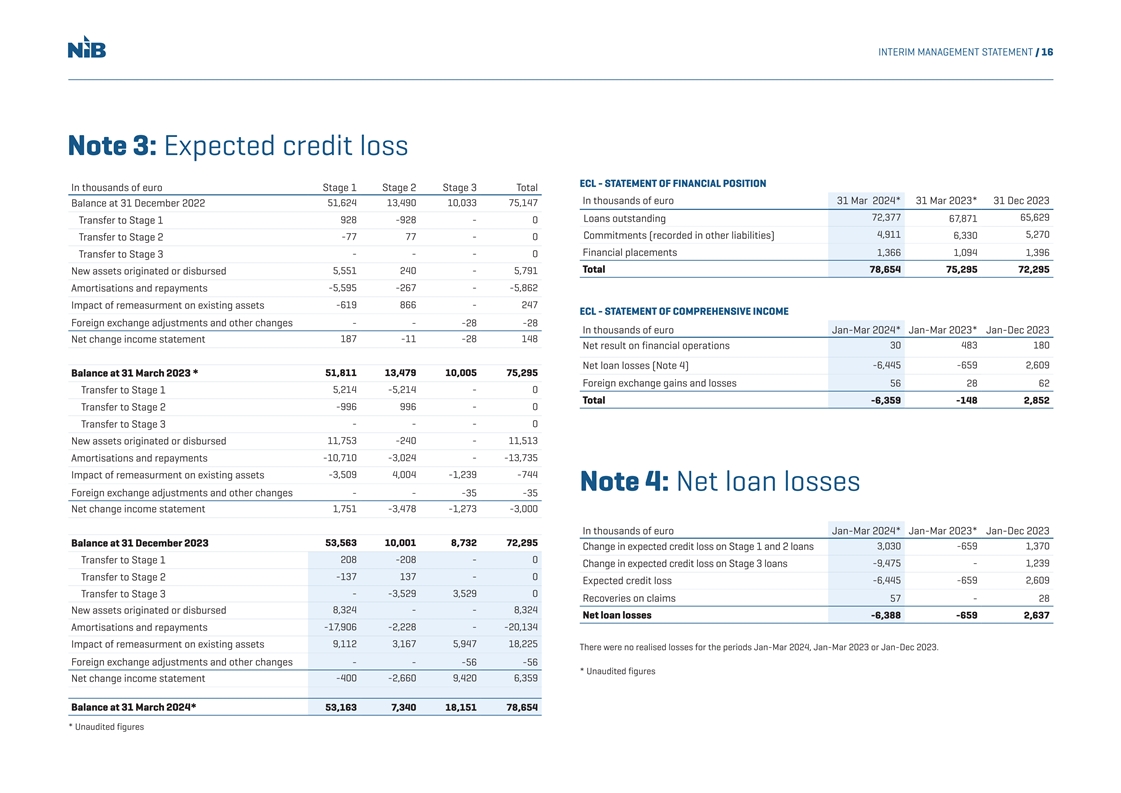
INTERIM MANAGEMENT STATEMENT / 16 Note 3: Expected credit loss ECL - STATEMENT OF FINANCIAL POSITION In thousands of euro Stage 1 Stage 2 Stage 3 Total In thousands of euro 31 Mar 2024* 31 Mar 2023* 31 Dec 2023 Balance at 31 December 2022 51,624 13,490 10,033 75,147 Loans outstanding 72,377 67,871 65,629 928 -928 - 0 Transfer to Stage 1 4,911 5,270 Commitments (recorded in other liabilities) 6,330 -77 77 - 0 Transfer to Stage 2 Financial placements 1,366 1,094 1,396 Transfer to Stage 3 - - - 0 Total 78,654 75,295 72,295 New assets originated or disbursed 5,551 240 - 5,791 -5,595 -267 - -5,862 Amortisations and repayments -619 866 - 247 Impact of remeasurment on existing assets ECL - STATEMENT OF COMPREHENSIVE INCOME Foreign exchange adjustments and other changes - - -28 -28 In thousands of euro Jan-Mar 2024* Jan-Mar 2023* Jan-Dec 2023 Net change income statement 187 -11 -28 148 Net result on financial operations 30 483 180 Net loan losses (Note 4) -6,445 -659 2,609 51,811 13,479 10,005 75,295 Balance at 31 March 2023 * Foreign exchange gains and losses 56 28 62 Transfer to Stage 1 5,214 -5,214 - 0 Total -6,359 -148 2,852 Transfer to Stage 2 -996 996 - 0 - - - 0 Transfer to Stage 3 11,753 -240 - 11,513 New assets originated or disbursed Amortisations and repayments -10,710 -3,024 - -13,735 Impact of remeasurment on existing assets -3,509 4,004 -1,239 -744 Note 4: Net loan losses Foreign exchange adjustments and other changes - - -35 -35 1,751 -3,478 -1,273 -3,000 Net change income statement In thousands of euro Jan-Mar 2024* Jan-Mar 2023* Jan-Dec 2023 Balance at 31 December 2023 53,563 10,001 8,732 72,295 3,030 -659 1,370 Change in expected credit loss on Stage 1 and 2 loans Transfer to Stage 1 208 -208 - 0 -9,475 - 1,239 Change in expected credit loss on Stage 3 loans -137 137 - 0 Transfer to Stage 2 Expected credit loss -6,445 -659 2,609 Transfer to Stage 3 - -3,529 3,529 0 Recoveries on claims 57 - 28 8,324 - - 8,324 New assets originated or disbursed Net loan losses -6,388 -659 2,637 Amortisations and repayments -17,906 -2,228 - -20,134 Impact of remeasurment on existing assets 9,112 3,167 5,947 18,225 There were no realised losses for the periods Jan-Mar 2024, Jan-Mar 2023 or Jan-Dec 2023. Foreign exchange adjustments and other changes - - -56 -56 * Unaudited figures -400 -2,660 9,420 6,359 Net change income statement Balance at 31 March 2024* 53,163 7,340 18,151 78,654 * Unaudited figures
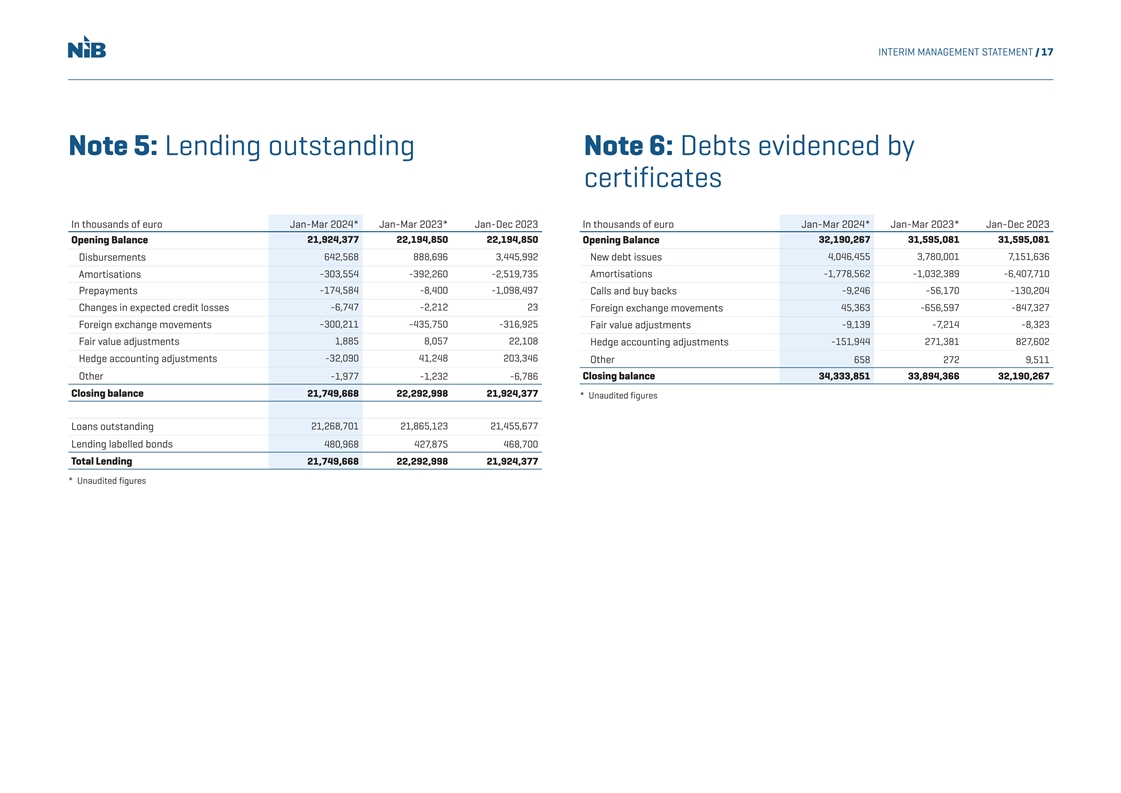
INTERIM MANAGEMENT STATEMENT / 17 Note 5: Lending outstanding Note 6: Debts evidenced by certificates In thousands of euro Jan-Mar 2024* Jan-Mar 2023* Jan-Dec 2023 In thousands of euro Jan-Mar 2024* Jan-Mar 2023* Jan-Dec 2023 21,924,377 22,194,850 22,194,850 32,190,267 31,595,081 31,595,081 Opening Balance Opening Balance 642,568 888,696 3,445,992 New debt issues 4,046,455 3,780,001 7,151,636 Disbursements Amortisations -303,554 -392,260 -2,519,735 Amortisations -1,778,562 -1,032,389 -6,407,710 -174,584 -8,400 -1,098,497 Prepayments Calls and buy backs -9,246 -56,170 -130,204 Changes in expected credit losses -6,747 -2,212 23 45,363 -656,597 -847,327 Foreign exchange movements Foreign exchange movements -300,211 -435,750 -316,925 Fair value adjustments -9,139 -7,214 -8,323 Fair value adjustments 1,885 8,057 22,108 Hedge accounting adjustments -151,944 271,381 827,602 -32,090 41,248 203,346 Hedge accounting adjustments Other 658 272 9,511 Other -1,977 -1,232 -6,786 Closing balance 34,333,851 33,894,366 32,190,267 Closing balance 21,749,668 22,292,998 21,924,377 * Unaudited figures 21,268,701 21,865,123 21,455,677 Loans outstanding Lending labelled bonds 480,968 427,875 468,700 Total Lending 21,749,668 22,292,998 21,924,377 * Unaudited figures
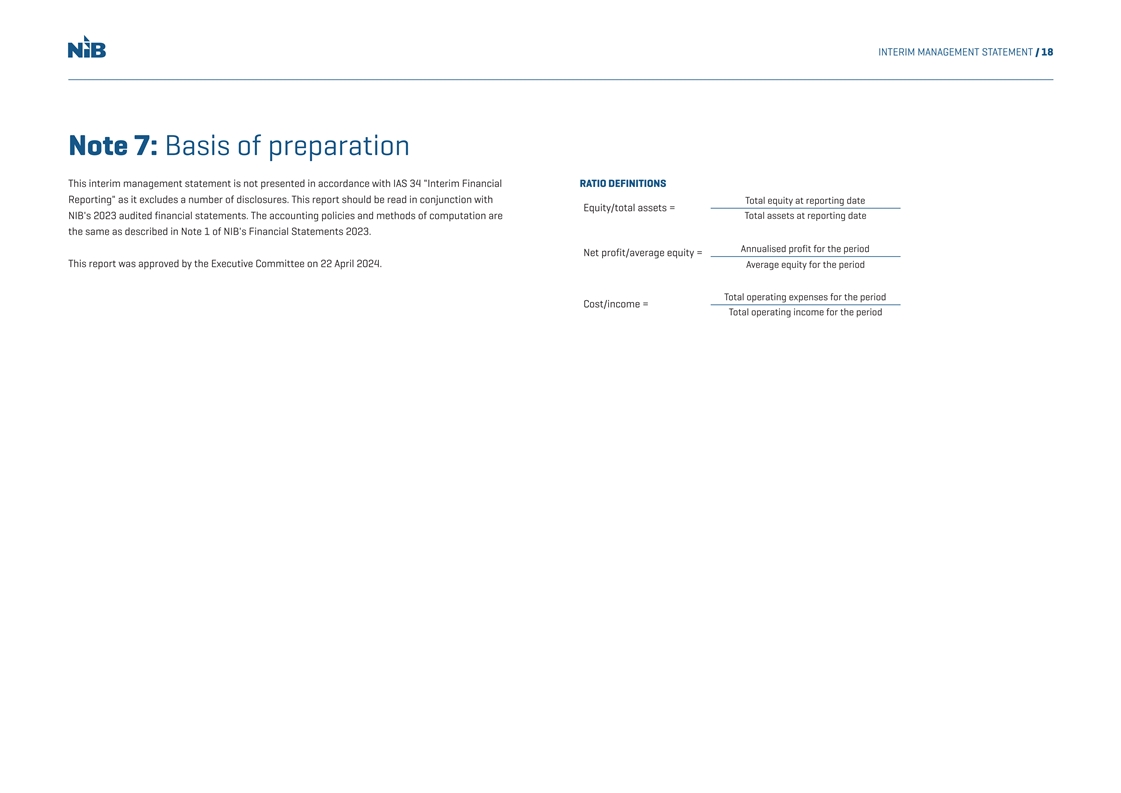
INTERIM MANAGEMENT STATEMENT / 18 Note 7: Basis of preparation This interim management statement is not presented in accordance with IAS 34 Interim Financial RATIO DEFINITIONS Reporting as it excludes a number of disclosures. This report should be read in conjunction with Total equity at reporting date Equity/total assets = NIB's 2023 audited financial statements. The accounting policies and methods of computation are Total assets at reporting date the same as described in Note 1 of NIB's Financial Statements 2023. Annualised profit for the period Net profit/average equity = This report was approved by the Executive Committee on 22 April 2024. Average equity for the period Total operating expenses for the period Cost/income = Total operating income for the period

CONTACT Kim Skov Jensen Jens Hellerup Jukka Ahonen Vice President & CFO Senior Director, Senior Director, kim.jensen@nib.int Head of Funding & Head of Communications +358 10 618 0209 Investor Relations jukka.ahonen@nib.int jens.hellerup@nib.int +358 10 618 0295 +358 9 6181 1401 For more information about the Nordic Investment Bank, visit www.nib.int