
Exhibit IX Interim Financial Report January –June Q2 2024
Q2 INTERIM FINANCIAL REPORT / 2 Table of contents 3 President and CEO's comments 4 Highlights 4 Key figures and ratios 5 Operating and financial review 5 Total comprehensive income 8 Financial position 10 Financial statements 10 Statement of comprehensive income 11 Statement of financial position 13 Statement of changes in equity 14 Cash flow statement 16 Notes to the interim financial statements 16 Note 1 - Segment information In April, NIB organised a 18 Note 2 - Net interest income seminar in Oslo bringing 18 Not e 3 - Net profit/loss on financial operations together stakeholders to 19 Note 4 - Expected credit loss discuss Norway's green transition. The emphasis 19 Note 5 - Net loan losses was on renewable energy, 20 Note 6 - Lending outstanding with an in-depth discussion 20 Note 7 - Debts evidenced by certificates on what is needed to turn 21 Not e 8 - Classification of financial instruments green power into sustainable 23 Note 9 - Fair value of financial instruments transportation. 26 Note 10 - Basis of preparation 26 Ratio definitions 28 Report on Review of Interim Financial Report
Q2 INTERIM FINANCIAL REPORT / 3 President and CEO’s comments NIB had a strong first half of the year. We maintained the solid financial performance with a 12.3% higher net profit in the first half of 2024 compared with the same period in 2023. Although the Bank is mission- driven, capital accumulation is crucial to fulfil the Bank’s mandate and make an impact in the member countries in the future. The demand for NIB lending remains strong with over EUR 2.6 billion in new lending signed, and EUR 1.9 billion disbursed so far in 2024 and with a 99.9% mandate fulfilment. In June, the Board of Directors approved the reviewed Sustainability Policy for a public consultation. The revision includes a variety of subjects, ranging from defence to biodiversity. This sends an important signal and aims to ensure that the Bank’s policies are in line with current sustainability standards and address the geopolitical challenges. The change regarding defence follows guidance from the Bank’s Board of Governors and permits NIB to provide financing for military goods and dual-use equipment that support regional security, excluding weapons and ammunition. The policy entered into force in July. NIB’s loans remain distributed across various sectors and countries. Total assets at 30 June 2024 amounted to EUR 41.6 billion, compared to EUR 39.6 billion at 31 December 2023. At the end of the second quarter, the total lending outstanding amounted to EUR 22.2 billion. To meet the demand for our financing, the Bank has raised EUR 6.4 billion in new funding so far in 2024. This includes a five-year USD 1.5 billion global benchmark bond with a final orderbook of more than USD 4.5 billion, the largest ever activities, particularly in driving the green transition. The first InvestEU loan disbursements occurred in the for NIB. first quarter of 2024. Further information about InvestEU can be found here. The net profit for the period from January to June was strong and amounted to EUR 143 million, June also marked a change in the composition of NIB’s Board of Directors. The chair rotates among the compared with EUR 127 million in the first half of 2023. The increase in net profit is mainly due to higher member countries, and Merle Wilkinson (Estonia) became Chair of the Board for a two-year period. Julie net interest income. Sonne (Denmark) became Deputy Chair of the Board, also for a two-year period. In addition, NIB welcomed two new Board members. The Bank is in a strong financial position as confirmed by our AAA/Aaa credit rating, which was reaffirmed by both Standard & Poor’s and Moody’s during the spring. NIB’s credit rating reflects its high asset quality, As stated previously, our mission to finance climate and nature, as well as productivity and innovation, solid liquidity and capital adequacy, strong risk management and governance – and the strength of its remains central to NIB. In addition, we will continue to develop NIB’s sustainability practices to ensure we owners. remain at the forefront of supporting our member countries. In 2024, the European Commission and NIB signed an amendment to the existing InvestEU guarantee agreement whereby NIB becomes implementing partner also for Norway and Iceland. The guarantee now André Küüsvek, President & CEO extends across all member countries of NIB and this expansion enables us to enhance our financing
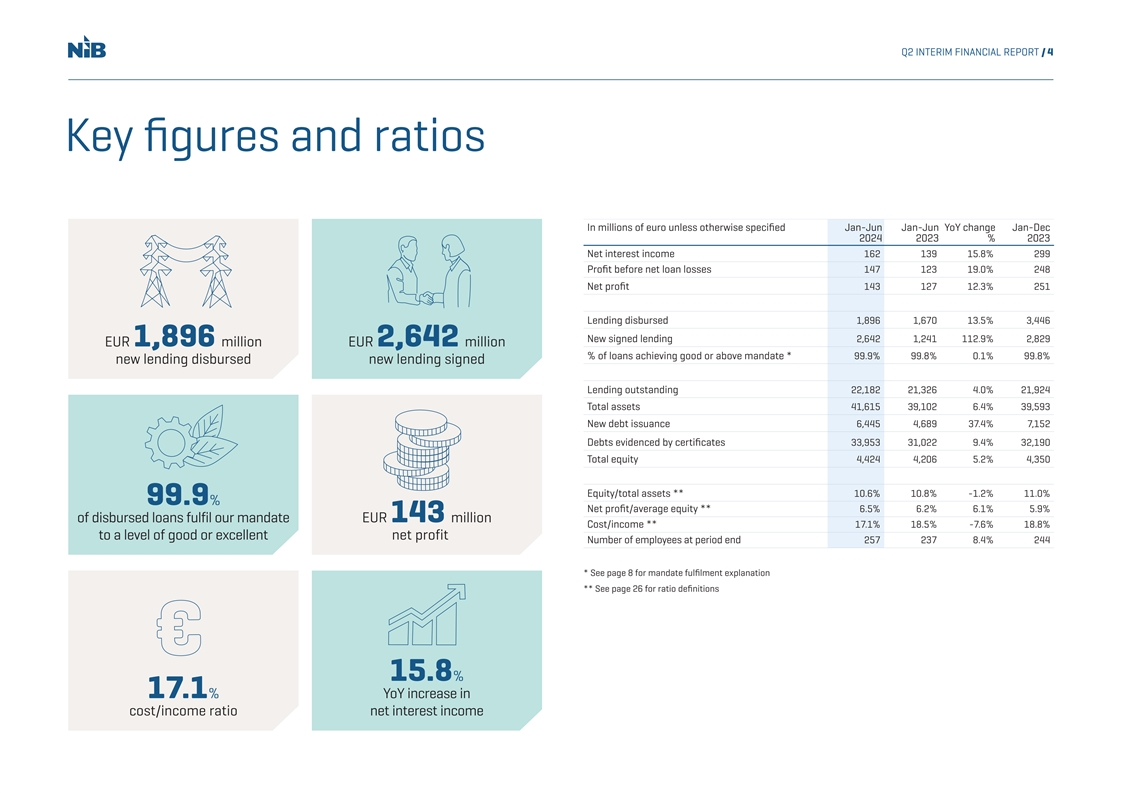
Q2 INTERIM FINANCIAL REPORT / 4 Key figures and ratios In millions of euro unless otherwise specified Jan-Jun Jan-Jun YoY change Jan-Dec 2024 2023 % 2023 Net interest income 162 139 15.8% 299 Profit before net loan losses 147 123 19.0% 248 Net profit 143 127 12.3% 251 Lending disbursed 1,896 1,670 13.5% 3,446 New signed lending 2,642 1,241 112.9% 2,829 EUR 1,896 million EUR 2,642 million % of loans achieving good or above mandate * 99.9% 99.8% 0.1% 99.8% new lending disbursed new lending signed Lending outstanding 22,182 21,326 4.0% 21,924 Total assets 41,615 39,102 6.4% 39,593 New debt issuance 6,445 4,689 37.4% 7,152 Debts evidenced by certificates 33,953 31,022 9.4% 32,190 Total equity 4,424 4,206 5.2% 4,350 Equity/total assets ** 10.6% 10.8% -1.2% 11.0% 99.9% Net profit/average equity ** 6.5% 6.2% 6.1% 5.9% of disbursed loans fulfil our mandate EUR 143 million Cost/income ** 17.1% 18.5% -7.6% 18.8% to a level of good or excellent net profit Number of employees at period end 257 237 8.4% 244 * See page 8 for mandate fulfilment explanation ** See page 26 for ratio definitions 15.8% 17.1% YoY increase in cost/income ratio net interest income
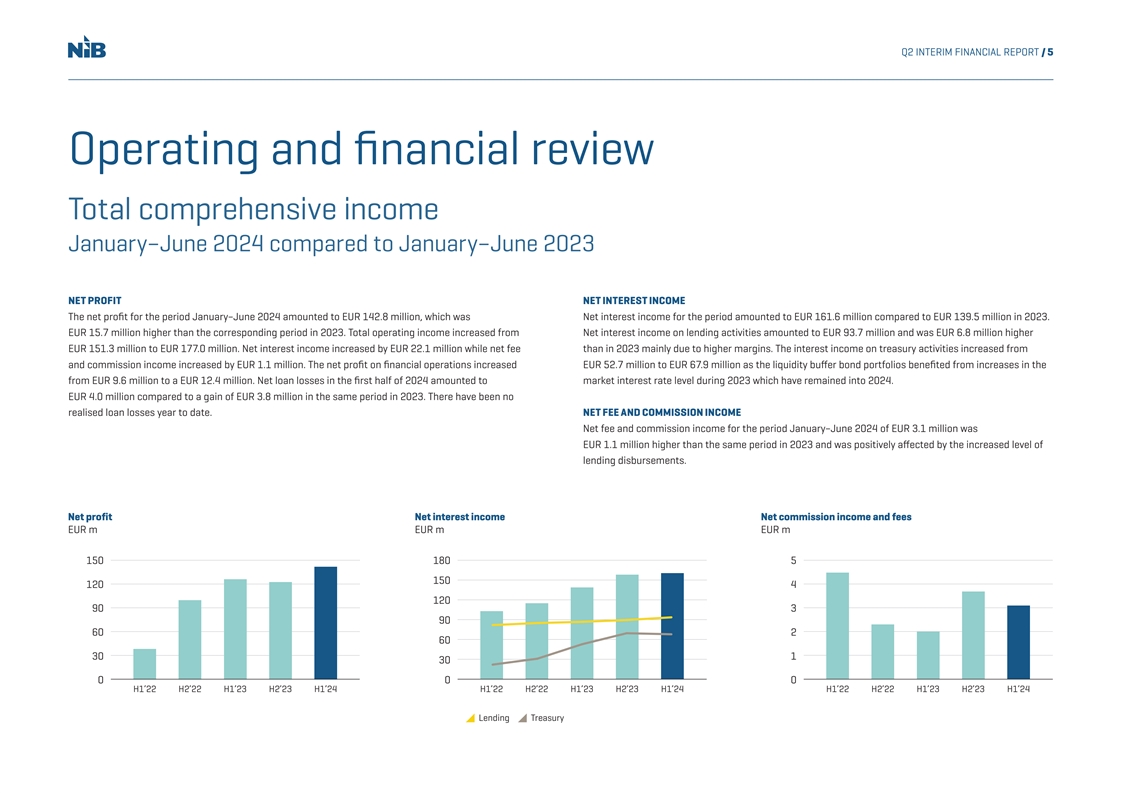
Q2 INTERIM FINANCIAL REPORT / 5 Operating and financial review Total comprehensive income January–June 2024 compared to January–June 2023 NET PROFIT NET INTEREST INCOME The net profit for the period January–June 2024 amounted to EUR 142.8 million, which was Net interest income for the period amounted to EUR 161.6 million compared to EUR 139.5 million in 2023. EUR 15.7 million higher than the corresponding period in 2023. Total operating income increased from Net interest income on lending activities amounted to EUR 93.7 million and was EUR 6.8 million higher EUR 151.3 million to EUR 177.0 million. Net interest income increased by EUR 22.1 million while net fee than in 2023 mainly due to higher margins. The interest income on treasury activities increased from and commission income increased by EUR 1.1 million. The net profit on financial operations increased EUR 52.7 million to EUR 67.9 million as the liquidity buffer bond portfolios benefited from increases in the from EUR 9.6 million to a EUR 12.4 million. Net loan losses in the first half of 2024 amounted to market interest rate level during 2023 which have remained into 2024. EUR 4.0 million compared to a gain of EUR 3.8 million in the same period in 2023. There have been no realised loan losses year to date. NET FEE AND COMMISSION INCOME Net fee and commission income for the period January–June 2024 of EUR 3.1 million was EUR 1.1 million higher than the same period in 2023 and was positively affected by the increased level of lending disbursements. Net profit Net interest income Net commission income and fees EUR m EUR m EUR m 150 180 5 150 120 4 120 90 3 90 60 2 60 30 1 30 0 0 0 H1’22 H2’22 H1’23 H2’23 H1’24 H1’22 H2’22 H1’23 H2’23 H1’24 H1’22 H2’22 H1’23 H2’23 H1’24 Lending Treasury
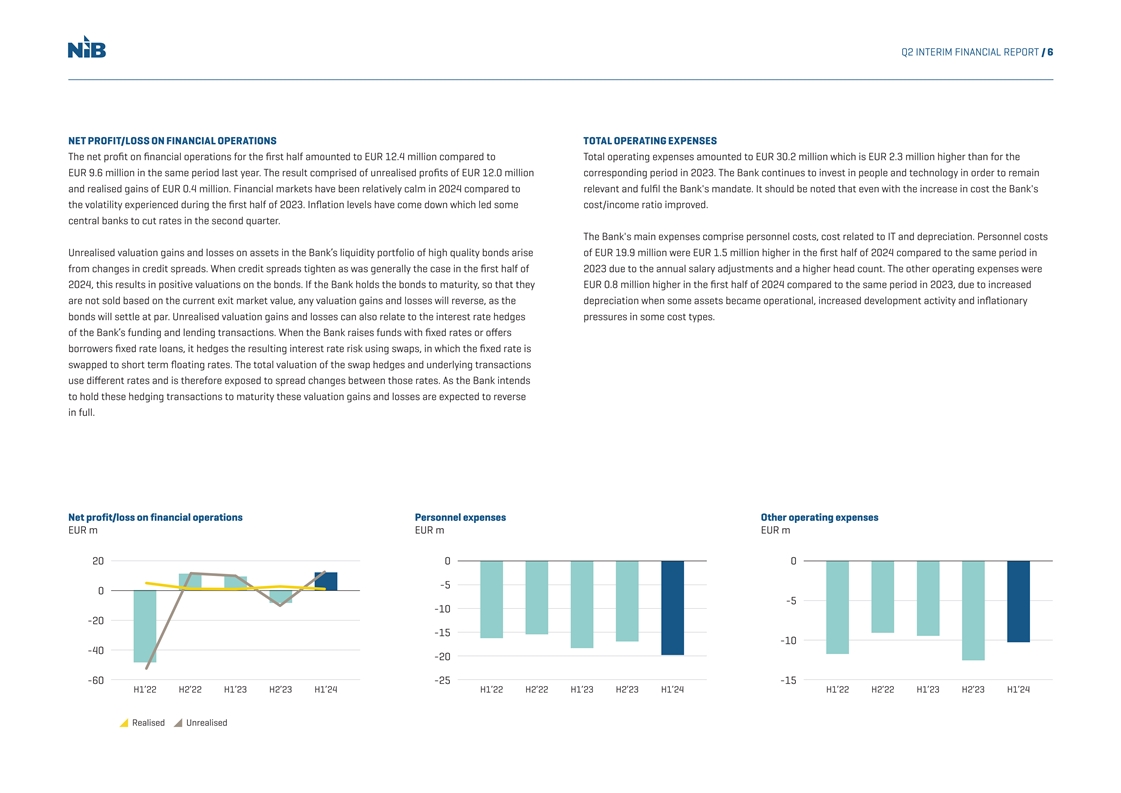
Q2 INTERIM FINANCIAL REPORT / 6 NET PROFIT/LOSS ON FINANCIAL OPERATIONS TOTAL OPERATING EXPENSES The net profit on financial operations for the first half amounted to EUR 12.4 million compared to Total operating expenses amounted to EUR 30.2 million which is EUR 2.3 million higher than for the EUR 9.6 million in the same period last year. The result comprised of unrealised profits of EUR 12.0 million corresponding period in 2023. The Bank continues to invest in people and technology in order to remain and realised gains of EUR 0.4 million. Financial markets have been relatively calm in 2024 compared to relevant and fulfil the Bank's mandate. It should be noted that even with the increase in cost the Bank's the volatility experienced during the first half of 2023. Inflation levels have come down which led some cost/income ratio improved. central banks to cut rates in the second quarter. The Bank's main expenses comprise personnel costs, cost related to IT and depreciation. Personnel costs Unrealised valuation gains and losses on assets in the Bank’s liquidity portfolio of high quality bonds arise of EUR 19.9 million were EUR 1.5 million higher in the first half of 2024 compared to the same period in from changes in credit spreads. When credit spreads tighten as was generally the case in the first half of 2023 due to the annual salary adjustments and a higher head count. The other operating expenses were 2024, this results in positive valuations on the bonds. If the Bank holds the bonds to maturity, so that they EUR 0.8 million higher in the first half of 2024 compared to the same period in 2023, due to increased are not sold based on the current exit market value, any valuation gains and losses will reverse, as the depreciation when some assets became operational, increased development activity and inflationary bonds will settle at par. Unrealised valuation gains and losses can also relate to the interest rate hedges pressures in some cost types. of the Bank’s funding and lending transactions. When the Bank raises funds with fixed rates or offers borrowers fixed rate loans, it hedges the resulting interest rate risk using swaps, in which the fixed rate is swapped to short term floating rates. The total valuation of the swap hedges and underlying transactions use different rates and is therefore exposed to spread changes between those rates. As the Bank intends to hold these hedging transactions to maturity these valuation gains and losses are expected to reverse in full. Net profit/loss on financial operations Personnel expenses Other operating expenses EUR m EUR m EUR m 20 0 0 -5 0 -5 -10 -20 -15 -10 -40 -20 -60 -25 -15 H1’22 H2’22 H1’23 H2’23 H1’24 H1’22 H2’22 H1’23 H2’23 H1’24 H1’22 H2’22 H1’23 H2’23 H1’24 Realised Unrealised
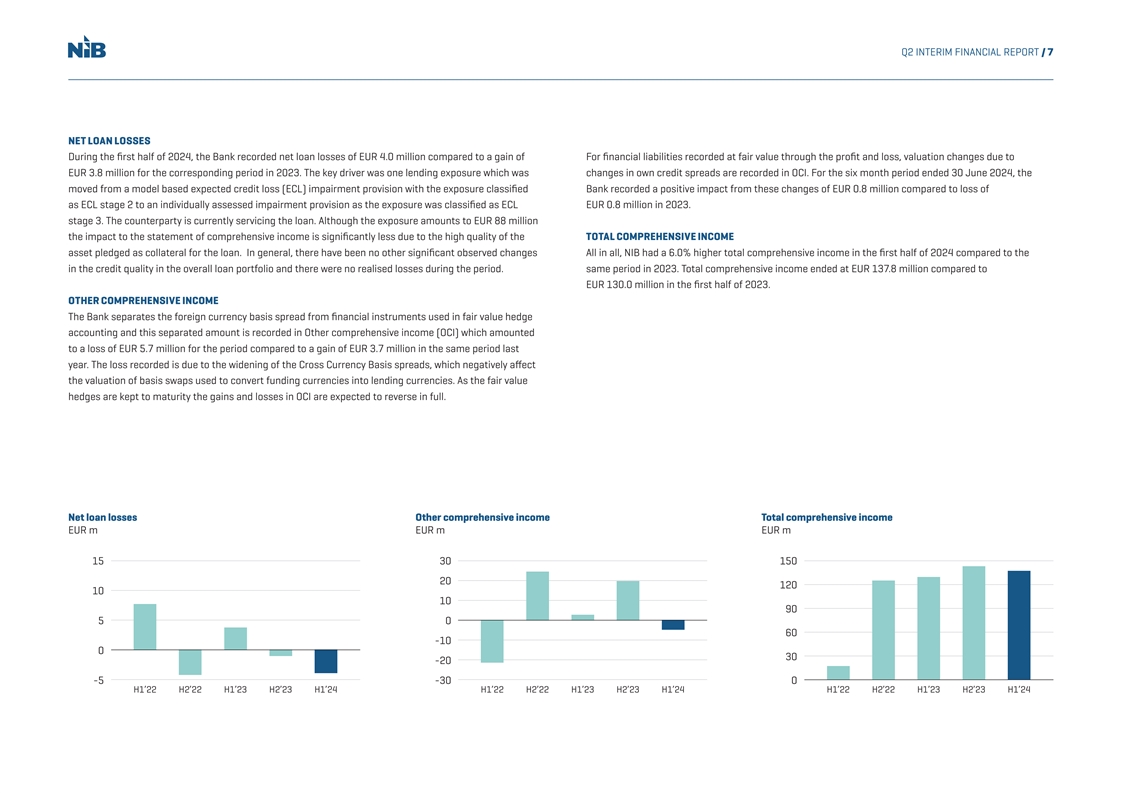
Q2 INTERIM FINANCIAL REPORT / 7 NET LOAN LOSSES During the first half of 2024, the Bank recorded net loan losses of EUR 4.0 million compared to a gain of For financial liabilities recorded at fair value through the profit and loss, valuation changes due to EUR 3.8 million for the corresponding period in 2023. The key driver was one lending exposure which was changes in own credit spreads are recorded in OCI. For the six month period ended 30 June 2024, the moved from a model based expected credit loss (ECL) impairment provision with the exposure classified Bank recorded a positive impact from these changes of EUR 0.8 million compared to loss of as ECL stage 2 to an individually assessed impairment provision as the exposure was classified as ECL EUR 0.8 million in 2023. stage 3. The counterparty is currently servicing the loan. Although the exposure amounts to EUR 88 million the impact to the statement of comprehensive income is significantly less due to the high quality of the TOTAL COMPREHENSIVE INCOME asset pledged as collateral for the loan. In general, there have been no other significant observed changes All in all, NIB had a 6.0% higher total comprehensive income in the first half of 2024 compared to the in the credit quality in the overall loan portfolio and there were no realised losses during the period. same period in 2023. Total comprehensive income ended at EUR 137.8 million compared to EUR 130.0 million in the first half of 2023. OTHER COMPREHENSIVE INCOME The Bank separates the foreign currency basis spread from financial instruments used in fair value hedge accounting and this separated amount is recorded in Other comprehensive income (OCI) which amounted to a loss of EUR 5.7 million for the period compared to a gain of EUR 3.7 million in the same period last year. The loss recorded is due to the widening of the Cross Currency Basis spreads, which negatively affect the valuation of basis swaps used to convert funding currencies into lending currencies. As the fair value hedges are kept to maturity the gains and losses in OCI are expected to reverse in full. Net loan losses Other comprehensive income Total comprehensive income EUR m EUR m EUR m 15 30 150 20 120 10 10 90 5 0 60 -10 0 30 -20 -5 -30 0 H1’22 H2’22 H1’23 H2’23 H1’24 H1’22 H2’22 H1’23 H2’23 H1’24 H1’22 H2’22 H1’23 H2’23 H1’24
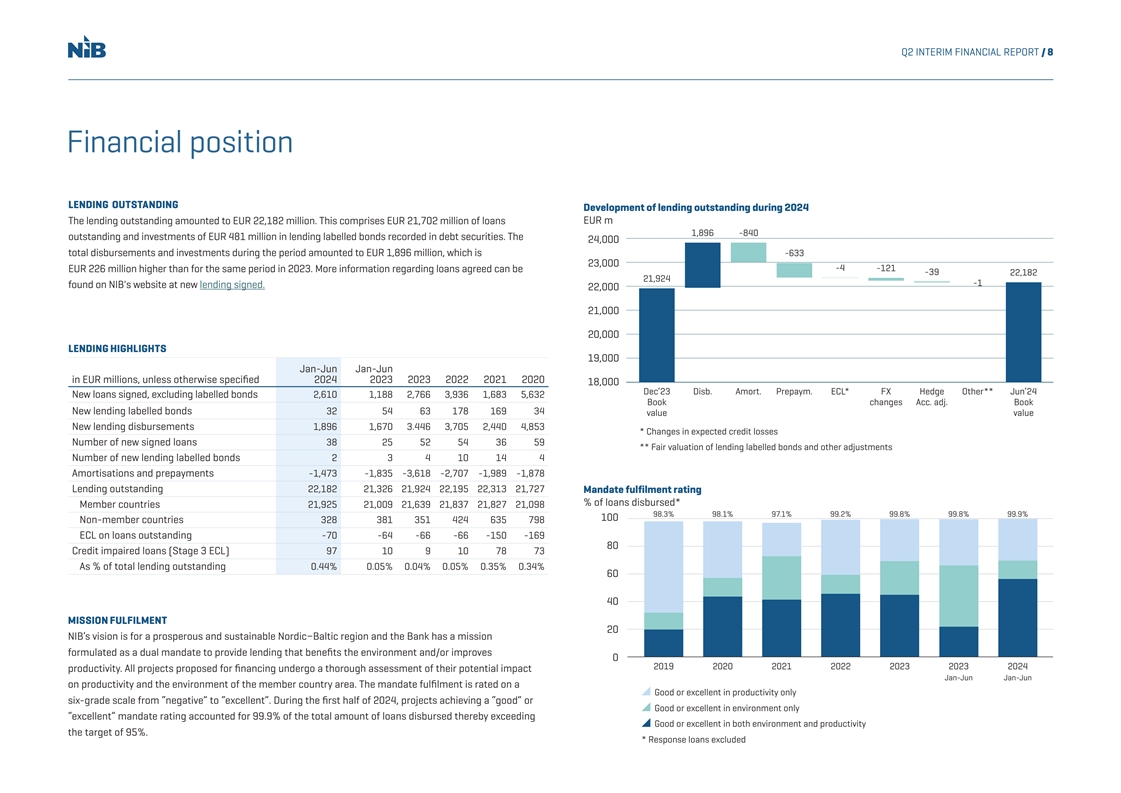
Q2 INTERIM FINANCIAL REPORT / 8 Financial position LENDING OUTSTANDING Development of lending outstanding during 2024 The lending outstanding amounted to EUR 22,182 million. This comprises EUR 21,702 million of loans EUR m 1,896 -840 outstanding and investments of EUR 481 million in lending labelled bonds recorded in debt securities. The 24,000 total disbursements and investments during the period amounted to EUR 1,896 million, which is -633 23,000 -4 -121 EUR 226 million higher than for the same period in 2023. More information regarding loans agreed can be -39 22,182 21,924 -1 found on NIB's website at new lending signed. 22,000 21,000 20,000 LENDING HIGHLIGHTS 19,000 Jan-Jun Jan-Jun in EUR millions, unless otherwise specified 2024 2023 2023 2022 2021 2020 18,000 Dec’23 Disb. Amort. Prepaym. ECL* FX Hedge Other** Jun’24 New loans signed, excluding labelled bonds 2,610 1,188 2,766 3,936 1,683 5,632 Book changes Acc. adj. Book New lending labelled bonds 32 54 63 178 169 34 value value New lending disbursements 1,896 1,670 3.446 3,705 2,440 4,853 * Changes in expected credit losses Number of new signed loans 38 25 52 54 36 59 ** Fair valuation of lending labelled bonds and other adjustments Number of new lending labelled bonds 2 3 4 10 14 4 Amortisations and prepayments -1,473 -1,835 -3,618 -2,707 -1,989 -1,878 Lending outstanding 22,182 21,326 21,924 22,195 22,313 21,727 Mandate fulfilment rating % of loans disbursed* Member countries 21,925 21,009 21,639 21,837 21,827 21,098 98.3% 98.1% 97.1% 99.2% 99.8% 99.8% 99.9% 100 Non-member countries 328 381 351 424 635 798 ECL on loans outstanding -70 -64 -66 -66 -150 -169 80 Credit impaired loans (Stage 3 ECL) 97 10 9 10 78 73 As % of total lending outstanding 0.44% 0.05% 0.04% 0.05% 0.35% 0.34% 60 40 MISSION FULFILMENT 20 NIB’s vision is for a prosperous and sustainable Nordic−Baltic region and the Bank has a mission formulated as a dual mandate to provide lending that benefits the environment and/or improves 0 2019 2020 2021 2022 2023 2023 2024 productivity. All projects proposed for financing undergo a thorough assessment of their potential impact Jan-Jun Jan-Jun on productivity and the environment of the member country area. The mandate fulfilment is rated on a Good or excellent in productivity only six-grade scale from “negative” to “excellent”. During the first half of 2024, projects achieving a “good” or Good or excellent in environment only “excellent” mandate rating accounted for 99.9% of the total amount of loans disbursed thereby exceeding Good or excellent in both environment and productivity the target of 95%. * Response loans excluded
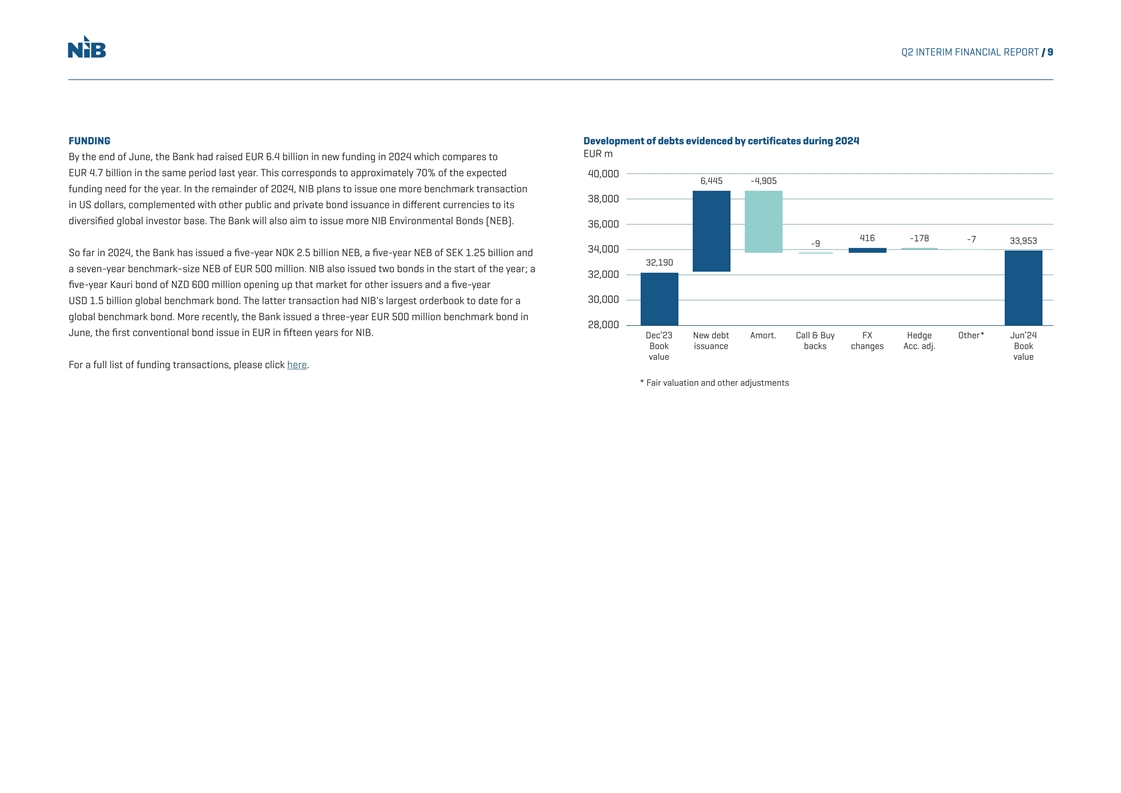
Q2 INTERIM FINANCIAL REPORT / 9 FUNDING Development of debts evidenced by certificates during 2024 EUR m By the end of June, the Bank had raised EUR 6.4 billion in new funding in 2024 which compares to EUR 4.7 billion in the same period last year. This corresponds to approximately 70% of the expected 40,000 6,445 -4,905 funding need for the year. In the remainder of 2024, NIB plans to issue one more benchmark transaction 38,000 in US dollars, complemented with other public and private bond issuance in different currencies to its diversified global investor base. The Bank will also aim to issue more NIB Environmental Bonds (NEB). 36,000 416 -178 -7 33,953 -9 34,000 So far in 2024, the Bank has issued a five-year NOK 2.5 billion NEB, a five-year NEB of SEK 1.25 billion and 32,190 a seven-year benchmark-size NEB of EUR 500 million. NIB also issued two bonds in the start of the year; a 32,000 five-year Kauri bond of NZD 600 million opening up that market for other issuers and a five-year 30,000 USD 1.5 billion global benchmark bond. The latter transaction had NIB's largest orderbook to date for a global benchmark bond. More recently, the Bank issued a three-year EUR 500 million benchmark bond in 28,000 June, the first conventional bond issue in EUR in fifteen years for NIB. Dec’23 New debt Amort. Call & Buy FX Hedge Other* Jun’24 Book issuance backs changes Acc. adj. Book value value For a full list of funding transactions, please click here. * Fair valuation and other adjustments
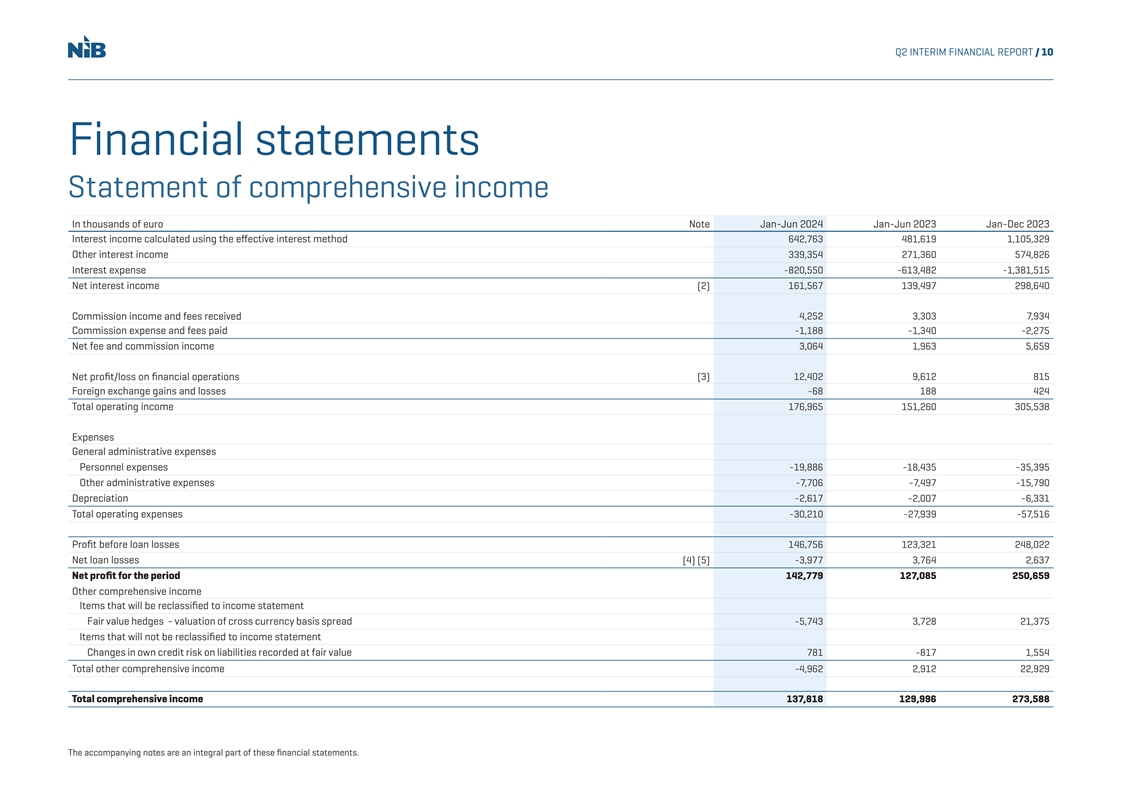
Q2 INTERIM FINANCIAL REPORT / 10 Financial statements Statement of comprehensive income In thousands of euro Note Jan-Jun 2024 Jan-Jun 2023 Jan-Dec 2023 Interest income calculated using the effective interest method 642,763 481,619 1,105,329 Other interest income 339,354 271,360 574,826 Interest expense -820,550 -613,482 -1,381,515 Net interest income (2) 161,567 139,497 298,640 Commission income and fees received 4,252 3,303 7,934 Commission expense and fees paid -1,188 -1,340 -2,275 Net fee and commission income 3,064 1,963 5,659 Net profit/loss on financial operations (3) 12,402 9,612 815 Foreign exchange gains and losses -68 188 424 Total operating income 176,965 151,260 305,538 Expenses General administrative expenses Personnel expenses -19,886 -18,435 -35,395 Other administrative expenses -7,706 -7,497 -15,790 Depreciation -2,617 -2,007 -6,331 Total operating expenses -30,210 -27,939 -57,516 Profit before loan losses 146,756 123,321 248,022 Net loan losses (4) (5) -3,977 3,764 2,637 Net profit for the period 142,779 127,085 250,659 Other comprehensive income Items that will be reclassified to income statement Fair value hedges - valuation of cross currency basis spread -5,743 3,728 21,375 Items that will not be reclassified to income statement Changes in own credit risk on liabilities recorded at fair value 781 -817 1,554 Total other comprehensive income -4,962 2,912 22,929 Total comprehensive income 137,818 129,996 273,588 The accompanying notes are an integral part of these financial statements.
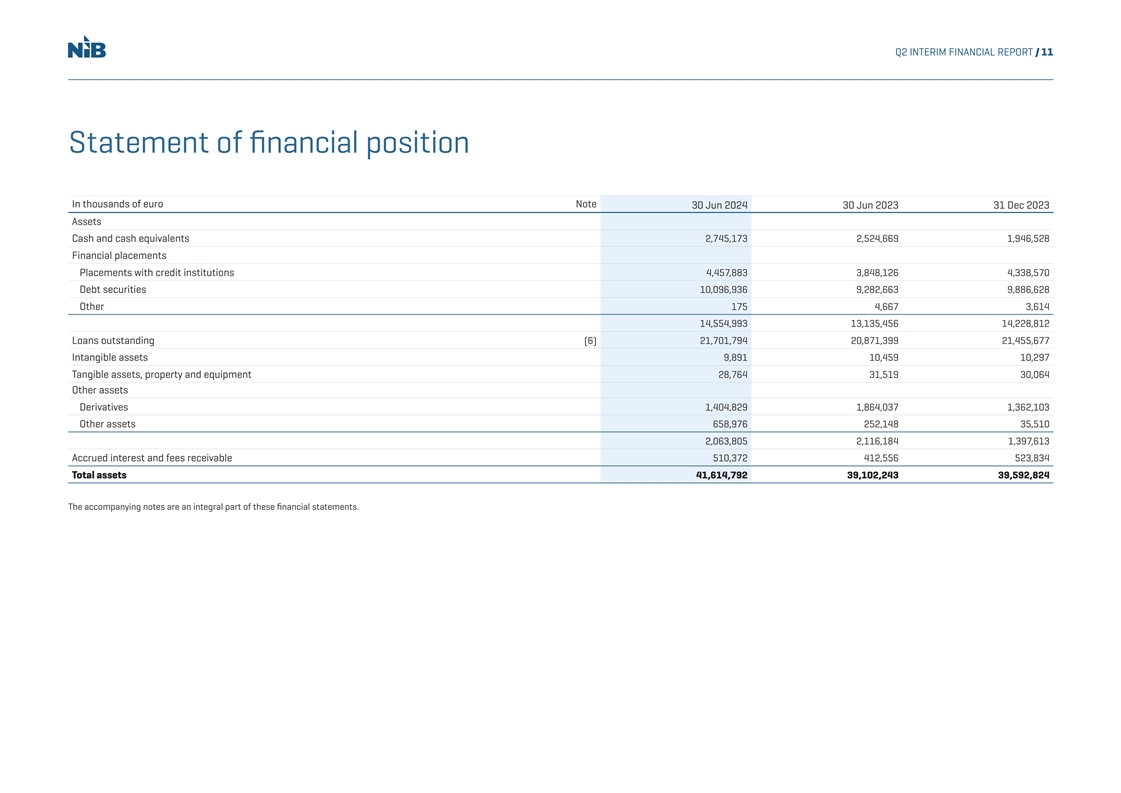
Q2 INTERIM FINANCIAL REPORT / 11 Statement of financial position In thousands of euro Note 30 Jun 2024 30 Jun 2023 31 Dec 2023 Assets Cash and cash equivalents 2,745,173 2,524,669 1,946,528 Financial placements Placements with credit institutions 4,457,883 3,848,126 4,338,570 Debt securities 10,096,936 9,282,663 9,886,628 Other 175 4,667 3,614 14,554,993 13,135,456 14,228,812 Loans outstanding (6) 21,701,794 20,871,399 21,455,677 Intangible assets 9,891 10,459 10,297 Tangible assets, property and equipment 28,764 31,519 30,064 Other assets Derivatives 1,404,829 1,864,037 1,362,103 Other assets 658,976 252,148 35,510 2,063,805 2,116,184 1,397,613 Accrued interest and fees receivable 510,372 412,556 523,834 Total assets 41,614,792 39,102,243 39,592,824 The accompanying notes are an integral part of these financial statements.
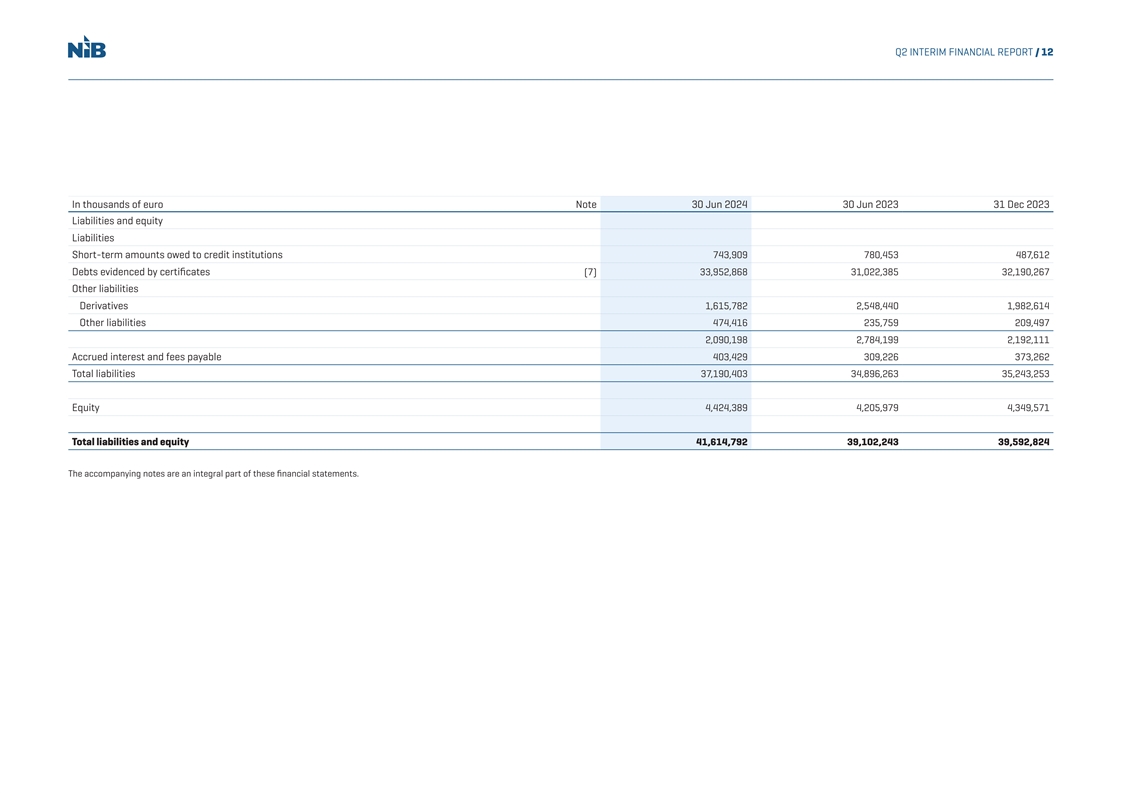
Q2 INTERIM FINANCIAL REPORT / 12 In thousands of euro Note 30 Jun 2024 30 Jun 2023 31 Dec 2023 Liabilities and equity Liabilities Short-term amounts owed to credit institutions 743,909 780,453 487,612 Debts evidenced by certificates (7) 33,952,868 31,022,385 32,190,267 Other liabilities Derivatives 1,615,782 2,548,440 1,982,614 Other liabilities 474,416 235,759 209,497 2,090,198 2,784,199 2,192,111 Accrued interest and fees payable 403,429 309,226 373,262 Total liabilities 37,190,403 34,896,263 35,243,253 Equity 4,424,389 4,205,979 4,349,571 Total liabilities and equity 41,614,792 39,102,243 39,592,824 The accompanying notes are an integral part of these financial statements.
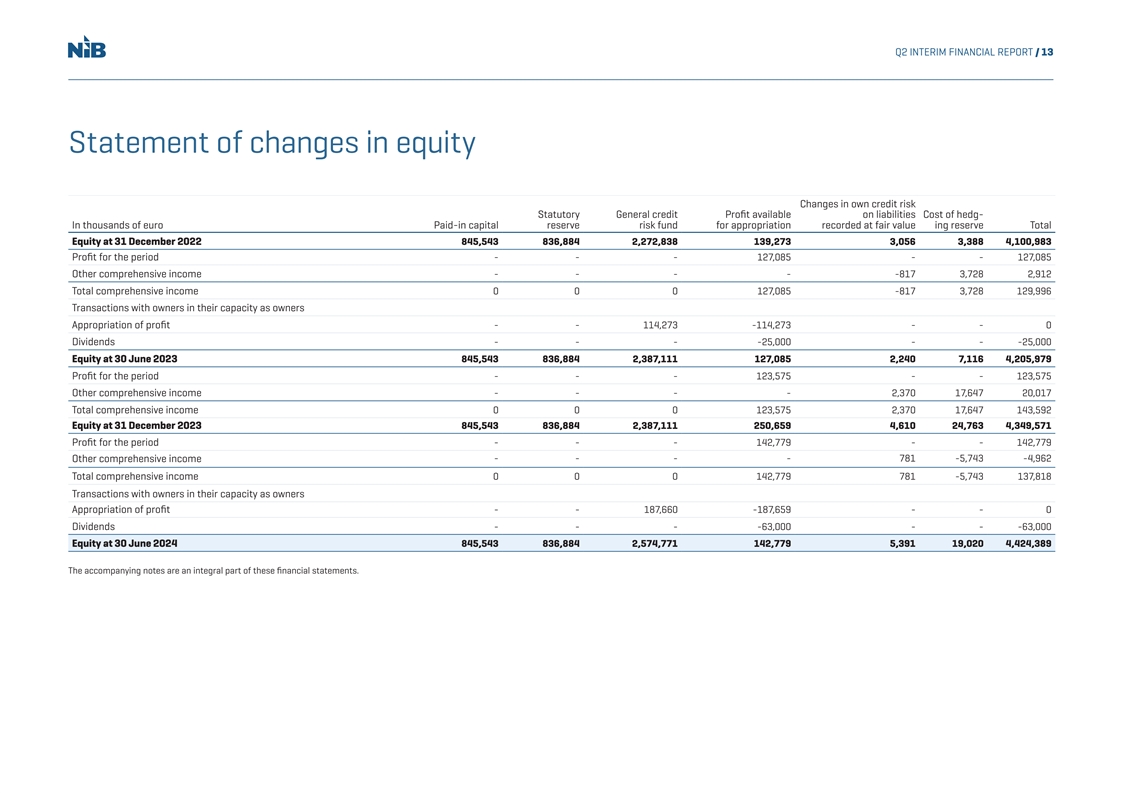
Q2 INTERIM FINANCIAL REPORT / 13 Statement of changes in equity Changes in own credit risk Statutory General credit Profit available on liabilities Cost of hedg- In thousands of euro Paid-in capital reserve risk fund for appropriation recorded at fair value ing reserve Total Equity at 31 December 2022 845,543 836,884 2,272,838 139,273 3,056 3,388 4,100,983 Profit for the period - - - 127,085 - - 127,085 Other comprehensive income - - - - -817 3,728 2,912 Total comprehensive income 0 0 0 127,085 -817 3,728 129,996 Transactions with owners in their capacity as owners Appropriation of profit - - 114,273 -114,273 - - 0 Dividends - - - -25,000 - - -25,000 Equity at 30 June 2023 845,543 836,884 2,387,111 127,085 2,240 7,116 4,205,979 Profit for the period - - - 123,575 - - 123,575 Other comprehensive income - - - - 2,370 17,647 20,017 Total comprehensive income 0 0 0 123,575 2,370 17,647 143,592 Equity at 31 December 2023 845,543 836,884 2,387,111 250,659 4,610 24,763 4,349,571 Profit for the period - - - 142,779 - - 142,779 - - - - 781 -5,743 -4,962 Other comprehensive income Total comprehensive income 0 0 0 142,779 781 -5,743 137,818 Transactions with owners in their capacity as owners Appropriation of profit - - 187,660 -187,659 - - 0 Dividends - - - -63,000 - - -63,000 Equity at 30 June 2024 845,543 836,884 2,574,771 142,779 5,391 19,020 4,424,389 The accompanying notes are an integral part of these financial statements.
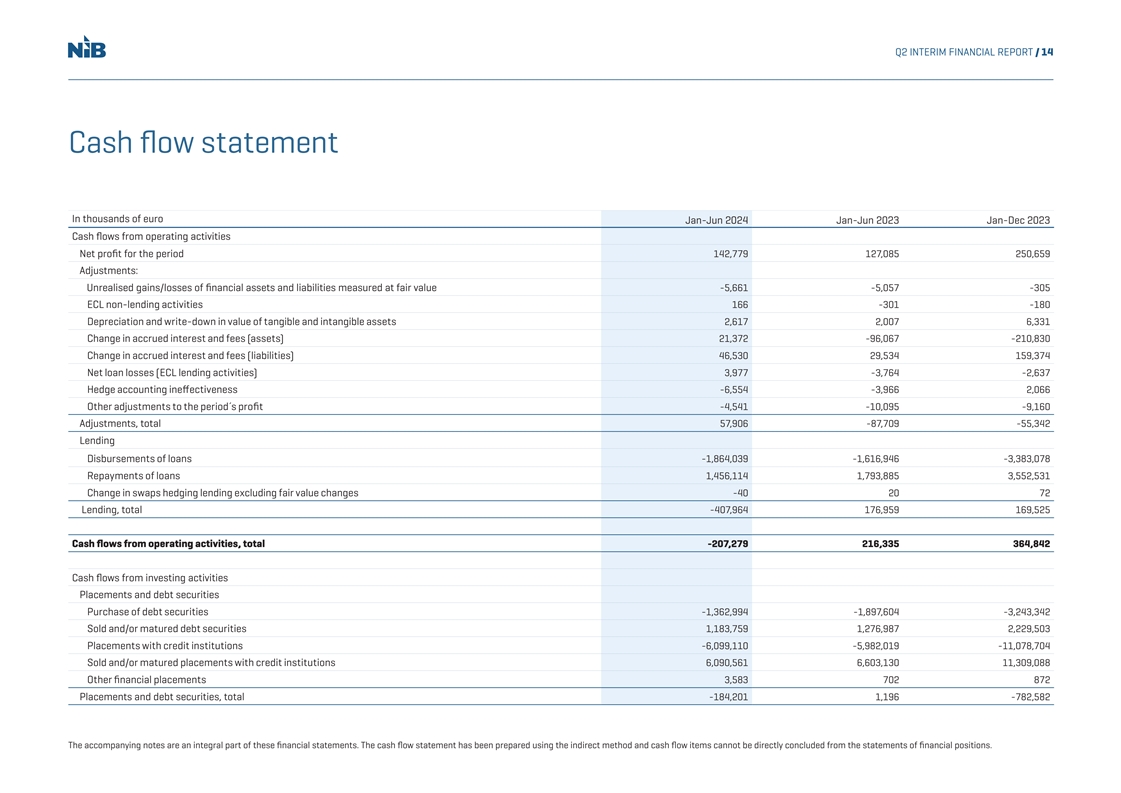
Q2 INTERIM FINANCIAL REPORT / 14 Cash flow statement In thousands of euro Jan-Jun 2024 Jan-Jun 2023 Jan-Dec 2023 Cash flows from operating activities Net profit for the period 142,779 127,085 250,659 Adjustments: Unrealised gains/losses of financial assets and liabilities measured at fair value -5,661 -5,057 -305 ECL non-lending activities 166 -301 -180 Depreciation and write-down in value of tangible and intangible assets 2,617 2,007 6,331 Change in accrued interest and fees (assets) 21,372 -96,067 -210,830 Change in accrued interest and fees (liabilities) 46,530 29,534 159,374 Net loan losses (ECL lending activities) 3,977 -3,764 -2,637 Hedge accounting ineffectiveness -6,554 -3,966 2,066 Other adjustments to the period´s profit -4,541 -10,095 -9,160 Adjustments, total 57,906 -87,709 -55,342 Lending Disbursements of loans -1,864,039 -1,616,946 -3,383,078 Repayments of loans 1,456,114 1,793,885 3,552,531 Change in swaps hedging lending excluding fair value changes -40 20 72 Lending, total -407,964 176,959 169,525 Cash flows from operating activities, total -207,279 216,335 364,842 Cash flows from investing activities Placements and debt securities Purchase of debt securities -1,362,994 -1,897,604 -3,243,342 Sold and/or matured debt securities 1,183,759 1,276,987 2,229,503 Placements with credit institutions -6,099,110 -5,982,019 -11,078,704 Sold and/or matured placements with credit institutions 6,090,561 6,603,130 11,309,088 Other financial placements 3,583 702 872 Placements and debt securities, total -184,201 1,196 -782,582 The accompanying notes are an integral part of these financial statements. The cash flow statement has been prepared using the indirect method and cash flow items cannot be directly concluded from the statements of financial positions.
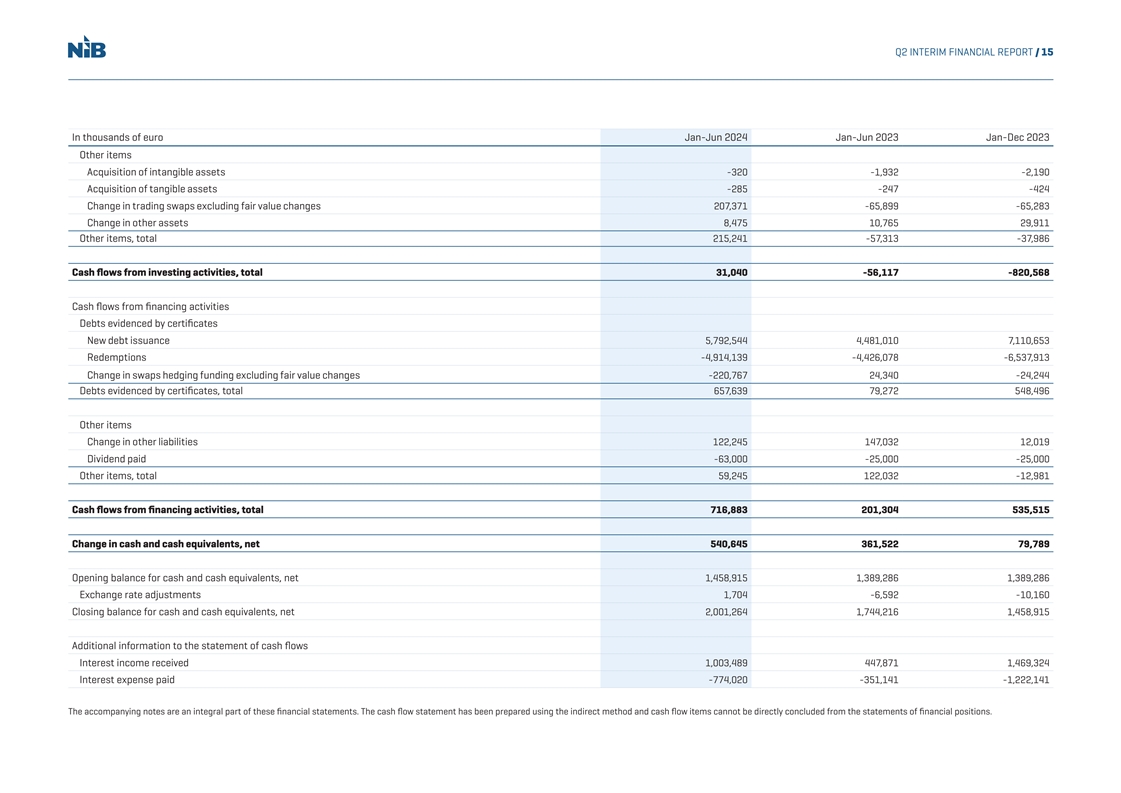
Q2 INTERIM FINANCIAL REPORT / 15 In thousands of euro Jan-Jun 2024 Jan-Jun 2023 Jan-Dec 2023 Other items Acquisition of intangible assets -320 -1,932 -2,190 Acquisition of tangible assets -285 -247 -424 Change in trading swaps excluding fair value changes 207,371 -65,899 -65,283 Change in other assets 8,475 10,765 29,911 Other items, total 215,241 -57,313 -37,986 Cash flows from investing activities, total 31,040 -56,117 -820,568 Cash flows from financing activities Debts evidenced by certificates New debt issuance 5,792,544 4,481,010 7,110,653 Redemptions -4,914,139 -4,426,078 -6,537,913 Change in swaps hedging funding excluding fair value changes -220,767 24,340 -24,244 Debts evidenced by certificates, total 657,639 79,272 548,496 Other items Change in other liabilities 122,245 147,032 12,019 Dividend paid -63,000 -25,000 -25,000 Other items, total 59,245 122,032 -12,981 Cash flows from financing activities, total 716,883 201,304 535,515 Change in cash and cash equivalents, net 540,645 361,522 79,789 Opening balance for cash and cash equivalents, net 1,458,915 1,389,286 1,389,286 Exchange rate adjustments 1,704 -6,592 -10,160 Closing balance for cash and cash equivalents, net 2,001,264 1,744,216 1,458,915 Additional information to the statement of cash flows Interest income received 1,003,489 447,871 1,469,324 Interest expense paid -774,020 -351,141 -1,222,141 The accompanying notes are an integral part of these financial statements. The cash flow statement has been prepared using the indirect method and cash flow items cannot be directly concluded from the statements of financial positions.
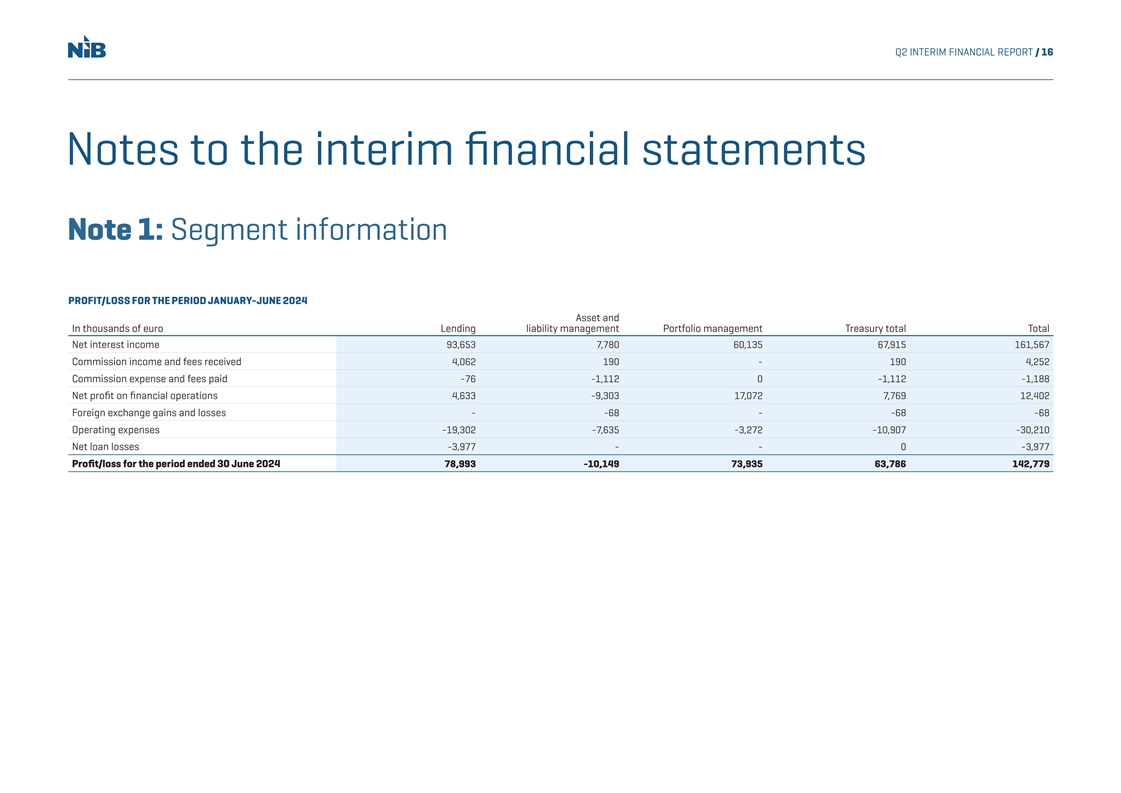
Q2 INTERIM FINANCIAL REPORT / 16 Notes to the interim financial statements Note 1: Segment information PROFIT/LOSS FOR THE PERIOD JANUARY-JUNE 2024 Asset and In thousands of euro Lending liability management Portfolio management Treasury total Total Net interest income 93,653 7,780 60,135 67,915 161,567 Commission income and fees received 4,062 190 - 190 4,252 Commission expense and fees paid -76 -1,112 0 -1,112 -1,188 Net profit on financial operations 4,633 -9,303 17,072 7,769 12,402 Foreign exchange gains and losses - -68 - -68 -68 Operating expenses -19,302 -7,635 -3,272 -10,907 -30,210 Net loan losses -3,977 - - 0 -3,977 Profit/loss for the period ended 30 June 2024 78,993 -10,149 73,935 63,786 142,779
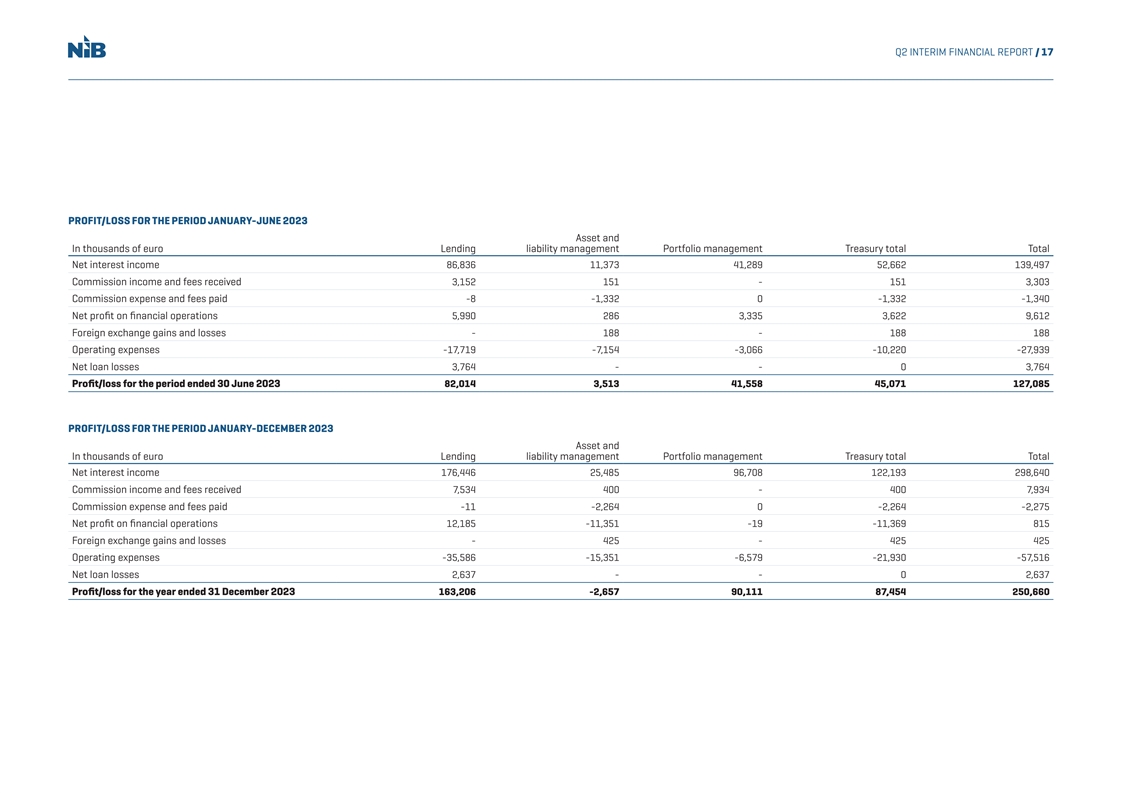
Q2 INTERIM FINANCIAL REPORT / 17 PROFIT/LOSS FOR THE PERIOD JANUARY-JUNE 2023 Asset and In thousands of euro Lending liability management Portfolio management Treasury total Total Net interest income 86,836 11,373 41,289 52,662 139,497 Commission income and fees received 3,152 151 - 151 3,303 Commission expense and fees paid -8 -1,332 0 -1,332 -1,340 Net profit on financial operations 5,990 286 3,335 3,622 9,612 Foreign exchange gains and losses - 188 - 188 188 Operating expenses -17,719 -7,154 -3,066 -10,220 -27,939 Net loan losses 3,764 - - 0 3,764 Profit/loss for the period ended 30 June 2023 82,014 3,513 41,558 45,071 127,085 PROFIT/LOSS FOR THE PERIOD JANUARY-DECEMBER 2023 Asset and In thousands of euro Lending liability management Portfolio management Treasury total Total Net interest income 176,446 25,485 96,708 122,193 298,640 Commission income and fees received 7,534 400 - 400 7,934 Commission expense and fees paid -11 -2,264 0 -2,264 -2,275 Net profit on financial operations 12,185 -11,351 -19 -11,369 815 Foreign exchange gains and losses - 425 - 425 425 Operating expenses -35,586 -15,351 -6,579 -21,930 -57,516 Net loan losses 2,637 - - 0 2,637 Profit/loss for the year ended 31 December 2023 163,206 -2,657 90,111 87,454 250,660
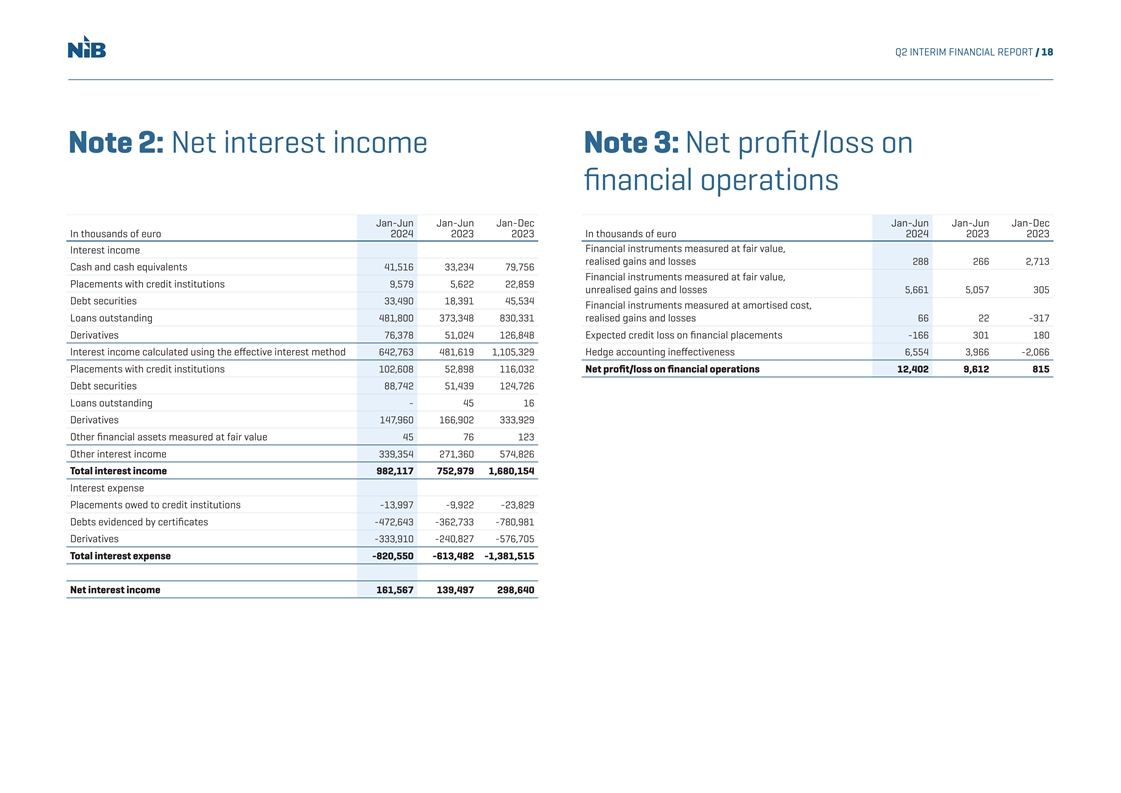
Q2 INTERIM FINANCIAL REPORT / 18 Note 2: Net interest income Note 3: Net profit/loss on n fi ancial operations Jan-Jun Jan-Jun Jan-Dec Jan-Jun Jan-Jun Jan-Dec In thousands of euro 2024 2023 2023 In thousands of euro 2024 2023 2023 Financial instruments measured at fair value, Interest income realised gains and losses 288 266 2,713 Cash and cash equivalents 41,516 33,234 79,756 Financial instruments measured at fair value, Placements with credit institutions 9,579 5,622 22,859 unrealised gains and losses 5,661 5,057 305 Debt securities 33,490 18,391 45,534 Financial instruments measured at amortised cost, Loans outstanding 481,800 373,348 830,331 realised gains and losses 66 22 -317 Derivatives 76,378 51,024 126,848 Expected credit loss on financial placements -166 301 180 Interest income calculated using the effective interest method 642,763 481,619 1,105,329 Hedge accounting ineffectiveness 6,554 3,966 -2,066 Placements with credit institutions 102,608 52,898 116,032 Net profit/loss on financial operations 12,402 9,612 815 Debt securities 88,742 51,439 124,726 Loans outstanding - 45 16 Derivatives 147,960 166,902 333,929 Other financial assets measured at fair value 45 76 123 Other interest income 339,354 271,360 574,826 Total interest income 982,117 752,979 1,680,154 Interest expense Placements owed to credit institutions -13,997 -9,922 -23,829 Debts evidenced by certificates -472,643 -362,733 -780,981 Derivatives -333,910 -240,827 -576,705 Total interest expense -820,550 -613,482 -1,381,515 Net interest income 161,567 139,497 298,640
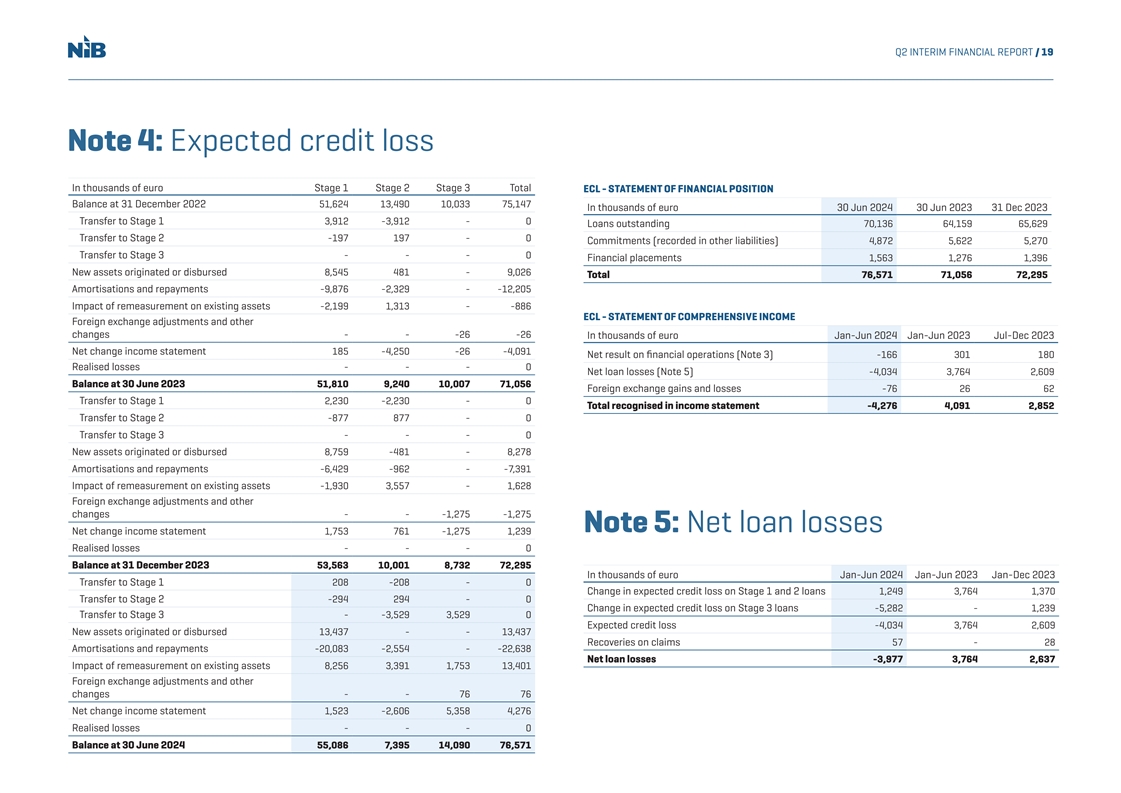
Q2 INTERIM FINANCIAL REPORT / 19 Note 4: Expected credit loss In thousands of euro Stage 1 Stage 2 Stage 3 Total ECL - STATEMENT OF FINANCIAL POSITION Balance at 31 December 2022 51,624 13,490 10,033 75,147 In thousands of euro 30 Jun 2024 30 Jun 2023 31 Dec 2023 Transfer to Stage 1 3,912 -3,912 - 0 Loans outstanding 70,136 64,159 65,629 Transfer to Stage 2 -197 197 - 0 Commitments (recorded in other liabilities) 4,872 5,622 5,270 Transfer to Stage 3 - - - 0 Financial placements 1,563 1,276 1,396 New assets originated or disbursed 8,545 481 - 9,026 Total 76,571 71,056 72,295 Amortisations and repayments -9,876 -2,329 - -12,205 Impact of remeasurement on existing assets -2,199 1,313 - -886 ECL - STATEMENT OF COMPREHENSIVE INCOME Foreign exchange adjustments and other changes - - -26 -26 In thousands of euro Jan-Jun 2024 Jan-Jun 2023 Jul-Dec 2023 Net change income statement 185 -4,250 -26 -4,091 Net result on financial operations (Note 3) -166 301 180 Realised losses - - - 0 Net loan losses (Note 5) -4,034 3,764 2,609 Balance at 30 June 2023 51,810 9,240 10,007 71,056 Foreign exchange gains and losses -76 26 62 Transfer to Stage 1 2,230 -2,230 - 0 Total recognised in income statement -4,276 4,091 2,852 Transfer to Stage 2 -877 877 - 0 Transfer to Stage 3 - - - 0 New assets originated or disbursed 8,759 -481 - 8,278 Amortisations and repayments -6,429 -962 - -7,391 Impact of remeasurement on existing assets -1,930 3,557 - 1,628 Foreign exchange adjustments and other changes - - -1,275 -1,275 Note 5: Net loan losses Net change income statement 1,753 761 -1,275 1,239 Realised losses - - - 0 Balance at 31 December 2023 53,563 10,001 8,732 72,295 In thousands of euro Jan-Jun 2024 Jan-Jun 2023 Jan-Dec 2023 Transfer to Stage 1 208 -208 - 0 Change in expected credit loss on Stage 1 and 2 loans 1,249 3,764 1,370 Transfer to Stage 2 -294 294 - 0 Change in expected credit loss on Stage 3 loans -5,282 - 1,239 Transfer to Stage 3 - -3,529 3,529 0 Expected credit loss -4,034 3,764 2,609 New assets originated or disbursed 13,437 - - 13,437 Recoveries on claims 57 - 28 Amortisations and repayments -20,083 -2,554 - -22,638 Net loan losses -3,977 3,764 2,637 Impact of remeasurement on existing assets 8,256 3,391 1,753 13,401 Foreign exchange adjustments and other changes - - 76 76 Net change income statement 1,523 -2,606 5,358 4,276 Realised losses - - - 0 Balance at 30 June 2024 55,086 7,395 14,090 76,571
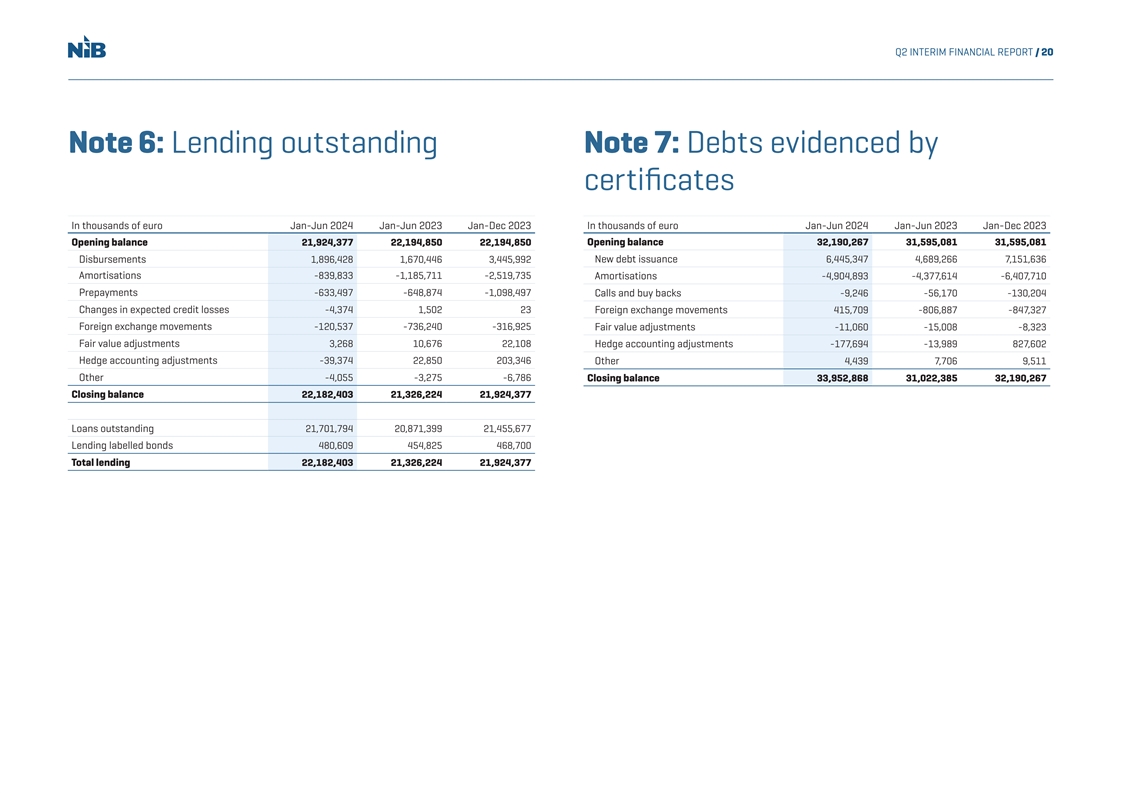
Q2 INTERIM FINANCIAL REPORT / 20 Note 6: Lending outstanding Note 7: Debts evidenced by certicate fi s In thousands of euro Jan-Jun 2024 Jan-Jun 2023 Jan-Dec 2023 In thousands of euro Jan-Jun 2024 Jan-Jun 2023 Jan-Dec 2023 Opening balance 21,924,377 22,194,850 22,194,850 Opening balance 32,190,267 31,595,081 31,595,081 Disbursements 1,896,428 1,670,446 3,445,992 New debt issuance 6,445,347 4,689,266 7,151,636 Amortisations -839,833 -1,185,711 -2,519,735 Amortisations -4,904,893 -4,377,614 -6,407,710 Prepayments -633,497 -648,874 -1,098,497 Calls and buy backs -9,246 -56,170 -130,204 Changes in expected credit losses -4,374 1,502 23 Foreign exchange movements 415,709 -806,887 -847,327 Foreign exchange movements -120,537 -736,240 -316,925 Fair value adjustments -11,060 -15,008 -8,323 Fair value adjustments 3,268 10,676 22,108 Hedge accounting adjustments -177,694 -13,989 827,602 Hedge accounting adjustments -39,374 22,850 203,346 Other 4,439 7,706 9,511 Other -4,055 -3,275 -6,786 Closing balance 33,952,868 31,022,385 32,190,267 Closing balance 22,182,403 21,326,224 21,924,377 Loans outstanding 21,701,794 20,871,399 21,455,677 Lending labelled bonds 480,609 454,825 468,700 Total lending 22,182,403 21,326,224 21,924,377
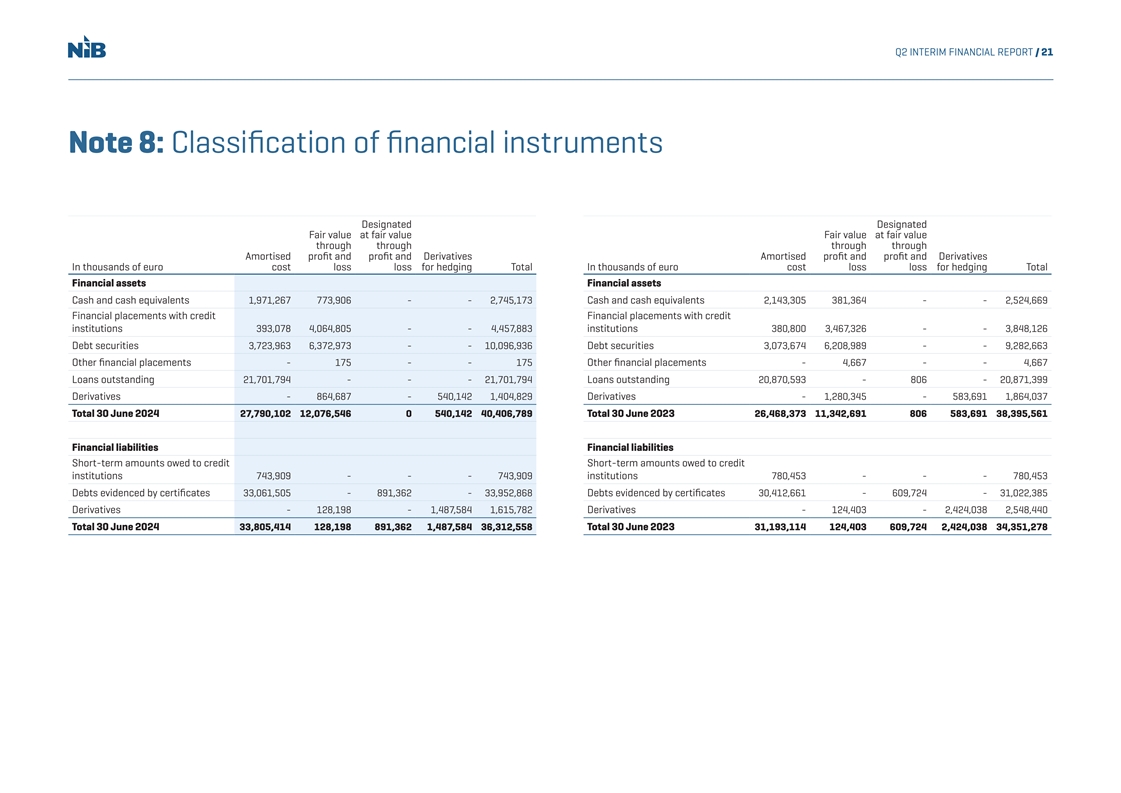
Q2 INTERIM FINANCIAL REPORT / 21 Note 8: Classic fi ation of financial instruments Designated Designated Fair value at fair value Fair value at fair value through through through through Amortised profit and profit and Derivatives Amortised profit and profit and Derivatives In thousands of euro cost loss loss for hedging Total In thousands of euro cost loss loss for hedging Total Financial assets Financial assets Cash and cash equivalents 1,971,267 773,906 - - 2,745,173 Cash and cash equivalents 2,143,305 381,364 - - 2,524,669 Financial placements with credit Financial placements with credit institutions 393,078 4,064,805 - - 4,457,883institutions 380,800 3,467,326 - - 3,848,126 Debt securities 3,723,963 6,372,973 - - 10,096,936 Debt securities 3,073,674 6,208,989 - - 9,282,663 Other financial placements - 175 - - 175 Other financial placements - 4,667 - - 4,667 Loans outstanding 21,701,794 - - - 21,701,794 Loans outstanding 20,870,593 - 806 - 20,871,399 Derivatives - 864,687 - 540,142 1,404,829 Derivatives - 1,280,345 - 583,691 1,864,037 Total 30 June 2024 27,790,102 12,076,546 0 540,142 40,406,789 Total 30 June 2023 26,468,373 11,342,691 806 583,691 38,395,561 Financial liabilities Financial liabilities Short-term amounts owed to credit Short-term amounts owed to credit institutions 743,909 - - - 743,909 institutions 780,453 - - - 780,453 Debts evidenced by certificates 33,061,505 - 891,362 - 33,952,868 Debts evidenced by certificates 30,412,661 - 609,724 - 31,022,385 Derivatives - 128,198 - 1,487,584 1,615,782 Derivatives - 124,403 - 2,424,038 2,548,440 Total 30 June 2024 33,805,414 128,198 891,362 1,487,584 36,312,558 Total 30 June 2023 31,193,114 124,403 609,724 2,424,038 34,351,278
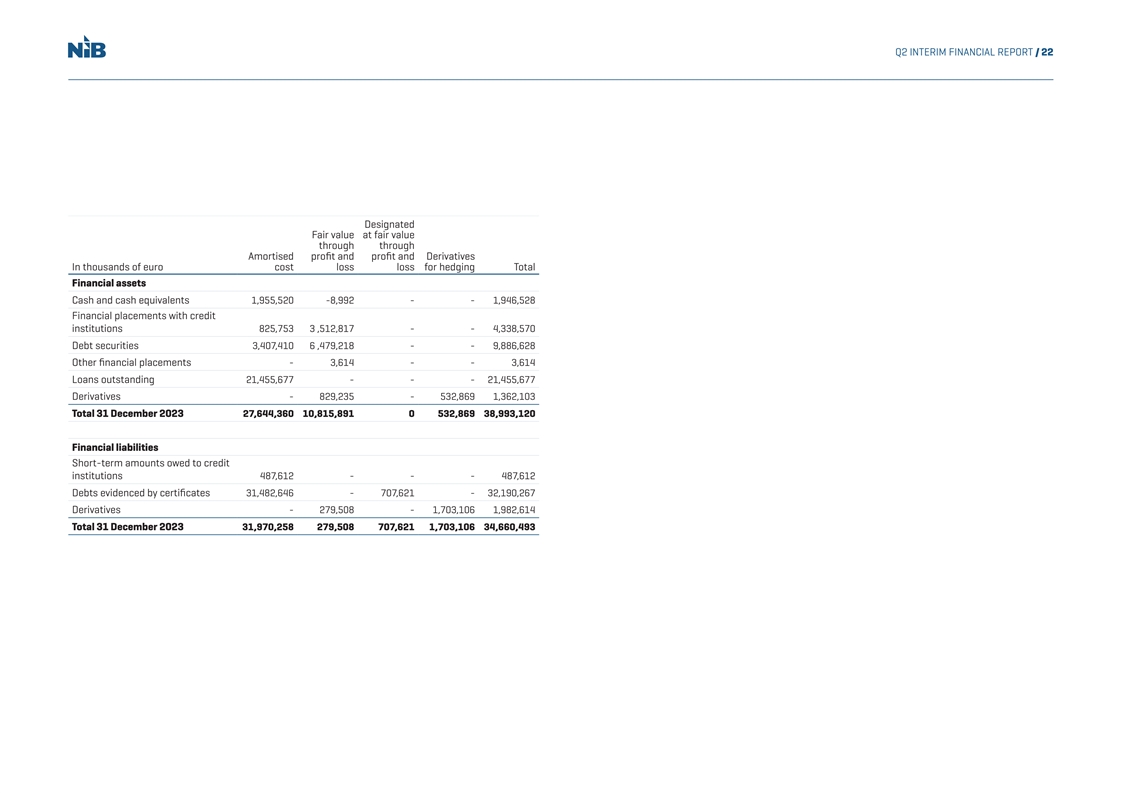
Q2 INTERIM FINANCIAL REPORT / 22 Designated Fair value at fair value through through Amortised profit and profit and Derivatives In thousands of euro cost loss loss for hedging Total Financial assets Cash and cash equivalents 1,955,520 -8,992 - - 1,946,528 Financial placements with credit institutions 825,753 3 ,512,817 - - 4,338,570 Debt securities 3,407,410 6 ,479,218 - - 9,886,628 Other financial placements - 3,614 - - 3,614 Loans outstanding 21,455,677 - - - 21,455,677 Derivatives - 829,235 - 532,869 1,362,103 Total 31 December 2023 27,644,360 10,815,891 0 532,869 38,993,120 Financial liabilities Short-term amounts owed to credit institutions 487,612 - - - 487,612 Debts evidenced by certificates 31,482,646 - 707,621 - 32,190,267 Derivatives - 279,508 - 1,703,106 1,982,614 Total 31 December 2023 31,970,258 279,508 707,621 1,703,106 34,660,493

Q2 INTERIM FINANCIAL REPORT / 23 Note 9: Fair value of financial instruments FAIR VALUE MEASUREMENT FOR FINANCIAL INSTRUMENTS 30 Jun 2024 30 Jun 2023 31 Dec 2023 Carrying Fair Carrying Fair Carrying Fair In thousands of euro amount value amount value amount value Financial assets Cash and cash equivalents 2,745,173 2,745,173 2,524,669 2,524,669 1,946,528 1,946,528 Financial placements with credit institutions 4,457,883 4,457,883 3,848,126 3,848,126 4,338,570 4,329,799 Debt securities 10,096,936 9,965,019 9,282,663 9,467,047 9,886,628 9,805,458 Other financial placements 175 175 4,667 4,667 3,614 3,614 Loans outstanding 21,701,794 21,881,868 20,871,399 20,996,962 21,455,677 21,598,417 Derivatives 1,404,829 1,404,829 1,864,037 1,864,037 1,362,103 1,362,103 Total 40,406,789 40,454,946 38,395,561 38,705,508 38,993,120 39,045,919 Financial liabilities Short-term amounts owed to credit institutions 743,909 743,909 780,453 780,453 487,612 487,612 Debt evidenced by certificates 33,952,868 33,864,798 31,022,385 30,978,465 32,190,267 32,102,914 Derivatives 1,615,782 1,615,782 2,548,440 2,548,440 1,982,614 1,982,614 Total 36,312,558 36,224,489 34,351,278 34,307,358 34,660,493 34,573,139
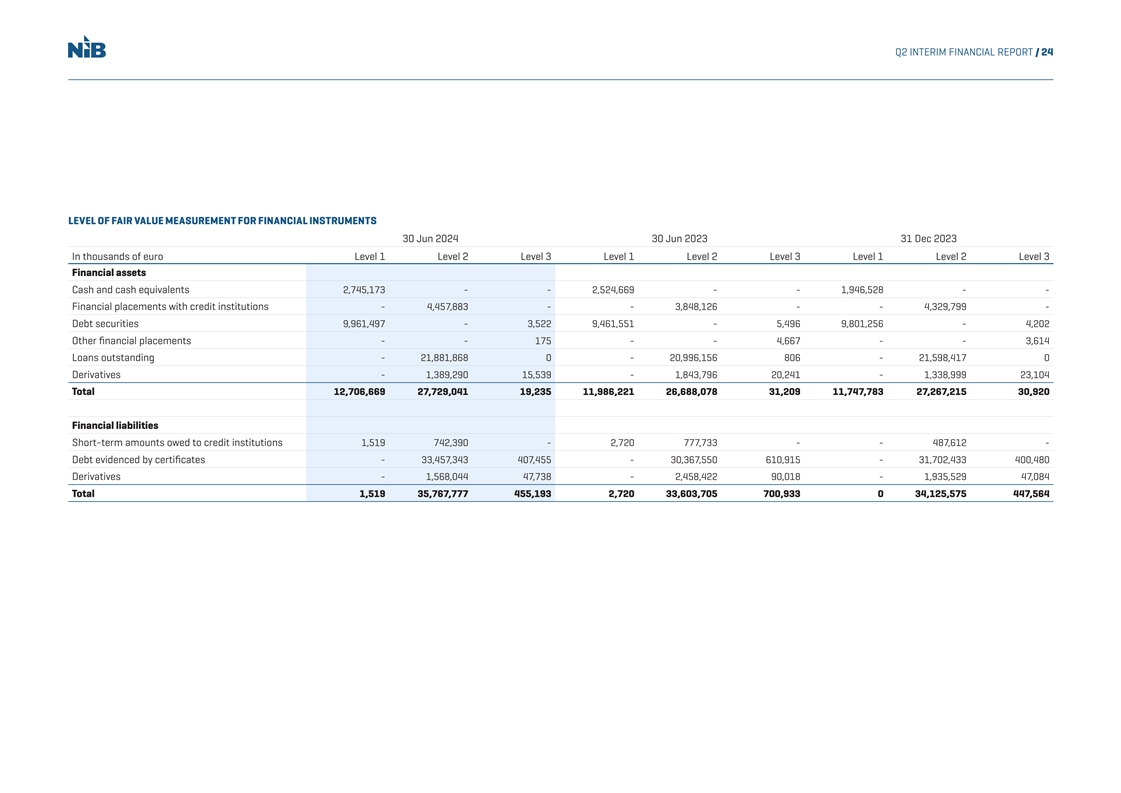
Q2 INTERIM FINANCIAL REPORT / 24 LEVEL OF FAIR VALUE MEASUREMENT FOR FINANCIAL INSTRUMENTS 30 Jun 2024 30 Jun 2023 31 Dec 2023 In thousands of euro Level 1 Level 2 Level 3 Level 1 Level 2 Level 3 Level 1 Level 2 Level 3 Financial assets Cash and cash equivalents 2,745,173 - - 2,524,669 - - 1,946,528 - - Financial placements with credit institutions - 4,457,883 - - 3,848,126 - - 4,329,799 - Debt securities 9,961,497 - 3,522 9,461,551 - 5,496 9,801,256 - 4,202 Other financial placements - - 175 - - 4,667 - - 3,614 Loans outstanding - 21,881,868 0 - 20,996,156 806 - 21,598,417 0 Derivatives - 1,389,290 15,539 - 1,843,796 20,241 - 1,338,999 23,104 Total 12,706,669 27,729,041 19,235 11,986,221 26,688,078 31,209 11,747,783 27,267,215 30,920 Financial liabilities Short-term amounts owed to credit institutions 1,519 742,390 - 2,720 777,733 - - 487,612 - Debt evidenced by certificates - 33,457,343 407,455 - 30,367,550 610,915 - 31,702,433 400,480 Derivatives - 1,568,044 47,738 - 2,458,422 90,018 - 1,935,529 47,084 Total 1,519 35,767,777 455,193 2,720 33,603,705 700,933 0 34,125,575 447,564
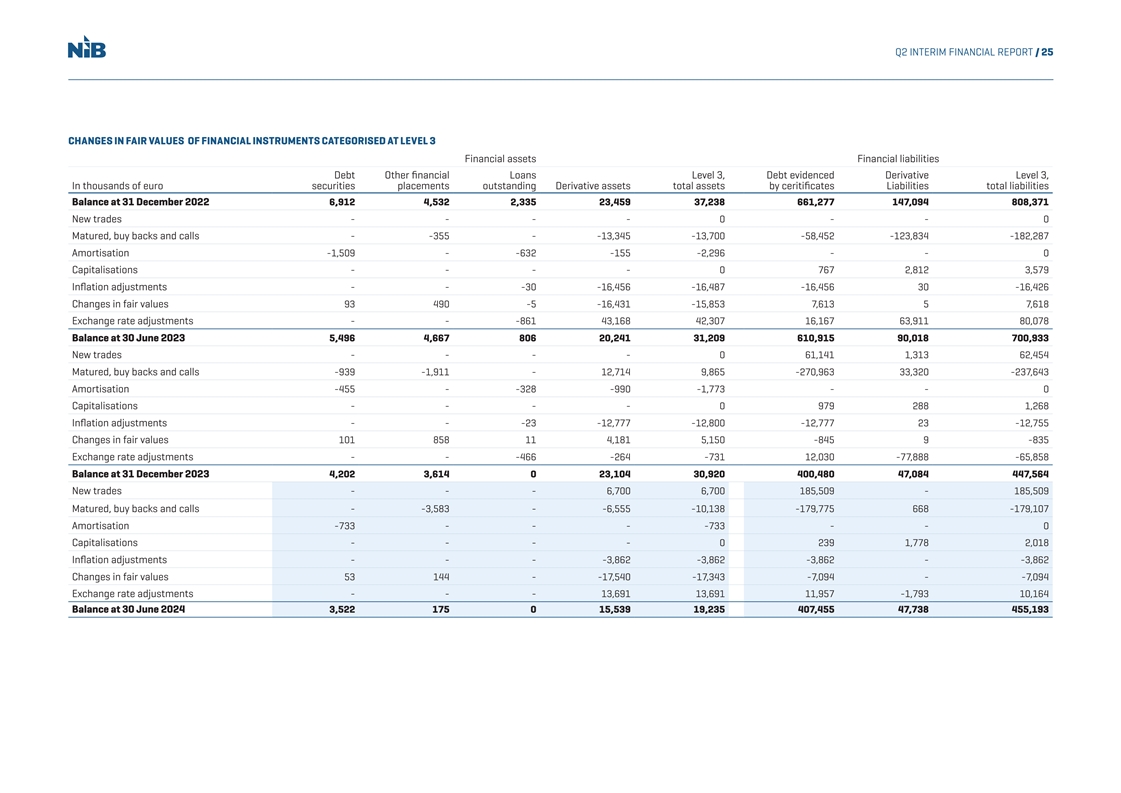
Q2 INTERIM FINANCIAL REPORT / 25 CHANGES IN FAIR VALUES OF FINANCIAL INSTRUMENTS CATEGORISED AT LEVEL 3 Financial assets Financial liabilities Debt Other financial Loans Level 3, Debt evidenced Derivative Level 3, In thousands of euro securities placements outstanding Derivative assets total assets by ceritificates Liabilities total liabilities Balance at 31 December 2022 6,912 4,532 2,335 23,459 37,238 661,277 147,094 808,371 New trades - - - - 0 - - 0 Matured, buy backs and calls - -355 - -13,345 -13,700 -58,452 -123,834 -182,287 Amortisation -1,509 - -632 -155 -2,296 - - 0 Capitalisations - - - - 0 767 2,812 3,579 Inflation adjustments - - -30 -16,456 -16,487 -16,456 30 -16,426 Changes in fair values 93 490 -5 -16,431 -15,853 7,613 5 7,618 Exchange rate adjustments - - -861 43,168 42,307 16,167 63,911 80,078 Balance at 30 June 2023 5,496 4,667 806 20,241 31,209 610,915 90,018 700,933 New trades - - - - 0 61,141 1,313 62,454 Matured, buy backs and calls -939 -1,911 - 12,714 9,865 -270,963 33,320 -237,643 Amortisation -455 - -328 -990 -1,773 - - 0 Capitalisations - - - - 0 979 288 1,268 Inflation adjustments - - -23 -12,777 -12,800 -12,777 23 -12,755 Changes in fair values 101 858 11 4,181 5,150 -845 9 -835 Exchange rate adjustments - - -466 -264 -731 12,030 -77,888 -65,858 Balance at 31 December 2023 4,202 3,614 0 23,104 30,920 400,480 47,084 447,564 New trades - - - 6,700 6,700 185,509 - 185,509 Matured, buy backs and calls - -3,583 - -6,555 -10,138 -179,775 668 -179,107 Amortisation -733 - - - -733 - - 0 Capitalisations - - - - 0 239 1,778 2,018 Inflation adjustments - - - -3,862 -3,862 -3,862 - -3,862 Changes in fair values 53 144 - -17,540 -17,343 -7,094 - -7,094 Exchange rate adjustments - - - 13,691 13,691 11,957 -1,793 10,164 Balance at 30 June 2024 3,522 175 0 15,539 19,235 407,455 47,738 455,193
Q2 INTERIM FINANCIAL REPORT / 26 Note 10: Basis of preparation These interim financial statements are presented in accordance with IAS 34 “Interim Financial Reporting”. RATIO DEFINITIONS The accounting policies and methods of computation are the same as described in Note 1 of NIB’s Total equity at reporting date Equity/total assets = Financial Report 2023. The International Accounting Standards Board (IASB) has amended a number of Total assets at reporting date standards, however they have not had any significant impact on the Bank's financial statements. Annualised profit for the period Profit/average equity = There have been no material changes in relation to transactions with related parties compared to those Average equity for the period described in Note 25 Related party disclosures in the 2023 IFRS financial statements. Total operating expenses for the period Cost/income = Net interest income in both Statement of comprehensive income and Note 2: Net interest income and Total operating income for the period Cash flow statement have been reclassified due to the revised allocation of swap contracts between different sections for the period ended 30 June 2023.
Q2 INTERIM FINANCIAL REPORT / 27 HELSINKI, 13 AUGUST 2024 Merle Wilkinson (Chair of the Board) Julie Sonne Minna Nikitin Esther Finnbogadóttir (Deputy Chair of the Board) Līga Kļaviņa Jurgita Uzielienė Bjarne Stakkestad Max Elger André Küüsvek (President & CEO)
Q2 INTERIM FINANCIAL REPORT / 28 Review Opinion To the Board of Directors of the Nordic Investment Bank Report on Review of Interim Financial Report INTRODUCTION CONCLUSION We have reviewed the condensed interim financial report of Nordic Investment Bank consisting of Based on our review, nothing has come to our attention that causes us to believe that the accompanying statement of financial position as of June 30, 2024 and the related statements of comprehensive income, interim financial report is not prepared, in all material respects in accordance with IAS 34. changes in equity and cash flows for the six-month period then ended, and a summary of significant accounting policies and other explanatory notes. Helsinki, 13 August 2024 Management is responsible for the preparation and presentation of this interim financial report in Ernst & Young Oy Ernst & Young AB accordance with IAS 34. Our responsibility is to express a conclusion on this interim financial report based Authorized Public Authorized Public on our review. Accountant Firm Accountant Firm SCOPE OF REVIEW We conducted our review in accordance with International Standard on Review Engagements 2410, Terhi Mäkinen Mona Alfredsson “Review of Interim Financial Information Performed by the Independent Auditor of the Entity.” Authorized Public Authorized Public A review of the interim financial report consists of making inquiries, primarily of persons responsible Accountant Accountant for financial and accounting matters, and applying analytical and other review procedures. A review is substantially less in scope than an audit conducted in accordance with International Standards on Auditing and consequently does not enable us to obtain assurance that we would become aware of all significant matters that might be identified in an audit. Accordingly, we do not express an audit opinion.

CONTACT Kim Skov Jensen Jens Hellerup Jukka Ahonen Vice President & CFO Senior Director, Senior Director, kim.jensen@nib.int Head of Funding & Head of Communications +358 10 618 0209 Investor Relations jukka.ahonen@nib.int jens.hellerup@nib.int +358 10 618 0295 +358 9 6181 1401 For more information about the Nordic Investment Bank, visit www.nib.int