
Exhibit 99.XI Interim Management Statement January –September Q3 2024
Q3 INTERIM MANAGEMENT STATEMENT / 2 Table of contents 3 President and CEO's comments 4 Highlights 4 Key figures and ratios 5 Operating and financial review 5 Total comprehensive income 8 Financial position 10 Financial statements 10 Statement of comprehensive income 11 Statement of financial position In August, NIB released its 13 Statement of changes in equity updated NIB Environmental 14 Cash flow statement Bond (NEB) framework. It got the highest possible 16 Notes to the interim financial statements rating Dark Green from 16 Note 1 - Net interest income Second Opinion provider 16 Note 2 - Net profit/loss on financial operations S&P Global Ratings (formerly 17 Note 3 - Expected credit loss CICERO). The framework is 17 Note 4 - Net loan losses aligned with the Green Bond 18 Note 5 - Lending outstanding Principles and its four core 18 Note 6 - Debts evidenced by certificates components. 19 Note 7 - Basis of preparation 19 Ratio definitions
Q3 INTERIM MANAGEMENT STATEMENT / 3 President and CEO’s comments The high level of activity continued after the summer. During the first nine months, new signed lending doubled to EUR 3.2 billion compared to the same period last year, indicating a good pipeline for actual loan disbursements in coming quarters—and even before year-end. So far, EUR 2.4 billion has been disbursed in 2024, with 100% of the projects delivering the mandate of improving productivity or protecting the environment. Our financial results kept a stable trend with a 1.2% higher net profit in the first nine months of 2024 compared with the same period in 2023. We also continued to engage actively with NIB’s stakeholders. NIB hosted a seminar for European Long- Term Investors Association (ELTI) in Helsinki. Together with our Board of Directors we visited the Council of Europe Development Bank (CEB) in Paris to maintain our high-level dialogue with other international financial institutions, focusing particularly on climate challenge and social development. Building on our commitment to deepen our partnerships, the quarter marked another significant milestone. NIB and the Republic of Latvia signed a Host Country Agreement to formalise the status of NIB’s regional hub in Riga. The agreement enters into force in November and supports the Bank's strategy to enhance its presence in the Baltics and increase investments in underserved market segments. The new regional hub will enable us to be better connected to the Baltic markets and to drive cross-border investments across the Nordic-Baltic region. In a world with high uncertainty, it is crucial that we sustain close partnerships with our stakeholders and stay close to our clients. The net profit for the period from January to September was strong, amounting to EUR 198 million. The increase in net profit was mainly due to higher net interest income, partly offset by unrealised losses in NIB’s loans remain distributed across various sectors and countries. Total assets at 30 September 2024 financial operations. Loan losses also remain well contained. NIB’s AAA/Aaa credit ratings reflect its high amounted to EUR 41.4 billion, with the total lending outstanding amounting to EUR 22.3 billion. The Bank asset quality, solid liquidity and capital adequacy, strong risk management and governance—and the has raised EUR 8.2 billion in new funding in the first three quarters of 2024, very close to the amount of strength of its owners. EUR 8.5-9.5 billion in the funding plan for the full year. Finally, I would like to thank NIB’s Chief Risk Officer Hilde Kjelsberg, who is retiring in December 2024, for Our strong ambition to accelerate environmentally sustainable projects received yet another quality stamp her many years of service and numerous accomplishments at the Bank. She has played an instrumental when we released our updated green bond framework during the third quarter. The NIB Environmental role in shaping NIB’s modern risk and compliance function. Bond (NEB) framework was accompanied by a Dark Green Second Opinion provided by Standard & Poor’s Global Ratings. Following this, in September, the Bank issued a 5-year EUR 750 million NEB. The transaction was NIB’s largest green bond ever, evidencing the global investor community’s strong support André Küüsvek, President & CEO for the Bank.
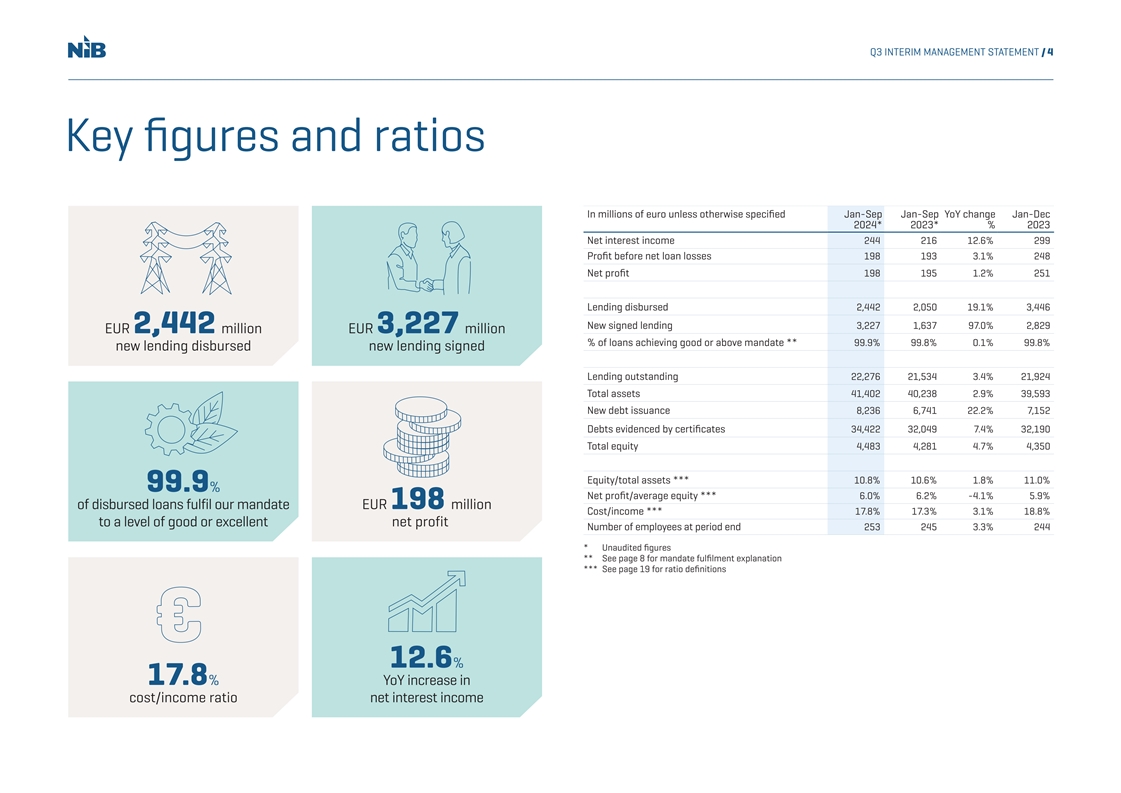
Q3 INTERIM MANAGEMENT STATEMENT / 4 Key figures and ratios In millions of euro unless otherwise specified Jan-Sep Jan-Sep YoY change Jan-Dec 2024* 2023* % 2023 Net interest income 244 216 12.6% 299 Profit before net loan losses 198 193 3.1% 248 Net profit 198 195 1.2% 251 Lending disbursed 2,442 2,050 19.1% 3,446 New signed lending 3,227 1,637 97.0% 2,829 EUR 2,442 million EUR 3,227 million % of loans achieving good or above mandate ** 99.9% 99.8% 0.1% 99.8% new lending disbursed new lending signed Lending outstanding 22,276 21,534 3.4% 21,924 Total assets 41,402 40,238 2.9% 39,593 New debt issuance 8,236 6,741 22.2% 7,152 Debts evidenced by certificates 34,422 32,049 7.4% 32,190 Total equity 4,483 4,281 4.7% 4,350 Equity/total assets *** 10.8% 10.6% 1.8% 11.0% 99.9% Net profit/average equity *** 6.0% 6.2% -4.1% 5.9% of disbursed loans fulfil our mandate EUR 198 million Cost/income *** 17.8% 17.3% 3.1% 18.8% to a level of good or excellent net profit Number of employees at period end 253 245 3.3% 244 * Unaudited figures ** See page 8 for mandate fulfilment explanation *** See page 19 for ratio definitions 12.6% 17.8% YoY increase in cost/income ratio net interest income
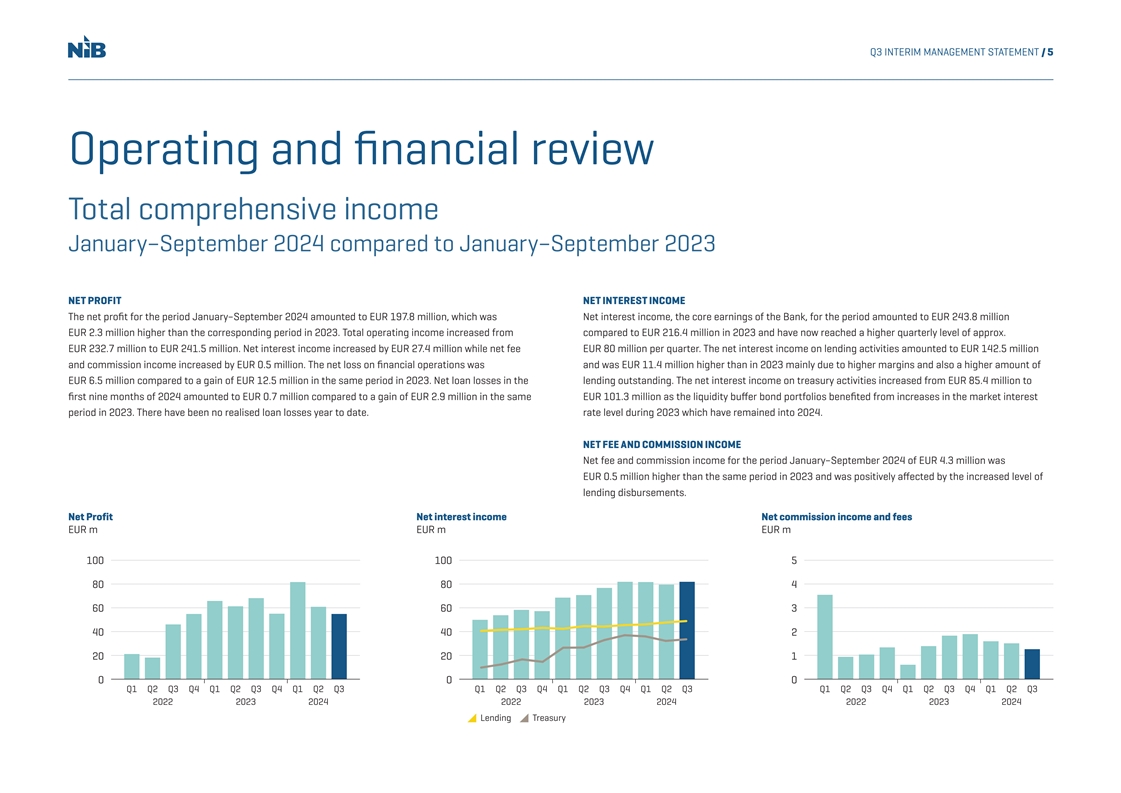
Q3 INTERIM MANAGEMENT STATEMENT / 5 Operating and financial review Total comprehensive income January–September 2024 compared to January–September 2023 NET PROFIT NET INTEREST INCOME The net profit for the period January–September 2024 amounted to EUR 197.8 million, which was Net interest income, the core earnings of the Bank, for the period amounted to EUR 243.8 million EUR 2.3 million higher than the corresponding period in 2023. Total operating income increased from compared to EUR 216.4 million in 2023 and have now reached a higher quarterly level of approx. EUR 232.7 million to EUR 241.5 million. Net interest income increased by EUR 27.4 million while net fee EUR 80 million per quarter. The net interest income on lending activities amounted to EUR 142.5 million and commission income increased by EUR 0.5 million. The net loss on financial operations was and was EUR 11.4 million higher than in 2023 mainly due to higher margins and also a higher amount of EUR 6.5 million compared to a gain of EUR 12.5 million in the same period in 2023. Net loan losses in the lending outstanding. The net interest income on treasury activities increased from EUR 85.4 million to first nine months of 2024 amounted to EUR 0.7 million compared to a gain of EUR 2.9 million in the same EUR 101.3 million as the liquidity buffer bond portfolios benefited from increases in the market interest period in 2023. There have been no realised loan losses year to date. rate level during 2023 which have remained into 2024. NET FEE AND COMMISSION INCOME Net fee and commission income for the period January–September 2024 of EUR 4.3 million was EUR 0.5 million higher than the same period in 2023 and was positively affected by the increased level of lending disbursements. Net Profit Net interest income Net commission income and fees EUR m EUR m EUR m 100 100 5 80 80 4 60 60 3 40 40 2 20 20 1 0 0 0 Q1 Q2 Q3 Q4 Q1 Q2 Q3 Q4 Q1 Q2 Q3 Q1 Q2 Q3 Q4 Q1 Q2 Q3 Q4 Q1 Q2 Q3 Q1 Q2 Q3 Q4 Q1 Q2 Q3 Q4 Q1 Q2 Q3 2022 2023 2024 2022 2023 2024 2022 2023 2024 Lending T reasury
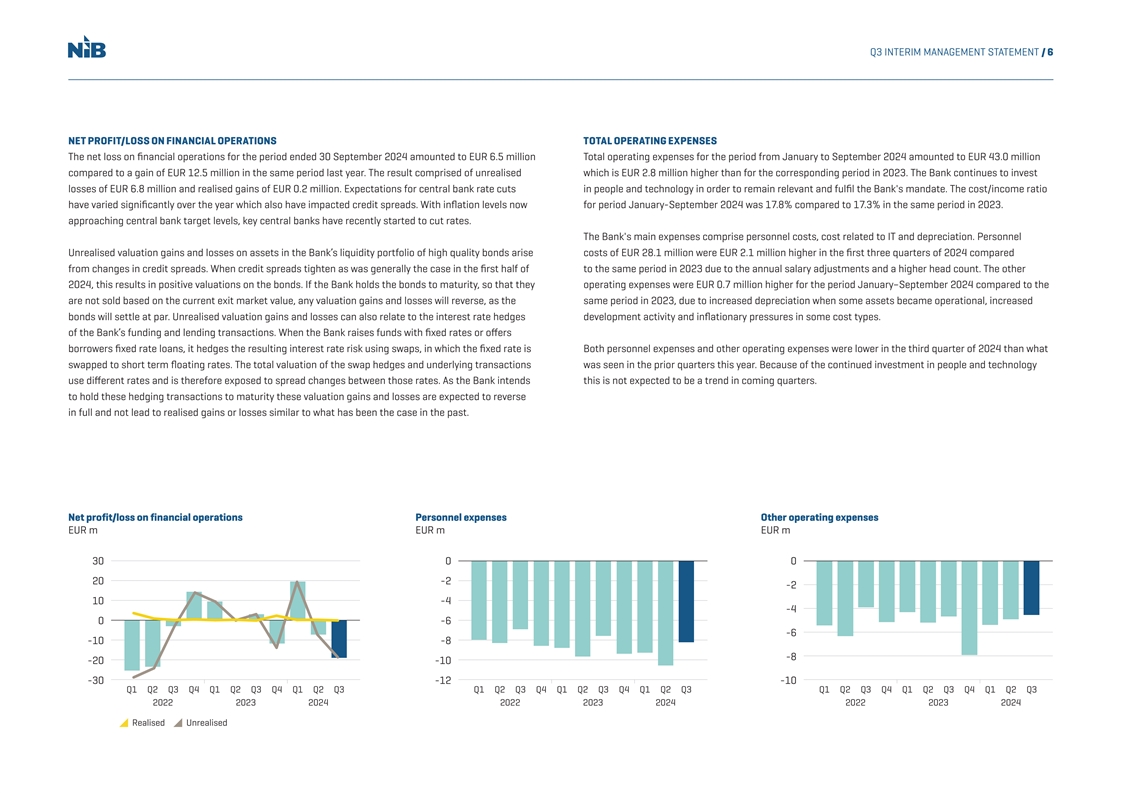
Q3 INTERIM MANAGEMENT STATEMENT / 6 NET PROFIT/LOSS ON FINANCIAL OPERATIONS TOTAL OPERATING EXPENSES The net loss on financial operations for the period ended 30 September 2024 amounted to EUR 6.5 million Total operating expenses for the period from January to September 2024 amounted to EUR 43.0 million compared to a gain of EUR 12.5 million in the same period last year. The result comprised of unrealised which is EUR 2.8 million higher than for the corresponding period in 2023. The Bank continues to invest losses of EUR 6.8 million and realised gains of EUR 0.2 million. Expectations for central bank rate cuts in people and technology in order to remain relevant and fulfil the Bank's mandate. The cost/income ratio have varied significantly over the year which also have impacted credit spreads. With inflation levels now for period January-September 2024 was 17.8% compared to 17.3% in the same period in 2023. approaching central bank target levels, key central banks have recently started to cut rates. The Bank's main expenses comprise personnel costs, cost related to IT and depreciation. Personnel Unrealised valuation gains and losses on assets in the Bank’s liquidity portfolio of high quality bonds arise costs of EUR 28.1 million were EUR 2.1 million higher in the first three quarters of 2024 compared from changes in credit spreads. When credit spreads tighten as was generally the case in the first half of to the same period in 2023 due to the annual salary adjustments and a higher head count. The other 2024, this results in positive valuations on the bonds. If the Bank holds the bonds to maturity, so that they operating expenses were EUR 0.7 million higher for the period January–September 2024 compared to the are not sold based on the current exit market value, any valuation gains and losses will reverse, as the same period in 2023, due to increased depreciation when some assets became operational, increased bonds will settle at par. Unrealised valuation gains and losses can also relate to the interest rate hedges development activity and inflationary pressures in some cost types. of the Bank’s funding and lending transactions. When the Bank raises funds with fixed rates or offers borrowers fixed rate loans, it hedges the resulting interest rate risk using swaps, in which the fixed rate is Both personnel expenses and other operating expenses were lower in the third quarter of 2024 than what swapped to short term floating rates. The total valuation of the swap hedges and underlying transactions was seen in the prior quarters this year. Because of the continued investment in people and technology use different rates and is therefore exposed to spread changes between those rates. As the Bank intends this is not expected to be a trend in coming quarters. to hold these hedging transactions to maturity these valuation gains and losses are expected to reverse in full and not lead to realised gains or losses similar to what has been the case in the past. Net profit/loss on financial operations Personnel expenses Other operating expenses EUR m EUR m EUR m 30 0 0 20 -2 -2 10 -4 -4 0 -6 -6 -10 -8 -8 -20 -10 -30 -12 -10 Q1 Q2 Q3 Q4 Q1 Q2 Q3 Q4 Q1 Q2 Q3 Q1 Q2 Q3 Q4 Q1 Q2 Q3 Q4 Q1 Q2 Q3 Q1 Q2 Q3 Q4 Q1 Q2 Q3 Q4 Q1 Q2 Q3 2022 2023 2024 2022 2023 2024 2022 2023 2024 Realised Unrealised
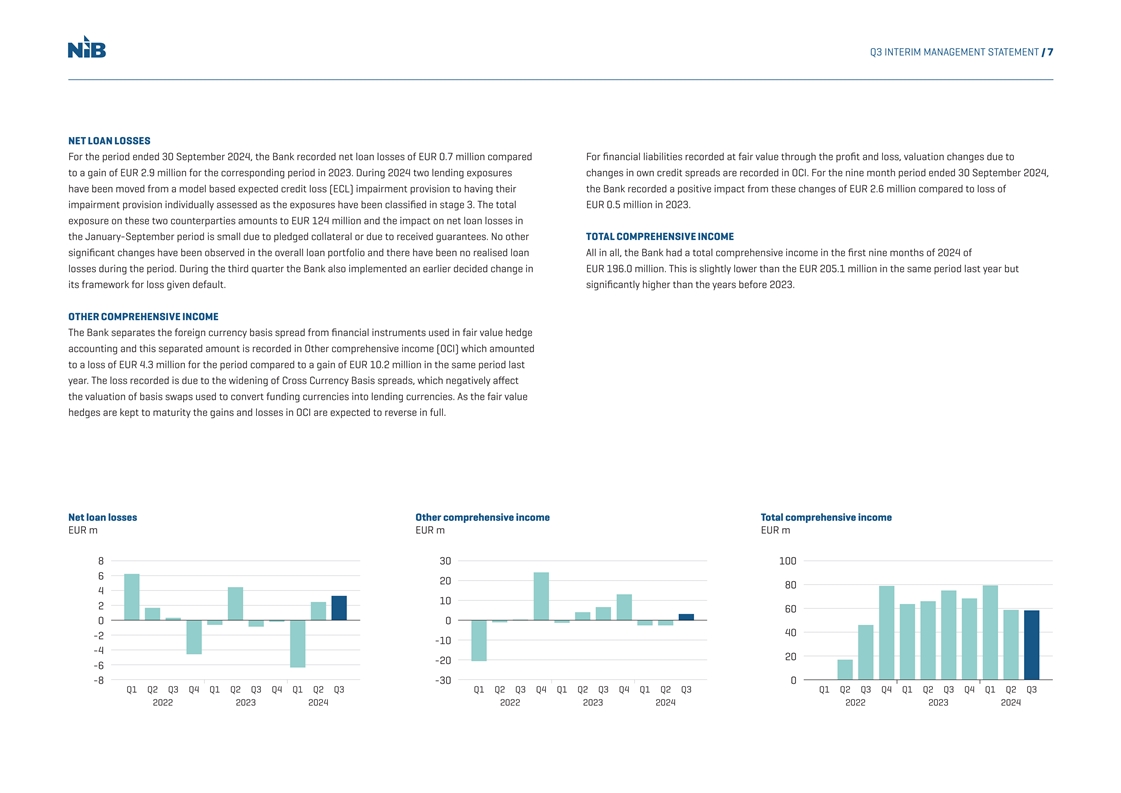
Q3 INTERIM MANAGEMENT STATEMENT / 7 NET LOAN LOSSES For the period ended 30 September 2024, the Bank recorded net loan losses of EUR 0.7 million compared For financial liabilities recorded at fair value through the profit and loss, valuation changes due to to a gain of EUR 2.9 million for the corresponding period in 2023. During 2024 two lending exposures changes in own credit spreads are recorded in OCI. For the nine month period ended 30 September 2024, have been moved from a model based expected credit loss (ECL) impairment provision to having their the Bank recorded a positive impact from these changes of EUR 2.6 million compared to loss of impairment provision individually assessed as the exposures have been classified in stage 3. The total EUR 0.5 million in 2023. exposure on these two counterparties amounts to EUR 124 million and the impact on net loan losses in the January-September period is small due to pledged collateral or due to received guarantees. No other TOTAL COMPREHENSIVE INCOME significant changes have been observed in the overall loan portfolio and there have been no realised loan All in all, the Bank had a total comprehensive income in the first nine months of 2024 of losses during the period. During the third quarter the Bank also implemented an earlier decided change in EUR 196.0 million. This is slightly lower than the EUR 205.1 million in the same period last year but its framework for loss given default. significantly higher than the years before 2023. OTHER COMPREHENSIVE INCOME The Bank separates the foreign currency basis spread from financial instruments used in fair value hedge accounting and this separated amount is recorded in Other comprehensive income (OCI) which amounted to a loss of EUR 4.3 million for the period compared to a gain of EUR 10.2 million in the same period last year. The loss recorded is due to the widening of Cross Currency Basis spreads, which negatively affect the valuation of basis swaps used to convert funding currencies into lending currencies. As the fair value hedges are kept to maturity the gains and losses in OCI are expected to reverse in full. Net loan losses Other comprehensive income Total comprehensive income EUR m EUR m EUR m 8 30 100 6 20 80 4 10 2 60 0 0 40 -2 -10 -4 20 -20 -6 -8 -30 0 Q1 Q2 Q3 Q4 Q1 Q2 Q3 Q4 Q1 Q2 Q3 Q1 Q2 Q3 Q4 Q1 Q2 Q3 Q4 Q1 Q2 Q3 Q1 Q2 Q3 Q4 Q1 Q2 Q3 Q4 Q1 Q2 Q3 2022 2023 2024 2022 2023 2024 2022 2023 2024
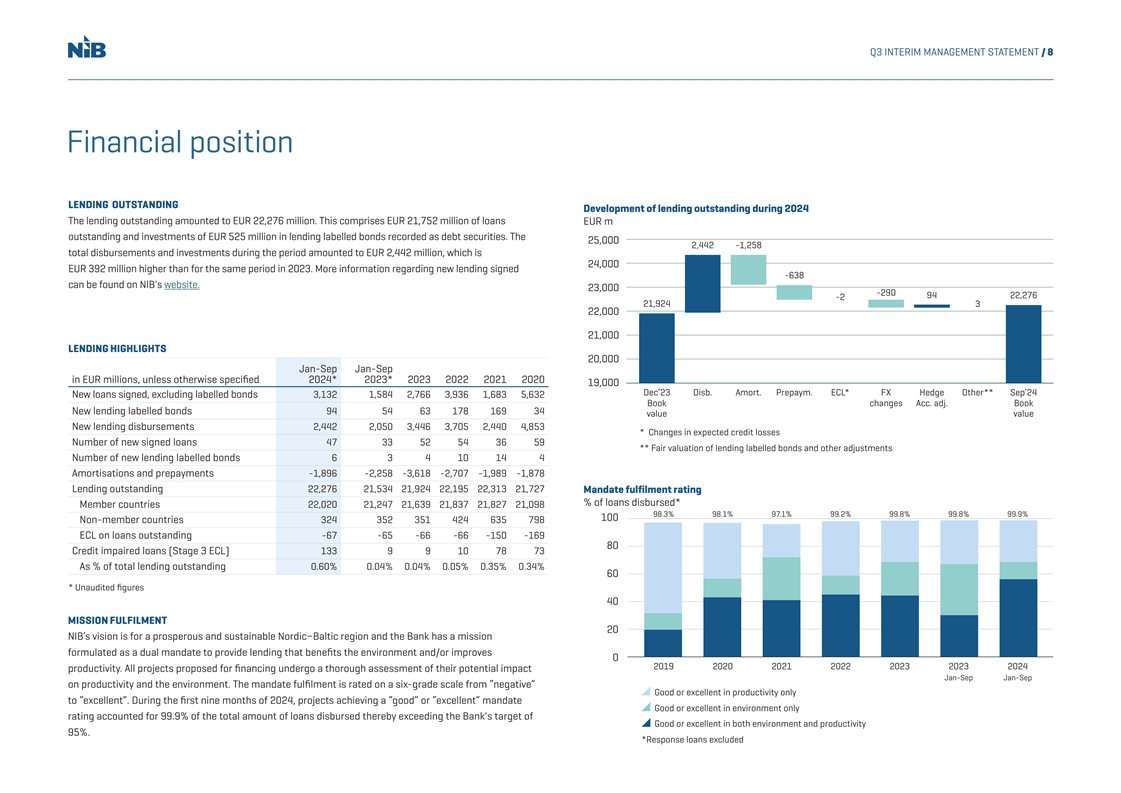
Q3 INTERIM MANAGEMENT STATEMENT / 8 Financial position LENDING OUTSTANDING Development of lending outstanding during 2024 The lending outstanding amounted to EUR 22,276 million. This comprises EUR 21,752 million of loans EUR m outstanding and investments of EUR 525 million in lending labelled bonds recorded as debt securities. The 25,000 2,442 -1,258 total disbursements and investments during the period amounted to EUR 2,442 million, which is 24,000 EUR 392 million higher than for the same period in 2023. More information regarding new lending signed -638 can be found on NIB's website. 23,000 -290 94 22,276 -2 21,924 3 22,000 21,000 LENDING HIGHLIGHTS 20,000 Jan-Sep Jan-Sep in EUR millions, unless otherwise specified 2024* 2023* 2023 2022 2021 2020 19,000 Dec’23 Disb. Amort. Prepaym. ECL* FX Hedge Other** Sep’24 New loans signed, excluding labelled bonds 3,132 1,584 2,766 3,936 1,683 5,632 Book changes Acc. adj. Book New lending labelled bonds 94 54 63 178 169 34 value value New lending disbursements 2,442 2,050 3,446 3,705 2,440 4,853 * Changes in expected credit losses Number of new signed loans 47 33 52 54 36 59 ** Fair valuation of lending labelled bonds and other adjustments Number of new lending labelled bonds 6 3 4 10 14 4 Amortisations and prepayments -1,896 -2,258 -3,618 -2,707 -1,989 -1,878 Lending outstanding 22,276 21,534 21,924 22,195 22,313 21,727 Mandate fulfilment rating % of loans disbursed* Member countries 22,020 21,247 21,639 21,837 21,827 21,098 98.3% 98.1% 97.1% 99.2% 99.8% 99.8% 99.9% 100 Non-member countries 324 352 351 424 635 798 ECL on loans outstanding -67 -65 -66 -66 -150 -169 80 Credit impaired loans (Stage 3 ECL) 133 9 9 10 78 73 As % of total lending outstanding 0.60% 0.04% 0.04% 0.05% 0.35% 0.34% 60 * Unaudited figures 40 MISSION FULFILMENT 20 NIB’s vision is for a prosperous and sustainable Nordic−Baltic region and the Bank has a mission formulated as a dual mandate to provide lending that benefits the environment and/or improves 0 2019 2020 2021 2022 2023 2023 2024 productivity. All projects proposed for financing undergo a thorough assessment of their potential impact Jan-Sep Jan-Sep on productivity and the environment. The mandate fulfilment is rated on a six-grade scale from “negative” Good or excellent in productivity only to “excellent”. During the first nine months of 2024, projects achieving a “good” or “excellent” mandate Good or excellent in environment only rating accounted for 99.9% of the total amount of loans disbursed thereby exceeding the Bank's target of Good or excellent in both environment and productivity 95%. *Response loans excluded
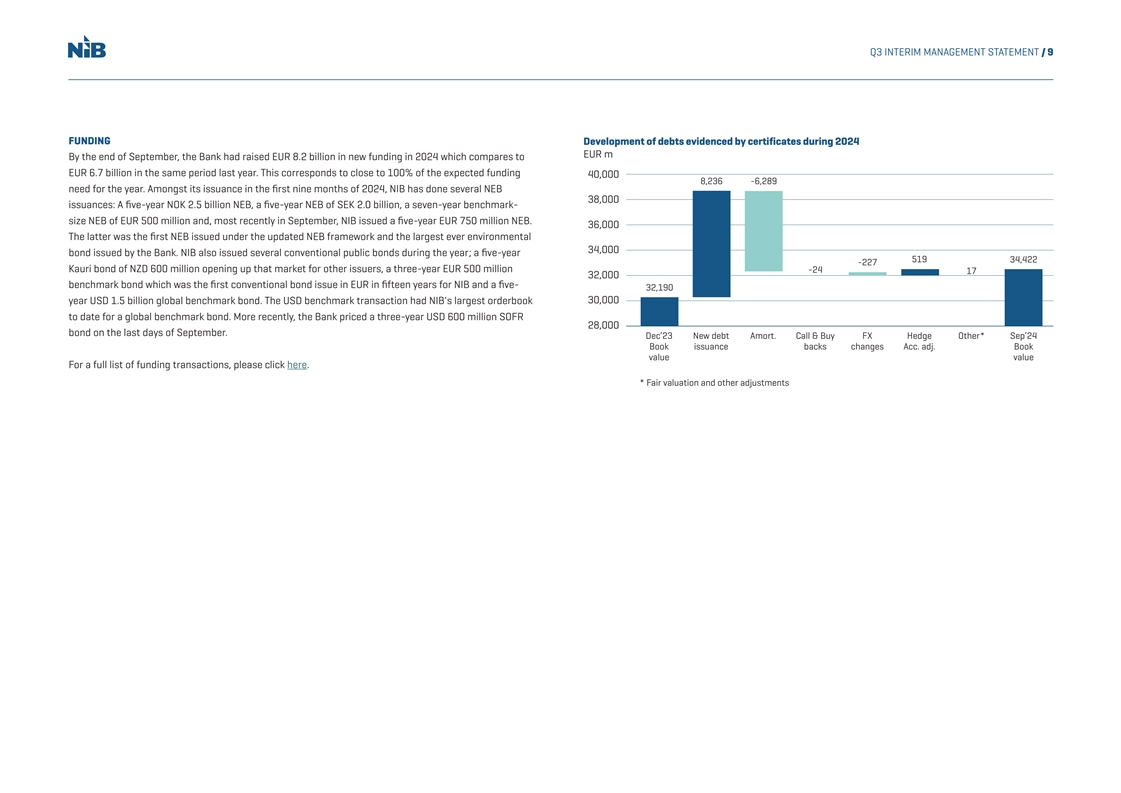
Q3 INTERIM MANAGEMENT STATEMENT / 9 FUNDING Development of debts evidenced by certificates during 2024 EUR m By the end of September, the Bank had raised EUR 8.2 billion in new funding in 2024 which compares to EUR 6.7 billion in the same period last year. This corresponds to close to 100% of the expected funding 40,000 8,236 -6,289 need for the year. Amongst its issuance in the first nine months of 2024, NIB has done several NEB 38,000 issuances: A five-year NOK 2.5 billion NEB, a five-year NEB of SEK 2.0 billion, a seven-year benchmark- size NEB of EUR 500 million and, most recently in September, NIB issued a five-year EUR 750 million NEB. 36,000 The latter was the first NEB issued under the updated NEB framework and the largest ever environmental 34,000 bond issued by the Bank. NIB also issued several conventional public bonds during the year; a five-year 519 34,422 -227 Kauri bond of NZD 600 million opening up that market for other issuers, a three-year EUR 500 million -24 17 32,000 benchmark bond which was the first conventional bond issue in EUR in fifteen years for NIB and a five- 32,190 year USD 1.5 billion global benchmark bond. The USD benchmark transaction had NIB's largest orderbook 30,000 to date for a global benchmark bond. More recently, the Bank priced a three-year USD 600 million SOFR 28,000 bond on the last days of September. Dec’23 New debt Amort. Call & Buy FX Hedge Other* Sep’24 Book issuance backs changes Acc. adj. Book value value For a full list of funding transactions, please click here. * Fair valuation and other adjustments
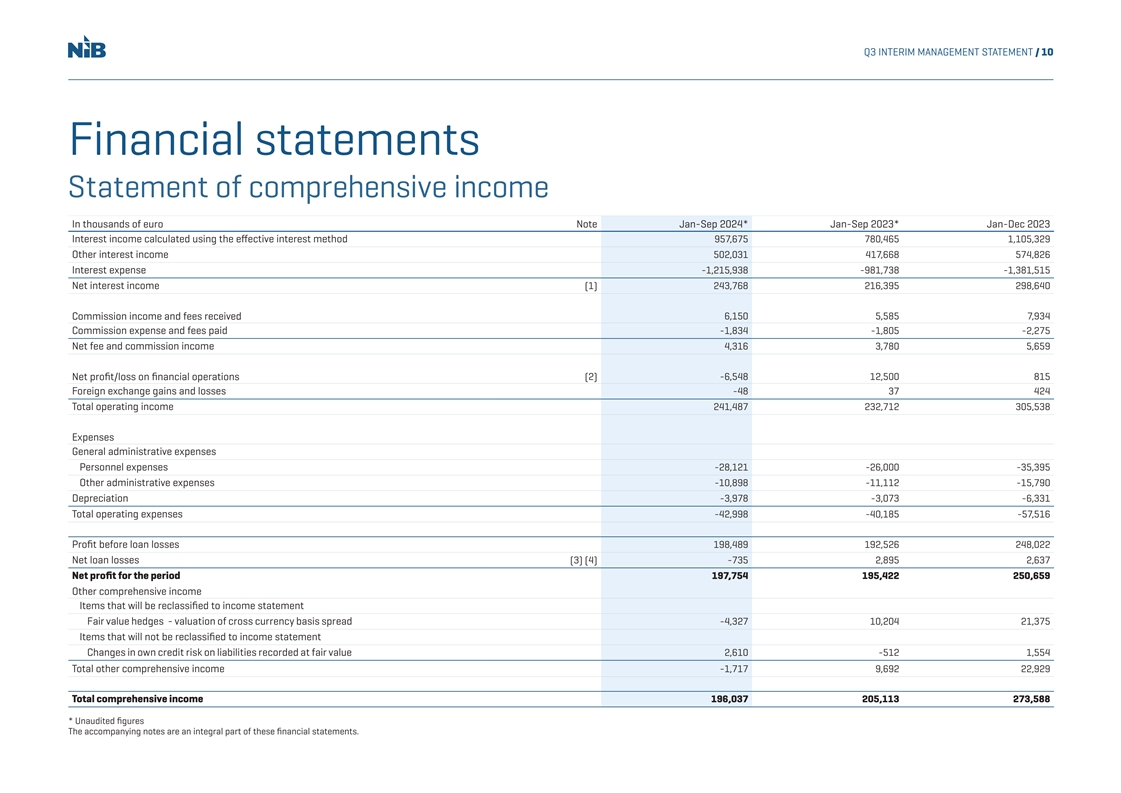
Q3 INTERIM MANAGEMENT STATEMENT / 10 Financial statements Statement of comprehensive income In thousands of euro Note Jan-Sep 2024* Jan-Sep 2023* Jan-Dec 2023 Interest income calculated using the effective interest method 957,675 780,465 1,105,329 Other interest income 502,031 417,668 574,826 Interest expense -1,215,938 -981,738 -1,381,515 Net interest income (1) 243,768 216,395 298,640 Commission income and fees received 6,150 5,585 7,934 Commission expense and fees paid -1,834 -1,805 -2,275 Net fee and commission income 4,316 3,780 5,659 Net profit/loss on financial operations (2) -6,548 12,500 815 Foreign exchange gains and losses -48 37 424 Total operating income 241,487 232,712 305,538 Expenses General administrative expenses Personnel expenses -28,121 -26,000 -35,395 Other administrative expenses -10,898 -11,112 -15,790 Depreciation -3,978 -3,073 -6,331 Total operating expenses -42,998 -40,185 -57,516 Profit before loan losses 198,489 192,526 248,022 Net loan losses (3) (4) -735 2,895 2,637 Net profit for the period 197,754 195,422 250,659 Other comprehensive income Items that will be reclassified to income statement Fair value hedges - valuation of cross currency basis spread -4,327 10,204 21,375 Items that will not be reclassified to income statement Changes in own credit risk on liabilities recorded at fair value 2,610 -512 1,554 Total other comprehensive income -1,717 9,692 22,929 Total comprehensive income 196,037 205,113 273,588 * Unaudited figures The accompanying notes are an integral part of these financial statements.
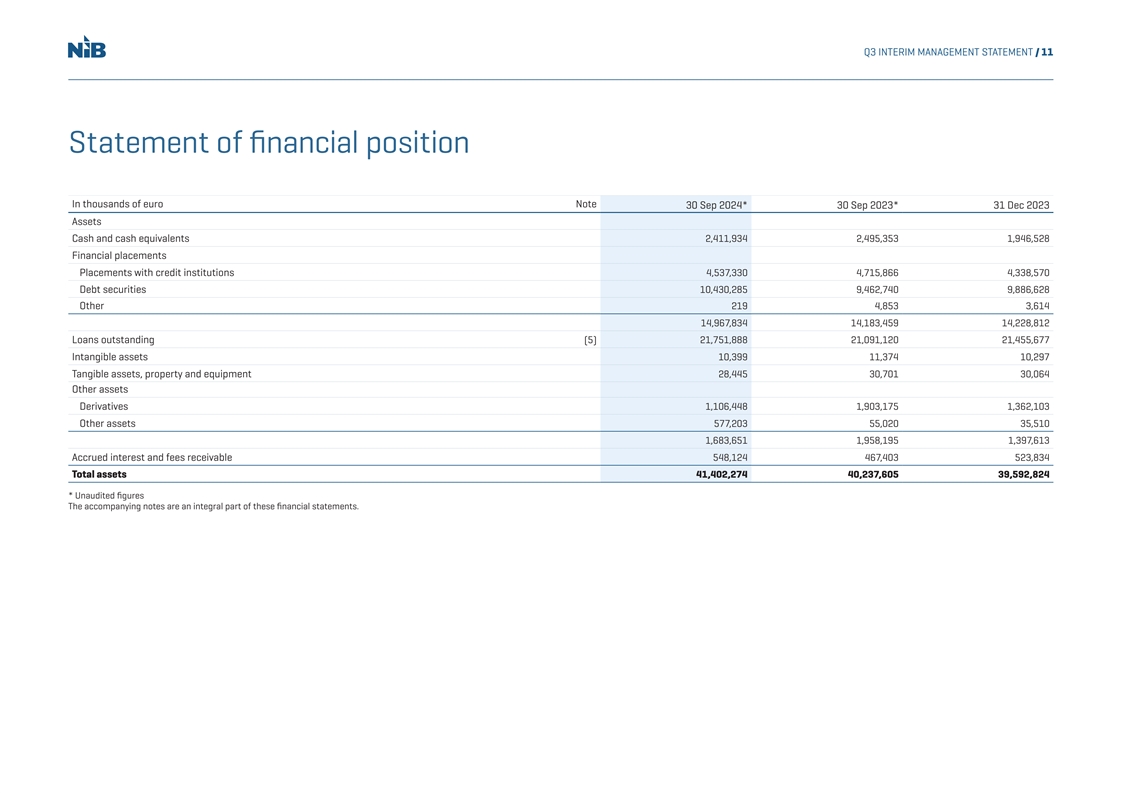
Q3 INTERIM MANAGEMENT STATEMENT / 11 Statement of financial position In thousands of euro Note 30 Sep 2024* 30 Sep 2023* 31 Dec 2023 Assets Cash and cash equivalents 2,411,934 2,495,353 1,946,528 Financial placements Placements with credit institutions 4,537,330 4,715,866 4,338,570 Debt securities 10,430,285 9,462,740 9,886,628 Other 219 4,853 3,614 14,967,834 14,183,459 14,228,812 Loans outstanding (5) 21,751,888 21,091,120 21,455,677 Intangible assets 10,399 11,374 10,297 Tangible assets, property and equipment 28,445 30,701 30,064 Other assets Derivatives 1,106,448 1,903,175 1,362,103 Other assets 577,203 55,020 35,510 1,683,651 1,958,195 1,397,613 Accrued interest and fees receivable 548,124 467,403 523,834 Total assets 41,402,274 40,237,605 39,592,824 * Unaudited figures The accompanying notes are an integral part of these financial statements.
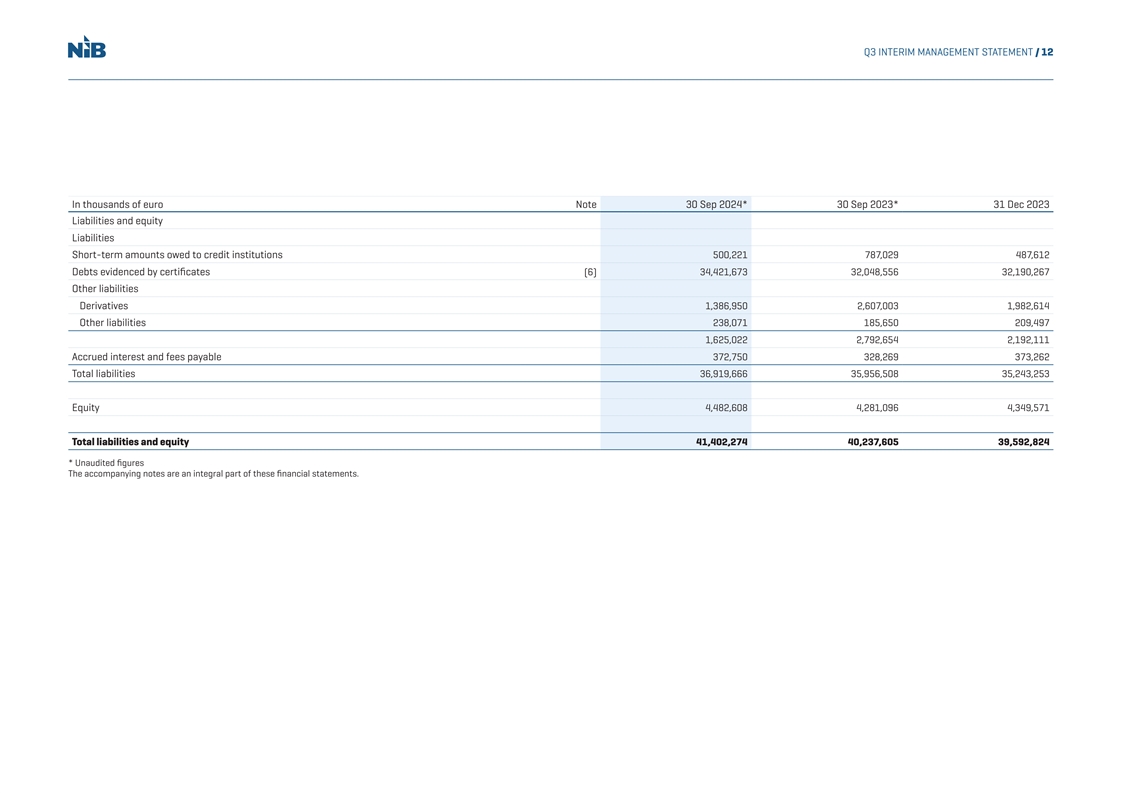
Q3 INTERIM MANAGEMENT STATEMENT / 12 In thousands of euro Note 30 Sep 2024* 30 Sep 2023* 31 Dec 2023 Liabilities and equity Liabilities Short-term amounts owed to credit institutions 500,221 787,029 487,612 Debts evidenced by certificates (6) 34,421,673 32,048,556 32,190,267 Other liabilities Derivatives 1,386,950 2,607,003 1,982,614 Other liabilities 238,071 185,650 209,497 1,625,022 2,792,654 2,192,111 Accrued interest and fees payable 372,750 328,269 373,262 Total liabilities 36,919,666 35,956,508 35,243,253 Equity 4,482,608 4,281,096 4,349,571 Total liabilities and equity 41,402,274 40,237,605 39,592,824 * Unaudited figures The accompanying notes are an integral part of these financial statements.
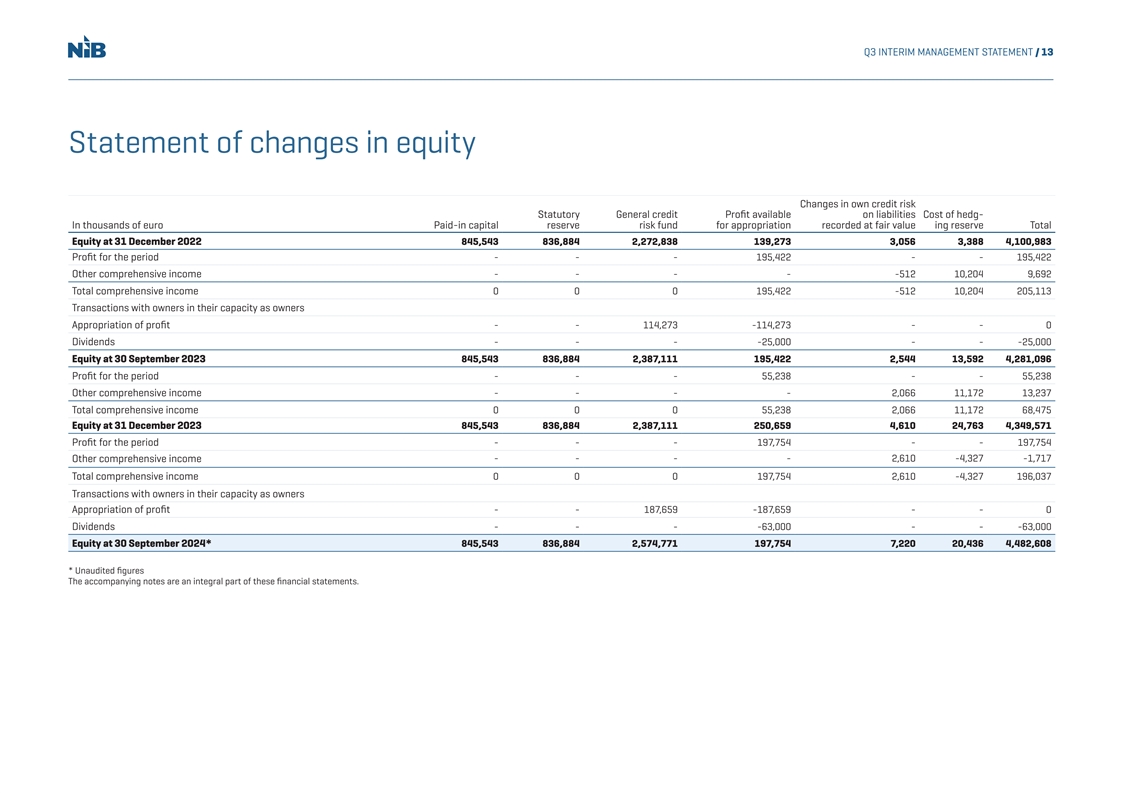
Q3 INTERIM MANAGEMENT STATEMENT / 13 Statement of changes in equity Changes in own credit risk Statutory General credit Profit available on liabilities Cost of hedg- In thousands of euro Paid-in capital reserve risk fund for appropriation recorded at fair value ing reserve Total Equity at 31 December 2022 845,543 836,884 2,272,838 139,273 3,056 3,388 4,100,983 Profit for the period - - - 195,422 - - 195,422 Other comprehensive income - - - - -512 10,204 9,692 Total comprehensive income 0 0 0 195,422 -512 10,204 205,113 Transactions with owners in their capacity as owners Appropriation of profit - - 114,273 -114,273 - - 0 Dividends - - - -25,000 - - -25,000 Equity at 30 September 2023 845,543 836,884 2,387,111 195,422 2,544 13,592 4,281,096 Profit for the period - - - 55,238 - - 55,238 Other comprehensive income - - - - 2,066 11,172 13,237 Total comprehensive income 0 0 0 55,238 2,066 11,172 68,475 Equity at 31 December 2023 845,543 836,884 2,387,111 250,659 4,610 24,763 4,349,571 Profit for the period - - - 197,754 - - 197,754 - - - - 2,610 -4,327 -1,717 Other comprehensive income Total comprehensive income 0 0 0 197,754 2,610 -4,327 196,037 Transactions with owners in their capacity as owners Appropriation of profit - - 187,659 -187,659 - - 0 Dividends - - - -63,000 - - -63,000 Equity at 30 September 2024* 845,543 836,884 2,574,771 197,754 7,220 20,436 4,482,608 * Unaudited figures The accompanying notes are an integral part of these financial statements.
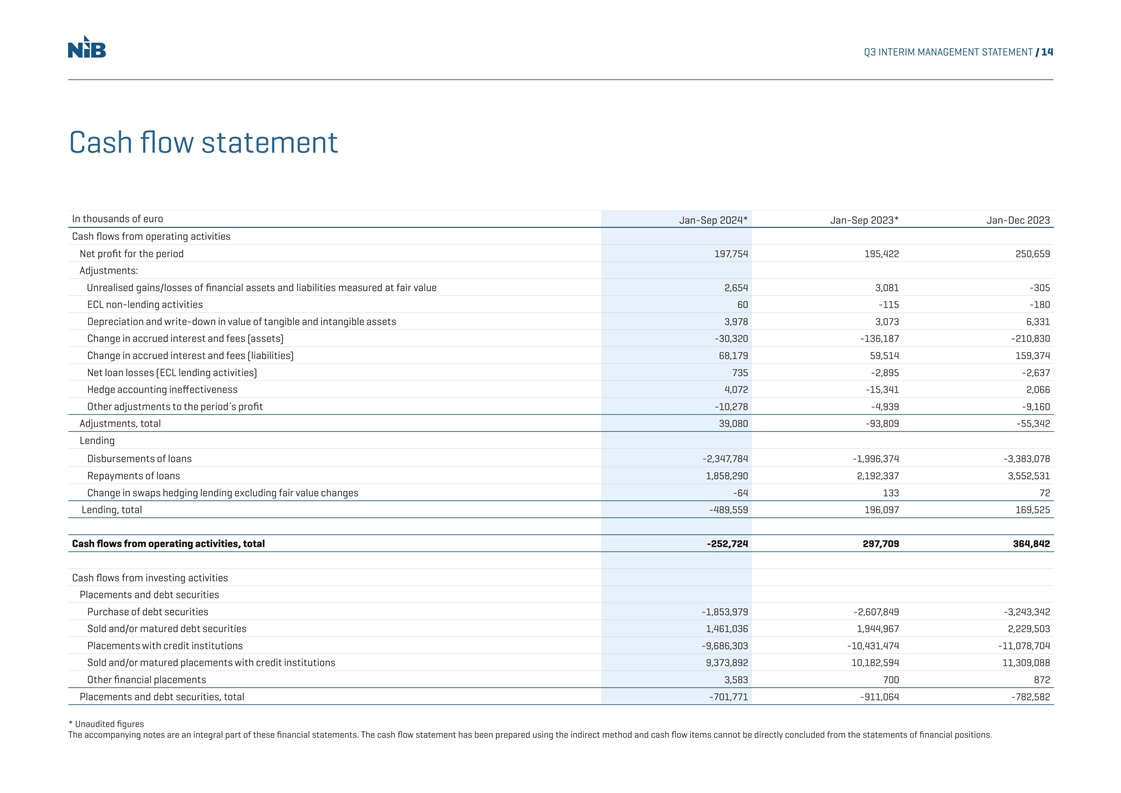
Q3 INTERIM MANAGEMENT STATEMENT / 14 Cash flow statement In thousands of euro Jan-Sep 2024* Jan-Sep 2023* Jan-Dec 2023 Cash flows from operating activities Net profit for the period 197,754 195,422 250,659 Adjustments: Unrealised gains/losses of financial assets and liabilities measured at fair value 2,654 3,081 -305 ECL non-lending activities 60 -115 -180 Depreciation and write-down in value of tangible and intangible assets 3,978 3,073 6,331 Change in accrued interest and fees (assets) -30,320 -136,187 -210,830 Change in accrued interest and fees (liabilities) 68,179 59,514 159,374 Net loan losses (ECL lending activities) 735 -2,895 -2,637 Hedge accounting ineffectiveness 4,072 -15,341 2,066 Other adjustments to the period´s profit -10,278 -4,939 -9,160 Adjustments, total 39,080 -93,809 -55,342 Lending Disbursements of loans -2,347,784 -1,996,374 -3,383,078 Repayments of loans 1,858,290 2,192,337 3,552,531 Change in swaps hedging lending excluding fair value changes -64 133 72 Lending, total -489,559 196,097 169,525 Cash flows from operating activities, total -252,724 297,709 364,842 Cash flows from investing activities Placements and debt securities Purchase of debt securities -1,853,979 -2,607,849 -3,243,342 Sold and/or matured debt securities 1,461,036 1,944,967 2,229,503 Placements with credit institutions -9,686,303 -10,431,474 -11,078,704 Sold and/or matured placements with credit institutions 9,373,892 10,182,594 11,309,088 Other financial placements 3,583 700 872 Placements and debt securities, total -701,771 -911,064 -782,582 * Unaudited figures The accompanying notes are an integral part of these financial statements. The cash flow statement has been prepared using the indirect method and cash flow items cannot be directly concluded from the statements of financial positions.
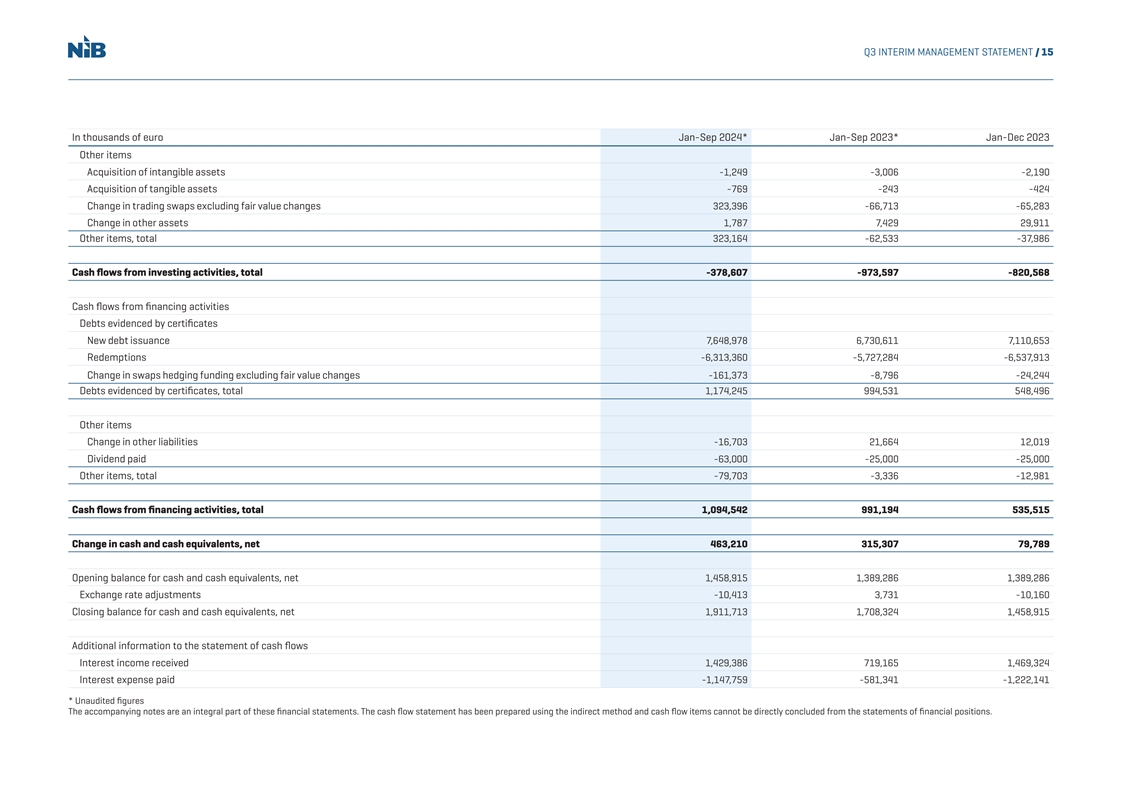
Q3 INTERIM MANAGEMENT STATEMENT / 15 In thousands of euro Jan-Sep 2024* Jan-Sep 2023* Jan-Dec 2023 Other items Acquisition of intangible assets -1,249 -3,006 -2,190 Acquisition of tangible assets -769 -243 -424 Change in trading swaps excluding fair value changes 323,396 -66,713 -65,283 Change in other assets 1,787 7,429 29,911 Other items, total 323,164 -62,533 -37,986 Cash flows from investing activities, total -378,607 -973,597 -820,568 Cash flows from financing activities Debts evidenced by certificates New debt issuance 7,648,978 6,730,611 7,110,653 Redemptions -6,313,360 -5,727,284 -6,537,913 Change in swaps hedging funding excluding fair value changes -161,373 -8,796 -24,244 Debts evidenced by certificates, total 1,174,245 994,531 548,496 Other items Change in other liabilities -16,703 21,664 12,019 Dividend paid -63,000 -25,000 -25,000 Other items, total -79,703 -3,336 -12,981 Cash flows from financing activities, total 1,094,542 991,194 535,515 Change in cash and cash equivalents, net 463,210 315,307 79,789 Opening balance for cash and cash equivalents, net 1,458,915 1,389,286 1,389,286 Exchange rate adjustments -10,413 3,731 -10,160 Closing balance for cash and cash equivalents, net 1,911,713 1,708,324 1,458,915 Additional information to the statement of cash flows Interest income received 1,429,386 719,165 1,469,324 Interest expense paid -1,147,759 -581,341 -1,222,141 * Unaudited figures The accompanying notes are an integral part of these financial statements. The cash flow statement has been prepared using the indirect method and cash flow items cannot be directly concluded from the statements of financial positions.
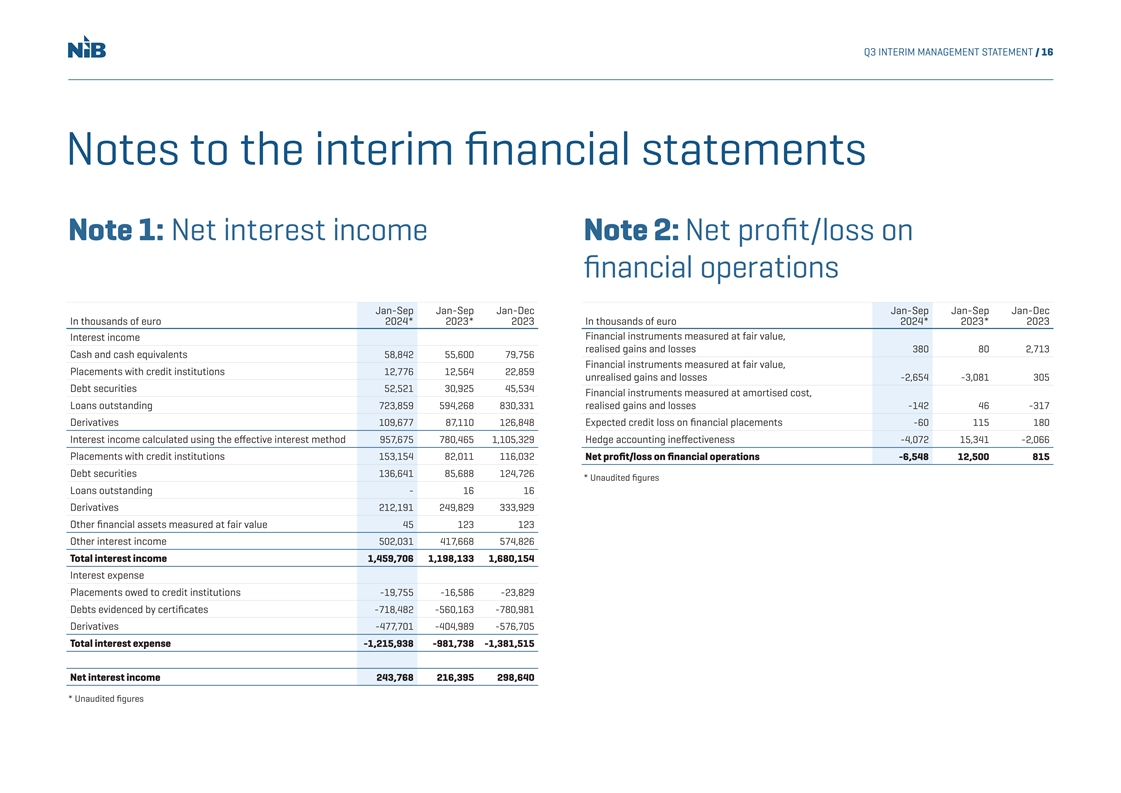
Q3 INTERIM MANAGEMENT STATEMENT / 16 Notes to the interim financial statements Note 1: Net interest income Note 2: Net profit/loss on n fi ancial operations Jan-Sep Jan-Sep Jan-Dec Jan-Sep Jan-Sep Jan-Dec In thousands of euro 2024* 2023* 2023 In thousands of euro 2024* 2023* 2023 Financial instruments measured at fair value, Interest income realised gains and losses 380 80 2,713 Cash and cash equivalents 58,842 55,600 79,756 Financial instruments measured at fair value, Placements with credit institutions 12,776 12,564 22,859 unrealised gains and losses -2,654 -3,081 305 Debt securities 52,521 30,925 45,534 Financial instruments measured at amortised cost, Loans outstanding 723,859 594,268 830,331 realised gains and losses -142 46 -317 Derivatives 109,677 87,110 126,848 Expected credit loss on financial placements -60 115 180 Interest income calculated using the effective interest method 957,675 780,465 1,105,329 Hedge accounting ineffectiveness -4,072 15,341 -2,066 Placements with credit institutions 153,154 82,011 116,032 Net profit/loss on financial operations -6,548 12,500 815 Debt securities 136,641 85,688 124,726 * Unaudited figures Loans outstanding - 16 16 Derivatives 212,191 249,829 333,929 Other financial assets measured at fair value 45 123 123 Other interest income 502,031 417,668 574,826 Total interest income 1,459,706 1,198,133 1,680,154 Interest expense Placements owed to credit institutions -19,755 -16,586 -23,829 Debts evidenced by certificates -718,482 -560,163 -780,981 Derivatives -477,701 -404,989 -576,705 Total interest expense -1,215,938 -981,738 -1,381,515 Net interest income 243,768 216,395 298,640 * Unaudited figures
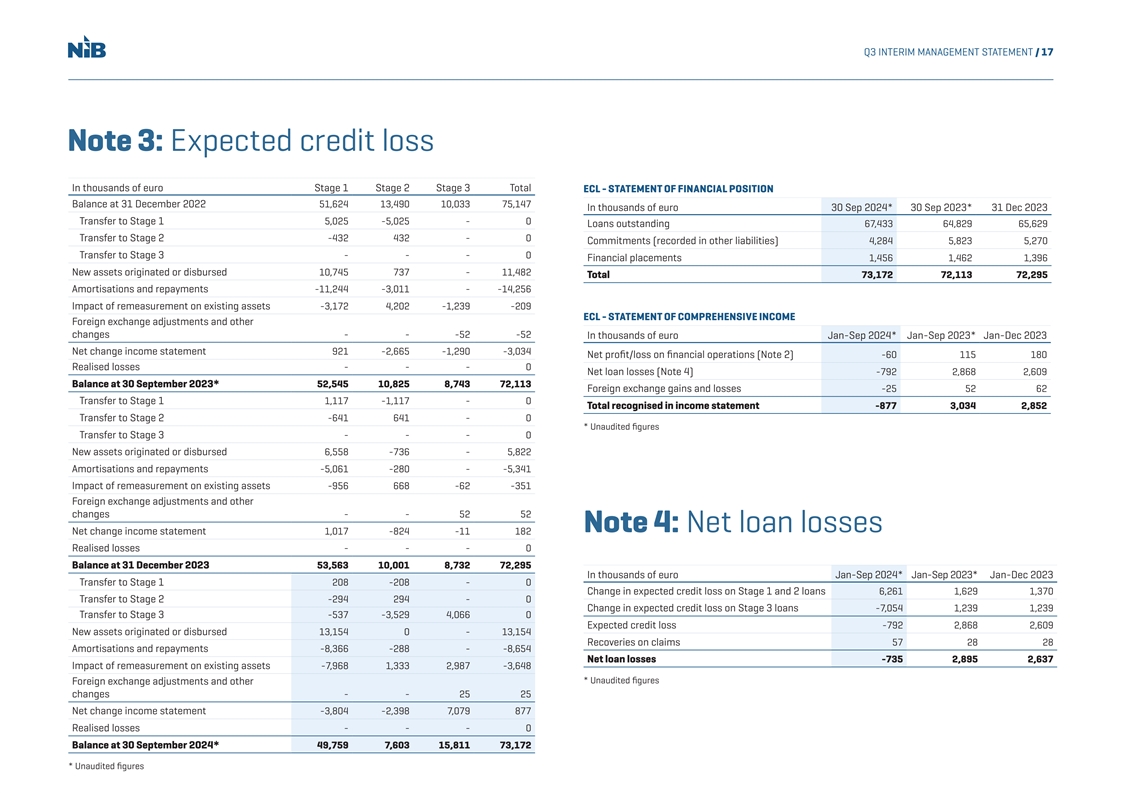
Q3 INTERIM MANAGEMENT STATEMENT / 17 Note 3: Expected credit loss In thousands of euro Stage 1 Stage 2 Stage 3 Total ECL - STATEMENT OF FINANCIAL POSITION Balance at 31 December 2022 51,624 13,490 10,033 75,147 In thousands of euro 30 Sep 2024* 30 Sep 2023* 31 Dec 2023 Transfer to Stage 1 5,025 -5,025 - 0 Loans outstanding 67,433 64,829 65,629 Transfer to Stage 2 -432 432 - 0 Commitments (recorded in other liabilities) 4,284 5,823 5,270 Transfer to Stage 3 - - - 0 Financial placements 1,456 1,462 1,396 New assets originated or disbursed 10,745 737 - 11,482 Total 73,172 72,113 72,295 Amortisations and repayments -11,244 -3,011 - -14,256 Impact of remeasurement on existing assets -3,172 4,202 -1,239 -209 ECL - STATEMENT OF COMPREHENSIVE INCOME Foreign exchange adjustments and other changes - - -52 -52 In thousands of euro Jan-Sep 2024* Jan-Sep 2023* Jan-Dec 2023 Net change income statement 921 -2,665 -1,290 -3,034 Net profit/loss on financial operations (Note 2) -60 115 180 Realised losses - - - 0 Net loan losses (Note 4) -792 2,868 2,609 Balance at 30 September 2023* 52,545 10,825 8,743 72,113 Foreign exchange gains and losses -25 52 62 Transfer to Stage 1 1,117 -1,117 - 0 Total recognised in income statement -877 3,034 2,852 Transfer to Stage 2 -641 641 - 0 * Unaudited figures Transfer to Stage 3 - - - 0 New assets originated or disbursed 6,558 -736 - 5,822 Amortisations and repayments -5,061 -280 - -5,341 Impact of remeasurement on existing assets -956 668 -62 -351 Foreign exchange adjustments and other changes - - 52 52 Note 4: Net loan losses Net change income statement 1,017 -824 -11 182 Realised losses - - - 0 Balance at 31 December 2023 53,563 10,001 8,732 72,295 In thousands of euro Jan-Sep 2024* Jan-Sep 2023* Jan-Dec 2023 Transfer to Stage 1 208 -208 - 0 Change in expected credit loss on Stage 1 and 2 loans 6,261 1,629 1,370 Transfer to Stage 2 -294 294 - 0 Change in expected credit loss on Stage 3 loans -7,054 1,239 1,239 Transfer to Stage 3 -537 -3,529 4,066 0 Expected credit loss -792 2,868 2,609 New assets originated or disbursed 13,154 0 - 13,154 Recoveries on claims 57 28 28 Amortisations and repayments -8,366 -288 - -8,654 Net loan losses -735 2,895 2,637 Impact of remeasurement on existing assets -7,968 1,333 2,987 -3,648 * Unaudited figures Foreign exchange adjustments and other changes - - 25 25 Net change income statement -3,804 -2,398 7,079 877 Realised losses - - - 0 Balance at 30 September 2024* 49,759 7,603 15,811 73,172 * Unaudited figures
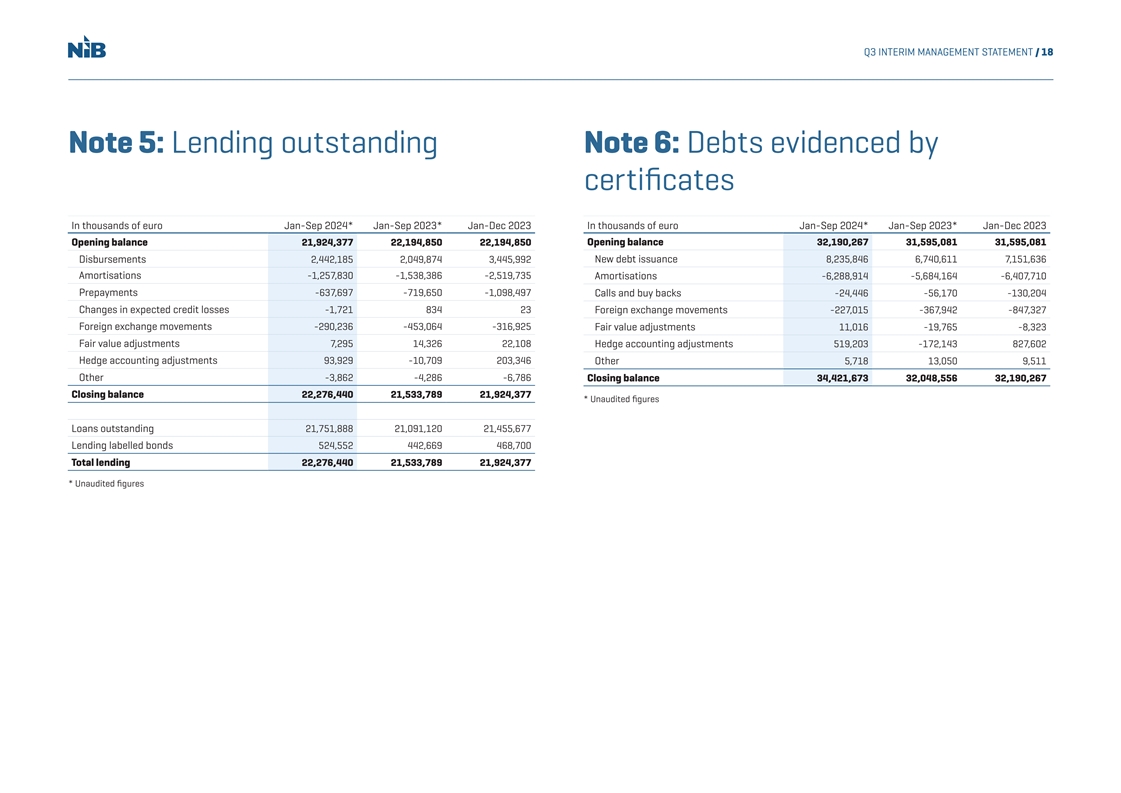
Q3 INTERIM MANAGEMENT STATEMENT / 18 Note 5: Lending outstanding Note 6: Debts evidenced by certicate fi s In thousands of euro Jan-Sep 2024* Jan-Sep 2023* Jan-Dec 2023 In thousands of euro Jan-Sep 2024* Jan-Sep 2023* Jan-Dec 2023 Opening balance 21,924,377 22,194,850 22,194,850 Opening balance 32,190,267 31,595,081 31,595,081 Disbursements 2,442,185 2,049,874 3,445,992 New debt issuance 8,235,846 6,740,611 7,151,636 Amortisations -1,257,830 -1,538,386 -2,519,735 Amortisations -6,288,914 -5,684,164 -6,407,710 Prepayments -637,697 -719,650 -1,098,497 Calls and buy backs -24,446 -56,170 -130,204 Changes in expected credit losses -1,721 834 23 Foreign exchange movements -227,015 -367,942 -847,327 Foreign exchange movements -290,236 -453,064 -316,925 Fair value adjustments 11,016 -19,765 -8,323 Fair value adjustments 7,295 14,326 22,108 Hedge accounting adjustments 519,203 -172,143 827,602 Hedge accounting adjustments 93,929 -10,709 203,346 Other 5,718 13,050 9,511 Other -3,862 -4,286 -6,786 Closing balance 34,421,673 32,048,556 32,190,267 Closing balance 22,276,440 21,533,789 21,924,377 * Unaudited figures Loans outstanding 21,751,888 21,091,120 21,455,677 Lending labelled bonds 524,552 442,669 468,700 Total lending 22,276,440 21,533,789 21,924,377 * Unaudited figures
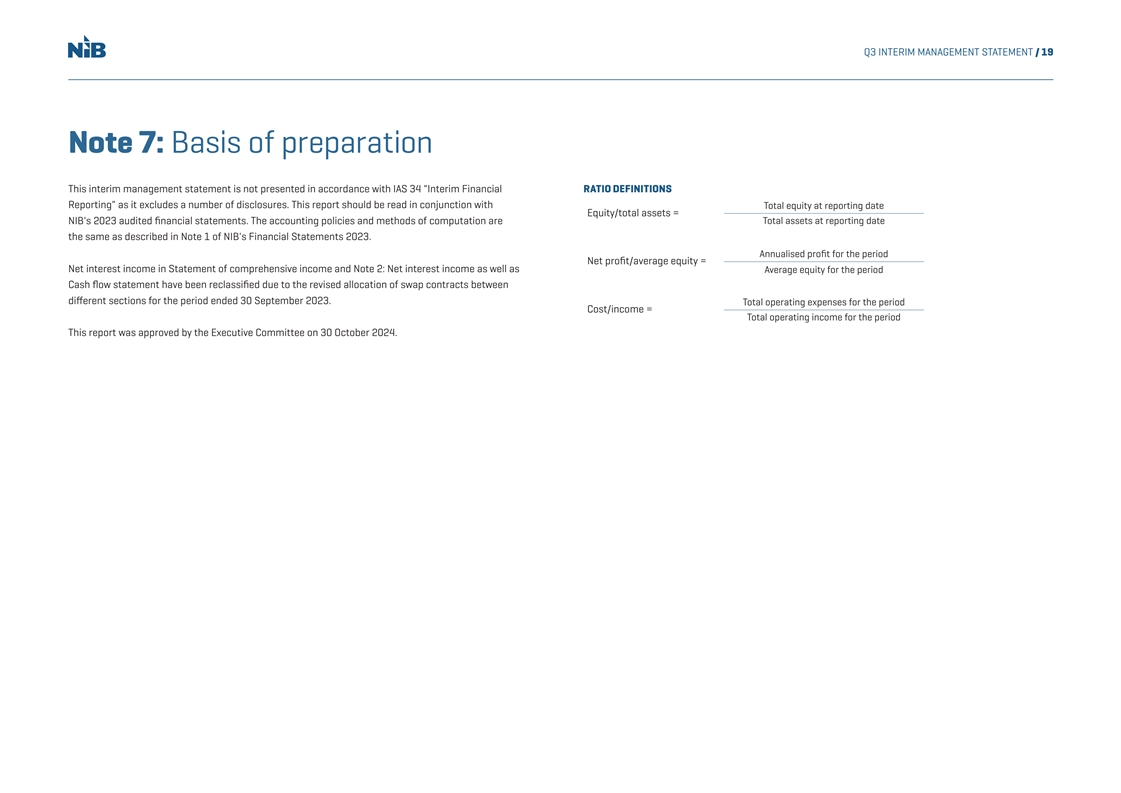
Q3 INTERIM MANAGEMENT STATEMENT / 19 Note 7: Basis of preparation This interim management statement is not presented in accordance with IAS 34 Interim Financial RATIO DEFINITIONS Reporting as it excludes a number of disclosures. This report should be read in conjunction with Total equity at reporting date Equity/total assets = NIB's 2023 audited financial statements. The accounting policies and methods of computation are Total assets at reporting date the same as described in Note 1 of NIB's Financial Statements 2023. Annualised profit for the period Net profit/average equity = Net interest income in Statement of comprehensive income and Note 2: Net interest income as well as Average equity for the period Cash flow statement have been reclassified due to the revised allocation of swap contracts between different sections for the period ended 30 September 2023. Total operating expenses for the period Cost/income = Total operating income for the period This report was approved by the Executive Committee on 30 October 2024.

CONTACT Kim Skov Jensen Jens Hellerup Jukka Ahonen Vice President & CFO Senior Director, Senior Director, kim.jensen@nib.int Head of Funding & Head of Communications Investor Relations jukka.ahonen@nib.int jens.hellerup@nib.int For more information about the Nordic Investment Bank, visit www.nib.int