UNITED STATES
SECURITIES AND EXCHANGE COMMISSION
Washington, D.C. 20549
FORM N-CSR
CERTIFIED SHAREHOLDER REPORT OF REGISTERED
MANAGEMENT INVESTMENT COMPANIES
Investment Company Act file number 811-03361
Fidelity Massachusetts Municipal Trust
(Exact name of registrant as specified in charter)
245 Summer St., Boston, Massachusetts 02210
(Address of principal executive offices) (Zip code)
Cynthia Lo Bessette, Secretary
245 Summer St.
Boston, Massachusetts 02210
(Name and address of agent for service)
Registrant's telephone number, including area code:
617-563-7000
Date of fiscal year end: | January 31 |
Date of reporting period: | January 31, 2023 |
Item 1.
Reports to Stockholders


Contents
| Average Annual Total Returns | |||
Periods ended January 31, 2023 | Past 1 year | Past 5 years | Past 10 years |
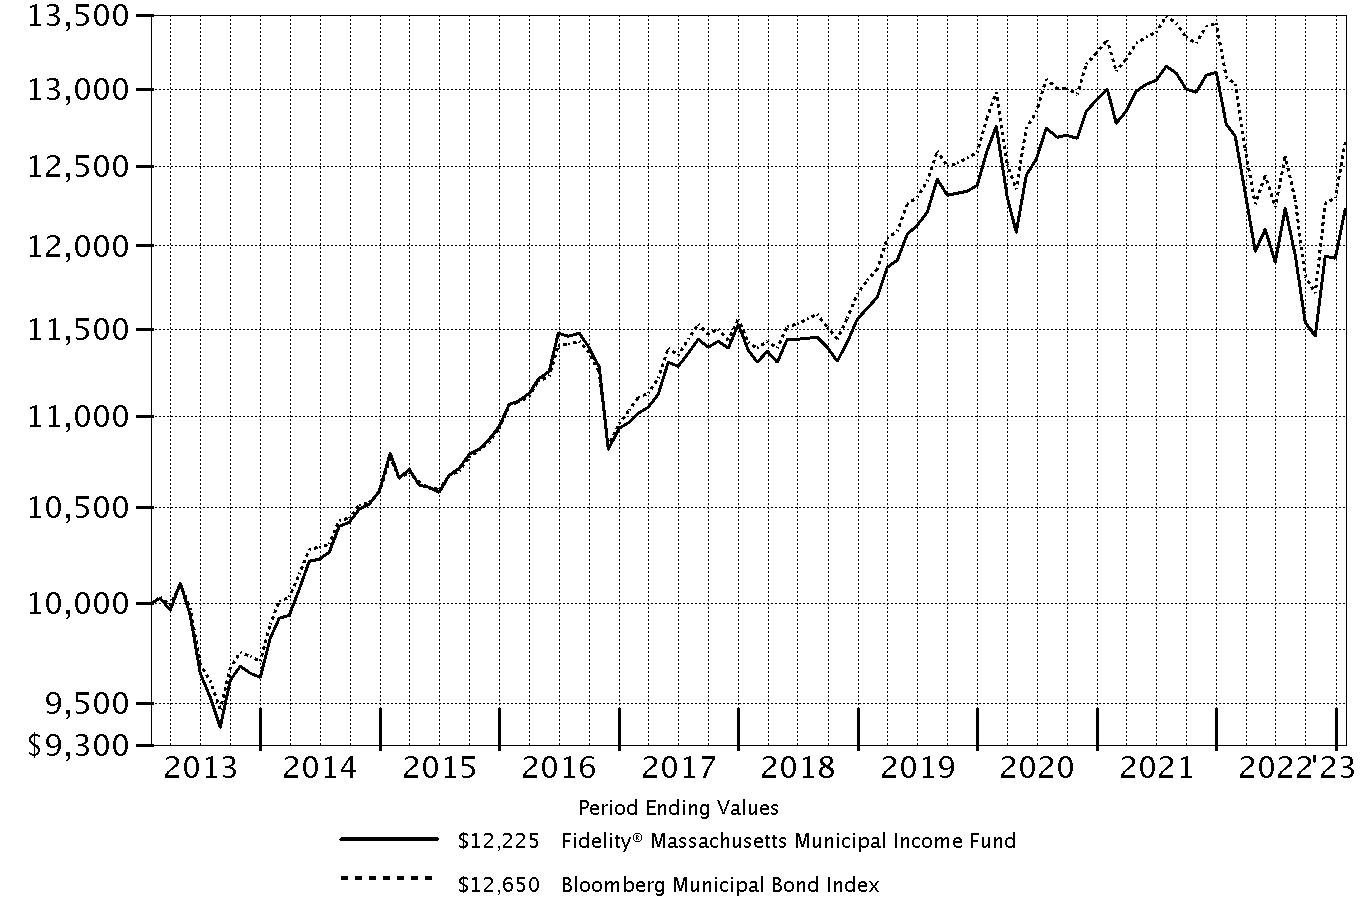
| Fidelity® Massachusetts Municipal Income Fund | -4.24% | 1.45% | 2.03% |
| $10,000 Over 10 Years |
Let's say hypothetically that $10,000 was invested in Fidelity® Massachusetts Municipal Income Fund on January 31, 2013. The chart shows how the value of your investment would have changed, and also shows how the Bloomberg Municipal Bond Index performed over the same period. |
 |
| Revenue Sources (% of Fund's net assets) | ||
| Education | 21.4% | |
| General Obligations | 21.2% | |
| Health Care | 14.6% | |
| Special Tax | 13.7% | |
| Other | 12.0% | |
| Transportation | 11.5% | |
| Others* (Individually Less Than 5%) | 5.6% | |
| 100.0% | ||
| *Includes net other assets | ||
Quality Diversification (% of Fund's net assets) |
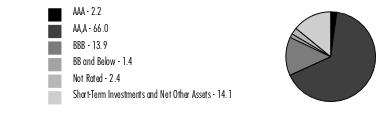 |
| We have used ratings from Moody's Investors Service, Inc. Where Moody's® ratings are not available, we have used S&P® ratings. All ratings are as of the date indicated and do not reflect subsequent changes. |
| Municipal Bonds - 85.9% | |||
Principal Amount (a) | Value ($) | ||
| Massachusetts - 84.7% | |||
| Ashland Gen. Oblig. Series 2022: | |||
| 4% 8/1/38 | 1,700,000 | 1,773,140 | |
| 4% 8/1/39 | 1,685,000 | 1,750,489 | |
| Attleboro Gen. Oblig.: | |||
| Series 2020 B, 3% 10/15/36 | 2,630,000 | 2,463,889 | |
| Series 2020, 2.625% 10/15/50 | 6,880,000 | 4,869,755 | |
| Series 70 B, 5% 10/15/29 | 1,585,000 | 1,821,250 | |
| Berkshire Wind Pwr. Coop. Corp. Series 2017 2: | |||
| 5% 7/1/25 | 505,000 | 535,795 | |
| 5% 7/1/26 | 925,000 | 1,003,208 | |
| 5% 7/1/27 | 700,000 | 776,106 | |
| 5% 7/1/30 | 480,000 | 532,361 | |
| Blue Hills Reg'l. Technical Series 2019, 4% 2/1/49 | 2,000,000 | 1,979,814 | |
| Braintree Gen. Oblig. Series 2015, 5% 5/15/28 | 600,000 | 684,527 | |
| Cambridge Gen. Oblig. Series 12, 5% 1/1/24 | 340,000 | 340,768 | |
| Framingham Gen. Oblig. Series 2012 A, 4% 12/1/24 | 1,360,000 | 1,361,942 | |
| Lowell Gen. Oblig. Series 2019, 5% 9/1/29 | 700,000 | 802,342 | |
| Lynn Wtr. & Swr. Commission Gen. Rev. Series 2003 A, 5% 12/1/32 (Nat'l. Pub. Fin. Guarantee Corp. Insured) | 440,000 | 440,996 | |
| Massachusetts Bay Trans. Auth. Assessment Rev. Series 2022 A1, 5% 7/1/39 | 3,435,000 | 4,019,862 | |
| Massachusetts Bay Trans. Auth. Sales Tax Rev.: | |||
| Series 2007 A1, 5.25% 7/1/34 | 2,955,000 | 3,777,493 | |
| Series 2020 B1, 5% 7/1/50 | 2,750,000 | 2,940,817 | |
| Massachusetts Clean Wtr. Trust: | |||
| Series 2021 23A: | |||
5% 2/1/39 | 5,000,000 | 5,741,521 | |
5% 2/1/40 | 4,750,000 | 5,429,436 | |
| Series 2021 23B, 5% 2/1/39 | 12,940,000 | 14,859,056 | |
| Series 2021 B, 5% 2/1/41 | 2,000,000 | 2,275,299 | |
| Series 22, 5% 8/1/37 | 4,110,000 | 4,658,141 | |
| Series 6, 5.5% 8/1/30 | 410,000 | 411,177 | |
| Massachusetts Commonwealth Trans. Fund Rev.: | |||
| (Rail Enhacement Prog.) Series 2022 A, 5% 6/1/50 | 13,500,000 | 14,953,600 | |
| (Rail Enhancement & Accelerated Bridge Prog.) Series 2018 A: | |||
5% 6/1/35 | 2,885,000 | 3,229,329 | |
5% 6/1/36 | 3,035,000 | 3,373,969 | |
| (Rail Enhancement & Accelerated Bridge Programs) Series 2019 A, 5% 6/1/49 | 24,600,000 | 26,731,413 | |
| (Rail Enhancement & Accelerated Bridge Progs.) Series 2018 A, 5.25% 6/1/43 | 14,575,000 | 16,002,853 | |
| (Rail Enhancement Prog.) Series 2021 B: | |||
5% 6/1/41 | 6,000,000 | 6,544,367 | |
5% 6/1/42 | 15,370,000 | 17,138,680 | |
| Series 2021 A: | |||
4% 6/1/50 | 1,050,000 | 1,039,926 | |
5% 6/1/41 | 8,140,000 | 9,243,502 | |
5% 6/1/42 | 9,000,000 | 10,159,090 | |
5% 6/1/43 | 3,000,000 | 3,379,513 | |
5% 6/1/51 | 5,435,000 | 5,949,271 | |
| Series 2021 B, 5% 6/1/46 | 7,615,000 | 8,415,800 | |
| Series 2022 B, 5% 6/1/52 | 20,000,000 | 22,300,152 | |
| Massachusetts Dept. of Trans. Metropolitan Hwy. Sys. Rev.: | |||
| Series A: | |||
5% 1/1/35 | 3,500,000 | 3,935,468 | |
5% 1/1/37 | 2,000,000 | 2,205,468 | |
| Series C, 5% 1/1/34 | 8,585,000 | 9,803,782 | |
| Massachusetts Dev. Fin. Agcy. Rev.: | |||
| (Boston College Proj.) Series T: | |||
5% 7/1/37 | 1,415,000 | 1,528,743 | |
5% 7/1/38 | 3,685,000 | 3,970,654 | |
5% 7/1/39 | 4,450,000 | 4,781,307 | |
5% 7/1/42 | 2,805,000 | 2,995,237 | |
| (Broad Institute Proj.) Series 2017: | |||
5% 4/1/33 | 10,145,000 | 11,294,539 | |
5% 4/1/34 | 2,500,000 | 2,774,941 | |
5% 4/1/35 | 2,455,000 | 2,708,853 | |
5% 4/1/37 | 1,500,000 | 1,635,495 | |
| (Broad Institute Proj.) Series 2017, 5% 4/1/36 | 2,205,000 | 2,416,799 | |
| (Lesley Univ. Proj.) Series 2016: | |||
5% 7/1/29 | 1,640,000 | 1,715,887 | |
5% 7/1/32 | 1,905,000 | 1,982,288 | |
| (Newbridge On The Charles Proj.) Series 2017: | |||
4% 10/1/24 (b) | 500,000 | 503,183 | |
4% 10/1/25 (b) | 500,000 | 504,384 | |
4% 10/1/26 (b) | 500,000 | 505,076 | |
4% 10/1/27 (b) | 350,000 | 353,698 | |
5% 10/1/37 (b) | 1,000,000 | 1,015,718 | |
5% 10/1/47 (b) | 1,000,000 | 985,985 | |
| (Partners Healthcare Sys., Inc. Proj.) Series 2017 S: | |||
5% 7/1/25 | 1,000,000 | 1,061,706 | |
5% 7/1/31 | 21,180,000 | 23,486,538 | |
5% 7/1/32 | 985,000 | 1,088,463 | |
5% 7/1/34 | 750,000 | 821,957 | |
| (Suffolk Univ. Proj.) Series 2017: | |||
5% 7/1/23 | 2,420,000 | 2,438,789 | |
5% 7/1/24 | 2,000,000 | 2,052,543 | |
5% 7/1/25 | 1,500,000 | 1,568,800 | |
5% 7/1/26 | 1,935,000 | 2,056,095 | |
5% 7/1/27 | 2,085,000 | 2,246,349 | |
5% 7/1/28 | 4,300,000 | 4,622,475 | |
| (Suffolk Univ., Proj.) Series 2017, 5% 7/1/32 | 1,000,000 | 1,065,779 | |
| (UMASS Boston Student Hsg. Proj.) Series 2016: | |||
5% 10/1/29 | 3,120,000 | 3,220,889 | |
5% 10/1/30 | 1,100,000 | 1,133,302 | |
5% 10/1/31 | 1,200,000 | 1,233,861 | |
5% 10/1/32 | 1,240,000 | 1,272,023 | |
5% 10/1/33 | 1,235,000 | 1,263,525 | |
| (UMass Memorial Health Care Proj.) Series K: | |||
5% 7/1/28 | 1,260,000 | 1,341,086 | |
5% 7/1/29 | 1,320,000 | 1,404,325 | |
5% 7/1/30 | 1,390,000 | 1,478,093 | |
5% 7/1/38 | 3,750,000 | 3,878,118 | |
| (Univ. of Massachusetts Health Cr., Inc. Proj.) Series 2017 L, 4% 7/1/44 | 7,000,000 | 6,651,081 | |
| (Wentworth Institute of Technology Proj.) Series 2017: | |||
5% 10/1/34 | 1,425,000 | 1,492,104 | |
5% 10/1/35 | 1,495,000 | 1,556,482 | |
5% 10/1/46 | 4,250,000 | 4,345,512 | |
| (Wheaton College, MA. Proj.) Series 2017 H: | |||
5% 1/1/29 | 1,435,000 | 1,526,763 | |
5% 1/1/31 | 1,580,000 | 1,671,945 | |
5% 1/1/32 | 1,665,000 | 1,756,500 | |
5% 1/1/33 | 1,745,000 | 1,834,606 | |
5% 1/1/34 | 1,835,000 | 1,917,768 | |
5% 1/1/35 | 1,000,000 | 1,041,526 | |
5% 1/1/36 | 1,000,000 | 1,032,494 | |
5% 1/1/42 | 5,775,000 | 5,861,596 | |
5% 1/1/47 | 1,895,000 | 1,910,847 | |
5% 1/1/53 | 3,425,000 | 3,441,235 | |
| Bonds Series A1, 5%, tender 1/31/30 (c) | 15,280,000 | 17,486,776 | |
| Series 2008 B: | |||
0% 1/1/37 (Assured Guaranty Corp. Insured) | 1,745,000 | 1,044,081 | |
0% 1/1/40 (Assured Guaranty Corp. Insured) | 5,000,000 | 2,568,708 | |
0% 1/1/41 (Assured Guaranty Corp. Insured) | 5,000,000 | 2,439,062 | |
0% 1/1/42 (Assured Guaranty Corp. Insured) | 5,000,000 | 2,331,704 | |
| Series 2012 C: | |||
5.25% 7/1/25 | 1,000,000 | 1,002,110 | |
5.25% 7/1/26 | 1,000,000 | 1,002,092 | |
| Series 2013 F: | |||
4% 7/1/32 | 2,050,000 | 2,053,640 | |
4% 7/1/43 | 21,685,000 | 20,072,553 | |
5% 7/1/27 | 1,300,000 | 1,310,294 | |
5% 7/1/37 | 3,925,000 | 3,942,003 | |
| Series 2013 G, 5% 7/1/44 | 10,360,000 | 10,002,670 | |
| Series 2014 A: | |||
5% 3/1/32 | 1,700,000 | 1,747,711 | |
5% 3/1/33 | 1,250,000 | 1,284,540 | |
5% 3/1/34 | 4,375,000 | 4,492,575 | |
5% 3/1/39 | 4,000,000 | 4,086,806 | |
| Series 2014 F: | |||
5% 7/15/23 | 350,000 | 352,508 | |
5% 7/15/24 | 400,000 | 403,342 | |
5% 7/15/25 | 550,000 | 553,955 | |
5% 7/15/26 | 500,000 | 503,765 | |
5% 7/15/27 | 200,000 | 201,520 | |
5% 7/15/28 | 320,000 | 322,436 | |
5.625% 7/15/36 | 800,000 | 802,115 | |
5.75% 7/15/43 | 4,700,000 | 4,712,950 | |
| Series 2015 D, 5% 7/1/44 | 10,975,000 | 11,146,382 | |
| Series 2015 H1: | |||
5% 7/1/26 | 3,585,000 | 3,783,691 | |
5% 7/1/29 | 3,750,000 | 3,958,461 | |
5% 7/1/30 | 1,800,000 | 1,899,482 | |
5% 7/1/31 | 1,190,000 | 1,255,435 | |
5% 7/1/32 | 1,000,000 | 1,054,279 | |
5% 7/1/33 | 1,000,000 | 1,053,130 | |
| Series 2015 K, 4% 10/1/30 | 500,000 | 505,368 | |
| Series 2015 Q: | |||
5% 8/15/28 | 1,000,000 | 1,064,124 | |
5% 8/15/29 | 1,000,000 | 1,063,870 | |
5% 8/15/32 | 1,500,000 | 1,593,519 | |
5% 8/15/33 | 1,550,000 | 1,644,671 | |
5% 8/15/34 | 1,790,000 | 1,892,541 | |
5% 8/15/38 | 1,690,000 | 1,768,175 | |
| Series 2015: | |||
5% 1/1/25 | 3,525,000 | 3,629,649 | |
5% 1/1/27 | 2,695,000 | 2,786,525 | |
5% 1/1/28 | 1,850,000 | 1,911,522 | |
5% 1/1/29 | 2,945,000 | 3,039,860 | |
| Series 2016 A: | |||
5% 1/1/31 | 5,000 | 5,275 | |
5.25% 1/1/42 | 7,000,000 | 7,212,997 | |
| Series 2016 E: | |||
5% 7/1/31 | 1,000,000 | 1,048,076 | |
5% 7/1/32 | 2,200,000 | 2,300,031 | |
5% 7/1/33 | 1,500,000 | 1,563,895 | |
5% 7/1/34 | 1,500,000 | 1,558,490 | |
5% 7/1/35 | 1,500,000 | 1,550,161 | |
5% 7/1/36 | 1,000,000 | 1,028,337 | |
5% 7/1/37 | 2,000,000 | 2,044,606 | |
| Series 2016 I: | |||
5% 7/1/25 | 510,000 | 530,733 | |
5% 7/1/27 | 1,150,000 | 1,219,490 | |
5% 7/1/27 | 1,100,000 | 1,169,036 | |
5% 7/1/29 | 1,680,000 | 1,784,965 | |
5% 7/1/30 | 2,400,000 | 2,536,106 | |
5% 7/1/31 | 2,500,000 | 2,642,468 | |
5% 7/1/32 | 1,960,000 | 2,067,181 | |
5% 7/1/34 | 3,035,000 | 3,233,446 | |
5% 7/1/36 | 2,000,000 | 2,104,846 | |
5% 7/1/37 | 1,470,000 | 1,541,318 | |
5% 7/1/38 | 1,000,000 | 1,046,322 | |
5% 7/1/41 | 14,790,000 | 15,125,535 | |
| Series 2016 N: | |||
5% 12/1/34 | 1,000,000 | 1,067,443 | |
5% 12/1/36 | 2,520,000 | 2,655,380 | |
| Series 2016: | |||
4% 10/1/36 | 1,250,000 | 1,266,830 | |
5% 7/1/26 | 1,710,000 | 1,814,163 | |
5% 7/1/29 | 2,000,000 | 2,120,291 | |
5% 7/1/30 | 2,000,000 | 2,119,401 | |
5% 7/1/31 | 1,700,000 | 1,800,831 | |
5% 10/1/32 | 1,760,000 | 1,881,679 | |
5% 9/1/33 | 475,000 | 510,661 | |
5% 10/1/33 | 1,500,000 | 1,600,884 | |
5% 10/1/34 | 1,500,000 | 1,595,001 | |
5% 9/1/35 | 375,000 | 403,153 | |
5% 10/1/35 | 1,500,000 | 1,586,418 | |
5% 7/1/36 | 3,000,000 | 3,132,633 | |
5% 9/1/36 | 315,000 | 337,870 | |
5% 9/1/37 | 840,000 | 883,187 | |
5% 10/1/37 | 2,000,000 | 2,097,638 | |
5% 10/1/39 | 5,000,000 | 5,219,141 | |
5% 7/1/40 | 5,325,000 | 5,543,749 | |
5% 7/1/41 | 5,145,000 | 5,311,217 | |
5% 10/1/43 | 5,000,000 | 5,086,064 | |
5% 9/1/46 | 3,235,000 | 3,432,477 | |
5% 10/1/46 | 4,000,000 | 4,139,220 | |
5% 10/1/48 | 6,000,000 | 5,905,802 | |
5% 9/1/52 | 9,115,000 | 9,415,612 | |
| Series 2017 A: | |||
5% 1/1/35 | 2,000,000 | 2,107,643 | |
5% 1/1/40 | 1,000,000 | 1,032,604 | |
| Series 2017 H: | |||
5% 1/1/24 | 260,000 | 265,302 | |
5% 1/1/24 (Escrowed to Maturity) | 840,000 | 859,124 | |
| Series 2017: | |||
5% 7/1/25 | 1,105,000 | 1,163,863 | |
5% 7/1/26 | 160,000 | 168,472 | |
5% 7/1/27 | 1,000,000 | 1,099,035 | |
5% 10/1/28 | 465,000 | 513,118 | |
5% 10/1/29 | 735,000 | 807,477 | |
5% 7/1/37 | 600,000 | 618,378 | |
5% 7/1/42 | 2,110,000 | 2,147,359 | |
5% 10/1/42 | 4,000,000 | 4,207,696 | |
5% 7/1/47 | 2,250,000 | 2,279,042 | |
5% 10/1/47 | 5,510,000 | 5,707,399 | |
| Series 2018 J2, 5% 7/1/48 | 2,365,000 | 2,433,994 | |
| Series 2018: | |||
5% 9/1/27 | 1,010,000 | 1,076,772 | |
5% 9/1/29 | 1,390,000 | 1,490,370 | |
5% 1/1/30 | 10,000 | 10,710 | |
5% 9/1/31 | 1,530,000 | 1,632,868 | |
5% 9/1/33 | 1,185,000 | 1,255,863 | |
5% 9/1/38 | 4,805,000 | 4,973,425 | |
5% 6/1/43 | 4,740,000 | 5,134,696 | |
5% 9/1/43 | 4,445,000 | 4,535,085 | |
5% 6/1/48 | 7,000,000 | 7,535,182 | |
| Series 2019 A: | |||
5% 7/1/30 | 1,350,000 | 1,443,799 | |
5% 7/1/31 | 1,350,000 | 1,435,559 | |
5% 7/1/32 | 2,000,000 | 2,118,114 | |
5% 7/1/33 | 2,300,000 | 2,423,667 | |
5% 7/1/34 | 1,400,000 | 1,464,707 | |
5% 7/1/34 | 1,015,000 | 1,074,775 | |
5% 7/1/36 | 1,120,000 | 1,164,717 | |
5% 7/1/38 | 735,000 | 757,050 | |
5% 7/1/44 | 2,250,000 | 2,278,183 | |
5% 7/1/49 | 3,500,000 | 3,524,041 | |
| Series 2019 K: | |||
5% 7/1/23 | 500,000 | 504,192 | |
5% 7/1/24 | 500,000 | 514,537 | |
5% 7/1/25 | 1,250,000 | 1,316,887 | |
5% 7/1/26 | 1,250,000 | 1,344,199 | |
5% 7/1/33 | 2,000,000 | 2,251,598 | |
5% 7/1/35 | 2,135,000 | 2,358,486 | |
| Series 2019 S1: | |||
5% 10/1/25 | 1,965,000 | 2,100,039 | |
5% 10/1/26 | 2,535,000 | 2,780,621 | |
| Series 2019 S2: | |||
5% 10/1/32 | 1,410,000 | 1,600,463 | |
5% 10/1/33 | 1,935,000 | 2,190,205 | |
5% 10/1/34 | 2,165,000 | 2,436,147 | |
| Series 2020 A: | |||
4% 7/1/39 | 2,455,000 | 2,380,625 | |
4% 7/1/40 | 7,920,000 | 7,605,409 | |
| Series 2021 A: | |||
4% 7/1/34 | 1,000,000 | 1,044,236 | |
4% 7/1/35 | 1,000,000 | 1,029,351 | |
4% 7/1/36 | 825,000 | 840,886 | |
4% 7/1/37 | 1,000,000 | 1,011,419 | |
4% 7/1/38 | 700,000 | 702,148 | |
4% 7/1/39 | 1,400,000 | 1,395,260 | |
5% 7/1/32 | 1,000,000 | 1,170,216 | |
| Series 2021 B: | |||
4% 7/1/42 | 475,000 | 434,412 | |
4% 7/1/50 | 2,135,000 | 1,850,231 | |
| Series 2021: | |||
4% 7/1/40 | 4,160,000 | 3,503,591 | |
4% 7/1/45 | 1,200,000 | 955,217 | |
4% 7/1/50 | 1,750,000 | 1,335,836 | |
| Series 2022: | |||
5% 7/1/37 | 800,000 | 850,624 | |
5% 7/1/42 | 740,000 | 769,024 | |
5% 7/1/52 | 2,300,000 | 2,348,193 | |
| Series A: | |||
4% 6/1/49 (Pre-Refunded to 6/1/29 @ 100) | 13,440,000 | 14,865,183 | |
5% 6/1/39 (Pre-Refunded to 6/1/29 @ 100) | 6,760,000 | 7,874,290 | |
| Series B, 0% 1/1/39 (Assured Guaranty Corp. Insured) | 3,200,000 | 1,728,425 | |
| Series G: | |||
5% 7/15/23 (b) | 120,000 | 120,860 | |
5% 7/15/24 (b) | 130,000 | 132,845 | |
5% 7/15/25 (b) | 120,000 | 123,398 | |
5% 7/15/26 (b) | 160,000 | 166,396 | |
5% 7/15/27 (b) | 170,000 | 178,360 | |
5% 7/1/28 | 350,000 | 386,472 | |
5% 7/15/28 (b) | 175,000 | 184,936 | |
5% 7/15/29 (b) | 320,000 | 339,929 | |
5% 7/1/30 | 225,000 | 255,810 | |
5% 7/15/30 (b) | 320,000 | 341,260 | |
5% 7/15/31 (b) | 350,000 | 364,255 | |
5% 7/15/32 (b) | 400,000 | 412,944 | |
5% 7/1/33 | 550,000 | 618,608 | |
5% 7/15/33 (b) | 320,000 | 327,330 | |
5% 7/1/34 | 250,000 | 280,002 | |
5% 7/15/34 (b) | 300,000 | 305,098 | |
5% 7/15/35 (b) | 270,000 | 271,171 | |
5% 7/1/36 | 475,000 | 518,533 | |
5% 7/15/36 (b) | 235,000 | 233,528 | |
5% 7/1/37 | 1,275,000 | 1,382,395 | |
5% 7/15/37 (b) | 250,000 | 247,155 | |
5% 7/15/46 (b) | 9,540,000 | 9,272,389 | |
5% 7/1/50 | 4,700,000 | 4,876,871 | |
| Series J2: | |||
5% 7/1/43 | 11,540,000 | 12,008,866 | |
5% 7/1/53 | 4,500,000 | 4,581,050 | |
| Series K, 5% 7/1/27 | 1,150,000 | 1,223,831 | |
| Series N 2016, 5% 12/1/46 | 7,000,000 | 7,221,259 | |
| Massachusetts Edl. Fing. Auth. Rev.: | |||
| Series 2014 I: | |||
5% 1/1/25 (d) | 2,660,000 | 2,748,462 | |
5% 1/1/27 (d) | 1,000,000 | 1,033,256 | |
| Series 2015 A, 5% 1/1/25 (d) | 5,450,000 | 5,647,693 | |
| Series 2016, 5% 7/1/24 (d) | 7,120,000 | 7,312,034 | |
| Series 2017 A: | |||
5% 7/1/23 (d) | 2,500,000 | 2,523,034 | |
5% 7/1/24 (d) | 3,000,000 | 3,080,913 | |
5% 7/1/25 (d) | 4,500,000 | 4,704,260 | |
5% 7/1/26 (d) | 3,935,000 | 4,187,833 | |
| Series 2018 B: | |||
5% 7/1/27 (d) | 9,240,000 | 9,978,801 | |
5% 7/1/28 (d) | 2,325,000 | 2,533,216 | |
| Series 2019 B: | |||
5% 7/1/23 (d) | 500,000 | 504,607 | |
5% 7/1/24 (d) | 1,000,000 | 1,028,372 | |
5% 7/1/25 (d) | 1,365,000 | 1,425,986 | |
5% 7/1/26 (d) | 1,215,000 | 1,291,037 | |
5% 7/1/28 (d) | 1,000,000 | 1,089,555 | |
5% 7/1/29 (d) | 3,500,000 | 3,841,769 | |
| Series 2020 C: | |||
5% 7/1/28 (d) | 2,000,000 | 2,179,110 | |
5% 7/1/29 (d) | 1,950,000 | 2,140,414 | |
5% 7/1/30 (d) | 1,950,000 | 2,164,863 | |
| Series 2021 B: | |||
5% 7/1/27 (d) | 1,950,000 | 2,105,916 | |
5% 7/1/28 (d) | 1,850,000 | 2,015,677 | |
5% 7/1/29 (d) | 1,825,000 | 2,003,208 | |
5% 7/1/30 (d) | 1,125,000 | 1,248,959 | |
5% 7/1/31 (d) | 1,500,000 | 1,683,287 | |
| Massachusetts Gen. Oblig.: | |||
| Series 2004 A, 5.5% 8/1/30 | 2,000,000 | 2,464,499 | |
| Series 2007 A, 3 month U.S. LIBOR + 0.570% 3.545% 5/1/37 (c)(e) | 6,840,000 | 6,719,360 | |
| Series 2018 B, 5% 1/1/32 | 5,000,000 | 5,652,619 | |
| Series 2019 A: | |||
5% 1/1/35 | 5,000,000 | 5,680,610 | |
5% 1/1/37 | 10,000,000 | 11,164,762 | |
5% 1/1/49 | 10,000,000 | 10,770,811 | |
5.25% 1/1/33 | 21,110,000 | 24,594,847 | |
| Series 2019 D, 3% 5/1/36 | 5,000,000 | 4,807,657 | |
| Series 2020 C: | |||
3% 3/1/47 | 5,810,000 | 4,791,509 | |
3% 3/1/49 | 5,000,000 | 4,047,355 | |
| Series 2020 D: | |||
3% 7/1/35 | 3,000,000 | 2,941,190 | |
3% 7/1/39 | 3,460,000 | 3,164,159 | |
3% 11/1/42 | 3,500,000 | 3,024,531 | |
4% 11/1/36 | 1,500,000 | 1,591,146 | |
4% 11/1/41 | 4,000,000 | 4,067,186 | |
5% 7/1/48 | 18,695,000 | 20,527,168 | |
| Series 2021 B: | |||
3% 4/1/48 | 21,500,000 | 17,549,321 | |
3% 4/1/49 | 13,500,000 | 10,924,201 | |
| Series 2021 C: | |||
3% 9/1/34 | 2,300,000 | 2,290,267 | |
3% 9/1/36 | 5,000,000 | 4,760,124 | |
| Series 2021 D: | |||
5% 9/1/48 | 6,880,000 | 7,640,142 | |
5% 9/1/49 | 50,000,000 | 55,347,360 | |
5% 9/1/50 | 1,785,000 | 1,972,435 | |
| Series 2022 B, 3% 2/1/48 | 38,250,000 | 31,243,223 | |
| Series 2022 C, 5.25% 10/1/52 | 1,690,000 | 1,926,004 | |
| Series 2022 E: | |||
5% 11/1/49 | 13,805,000 | 15,449,641 | |
5% 11/1/52 | 52,445,000 | 58,427,706 | |
| Series B: | |||
5% 7/1/33 | 3,500,000 | 4,151,101 | |
5% 7/1/34 | 2,000,000 | 2,352,550 | |
| Series C, 3% 3/1/48 | 5,000,000 | 4,082,638 | |
| Series D, 5% 7/1/45 | 3,415,000 | 3,777,683 | |
| Series E: | |||
5% 9/1/29 | 7,115,000 | 8,195,602 | |
5% 11/1/45 | 8,065,000 | 8,955,103 | |
5% 11/1/50 | 23,480,000 | 25,736,874 | |
| Massachusetts Hsg. Fin. Agcy. Hsg. Rev.: | |||
| Series 183, 3.5% 12/1/46 | 580,000 | 579,353 | |
| Series 2011, 3.5% 12/1/49 | 3,295,000 | 3,294,962 | |
| Series 2017, 4% 6/1/43 (d) | 800,000 | 799,853 | |
| Series 2020 A, 0.875% 12/1/23 | 1,990,000 | 1,962,997 | |
| Series 207, 4% 6/1/49 | 1,740,000 | 1,760,521 | |
| Series 214, 3.75% 12/1/49 | 4,590,000 | 4,618,094 | |
| Series 218, 3% 12/1/50 | 1,800,000 | 1,775,803 | |
| Massachusetts Hsg. Fin. Auth.: | |||
| Series 2021 221, 3% 12/1/50 | 3,860,000 | 3,802,589 | |
| Series 2021 A2: | |||
0.4% 6/1/24 | 875,000 | 845,631 | |
0.45% 12/1/24 | 1,000,000 | 955,758 | |
| Series 2021 B1, 2.875% 12/1/51 | 4,000,000 | 2,922,932 | |
| Series 2021, 3% 6/1/51 | 3,995,000 | 3,925,775 | |
| Series 2022 224, 5% 6/1/50 | 1,750,000 | 1,859,880 | |
| Series 220: | |||
3% 12/1/50 | 3,340,000 | 3,293,446 | |
5% 6/1/23 | 300,000 | 302,250 | |
5% 12/1/23 | 100,000 | 101,935 | |
5% 6/1/24 | 150,000 | 154,689 | |
5% 12/1/24 | 215,000 | 224,354 | |
5% 6/1/25 | 425,000 | 448,946 | |
5% 12/1/25 | 150,000 | 160,467 | |
5% 6/1/26 | 100,000 | 108,084 | |
5% 12/1/26 | 125,000 | 136,595 | |
5% 6/1/27 | 100,000 | 110,238 | |
5% 12/1/27 | 185,000 | 206,055 | |
5% 6/1/28 | 75,000 | 84,162 | |
5% 12/1/28 | 230,000 | 259,832 | |
5% 6/1/29 | 100,000 | 113,946 | |
| Massachusetts Port Auth. Rev.: | |||
| Series 2014 B, 5% 7/1/29 (d) | 1,270,000 | 1,304,021 | |
| Series 2014 C: | |||
5% 7/1/28 | 3,000,000 | 3,116,874 | |
5% 7/1/29 | 4,205,000 | 4,365,084 | |
| Series 2015 A: | |||
5% 7/1/28 | 460,000 | 490,833 | |
5% 7/1/28 (d) | 500,000 | 523,398 | |
5% 7/1/29 (d) | 1,245,000 | 1,301,116 | |
5% 7/1/30 (d) | 1,450,000 | 1,514,895 | |
5% 7/1/40 (d) | 2,000,000 | 2,051,224 | |
5% 7/1/45 (d) | 3,500,000 | 3,570,059 | |
| Series 2016 A: | |||
5% 7/1/26 | 695,000 | 759,734 | |
5% 7/1/28 | 760,000 | 831,298 | |
| Series 2016 B: | |||
4% 7/1/46 (d) | 12,950,000 | 12,494,143 | |
5% 7/1/43 (d) | 11,410,000 | 11,754,363 | |
| Series 2017 A: | |||
5% 7/1/30 (d) | 1,280,000 | 1,381,697 | |
5% 7/1/31 (d) | 1,095,000 | 1,180,512 | |
5% 7/1/32 (d) | 1,370,000 | 1,474,087 | |
5% 7/1/33 (d) | 1,250,000 | 1,341,884 | |
5% 7/1/35 (d) | 2,000,000 | 2,126,503 | |
5% 7/1/36 (d) | 1,720,000 | 1,818,787 | |
5% 7/1/42 (d) | 4,540,000 | 4,719,241 | |
| Series 2019 A: | |||
5% 7/1/24 (d) | 4,140,000 | 4,274,931 | |
5% 7/1/30 (d) | 725,000 | 806,273 | |
5% 7/1/33 (d) | 2,585,000 | 2,852,761 | |
5% 7/1/34 (d) | 5,605,000 | 6,154,674 | |
5% 7/1/37 (d) | 1,100,000 | 1,180,332 | |
5% 7/1/40 (d) | 950,000 | 1,010,049 | |
| Series 2019 B, 5% 7/1/44 | 5,000,000 | 5,481,470 | |
| Series 2019 C: | |||
5% 7/1/31 (d) | 3,500,000 | 3,885,538 | |
5% 7/1/32 (d) | 2,700,000 | 2,989,218 | |
5% 7/1/38 (d) | 5,000,000 | 5,354,286 | |
5% 7/1/39 (d) | 5,000,000 | 5,336,134 | |
5% 7/1/49 (d) | 2,500,000 | 2,609,454 | |
| Series 2021 A: | |||
5% 7/1/38 | 2,125,000 | 2,441,230 | |
5% 7/1/39 | 1,125,000 | 1,286,855 | |
5% 7/1/40 | 1,045,000 | 1,189,635 | |
| Series 2021 B, 5% 7/1/39 (d) | 1,325,000 | 1,437,735 | |
| Series 2021 D: | |||
5% 7/1/46 | 3,180,000 | 3,552,382 | |
5% 7/1/51 | 5,740,000 | 6,370,028 | |
| Series 2021 E: | |||
5% 7/1/33 (d) | 3,440,000 | 3,893,416 | |
5% 7/1/40 (d) | 4,000,000 | 4,319,800 | |
5% 7/1/41 (d) | 1,940,000 | 2,084,912 | |
5% 7/1/51 (d) | 11,775,000 | 12,399,510 | |
| Series 2022 A: | |||
5% 7/1/31 (d) | 2,630,000 | 2,999,002 | |
5% 7/1/36 (d) | 2,450,000 | 2,725,703 | |
5% 7/1/39 (d) | 1,460,000 | 1,596,537 | |
5% 7/1/40 (d) | 2,780,000 | 3,024,224 | |
| Massachusetts Port Auth. Spl. Facilities Rev.: | |||
| (Bosfuel Proj.) Series 2019 A: | |||
5% 7/1/23 (d) | 360,000 | 363,168 | |
5% 7/1/24 (d) | 615,000 | 633,312 | |
5% 7/1/25 (d) | 1,000,000 | 1,047,771 | |
5% 7/1/28 (d) | 1,500,000 | 1,649,995 | |
5% 7/1/32 (d) | 500,000 | 553,559 | |
5% 7/1/34 (d) | 1,250,000 | 1,372,586 | |
5% 7/1/49 (d) | 5,620,000 | 5,856,431 | |
| Series 2019 A, 4% 7/1/44 (d) | 5,000,000 | 4,825,079 | |
| Massachusetts School Bldg. Auth. Dedicated Sales Tax Rev.: | |||
| Series 2019 A, 5% 2/15/44 | 11,510,000 | 12,566,086 | |
| Series 2020 A, 3% 8/15/50 | 5,030,000 | 4,086,043 | |
| Series A: | |||
5% 8/15/31 | 1,850,000 | 2,197,218 | |
5% 8/15/32 | 1,500,000 | 1,772,216 | |
5% 8/15/33 | 1,675,000 | 1,972,631 | |
5% 8/15/34 | 3,000,000 | 3,508,257 | |
5% 8/15/35 | 2,000,000 | 2,315,615 | |
5% 8/15/37 | 1,400,000 | 1,592,915 | |
5% 8/15/45 | 10,000,000 | 11,091,631 | |
5% 8/15/50 | 16,615,000 | 18,289,981 | |
| Series B, 5% 11/15/39 | 1,975,000 | 2,125,693 | |
| Massachusetts Spl. Oblig. Dedicated Tax Rev. Series 2005: | |||
| 5.5% 1/1/27 (Nat'l. Pub. Fin. Guarantee Corp. Insured) | 2,500,000 | 2,783,265 | |
| 5.5% 1/1/28 (Nat'l. Pub. Fin. Guarantee Corp. Insured) | 2,575,000 | 2,938,582 | |
| 5.5% 1/1/30 (Nat'l. Pub. Fin. Guarantee Corp. Insured) | 19,080,000 | 22,629,584 | |
| 5.5% 1/1/34 (Nat'l. Pub. Fin. Guarantee Corp. Insured) | 14,770,000 | 18,127,044 | |
| Massachusetts State College Bldg. Auth. Rev.: | |||
| Series 1999 A, 0% 5/1/28 (Escrowed to Maturity) | 1,700,000 | 1,492,659 | |
| Series 2003 B, 0% 5/1/28 (Assured Guaranty Corp. Insured) | 6,080,000 | 5,248,001 | |
| Series 2021 A, 2% 5/1/37 | 1,060,000 | 836,377 | |
| Series 2022 A: | |||
4% 5/1/36 | 600,000 | 641,810 | |
4% 5/1/38 | 750,000 | 780,504 | |
4% 5/1/40 | 1,000,000 | 1,022,224 | |
4% 5/1/41 | 625,000 | 637,943 | |
4% 5/1/42 | 550,000 | 557,108 | |
5% 5/1/32 | 600,000 | 731,678 | |
5% 5/1/33 | 500,000 | 607,655 | |
5% 5/1/34 | 500,000 | 604,062 | |
5% 5/1/35 | 500,000 | 597,445 | |
| Massachusetts Tpk. Auth. Metropolitan Hwy. Sys. Rev. Sr. Series A: | |||
| 0% 1/1/25 (Nat'l. Pub. Fin. Guarantee Corp. Insured) | 5,110,000 | 4,832,993 | |
| 0% 1/1/28 (Nat'l. Pub. Fin. Guarantee Corp. Insured) | 12,700,000 | 11,028,041 | |
| 0% 1/1/29 (Nat'l. Pub. Fin. Guarantee Corp. Insured) | 33,195,000 | 27,691,286 | |
| Massachusetts Wtr. Resources Auth. Wtr. & Swr. Rev. Series 2020 B: | |||
| 5% 8/1/41 | 3,155,000 | 3,544,863 | |
| 5% 8/1/42 | 7,415,000 | 8,301,487 | |
| Quincy Gen. Oblig.: | |||
| Series 2021, 2% 1/15/46 | 1,755,000 | 1,112,949 | |
| Series 2022 B, 5% 7/1/47 | 4,995,000 | 5,622,968 | |
| Swampscott Gen. Oblig. Series 2022, 3% 3/1/36 | 1,000,000 | 968,219 | |
| Town of Tisbury Gen. Oblig. Series 2022: | |||
| 4% 8/15/36 | 1,780,000 | 1,881,763 | |
| 4% 8/15/40 | 1,995,000 | 2,050,316 | |
| 4% 8/15/41 | 2,085,000 | 2,133,023 | |
| Univ. of Massachusetts Bldg. Auth. Facilities Rev. Series 2020 1, 5% 11/1/50 | 4,015,000 | 4,371,888 | |
| Univ. of Massachusetts Bldg. Auth. Rev. Series 2019 1: | |||
| 5% 5/1/34 | 600,000 | 681,464 | |
| 5% 5/1/35 | 2,000,000 | 2,253,744 | |
| 5% 5/1/36 | 3,400,000 | 3,799,811 | |
| 5% 5/1/37 | 3,200,000 | 3,552,556 | |
| 5% 5/1/38 | 3,000,000 | 3,318,398 | |
| 5% 5/1/39 | 2,000,000 | 2,203,698 | |
TOTAL MASSACHUSETTS | 1,671,175,808 | ||
| Puerto Rico - 1.2% | |||
| Puerto Rico Commonwealth Aqueduct & Swr. Auth. Series 2021 B, 5% 7/1/37 (b) | 4,885,000 | 4,958,466 | |
| Puerto Rico Commonwealth Pub. Impt. Gen. Oblig. Series 2021 A1: | |||
| 0% 7/1/33 | 5,238,348 | 3,033,738 | |
| 5.625% 7/1/27 | 625,000 | 654,620 | |
| 5.625% 7/1/29 | 1,925,000 | 2,046,615 | |
| 5.75% 7/1/31 | 4,525,000 | 4,907,466 | |
| Puerto Rico Hsg. Fin. Auth. Series 2020, 5% 12/1/27 | 4,435,000 | 4,865,566 | |
| Puerto Rico Sales Tax Fing. Corp. Sales Tax Rev. Series 2018 A1, 0% 7/1/31 | 5,010,000 | 3,374,366 | |
TOTAL PUERTO RICO | 23,840,837 | ||
| TOTAL MUNICIPAL BONDS (Cost $1,753,676,798) | 1,695,016,645 | ||
| Municipal Notes - 4.3% | |||
Principal Amount (a) | Value ($) | ||
| Massachusetts - 4.3% | |||
| Massachusetts Dev. Fin. Agcy. Rev.: | |||
| (Boston Univ. Proj.): | |||
Series U-6C, 1.15% 2/1/23, LOC TD Banknorth, NA, VRDN (c) | 36,080,000 | 36,080,000 | |
Series U-6E, 1.15% 2/1/23, LOC TD Banknorth, NA, VRDN (c) | 4,000,000 | 4,000,000 | |
| Series 2011 K1, 1.7% 2/7/23 (Liquidity Facility Wells Fargo Bank NA), VRDN (c) | 5,550,000 | 5,550,000 | |
| Massachusetts Health & Edl. Facilities Auth. Rev.: | |||
| (Baystate Health Sys. Proj.) Series 2009 J2, 1.1% 2/1/23, LOC TD Banknorth, NA, VRDN (c) | 8,825,000 | 8,825,000 | |
| (Harvard Univ. Proj.) Series Y, 1.58% 2/7/23, VRDN (c) | 5,000,000 | 5,000,000 | |
| (Massachusetts Institute of Technology Proj.): | |||
Series 2001 J1, 1.45% 2/7/23, VRDN (c) | 4,545,000 | 4,545,000 | |
Series 2001 J2, 1.58% 2/7/23, VRDN (c) | 12,000,000 | 12,000,000 | |
| Series 1997 P1, 1.55% 2/7/23 (Liquidity Facility JPMorgan Chase Bank), VRDN (c) | 8,500,000 | 8,500,000 | |
| TOTAL MUNICIPAL NOTES (Cost $84,500,000) | 84,500,000 | ||
| TOTAL INVESTMENT IN SECURITIES - 90.2% (Cost $1,838,176,798) | 1,779,516,645 |
NET OTHER ASSETS (LIABILITIES) - 9.8% | 193,321,349 |
| NET ASSETS - 100.0% | 1,972,837,994 |
| VRDN | - | VARIABLE RATE DEMAND NOTE (A debt instrument that is payable upon demand, either daily, weekly or monthly) |
| (a) | Amount is stated in United States dollars unless otherwise noted. |
| (b) | Security exempt from registration under Rule 144A of the Securities Act of 1933. These securities may be resold in transactions exempt from registration, normally to qualified institutional buyers. At the end of the period, the value of these securities amounted to $21,848,364 or 1.1% of net assets. |
| (c) | Coupon rates for floating and adjustable rate securities reflect the rates in effect at period end. |
| (d) | Private activity obligations whose interest is subject to the federal alternative minimum tax for individuals. |
| (e) | Coupon is indexed to a floating interest rate which may be multiplied by a specified factor and/or subject to caps or floors. |
| Valuation Inputs at Reporting Date: | ||||
| Description | Total ($) | Level 1 ($) | Level 2 ($) | Level 3 ($) |
Investments in Securities: | ||||
| Municipal Securities | 1,779,516,645 | - | 1,779,516,645 | - |
| Total Investments in Securities: | 1,779,516,645 | - | 1,779,516,645 | - |
| Statement of Assets and Liabilities | ||||
| January 31, 2023 | ||||
| Assets | ||||
Investment in securities, at value - See accompanying schedule Unaffiliated issuers (cost $1,838,176,798): | $ | 1,779,516,645 | ||
| Cash | 186,737,628 | |||
| Receivable for fund shares sold | 1,225,984 | |||
| Interest receivable | 14,305,617 | |||
| Prepaid expenses | 1,479 | |||
| Other receivables | 4,844 | |||
Total assets | 1,981,792,197 | |||
| Liabilities | ||||
| Payable for investments purchased | $2,905,000 | |||
| Payable for fund shares redeemed | 3,733,676 | |||
| Distributions payable | 1,543,140 | |||
| Accrued management fee | 560,364 | |||
| Other affiliated payables | 161,191 | |||
| Other payables and accrued expenses | 50,832 | |||
| Total Liabilities | 8,954,203 | |||
| Net Assets | $ | 1,972,837,994 | ||
| Net Assets consist of: | ||||
| Paid in capital | $ | 2,051,138,832 | ||
| Total accumulated earnings (loss) | (78,300,838) | |||
| Net Assets | $ | 1,972,837,994 | ||
Net Asset Value , offering price and redemption price per share ($1,972,837,994 ÷ 173,058,478 shares) | $ | 11.40 | ||
| Statement of Operations | ||||
Year ended January 31, 2023 | ||||
| Investment Income | ||||
| Interest | $ | 48,986,708 | ||
| Expenses | ||||
| Management fee | $ | 6,609,394 | ||
| Transfer agent fees | 1,585,787 | |||
| Accounting fees and expenses | 347,791 | |||
| Custodian fees and expenses | 17,783 | |||
| Independent trustees' fees and expenses | 6,658 | |||
| Registration fees | 39,574 | |||
| Audit | 54,984 | |||
| Legal | 4,135 | |||
| Miscellaneous | 12,557 | |||
| Total expenses before reductions | 8,678,663 | |||
| Expense reductions | (53,334) | |||
| Total expenses after reductions | 8,625,329 | |||
| Net Investment income (loss) | 40,361,379 | |||
| Realized and Unrealized Gain (Loss) | ||||
| Net realized gain (loss) on: | ||||
| Investment Securities: | ||||
| Unaffiliated issuers | (20,291,630) | |||
| Total net realized gain (loss) | (20,291,630) | |||
| Change in net unrealized appreciation (depreciation) on investment securities | (121,383,216) | |||
| Net gain (loss) | (141,674,846) | |||
| Net increase (decrease) in net assets resulting from operations | $ | (101,313,467) | ||
| Statement of Changes in Net Assets | ||||
Year ended January 31, 2023 | Year ended January 31, 2022 | |||
| Increase (Decrease) in Net Assets | ||||
| Operations | ||||
| Net investment income (loss) | $ | 40,361,379 | $ | 46,528,466 |
| Net realized gain (loss) | (20,291,630) | 10,629,071 | ||
| Change in net unrealized appreciation (depreciation) | (121,383,216) | (98,246,008) | ||
| Net increase (decrease) in net assets resulting from operations | (101,313,467) | (41,088,471) | ||
| Distributions to shareholders | (40,155,247) | (61,680,325) | ||
| Share transactions | ||||
| Proceeds from sales of shares | 1,227,072,147 | 352,209,362 | ||
| Reinvestment of distributions | 23,902,311 | 36,101,327 | ||
| Cost of shares redeemed | (1,414,849,935) | (393,502,142) | ||
Net increase (decrease) in net assets resulting from share transactions | (163,875,477) | (5,191,453) | ||
| Total increase (decrease) in net assets | (305,344,191) | (107,960,249) | ||
| Net Assets | ||||
| Beginning of period | 2,278,182,185 | 2,386,142,434 | ||
| End of period | $ | 1,972,837,994 | $ | 2,278,182,185 |
| Other Information | ||||
| Shares | ||||
| Sold | 108,695,832 | 28,028,547 | ||
| Issued in reinvestment of distributions | 2,111,674 | 2,881,619 | ||
| Redeemed | (125,061,450) | (31,327,255) | ||
| Net increase (decrease) | (14,253,944) | (417,089) | ||
| Fidelity® Massachusetts Municipal Income Fund |
| Years ended January 31, | 2023 | 2022 | 2021 | 2020 | 2019 | |||||
Selected Per-Share Data | ||||||||||
| Net asset value, beginning of period | $ | 12.16 | $ | 12.71 | $ | 12.62 | $ | 11.95 | $ | 12.07 |
| Income from Investment Operations | ||||||||||
Net investment income (loss) A,B | .242 | .248 | .280 | .316 | .327 | |||||
| Net realized and unrealized gain (loss) | (.762) | (.469) | .111 | .678 | (.075) | |||||
| Total from investment operations | (.520) | (.221) | .391 | .994 | .252 | |||||
| Distributions from net investment income | (.240) | (.248) | (.280) | (.316) | (.327) | |||||
| Distributions from net realized gain | - | (.081) | (.021) | (.008) | (.045) | |||||
| Total distributions | (.240) | (.329) | (.301) | (.324) | (.372) | |||||
| Net asset value, end of period | $ | 11.40 | $ | 12.16 | $ | 12.71 | $ | 12.62 | $ | 11.95 |
Total Return C | (4.24)% | (1.79)% | 3.16% | 8.41% | 2.15% | |||||
Ratios to Average Net Assets B,D,E | ||||||||||
| Expenses before reductions | .46% | .45% | .45% | .45% | .46% | |||||
| Expenses net of fee waivers, if any | .46% | .45% | .45% | .45% | .46% | |||||
| Expenses net of all reductions | .45% | .45% | .45% | .45% | .45% | |||||
| Net investment income (loss) | 2.13% | 1.97% | 2.24% | 2.56% | 2.75% | |||||
| Supplemental Data | ||||||||||
| Net assets, end of period (000 omitted) | $ | 1,972,838 | $ | 2,278,182 | $ | 2,386,142 | $ | 2,369,049 | $ | 2,140,001 |
Portfolio turnover rate F | 25% | 11% | 20% | 12% | 12% |
| Gross unrealized appreciation | $20,359,283 |
| Gross unrealized depreciation | (78,558,335) |
| Net unrealized appreciation (depreciation) | $(58,199,052) |
| Tax Cost | $1,837,715,697 |
| Undistributed tax-exempt income | $291,348 |
| Capital loss carryforward | $(20,393,133) |
| Net unrealized appreciation (depreciation) on securities and other investments | $(58,199,052) |
| Short-term | $(2,769,191) |
| Long-term | (17,623,942) |
| Total capital loss carryforward | $(20,393,133) |
| January 31, 2023 | January 31, 2022 | |
| Tax-exempt Income | $40,155,247 | $46,476,238 |
| Long-term Capital Gains | - | 15,204,087 |
| Total | $40,155,247 | $ 61,680,325 |
| Purchases ($) | Sales ($) | |
| Fidelity Massachusetts Municipal Income Fund | 446,041,662 | 807,376,942 |
| % of Average Net Assets | |
| Fidelity Massachusetts Municipal Income Fund | .02 |
| Purchases ($) | Sales ($) | Realized Gain (Loss) ($) | |
| Fidelity Massachusetts Municipal Income Fund | 4,000,000 | - | - |
| Amount | |
| Fidelity Massachusetts Municipal Income Fund | $3,444 |
| The Example is based on an investment of $1,000 invested at the beginning of the period and held for the entire period (August 1, 2022 to January 31, 2023). |
Annualized Expense Ratio- A | Beginning Account Value August 1, 2022 | Ending Account Value January 31, 2023 | Expenses Paid During Period- C August 1, 2022 to January 31, 2023 | |||||||
| Fidelity® Massachusetts Municipal Income Fund | .45% | |||||||||
| Actual | $ 1,000 | $ 999.60 | $ 2.27 | |||||||
Hypothetical- B | $ 1,000 | $ 1,022.94 | $ 2.29 | |||||||
- Highly liquid investments - cash or convertible to cash within three business days or less
- Moderately liquid investments - convertible to cash in three to seven calendar days
- Less liquid investments - can be sold or disposed of, but not settled, within seven calendar days
- Illiquid investments - cannot be sold or disposed of within seven calendar days
|


Contents
| Current 7-Day Yields | ||
| Fidelity® Massachusetts Municipal Money Market Fund | 1.32% | |
| Institutional Class | 1.53% | |
| Premium Class | 1.44% | |
Yield refers to the income paid by the Fund over a given period. Yield for money market funds is usually for seven-day periods, as it is here, though it is expressed as an annual percentage rate. Past performance is no guarantee of future results. Yield will vary and it's possible to lose money investing in the Fund. A portion of the Fund's expenses was reimbursed and/or waived. Absent such reimbursements and/or waivers the yield for the period ending January 31, 2023, the most recent period shown in the table, would have been 1.48% for Institutional Class. | ||
| Effective Maturity Diversification (% of Fund's Investments) | ||
| Days | ||
| 1 - 7 | 82.2 | |
| 8 - 30 | 3.4 | |
| 31 - 60 | 3.1 | |
| 61 - 90 | 1.4 | |
| 91 - 180 | 6.7 | |
| > 180 | 3.2 | |
| Effective maturity is determined in accordance with the requirements of Rule 2a-7 under the Investment Company Act of 1940. | ||
Asset Allocation (% of Fund's net assets) |
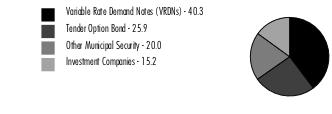 |
Net Other Assets (Liabilities) - (1.4)% |
Net Other Assets (Liabilities) are not available in the pie chart. |
| Variable Rate Demand Note - 40.3% | |||
Principal Amount (a) | Value ($) | ||
| Alabama - 0.5% | |||
| Decatur Indl. Dev. Board Exempt Facilities Rev. (Nucor Steel Decatur LLC Proj.) Series 2003 A, 2.16% 2/7/23, VRDN (b)(c) | 9,643,000 | 9,643,000 | |
| West Jefferson Indl. Dev. Series 2008, 1.78% 2/7/23, VRDN (b) | 2,800,000 | 2,800,000 | |
TOTAL ALABAMA | 12,443,000 | ||
| Arizona - 0.2% | |||
| Maricopa County Poll. Cont. Rev. Series 2009 C, 1.95% 2/7/23, VRDN (b) | 5,400,000 | 5,400,000 | |
| Arkansas - 0.0% | |||
| Blytheville Indl. Dev. Rev. (Nucor Corp. Proj.) Series 1998, 2.16% 2/7/23, VRDN (b)(c) | 400,000 | 400,000 | |
| Delaware - 0.0% | |||
| Delaware Econ. Dev. Auth. Rev. (Delmarva Pwr. & Lt. Co. Proj.) Series 1993 C, 1.82% 2/7/23, VRDN (b) | 100,000 | 100,000 | |
| Indiana - 0.0% | |||
| Indiana Dev. Fin. Auth. Envir. Rev. (PSI Energy Proj.) Series 2003 B, 1.9% 2/7/23, VRDN (b)(c) | 900,000 | 900,000 | |
| Kansas - 0.2% | |||
| Burlington Envir. Impt. Rev. (Kansas City Pwr. and Lt. Co. Proj.): | |||
| Series 2007 A, 1.84% 2/7/23, VRDN (b) | 2,200,000 | 2,200,000 | |
| Series 2007 B, 1.84% 2/7/23, VRDN (b) | 1,000,000 | 1,000,000 | |
| Wamego Kansas Poll. Cont. Rfdg. Rev. (Western Resources, Inc. Proj.) Series 1994, 1.85% 2/7/23, VRDN (b) | 700,000 | 700,000 | |
TOTAL KANSAS | 3,900,000 | ||
| Louisiana - 0.3% | |||
| Saint James Parish Gen. Oblig. (Nucor Steel Louisiana LLC Proj.) Series 2010 B1, 2.3% 2/7/23, VRDN (b) | 6,480,000 | 6,480,000 | |
| Massachusetts - 38.8% | |||
| Boston Wtr. & Swr. Commission Rev. Series 1994 A, 1.5% 2/7/23, LOC State Street Bank & Trust Co., Boston, VRDN (b) | 3,310,000 | 3,310,000 | |
| Massachusetts Bay Trans. Auth.: | |||
| Series 2000 A2, 1.79% 2/7/23 (Liquidity Facility TD Banknorth, NA), VRDN (b) | 16,550,000 | 16,550,000 | |
| Series 2022 A1, 1.68% 2/7/23 (Liquidity Facility TD Banknorth, NA), VRDN (b) | 300,000 | 300,000 | |
| Massachusetts Bay Trans. Auth. Sales Tax Rev. Series 2022 A, 1.68% 2/7/23 (Liquidity Facility TD Banknorth, NA), VRDN (b) | 7,500,000 | 7,500,000 | |
| Massachusetts Dept. of Trans. Metropolitan Hwy. Sys. Rev.: | |||
| Series 2010 A1, 1.63% 2/7/23, LOC TD Banknorth, NA, VRDN (b) | 61,500,000 | 61,500,000 | |
| Series 2010 A2, 1.65% 2/7/23, LOC TD Banknorth, NA, VRDN (b) | 52,265,000 | 52,265,000 | |
| Series 2022 A1, 1.65% 2/7/23 (Liquidity Facility TD Banknorth, NA), VRDN (b) | 4,600,000 | 4,600,000 | |
| Series 2022 A2, 1.65% 2/7/23 (Liquidity Facility U.S. Bank NA, Cincinnati), VRDN (b) | 39,795,000 | 39,795,000 | |
| Series 2022 A3, 1.65% 2/7/23 (Liquidity Facility U.S. Bank NA, Cincinnati), VRDN (b) | 38,175,000 | 38,175,000 | |
| Massachusetts Dev. Fin. Agcy. Rev.: | |||
| (Babson College Proj.) Series 2008 A, 1.5% 2/7/23, LOC Bank of America NA, VRDN (b) | 19,810,000 | 19,810,000 | |
| (Boston Univ. Proj.): | |||
Series U-6C, 1.15% 2/1/23, LOC TD Banknorth, NA, VRDN (b) | 1,300,000 | 1,300,000 | |
Series U-6E, 1.15% 2/1/23, LOC TD Banknorth, NA, VRDN (b) | 9,920,000 | 9,920,000 | |
| (College of the Holy Cross Proj.) Series 2008 A, 1.25% 2/1/23, LOC Bank of America NA, VRDN (b) | 21,545,000 | 21,545,000 | |
| (ISO New England, Inc. Proj.) Series 2005, 1.6% 2/7/23, LOC TD Banknorth, NA, VRDN (b) | 16,560,000 | 16,560,000 | |
| (Wilber School Apts. Proj.) Series 2008 A, 1.68% 2/7/23, LOC Bank of America NA, VRDN (b) | 9,470,000 | 9,470,000 | |
| (Worcester Polytechnic Institute Proj.) Series 2008 A, 1.61% 2/7/23, LOC TD Banknorth, NA, VRDN (b) | 29,690,000 | 29,690,000 | |
| Series 2006: | |||
1.65% 2/7/23, LOC PNC Bank NA, VRDN (b) | 22,005,000 | 22,005,000 | |
1.65% 2/7/23, LOC TD Banknorth, NA, VRDN (b) | 1,640,000 | 1,640,000 | |
| Series 2019, 1.72% 2/7/23, LOC Manufacturers & Traders Trust Co., VRDN (b)(d) | 26,655,000 | 26,655,000 | |
| Massachusetts Health & Edl. Facilities Auth. Rev.: | |||
| (Amherst College Proj.): | |||
Series 2005 I, 1.52% 2/7/23, VRDN (b) | 13,550,000 | 13,550,000 | |
Series 2005 J1, 1.52% 2/7/23, VRDN (b) | 29,150,000 | 29,150,000 | |
Series 2005 J2, 1.28% 2/1/23, VRDN (b) | 11,890,000 | 11,890,000 | |
| (Baystate Health Sys. Proj.): | |||
Series 2009 J1, 1.65% 2/7/23, LOC TD Banknorth, NA, VRDN (b) | 33,000,000 | 33,000,000 | |
Series 2009 J2, 1.1% 2/1/23, LOC TD Banknorth, NA, VRDN (b) | 4,000,000 | 4,000,000 | |
Series 2009 K, 1.65% 2/7/23, LOC Bank of America NA, VRDN (b) | 26,265,000 | 26,265,000 | |
| (Harvard Univ. Proj.): | |||
Series R, 0.4% 2/1/23, VRDN (b) | 22,705,000 | 22,705,000 | |
Series Y, 1.58% 2/7/23, VRDN (b) | 90,085,000 | 90,085,000 | |
| (Massachusetts Institute of Technology Proj.): | |||
Series 2001 J1, 1.45% 2/7/23, VRDN (b) | 26,725,000 | 26,725,000 | |
Series 2001 J2, 1.58% 2/7/23, VRDN (b) | 78,195,000 | 78,195,000 | |
| (Partners HealthCare Sys., Inc. Proj.) Series 2005 F, 1.6% 2/7/23, LOC TD Banknorth, NA, VRDN (b) | 16,695,000 | 16,695,000 | |
| (Williams College Proj.) Series J, 1.52% 2/7/23, VRDN (b) | 12,067,000 | 12,067,000 | |
| Series 2009 O-1, 1.65% 2/7/23, LOC Fed. Home Ln. Bank of Boston, VRDN (b) | 7,710,000 | 7,710,000 | |
| Massachusetts Hsg. Fin. Agcy. Hsg. Rev.: | |||
| (Princeton Westford Proj.) Series 2015 A, 1.66% 2/7/23, LOC Bank of America NA, VRDN (b) | 29,875,000 | 29,875,000 | |
| Series 208, 1.68% 2/7/23 (Liquidity Facility Royal Bank of Canada), VRDN (b) | 5,800,000 | 5,800,000 | |
| Massachusetts Hsg. Fin. Agcy. Multi-Family Rev. Series 2013 F, 1.65% 2/7/23, LOC TD Banknorth, NA, VRDN (b)(c) | 21,870,000 | 21,870,000 | |
| Massachusetts Wtr. Resources Auth. Wtr. & Swr. Rev.: | |||
| Series 1999 B, 1.7% 2/7/23, LOC TD Banknorth, NA, VRDN (b) | 28,300,000 | 28,300,000 | |
| Series 2008 C2, 1.6% 2/7/23 (Liquidity Facility Barclays Bank PLC), VRDN (b) | 24,260,000 | 24,260,000 | |
| FHLMC Massachusetts Dev. Fin. Agcy. Multi-family Hsg. Rev. (Tammy Brook Apts. Proj.) Series 2009, 1.68% 2/7/23, LOC Freddie Mac, VRDN (b) | 8,615,000 | 8,615,000 | |
| FNMA Massachusetts Dev. Fin. Agcy. Multi-family Hsg. Rev. (Avalon Acton Apts. Proj.) Series 2006, 1.71% 2/7/23, LOC Fannie Mae, VRDN (b)(c) | 45,000,000 | 45,000,000 | |
TOTAL MASSACHUSETTS | 918,347,000 | ||
| Nebraska - 0.2% | |||
| Stanton County Indl. Dev. Rev.: | |||
| (Nucor Corp. Proj.) Series 1996, 2.16% 2/7/23, VRDN (b)(c) | 3,700,000 | 3,700,000 | |
| Series 1998, 2.16% 2/7/23, VRDN (b)(c) | 300,000 | 300,000 | |
TOTAL NEBRASKA | 4,000,000 | ||
| Pennsylvania - 0.0% | |||
| Beaver County Indl. Dev. Auth. Series 2018 A, 1.73% 2/7/23, LOC Truist Bank, VRDN (b) | 400,000 | 400,000 | |
| Tennessee - 0.1% | |||
| Memphis-Shelby County Indl. Dev. Board Facilities Rev. Series 2007, 2.16% 2/7/23, VRDN (b)(c) | 2,330,000 | 2,330,000 | |
| TOTAL VARIABLE RATE DEMAND NOTE (Cost $954,700,000) | 954,700,000 | ||
| Tender Option Bond - 25.9% | |||
Principal Amount (a) | Value ($) | ||
| California - 0.0% | |||
| California Health Facilities Fing. Auth. Rev. Participating VRDN Series 17 04, 1.81% 3/14/23 (Liquidity Facility Barclays Bank PLC) (b)(e)(f) | 795,000 | 795,000 | |
| Colorado - 0.4% | |||
| Colorado Health Facilities Auth. Rev. Bonds Participating VRDN Series 2022 004, 1.81% 3/14/23 (Liquidity Facility Barclays Bank PLC) (b)(e)(f) | 9,900,000 | 9,900,000 | |
| Denver City & County Arpt. Rev. Bonds Series G-114, 1.91%, tender 6/1/23 (Liquidity Facility Royal Bank of Canada) (b)(c)(e)(f)(g) | 300,000 | 300,000 | |
TOTAL COLORADO | 10,200,000 | ||
| Connecticut - 0.3% | |||
| Connecticut Gen. Oblig. Participating VRDN: | |||
| Series Floaters 014, 1.81% 3/14/23 (Liquidity Facility Barclays Bank PLC) (b)(e)(f) | 845,000 | 845,000 | |
| Series Floaters 016, 1.81% 3/14/23 (Liquidity Facility Barclays Bank PLC) (b)(e)(f) | 4,500,000 | 4,500,000 | |
| Connecticut Spl. Tax Oblig. Trans. Infrastructure Rev. Bonds Series Floaters G 110, 1.84%, tender 4/3/23 (Liquidity Facility Royal Bank of Canada) (b)(e)(f)(g) | 200,000 | 200,000 | |
TOTAL CONNECTICUT | 5,545,000 | ||
| District Of Columbia - 0.0% | |||
| Metropolitan Washington DC Arpts. Auth. Sys. Rev. Participating VRDN Series Floaters XF 06 94, 1.78% 2/7/23 (Liquidity Facility Bank of America NA) (b)(c)(e)(f) | 170,000 | 170,000 | |
| Florida - 0.2% | |||
| Lee County Arpt. Rev. Participating VRDN Series XF 11 26, 1.73% 2/7/23 (Liquidity Facility Deutsche Bank AG New York Branch) (b)(c)(e)(f) | 200,000 | 200,000 | |
| Miami-Dade County Aviation Rev. Participating VRDN Series 2022 025, 1.84% 3/14/23 (Liquidity Facility Barclays Bank PLC) (b)(c)(e)(f) | 600,000 | 600,000 | |
| Orlando Health Participating VRDN Series 026, 1.81% 3/14/23 (Liquidity Facility Barclays Bank PLC) (b)(e)(f) | 600,000 | 600,000 | |
| Palm Beach County Health Facilities Auth. Hosp. Rev. Participating VRDN Series XG 03 70, 1.76% 2/7/23 (Liquidity Facility Bank of America NA) (b)(e)(f) | 1,860,000 | 1,860,000 | |
| South Miami Health Facilities Auth. Hosp. Rev. Participating VRDN: | |||
| Series XF 25 23, 1.73% 2/7/23 (Liquidity Facility Barclays Bank PLC) (b)(e)(f) | 400,000 | 400,000 | |
| Series XM 08 68, 1.81% 2/7/23 (Liquidity Facility JPMorgan Chase Bank) (b)(e)(f) | 700,000 | 700,000 | |
| Tampa-Hillsborough County Expressway Auth. Rev. Bonds Series G-113, 1.86%, tender 7/3/23 (Liquidity Facility Royal Bank of Canada) (b)(e)(f)(g) | 300,000 | 300,000 | |
TOTAL FLORIDA | 4,660,000 | ||
| Georgia - 0.0% | |||
| Fulton County Dev. Auth. Rev. Participating VRDN Series XL 02 68, 1.76% 2/7/23 (Liquidity Facility Bank of America NA) (b)(e)(f) | 270,000 | 270,000 | |
| Illinois - 0.2% | |||
| Chicago Gen. Oblig. Participating VRDN Series XM 10 05, 1.81% 2/7/23 (Liquidity Facility Deutsche Bank AG New York Branch) (b)(e)(f) | 600,000 | 600,000 | |
| Illinois Fin. Auth. Rev. Participating VRDN Series Floaters 017, 1.81% 3/14/23 (Liquidity Facility Barclays Bank PLC) (b)(e)(f) | 3,995,000 | 3,995,000 | |
TOTAL ILLINOIS | 4,595,000 | ||
| Maryland - 0.4% | |||
| Baltimore Proj. Rev. Bonds Series Floaters G 28, 1.86%, tender 7/3/23 (Liquidity Facility Royal Bank of Canada) (b)(e)(f)(g) | 300,000 | 300,000 | |
| RBC Muni. Products, Inc. Trust Bonds Series 2023, 1.86%, tender 5/1/23 (Liquidity Facility Royal Bank of Canada) (b)(e)(f) | 1,200,000 | 1,200,000 | |
| Univ. of Maryland Med. Sys., Participating VRDN Series 2022 031, 1.81% 3/14/23 (Liquidity Facility Barclays Bank PLC) (b)(e)(f) | 7,200,000 | 7,200,000 | |
TOTAL MARYLAND | 8,700,000 | ||
| Massachusetts - 24.0% | |||
| Beth Israel Lahey Health Participating VRDN Series XF 11 53, 1.72% 2/7/23 (Liquidity Facility Deutsche Bank AG New York Branch) (b)(e)(f) | 2,655,000 | 2,655,000 | |
| Billerica Gen. Oblig. Participating VRDN Series Solar 17 0027, 1.25% 2/1/23 (Liquidity Facility U.S. Bank NA, Cincinnati) (b)(e)(f) | 10,895,000 | 10,895,000 | |
| Massachusetts Bay Trans. Auth. Assessment Rev. Participating VRDN Series XL 02 78, 1.69% 2/7/23 (Liquidity Facility Morgan Stanley Bank, West Valley City Utah) (b)(e)(f) | 5,625,000 | 5,625,000 | |
| Massachusetts Commonwealth Trans. Fund Rev. Participating VRDN: | |||
| Series 2022 XL 03 70, 1.69% 2/7/23 (Liquidity Facility Morgan Stanley Bank, West Valley City Utah) (b)(e)(f) | 5,625,000 | 5,625,000 | |
| Series Floaters XF 06 10, 1.69% 2/7/23 (Liquidity Facility JPMorgan Chase Bank) (b)(e)(f) | 13,495,000 | 13,495,000 | |
| Series Floaters XF 26 06, 1.66% 2/7/23 (Liquidity Facility Citibank NA) (b)(e)(f) | 4,000,000 | 4,000,000 | |
| Series Floaters ZF 25 67, 1.67% 2/7/23 (Liquidity Facility Citibank NA) (b)(e)(f) | 5,370,000 | 5,370,000 | |
| Series Floaters ZF 25 68, 1.67% 2/7/23 (Liquidity Facility Citibank NA) (b)(e)(f) | 7,965,000 | 7,965,000 | |
| Series XF 09 23, 1.69% 2/7/23 (Liquidity Facility JPMorgan Chase Bank) (b)(e)(f) | 4,665,000 | 4,665,000 | |
| Series XM 10 79, 1.69% 2/7/23 (Liquidity Facility JPMorgan Chase Bank) (b)(e)(f) | 4,000,000 | 4,000,000 | |
| Massachusetts Dev. Fin. Agcy. Rev. Participating VRDN: | |||
| Series 15 XF0245, 1.69% 2/7/23 (Liquidity Facility JPMorgan Chase Bank) (b)(e)(f) | 12,800,000 | 12,800,000 | |
| Series 2016 XF2207, 1.7% 2/7/23 (Liquidity Facility Toronto-Dominion Bank) (b)(e)(f) | 4,000,000 | 4,000,000 | |
| Series 2016 XM0137, 1.69% 2/7/23 (Liquidity Facility JPMorgan Chase Bank) (b)(e)(f) | 7,815,000 | 7,815,000 | |
| Series 2018 XF 26 55, 1.7% 2/7/23 (Liquidity Facility Bank of America NA) (b)(e)(f) | 4,740,000 | 4,740,000 | |
| Series 2022 XL 03 65, 1.69% 2/7/23 (Liquidity Facility UBS AG) (b)(e)(f) | 4,340,000 | 4,340,000 | |
| Series Floaters E 130, 1.69% 2/7/23 (Liquidity Facility Royal Bank of Canada) (b)(e)(f) | 38,235,000 | 38,235,000 | |
| Series Floaters XF 27 05, 1.66% 2/7/23 (Liquidity Facility Barclays Bank PLC) (b)(e)(f) | 8,040,000 | 8,040,000 | |
| Series Floaters YX 10 74, 1.69% 2/7/23 (Liquidity Facility Barclays Bank PLC) (b)(e)(f) | 8,560,000 | 8,560,000 | |
| Series Floaters ZF 27 22, 1.69% 2/7/23 (Liquidity Facility Morgan Stanley Bank, West Valley City Utah) (b)(e)(f) | 14,665,000 | 14,665,000 | |
| Series MS 3373, 1.68% 2/7/23 (Liquidity Facility Toronto-Dominion Bank) (b)(e)(f) | 8,000,000 | 8,000,000 | |
| Massachusetts Edl. Fing. Auth. Rev. Participating VRDN: | |||
| Series Floaters XF 25 11, 1.71% 2/7/23 (Liquidity Facility Barclays Bank PLC) (b)(c)(e)(f) | 1,685,000 | 1,685,000 | |
| Series Floaters XG 01 39, 1.71% 2/7/23 (Liquidity Facility Barclays Bank PLC) (b)(c)(e)(f) | 13,055,000 | 13,055,000 | |
| Series XM 07 57, 1.73% 2/7/23 (Liquidity Facility Royal Bank of Canada) (b)(c)(e)(f) | 6,665,000 | 6,665,000 | |
| Massachusetts Gen. Oblig. Participating VRDN: | |||
| Series 16 XM0221, 1.69% 2/7/23 (Liquidity Facility JPMorgan Chase Bank) (b)(e)(f) | 21,630,000 | 21,630,000 | |
| Series 2022 ZL 03 66, 1.69% 2/7/23 (Liquidity Facility Morgan Stanley Bank, West Valley City Utah) (b)(e)(f) | 5,000,000 | 5,000,000 | |
| Series E 144, 1.69% 2/7/23 (Liquidity Facility Royal Bank of Canada) (b)(e)(f) | 50,000,000 | 50,000,000 | |
| Series Floaters G4, 1.69% 2/7/23 (Liquidity Facility Royal Bank of Canada) (b)(e)(f) | 17,100,000 | 17,100,000 | |
| Series Floaters G9, 1.69% 2/7/23 (Liquidity Facility Royal Bank of Canada) (b)(e)(f) | 5,000,000 | 5,000,000 | |
| Series Floaters XF 05 30, 1.7% 2/7/23 (Liquidity Facility Toronto-Dominion Bank) (b)(e)(f) | 6,665,000 | 6,665,000 | |
| Series Floaters XF 25 74, 1.67% 2/7/23 (Liquidity Facility Citibank NA) (b)(e)(f) | 6,000,000 | 6,000,000 | |
| Series Floaters XF 27 06, 1.66% 2/7/23 (Liquidity Facility Barclays Bank PLC) (b)(e)(f) | 26,400,000 | 26,400,000 | |
| Series XM 10 21, 1.69% 2/7/23 (Liquidity Facility JPMorgan Chase Bank) (b)(e)(f) | 4,250,000 | 4,250,000 | |
| Series ZL 02 83, 1.69% 2/7/23 (Liquidity Facility JPMorgan Chase Bank) (b)(e)(f) | 14,165,000 | 14,165,000 | |
| Series ZL 03 39, 1.69% 2/7/23 (Liquidity Facility Morgan Stanley Bank, West Valley City Utah) (b)(e)(f) | 6,000,000 | 6,000,000 | |
| Massachusetts Health & Edl. Facilities Auth. Rev. Participating VRDN: | |||
| Series 16 XG0014, 1.68% 2/7/23 (Liquidity Facility Bank of America NA) (b)(e)(f) | 5,550,000 | 5,550,000 | |
| Series Floaters XM 02 32, 1.68% 2/7/23 (Liquidity Facility Bank of America NA) (b)(e)(f) | 6,010,000 | 6,010,000 | |
| Massachusetts Port Auth. Rev. Participating VRDN: | |||
| Series 2022 039, 1.28% 2/1/23 (Liquidity Facility Barclays Bank PLC) (b)(c)(e)(f) | 1,240,000 | 1,240,000 | |
| Series 2022 XF 30 54, 1.71% 2/7/23 (Liquidity Facility Morgan Stanley Bank, West Valley City Utah) (b)(c)(e)(f) | 11,250,000 | 11,250,000 | |
| Massachusetts School Bldg. Auth. Participating VRDN Series Floaters XM 03 89, 1.69% 2/7/23 (Liquidity Facility JPMorgan Chase Bank) (b)(e)(f) | 7,500,000 | 7,500,000 | |
| Massachusetts School Bldg. Auth. Dedicated Sales Tax Rev. Participating VRDN: | |||
| Series 2022 XL 03 71, 1.3% 2/1/23 (Liquidity Facility JPMorgan Chase Bank) (b)(e)(f) | 2,535,000 | 2,535,000 | |
| Series EGL 15 0004, 1.68% 2/7/23 (Liquidity Facility Citibank NA) (b)(e)(f) | 63,360,000 | 63,360,000 | |
| Series Floaters XF 25 46, 1.7% 2/7/23 (Liquidity Facility Toronto-Dominion Bank) (b)(e)(f) | 4,480,000 | 4,480,000 | |
| Series Floaters XF 27 75, 1.69% 2/7/23 (Liquidity Facility Morgan Stanley Bank, West Valley City Utah) (b)(e)(f) | 9,750,000 | 9,750,000 | |
| Series Solar 17 13, 1.3% 2/1/23 (Liquidity Facility U.S. Bank NA, Cincinnati) (b)(e)(f) | 15,360,000 | 15,360,000 | |
| Series XM 10 51, 1.69% 2/7/23 (Liquidity Facility Royal Bank of Canada) (b)(e)(f) | 4,475,000 | 4,475,000 | |
| Series ZL 02 95, 1.69% 2/7/23 (Liquidity Facility JPMorgan Chase Bank) (b)(e)(f) | 11,750,000 | 11,750,000 | |
| Massachusetts Spl. Oblig. Dedicated Tax Rev. Bonds Series Floaters G 29, 1.84%, tender 7/3/23 (Liquidity Facility Royal Bank of Canada) (b)(e)(f)(g) | 5,490,000 | 5,490,000 | |
| Massachusetts Wtr. Resources Auth. Wtr. & Swr. Rev. Participating VRDN Series Floaters XF 27 01, 1.67% 2/7/23 (Liquidity Facility Barclays Bank PLC) (b)(e)(f) | 4,000,000 | 4,000,000 | |
| RBC Muni. Products, Inc. Trust Participating VRDN Series E 148, 1.69% 2/7/23 (Liquidity Facility Royal Bank of Canada) (b)(e)(f) | 40,000,000 | 40,000,000 | |
| Saugus Gen. Oblig. Participating VRDN Series Floaters XF 06 81, 1.7% 2/7/23 (Liquidity Facility Toronto-Dominion Bank) (b)(e)(f) | 7,615,000 | 7,615,000 | |
| Tender Option Bond Trust Receipts Participating VRDN Series 2016 B, 1.71% 2/7/23 (Liquidity Facility JPMorgan Chase Bank) (b)(c)(e)(f) | 8,100,000 | 8,100,000 | |
TOTAL MASSACHUSETTS | 567,570,000 | ||
| Michigan - 0.0% | |||
| Mclaren Health Care Corp. Participating VRDN Series XL 02 71, 1.76% 2/7/23 (Liquidity Facility Bank of America NA) (b)(e)(f) | 185,000 | 185,000 | |
| Missouri - 0.1% | |||
| Kansas City Indl. Dev. Auth. Participating VRDN Series XG 03 96, 1.85% 2/7/23 (Liquidity Facility Deutsche Bank AG New York Branch) (b)(c)(e)(f) | 2,700,000 | 2,700,000 | |
| New York - 0.0% | |||
| New York City Gen. Oblig. Participating VRDN Series 2020 003, 1.81% 3/14/23 (Liquidity Facility Wells Fargo Bank NA) (b)(e)(f) | 700,000 | 700,000 | |
| Ohio - 0.2% | |||
| Cuyahoga County Ctfs. of Prtn. Participating VRDN Series Floaters XG 02 06, 1.76% 2/7/23 (Liquidity Facility Bank of America NA) (b)(e)(f) | 200,000 | 200,000 | |
| Middletown Hosp. Facilities Rev. Participating VRDN Series Floaters 003, 1.81% 3/14/23 (Liquidity Facility Barclays Bank PLC) (b)(e)(f) | 590,000 | 590,000 | |
| Ohio Hosp. Rev. Participating VRDN Series 002, 1.81% 3/14/23 (Liquidity Facility Barclays Bank PLC) (b)(e)(f) | 2,300,000 | 2,300,000 | |
| Ohio Univ. Gen. Receipts Athens Bonds Series Floaters G 27, 1.86%, tender 6/1/23 (Liquidity Facility Royal Bank of Canada) (b)(e)(f)(g) | 600,000 | 600,000 | |
TOTAL OHIO | 3,690,000 | ||
| Texas - 0.0% | |||
| North Texas Tollway Auth. Rev. Bonds Series G-112, 1.86%, tender 7/3/23 (Liquidity Facility Royal Bank of Canada) (b)(e)(f)(g) | 390,000 | 390,000 | |
| Virginia - 0.0% | |||
| Virginia Pub. Bldg. Auth. Pub. Facilities Rev. Bonds Series Floaters G 40, 1.86%, tender 8/1/23 (Liquidity Facility Royal Bank of Canada) (b)(e)(f)(g) | 100,000 | 100,000 | |
| Washington - 0.1% | |||
| Port of Seattle Rev. Participating VRDN Series XM 10 27, 1.81% 2/7/23 (Liquidity Facility JPMorgan Chase Bank) (b)(c)(e)(f) | 2,000,000 | 2,000,000 | |
| TOTAL TENDER OPTION BOND (Cost $612,270,000) | 612,270,000 | ||
| Other Municipal Security - 20.0% | |||
Principal Amount (a) | Value ($) | ||
| Guam - 0.1% | |||
| Guam Int'l. Arpt. Auth. Rev. Bonds Series 2013 C, 6.25% 10/1/23 (Pre-Refunded to 10/1/23 @ 100) (c) | 2,180,000 | 2,216,136 | |
| Massachusetts - 19.8% | |||
| Boston Gen. Oblig. Bonds: | |||
| Series 2013 A, 5% 3/1/23 | 1,290,000 | 1,292,315 | |
| Series 2014 A, 5% 3/1/23 | 100,000 | 100,184 | |
| Series 2015 A, 5% 4/1/23 | 100,000 | 100,383 | |
| Series 2020 D, 5% 3/1/23 | 4,140,000 | 4,148,080 | |
| Boston Wtr. & Swr. Commission Rev. Series 2022 A, 2.7% 3/6/23, LOC TD Banknorth, NA, CP | 15,500,000 | 15,500,000 | |
| Brockton Gen. Oblig. BAN Series 2022, 3% 6/16/23 | 1,855,833 | 1,858,417 | |
| Brookline Gen. Oblig. Bonds Series 2022, 5% 3/15/23 | 480,000 | 481,352 | |
| Cambridge Gen. Oblig. Bonds: | |||
| Series 2015 A, 4% 2/15/23 | 280,000 | 280,165 | |
| Series 2017 B, 5% 2/15/23 | 1,000,000 | 1,001,071 | |
| Series 2018 B, 5% 2/15/23 | 125,000 | 125,124 | |
| Series 2019, 5% 2/15/23 | 510,000 | 510,468 | |
| Series 2020, 5% 2/15/23 | 1,755,000 | 1,757,089 | |
| Series 2022, 5% 2/15/23 | 800,000 | 800,832 | |
| Falmouth Gen. Oblig. BAN Series 2023, 5% 10/13/23 | 4,911,485 | 4,975,156 | |
| Gloucester Gen. Oblig. BAN Series 2022, 4% 9/15/23 | 23,175,000 | 23,391,984 | |
| Groton BAN Series 2022, 2% 2/17/23 | 8,142,659 | 8,146,908 | |
| Hingham Gen. Oblig. Bonds Series 2020, 5% 2/15/23 | 100,000 | 100,082 | |
| Lexington Gen. Oblig. Bonds: | |||
| Series 2018, 5% 2/15/23 | 715,000 | 715,714 | |
| Series 2019, 5% 2/1/23 | 225,000 | 225,000 | |
| Series 2020, 5% 2/1/23 | 750,000 | 750,000 | |
| Massachusetts Bay Trans. Auth. Assessment Rev. Bonds Series 2022 A1, 5% 7/1/23 | 3,195,000 | 3,222,917 | |
| Massachusetts Bay Trans. Auth. Sales Tax Rev. Bonds: | |||
| Series 2005 A, 5% 7/1/23 | 680,000 | 685,452 | |
| Series 2006 B, 5.25% 7/1/23 | 125,000 | 126,306 | |
| Series 2016 A, 0% 7/1/23 | 120,000 | 118,442 | |
| Massachusetts Clean Wtr. Trust Bonds: | |||
| Series 2014, 5% 8/1/23 | 5,530,000 | 5,583,049 | |
| Series 2017 20, 5% 2/1/23 | 3,795,000 | 3,795,000 | |
| Series 2021 23A, 4% 2/1/23 | 3,000,000 | 3,000,000 | |
| Series 2021 B, 5% 2/1/23 | 480,000 | 480,000 | |
| Massachusetts Dev. Fin. Agcy. Elec. Util. Rev. Bonds Series 2023, 2.15% tender 2/2/23 (Massachusetts Elec. Co. Guaranteed), CP mode (c) | 13,300,000 | 13,300,000 | |
| Massachusetts Dev. Fin. Agcy. Rev. Bonds: | |||
| (Partners Healthcare Sys., Inc. Proj.) Series 2017, 5% 7/1/23 | 135,000 | 136,306 | |
| Series 2014 M4: | |||
5% 7/1/23 | 475,000 | 479,069 | |
5% 7/1/23 (Pre-Refunded to 7/1/23 @ 100) | 1,085,000 | 1,095,187 | |
5% 7/1/23 (Pre-Refunded to 7/1/23 @ 100) | 2,400,000 | 2,417,868 | |
| Series 2015 O2, 5% 7/1/23 | 155,000 | 155,989 | |
| Series 2020 A2, 5% 7/1/23 | 5,000,000 | 5,034,773 | |
| Massachusetts Edl. Fing. Auth. Rev. Bonds: | |||
| Series 2016 J, 5% 7/1/23 (c) | 9,120,000 | 9,182,706 | |
| Series 2017 A, 5% 7/1/23 (c) | 3,615,000 | 3,637,330 | |
| Series 2018 B, 5% 7/1/23 (c) | 6,860,000 | 6,904,274 | |
| Series 2020 C, 5% 7/1/23 (c) | 115,000 | 115,932 | |
| Massachusetts Gen. Oblig. Bonds: | |||
| Series 2006 B, 5.25% 9/1/23 | 8,125,000 | 8,228,607 | |
| Series 2015 A, 5% 5/1/23 | 300,000 | 301,449 | |
| Series 2016 A, 5% 3/1/23 | 2,860,000 | 2,865,638 | |
| Series 2016 B, 5% 7/1/23 | 600,000 | 605,226 | |
| Series 2017 C, 5% 2/1/23 | 1,645,000 | 1,645,000 | |
| Series 2018 C, 5% 9/1/23 | 700,000 | 710,007 | |
| Series 2019 A, 5% 7/1/23 | 185,000 | 186,832 | |
| Series 2019 F, 5% 5/1/23 | 3,975,000 | 3,999,437 | |
| Series 2020 A, 5%, tender 6/1/23 (b) | 36,980,000 | 37,213,930 | |
| Series E, 5% 11/1/23 | 290,000 | 295,107 | |
| Massachusetts Health & Edl. Facilities Auth. Rev. Bonds: | |||
| Series 2022 H1, 2.4% tender 2/3/23, CP mode | 14,345,000 | 14,345,000 | |
| Series 2022: | |||
2.2% tender 2/1/23, CP mode | 12,500,000 | 12,500,000 | |
2.2% tender 2/2/23, CP mode | 9,560,000 | 9,560,000 | |
2.5% tender 2/6/23, CP mode | 12,530,000 | 12,530,000 | |
| Series 2023 2, 2.75% tender 5/4/23, CP mode | 12,640,000 | 12,640,000 | |
| Series 2023: | |||
2.67% tender 5/9/23, CP mode | 17,750,000 | 17,750,000 | |
2.7% tender 5/8/23, CP mode | 19,585,000 | 19,585,000 | |
3.2% tender 3/2/23, CP mode | 16,050,000 | 16,050,000 | |
| Massachusetts Hsg. Fin. Auth. Bonds Series 2021 221, 5% 6/1/23 | 520,000 | 523,097 | |
| Massachusetts Port Auth. Rev. Bonds: | |||
| Series 2015 B, 5% 7/1/23 (c) | 600,000 | 604,154 | |
| Series 2019 A, 5% 7/1/23 (c) | 4,840,000 | 4,871,101 | |
| Series 2019 C, 5% 7/1/23 (c) | 610,000 | 613,924 | |
| Massachusetts School Bldg. Auth. Dedicated Sales Tax Rev. Bonds Series 2013 A: | |||
| 5% 5/15/23 (Escrowed to Maturity) | 180,000 | 180,901 | |
| 5% 5/15/23 (Pre-Refunded to 5/15/23 @ 100) | 265,000 | 266,249 | |
| 5% 5/15/23 (Pre-Refunded to 5/15/23 @ 100) | 9,895,000 | 9,970,920 | |
| 5% 5/15/23 (Pre-Refunded to 5/15/23 @ 100) | 5,700,000 | 5,740,526 | |
| Massachusetts State College Bldg. Auth. Rev. Bonds: | |||
| Series 1999 A, 0% 5/1/23 (Escrowed to Maturity) | 3,000,000 | 2,977,502 | |
| Series 2003 B, 0% 5/1/23 | 8,745,000 | 8,687,192 | |
| Series 2014 A: | |||
5% 5/1/23 (Pre-Refunded to 5/1/23 @ 100) | 400,000 | 402,410 | |
5% 5/1/23 (Pre-Refunded to 5/1/23 @ 100) | 500,000 | 502,284 | |
| Series 2017 D, 5% 5/1/23 | 260,000 | 261,544 | |
| Massachusetts Wtr. Resources Auth. Wtr. & Swr. Rev.: | |||
| Bonds: | |||
Series 2007 B, 5.25% 8/1/23 | 100,000 | 101,109 | |
Series 2013 A, 5% 8/1/23 | 120,000 | 121,443 | |
| Series 2022, 3.4% 2/15/23, LOC TD Banknorth, NA, CP | 22,100,000 | 22,100,000 | |
| Melrose Gen. Oblig. BAN Series 2022, 4% 9/21/23 | 6,162,471 | 6,215,888 | |
| Natick Gen. Oblig. BAN Series 2022, 5% 6/22/23 | 6,473,900 | 6,525,792 | |
| North Middlesex Reg'l. School District BAN Series 2022, 3% 2/3/23 | 10,932,303 | 10,933,671 | |
| Salisbury Gen. Oblig. BAN Series 2022, 4% 9/8/23 | 3,568,010 | 3,599,330 | |
| Somerville Gen. Oblig. BAN Series 2022, 3.5% 6/2/23 | 770,000 | 770,916 | |
| Town of Millbury BAN Series 2023, 4.5% 9/1/23 (h) | 20,000,000 | 20,224,000 | |
| Waltham Gen. Oblig. BAN Series 2022, 3% 4/28/23 | 15,000,000 | 15,029,152 | |
| Wellesley Gen. Oblig. Bonds Series 2021, 5% 4/1/23 | 150,000 | 150,443 | |
| Westborough Gen. Oblig. BAN Series 2022, 3% 3/29/23 | 5,132,719 | 5,137,251 | |
| Woods Hole, Martha's Vineyard & Nantucket Steamship Auth. BAN Series 2022, 3.25% 3/30/23 (Massachusetts Gen. Oblig. Guaranteed) | 20,000,000 | 20,027,960 | |
| Worcester Gen. Oblig.: | |||
| BAN Series 2022, 3% 3/1/23 | 22,000,000 | 22,018,006 | |
| Bonds: | |||
Series 2020, 5% 2/15/23 | 150,000 | 150,104 | |
Series 2022, 5% 2/1/23 | 4,400,000 | 4,400,000 | |
TOTAL MASSACHUSETTS | 469,849,026 | ||
| Michigan - 0.1% | |||
| Kent Hosp. Fin. Auth. Hosp. Facilities Rev. Bonds (Spectrum Health Sys. Proj.) Series 2015 A, SIFMA Municipal Swap Index + 0.250% 1.91%, tender 8/29/23 (b)(i) | 1,100,000 | 1,100,000 | |
| TOTAL OTHER MUNICIPAL SECURITY (Cost $473,165,162) | 473,165,162 | ||
| Investment Company - 15.2% | |||
| Shares | Value ($) | ||
Fidelity Municipal Cash Central Fund 1.40% (j)(k) (Cost $360,141,969) | 360,076,678 | 360,141,969 | |
| TOTAL INVESTMENT IN SECURITIES - 101.4% (Cost $2,400,277,131) | 2,400,277,131 |
NET OTHER ASSETS (LIABILITIES) - (1.4)% | (32,330,031) |
| NET ASSETS - 100.0% | 2,367,947,100 |
| BAN | - | BOND ANTICIPATION NOTE |
| CP | - | COMMERCIAL PAPER |
| VRDN | - | VARIABLE RATE DEMAND NOTE (A debt instrument that is payable upon demand, either daily, weekly or monthly) |
| (a) | Amount is stated in United States dollars unless otherwise noted. |
| (b) | Coupon rates for floating and adjustable rate securities reflect the rates in effect at period end. |
| (c) | Private activity obligations whose interest is subject to the federal alternative minimum tax for individuals. |
| (d) | Security exempt from registration under Rule 144A of the Securities Act of 1933. These securities may be resold in transactions exempt from registration, normally to qualified institutional buyers. At the end of the period, the value of these securities amounted to $26,655,000 or 1.1% of net assets. |
| (e) | Provides evidence of ownership in one or more underlying municipal bonds. |
| (f) | Coupon rates are determined by re-marketing agents based on current market conditions. |
| (g) | Restricted securities (including private placements) - Investment in securities not registered under the Securities Act of 1933 (excluding 144A issues). At the end of the period, the value of restricted securities (excluding 144A issues) amounted to $7,680,000 or 0.3% of net assets. |
| (h) | Security or a portion of the security purchased on a delayed delivery or when-issued basis. |
| (i) | Coupon is indexed to a floating interest rate which may be multiplied by a specified factor and/or subject to caps or floors. |
| (j) | Information in this report regarding holdings by state and security types does not reflect the holdings of the Fidelity Municipal Cash Central Fund. |
| (k) | Affiliated fund that is generally available only to investment companies and other accounts managed by Fidelity Investments. The rate quoted is the annualized seven-day yield of the fund at period end. A complete unaudited listing of the fund's holdings as of its most recent quarter end is available upon request. In addition, each Fidelity Central Fund's financial statements, which are not covered by the Fund's Report of Independent Registered Public Accounting Firm, are available on the SEC's website or upon request. |
| Additional information on each restricted holding is as follows: | ||
| Security | Acquisition Date | Cost ($) |
| Baltimore Proj. Rev. Bonds Series Floaters G 28, 1.86%, tender 7/3/23 (Liquidity Facility Royal Bank of Canada) | 1/03/23 | 300,000 |
| Connecticut Spl. Tax Oblig. Trans. Infrastructure Rev. Bonds Series Floaters G 110, 1.84%, tender 4/3/23 (Liquidity Facility Royal Bank of Canada) | 12/20/22 | 200,000 |
| Denver City & County Arpt. Rev. Bonds Series G-114, 1.91%, tender 6/1/23 (Liquidity Facility Royal Bank of Canada) | 12/01/22 | 300,000 |
| Massachusetts Spl. Oblig. Dedicated Tax Rev. Bonds Series Floaters G 29, 1.84%, tender 7/3/23 (Liquidity Facility Royal Bank of Canada) | 1/03/23 | 5,490,000 |
| North Texas Tollway Auth. Rev. Bonds Series G-112, 1.86%, tender 7/3/23 (Liquidity Facility Royal Bank of Canada) | 1/03/23 | 390,000 |
| Ohio Univ. Gen. Receipts Athens Bonds Series Floaters G 27, 1.86%, tender 6/1/23 (Liquidity Facility Royal Bank of Canada) | 12/01/22 | 600,000 |
| Tampa-Hillsborough County Expressway Auth. Rev. Bonds Series G-113, 1.86%, tender 7/3/23 (Liquidity Facility Royal Bank of Canada) | 1/03/23 | 300,000 |
| Virginia Pub. Bldg. Auth. Pub. Facilities Rev. Bonds Series Floaters G 40, 1.86%, tender 8/1/23 (Liquidity Facility Royal Bank of Canada) | 2/01/21 | 100,000 |
| Affiliate | Value, beginning of period ($) | Purchases ($) | Sales Proceeds ($) | Dividend Income ($) | Realized Gain (loss) ($) | Change in Unrealized appreciation (depreciation) ($) | Value, end of period ($) | % ownership, end of period |
| Fidelity Municipal Cash Central Fund 1.40% | - | 419,716,969 | 59,575,000 | 2,209,581 | - | - | 360,141,969 | 14.1% |
| Fidelity Tax-Free Cash Central Fund 1.39% | 129,923,977 | 346,216,001 | 476,150,100 | 1,147,532 | 10,122 | - | - | 0.0% |
| Total | 129,923,977 | 765,932,970 | 535,725,100 | 3,357,113 | 10,122 | - | 360,141,969 | |
| Statement of Assets and Liabilities | ||||
| January 31, 2023 | ||||
| Assets | ||||
| Investment in securities, at value - See accompanying schedule: | ||||
Unaffiliated issuers (cost $2,040,135,162) | $ | 2,040,135,162 | ||
Fidelity Central Funds (cost $360,141,969) | 360,141,969 | |||
| Total Investment in Securities (cost $2,400,277,131) | $ | 2,400,277,131 | ||
| Cash | 5,110,409 | |||
| Receivable for investments sold | 2,000,000 | |||
| Receivable for fund shares sold | 725,885 | |||
| Interest receivable | 9,545,137 | |||
| Distributions receivable from Fidelity Central Funds | 622,616 | |||
| Receivable from investment adviser for expense reductions | 48,653 | |||
| Other receivables | 6,374 | |||
Total assets | 2,418,336,205 | |||
| Liabilities | ||||
| Payable for investments purchased | ||||
Regular delivery | $ | 11,394,142 | ||
Delayed delivery | 20,224,000 | |||
| Payable for fund shares redeemed | 17,639,132 | |||
| Distributions payable | 563,456 | |||
| Accrued management fee | 407,879 | |||
| Other affiliated payables | 151,316 | |||
| Other payables and accrued expenses | 9,180 | |||
| Total Liabilities | 50,389,105 | |||
| Net Assets | $ | 2,367,947,100 | ||
| Net Assets consist of: | ||||
| Paid in capital | $ | 2,367,890,827 | ||
| Total accumulated earnings (loss) | 56,273 | |||
| Net Assets | $ | 2,367,947,100 | ||
| Net Asset Value and Maximum Offering Price | ||||
| Fidelity Massachusetts Municipal Money Market Fund : | ||||
Net Asset Value , offering price and redemption price per share ($3,949,498 ÷ 3,949,680 shares) | $ | 1.00 | ||
| Institutional Class : | ||||
Net Asset Value , offering price and redemption price per share ($1,201,471,712 ÷ 1,200,022,338 shares) | $ | 1.00 | ||
| Premium Class : | ||||
Net Asset Value , offering price and redemption price per share ($1,162,525,890 ÷ 1,160,686,742 shares) | $ | 1.00 | ||
| Statement of Operations | ||||
Year ended January 31, 2023 | ||||
| Investment Income | ||||
| Interest | $ | 22,456,326 | ||
| Income from Fidelity Central Funds | 3,352,733 | |||
| Total Income | 25,809,059 | |||
| Expenses | ||||
| Management fee | $ | 3,224,301 | ||
| Transfer agent fees | 1,100,166 | |||
| Distribution and service plan fees | 138 | |||
| Independent trustees' fees and expenses | 5,192 | |||
| Miscellaneous | 8,889 | |||
| Total expenses before reductions | 4,338,686 | |||
| Expense reductions | (595,875) | |||
| Total expenses after reductions | 3,742,811 | |||
| Net Investment income (loss) | 22,066,248 | |||
| Realized and Unrealized Gain (Loss) | ||||
| Net realized gain (loss) on: | ||||
| Investment Securities: | ||||
| Unaffiliated issuers | 1,334 | |||
| Fidelity Central Funds | 10,122 | |||
| Capital gain distributions from Fidelity Central Funds | 4,380 | |||
| Total net realized gain (loss) | 15,836 | |||
| Net increase in net assets resulting from operations | $ | 22,082,084 | ||
| Statement of Changes in Net Assets | ||||
Year ended January 31, 2023 | Year ended January 31, 2022 | |||
| Increase (Decrease) in Net Assets | ||||
| Operations | ||||
| Net investment income (loss) | $ | 22,066,248 | $ | 117,942 |
| Net realized gain (loss) | 15,836 | 192,800 | ||
Net increase in net assets resulting from operations | 22,082,084 | 310,742 | ||
| Distributions to shareholders | (22,053,863) | (251,767) | ||
| Share transactions - net increase (decrease) | 1,257,661,702 | (196,643,539) | ||
| Total increase (decrease) in net assets | 1,257,689,923 | (196,584,564) | ||
| Net Assets | ||||
| Beginning of period | 1,110,257,177 | 1,306,841,741 | ||
| End of period | $ | 2,367,947,100 | $ | 1,110,257,177 |
| Fidelity® Massachusetts Municipal Money Market Fund |
| Years ended January 31, | 2023 A | |
Selected Per-Share Data | ||
| Net asset value, beginning of period | $ | 1.00 |
| Income from Investment Operations | ||
Net investment income (loss) B | .007 | |
| Net realized and unrealized gain (loss) | - C | |
| Total from investment operations | .007 | |
| Distributions from net investment income | (.007) | |
| Total distributions | (.007) | |
| Net asset value, end of period | $ | 1.00 |
Total Return D,E | .69% | |
Ratios to Average Net Assets B,F,G | ||
| Expenses before reductions | .42% H | |
| Expenses net of fee waivers, if any | .42% H | |
| Expenses net of all reductions | .41% H | |
| Net investment income (loss) | 1.71% H | |
| Supplemental Data | ||
| Net assets, end of period (000 omitted) | $ | 3,949 |
| Fidelity® Massachusetts Municipal Money Market Fund Institutional Class |
| Years ended January 31, | 2023 | 2022 | 2021 | 2020 | 2019 | |||||
Selected Per-Share Data | ||||||||||
| Net asset value, beginning of period | $ | 1.00 | $ | 1.00 | $ | 1.00 | $ | 1.00 | $ | 1.00 |
| Income from Investment Operations | ||||||||||
Net investment income (loss) A | .011 | - B | .004 | .013 | .012 | |||||
Net realized and unrealized gain (loss) B | - | - | - | - | - | |||||
| Total from investment operations | .011 | - B | .004 | .013 | .012 | |||||
| Distributions from net investment income | (.011) | - B | (.004) | (.013) | (.012) | |||||
| Distributions from net realized gain | - | - B | - B | - B | - | |||||
| Total distributions | (.011) | - B | (.004) | (.013) | (.012) | |||||
| Net asset value, end of period | $ | 1.00 | $ | 1.00 | $ | 1.00 | $ | 1.00 | $ | 1.00 |
Total Return C | 1.14% | .02% | .36% | 1.27% | 1.25% | |||||
Ratios to Average Net Assets A,D,E | ||||||||||
| Expenses before reductions | .25% | .25% | .25% | .25% | .25% | |||||
| Expenses net of fee waivers, if any | .20% | .07% | .19% | .20% | .20% | |||||
| Expenses net of all reductions | .20% | .07% | .18% | .20% | .20% | |||||
| Net investment income (loss) | 1.39% | .01% | .40% | 1.25% | 1.25% | |||||
| Supplemental Data | ||||||||||
| Net assets, end of period (000 omitted) | $ | 1,201,472 | $ | 907,646 | $ | 1,073,961 | $ | 1,741,405 | $ | 1,508,445 |
| Fidelity® Massachusetts Municipal Money Market Fund Premium Class |
| Years ended January 31, | 2023 | 2022 | 2021 | 2020 | 2019 | |||||
Selected Per-Share Data | ||||||||||
| Net asset value, beginning of period | $ | 1.00 | $ | 1.00 | $ | 1.00 | $ | 1.00 | $ | 1.00 |
| Income from Investment Operations | ||||||||||
Net investment income (loss) A | .010 | - B | .003 | .012 | .011 | |||||
Net realized and unrealized gain (loss) B | - | - | - | - | - | |||||
| Total from investment operations | .010 | - B | .003 | .012 | .011 | |||||
| Distributions from net investment income | (.010) | - B | (.003) | (.012) | (.011) | |||||
| Distributions from net realized gain | - | - B | - B | - B | - | |||||
| Total distributions | (.010) | - B | (.003) | (.012) | (.011) | |||||
| Net asset value, end of period | $ | 1.00 | $ | 1.00 | $ | 1.00 | $ | 1.00 | $ | 1.00 |
Total Return C | 1.05% | .02% | .31% | 1.17% | 1.15% | |||||
Ratios to Average Net Assets A,D,E | ||||||||||
| Expenses before reductions | .30% | .30% | .30% | .30% | .30% | |||||
| Expenses net of fee waivers, if any | .29% | .07% | .23% | .30% | .30% | |||||
| Expenses net of all reductions | .29% | .07% | .23% | .30% | .30% | |||||
| Net investment income (loss) | 1.30% | .01% | .35% | 1.15% | 1.15% | |||||
| Supplemental Data | ||||||||||
| Net assets, end of period (000 omitted) | $ | 1,162,526 | $ | 202,508 | $ | 232,777 | $ | 293,167 | $ | 282,538 |
| Fidelity Central Fund | Investment Manager | Investment Objective | Investment Practices | Expense Ratio A |
| Fidelity Money Market Central Funds | Fidelity Management & Research Company LLC (FMR) | Each fund seeks to obtain a high level of current income consistent with the preservation of capital and liquidity. | Short-term Investments | Less than .005% |
| Gross unrealized appreciation | $- |
| Gross unrealized depreciation | - |
| Net unrealized appreciation (depreciation) | $- |
| Tax Cost | $2,400,277,131 |
| Undistributed tax-exempt income | $119,504 |
| Capital loss carryforward | $(60,859) |
Short-term | $(60,859) |
Long-term | (-) |
| Total capital loss carryforward | $(60,859) |
| January 31, 2023 | January 31, 2022 | |
| Tax-exempt Income | $22,053,863 | $117,755 |
| Long-term Capital Gains | - | 134,012 |
| Total | $22,053,863 | $251,767 |
| Service Fee | Total Fees | Retained by FDC | |
| Service Class | .25% | $138 | $138 |
| Amount | |
| Fidelity Massachusetts Municipal Money Market Fund | $670 |
| Institutional Class | 529,120 |
| Premium Class | 570,349 |
| Service Class | 27 |
$ 1,100,166 |
| Purchases ($) | Sales ($) | Realized Gain (Loss) ($) | |
| Fidelity Massachusetts Municipal Money Market Fund | 27,645,000 | 26,515,000 | - |
| Institutional Class | $27,967 |
| Premium Class | 31,515 |
| Service Class | 36 |
| Expense reduction | |
| Premium Class | $102 |
Year ended January 31, 2023 A | Year ended January 31, 2022 | |
| Fidelity Massachusetts Municipal Money Market Fund | ||
| Distributions to shareholders | ||
Fidelity Massachusetts Municipal Money Market Fund | $5,309 | $- |
| Institutional Class | 12,692,922 | 207,165 |
Premium Class | 9,355,510 | 44,579 |
| Service Class | 122 | 23 |
Total | $ 22,053,863 | $251,767 |
| Shares | Shares | Dollars | Dollars | |
Year ended January 31, 2023 A | Year ended January 31, 2022 | Year ended January 31, 2023 A | Year ended January 31, 2022 | |
| Fidelity Massachusetts Municipal Money Market Fund | ||||
Fidelity Massachusetts Municipal Money Market Fund | ||||
| Shares sold | 4,771,313 | - | $4,771,313 | $ - |
| Reinvestment of distributions | 5,227 | - | 5,227 | - |
| Shares redeemed | (826,860) | - | (826,860) | - |
| Net increase (decrease) | 3,949,680 | - | $3,949,680 | $ - |
| Institutional Class | ||||
| Shares sold | 1,351,755,115 | 164,149,672 | $1,351,755,115 | $164,149,672 |
| Reinvestment of distributions | 10,369,998 | 167,826 | 10,369,998 | 167,826 |
| Shares redeemed | (1,068,719,353) | (330,688,195) | (1,068,719,353) | (330,688,195) |
| Net increase (decrease) | 293,405,760 | (166,370,697) | $293,405,760 | $(166,370,697) |
| Premium Class | ||||
| Shares sold | 248,999,145 | 81,899,804 | $248,999,800 | $81,899,804 |
| Issued in exchange for the shares of the Target Fund(s) | 1,009,038,794 | - | 1,010,960,863 | - |
| Reinvestment of distributions | 8,765,318 | 40,282 | 8,765,318 | 40,282 |
| Shares redeemed | (308,316,548) | (112,212,951) | (308,316,548) | (112,212,951) |
| Net increase (decrease) | 958,486,709 | (30,272,865) | $960,409,433 | $(30,272,865) |
| Service Class | ||||
| Reinvestment of distributions | 90 | 23 | 90 | 23 |
| Shares redeemed | (103,155) | - | (103,261) | - |
| Net increase (decrease) | (103,065) | 23 | $(103,171) | $23 |
| Target Fund | Investments $ | Unrealized appreciation (depreciation) $ | Net Assets $ | Shares Exchanged | Shares Exchanged Ratio |
| Fidelity Massachusetts Municipal Money Market Fund | 1,008,064,249 | 0 | 1,010,960,863 | 1,009,038,794 | 1.0000 |
| Surviving Fund | Net Assets $ | Total net assets after the acquisition $ |
| Fidelity Massachusetts Municipal Money Market Fund (formerly Fidelity Massachusetts AMT Tax-Free Money Market Fund) | 1,264,821,342 | 2,275,782,205 |
| Net investment income (loss) | $25,310,746 |
| Total net realized gain (loss) | (52,595) |
| Total change in net unrealized appreciation (depreciation) | - |
| Net increase (decrease) in net assets resulting from operations | $25,258,151 |
| The actual expense Example is based on an investment of $1,000 invested at the beginning of the period and held for the entire period (August 1, 2022 to January 31, 2023) for Institutional Class and Premium Class and for the period (September 22, 2022 to January 31, 2023) for Fidelity® Massachusetts Municipal Money Market Fund. The hypothetical expense Example is based on an investment of $1,000 invested for the one-half year period (August 1, 2022 to January 31, 2023). |
Annualized Expense Ratio- A | Beginning Account Value | Ending Account Value January 31, 2023 | Expenses Paid During Period | |||||||
| Fidelity® Massachusetts Municipal Money Market Fund | ||||||||||
| Fidelity® Massachusetts Municipal Money Market Fund | .42% | |||||||||
| Actual | $ 1,000 | $ 1,006.90 | $ 1.52 C | |||||||
Hypothetical- B | $ 1,000 | $ 1,023.09 | $ 2.14 D | |||||||
| Institutional Class | .20% | |||||||||
| Actual | $ 1,000 | $ 1,009.60 | $ 1.01 C | |||||||
Hypothetical- B | $ 1,000 | $ 1,024.20 | $ 1.02 D | |||||||
| Premium Class | .30% | |||||||||
| Actual | $ 1,000 | $ 1,009.10 | $ 1.52 C | |||||||
Hypothetical- B | $ 1,000 | $ 1,023.69 | $ 1.53 D | |||||||
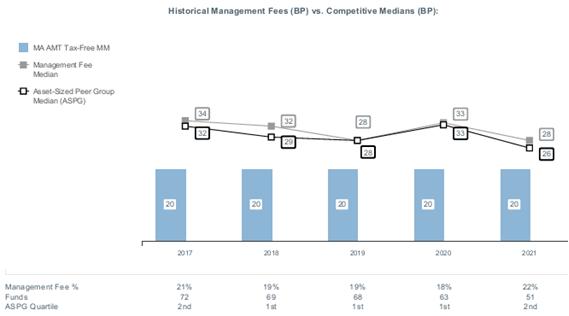
|
Item 2.
Code of Ethics
As of the end of the period, January 31, 2023, Fidelity Massachusetts Municipal Trust (the trust) has adopted a code of ethics, as defined in Item 2 of Form N-CSR, that applies to its President and Treasurer and its Chief Financial Officer. A copy of the code of ethics is filed as an exhibit to this Form N-CSR.
Item 3.
Audit Committee Financial Expert
The Board of Trustees of the trust has determined that Elizabeth S. Acton is an audit committee financial expert, as defined in Item 3 of Form N-CSR. Ms. Acton is independent for purposes of Item 3 of Form N-CSR.
Item 4.
Principal Accountant Fees and Services
Fees and Services
The following table presents fees billed by Deloitte & Touche LLP, the member firms of Deloitte Touche Tohmatsu, and their respective affiliates (collectively, “Deloitte Entities”) in each of the last two fiscal years for services rendered to Fidelity Massachusetts Municipal Income Fund and Fidelity Massachusetts Municipal Money Market Fund (the “Funds”):
Services Billed by Deloitte Entities
January 31, 2023 FeesA
Audit Fees | Audit-Related Fees | Tax Fees | All Other Fees | |
Fidelity Massachusetts Municipal Income Fund | $40,900 | $- | $7,700 | $1,000 |
Fidelity Massachusetts Municipal Money Market Fund | $31,600 | $- | $5,400 | $700 |
January 31, 2022 FeesA
Audit Fees | Audit-Related Fees | Tax Fees | All Other Fees | |
Fidelity Massachusetts Municipal Income Fund | $40,500 | $- | $7,400 | $900 |
Fidelity Massachusetts Municipal Money Market Fund | $30,000 | $- | $5,200 | $700 |
A Amounts may reflect rounding.
The following table(s) present(s) fees billed by Deloitte Entities that were required to be approved by the Audit Committee for services that relate directly to the operations and financial reporting of the Fund(s) and that are rendered on behalf of Fidelity Management & Research Company LLC ("FMR") and entities controlling, controlled by, or under common control with FMR (not including any sub-adviser whose role is primarily portfolio management and is subcontracted with or overseen by another investment adviser) that provide ongoing services to the Fund(s) (“Fund Service Providers”):
Services Billed by Deloitte Entities
January 31, 2023A | January 31, 2022A | |
Audit-Related Fees | $- | $- |
Tax Fees | $- | $- |
All Other Fees | $- | $- |
A Amounts may reflect rounding.
“Audit-Related Fees” represent fees billed for assurance and related services that are reasonably related to the performance of the fund audit or the review of the fund's financial statements and that are not reported under Audit Fees.
“Tax Fees” represent fees billed for tax compliance, tax advice or tax planning that relate directly to the operations and financial reporting of the fund.
“All Other Fees” represent fees billed for services provided to the fund or Fund Service Provider, a significant portion of which are assurance related, that relate directly to the operations and financial reporting of the fund, excluding those services that are reported under Audit Fees, Audit-Related Fees or Tax Fees.
Assurance services must be performed by an independent public accountant.
* * *
The aggregate non-audit fees billed by Deloitte Entities for services rendered to the Fund(s), FMR (not including any sub-adviser whose role is primarily portfolio management and is subcontracted with or overseen by another investment adviser), and any Fund Service Provider for each of the last two fiscal years of the Fund(s) are as follows:
Billed By | January 31, 2023A | January 31, 2022A |
Deloitte Entities | $473,300 | $541,900 |
A Amounts may reflect rounding.
The trust's Audit Committee has considered non-audit services that were not pre-approved that were provided by Deloitte Entities to Fund Service Providers to be compatible with maintaining the independence of Deloitte Entities in its(their) audit of the Fund(s), taking into account representations from Deloitte Entities, in accordance with Public Company Accounting Oversight Board rules, regarding its independence from the Fund(s) and its(their) related entities and FMR’s review of the appropriateness and permissibility under applicable law of such non-audit services prior to their provision to the Fund(s) Service Providers.
Audit Committee Pre-Approval Policies and Procedures
The trust’s Audit Committee must pre-approve all audit and non-audit services provided by a fund’s independent registered public accounting firm relating to the operations or financial reporting of the fund. Prior to the commencement of any audit or non-audit services to a fund, the Audit Committee reviews the services to determine whether they are appropriate and permissible under applicable law.
The Audit Committee has adopted policies and procedures to, among other purposes, provide a framework for the Committee’s consideration of non-audit services by the audit firms that audit the Fidelity funds. The policies and procedures require that any non-audit service provided by a fund audit firm to a Fidelity fund and any non-audit service provided by a fund auditor to a Fund Service Provider that relates directly to the operations and financial reporting of a Fidelity fund (“Covered Service”) are subject to approval by the Audit Committee before such service is provided.
All Covered Services must be approved in advance of provision of the service either: (i) by formal resolution of the Audit Committee, or (ii) by oral or written approval of the service by the Chair of the Audit Committee (or if the Chair is unavailable, such other member of the Audit Committee as may be designated by the Chair to act in the Chair’s absence). The approval contemplated by (ii) above is permitted where the Treasurer determines that action on such an engagement is necessary before the next meeting of the Audit Committee.
Non-audit services provided by a fund audit firm to a Fund Service Provider that do not relate directly to the operations and financial reporting of a Fidelity fund are reported to the Audit Committee periodically.
Non-Audit Services Approved Pursuant to Rule 2-01(c)(7)(i)(C) and (ii) of Regulation S-X (“De Minimis Exception”)
There were no non-audit services approved or required to be approved by the Audit Committee pursuant to the De Minimis Exception during the Fund’s(s’) last two fiscal years relating to services provided to (i) the Fund(s) or (ii) any Fund Service Provider that relate directly to the operations and financial reporting of the Fund(s).
Item 5.
Audit Committee of Listed Registrants
Not applicable.
Item 6.
Investments
(a)
Not applicable.
(b)
Not applicable.
Item 7.
Disclosure of Proxy Voting Policies and Procedures for Closed-End Management Investment Companies
Not applicable.
Item 8.
Portfolio Managers of Closed-End Management Investment Companies
Not applicable.
Item 9.
Purchase of Equity Securities by Closed-End Management Investment Company and Affiliated Purchasers
Not applicable.
Item 10.
Submission of Matters to a Vote of Security Holders
There were no material changes to the procedures by which shareholders may recommend nominees to the trust’s Board of Trustees.
Item 11.
Controls and Procedures
(a)(i) The President and Treasurer and the Chief Financial Officer have concluded that the trust’s disclosure controls and procedures (as defined in Rule 30a-3(c) under the Investment Company Act) provide reasonable assurances that material information relating to the trust is made known to them by the appropriate persons, based on their evaluation of these controls and procedures as of a date within 90 days of the filing date of this report.
(a)(ii) There was no change in the trust’s internal control over financial reporting (as defined in Rule 30a-3(d) under the Investment Company Act) that occurred during the
period covered by this report that has materially affected, or is reasonably likely to materially affect, the trust’s internal control over financial reporting.
Item 12.
Disclosure of Securities Lending Activities for Closed-End Management
Investment Companies
Not applicable.
Item 13.
Exhibits
(a) | (1) | Code of Ethics pursuant to Item 2 of Form N-CSR is filed and attached hereto as EX-99.CODE ETH. |
(a) | (2) | |
(a) | (3) | Not applicable. |
(b) |
SIGNATURES
Pursuant to the requirements of the Securities Exchange Act of 1934 and the Investment Company Act of 1940, the registrant has duly caused this report to be signed on its behalf by the undersigned, thereunto duly authorized.
Fidelity Massachusetts Municipal Trust
By: | /s/Laura M. Del Prato |
Laura M. Del Prato | |
President and Treasurer | |
Date: | March 23, 2023 |
Pursuant to the requirements of the Securities Exchange Act of 1934 and the Investment Company Act of 1940, this report has been signed below by the following persons on behalf of the registrant and in the capacities and on the dates indicated.
By: | /s/Laura M. Del Prato |
Laura M. Del Prato | |
President and Treasurer | |
Date: | March 23, 2023 |
By: | /s/John J. Burke III |
John J. Burke III | |
Chief Financial Officer | |
Date: | March 23, 2023 |