Fidelity® Massachusetts AMT Tax-Free Money Market Fund
Fidelity® Massachusetts AMT Tax-Free Money Market Fund
Institutional Class
Service Class
Annual Report January 31, 2016 |
 |
Contents
To view a fund's proxy voting guidelines and proxy voting record for the 12-month period ended June 30, visit http://www.fidelity.com/proxyvotingresults or visit the Securities and Exchange Commission's (SEC) web site at http://www.sec.gov.
You may also call 1-800-544-8544, or for Institutional and Service Class, call 1-877-208-0098, to request a free copy of the proxy voting guidelines.
Standard & Poor's, S&P and S&P 500 are registered service marks of The McGraw-Hill Companies, Inc. and have been licensed for use by Fidelity Distributors Corporation.
Other third-party marks appearing herein are the property of their respective owners.
All other marks appearing herein are registered or unregistered trademarks or service marks of FMR LLC or an affiliated company. © 2016 FMR LLC. All rights reserved.
This report and the financial statements contained herein are submitted for the general information of the shareholders of the Fund. This report is not authorized for distribution to prospective investors in the Fund unless preceded or accompanied by an effective prospectus.
A fund files its complete schedule of portfolio holdings with the SEC for the first and third quarters of each fiscal year on Form N-Q. Forms N-Q are available on the SEC’s web site at http://www.sec.gov. A fund's Forms N-Q may be reviewed and copied at the SEC’s Public Reference Room in Washington, DC. Information regarding the operation of the SEC's Public Reference Room may be obtained by calling 1-800-SEC-0330.
For a complete list of a fund's portfolio holdings, view the most recent holdings listing, semiannual report, or annual report on Fidelity's web site at http://www.fidelity.com, http://www.advisor.fidelity.com, or http://www.401k.com, as applicable.
NOT FDIC INSURED •MAY LOSE VALUE •NO BANK GUARANTEE
Neither the Fund nor Fidelity Distributors Corporation is a bank.
Investment Summary/Performance (Unaudited)
Effective Maturity Diversification
| Days | % of fund's investments 1/31/16 | % of fund's investments 7/31/15 | % of fund's investments 1/31/15 |
| 1 - 7 | 79.3 | 84.1 | 75.6 |
| 8 - 30 | 3.0 | 1.8 | 1.7 |
| 31 - 60 | 2.4 | 3.4 | 2.1 |
| 61 - 90 | 4.0 | 2.6 | 3.1 |
| 91 - 180 | 7.9 | 2.9 | 13.1 |
| > 180 | 3.4 | 5.2 | 4.4 |
Effective maturity is determined in accordance with the requirements of Rule 2a-7 under the Investment Company Act of 1940.
Weighted Average Maturity
| | 1/31/16 | 7/31/15 | 1/31/15 |
| Fidelity Massachusetts AMT Tax-Free Money Market Fund | 26 Days | 28 Days | 35 Days |
| Massachusetts Tax-Free Money Market Funds Average(a) | 26 Days | 31 Days | 38 Days |
(a) Source: iMoneyNet, Inc.
This is a weighted average of all the maturities of the securities held in a fund. Weighted Average Maturity (WAM) can be used as a measure of sensitivity to interest rate changes and market changes. Generally, the longer the maturity, the greater the sensitivity to such changes. WAM is based on the dollar-weighted average length of time until principal payments must be paid. Depending on the types of securities held in a fund, certain maturity shortening devices (e.g., demand features, interest rate resets, and call options) may be taken into account when calculating the WAM.
Weighted Average Life
| | 1/31/16 | 7/31/15 | 1/31/15 |
| Fidelity Massachusetts AMT Tax-Free Money Market Fund | 28 Days | 29 Days | 36 Days |
Weighted Average Life (WAL) is the weighted average of the life of the securities held in a fund or portfolio and can be used as a measure of sensitivity to changes in liquidity and/or credit risk. Generally, the higher the value, the greater the sensitivity. WAL is based on the dollar-weighted average length of time until principal payments must be paid, taking into account any call options exercised by the issuer and any permissible maturity shortening features other than interest rate resets. The difference between WAM and WAL is that WAM takes into account interest rate resets and WAL does not. WAL for money market funds is not the same as WAL of a mortgage- or asset-backed security.
Asset Allocation (% of fund's net assets)
| As of January 31, 2016 |
| | Variable Rate Demand Notes (VRDNs) | 58.7% |
| | Other Municipal Debt | 22.8% |
| | Investment Companies | 10.8% |
| | Net Other Assets (Liabilities) | 7.7% |

| As of July 31, 2015 |
| | Variable Rate Demand Notes (VRDNs) | 62.8% |
| | Other Municipal Debt | 22.4% |
| | Investment Companies | 13.5% |
| | Net Other Assets (Liabilities) | 1.3% |

Current And Historical 7-Day Yields
| | 1/31/2016 | 10/31/15 | 07/31/15 | 4/30/15 | 1/31/15 |
| Fidelity® Massachusetts AMT Tax-Free Money Market Fund | 0.01% | 0.01% | 0.01% | 0.01% | 0.01% |
| Institutional Class | 0.01% | 0.01% | 0.01% | 0.01% | 0.01% |
| Service Class | 0.01% | 0.01% | 0.01% | 0.01% | 0.01% |
Yield refers to the income paid by the Fund over a given period. Yields for money market funds are usually for seven-day periods, as they are here, though they are expressed as annual percentage rates. Past performance is no guarantee of future results. Yield will vary and it's possible to lose money investing in the Fund. A portion of the Fund's expenses was reimbursed and/or waived. Absent such reimbursements and/or waivers the yield for the period ending January 31, 2016, the most recent period shown in the table, would have been -0.24% for Massachusetts AMT Tax-Free Money Market, -0.19% for Institutional Class and -0.44% for Service Class.
Investments January 31, 2016
Showing Percentage of Net Assets
| Variable Rate Demand Note - 58.7% | | | |
| | | Principal Amount | Value |
| Delaware - 0.4% | | | |
| Delaware Econ. Dev. Auth. Rev. (Delmarva Pwr. & Lt. Co. Proj.) Series 1999 A, 0.07% 2/5/16, VRDN (a) | | $2,300,000 | $2,300,000 |
| Georgia - 0.5% | | | |
| Burke County Indl. Dev. Auth. Poll. Cont. Rev. (Georgia Pwr. Co. Plant Vogtle Proj.): | | | |
| First Series 2009, 0.19% 2/1/16, VRDN (a) | | 1,000,000 | 1,000,000 |
| Series 2013, 0.17% 2/5/16, VRDN (a) | | 600,000 | 600,000 |
| Coweta County Dev. Auth. Poll. Cont. Rev. (Georgia Pwr. Co. Plant Yates Proj.) Series 2006, 0.18% 2/1/16, VRDN (a) | | 700,000 | 700,000 |
| Monroe County Dev. Auth. Poll. Cont. Rev.: | | | |
| (Georgia Pwr. Co. Plant Scherer Proj.) Series 1997, 0.18% 2/1/16, VRDN (a) | | 300,000 | 300,000 |
| (Georgia Pwr. Plant Co. Scherer Proj.) Series 2008, 0.18% 2/1/16, VRDN (a) | | 500,000 | 500,000 |
| | | | 3,100,000 |
| Louisiana - 0.2% | | | |
| Saint James Parish Gen. Oblig. (Nucor Steel Louisiana LLC Proj.) Series 2010 A1, 0.4% 2/5/16, VRDN (a) | | 1,100,000 | 1,100,000 |
| Massachusetts - 56.7% | | | |
| JPMorgan Chase Participating VRDN: | | | |
| Series Putters 16 5004, 0.01% 2/1/16 (Liquidity Facility JPMorgan Chase Bank) (a)(b) | | 1,100,000 | 1,100,000 |
| Series Putters 16 5005, 0.01% 2/1/16 (Liquidity Facility JPMorgan Chase Bank) (a)(b) | | 1,100,000 | 1,100,000 |
| Massachusetts Dept. of Trans. Metropolitan Hwy. Sys. Rev.: | | | |
| Series 2010 A1, 0.01% 2/5/16, LOC Citibank NA, VRDN (a) | | 17,150,000 | 17,150,000 |
| Series 2010 A3, 0.01% 2/5/16, LOC Landesbank Hessen-Thuringen, VRDN (a) | | 6,300,000 | 6,300,000 |
| Massachusetts Dev. Fin. Agcy. Multi-family Hsg. Rev. (Tammy Brook Apts. Proj.) Series 2009, 0.03% 2/5/16, LOC Freddie Mac, VRDN (a) | | 3,515,000 | 3,515,000 |
| Massachusetts Dev. Fin. Agcy. Rev.: | | | |
| (Babson College Proj.) Series 2008 A, 0.01% 2/5/16, LOC Fed. Home Ln. Bank of Boston, VRDN (a) | | 26,690,000 | 26,690,000 |
| (Boston Univ. Proj.) Series U3, 0.01% 2/5/16, LOC Northern Trust Co., VRDN (a) | | 5,900,000 | 5,900,000 |
| (Briarwood Retirement Cmnty. Proj.) Series 2004 A, 0.01% 2/5/16, LOC Manufacturers & Traders Trust Co., VRDN (a) | | 3,485,000 | 3,485,000 |
| (College of the Holy Cross Proj.) Series 2008 A, 0.01% 2/1/16, LOC JPMorgan Chase Bank, VRDN (a) | | 2,385,000 | 2,385,000 |
| (Governor Dummer Academy Issues Proj.) Series 2006, 0.01% 2/5/16, LOC TD Banknorth, NA, VRDN (a) | | 4,555,000 | 4,555,000 |
| (New England Deaconess Assoc. Proj.) Series 2011 B, 0.03% 2/5/16, LOC Manufacturers & Traders Trust Co., VRDN (a) | | 5,325,000 | 5,325,000 |
| (Olin College Proj.): | | | |
| Series 2008 C2, 0.02% 2/1/16, LOC RBS Citizens NA, VRDN (a) | | 3,700,000 | 3,700,000 |
| Series 2008 C3, 0.02% 2/1/16, LOC RBS Citizens NA, VRDN (a) | | 1,935,000 | 1,935,000 |
| (Partners HealthCare Sys. Proj.): | | | |
| Series 2011 K2, 0.01% 2/5/16 (Liquidity Facility Barclays Bank PLC), VRDN (a) | | 4,500,000 | 4,500,000 |
| Series 2014 M1, 0.01% 2/1/16, LOC U.S. Bank NA, Cincinnati, VRDN (a) | | 6,000,000 | 6,000,000 |
| (Simmons College Proj.) Series G, 0.01% 2/5/16, LOC JPMorgan Chase Bank, VRDN (a) | | 4,755,000 | 4,755,000 |
| (Worcester Polytechnic Institute Proj.) Series 2008 A, 0.01% 2/5/16, LOC TD Banknorth, NA, VRDN (a) | | 22,870,000 | 22,870,000 |
| Participating VRDN: | | | |
| Series 15 XF0245, 0.02% 2/5/16 (Liquidity Facility JPMorgan Chase Bank) (a)(b) | | 400,000 | 400,000 |
| Series 2016 XM0137, 0.02% 2/5/16 (Liquidity Facility JPMorgan Chase Bank) (a)(b) | | 1,350,000 | 1,350,000 |
| Series MS 3373, 0.02% 2/5/16 (Liquidity Facility Morgan Stanley Bank, West Valley City Utah) (a)(b) | | 900,000 | 900,000 |
| Series Putters 3840, 0.02% 2/5/16 (Liquidity Facility JPMorgan Chase Bank) (a)(b) | | 400,000 | 400,000 |
| Series 2010, 0.03% 2/5/16, LOC Manufacturers & Traders Trust Co., VRDN (a) | | 980,000 | 980,000 |
| Series 2014 M2, 0.01% 2/5/16, LOC Bank of New York, New York, VRDN (a) | | 3,300,000 | 3,300,000 |
| Massachusetts Gen. Oblig.: | | | |
| (Central Artery Proj.): | | | |
| Series 2000 A, 0.01% 2/5/16 (Liquidity Facility Citibank NA), VRDN (a) | | 7,800,000 | 7,800,000 |
| Series 2000 B, 0.01% 2/1/16 (Liquidity Facility Bank of America NA), VRDN (a) | | 5,990,000 | 5,990,000 |
| Participating VRDN: | | | |
| Series Clipper 07 06, 0.04% 2/5/16 (Liquidity Facility State Street Bank & Trust Co., Boston) (a)(b) | | 17,900,000 | 17,900,000 |
| Series Clipper 07 39, 0.01% 2/5/16 (Liquidity Facility State Street Bank & Trust Co., Boston) (a)(b) | | 14,400,000 | 14,400,000 |
| Series Putters 3699, 0.02% 2/5/16 (Liquidity Facility JPMorgan Chase Bank) (a)(b) | | 4,800,000 | 4,800,000 |
| Series Putters 3898, 0.02% 2/5/16 (Liquidity Facility JPMorgan Chase Bank) (a)(b) | | 3,500,000 | 3,500,000 |
| Series XF 2197, 0.01% 2/5/16 (Liquidity Facility Citibank NA) (a)(b) | | 1,350,000 | 1,350,000 |
| Series 2001 C, 0.01% 2/5/16 (Liquidity Facility State Street Bank & Trust Co., Boston), VRDN (a) | | 3,495,000 | 3,495,000 |
| Series 2006 A, 0.01% 2/1/16 (Liquidity Facility Wells Fargo Bank NA), VRDN (a) | | 8,200,000 | 8,200,000 |
| Massachusetts Health & Edl. Facilities Auth. Rev.: | | | |
| (Amherst College Proj.): | | | |
| Series 1996 F, 0.01% 2/5/16, VRDN (a) | | 900,000 | 900,000 |
| Series 2005 I, 0.01% 2/5/16, VRDN (a) | | 1,340,000 | 1,340,000 |
| Series 2005 J2, 0.01% 2/1/16, VRDN (a) | | 2,900,000 | 2,900,000 |
| (Baystate Health Sys. Proj.): | | | |
| Series 2009 J1, 0.01% 2/5/16, LOC JPMorgan Chase Bank, VRDN (a) | | 6,000,000 | 6,000,000 |
| Series 2009 J2, 0.01% 2/1/16, LOC JPMorgan Chase Bank, VRDN (a) | | 1,600,000 | 1,600,000 |
| (Baystate Med. Ctr. Proj.) Series 2005 G, 0.01% 2/1/16, LOC Wells Fargo Bank NA, VRDN (a) | | 1,315,000 | 1,315,000 |
| (Children's Hosp. Proj.): | | | |
| Series 2010 N3, 0.01% 2/5/16, LOC U.S. Bank NA, Cincinnati, VRDN (a) | | 2,500,000 | 2,500,000 |
| Series 2010 N4, 0.01% 2/1/16, LOC Wells Fargo Bank NA, VRDN (a) | | 20,100,000 | 20,100,000 |
| (CIL Realty of Massachusetts Proj.) Series 2007, 0.01% 2/5/16, LOC HSBC Bank U.S.A., NA, VRDN(a) | | 1,005,000 | 1,005,000 |
| (Fairview Extended Care Proj.) Series B, 0.08% 2/5/16, LOC Bank of America NA, VRDN (a) | | 2,065,000 | 2,065,000 |
| (Henry Heywood Memorial Hosp. Proj.) Series 2008 C, 0.01% 2/1/16, LOC TD Banknorth, NA, VRDN (a) | | 975,000 | 975,000 |
| (Massachusetts Institute of Technology Proj.): | | | |
| Series 2001 J1, 0.01% 2/5/16, VRDN (a) | | 13,000,000 | 13,000,000 |
| Series 2001 J2, 0.01% 2/5/16, VRDN (a) | | 13,025,000 | 13,025,000 |
| (Northeast Hosp. Corp. Proj.) Series 2004 G, 0.07% 2/5/16, LOC JPMorgan Chase Bank, VRDN (a) | | 8,985,000 | 8,985,000 |
| (Wellesley College Proj.): | | | |
| Series B, 0.01% 2/5/16, VRDN (a) | | 1,400,000 | 1,400,000 |
| Series I, 0.01% 2/5/16, VRDN (a) | | 4,385,000 | 4,385,000 |
| (Williams College Proj.) Series J, 0.01% 2/5/16, VRDN (a) | | 466,000 | 466,000 |
| Participating VRDN: | | | |
| Series BA 08 3503, 0.06% 2/5/16 (Liquidity Facility Bank of America NA) (a)(b) | | 5,550,000 | 5,550,000 |
| Series BC 10 20W, 0.03% 2/5/16 (Liquidity Facility Barclays Bank PLC) (a)(b) | | 2,550,000 | 2,550,000 |
| Series Putters 3163, 0.02% 2/5/16 (Liquidity Facility JPMorgan Chase Bank) (a)(b) | | 5,655,000 | 5,655,000 |
| Series Putters 3529, 0.02% 2/5/16 (Liquidity Facility JPMorgan Chase Bank) (a)(b) | | 10,000,000 | 10,000,000 |
| Series Putters 3530, 0.02% 2/5/16 (Liquidity Facility JPMorgan Chase Bank) (a)(b) | | 4,495,000 | 4,495,000 |
| Series Putters 3650, 0.02% 2/5/16 (Liquidity Facility JPMorgan Chase Bank) (a)(b) | | 3,200,000 | 3,200,000 |
| Massachusetts Indl. Fin. Agcy. Rev.: | | | |
| (Governor Dummer Academy Proj.) Series 1996, 0.01% 2/5/16, LOC TD Banknorth, NA, VRDN (a) | | 800,000 | 800,000 |
| (Society for the Prevention of Cruelty to Animals Proj.) Series 1997, 0.01% 2/5/16, LOC TD Banknorth, NA, VRDN (a) | | 2,815,000 | 2,815,000 |
| Massachusetts Port Auth. Rev. Series 2008 A, 0.01% 2/5/16, LOC State Street Bank & Trust Co., Boston, VRDN (a) | | 4,400,000 | 4,400,000 |
| Massachusetts School Bldg. Auth. Dedicated Sales Tax Rev. Participating VRDN: | | | |
| Series EGL 15 0004, 0.01% 2/5/16 (Liquidity Facility Citibank NA) (a)(b) | | 5,900,000 | 5,900,000 |
| Series EGL 15 001, 0.01% 2/5/16 (Liquidity Facility Citibank NA) (a)(b) | | 5,900,000 | 5,900,000 |
| Series EGL 15 002, 0.01% 2/5/16 (Liquidity Facility Citibank NA) (a)(b) | | 6,600,000 | 6,600,000 |
| Series EGL 15 003, 0.01% 2/5/16 (Liquidity Facility Citibank NA) (a)(b) | | 5,000,000 | 5,000,000 |
| Series Putters 1920, 0.02% 2/5/16 (Liquidity Facility JPMorgan Chase Bank) (a)(b) | | 7,985,000 | 7,985,000 |
| Series Putters 3691, 0.02% 2/5/16 (Liquidity Facility JPMorgan Chase Bank) (a)(b) | | 1,425,000 | 1,425,000 |
| Series Putters 4420, 0.02% 2/5/16 (Liquidity Facility JPMorgan Chase Bank) (a)(b) | | 600,000 | 600,000 |
| Series RBC O 72, 0.01% 2/5/16 (Liquidity Facility Royal Bank of Canada) (a)(b) | | 1,000,000 | 1,000,000 |
| Series ROC II R 14021, 0.01% 2/5/16 (Liquidity Facility Citibank NA) (a)(b) | | 1,500,000 | 1,500,000 |
| Massachusetts Wtr. Resources Auth. Wtr. & Swr. Rev. Series 1999 B, 0.01% 2/5/16, LOC Landesbank Hessen-Thuringen, VRDN (a) | | 5,500,000 | 5,500,000 |
| | | | 358,866,000 |
| New Jersey - 0.2% | | | |
| Salem County Poll. Cont. Fin. Auth. Rev. (Pub. Svc. Elec. and Gas Co. Proj.) Series 2003 B1, 0.13% 2/5/16, VRDN (a) | | 1,400,000 | 1,400,000 |
| Pennsylvania - 0.3% | | | |
| Bucks County Indl. Dev. Auth. Rev. (Lutheran Cmnty. at Telford Healthcare Ctr., Inc. Proj.) Series 2007 B, 0.22% 2/5/16, LOC Citizens Bank of Pennsylvania, VRDN (a) | | 2,050,000 | 2,050,000 |
| Texas - 0.4% | | | |
| Port Arthur Navigation District Envir. Facilities Rev. (Motiva Enterprises LLC Proj.): | | | |
| Series 2001 A, 0.2% 2/1/16, VRDN (a) | | 200,000 | 200,000 |
| Series 2009 A, 0.2% 2/1/16, VRDN (a) | | 300,000 | 300,000 |
| Series 2010 B, 0.2% 2/1/16, VRDN (a) | | 300,000 | 300,000 |
| Series 2010 C, 0.21% 2/1/16, VRDN (a) | | 150,000 | 150,000 |
| Series 2010 D: | | | |
| 0.2% 2/1/16, VRDN (a) | | 1,100,000 | 1,100,000 |
| 0.21% 2/1/16, VRDN (a) | | 700,000 | 700,000 |
| | | | 2,750,000 |
| TOTAL VARIABLE RATE DEMAND NOTE | | | |
| (Cost $371,566,000) | | | 371,566,000 |
|
| Other Municipal Debt - 22.8% | | | |
| Kentucky - 0.1% | | | |
| Jefferson County Poll. Cont. Rev. Bonds (Louisville Gas & Elec. Co. Proj.) Series 2001 A, 0.25% tender 2/16/16, CP mode | | 300,000 | 300,000 |
| Massachusetts - 22.7% | | | |
| Arlington Gen. Oblig. BAN 2% 11/10/16 | | 1,000,000 | 1,012,474 |
| Beverly Gen. Oblig. BAN 1.25% 4/23/16 | | 1,000,000 | 1,002,346 |
| Cambridge Gen. Oblig. Bonds Series 2013, 3% 2/15/16 | | 1,900,000 | 1,902,034 |
| Concord & Carlisle Reg'l. School District BAN 1.5% 3/16/16 | | 2,000,000 | 2,003,167 |
| Danvers Gen. Oblig. BAN 2% 8/19/16 | | 1,200,000 | 1,211,242 |
| Eastham Massachusetts BAN 2% 6/30/16 | | 2,000,000 | 2,013,639 |
| Falmouth Gen. Oblig. BAN 2% 12/16/16 | | 1,400,000 | 1,418,208 |
| Gloucester Gen. Oblig. BAN: | | | |
| Series 2015, 2% 8/12/16 | | 1,900,000 | 1,917,176 |
| 2% 2/3/17 | | 1,200,000 | 1,218,168 |
| Holden Massachusetts Gen. Oblig. BAN 2% 6/17/16 | | 2,200,000 | 2,213,952 |
| Lexington Gen. Oblig. BAN Series 2015 B, 1.25% 6/10/16 | | 1,366,000 | 1,370,347 |
| Marblehead Gen. Oblig. BAN 2% 8/5/16 | | 1,200,000 | 1,210,271 |
| Marlborough Gen. Oblig. BAN 1.5% 6/17/16 | | 3,805,229 | 3,822,687 |
| Massachusetts Bay Trans. Auth. Sales Tax Rev. Bonds Series A, 5.5% 7/1/16 | | 745,000 | 761,159 |
| Massachusetts Clean Wtr. Trust Bonds: | | | |
| (Pool Prog.) Series 2004 A, 5.25% 8/1/16 | | 1,000,000 | 1,024,029 |
| Series 2010 A, 4% 8/1/16 | | 1,675,000 | 1,706,271 |
| Massachusetts Dev. Fin. Agcy. Series 5, 0.09% 2/10/16, LOC TD Banknorth, NA, CP | | 900,000 | 900,000 |
| Massachusetts Dev. Fin. Agcy. Rev. Series 1, 0.07% 2/2/16, LOC JPMorgan Chase Bank, CP | | 800,000 | 800,000 |
| Massachusetts Gen. Oblig.: | | | |
| Bonds: | | | |
| Series 2004 C, 5.5% 12/1/16 | | 325,000 | 338,454 |
| Series 2006 D, 5% 8/1/16 (Pre-Refunded to 8/1/16 @ 100) | | 1,000,000 | 1,023,082 |
| Series 2008 A, 5% 8/1/16 | | 2,530,000 | 2,589,054 |
| Series 2009 B, 5% 7/1/16 | | 2,940,000 | 2,996,994 |
| Series 2011 B, 5% 8/1/16 | | 1,300,000 | 1,330,467 |
| Series 2011 D, 5% 10/1/16 | | 500,000 | 515,230 |
| Series 2012 D, 0.35% 1/1/17 (a) | | 1,900,000 | 1,901,330 |
| Series 2013 A, 0.37% 2/1/17 (a) | | 1,300,000 | 1,301,132 |
| Series 2014 D, 0.01% 2/1/16 (a) | | 1,160,000 | 1,160,000 |
| RAN: | | | |
| Series 2015 A, 2% 4/27/16 | | 9,700,000 | 9,742,619 |
| Series 2015 B, 2% 5/25/16 | | 13,000,000 | 13,074,629 |
| Series 2015 C, 2% 6/22/16 | | 4,800,000 | 4,833,672 |
| 0.06% 4/21/16 (Liquidity Facility TD Banknorth, NA), CP | | 4,400,000 | 4,400,000 |
| Massachusetts Health & Edl. Facilities Auth. Rev.: | | | |
| Bonds (Partners HealthCare Sys., Inc. Proj.): | | | |
| Series 2008 H1: | | | |
| 0.05% tender 3/4/16, CP mode | | 1,400,000 | 1,400,000 |
| 0.07% tender 3/1/16, CP mode | | 1,700,000 | 1,700,000 |
| 0.07% tender 3/2/16, CP mode | | 1,200,000 | 1,200,000 |
| 0.08% tender 2/1/16, CP mode | | 1,900,000 | 1,900,000 |
| 0.08% tender 4/5/16, CP mode | | 1,800,000 | 1,800,000 |
| Series 2008 H2: | | | |
| 0.05% tender 2/2/16, CP mode | | 1,890,000 | 1,890,000 |
| 0.07% tender 2/4/16, CP mode | | 1,900,000 | 1,900,000 |
| 0.07% tender 2/8/16, CP mode | | 1,340,000 | 1,340,000 |
| 0.07% tender 3/3/16, CP mode | | 1,340,000 | 1,340,000 |
| Series EE, 0.02% 2/1/16, CP | | 1,500,000 | 1,500,000 |
| Massachusetts Indl. Fin. Agcy. Poll. Cont. Rev.: | | | |
| Bonds (New England Pwr. Co. Proj.) Series 1993 B: | | | |
| 0.48% tender 2/5/16, CP mode | | 1,800,000 | 1,800,000 |
| 0.48% tender 3/10/16, CP mode | | 500,000 | 500,000 |
| Series 1992, Bonds (New England Pwr. Co. Proj.) 0.4% tender 2/24/16, CP mode | | 600,000 | 600,000 |
| Massachusetts Port Auth. Rev. Series 2012 A, 0.04% 3/9/16, LOC TD Banknorth, NA, CP | | 2,400,000 | 2,400,000 |
| Massachusetts School Bldg. Auth. Dedicated Sales Tax Rev.: | | | |
| Series A: | | | |
| 0.02% 2/1/16, LOC Bank of America NA, CP | | 4,700,000 | 4,700,000 |
| 0.03% 3/2/16, LOC Bank of America NA, CP | | 1,700,000 | 1,700,000 |
| Series B: | | | |
| 0.03% 2/16/16, LOC Citibank NA, CP | | 4,500,000 | 4,500,000 |
| 0.03% 2/17/16, LOC Citibank NA, CP | | 2,200,000 | 2,200,000 |
| Series C: | | | |
| 0.03% 2/1/16, LOC Barclays Bank PLC, CP | | 1,800,000 | 1,800,000 |
| 0.03% 2/2/16, LOC Barclays Bank PLC, CP | | 1,800,000 | 1,800,000 |
| 0.05% 3/2/16, LOC Barclays Bank PLC, CP | | 1,800,000 | 1,800,000 |
| 0.06% 2/1/16, LOC Barclays Bank PLC, CP | | 1,100,000 | 1,100,000 |
| Massachusetts Spl. Oblig. Rev. Bonds Series 2005 A, 5.5% 6/1/16 | | 1,000,000 | 1,017,543 |
| Massachusetts Wtr. Resources Auth. Wtr. & Swr. Rev. Series 99, 0.06% 2/10/16, LOC State Street Bank & Trust Co., Boston, CP | | 4,000,000 | 4,000,000 |
| Melrose Gen. Oblig. Bonds Series 2015 B, 2% 8/1/16 | | 1,220,000 | 1,230,300 |
| Milford Gen. Oblig. BAN 2% 7/1/16 | | 1,600,000 | 1,611,684 |
| Norwood Gen. Oblig. BAN 2% 7/29/16 | | 2,000,000 | 2,016,898 |
| Peabody Gen. Oblig. BAN 1.25% 3/24/16 | | 1,900,000 | 1,902,910 |
| Pittsfield Gen. Oblig. BAN: | | | |
| 1.25% 4/1/16 | | 1,500,000 | 1,502,601 |
| 1.5% 4/1/16 | | 2,000,000 | 2,003,981 |
| Quincy Gen. Oblig. BAN 2% 6/17/16 | | 3,121,000 | 3,140,911 |
| RBC Muni. Products, Inc. Trust Bonds Series RBC E 42, 0.1%, tender 5/2/16 (Liquidity Facility Royal Bank of Canada) (a)(b)(c) | | 2,200,000 | 2,200,000 |
| Revere Gen. Oblig. BAN 1.25% 4/15/16 | | 1,600,000 | 1,603,422 |
| Shrewsbury Gen. Oblig. BAN 2% 7/29/16 | | 1,700,000 | 1,713,831 |
| Somerville Gen. Oblig. BAN Series 2015 B, 1.5% 6/10/16 | | 3,200,000 | 3,213,939 |
| Westfield Gen. Oblig. BAN 1.25% 4/1/16 | | 1,300,000 | 1,302,297 |
| Worcester Gen. Oblig. Bonds Series 2015 C, 5% 9/15/16 | | 1,870,000 | 1,922,620 |
| | | | 143,966,770 |
| TOTAL OTHER MUNICIPAL DEBT | | | |
| (Cost $144,266,770) | | | 144,266,770 |
| | | Shares | Value |
|
| Investment Company - 10.8% | | | |
| Fidelity Tax-Free Cash Central Fund, 0.01% (d)(e) | | | |
| (Cost $68,628,689) | | 68,628,689 | 68,628,689 |
| TOTAL INVESTMENT PORTFOLIO - 92.3% | | | |
| (Cost $584,461,459) | | | 584,461,459 |
| NET OTHER ASSETS (LIABILITIES) - 7.7% | | | 48,764,217 |
| NET ASSETS - 100% | | | $633,225,676 |
Security Type Abbreviations
BAN – BOND ANTICIPATION NOTE
CP – COMMERCIAL PAPER
RAN – REVENUE ANTICIPATION NOTE
VRDN – VARIABLE RATE DEMAND NOTE (A debt instrument that is payable upon demand, either daily, weekly or monthly)
The date shown for securities represents the date when principal payments must be paid, taking into account any call options exercised by the issuer and any permissible maturity shortening features other than interest rate resets.
Legend
(a) Coupon rates for floating and adjustable rate securities reflect the rates in effect at period end.
(b) Provides evidence of ownership in one or more underlying municipal bonds.
(c) Restricted securities - Investment in securities not registered under the Securities Act of 1933 (excluding 144A issues). At the end of the period, the value of restricted securities (excluding 144A issues) amounted to $2,200,000 or 0.3% of net assets.
(d) Information in this report regarding holdings by state and security types does not reflect the holdings of the Fidelity Tax-Free Cash Central Fund.
(e) Affiliated fund that is available only to investment companies and other accounts managed by Fidelity Investments. The rate quoted is the annualized seven-day yield of the fund at period end. A complete unaudited listing of the fund's holdings as of its most recent quarter end is available upon request. In addition, each Fidelity Central Fund's financial statements, which are not covered by the Fund's Report of Independent Registered Public Accounting Firm, are available on the SEC's website or upon request.
Additional information on each restricted holding is as follows:
| Security | Acquisition Date | Cost |
| RBC Muni. Products, Inc. Trust Bonds Series RBC E 42, 0.1%, tender 5/2/16 (Liquidity Facility Royal Bank of Canada) | 11/5/15 | $2,200,000 |
Affiliated Central Funds
Information regarding fiscal year to date income earned by the Fund from investments in Fidelity Central Funds is as follows:
| Fund | Income earned |
| Fidelity Tax-Free Cash Central Fund | $22,929 |
Investment Valuation
All investments are categorized as Level 2 under the Fair Value Hierarchy. The inputs or methodology used for valuing securities may not be an indication of the risk associated with investing in those securities. For more information on valuation inputs please refer to the Investment Valuation section in the accompanying Notes to Financial Statements.
See accompanying notes which are an integral part of the financial statements.
Financial Statements
Statement of Assets and Liabilities
| | | January 31, 2016 |
| Assets | | |
Investment in securities, at value — See accompanying schedule:
Unaffiliated issuers (cost $515,832,770) | $515,832,770 | |
| Fidelity Central Funds (cost $68,628,689) | 68,628,689 | |
| Total Investments (cost $584,461,459) | | $584,461,459 |
| Cash | | 50,985,598 |
| Receivable for fund shares sold | | 93,531 |
| Interest receivable | | 837,858 |
| Distributions receivable from Fidelity Central Funds | | 638 |
| Receivable from investment adviser for expense reductions | | 16,916 |
| Other receivables | | 1,195 |
| Total assets | | 636,397,195 |
| Liabilities | | |
| Payable for investments purchased | $1,733,398 | |
| Payable for fund shares redeemed | 1,396,327 | |
| Distributions payable | 546 | |
| Accrued management fee | 41,062 | |
| Other affiliated payables | 186 | |
| Total liabilities | | 3,171,519 |
| Net Assets | | $633,225,676 |
| Net Assets consist of: | | |
| Paid in capital | | $633,212,468 |
| Accumulated undistributed net realized gain (loss) on investments | | 13,208 |
| Net Assets | | $633,225,676 |
| Massachusetts AMT Tax-Free Money Market: | | |
| Net Asset Value, offering price and redemption price per share ($200,616,383 ÷ 200,342,037 shares) | | $1.00 |
| Institutional Class: | | |
| Net Asset Value, offering price and redemption price per share ($432,509,027 ÷ 432,085,415 shares) | | $1.00 |
| Service Class: | | |
| Net Asset Value, offering price and redemption price per share ($100,266 ÷ 100,167 shares) | | $1.00 |
See accompanying notes which are an integral part of the financial statements.
Statement of Operations
| | | Year ended January 31, 2016 |
| Investment Income | | |
| Interest | | $404,758 |
| Income from Fidelity Central Funds | | 22,929 |
| Total income | | 427,687 |
| Expenses | | |
| Management fee | $1,372,133 | |
| Transfer agent fees | 453,257 | |
| Distribution and service plan fees | 250 | |
| Independent trustees' compensation | 2,928 | |
| Total expenses before reductions | 1,828,568 | |
| Expense reductions | (1,469,453) | 359,115 |
| Net investment income (loss) | | 68,572 |
| Realized and Unrealized Gain (Loss) | | |
| Net realized gain (loss) on: | | |
| Investment securities: | | |
| Unaffiliated issuers | 414,710 | |
| Total net realized gain (loss) | | 414,710 |
| Net increase in net assets resulting from operations | | $483,282 |
See accompanying notes which are an integral part of the financial statements.
Statement of Changes in Net Assets
| | Year ended January 31, 2016 | Year ended January 31, 2015 |
| Increase (Decrease) in Net Assets | | |
| Operations | | |
| Net investment income (loss) | $68,572 | $77,348 |
| Net realized gain (loss) | 414,710 | 223,411 |
| Net increase in net assets resulting from operations | 483,282 | 300,759 |
| Distributions to shareholders from net investment income | (68,563) | (77,313) |
| Distributions to shareholders from net realized gain | (657,144) | (191,037) |
| Total distributions | (725,707) | (268,350) |
| Share transactions - net increase (decrease) | (86,757,068) | (97,697,929) |
| Total increase (decrease) in net assets | (86,999,493) | (97,665,520) |
| Net Assets | | |
| Beginning of period | 720,225,169 | 817,890,689 |
| End of period | $633,225,676 | $720,225,169 |
See accompanying notes which are an integral part of the financial statements.
Financial Highlights — Fidelity Massachusetts AMT Tax-Free Money Market Fund
| | | January 31, | | | |
| Years ended January 31, | 2016 | 2015 | 2014 | 2013 | 2012 |
| Selected Per–Share Data | | | | | |
| Net asset value, beginning of period | $1.00 | $1.00 | $1.00 | $1.00 | $1.00 |
| Income from Investment Operations | | | | | |
| Net investment income (loss)A | – | – | – | – | – |
| Net realized and unrealized gain (loss) | .001 | –A | –A | –A | –A |
| Total from investment operations | .001 | –A | –A | –A | –A |
| Distributions from net investment incomeA | – | – | – | – | – |
| Distributions from net realized gain | (.001) | –A | –A | –A | –A |
| Total distributions | (.001) | –A | –A | –A | –A |
| Net asset value, end of period | $1.00 | $1.00 | $1.00 | $1.00 | $1.00 |
| Total ReturnB | .11% | .04% | .02% | .02% | .01% |
| Ratios to Average Net AssetsC,D | | | | | |
| Expenses before reductions | .30% | .30% | .30% | .30% | .30% |
| Expenses net of fee waivers, if any | .05% | .07% | .10% | .17% | .17% |
| Expenses net of all reductions | .05% | .06% | .10% | .17% | .17% |
| Net investment income (loss) | .01% | .01% | .01% | .01% | .01% |
| Supplemental Data | | | | | |
| Net assets, end of period (000 omitted) | $200,616 | $235,903 | $250,871 | $272,374 | $290,104 |
A Amount represents less than $.005 per share.
B Total returns would have been lower if certain expenses had not been reduced during the applicable periods shown.
C Fees and expenses of any underlying Fidelity Central Funds are not included in the Fund's expense ratio. The Fund indirectly bears its proportionate share of the expenses of any underlying Fidelity Central Funds.
D Expense ratios reflect operating expenses of the class. Expenses before reductions do not reflect amounts reimbursed or waived or reductions from expense offset arrangements and do not represent the amount paid by the class during periods when reimbursements, waivers or reductions occur. Expenses net of fee waivers reflect expenses after reimbursement and waivers but prior to reductions from expense offset arrangements. Expenses net of all reductions represent the net expenses paid by the class.
See accompanying notes which are an integral part of the financial statements.
Financial Highlights — Fidelity Massachusetts AMT Tax-Free Money Market Fund Institutional Class
| | | January 31, | | | |
| Years ended January 31, | 2016 | 2015 | 2014 | 2013 | 2012 |
| Selected Per–Share Data | | | | | |
| Net asset value, beginning of period | $1.00 | $1.00 | $1.00 | $1.00 | $1.00 |
| Income from Investment Operations | | | | | |
| Net investment income (loss)A | – | – | – | – | – |
| Net realized and unrealized gain (loss) | .001 | –A | –A | –A | –A |
| Total from investment operations | .001 | –A | –A | –A | –A |
| Distributions from net investment incomeA | – | – | – | – | – |
| Distributions from net realized gain | (.001) | –A | –A | –A | –A |
| Total distributions | (.001) | –A | –A | –A | –A |
| Net asset value, end of period | $1.00 | $1.00 | $1.00 | $1.00 | $1.00 |
| Total ReturnB | .11% | .04% | .02% | .02% | .02% |
| Ratios to Average Net AssetsC,D | | | | | |
| Expenses before reductions | .25% | .25% | .25% | .25% | .25% |
| Expenses net of fee waivers, if any | .05% | .07% | .10% | .17% | .15% |
| Expenses net of all reductions | .05% | .06% | .10% | .17% | .15% |
| Net investment income (loss) | .01% | .01% | .01% | .01% | .03% |
| Supplemental Data | | | | | |
| Net assets, end of period (000 omitted) | $432,509 | $484,222 | $566,873 | $660,561 | $982,481 |
A Amount represents less than $.005 per share.
B Total returns would have been lower if certain expenses had not been reduced during the applicable periods shown.
C Fees and expenses of any underlying Fidelity Central Funds are not included in the Fund's expense ratio. The Fund indirectly bears its proportionate share of the expenses of any underlying Fidelity Central Funds.
D Expense ratios reflect operating expenses of the class. Expenses before reductions do not reflect amounts reimbursed or waived or reductions from expense offset arrangements and do not represent the amount paid by the class during periods when reimbursements, waivers or reductions occur. Expenses net of fee waivers reflect expenses after reimbursement and waivers but prior to reductions from expense offset arrangements. Expenses net of all reductions represent the net expenses paid by the class.
See accompanying notes which are an integral part of the financial statements.
Financial Highlights — Fidelity Massachusetts AMT Tax-Free Money Market Fund Service Class
| | | January 31, | | | |
| Years ended January 31, | 2016 | 2015 | 2014 | 2013 | 2012 |
| Selected Per–Share Data | | | | | |
| Net asset value, beginning of period | $1.00 | $1.00 | $1.00 | $1.00 | $1.00 |
| Income from Investment Operations | | | | | |
| Net investment income (loss)A | – | – | – | – | – |
| Net realized and unrealized gain (loss) | .001 | –A | –A | –A | –A |
| Total from investment operations | .001 | –A | –A | –A | –A |
| Distributions from net investment incomeA | – | – | – | – | – |
| Distributions from net realized gain | (.001) | –A | –A | –A | –A |
| Total distributions | (.001) | –A | –A | –A | –A |
| Net asset value, end of period | $1.00 | $1.00 | $1.00 | $1.00 | $1.00 |
| Total ReturnB | .11% | .04% | .02% | .02% | .01% |
| Ratios to Average Net AssetsC,D | | | | | |
| Expenses before reductions | .50% | .50% | .50% | .50% | .50% |
| Expenses net of fee waivers, if any | .05% | .06% | .10% | .18% | .17% |
| Expenses net of all reductions | .05% | .06% | .10% | .18% | .16% |
| Net investment income (loss) | .01% | .01% | .01% | .01% | .01% |
| Supplemental Data | | | | | |
| Net assets, end of period (000 omitted) | $100 | $100 | $146 | $94 | $534 |
A Amount represents less than $.005 per share.
B Total returns would have been lower if certain expenses had not been reduced during the applicable periods shown.
C Fees and expenses of any underlying Fidelity Central Funds are not included in the Fund's expense ratio. The Fund indirectly bears its proportionate share of the expenses of any underlying Fidelity Central Funds.
D Expense ratios reflect operating expenses of the class. Expenses before reductions do not reflect amounts reimbursed or waived or reductions from expense offset arrangements and do not represent the amount paid by the class during periods when reimbursements, waivers or reductions occur. Expenses net of fee waivers reflect expenses after reimbursement and waivers but prior to reductions from expense offset arrangements. Expenses net of all reductions represent the net expenses paid by the class.
See accompanying notes which are an integral part of the financial statements.
Notes to Financial Statements
For the period ended January 31, 2016
1. Organization.
Fidelity Massachusetts AMT Tax-Free Money Market Fund (the Fund) is a fund of Fidelity Massachusetts Municipal Trust (the Trust) and is authorized to issue an unlimited number of shares. The Trust is registered under the Investment Company Act of 1940, as amended (the 1940 Act), as an open-end management investment company organized as a Massachusetts business trust. The Fund offers Massachusetts AMT Tax-Free Money Market, Institutional Class and Service Class shares, each of which has equal rights as to assets and voting privileges. Each class has exclusive voting rights with respect to matters that affect that class. Effective January 1, 2016 shares of the Fund are only available for purchase by retail shareholders. The Fund may be affected by economic and political developments in the state of Massachusetts.
2. Investments in Fidelity Central Funds.
The Fund may invests in Fidelity Central Funds, which are open-end investment companies generally available only to other investment companies and accounts managed by the investment adviser and its affiliates. The Fund's Schedule of Investments lists each of the Fidelity Central Funds held as of period end, if any, as an investment of the Fund, but does not include the underlying holdings of each Fidelity Central Fund. As an Investing Fund, the Fund indirectly bears its proportionate share of the expenses of the underlying Fidelity Central Funds.
The Money Market Central Funds seek preservation of capital and current income and are managed by Fidelity Investments Money Management, Inc. (FIMM), an affiliate of the investment adviser. Annualized expenses of the Money Market Central Funds as of their most recent shareholder report date are less than .005%.
A complete unaudited list of holdings for each Fidelity Central Fund is available upon request or at the Securities and Exchange Commission (the SEC) website at www.sec.gov. In addition, the financial statements of the Fidelity Central Funds, which are not covered by the Fund's Report of Independent Registered Public Accounting Firm, are available on the SEC website or upon request.
3. Significant Accounting Policies.
The financial statements have been prepared in conformity with accounting principles generally accepted in the United States of America (GAAP), which require management to make certain estimates and assumptions at the date of the financial statements. Actual results could differ from those estimates. Subsequent events, if any, through the date that the financial statements were issued have been evaluated in the preparation of the financial statements. The following summarizes the significant accounting policies of the Fund:
Investment Valuation. The Fund categorizes the inputs to valuation techniques used to value its investments into a disclosure hierarchy consisting of three levels as shown below:
- Level 1 – quoted prices in active markets for identical investments
- Level 2 – other significant observable inputs (including quoted prices for similar investments, interest rates, prepayment speeds, etc.)
- Level 3 – unobservable inputs (including the Fund's own assumptions based on the best information available)
As permitted by compliance with certain conditions under Rule 2a-7 of the 1940 Act, securities are valued at amortized cost, which approximates fair value. The amortized cost of an instrument is determined by valuing it at its original cost and thereafter amortizing any discount or premium from its face value at a constant rate until maturity. Securities held by a money market fund are generally high quality and liquid; however, they are reflected as Level 2 because the inputs used to determine fair value are not quoted prices in an active market.
Investment Transactions and Income. The net asset value per share for processing shareholder transactions is calculated as of the close of business of the New York Stock Exchange (NYSE), normally 4:00 p.m. Eastern time. Security transactions, including the Fund's investment activity in the Fidelity Central Funds, are accounted for as of trade date. Gains and losses on securities sold are determined on the basis of identified cost. Income and capital gain distributions from Fidelity Central Funds, if any, are recorded on the ex-dividend date. Interest income is accrued as earned and includes coupon interest and amortization of premium and accretion of discount on debt securities as applicable.
Class Allocations and Expenses. Investment income, realized and unrealized capital gains and losses, common expenses of the Fund, and certain fund-level expense reductions, if any, are allocated daily on a pro-rata basis to each class based on the relative net assets of each class to the total net assets of the Fund. Each class differs with respect to transfer agent and distribution and service plan fees incurred. Certain expense reductions may also differ by class. For the reporting period, the allocated portion of income and expenses to each class as a percent of its average net assets may vary due to the timing of recording these transactions in relation to fluctuating net assets of the classes. Expenses directly attributable to a fund are charged to that fund. Expenses attributable to more than one fund are allocated among the respective funds on the basis of relative net assets or other appropriate methods. Expense estimates are accrued in the period to which they relate and adjustments are made when actual amounts are known.
Income Tax Information and Distributions to Shareholders. Each year, the Fund intends to qualify as a regulated investment company under Subchapter M of the Internal Revenue Code, including distributing substantially all of its taxable income and realized gains. As a result, no provision for U.S. Federal income taxes is required. As of January 31, 2016, the Fund did not have any unrecognized tax benefits in the financial statements; nor is the Fund aware of any tax positions for which it is reasonably possible that the total amounts of unrecognized tax benefits will significantly change in the next twelve months. The Fund files a U.S. federal tax return, in addition to state and local tax returns as required. The Fund's federal income tax returns are subject to examination by the Internal Revenue Service (IRS) for a period of three fiscal years after they are filed. State and local tax returns may be subject to examination for an additional fiscal year depending on the jurisdiction.
Dividends are declared and recorded daily and paid monthly from net investment income. Distributions from realized gains, if any, are declared and recorded on the ex-dividend date. Income dividends and capital gain distributions are declared separately for each class. Income and capital gain distributions are determined in accordance with income tax regulations, which may differ from GAAP.
Capital accounts within the financial statements are adjusted for permanent book-tax differences. These adjustments have no impact on net assets or the results of operations. Capital accounts are not adjusted for temporary book-tax differences which will reverse in a subsequent period.
Book-tax differences are primarily due to deferred trustees compensation.
The Fund purchases municipal securities whose interest, in the opinion of the issuer, is free from federal income tax. There is no assurance that the IRS will agree with this opinion. In the event the IRS determines that the issuer does not comply with relevant tax requirements, interest payments from a security could become federally taxable, possibly retroactively to the date the security was issued.
The federal tax cost of investment securities and unrealized appreciation (depreciation) as of period end were as follows:
| Gross unrealized appreciation | $– |
| Gross unrealized depreciation | – |
| Net unrealized appreciation (depreciation) on securities | $– |
| Tax Cost | $584,461,459 |
The tax-based components of distributable earnings as of period end were as follows:
| Undistributed tax-exempt income | $13,402 |
The tax character of distributions paid was as follows:
| | January 31, 2016 | January 31, 2015 |
| Tax-exempt Income | $68,563 | $77,313 |
| Long-term Capital Gains | 657,144 | 191,037 |
| Total | $725,707 | $ 268,350 |
Restricted Securities. The Fund may invest in securities that are subject to legal or contractual restrictions on resale. These securities generally may be resold in transactions exempt from registration or to the public if the securities are registered. Disposal of these securities may involve time-consuming negotiations and expense, and prompt sale at an acceptable price may be difficult. Information regarding restricted securities is included at the end of the Fund's Schedule of Investments.
4. Fees and Other Transactions with Affiliates.
Management Fee and Expense Contract. Fidelity Management & Research Company (the investment adviser) and its affiliates provide the Fund with investment management related services for which the Fund pays a monthly management fee that is based on an annual rate of .20% of the Fund's average net assets. Under the management contract, the investment adviser pays all other fund-level expenses, except the compensation of the independent Trustees and certain other expenses such as interest expense. The management fee is reduced by an amount equal to the fees and expenses paid by the Fund to the independent Trustees.
In addition, under the expense contract, the investment adviser pays class-level expenses for Massachusetts AMT Tax-Free Money Market so that the total expenses do not exceed .35%, expressed as a percentage of class average net assets, with certain exceptions such as interest expense.
Distribution and Service Plan Fees. In accordance with Rule 12b-1 of the 1940 Act, the Fund has adopted separate Distribution and Service Plans for each class of shares. Service Class pays Fidelity Distributors Corporation (FDC), an affiliate of the investment adviser, a Service Fee based on an annual percentage of Service Class' average net assets. In addition, FDC may pay financial intermediaries for selling shares of the Fund and providing shareholder support services. For the period, the Service Fee rate, total service fees and amounts retained by FDC were as follows:
| | Service
Fee | Total Fees | Retained
by FDC |
| Service Class | .25% | $250 | $– |
During the period, the investment adviser or its affiliates waived a portion of these fees.
Transfer Agent Fees. Pursuant to the transfer agent contract approved by the Board of Trustees effective May 1, 2015, Fidelity Investments Institutional Operations Company, Inc. (FIIOC), an affiliate of the investment adviser, is the transfer, dividend disbursing and shareholder servicing agent for the Fund. FIIOC receives asset-based fees with respect to each account. FIIOC pays for typesetting, printing and mailing of shareholder reports, except proxy statements. Each class, with the exception of Massachusetts AMT Tax-Free Money Market, pays a transfer agent fee equal to an annual rate of .05% of class-level average net assets. Massachusetts AMT Tax-Free Money Market pays a transfer agent fee equal to an annual rate of .10% of class-level average net assets. For the period, transfer agent fees for each class were as follows:
| | Amount |
| Massachusetts AMT Tax-Free Money Market | $218,858 |
| Institutional Class | 234,350 |
| Service Class | 49 |
| | $453,257 |
During the period, the investment adviser or its affiliates waived a portion of these fees.
Prior to May 1, 2015, Citibank, N.A. was the transfer, dividend disbursing and shareholder servicing agent for the Fund. Prior to May 8, 2015, Citibank, N.A. was the custodian for the Fund.
Interfund Trades. The Fund may purchase from or sell securities to other Fidelity Funds under procedures adopted by the Board. The procedures have been designed to ensure these interfund trades are executed in accordance with Rule 17a-7 of the 1940 Act.
5. Expense Reductions.
The investment adviser contractually agreed to reimburse Institutional Class and Service Class to the extent annual operating expenses, expressed as a percentage of each class' average net assets, exceed .20% and .45%, respectively. Some expenses, for example interest expense, are excluded from this reimbursement. During the period, this reimbursement reduced Institutional Class and Service Class expenses by $234,629 and $49, respectively.
Additionally, the investment adviser or its affiliates voluntarily agreed to waive certain fees in order to maintain a minimum annualized yield of .01%. Such arrangements may be discontinued by the investment adviser at any time. For the period, the amount of the waiver for each class was as follows:
| | Amount |
| Massachusetts AMT Tax-Free Money Market | $540,502 |
| Institutional Class | 687,752 |
| Service Class | 399 |
In addition, through arrangements with the Fund's custodian, credits realized as a result of certain uninvested cash balances were used to reduce the Fund's expenses. During the period, these credits reduced the Fund's expenses by $6,122.
6. Distributions to Shareholders.
Distributions to shareholders of each class were as follows:
| Years ended January 31, | 2016 | 2015 |
| From net investment income | | |
| Massachusetts AMT Tax-Free Money Market | $21,765 | $24,529 |
| Institutional Class | 46,787 | 52,770 |
| Service Class | 11 | 14 |
| Total | $68,563 | $77,313 |
| From net realized gain | | |
| Massachusetts AMT Tax-Free Money Market | $207,228 | $61,845 |
| Institutional Class | 449,816 | 129,158 |
| Service Class | 100 | 34 |
| Total | $657,144 | $191,037 |
7. Share Transactions.
Share transactions for each class of shares at a $1.00 per share were as follows and may contain automatic conversions between classes or exchanges between affiliated funds:
| Years ended January 31, | 2016 | 2015 |
| Massachusetts AMT Tax-Free Money Market | | |
| Shares sold | 56,824,175 | 68,833,614 |
| Reinvestment of distributions | 211,201 | 81,141 |
| Shares redeemed | (92,226,287) | (83,905,639) |
| Net increase (decrease) | (35,190,911) | (14,990,884) |
| Institutional Class | | |
| Shares sold | 108,908,865 | 106,197,119 |
| Reinvestment of distributions | 416,350 | 156,392 |
| Shares redeemed | (160,891,482) | (189,014,381) |
| Net increase (decrease) | (51,566,267) | (82,660,870) |
| Service Class | | |
| Reinvestment of distributions | 110 | 48 |
| Shares redeemed | – | (46,223) |
| Net increase (decrease) | 110 | (46,175) |
8. Other.
The Fund's organizational documents provide former and current trustees and officers with a limited indemnification against liabilities arising in connection with the performance of their duties to the Fund. In the normal course of business, the Fund may also enter into contracts that provide general indemnifications. The Fund's maximum exposure under these arrangements is unknown as this would be dependent on future claims that may be made against the Fund. The risk of material loss from such claims is considered remote.
Report of Independent Registered Public Accounting Firm
To the Trustees of Fidelity Massachusetts Municipal Trust and Shareholders of Fidelity Massachusetts AMT Tax-Free Money Market Fund:
We have audited the accompanying statement of assets and liabilities of Fidelity® Massachusetts AMT Tax-Free Money Market Fund (the Fund), a fund of Fidelity Massachusetts Municipal Trust, including the schedule of investments, as of January 31, 2016, and the related statement of operations for the year then ended, the statement of changes in net assets for each of the two years in the period then ended, and the financial highlights for each of the five years in the period then ended. These financial statements and financial highlights are the responsibility of the Fund's management. Our responsibility is to express an opinion on these financial statements and financial highlights based on our audits.
We conducted our audits in accordance with the standards of the Public Company Accounting Oversight Board (United States). Those standards require that we plan and perform the audit to obtain reasonable assurance about whether the financial statements and financial highlights are free of material misstatement. The Fund is not required to have, nor were we engaged to perform, an audit of its internal control over financial reporting. Our audits included consideration of internal control over financial reporting as a basis for designing audit procedures that are appropriate in the circumstances, but not for the purpose of expressing an opinion on the effectiveness of the Fund's internal control over financial reporting. Accordingly, we express no such opinion. An audit also includes examining, on a test basis, evidence supporting the amounts and disclosures in the financial statements, assessing the accounting principles used and significant estimates made by management, as well as evaluating the overall financial statement presentation. Our procedures included confirmation of securities owned as of January 31, 2016, by correspondence with the custodians and brokers; when replies were not received from brokers, we performed other auditing procedures. We believe that our audits provide a reasonable basis for our opinion.
In our opinion, such financial statements and financial highlights referred to above present fairly, in all material respects, the financial position of Fidelity Massachusetts AMT Tax-Free Money Market Fund as of January 31, 2016, the results of its operations for the year then ended, the changes in its net assets for each of the two years in the period then ended, and the financial highlights for each of the five years in the period then ended, in conformity with accounting principles generally accepted in the United States of America.
DELOITTE & TOUCHE LLP
Boston, Massachusetts
March 16, 2016
Trustees and Officers
The Trustees, Members of the Advisory Board (if any), and officers of the trust and fund, as applicable, are listed below. The Board of Trustees governs the fund and is responsible for protecting the interests of shareholders. The Trustees are experienced executives who meet periodically throughout the year to oversee the fund's activities, review contractual arrangements with companies that provide services to the fund, oversee management of the risks associated with such activities and contractual arrangements, and review the fund's performance. Except for Elizabeth S. Acton, John Engler, and Geoffrey A. von Kuhn, each of the Trustees oversees 239 funds. Ms. Acton and Mr. Engler each oversees 234 funds. Mr. von Kuhn oversees 163 funds.
The Trustees hold office without limit in time except that (a) any Trustee may resign; (b) any Trustee may be removed by written instrument, signed by at least two-thirds of the number of Trustees prior to such removal; (c) any Trustee who requests to be retired or who has become incapacitated by illness or injury may be retired by written instrument signed by a majority of the other Trustees; and (d) any Trustee may be removed at any special meeting of shareholders by a two-thirds vote of the outstanding voting securities of the trust. Each Trustee who is not an interested person (as defined in the 1940 Act) of the trust and the fund is referred to herein as an Independent Trustee. Each Independent Trustee shall retire not later than the last day of the calendar year in which his or her 75th birthday occurs. The Independent Trustees may waive this mandatory retirement age policy with respect to individual Trustees. Officers and Advisory Board Members hold office without limit in time, except that any officer or Advisory Board Member may resign or may be removed by a vote of a majority of the Trustees at any regular meeting or any special meeting of the Trustees. Except as indicated, each individual has held the office shown or other offices in the same company for the past five years.
The fund’s Statement of Additional Information (SAI) includes more information about the Trustees. To request a free copy, call Fidelity at 1-800-544-8544 for Fidelity® Massachusetts AMT Tax-Free Money Market Fund or at 1-877-208-0098 for Institutional Class and Service Class.
Experience, Skills, Attributes, and Qualifications of the Trustees. The Governance and Nominating Committee has adopted a statement of policy that describes the experience, qualifications, attributes, and skills that are necessary and desirable for potential Independent Trustee candidates (Statement of Policy). The Board believes that each Trustee satisfied at the time he or she was initially elected or appointed a Trustee, and continues to satisfy, the standards contemplated by the Statement of Policy. The Governance and Nominating Committee also engages professional search firms to help identify potential Independent Trustee candidates who have the experience, qualifications, attributes, and skills consistent with the Statement of Policy. From time to time, additional criteria based on the composition and skills of the current Independent Trustees, as well as experience or skills that may be appropriate in light of future changes to board composition, business conditions, and regulatory or other developments, have also been considered by the professional search firms and the Governance and Nominating Committee. In addition, the Board takes into account the Trustees' commitment and participation in Board and committee meetings, as well as their leadership of standing and ad hoc committees throughout their tenure.
In determining that a particular Trustee was and continues to be qualified to serve as a Trustee, the Board has considered a variety of criteria, none of which, in isolation, was controlling. The Board believes that, collectively, the Trustees have balanced and diverse experience, qualifications, attributes, and skills, which allow the Board to operate effectively in governing the fund and protecting the interests of shareholders. Information about the specific experience, skills, attributes, and qualifications of each Trustee, which in each case led to the Board's conclusion that the Trustee should serve (or continue to serve) as a trustee of the fund, is provided below.
Board Structure and Oversight Function. Abigail P. Johnson is an interested person and currently serves as Chairman. The Trustees have determined that an interested Chairman is appropriate and benefits shareholders because an interested Chairman has a personal and professional stake in the quality and continuity of services provided to the fund. Independent Trustees exercise their informed business judgment to appoint an individual of their choosing to serve as Chairman, regardless of whether the Trustee happens to be independent or a member of management. The Independent Trustees have determined that they can act independently and effectively without having an Independent Trustee serve as Chairman and that a key structural component for assuring that they are in a position to do so is for the Independent Trustees to constitute a substantial majority for the Board. The Independent Trustees also regularly meet in executive session. Marie L. Knowles serves as Chairman of the Independent Trustees and as such (i) acts as a liaison between the Independent Trustees and management with respect to matters important to the Independent Trustees and (ii) with management prepares agendas for Board meetings.
Fidelity® funds are overseen by different Boards of Trustees. The fund's Board oversees Fidelity's investment-grade bond, money market, asset allocation and certain equity funds, and other Boards oversee Fidelity's high income, sector and other equity funds. The asset allocation funds may invest in Fidelity® funds that are overseen by such other Boards. The use of separate Boards, each with its own committee structure, allows the Trustees of each group of Fidelity® funds to focus on the unique issues of the funds they oversee, including common research, investment, and operational issues. On occasion, the separate Boards establish joint committees to address issues of overlapping consequences for the Fidelity® funds overseen by each Board.
The Trustees operate using a system of committees to facilitate the timely and efficient consideration of all matters of importance to the Trustees, the fund, and fund shareholders and to facilitate compliance with legal and regulatory requirements and oversight of the fund's activities and associated risks. The Board, acting through its committees, has charged FMR and its affiliates with (i) identifying events or circumstances the occurrence of which could have demonstrably adverse effects on the fund's business and/or reputation; (ii) implementing processes and controls to lessen the possibility that such events or circumstances occur or to mitigate the effects of such events or circumstances if they do occur; and (iii) creating and maintaining a system designed to evaluate continuously business and market conditions in order to facilitate the identification and implementation processes described in (i) and (ii) above. Because the day-to-day operations and activities of the fund are carried out by or through FMR, its affiliates, and other service providers, the fund's exposure to risks is mitigated but not eliminated by the processes overseen by the Trustees. While each of the Board's committees has responsibility for overseeing different aspects of the fund's activities, oversight is exercised primarily through the Operations and Audit Committees. In addition, an ad hoc Board committee of Independent Trustees has worked with FMR to enhance the Board's oversight of investment and financial risks, legal and regulatory risks, technology risks, and operational risks, including the development of additional risk reporting to the Board. The Operations Committee also worked and continues to work with FMR to enhance the stress tests required under SEC regulations for money market funds. Appropriate personnel, including but not limited to the fund's Chief Compliance Officer (CCO), FMR's internal auditor, the independent accountants, the fund's Treasurer and portfolio management personnel, make periodic reports to the Board's committees, as appropriate, including an annual review of Fidelity's risk management program for the Fidelity® funds. The responsibilities of each standing committee, including their oversight responsibilities, are described further under "Standing Committees of the Trustees."
Interested Trustees*:
Correspondence intended for a Trustee who is an interested person may be sent to Fidelity Investments, 245 Summer Street, Boston, Massachusetts 02210.
Name, Year of Birth; Principal Occupations and Other Relevant Experience+
Abigail P. Johnson (1961)
Year of Election or Appointment: 2009
Trustee
Chairman of the Board of Trustees
Ms. Johnson also serves as Trustee of other Fidelity® funds. Ms. Johnson serves as President (2013-present) and Chief Executive Officer (2014-present) of FMR LLC (diversified financial services company), President of Fidelity Financial Services (2012-present) and President of Personal, Workplace and Institutional Services (2005-present). Ms. Johnson is Chairman and Director of FMR Co., Inc. (investment adviser firm, 2011-present), Chairman and Director of FMR (investment adviser firm, 2011-present), and the Vice Chairman and Director (2007-present) of FMR LLC. Previously, Ms. Johnson served as President and a Director of FMR (2001-2005), a Trustee of other investment companies advised by FMR, Fidelity Investments Money Management, Inc. (investment adviser firm), and FMR Co., Inc. (2001-2005), Senior Vice President of the Fidelity® funds (2001-2005), and managed a number of Fidelity® funds. Ms. Abigail P. Johnson and Mr. Arthur E. Johnson are not related.
Geoffrey A. von Kuhn (1951)
Year of Election or Appointment: 2016
Trustee
Mr. von Kuhn also serves as Trustee or Member of the Advisory Board of other Fidelity funds. Mr. von Kuhn is Chief Administrative Officer for FMR LLC (diversified financial services company, 2013-present), a Director of Pembroke Real Estate, Inc. (2009-present), and a Director of Discovery Natural Resources LLC (2012-present). Previously, Mr. von Kuhn was a managing director of Crosby Group (private wealth management company, 2007-2013), a member of the management committee and senior executive in the Wealth Management Group of AmSouth Bank (2001-2006), and head of the U.S. private bank at Citigroup (2000-2001).
* Determined to be an “Interested Trustee” by virtue of, among other things, his or her affiliation with the trust or various entities under common control with FMR.
+ The information includes the Trustee's principal occupation during the last five years and other information relating to the experience, attributes, and skills relevant to the Trustee's qualifications to serve as a Trustee, which led to the conclusion that the Trustee should serve as a Trustee for the fund.
Independent Trustees:
Correspondence intended for an Independent Trustee may be sent to Fidelity Investments, P.O. Box 55235, Boston, Massachusetts 02205-5235.
Name, Year of Birth; Principal Occupations and Other Relevant Experience+
Elizabeth S. Acton (1951)
Year of Election or Appointment: 2013
Trustee
Ms. Acton also serves as Trustee or Member of the Advisory Board of other Fidelity® funds. Prior to her retirement in April 2012, Ms. Acton was Executive Vice President, Finance (2011-2012), Executive Vice President, Chief Financial Officer (2002-2011), and Treasurer (2004-2005) of Comerica Incorporated (financial services). Prior to joining Comerica, Ms. Acton held a variety of positions at Ford Motor Company (1983-2002), including Vice President and Treasurer (2000-2002) and Executive Vice President and Chief Financial Officer of Ford Motor Credit Company (1998-2000). Ms. Acton currently serves as a member of the Board of Directors and Audit and Finance Committees of Beazer Homes USA, Inc. (homebuilding, 2012-present).
John Engler (1948)
Year of Election or Appointment: 2014
Trustee
Mr. Engler also serves as Trustee or Member of the Advisory Board of other Fidelity® funds. He serves as president of the Business Roundtable (2011-present), and on the board of directors for Universal Forest Products (manufacturer and distributor of wood and wood-alternative products, 2003-present) and K12 Inc. (technology-based education company, 2012-present). Previously, Mr. Engler served as a trustee of The Munder Funds (2003-2014), president and CEO of the National Association of Manufacturers (2004-2011), member of the Board of Trustees of the Annie E. Casey Foundation (2004-2015), and as governor of Michigan (1991-2003). He is a past chairman of the National Governors Association.
Albert R. Gamper, Jr. (1942)
Year of Election or Appointment: 2006
Trustee
Mr. Gamper also serves as Trustee of other Fidelity® funds. Prior to his retirement in December 2004, Mr. Gamper served as Chairman of the Board of CIT Group Inc. (commercial finance). During his tenure with CIT Group Inc. Mr. Gamper served in numerous senior management positions, including Chairman (1987-1989; 1999-2001; 2002-2004), Chief Executive Officer (1987-2004), and President (2002-2003). Mr. Gamper currently serves as a member of the Board of Directors of Public Service Enterprise Group (utilities, 2000-present), and Member of the Board of Trustees of Barnabas Health Care System (1997-present). Previously, Mr. Gamper served as Chairman (2012-2015) and Vice Chairman (2011-2012) of the Independent Trustees of certain Fidelity® funds and as Chairman of the Board of Governors, Rutgers University (2004-2007).
Robert F. Gartland (1951)
Year of Election or Appointment: 2010
Trustee
Mr. Gartland also serves as Trustee of other Fidelity® funds. Mr. Gartland is Chairman and an investor in Gartland and Mellina Group Corp. (consulting, 2009-present). Previously, Mr. Gartland served as a partner and investor of Vietnam Partners LLC (investments and consulting, 2008-2011). Prior to his retirement, Mr. Gartland held a variety of positions at Morgan Stanley (financial services, 1979-2007) including Managing Director (1987-2007).
Arthur E. Johnson (1947)
Year of Election or Appointment: 2008
Trustee
Vice Chairman of the Independent Trustees
Mr. Johnson also serves as Trustee of other Fidelity® funds. Mr. Johnson serves as a member of the Board of Directors of Eaton Corporation plc (diversified power management, 2009-present), AGL Resources, Inc. (holding company, 2002-present) and Booz Allen Hamilton (management consulting, 2011-present). Prior to his retirement, Mr. Johnson served as Senior Vice President of Corporate Strategic Development of Lockheed Martin Corporation (defense contractor, 1999-2009). He previously served on the Board of Directors of IKON Office Solutions, Inc. (1999-2008) and Delta Airlines (2005-2007). Mr. Arthur E. Johnson is not related to Ms. Abigail P. Johnson.
Michael E. Kenneally (1954)
Year of Election or Appointment: 2009
Trustee
Mr. Kenneally also serves as Trustee of other Fidelity® funds. Prior to his retirement, Mr. Kenneally served as Chairman and Global Chief Executive Officer of Credit Suisse Asset Management. Before joining Credit Suisse, he was an Executive Vice President and Chief Investment Officer for Bank of America Corporation. Earlier roles at Bank of America included Director of Research, Senior Portfolio Manager and Research Analyst, and Mr. Kenneally was awarded the Chartered Financial Analyst (CFA) designation in 1991.
James H. Keyes (1940)
Year of Election or Appointment: 2007
Trustee
Mr. Keyes also serves as Trustee of other Fidelity® funds. Mr. Keyes serves as a member of the Board and Non-Executive Chairman of Navistar International Corporation (manufacture and sale of trucks, buses, and diesel engines, since 2002). Previously, Mr. Keyes served as a member of the Board of Pitney Bowes, Inc. (integrated mail, messaging, and document management solutions, 1998-2013). Prior to his retirement, Mr. Keyes served as Chairman (1993-2002) and Chief Executive Officer (1988-2002) of Johnson Controls (automotive, building, and energy) and as a member of the Board of LSI Logic Corporation (semiconductor technologies, 1984-2008).
Marie L. Knowles (1946)
Year of Election or Appointment: 2001
Trustee
Chairman of the Independent Trustees
Ms. Knowles also serves as Trustee of other Fidelity® funds. Prior to Ms. Knowles' retirement in June 2000, she served as Executive Vice President and Chief Financial Officer of Atlantic Richfield Company (ARCO) (diversified energy, 1996-2000). From 1993 to 1996, she was a Senior Vice President of ARCO and President of ARCO Transportation Company (pipeline and tanker operations). Ms. Knowles currently serves as a Director and Chairman of the Audit Committee of McKesson Corporation (healthcare service, since 2002). Ms. Knowles is a member of the Board of the Santa Catalina Island Company (real estate, 2009-present). Ms. Knowles is a Member of the Investment Company Institute Board of Governors and a Member of the Governing Council of the Independent Directors Council (2014-present). She also serves as a member of the Advisory Board for the School of Engineering of the University of Southern California. Previously, Ms. Knowles served as a Director of Phelps Dodge Corporation (copper mining and manufacturing, 1994-2007), URS Corporation (engineering and construction, 2000-2003) and America West (airline, 1999-2002). Ms. Knowles previously served as Vice Chairman of the Independent Trustees of certain Fidelity® funds (2012-2015).
+ The information includes the Trustee's principal occupation during the last five years and other information relating to the experience, attributes, and skills relevant to the Trustee's qualifications to serve as a Trustee, which led to the conclusion that the Trustee should serve as a Trustee for the fund.
Advisory Board Members and Officers:
Correspondence intended for an officer may be sent to Fidelity Investments, 245 Summer Street, Boston, Massachusetts 02210. Officers appear below in alphabetical order.
Name, Year of Birth; Principal Occupation
Marc R. Bryant (1966)
Year of Election or Appointment: 2015
Secretary and Chief Legal Officer (CLO)
Mr. Bryant also serves as Secretary and CLO of other funds. Mr. Bryant serves as CLO, Secretary, and Senior Vice President of Fidelity Management & Research Company (investment adviser firm, 2015-present) and FMR Co., Inc. (investment adviser firm, 2015-present); Secretary of Fidelity SelectCo, LLC (investment adviser firm, 2015-present) and Fidelity Investments Money Management, Inc. (investment adviser firm, 2015-present); and CLO of Fidelity Management & Research (Hong Kong) Limited (investment adviser firm, 2015-present). He is Senior Vice President and Deputy General Counsel of FMR LLC (diversified financial services company). Previously, Mr. Bryant served as Secretary and CLO of Fidelity Rutland Square Trust II (2010-2014) and Assistant Secretary of Fidelity's Fixed Income and Asset Allocation Funds (2013-2015). Prior to joining Fidelity Investments, Mr. Bryant served as a Senior Vice President and the Head of Global Retail Legal for AllianceBernstein L.P. (2006-2010), and as the General Counsel for ProFund Advisors LLC (2001-2006).
Jonathan Davis (1968)
Year of Election or Appointment: 2010
Assistant Treasurer
Mr. Davis also serves as Assistant Treasurer of other funds, and is an employee of Fidelity Investments. Previously, Mr. Davis served as Vice President and Associate General Counsel of FMR LLC (diversified financial services company, 2003-2010).
Adrien E. Deberghes (1967)
Year of Election or Appointment: 2010
Assistant Treasurer
Mr. Deberghes also serves as an officer of other funds. He is an employee of Fidelity Investments (2008-present). Prior to joining Fidelity Investments, Mr. Deberghes was Senior Vice President of Mutual Fund Administration at State Street Corporation (2007-2008), Senior Director of Mutual Fund Administration at Investors Bank & Trust (2005-2007), and Director of Finance for Dunkin' Brands (2000-2005).
Stephanie J. Dorsey (1969)
Year of Election or Appointment: 2013
President and Treasurer
Ms. Dorsey also serves as an officer of other funds. She is an employee of Fidelity Investments (2008-present) and has served in other fund officer roles. Prior to joining Fidelity Investments, Ms. Dorsey served as Treasurer (2004-2008) of the JPMorgan Mutual Funds and Vice President (2004-2008) of JPMorgan Chase Bank.
Howard J. Galligan III (1966)
Year of Election or Appointment: 2014
Chief Financial Officer
Mr. Galligan also serves as Chief Financial Officer of other funds. Mr. Galligan serves as President of Fidelity Pricing and Cash Management Services (FPCMS) (2014-present) and as a Director of Strategic Advisers, Inc. (investment adviser firm, 2008-present). Previously, Mr. Galligan served as Chief Administrative Officer of Asset Management (2011-2014) and Chief Operating Officer and Senior Vice President of Investment Support for Strategic Advisers, Inc. (2003-2011).
Scott C. Goebel (1968)
Year of Election or Appointment: 2015
Vice President
Mr. Goebel serves as Vice President of other funds and is an employee of Fidelity Investments (2001-present). Previously, Mr. Goebel served as Secretary of Fidelity SelectCo, LLC (investment adviser firm, 2013-2015), Fidelity Investments Money Management, Inc. (FIMM) (investment adviser firm, 2010-2015), and Fidelity Research and Analysis Company (FRAC) (investment adviser firm, 2010-2015); General Counsel, Secretary, and Senior Vice President of Fidelity Management & Research Company (investment adviser firm, 2008-2015) and FMR Co., Inc. (investment adviser firm, 2008-2015); Assistant Secretary of Fidelity Management & Research (Japan) Limited (investment adviser firm, 2008-2015) and FMR Investment Management (U.K.) Limited (investment adviser firm, 2008-2015); Chief Legal Officer (CLO) of Fidelity Management & Research (Hong Kong) Limited (investment adviser firm, 2008-2015); Secretary and CLO of certain Fidelity® funds (2008-2015); Assistant Secretary of FIMM (2008-2010), FRAC (2008-2010), and certain funds (2007-2008); and as Vice President and Secretary of Fidelity Distributors Corporation (FDC) (2005-2007).
Timothy Huyck (1964)
Year of Election or Appointment: 2015
Vice President of Fidelity's Money Market Funds
Mr. Huyck also serves as Vice President of other funds. Mr. Huyck serves as Chief Investment Officer of Fidelity's Money Market Funds (2015-present) and is an employee of Fidelity Investments (1990-present).
Chris Maher (1972)
Year of Election or Appointment: 2013
Assistant Treasurer
Mr. Maher serves as Assistant Treasurer of other funds. Mr. Maher is Vice President of Valuation Oversight and is an employee of Fidelity Investments. Previously, Mr. Maher served as Vice President of Asset Management Compliance (2013), Vice President of the Program Management Group of FMR (investment adviser firm, 2010-2013), and Vice President of Valuation Oversight (2008-2010).
John F. Papandrea (1972)
Year of Election or Appointment: 2016
Anti-Money Laundering (AML) Officer
Mr. Papandrea also serves as AML Officer of other funds. Mr. Papandrea is Vice President of FMR LLC (diversified financial services company, 2008-present) and is an employee of Fidelity Investments (2005-present).
Jason P. Pogorelec (1975)
Year of Election or Appointment: 2015
Assistant Secretary
Mr. Pogorelec also serves as Assistant Secretary of other funds. Mr. Pogorelec serves as Vice President, Associate General Counsel (2010-present) and is an employee of Fidelity Investments (2006-present).
Nancy D. Prior (1967)
Year of Election or Appointment: 2014
Vice President
Ms. Prior also serves as Vice President of other funds. Ms. Prior serves as a Director of Fidelity Investments Money Management, Inc. (FIMM) (investment adviser firm, 2014-present), President, Fixed Income (2014-present), Vice Chairman of FIAM LLC (investment adviser firm, 2014-present), and is an employee of Fidelity Investments (2002-present). Previously, Ms. Prior served as Vice President of Fidelity's Money Market Funds (2012-2014), President, Money Market and Short Duration Bond Group of Fidelity Management & Research (FMR) (investment adviser firm, 2013-2014), President, Money Market Group of FMR (2011-2013), Managing Director of Research (2009-2011), Senior Vice President and Deputy General Counsel (2007-2009), and Assistant Secretary of other Fidelity® funds (2008-2009).
Kenneth B. Robins (1969)
Year of Election or Appointment: 2009
Assistant Treasurer
Mr. Robins also serves as an officer of other funds. Mr. Robins serves as Executive Vice President of Fidelity Investments Money Management, Inc. (FIMM) (investment adviser firm, 2013-present) and is an employee of Fidelity Investments (2004-present). Previously, Mr. Robins served in other fund officer roles.
Stacie M. Smith (1974)
Year of Election or Appointment: 2013
Assistant Treasurer
Ms. Smith also serves as an officer of other funds. She is an employee of Fidelity Investments (2009-present) and has served in other fund officer roles. Prior to joining Fidelity Investments, Ms. Smith served as Senior Audit Manager of Ernst & Young LLP (1996-2009).
Renee Stagnone (1975)
Year of Election or Appointment: 2013
Deputy Treasurer
Ms. Stagnone also serves as Deputy Treasurer of other funds. Ms. Stagnone is an employee of Fidelity Investments (1997-present).
Michael H. Whitaker (1967)
Year of Election or Appointment: 2008
Chief Compliance Officer
Mr. Whitaker also serves as Chief Compliance Officer of other funds. Mr. Whitaker also serves as Compliance Officer of FMR Co., Inc. (investment adviser firm, 2014-present), FMR (investment adviser firm, 2014-present), and Fidelity Investments Money Management, Inc. (investment adviser firm, 2014-present) and is an employee of Fidelity Investments (2007-present). Prior to joining Fidelity Investments, Mr. Whitaker worked at MFS Investment Management where he served as Senior Vice President and Chief Compliance Officer (2004-2006), and Assistant General Counsel.
Joseph F. Zambello (1957)
Year of Election or Appointment: 2011
Deputy Treasurer
Mr. Zambello also serves as Deputy Treasurer of other funds. Mr. Zambello is an employee of Fidelity Investments (1991-present). Previously, Mr. Zambello served as Vice President of the Program Management Group of FMR (investment adviser firm, 2009-2011) and Vice President of the Transfer Agent Oversight Group (2005-2009).
Shareholder Expense Example
As a shareholder of the Fund, you incur two types of costs: (1) transaction costs, and (2) ongoing costs, including management fees, distribution and/or service (12b-1) fees and other Fund expenses. This Example is intended to help you understand your ongoing costs (in dollars) of investing in the Fund and to compare these costs with the ongoing costs of investing in other mutual funds.
The Example is based on an investment of $1,000 invested at the beginning of the period and held for the entire period (August 1, 2015 to January 31, 2016).
Actual Expenses
The first line of the accompanying table for each class of the Fund provides information about actual account values and actual expenses. You may use the information in this line, together with the amount you invested, to estimate the expenses that you paid over the period. Simply divide your account value by $1,000.00 (for example, an $8,600 account value divided by $1,000.00 = 8.6), then multiply the result by the number in the first line for a class of the Fund under the heading entitled "Expenses Paid During Period" to estimate the expenses you paid on your account during this period. A small balance maintenance fee of $12.00 that is charged once a year may apply for certain accounts with a value of less than $2,000. This fee is not included in the table below. If it was, the estimate of expenses you paid during the period would be higher, and your ending account value lower, by this amount. In addition, the Fund, as a shareholder in the underlying Fidelity Central Funds, will indirectly bear its pro-rata share of the fees and expenses incurred by the underlying Fidelity Central Funds. These fees and expenses are not included in the Fund's annualized expense ratio used to calculate the expense estimate in the table below.
Hypothetical Example for Comparison Purposes
The second line of the accompanying table for each class of the Fund provides information about hypothetical account values and hypothetical expenses based on a Class' actual expense ratio and an assumed rate of return of 5% per year before expenses, which is not the Class' actual return. The hypothetical account values and expenses may not be used to estimate the actual ending account balance or expenses you paid for the period. You may use this information to compare the ongoing costs of investing in the Fund and other funds. To do so, compare this 5% hypothetical example with the 5% hypothetical examples that appear in the shareholder reports of the other funds. A small balance maintenance fee of $12.00 that is charged once a year may apply for certain accounts with a value of less than $2,000. This fee is not included in the table below. If it was, the estimate of expenses you paid during the period would be higher, and your ending account value lower, by this amount. In addition, the Fund, as a shareholder in the underlying Fidelity Central Funds, will indirectly bear its pro-rata share of the fees and expenses incurred by the underlying Fidelity Central Funds. These fees and expenses are not included in the Fund's annualized expense ratio used to calculate the expense estimate in the table below.
Please note that the expenses shown in the table are meant to highlight your ongoing costs only and do not reflect any transaction costs. Therefore, the second line of the table is useful in comparing ongoing costs only, and will not help you determine the relative total costs of owning different funds.
| | Annualized Expense Ratio-A | Beginning
Account Value
August 1, 2015 | Ending
Account Value
January 31, 2016 | Expenses Paid
During Period-B
August 1, 2015
to January 31, 2016 |
| Massachusetts AMT Tax-Free Money Market | .04% | | | |
| Actual | | $1,000.00 | $1,001.05 | $.20 |
| Hypothetical-C | | $1,000.00 | $1,025.00 | $.20 |
| Institutional Class | .04% | | | |
| Actual | | $1,000.00 | $1,001.05 | $.20 |
| Hypothetical-C | | $1,000.00 | $1,025.00 | $.20 |
| Service Class | .04% | | | |
| Actual | | $1,000.00 | $1,001.05 | $.20 |
| Hypothetical-C | | $1,000.00 | $1,025.00 | $.20 |
A Annualized expense ratio reflects expenses net of applicable fee waivers.
B Expenses are equal to each Class' annualized expense ratio, multiplied by the average account value over the period, multiplied by 184/365 (to reflect the one-half year period).
C 5% return per year before expenses
Distributions (Unaudited)
The fund hereby designates as a capital gain dividend with respect to the taxable year ended January 31, 2016, $407,545 or, if subsequently determined to be different, the net capital gain of such year.
During fiscal year ended 2016, 100% of the fund's income dividends were free from federal income tax, and 0.00% of the fund's income dividends were subject to the federal alternative minimum tax.
The fund will notify shareholders in January 2017 of amounts for use in preparing 2016 income tax returns.
Board Approval of Investment Advisory Contracts and Management Fees
Fidelity Massachusetts AMT Tax-Free Money Market Fund
Each year, the Board of Trustees, including the Independent Trustees (together, the Board), votes on the renewal of the management contract with Fidelity Management & Research Company (FMR) and the sub-advisory agreements (together, the Advisory Contracts) for the fund. The Board, assisted by the advice of fund counsel and Independent Trustees' counsel, requests and considers a broad range of information relevant to the renewal of the Advisory Contracts throughout the year.
The Board meets regularly and, at each of its meetings, covers an extensive agenda of topics and materials and considers factors that are relevant to its annual consideration of the renewal of the fund's Advisory Contracts, including the services and support provided to the fund and its shareholders. The Board has established four standing committees (Committees) — Operations, Audit, Fair Valuation, and Governance and Nominating — each composed of and chaired by Independent Trustees with varying backgrounds, to which the Board has assigned specific subject matter responsibilities in order to enhance effective decision-making by the Board. The Operations Committee, of which all of the Independent Trustees are members, meets regularly throughout the year and considers, among other matters, information specifically related to the annual consideration of the renewal of the fund's Advisory Contracts. The Board, acting directly and through its Committees, requests and receives information concerning the annual consideration of the renewal of the fund's Advisory Contracts. The Board also meets as needed to consider matters specifically related to the Board's annual consideration of the renewal of the Advisory Contracts. Members of the Board may also meet with trustees of other Fidelity funds through ad hoc joint committees to discuss certain matters relevant to all of the Fidelity funds.
At its September 2015 meeting, the Board unanimously determined to renew the fund's Advisory Contracts. In reaching its determination, the Board considered all factors it believed relevant, including (i) the nature, extent, and quality of the services to be provided to the fund and its shareholders (including the investment performance of the fund); (ii) the competitiveness of the fund's management fee and total expense ratio relative to peer funds; (iii) the total costs of the services to be provided by and the profits to be realized by Fidelity from its relationship with the fund; and (iv) the extent to which (if any) economies of scale exist and would be realized as the fund grows, and whether any economies of scale are appropriately shared with fund shareholders.
In considering whether to renew the Advisory Contracts for the fund, the Board reached a determination, with the assistance of fund counsel and Independent Trustees' counsel and through the exercise of its business judgment, that the renewal of the Advisory Contracts was in the best interests of the fund and its shareholders and that the compensation payable under the Advisory Contracts was fair and reasonable. The Board's decision to renew the Advisory Contracts was not based on any single factor, but rather was based on a comprehensive consideration of all the information provided to the Board at its meetings throughout the year. The Board, in reaching its determination to renew the Advisory Contracts, was aware that shareholders of the fund have a broad range of investment choices available to them, including a wide choice among funds offered by Fidelity's competitors, and that the fund's shareholders, who have the opportunity to review and weigh the disclosure provided by the fund in its prospectus and other public disclosures, have chosen to invest in this fund, which is part of the Fidelity family of funds.
Nature, Extent, and Quality of Services Provided. The Board considered Fidelity's staffing as it relates to the fund, including the backgrounds of investment personnel of Fidelity, and also considered the fund's investment objective, strategies, and related investment philosophy. The Independent Trustees also had discussions with senior management of Fidelity's investment operations and investment groups. The Board considered the structure of the portfolio manager compensation program and whether this structure provides appropriate incentives to act in the best interests of the fund. Additionally, the Board considered the portfolio managers' investments, if any, in the funds that they manage.
Resources Dedicated to Investment Management and Support Services. The Board reviewed the general qualifications and capabilities of Fidelity's investment staff, including its size, education, experience, and resources, as well as Fidelity's approach to recruiting, training, managing, and compensating investment personnel. The Board noted that Fidelity has continued to increase the resources devoted to non-U.S. offices, including expansion of Fidelity's global investment organization. The Board also noted that Fidelity's analysts have extensive resources, tools and capabilities that allow them to conduct sophisticated quantitative and fundamental analysis, as well as credit analysis of issuers, counterparties and guarantors. Further, the Board considered that Fidelity's investment professionals have sufficient access to global information and data so as to provide competitive investment results over time, and that those professionals also have access to sophisticated tools that permit them to assess portfolio construction and risk and performance attribution characteristics continuously, as well as to transmit new information and research conclusions rapidly around the world. Additionally, in its deliberations, the Board considered Fidelity's trading, risk management, compliance, and technology and operations capabilities and resources, which are integral parts of the investment management process.
Shareholder and Administrative Services. The Board considered (i) the nature, extent, quality, and cost of advisory, administrative, and shareholder services performed by FMR, the sub-advisers (together with FMR, the Investment Advisers), and their affiliates under the Advisory Contracts and under separate agreements covering transfer agency and pricing and bookkeeping services for the fund; (ii) the nature and extent of the supervision of third party service providers, principally custodians, subcustodians, and pricing vendors; and (iii) the resources devoted to, and the record of compliance with, the fund's compliance policies and procedures.
The Board noted that the growth of fund assets over time across the complex allows Fidelity to reinvest in the development of services designed to enhance the value or convenience of the Fidelity funds as investment vehicles. These services include 24-hour access to account information and market information through telephone representatives and over the Internet, investor education materials and asset allocation tools, and the expanded availability of Fidelity Investor Centers.
Investment in a Large Fund Family. The Board considered the benefits to shareholders of investing in a Fidelity fund, including the benefits of investing in a fund that is part of a large family of funds offering a variety of investment disciplines and providing a large variety of mutual fund investor services. The Board noted that Fidelity had taken, or had made recommendations that resulted in the Fidelity funds taking, a number of actions over the previous year that benefited particular funds, including (i) continuing to dedicate additional resources to investment research and to the support of the senior management team that oversees asset management; (ii) continuing efforts to enhance Fidelity's global research capabilities; (iii) launching new funds and making other enhancements to meet client needs; (iv) reducing management fees and total expenses for certain index funds and diversified international funds; (v) continuing to launch dedicated lower cost underlying funds to meet portfolio construction needs related to expanding underlying fund options for Fidelity funds of funds, specifically for the Freedom Fund product lines; (vi) rationalizing product lines and gaining increased efficiencies through fund mergers; (vii) launching active fixed-income exchange-traded funds; (viii) continuing to develop, acquire and implement systems and technology to improve services to the funds and shareholders, strengthen information security, and increase efficiency; (ix) implementing investment enhancements to further strengthen Fidelity's target date product line to increase investors' probability of success in achieving their goals; (x) modifying the eligibility criteria for certain share classes to accommodate roll-over assets from employer-sponsored retirement plans; (xi) launching a new Class W of the Freedom Index Funds to attract and retain Fidelity record-kept retirement plan assets; and (xii) implementing changes to Fidelity's money market product line in response to recent money market regulatory reforms.
Investment Performance. The Board considered whether the fund has operated in accordance with its investment objective, as well as its record of compliance with its investment restrictions and its performance history.
The Board took into account discussions with representatives of the Investment Advisers about fund investment performance that occur at Board meetings throughout the year. In this regard the Board noted that as part of regularly scheduled fund reviews and other reports to the Board on fund performance, the Board considers annualized return information for the fund for different time periods, measured against a peer group of funds with similar objectives ("peer group").
In addition to reviewing absolute and relative fund performance, the Independent Trustees periodically consider the appropriateness of fund performance metrics in evaluating the results achieved. In general, the Independent Trustees believe that fund performance should be evaluated based on gross performance (before fees and expenses but after transaction costs) compared to appropriate peer groups, over appropriate time periods that may include full market cycles, taking into account relevant factors including the following: general market conditions; expectations for interest rate levels and credit conditions; issuer-specific information including credit quality; the fund's market value NAV over time and its resilience under various stressed conditions; and fund cash flows and other factors.
The Board recognizes that in interest rate environments where many competitors waive fees to maintain a minimum yield, relative money market fund performance on a net basis (after fees and expenses) may not be particularly meaningful due to miniscule performance differences among competitor funds. Depending on the circumstances, the Independent Trustees may be satisfied with a fund's performance notwithstanding that it lags its peer group for certain periods.
The Independent Trustees recognize that shareholders evaluate performance on a net basis over their own holding periods, for which one-, three-, and five-year periods are often used as a proxy. For this reason, the performance information reviewed by the Board also included net cumulative calendar year total return information for the fund and an appropriate peer group for the most recent one-, three-, and five-year periods.
Based on its review, the Board concluded that the nature, extent, and quality of services provided to the fund under the Advisory Contracts should benefit the shareholders of the fund.
Competitiveness of Management Fee and Total Expense Ratio. The Board considered the fund's management fee and total expense ratio compared to "mapped groups" of competitive funds and classes created for the purpose of facilitating the Trustees' competitive analysis of management fees and total expenses. Fidelity creates "mapped groups" by combining similar Lipper investment objective categories that have comparable investment mandates. Combining Lipper investment objective categories aids the Board's management fee and total expense ratio comparisons by broadening the competitive group used for comparison.
Management Fee. The Board considered two proprietary management fee comparisons for the 12-month periods shown in basis points (BP) in the chart below. The group of Lipper funds used by the Board for management fee comparisons is referred to below as the "Total Mapped Group" and, for the reasons explained above, is broader than the Lipper peer group used by the Board for performance comparisons. The Total Mapped Group comparison focuses on a fund's standing in terms of gross management fees before expense reimbursements or caps relative to the total universe of funds with comparable investment mandates, regardless of whether their management fee structures also are comparable. Funds with comparable investment mandates offer exposure to similar types of securities. Funds with comparable management fee structures have similar management fee contractual arrangements (
e.g., flat rate charged for advisory services, all-inclusive fee rate,
etc.). "TMG %" represents the percentage of funds in the Total Mapped Group that had management fees that were lower than the fund's. For example, a hypothetical TMG % of 20% would mean that 80% of the funds in the Total Mapped Group had higher, and 20% had lower, management fees than the fund. The fund's actual TMG %s and the number of funds in the Total Mapped Group are in the chart below. The "Asset-Size Peer Group" (ASPG) comparison focuses on a fund's standing relative to a subset of non-Fidelity funds within the Total Mapped Group that are similar in size and management fee structure. For example, if a fund is in the first quartile of the ASPG, the fund's management fee ranks in the least expensive or lowest 25% of funds in the ASPG. The ASPG represents at least 15% of the funds in the Total Mapped Group with comparable asset size and management fee structures, subject to a minimum of 50 funds (or all funds in the Total Mapped Group if fewer than 50). Additional information, such as the ASPG quartile in which the fund's management fee rate ranked, is also included in the chart and considered by the Board. Because the vast majority of competitor funds' management fees do not cover non-management expenses, for a more meaningful comparison of management fees, the fund is compared on the basis of a hypothetical "net management fee," which is derived by subtracting payments made by FMR for "fund-level" non-management expenses (including pricing and bookkeeping fees and fees paid to non-affiliated custodians) from the fund's management fee. In this regard, the Board considered that net management fees can vary from year to year because of differences in "fund-level" non-management expenses. The Board noted that, although FMR does not pay transfer agent fees or other "class-level" expenses under the fund's management contract, such expenses (excluding 12b-1 fees, if applicable) may be paid by FMR pursuant to expense limitation arrangements in effect for the fund and, as a result, are also subtracted from the management fee for purposes of calculating the hypothetical "net management fee."
Fidelity Massachusetts AMT Tax-Free Money Market Fund
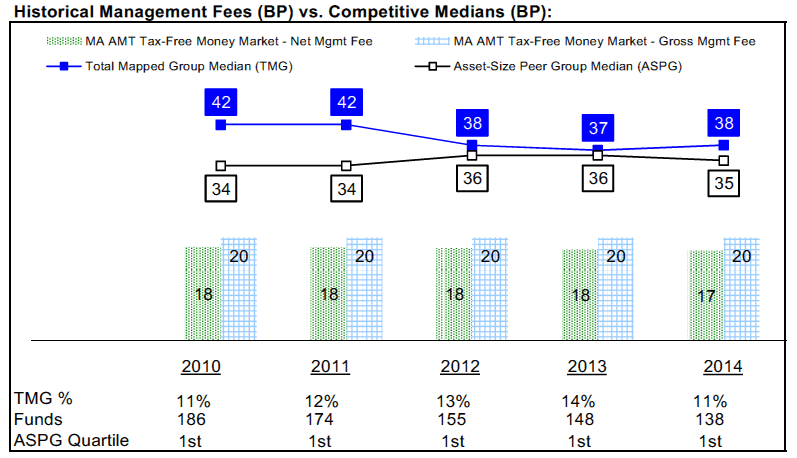
The Board noted that the fund's hypothetical net management fee rate ranked below the median of its Total Mapped Group and below the median of its ASPG for 2014.
The Board noted that, in 2014, the ad hoc Committee on Group Fee was formed by it and other Fidelity fund boards to conduct an in-depth review of the "group fee" component of the management fee of funds with such management fee structures. Committee focus included the mechanics of the group fee, the competitive landscape of group fee structures, Fidelity funds with no group fee component and investment products not included in group fee assets. The Board also considered that, for funds subject to the group fee, FMR agreed to voluntarily waive fees over a specified period of time in amounts designed to account for assets converted from certain funds to certain collective investment trusts.
Based on its review, the Board concluded that the fund's management fee is fair and reasonable in light of the services that the fund receives and the other factors considered.
Total Expense Ratio. In its review of each class's total expense ratio, the Board considered the fund's hypothetical net management fee rate as well as the fund's gross management fee. The Board also considered other "fund-level" expenses, such as pricing and bookkeeping fees and custodial, legal, and audit fees. The Board also considered other "class-level" expenses, such as transfer agent fees and fund-paid 12b-1 fees. The Board also noted that Fidelity may agree to waive fees and expenses from time to time, and the extent to which, if any, it has done so for the fund. As part of its review, the Board also considered the current and historical total expense ratios of each class of the fund compared to competitive fund median expenses. Each class of the fund is compared to those funds and classes in the Total Mapped Group (used by the Board for management fee comparisons) that have a similar sales load structure.
The Board noted that the total expense ratio of each class ranked below its competitive median for 2014.
The Board considered that current contractual arrangements for the fund oblige FMR to pay all "class-level" expenses of each class of the fund to the extent necessary to limit total expenses, with certain exceptions, as follows: retail class: 0.35%; Institutional Class: 0.20%; and Service Class: 0.45%. The contractual arrangements for the retail class may not be increased without the approval of the Board and the shareholders of that class.
The Board considered that Fidelity has been voluntarily waiving part or all of the 12b-1 fees, transfer agent fees, and/or management fees to maintain a minimum yield, and also noted that Fidelity may recover a portion of waived fees under certain circumstances.
Fees Charged to Other Fidelity Clients. The Board also considered Fidelity fee structures and other information with respect to clients of Fidelity, such as other funds advised or subadvised by Fidelity, pension plan clients, and other institutional clients with similar mandates. The Board noted the findings of the 2013 ad hoc joint committee (created with the board of other Fidelity funds), which reviewed and compared Fidelity's institutional investment advisory business with its business of providing services to the Fidelity funds, including the differences in services provided, fees charged, and costs incurred, as well as competition in their respective marketplaces.
Based on its review of total expense ratios and fees charged to other Fidelity clients, the Board concluded that the total expense ratio of each class of the fund was reasonable in light of the services that the fund and its shareholders receive and the other factors considered.
Costs of the Services and Profitability. The Board considered the revenues earned and the expenses incurred by Fidelity in conducting the business of developing, marketing, distributing, managing, administering and servicing the fund and servicing the fund's shareholders. The Board also considered the level of Fidelity's profits in respect of all the Fidelity funds.
On an annual basis, Fidelity presents to the Board information about the profitability of its relationship with the fund. Fidelity calculates profitability information for each fund, as well as aggregate profitability information for groups of Fidelity funds and all Fidelity funds, using a series of detailed revenue and cost allocation methodologies which originate with the books and records of Fidelity on which Fidelity's audited financial statements are based. The Audit Committee of the Board reviews any significant changes from the prior year's methodologies.
PricewaterhouseCoopers LLP (PwC), independent registered public accounting firm and auditor to Fidelity and certain Fidelity funds, has been engaged annually by the Board as part of the Board's assessment of Fidelity's profitability analysis. PwC's engagement includes the review and assessment of the methodologies used by Fidelity in determining the revenues and expenses attributable to Fidelity's mutual fund business, and completion of agreed-upon procedures in respect of the mathematical accuracy of fund profitability and its conformity to established allocation methodologies. After considering PwC's reports issued under the engagement and information provided by Fidelity, the Board concluded that while other allocation methods may also be reasonable, Fidelity's profitability methodologies are reasonable in all material respects.
The Board also reviewed Fidelity's non-fund businesses and fall-out benefits related to the mutual fund business as well as cases where Fidelity's affiliates may benefit from or be related to the fund's business.
The Board considered the costs of the services provided by and the profits realized by Fidelity in connection with the operation of the fund and was satisfied that the profitability was not excessive.
Economies of Scale. The Board considered whether there have been economies of scale in respect of the management of the Fidelity funds, whether the Fidelity funds (including the fund) have appropriately benefited from any such economies of scale, and whether there is potential for realization of any further economies of scale. The Board considered the extent to which the fund will benefit from economies of scale as assets grow through increased services to the fund, through waivers or reimbursements, or through fee or expense ratio reductions. The Board also noted that in 2013, it and the boards of other Fidelity funds created an ad hoc committee (the Economies of Scale Committee) to analyze whether Fidelity attains economies of scale in respect of the management and servicing of the Fidelity funds, whether the Fidelity funds have appropriately benefited from such economies of scale, and whether there is potential for realization of any further economies of scale.
The Board concluded, taking into account the analysis of the Economies of Scale Committee, that economies of scale, if any, are being appropriately shared between fund shareholders and Fidelity.
Additional Information Requested by the Board. In order to develop fully the factual basis for consideration of the Fidelity funds' Advisory Contracts, the Board requested and received additional information on certain topics, including: (i) Fidelity's fund profitability methodology, profitability trends for certain funds, and the impact of certain factors on fund profitability results; (ii) portfolio manager changes that have occurred during the past year and the amount of the investment that each portfolio manager has made in the Fidelity fund(s) that he or she manages; (iii) Fidelity's compensation structure for portfolio managers, research analysts, and other key personnel, including its effects on fund profitability, the rationale for the compensation structure, and the extent to which current market conditions have affected retention and recruitment; (iv) the arrangements with and compensation paid to certain fund sub-advisers on behalf of the Fidelity funds; (v) Fidelity's voluntary waiver of its fees to maintain minimum yields for certain money market funds and classes as well as contractual waivers in place for certain funds; (vi) the methodology with respect to competitive fund data and peer group classifications; (vii) Fidelity's transfer agent fee, expense, and service structures for different funds and classes relative to competitive trends, and the impact of the increased use of omnibus accounts; (viii) Fidelity's long-term expectations for its offerings in the workplace investing channel; (ix) new developments in the retail and institutional marketplaces; and (x) the impact of money market reform on Fidelity's money market funds. In addition, the Board considered its discussions with Fidelity throughout the year regarding enhanced information security initiatives and the funds' fair valuation policies.
Based on its evaluation of all of the conclusions noted above, and after considering all factors it believed relevant, the Board concluded that the advisory fee structures are fair and reasonable, and that the fund's Advisory Contracts should be renewed.
Proxy Voting Results
A special meeting of shareholders was held on January 15, 2016. The results of votes taken among shareholders on the proposal before them are reported below. Each vote reported represents one dollar of net asset value held on the record date for the meeting.
PROPOSAL 1
| To elect a Board of Trustees. |
| | # of
Votes | % of
Votes |
| Elizabeth S. Acton | | |
| Affirmative | 3,099,140,855.91 | 96.585 |
| Withheld | 109,609,021.09 | 3.415 |
| TOTAL | 3,208,749,877.00 | 100.000 |
| John Engler | | |
| Affirmative | 3,093,798,797.83 | 96.418 |
| Withheld | 114,951,079.17 | 3.582 |
| TOTAL | 3,208,749,877.00 | 100.000 |
| Albert R. Gamper, Jr. | | |
| Affirmative | 3,092,671,799.84 | 96.383 |
| Withheld | 116,078,077.16 | 3.617 |
| TOTAL | 3,208,749,877.00 | 100.000 |
| Robert F. Gartland | | |
| Affirmative | 3,094,707,691.64 | 96.446 |
| Withheld | 114,042,185.36 | 3.554 |
| TOTAL | 3,208,749,877.00 | 100.000 |
| Abigail P. Johnson | | |
| Affirmative | 3,095,323,804.40 | 96.466 |
| Withheld | 113,426,072.60 | 3.534 |
| TOTAL | 3,208,749,877.00 | 100.000 |
| Arthur E. Johnson | | |
| Affirmative | 3,092,099,624.00 | 96.365 |
| Withheld | 116,650,253.00 | 3.635 |
| TOTAL | 3,208,749,877.00 | 100.000 |
| Michael E. Kenneally | | |
| Affirmative | 3,098,846,822.23 | 96.575 |
| Withheld | 109,903,054.77 | 3.425 |
| TOTAL | 3,208,749,877.00 | 100.000 |
| James H. Keyes | | |
| Affirmative | 3,094,129,530.99 | 96.428 |
| Withheld | 114,620,346.01 | 3.572 |
| TOTAL | 3,208,749,877.00 | 100.000 |
| Marie L. Knowles | | |
| Affirmative | 3,096,764,677.82 | 96.511 |
| Withheld | 111,985,199.18 | 3.489 |
| TOTAL | 3,208,749,877.00 | 100.000 |
| Geoffrey A. von Kuhn | | |
| Affirmative | 3,092,206,726.98 | 96.368 |
| Withheld | 116,543,150.02 | 3.632 |
| TOTAL | 3,208,749,877.00 | 100.000 |
| Proposal 1 reflects trust wide proposal and voting results. |

Corporate Headquarters
245 Summer St.
Boston, MA 02210
www.fidelity.com
SMA-ANN-0316
1.854000.108
Fidelity® Massachusetts Municipal Income Fund and
Fidelity® Massachusetts Municipal Money Market Fund
Annual Report January 31, 2016 |
|
Contents
To view a fund's proxy voting guidelines and proxy voting record for the 12-month period ended June 30, visit http://www.fidelity.com/proxyvotingresults or visit the Securities and Exchange Commission's (SEC) web site at http://www.sec.gov.
You may also call 1-800-544-8544 to request a free copy of the proxy voting guidelines.
Standard & Poor's, S&P and S&P 500 are registered service marks of The McGraw-Hill Companies, Inc. and have been licensed for use by Fidelity Distributors Corporation.
Other third-party marks appearing herein are the property of their respective owners.
All other marks appearing herein are registered or unregistered trademarks or service marks of FMR LLC or an affiliated company. © 2016 FMR LLC. All rights reserved.
This report and the financial statements contained herein are submitted for the general information of the shareholders of the Fund. This report is not authorized for distribution to prospective investors in the Fund unless preceded or accompanied by an effective prospectus.
A fund files its complete schedule of portfolio holdings with the SEC for the first and third quarters of each fiscal year on Form N-Q. Forms N-Q are available on the SEC’s web site at http://www.sec.gov. A fund's Forms N-Q may be reviewed and copied at the SEC’s Public Reference Room in Washington, DC. Information regarding the operation of the SEC's Public Reference Room may be obtained by calling 1-800-SEC-0330.
For a complete list of a fund's portfolio holdings, view the most recent holdings listing, semiannual report, or annual report on Fidelity's web site at http://www.fidelity.com, http://www.advisor.fidelity.com, or http://www.401k.com, as applicable.
NOT FDIC INSURED •MAY LOSE VALUE •NO BANK GUARANTEE
Neither the Fund nor Fidelity Distributors Corporation is a bank.
Fidelity® Massachusetts Municipal Income Fund
Performance: The Bottom Line
Average annual total return reflects the change in the value of an investment, assuming reinvestment of distributions from dividend income and capital gains (the profits earned upon the sale of securities that have grown in value, if any) and assuming a constant rate of performance each year. The hypothetical investment and the average annual total returns do not reflect the deduction of taxes that a shareholder would pay on fund distributions or the redemption of fund shares. During periods of reimbursement by Fidelity, a fund’s total return will be greater than it would be had the reimbursement not occurred. How a fund did yesterday is no guarantee of how it will do tomorrow.
Average Annual Total Returns
| For the periods ended January 31, 2016 | Past 1 year | Past 5 years | Past 10 years |
| Fidelity® Massachusetts Municipal Income Fund | 2.54% | 5.70% | 4.65% |
$10,000 Over 10 Years
Let's say hypothetically that $10,000 was invested in Fidelity® Massachusetts Municipal Income Fund on January 31, 2006.
The chart shows how the value of your investment would have changed, and also shows how the Barclays® Municipal Bond Index performed over the same period.
| Period Ending Values |
| $15,760 | Fidelity® Massachusetts Municipal Income Fund |
| $15,999 | Barclays® Municipal Bond Index |
Fidelity® Massachusetts Municipal Income Fund
Management's Discussion of Fund Performance
Market Recap: Tax-exempt municipal bonds posted a moderate gain for the year ending January 31, 2016, driven by strong demand and limited supply. The Barclays
® Municipal Bond Index returned 2.71% for the year. However, the muni market faced a volatile stretch between April and June, when the focus of the market shifted to the credit challenges of a handful of high-profile issuers, including Puerto Rico, New Jersey, Illinois and Chicago. A common theme of unfunded pension liabilities for these issuers overshadowed a generally stable credit environment for state and local governments more broadly. The tax advantages of munis continued to appeal to investors, due to the higher federal income tax rates and 3.8% Medicare tax on non-municipal investment income that took effect in 2013. At period end, investors continued to watch the flow of U.S. economic data for hints as to whether, when and by how much the U.S. Federal Reserve may raise policy interest rates in 2016, on the heels of its quarter-point rate hike in mid-December.
Comments from Portfolio Manager Kevin Ramundo: For the year, the fund gained 2.54%, slightly lagging the 2.97% return Barclays
® Massachusetts 3+ Year Enhanced Municipal Bond Index. I sought to generate attractive tax-exempt income for the fund and protect shareholder capital. Versus the Barclays
® Massachusetts index, overweighting lower-rated investment-grade bonds was a plus. Bonds in the A and BBB credit tiers benefited from the comparatively high level of income they generated. These securities outperformed higher-quality bonds the past year. We also benefited from the advance refunding of a couple of holdings-- CareGroup and a Massachusetts general obligation bond--which led to their above-benchmark price appreciation. An advance refunding is one of the most positive events that can take place in a municipal portfolio – the bonds are converted from longer, callable bonds with issuer-specific credit risk to shorter, non-callable bonds backed by U.S. government securities, most often U.S. Treasuries. In contrast, having larger-than-benchmark exposure to bonds backed by Partners HealthCare tempered the fund’s relative result. These bonds came under pressure due to credit-rating downgrades in response to losses at the company's insurance division, weaker financial performance, and elevated political and public scrutiny that may curtail the organization's future strategic options.
The views expressed above reflect those of the portfolio manager(s) only through the end of the period as stated on the cover of this report and do not necessarily represent the views of Fidelity or any other person in the Fidelity organization. Any such views are subject to change at any time based upon market or other conditions and Fidelity disclaims any responsibility to update such views. These views may not be relied on as investment advice and, because investment decisions for a Fidelity fund are based on numerous factors, may not be relied on as an indication of trading intent on behalf of any Fidelity fund.
Fidelity® Massachusetts Municipal Income Fund
Investment Summary (Unaudited)
Top Five Sectors as of January 31, 2016
| | % of fund's net assets | % of fund's net assets 6 months ago |
| Special Tax | 20.7 | 17.5 |
| Education | 19.7 | 19.5 |
| Health Care | 18.7 | 18.7 |
| Water & Sewer | 11.3 | 12.4 |
| General Obligations | 11.0 | 11.9 |
Weighted Average Maturity as of January 31, 2016
| | | 6 months ago |
| Years | 6.1 | 6.2 |
This is a weighted average of all the maturities of the securities held in a fund. Weighted Average Maturity (WAM) can be used as a measure of sensitivity to interest rate changes and market changes. Generally, the longer the maturity, the greater the sensitivity to such changes. WAM is based on the dollar-weighted average length of time until principal payments must be paid. Depending on the types of securities held in a fund, certain maturity shortening devices (e.g., demand features, interest rate resets, and call options) may be taken into account when calculating the WAM.
Duration as of January 31, 2016
| | | 6 months ago |
| Years | 6.9 | 7.1 |
Duration is a measure of a security's price sensitivity to changes in interest rates. Duration differs from maturity in that it considers a security's interest payments in addition to the amount of time until the security reaches maturity, and also takes into account certain maturity shortening features (e.g., demand features, interest rate resets, and call options) when applicable. Securities with longer durations generally tend to be more sensitive to interest rate changes than securities with shorter durations. A fund with a longer average duration generally can be expected to be more sensitive to interest rate changes than a fund with a shorter average duration.
Quality Diversification (% of fund's net assets)
| As of January 31, 2016 |
| | AAA | 12.8% |
| | AA,A | 76.5% |
| | BBB | 6.7% |
| | Not Rated | 2.2% |
| | Short-Term Investments and Net Other Assets | 1.8% |

| As of July 31, 2015 |
| | AAA | 10.3% |
| | AA,A | 79.6% |
| | BBB | 5.8% |
| | BB and Below | 1.5% |
| | Not Rated | 1.8% |
| | Short-Term Investments and Net Other Assets | 1.0% |

We have used ratings from Moody's Investors Service, Inc. Where Moody's® ratings are not available, we have used S&P® ratings. All ratings are as of the date indicated and do not reflect subsequent changes.
Fidelity® Massachusetts Municipal Income Fund
Investments January 31, 2016
Showing Percentage of Net Assets
| Municipal Bonds - 98.2% | | | |
| | | Principal Amount | Value |
| Guam - 0.2% | | | |
| Guam Ed. Fing. Foundation Ctfs. of Prtn.: | | | |
| Series 2006 A, 5% 10/1/23 | | $2,740,000 | $2,793,101 |
| Series 2008, 5.875% 10/1/18 | | 1,465,000 | 1,561,016 |
|
| TOTAL GUAM | | | 4,354,117 |
|
| Massachusetts - 97.6% | | | |
| Berkshire Wind Pwr. Coop. Corp. (Wind Proj.) Series 1, 5.25% 7/1/30 | | 5,000,000 | 5,689,150 |
| Boston Gen. Oblig. Series 2012 A: | | | |
| 5% 4/1/21 | | 8,130,000 | 9,743,642 |
| 5% 4/1/22 | | 2,050,000 | 2,519,471 |
| Boston Wtr. & Swr. Commission Rev.: | | | |
| Series 2009 A: | | | |
| 5% 11/1/25 (Pre-Refunded to 5/1/19 @ 100) | | 1,725,000 | 1,951,217 |
| 5% 11/1/26 (Pre-Refunded to 5/1/19 @ 100) | | 1,500,000 | 1,696,710 |
| 5% 11/1/28 (Pre-Refunded to 5/1/19 @ 100) | | 2,195,000 | 2,482,852 |
| Series 2012 A, 4% 11/1/25 | | 2,950,000 | 3,354,357 |
| Sr. Series A, 5.25% 11/1/19 | | 6,305,000 | 6,876,107 |
| Braintree Gen. Oblig.: | | | |
| Series 2009: | | | |
| 5% 5/15/23 (Pre-Refunded to 5/15/19 @ 100) | | 5,000,000 | 5,663,450 |
| 5% 5/15/24 (Pre-Refunded to 5/15/19 @ 100) | | 5,050,000 | 5,720,085 |
| 5% 5/15/26 | | 2,300,000 | 2,958,145 |
| 5% 5/15/27 | | 2,000,000 | 2,593,920 |
| 5% 5/15/28 | | 600,000 | 782,208 |
| Cambridge Gen. Oblig. Series 12: | | | |
| 5% 1/1/23 | | 865,000 | 1,050,914 |
| 5% 1/1/24 | | 340,000 | 411,349 |
| Framingham Gen. Oblig. Series 2012 A: | | | |
| 4% 12/1/20 | | 1,260,000 | 1,429,420 |
| 4% 12/1/24 | | 1,360,000 | 1,564,598 |
| Lynn Wtr. & Swr. Commission Gen. Rev. Series 2003 A, 5% 12/1/32 (Nat'l. Pub. Fin. Guarantee Corp. Insured) | | 440,000 | 441,223 |
| Marshfield Gen. Oblig.: | | | |
| 5% 11/1/20 | | 1,780,000 | 2,091,909 |
| 5% 11/1/21 | | 1,730,000 | 2,085,290 |
| Massachusetts Bay Trans. Auth.: | | | |
| Series 1991 A: | | | |
| 7% 3/1/21 (Escrowed to Maturity) | | 410,000 | 424,063 |
| 7% 3/1/21 (Nat'l. Pub. Fin. Guarantee Corp. Insured) | | 2,055,000 | 2,361,627 |
| 7% 3/1/21 | | 610,000 | 726,266 |
| Massachusetts Bay Trans. Auth. Assessment Rev.: | | | |
| Series 2012 A, 5% 7/1/22 | | 6,110,000 | 7,521,593 |
| Series A: | | | |
| 5.25% 7/1/34 | | 17,580,000 | 19,271,372 |
| 5.25% 7/1/34 (Pre-Refunded to 7/1/18 @ 100) | | 7,170,000 | 7,919,480 |
| Massachusetts Bay Trans. Auth. Sales Tax Rev.: | | | |
| Series 2003 C: | | | |
| 5.25% 7/1/19 | | 4,430,000 | 5,082,318 |
| 5.25% 7/1/23 | | 3,950,000 | 5,004,255 |
| Series 2005 A, 5% 7/1/24 | | 16,175,000 | 20,413,982 |
| Series 2005 B, 5.5% 7/1/29 (Nat'l. Pub. Fin. Guarantee Corp. Insured) | | 4,000,000 | 5,453,200 |
| Series 2006 A: | | | |
| 5.25% 7/1/29 | | 3,005,000 | 4,018,827 |
| 5.25% 7/1/32 | | 6,745,000 | 9,109,460 |
| Series 2010 B: | | | |
| 5% 7/1/26 | | 1,000,000 | 1,175,490 |
| 5% 7/1/28 | | 1,000,000 | 1,172,650 |
| 5% 7/1/30 | | 1,000,000 | 1,165,120 |
| Series 2015 A: | | | |
| 5% 7/1/40 | | 7,635,000 | 8,960,818 |
| 5% 7/1/45 | | 4,395,000 | 5,134,503 |
| Massachusetts Clean Energy Coop. Corp. Series 2013: | | | |
| 5% 7/1/25 | | 2,795,000 | 3,367,723 |
| 5% 7/1/30 | | 3,725,000 | 4,415,019 |
| Massachusetts Clean Wtr. Trust: | | | |
| (Pool Prog.): | | | |
| Series 2004 A: | | | |
| 5.25% 8/1/22 | | 6,525,000 | 8,148,224 |
| 5.25% 2/1/24 | | 1,170,000 | 1,498,361 |
| 5.25% 8/1/24 | | 3,780,000 | 4,882,172 |
| Series 6, 5.25% 8/1/19 | | 30,000 | 30,111 |
| Series 8: | | | |
| 5% 8/1/17 | | 110,000 | 110,393 |
| 5% 8/1/20 | | 105,000 | 105,364 |
| Series 14: | | | |
| 5% 8/1/32 | | 5,685,000 | 6,440,934 |
| 5% 8/1/38 | | 8,390,000 | 9,444,120 |
| Series 18: | | | |
| 5% 2/1/28 | | 3,500,000 | 4,330,480 |
| 5% 2/1/29 | | 6,355,000 | 7,815,061 |
| Series 2002 A, 5.25% 8/1/20 | | 680,000 | 682,482 |
| Series 2010 A, 5% 8/1/21 | | 9,000,000 | 10,548,000 |
| Series 2012 A: | | | |
| 5% 8/1/27 | | 5,900,000 | 7,157,054 |
| 5% 8/1/28 | | 6,570,000 | 7,951,737 |
| Series 2014, 5% 8/1/25 | | 7,900,000 | 10,144,943 |
| Series 6, 5.5% 8/1/30 | | 1,310,000 | 1,314,742 |
| 5% 8/1/21 | | 7,520,000 | 8,617,469 |
| 5% 8/1/22 | | 4,290,000 | 4,911,278 |
| 5% 8/1/23 | | 5,000,000 | 5,720,400 |
| 5% 8/1/24 | | 4,215,000 | 4,816,017 |
| 5% 8/1/25 | | 4,965,000 | 5,665,562 |
| 5% 8/1/26 | | 3,205,000 | 3,654,854 |
| 5% 8/1/27 | | 2,460,000 | 2,804,375 |
| 5% 8/1/28 | | 3,480,000 | 3,963,302 |
| Massachusetts Commonwealth Trans. Fund Rev.: | | | |
| (Accelerated Bridge Prog.): | | | |
| Series 2012 A: | | | |
| 5% 6/1/24 | | 11,880,000 | 14,209,787 |
| 5% 6/1/25 | | 12,940,000 | 15,426,033 |
| Series 2014 A, 5% 6/1/44 | | 27,295,000 | 31,682,944 |
| (Rail Enhancement Prog.) Series 2015 A, 5% 6/1/45 | | 20,000,000 | 23,463,800 |
| Series 2013 A, 5% 6/1/43 | | 10,000,000 | 11,465,100 |
| Massachusetts Dept. of Trans. Metropolitan Hwy. Sys. Rev. Series 2010 B: | | | |
| 5% 1/1/22 | | 11,000,000 | 12,592,250 |
| 5% 1/1/25 | | 13,340,000 | 15,216,138 |
| 5% 1/1/26 | | 4,210,000 | 4,796,916 |
| 5% 1/1/27 | | 7,000,000 | 7,961,520 |
| 5% 1/1/30 | | 5,000,000 | 5,684,750 |
| 5% 1/1/32 | | 3,495,000 | 3,939,459 |
| 5% 1/1/35 | | 4,230,000 | 4,771,398 |
| Massachusetts Dev. Fin. Agcy. Hosp. Rev. Series 2013: | | | |
| 5.25% 11/15/36 | | 3,000,000 | 3,454,080 |
| 5.25% 11/15/41 | | 4,620,000 | 5,250,676 |
| Massachusetts Dev. Fin. Agcy. Rev.: | | | |
| (Boston Univ. Proj.) Series U4, 5.7% 10/1/40 | | 3,100,000 | 3,540,634 |
| (Brandeis Univ. Proj.) Series N: | | | |
| 5% 10/1/23 | | 1,040,000 | 1,145,206 |
| 5% 10/1/24 | | 1,210,000 | 1,332,065 |
| (Carleton-Willard Village Proj.) Series 2010: | | | |
| 4.75% 12/1/20 | | 3,355,000 | 3,646,717 |
| 5.25% 12/1/25 | | 820,000 | 904,640 |
| 5.625% 12/1/30 | | 1,000,000 | 1,120,740 |
| (College of the Holy Cross Proj.): | | | |
| Series 2008 A, 5% 9/1/26 | | 1,500,000 | 1,653,105 |
| Series 2008 B, 5% 9/1/22 | | 1,100,000 | 1,214,059 |
| (Deerfield Academy Proj.) 5% 10/1/40 | | 10,500,000 | 12,036,045 |
| (Partners HealthCare Sys. Proj.) Series 2011 K6, 5.375% 7/1/41 | | 7,000,000 | 7,798,280 |
| (Tufts Med. Ctr. Proj.) Series I, 6.25% 1/1/27 | | 12,485,000 | 14,724,310 |
| Series 2008, 5.75% 9/1/25 (Pre-Refunded to 9/1/18 @ 100) | | 9,500,000 | 10,676,575 |
| Series 2010 B1, 5% 10/15/40 | | 22,510,000 | 25,829,325 |
| Series 2010 B2, 5.25% 2/1/34 | | 5,000,000 | 5,901,650 |
| Series 2011 B, 5% 7/1/41 | | 6,520,000 | 7,180,346 |
| Series 2011 H: | | | |
| 5.125% 7/1/26 | | 5,500,000 | 6,247,230 |
| 5.5% 7/1/31 | | 7,750,000 | 8,777,030 |
| Series 2011: | | | |
| 5% 10/1/20 | | 1,215,000 | 1,403,945 |
| 5% 7/1/41 | | 5,000,000 | 5,506,400 |
| 5.25% 10/1/41 | | 5,485,000 | 6,279,557 |
| Series 2012 G: | | | |
| 5% 10/1/23 | | 2,245,000 | 2,619,421 |
| 5% 10/1/24 | | 1,625,000 | 1,892,231 |
| 5% 10/1/25 | | 1,600,000 | 1,858,448 |
| 5% 10/1/26 | | 2,170,000 | 2,504,180 |
| 5% 10/1/27 | | 2,235,000 | 2,568,887 |
| 5% 10/1/28 | | 1,240,000 | 1,420,978 |
| Series 2012 J, 5% 7/1/42 | | 7,000,000 | 8,039,500 |
| Series 2012 L, 5% 7/1/36 | | 6,000,000 | 6,767,580 |
| Series 2013 A: | | | |
| 6.25% 11/15/33 (a) | | 2,245,000 | 2,440,472 |
| 6.5% 11/15/43 (a) | | 4,000,000 | 4,366,400 |
| Series 2013 E: | | | |
| 5% 11/1/38 | | 3,400,000 | 3,899,562 |
| 5% 11/1/43 | | 15,000,000 | 16,992,300 |
| Series 2013 F: | | | |
| 4% 7/1/32 | | 2,050,000 | 2,146,371 |
| 4% 7/1/43 | | 27,185,000 | 27,392,693 |
| 5% 7/1/27 | | 1,300,000 | 1,517,633 |
| 5% 7/1/37 | | 3,925,000 | 4,396,000 |
| Series 2013 G, 5% 7/1/44 | | 17,105,000 | 18,237,351 |
| Series 2013 P, 5% 7/1/43 | | 12,320,000 | 14,337,277 |
| Series 2013 X, 5% 10/1/48 | | 14,920,000 | 17,157,552 |
| Series 2013, 5% 7/1/21 | | 1,085,000 | 1,267,497 |
| Series 2014 A: | | | |
| 5% 3/1/32 | | 1,700,000 | 1,979,361 |
| 5% 3/1/33 | | 1,250,000 | 1,448,525 |
| 5% 3/1/39 | | 4,000,000 | 4,582,360 |
| 5% 3/1/44 | | 15,730,000 | 17,862,831 |
| Series 2014 F: | | | |
| 5% 7/15/19 | | 250,000 | 273,743 |
| 5% 7/15/20 | | 300,000 | 330,465 |
| 5% 7/15/21 | | 300,000 | 329,481 |
| 5% 7/15/22 | | 400,000 | 438,968 |
| 5% 7/15/23 | | 350,000 | 384,643 |
| 5% 7/15/24 | | 400,000 | 437,396 |
| 5% 7/15/25 | | 550,000 | 594,314 |
| 5% 7/15/26 | | 500,000 | 536,255 |
| 5% 7/15/27 | | 200,000 | 212,904 |
| 5% 7/15/28 | | 320,000 | 337,901 |
| 5.625% 7/15/36 | | 800,000 | 880,320 |
| 5.75% 7/15/43 | | 4,700,000 | 5,183,912 |
| Series 2014 M4, 5% 7/1/44 | | 15,000,000 | 16,873,800 |
| Series 2014 P: | | | |
| 5% 10/1/32 | | 5,000,000 | 5,908,100 |
| 5% 10/1/46 | | 7,080,000 | 8,190,144 |
| Series 2015 D, 5% 7/1/44 | | 9,975,000 | 11,022,375 |
| Series 2015 F, 5% 8/15/45 | | 17,000,000 | 19,406,860 |
| Series 2015 H1: | | | |
| 5% 7/1/26 | | 3,585,000 | 4,276,009 |
| 5% 7/1/29 | | 3,750,000 | 4,384,350 |
| 5% 7/1/30 | | 1,800,000 | 2,093,220 |
| 5% 7/1/31 | | 1,190,000 | 1,375,402 |
| 5% 7/1/32 | | 1,000,000 | 1,148,750 |
| 5% 7/1/33 | | 1,000,000 | 1,144,370 |
| Series 2015 O2: | | | |
| 5% 7/1/27 | | 8,635,000 | 10,646,955 |
| 5% 7/1/29 | | 4,495,000 | 5,461,515 |
| Series 2015 Q: | | | |
| 5% 8/15/28 | | 1,000,000 | 1,236,700 |
| 5% 8/15/29 | | 1,000,000 | 1,232,830 |
| 5% 8/15/32 | | 1,500,000 | 1,826,280 |
| 5% 8/15/33 | | 1,500,000 | 1,819,170 |
| 5% 8/15/34 | | 1,790,000 | 2,162,427 |
| 5% 8/15/38 | | 1,690,000 | 2,022,609 |
| Series 2015: | | | |
| 5% 1/1/25 | | 3,525,000 | 4,031,084 |
| 5% 1/1/27 | | 2,695,000 | 3,084,185 |
| 5% 1/1/28 | | 1,850,000 | 2,114,069 |
| 5% 1/1/29 | | 2,945,000 | 3,360,451 |
| Series 2016: | | | |
| 5% 7/1/26 (b) | | 1,710,000 | 2,070,023 |
| 5% 7/1/29 (b) | | 2,000,000 | 2,379,020 |
| 5% 7/1/30 (b) | | 2,000,000 | 2,365,180 |
| 5% 7/1/36 (b) | | 3,000,000 | 3,466,230 |
| 5% 7/1/41 (b) | | 1,850,000 | 2,100,694 |
| 5% 7/1/46 (b) | | 1,360,000 | 1,537,942 |
| Series I, 6.875% 1/1/41 | | 9,540,000 | 11,216,083 |
| Series L, 5% 7/1/41 | | 4,900,000 | 5,445,468 |
| 5% 3/1/34 | | 4,375,000 | 5,066,425 |
| 5.25% 7/1/25 | | 1,000,000 | 1,149,810 |
| 5.25% 7/1/25 (Pre-Refunded to 7/1/22 @ 100) | | 1,000,000 | 1,244,990 |
| 5.25% 7/1/26 | | 1,000,000 | 1,142,840 |
| 5.25% 7/1/26 (Pre-Refunded to 7/1/22 @ 100) | | 1,000,000 | 1,244,990 |
| 5.5% 7/1/44 | | 11,295,000 | 12,201,311 |
| Massachusetts Dev. Fin. Agcy. Solid Waste Disp. Rev. Bonds Series 2009, 5.75%, tender 5/1/19 (c) | | 2,000,000 | 2,306,660 |
| Massachusetts Edl. Fing. Auth. Rev.: | | | |
| Series 2010 A: | | | |
| 5.5% 1/1/17 | | 3,000,000 | 3,123,660 |
| 5.5% 1/1/22 | | 3,500,000 | 3,972,955 |
| 5.5% 1/1/23 (d) | | 1,200,000 | 1,302,624 |
| Series 2010 B, 4.8% 1/1/17 (d) | | 1,455,000 | 1,501,909 |
| Massachusetts Fed. Hwy. Series 2013 A: | | | |
| 5% 6/15/26 | | 5,000,000 | 6,021,700 |
| 5% 6/15/27 | | 5,000,000 | 6,008,250 |
| Massachusetts Gen. Oblig.: | | | |
| Series 2001 D: | | | |
| 5.5% 11/1/20 | | 1,000,000 | 1,205,930 |
| 5.5% 11/1/20 (Nat'l. Pub. Fin. Guarantee Corp. Insured) | | 2,000,000 | 2,411,860 |
| Series 2004 A, 5.5% 8/1/30 | | 2,000,000 | 2,674,640 |
| Series 2006 B: | | | |
| 5.25% 9/1/22 | | 5,360,000 | 6,679,096 |
| 5.25% 9/1/23 | | 9,400,000 | 11,915,910 |
| Series 2007 A, 0.79% 5/1/37 (c) | | 20,250,000 | 18,975,668 |
| Series 2008 A: | | | |
| 5% 8/1/22 (Pre-Refunded to 8/1/18 @ 100) | | 3,685,000 | 4,064,555 |
| 5% 8/1/24 (Pre-Refunded to 8/1/18 @ 100) | | 7,380,000 | 8,140,140 |
| Series 2009 A, 5% 3/1/39 | | 17,000,000 | 18,680,450 |
| Series 2011 A: | | | |
| 5% 4/1/26 | | 5,425,000 | 6,405,894 |
| 5% 4/1/28 | | 5,880,000 | 6,923,876 |
| Series 2011 B: | | | |
| 5% 8/1/23 | | 5,770,000 | 6,729,320 |
| 5% 8/1/24 | | 1,750,000 | 2,040,115 |
| 5% 8/1/25 | | 1,930,000 | 2,249,029 |
| Series 2014 E: | | | |
| 5% 9/1/28 | | 10,400,000 | 12,570,376 |
| 5% 9/1/29 | | 7,500,000 | 9,039,225 |
| 5% 9/1/30 | | 5,000,000 | 6,008,900 |
| 5% 9/1/31 | | 8,000,000 | 9,586,720 |
| Series 2015 A, 4% 5/1/25 | | 19,000,000 | 21,688,120 |
| Series 2015 C: | | | |
| 5% 7/1/40 | | 7,675,000 | 9,070,238 |
| 5% 7/1/45 | | 20,000,000 | 23,473,000 |
| Series C, 5.5% 12/1/22 | | 7,800,000 | 9,886,968 |
| Massachusetts Health & Edl. Facilities Auth. Rev.: | | | |
| (Baystate Health Sys. Proj.) Series 2009 I, 5.75% 7/1/36 | | 7,500,000 | 8,467,800 |
| (Berklee College of Music Proj.) Series 2007 A: | | | |
| 5% 10/1/16 | | 1,000,000 | 1,029,590 |
| 5% 10/1/19 | | 3,290,000 | 3,518,655 |
| 5% 10/1/21 | | 3,270,000 | 3,495,009 |
| 5% 10/1/23 | | 2,000,000 | 2,136,240 |
| 5% 10/1/25 | | 5,950,000 | 6,351,268 |
| (Blood Research Institute Proj.) Series A, 6.5% 2/1/22 (e) | | 6,935,000 | 6,966,485 |
| (Cape Cod Healthcare Proj.) Series 2004 D: | | | |
| 5% 11/15/31 (Assured Guaranty Corp. Insured) | | 2,000,000 | 2,221,380 |
| 5.125% 11/15/35 (Assured Guaranty Corp. Insured) | | 1,000,000 | 1,100,620 |
| 6% 11/15/28 (Assured Guaranty Corp. Insured) | | 2,735,000 | 3,190,350 |
| (CareGroup, Inc. Proj.): | | | |
| Series 2008 B1, 5.375% 2/1/27 (Nat'l. Pub. Fin. Guarantee Corp. Insured) | | 1,000,000 | 1,100,740 |
| Series 2008 B2: | | | |
| 5% 2/1/25 (Nat'l. Pub. Fin. Guarantee Corp. Insured) | | 800,000 | 874,696 |
| 5.375% 2/1/26 (Nat'l. Pub. Fin. Guarantee Corp. Insured) | | 1,750,000 | 1,929,480 |
| 5.375% 2/1/28 (Nat'l. Pub. Fin. Guarantee Corp. Insured) | | 2,000,000 | 2,196,800 |
| Series 2008 D: | | | |
| 5.25% 7/1/19 (Nat'l. Pub. Fin. Guarantee Corp. Insured) | | 1,500,000 | 1,652,235 |
| 5.25% 7/1/21 (Nat'l. Pub. Fin. Guarantee Corp. Insured) | | 1,450,000 | 1,599,727 |
| 5.25% 7/1/22 (Nat'l. Pub. Fin. Guarantee Corp. Insured) | | 1,000,000 | 1,104,270 |
| 5.25% 7/1/24 (Nat'l. Pub. Fin. Guarantee Corp. Insured) | | 1,900,000 | 2,092,356 |
| Series 2008 E1: | | | |
| 5% 7/1/28 | | 2,525,000 | 2,737,858 |
| 5.125% 7/1/33 | | 2,000,000 | 2,151,760 |
| 5.125% 7/1/38 | | 4,040,000 | 4,315,932 |
| 5.375% 7/1/21 | | 10,850,000 | 12,019,196 |
| Series 2008 E2: | | | |
| 5.375% 7/1/24 (Pre-Refunded to 7/1/18 @ 100) | | 5,015,000 | 5,560,482 |
| 5.375% 7/1/25 (Pre-Refunded to 7/1/18 @ 100) | | 3,500,000 | 3,880,695 |
| (Catholic Health East Proj.) Series 2010, 5% 11/15/18 | | 1,005,000 | 1,116,525 |
| (Children's Hosp. Proj.) Series 2009 M, 5.5% 12/1/39 | | 20,000,000 | 22,764,600 |
| (Northeastern Univ. Proj.): | | | |
| Series 2008 R: | | | |
| 5% 10/1/16 | | 600,000 | 617,754 |
| 5% 10/1/17 | | 775,000 | 828,863 |
| 5% 10/1/18 | | 500,000 | 551,550 |
| 5% 10/1/20 | | 2,000,000 | 2,219,040 |
| 5% 10/1/22 | | 1,160,000 | 1,290,291 |
| 5% 10/1/27 | | 3,030,000 | 3,355,907 |
| 5% 10/1/28 | | 1,000,000 | 1,104,770 |
| 5% 10/1/33 | | 5,000,000 | 5,479,500 |
| Series 2009 Y1: | | | |
| 5% 10/1/17 | | 1,570,000 | 1,679,115 |
| 5% 10/1/19 | | 1,730,000 | 1,968,757 |
| Series 2009 Y2: | | | |
| 5% 10/1/17 | | 1,145,000 | 1,224,578 |
| 5% 10/1/18 | | 1,215,000 | 1,340,267 |
| (Partners HealthCare Sys., Inc. Proj.): | | | |
| Series 2009 I3, 5% 7/1/21 | | 2,300,000 | 2,602,795 |
| Series 2010 J1, 5% 7/1/39 | | 23,500,000 | 26,075,600 |
| (South Shore Hosp. Proj.) Series F: | | | |
| 5.625% 7/1/19 | | 145,000 | 145,315 |
| 5.75% 7/1/29 | | 6,370,000 | 6,381,466 |
| (Tufts Univ. Proj.): | | | |
| Series 2008 O, 5.375% 8/15/38 (Pre-Refunded to 8/15/18 @ 100) | | 4,500,000 | 5,018,895 |
| Series J, 5.5% 8/15/17 | | 500,000 | 537,660 |
| (UMass Memorial Proj.) Series 2010 G, 5% 7/1/17 | | 2,215,000 | 2,343,005 |
| (Winchester Hosp. Proj.) Series 2010 H, 5.25% 7/1/38 | | 18,995,000 | 21,230,901 |
| (Woods Hole Oceanographic Institution Proj.) Series 2008 B: | | | |
| 5.25% 6/1/25 | | 1,760,000 | 1,935,085 |
| 5.375% 6/1/30 | | 8,000,000 | 8,799,280 |
| Series 2007 E: | | | |
| 5% 7/15/32 | | 1,155,000 | 1,196,719 |
| 5% 7/15/37 | | 2,750,000 | 2,837,725 |
| Series 2008 B2, 5.375% 2/1/27 (Nat'l. Pub. Fin. Guarantee Corp. Insured) | | 1,000,000 | 1,100,740 |
| Series 2008 E2, 5.375% 7/1/21 (Pre-Refunded to 7/1/18 @ 100) | | 2,075,000 | 2,300,698 |
| Series 2010 C: | | | |
| 5% 7/1/30 | | 4,460,000 | 4,770,639 |
| 5.125% 7/1/35 | | 530,000 | 564,010 |
| Series 2010 H, 5% 7/1/16 | | 1,000,000 | 1,017,700 |
| Series E, 5% 7/15/27 | | 7,195,000 | 7,487,189 |
| Massachusetts Port Auth. Rev.: | | | |
| Series 2007 C, 5% 7/1/17 (FSA Insured) (d) | | 1,660,000 | 1,759,069 |
| Series 2010 A: | | | |
| 5% 7/1/34 | | 2,000,000 | 2,301,380 |
| 5% 7/1/40 | | 12,000,000 | 13,664,880 |
| Series 2012 A: | | | |
| 5% 7/1/37 (d) | | 2,000,000 | 2,285,540 |
| 5% 7/1/42 (d) | | 10,300,000 | 11,582,556 |
| Series 2012 B: | | | |
| 5% 7/1/25 | | 4,150,000 | 5,006,436 |
| 5% 7/1/27 | | 6,570,000 | 7,903,644 |
| 5% 7/1/28 | | 5,030,000 | 6,034,139 |
| Series 2014 B, 5% 7/1/39 (d) | | 4,965,000 | 5,638,949 |
| Series 2014 C: | | | |
| 5% 7/1/28 | | 3,000,000 | 3,657,180 |
| 5% 7/1/29 | | 4,205,000 | 5,082,962 |
| 5% 7/1/30 | | 3,000,000 | 3,603,480 |
| Series 2015 A: | | | |
| 5% 7/1/28 | | 460,000 | 567,622 |
| 5% 7/1/28 (d) | | 500,000 | 599,595 |
| 5% 7/1/29 (d) | | 1,245,000 | 1,479,272 |
| 5% 7/1/30 | | 1,400,000 | 1,707,608 |
| 5% 7/1/30 (d) | | 1,450,000 | 1,709,652 |
| 5% 7/1/40 (d) | | 2,000,000 | 2,285,260 |
| 5% 7/1/45 (d) | | 3,500,000 | 3,974,845 |
| 5% 7/1/45 | | 5,570,000 | 6,502,251 |
| Massachusetts Port Auth. Spl. Facilities Rev.: | | | |
| (BosFuel Corp. Proj.) Series 2007: | | | |
| 5% 7/1/18 (Nat'l. Pub. Fin. Guarantee Corp. Insured) (d) | | 1,615,000 | 1,698,269 |
| 5% 7/1/19 (Nat'l. Pub. Fin. Guarantee Corp. Insured) (d) | | 1,000,000 | 1,052,280 |
| 5% 7/1/20 (Nat'l. Pub. Fin. Guarantee Corp. Insured) (d) | | 1,560,000 | 1,646,065 |
| 5% 7/1/21 (Nat'l. Pub. Fin. Guarantee Corp. Insured) (d) | | 1,000,000 | 1,056,340 |
| (BosFuel Proj.) Series 2007, 5% 7/1/38 (Nat'l. Pub. Fin. Guarantee Corp. Insured) (d) | | 5,175,000 | 5,397,215 |
| (ConRAC Proj.) Series 2011 A, 5.125% 7/1/41 | | 13,000,000 | 14,173,250 |
| (Delta Air Lines, Inc. Proj.) Series 2001 A: | | | |
| 5.5% 1/1/17 (AMBAC Insured) (d) | | 5,555,000 | 5,574,276 |
| 5.5% 1/1/18 (AMBAC Insured) (d) | | 6,000,000 | 6,020,280 |
| 5.5% 1/1/19 (AMBAC Insured) (d) | | 5,000,000 | 5,016,500 |
| Massachusetts School Bldg. Auth. Dedicated Sales Tax Rev.: | | | |
| Series 2007 A: | | | |
| 5% 8/15/37 | | 25,000 | 26,415 |
| 5% 8/15/37 (Pre-Refunded to 8/15/17 @ 100) | | 6,580,000 | 7,009,740 |
| Series 2011 B: | | | |
| 5% 10/15/41 | | 25,000,000 | 29,196,750 |
| 5.25% 10/15/35 | | 12,500,000 | 14,915,625 |
| Series 2012 A: | | | |
| 5% 8/15/23 | | 15,000,000 | 18,318,300 |
| 5% 8/15/24 | | 27,500,000 | 33,487,575 |
| 5% 8/15/25 | | 28,475,000 | 34,595,974 |
| Series 2012 B: | | | |
| 5% 8/15/27 | | 10,000,000 | 12,094,200 |
| 5% 8/15/28 | | 12,000,000 | 14,480,040 |
| 5% 8/15/30 | | 25,900,000 | 31,092,950 |
| Series 2013 A, 5% 5/15/43 | | 18,675,000 | 21,510,425 |
| Series 2015 C, 5% 8/15/37 | | 10,000,000 | 11,921,700 |
| Series 2016 A: | | | |
| 5% 11/15/40 | | 7,335,000 | 8,686,620 |
| 5% 11/15/41 | | 7,710,000 | 9,109,057 |
| Massachusetts Spl. Oblig. Dedicated Tax Rev.: | | | |
| Series 2004, 5.25% 1/1/19 (Nat'l. Pub. Fin. Guarantee Corp. Insured) | | 5,935,000 | 6,627,793 |
| Series 2005: | | | |
| 5% 1/1/20 (Nat'l. Pub. Fin. Guarantee Corp. Insured) | | 2,500,000 | 2,851,600 |
| 5.5% 1/1/28 (Nat'l. Pub. Fin. Guarantee Corp. Insured) | | 1,000,000 | 1,300,170 |
| 5.5% 1/1/34 (Nat'l. Pub. Fin. Guarantee Corp. Insured) | | 4,770,000 | 6,311,569 |
| Massachusetts Spl. Oblig. Rev. Series 2005 A, 5.5% 6/1/19 | | 10,000,000 | 11,483,300 |
| Massachusetts State College Bldg. Auth. Rev.: | | | |
| Series 2002 A, 0% 5/1/22 (Escrowed to Maturity) | | 2,250,000 | 2,050,808 |
| Series 2003 B: | | | |
| 0% 5/1/28 (XL Cap. Assurance, Inc. Insured) | | 6,080,000 | 4,452,810 |
| 5.375% 5/1/18 (XL Cap. Assurance, Inc. Insured) | | 1,100,000 | 1,210,924 |
| 5.375% 5/1/20 (XL Cap. Assurance, Inc. Insured) | | 1,825,000 | 2,143,481 |
| Series 2008 A: | | | |
| 5% 5/1/19 (Assured Guaranty Corp. Insured) | | 1,730,000 | 1,892,914 |
| 5% 5/1/20 (Assured Guaranty Corp. Insured) | | 2,130,000 | 2,335,098 |
| 5% 5/1/21 (Assured Guaranty Corp. Insured) | | 2,440,000 | 2,684,171 |
| 5% 5/1/22 (Assured Guaranty Corp. Insured) | | 2,430,000 | 2,676,621 |
| 5% 5/1/23 (Assured Guaranty Corp. Insured) | | 2,490,000 | 2,742,710 |
| Series 2009 A: | | | |
| 5.375% 5/1/34 | | 2,305,000 | 2,618,964 |
| 5.5% 5/1/39 | | 7,000,000 | 7,954,870 |
| 5.5% 5/1/49 | | 3,440,000 | 3,823,182 |
| 5.75% 5/1/49 | | 10,000,000 | 11,192,100 |
| Series 2009 B: | | | |
| 5% 5/1/35 | | 5,560,000 | 6,374,484 |
| 5% 5/1/40 | | 4,625,000 | 5,239,200 |
| Series 2012 A: | | | |
| 5% 5/1/36 | | 7,360,000 | 8,551,363 |
| 5% 5/1/41 | | 10,000,000 | 11,276,400 |
| Series 2012 B: | | | |
| 5% 5/1/29 | | 2,000,000 | 2,384,160 |
| 5% 5/1/30 | | 1,870,000 | 2,224,328 |
| 5% 5/1/37 | | 3,075,000 | 3,528,286 |
| 5% 5/1/43 | | 11,125,000 | 12,443,424 |
| Series 2014 B: | | | |
| 5% 5/1/39 | | 2,500,000 | 2,908,300 |
| 5% 5/1/44 | | 13,935,000 | 16,099,802 |
| Series 2014 D: | | | |
| 5% 5/1/39 | | 7,575,000 | 8,903,504 |
| 5% 5/1/41 | | 4,515,000 | 5,274,829 |
| Massachusetts Tpk. Auth. Metropolitan Hwy. Sys. Rev.: | | | |
| Series 1997 C, 0% 1/1/23 (Nat'l. Pub. Fin. Guarantee Corp. Insured) | | 1,800,000 | 1,577,322 |
| Sr. Series A: | | | |
| 0% 1/1/25 (Nat'l. Pub. Fin. Guarantee Corp. Insured) | | 5,110,000 | 4,167,920 |
| 0% 1/1/28 (Nat'l. Pub. Fin. Guarantee Corp. Insured) | | 7,700,000 | 5,660,578 |
| 0% 1/1/29 (Nat'l. Pub. Fin. Guarantee Corp. Insured) | | 33,195,000 | 23,479,487 |
| Sr. Series C: | | | |
| 0% 1/1/17 (Nat'l. Pub. Fin. Guarantee Corp. Insured) | | 7,705,000 | 7,654,686 |
| 0% 1/1/19 (Nat'l. Pub. Fin. Guarantee Corp. Insured) | | 13,815,000 | 13,349,849 |
| Massachusetts Wtr. Resources Auth. Wtr. & Swr. Rev.: | | | |
| Series 1992 A, 6.5% 7/15/19 (Escrowed to Maturity) | | 12,675,000 | 13,810,046 |
| Series 2002 J, 5.5% 8/1/20 | | 1,000,000 | 1,196,800 |
| Series 2009 A: | | | |
| 5% 8/1/34 | | 6,350,000 | 7,140,829 |
| 5% 8/1/39 | | 8,360,000 | 9,334,358 |
| Series 2009 B, 5% 8/1/22 | | 2,540,000 | 2,884,297 |
| Series 2011 B: | | | |
| 5% 8/1/36 | | 5,000,000 | 5,850,600 |
| 5% 8/1/41 | | 16,000,000 | 18,342,240 |
| Series 2011 C: | | | |
| 5% 8/1/23 | | 6,070,000 | 7,296,504 |
| 5% 8/1/24 | | 22,090,000 | 26,514,406 |
| 5% 8/1/25 | | 14,235,000 | 17,044,277 |
| 5.25% 8/1/42 | | 8,425,000 | 9,862,137 |
| Series 2012 A, 5% 8/1/37 | | 8,000,000 | 9,249,120 |
| Series 2014 F, 5% 8/1/26 | | 8,790,000 | 10,918,235 |
| Series J, 5% 8/1/42 | | 100,000 | 100,275 |
| 5% 8/1/27 (FSA Insured) | | 150,000 | 156,167 |
| Monson Gen. Oblig. 5.25% 11/1/21 (AMBAC Insured) | | 1,000,000 | 1,003,060 |
| Newton Gen. Oblig. Series 2009 A: | | | |
| 4% 4/1/23 | | 1,490,000 | 1,632,638 |
| 5% 4/1/20 | | 1,840,000 | 2,076,422 |
| 5% 4/1/21 | | 1,915,000 | 2,160,407 |
| Plymouth Gen. Oblig.: | | | |
| Series 2009: | | | |
| 5% 5/15/23 | | 1,255,000 | 1,435,143 |
| 5% 5/15/25 | | 1,150,000 | 1,312,645 |
| 5% 10/15/17 | | 1,665,000 | 1,788,710 |
| 5% 10/15/19 | | 500,000 | 574,825 |
| Reading Gen. Oblig. Series 2012: | | | |
| 5% 2/1/20 | | 1,165,000 | 1,338,142 |
| 5% 2/1/22 | | 1,245,000 | 1,509,824 |
| 5% 2/1/23 | | 1,185,000 | 1,469,187 |
| Revere Gen. Oblig. Series 2009: | | | |
| 5% 4/1/28 | | 515,000 | 572,968 |
| 5% 4/1/39 | | 2,000,000 | 2,197,060 |
| 5.5% 4/1/27 | | 2,510,000 | 2,842,098 |
| Springfield Wtr. & Swr. Commission Rev. Series 2008 A: | | | |
| 5.75% 10/15/26 (Assured Guaranty Corp. Insured) | | 1,000,000 | 1,138,000 |
| 5.75% 10/15/27 (Assured Guaranty Corp. Insured) | | 1,000,000 | 1,138,000 |
| 5.75% 10/15/28 (Assured Guaranty Corp. Insured) | | 1,000,000 | 1,136,560 |
| Taunton Gen. Oblig. 5% 12/1/17 | | 1,965,000 | 2,108,838 |
| Univ. of Massachusetts Bldg. Auth. Facilities Rev.: | | | |
| (Bldg. Auth. Proj.) Series 2015 1: | | | |
| 5% 11/1/27 | | 3,500,000 | 4,397,120 |
| 5% 11/1/28 | | 6,000,000 | 7,483,980 |
| 5% 11/1/29 | | 6,230,000 | 7,727,567 |
| 5% 11/1/30 | | 6,000,000 | 7,400,880 |
| Series 2004 1, 5.375% 11/1/16 (AMBAC Insured) | | 1,305,000 | 1,309,646 |
| Series 2008 2, 5% 5/1/38 (FSA Insured) | | 20,605,000 | 22,147,696 |
| Series 2014 1, 5% 11/1/44 | | 14,515,000 | 16,890,380 |
| Series 2015 1, 5% 11/1/40 | | 9,595,000 | 11,338,987 |
| Westfield Gen. Oblig. Series 2014: | | | |
| 5% 3/1/26 | | 2,990,000 | 3,681,019 |
| 5% 3/1/27 | | 2,740,000 | 3,352,582 |
| Worcester Gen. Oblig. Series 2001 A: | | | |
| 5.25% 8/15/21 (Nat'l. Pub. Fin. Guarantee Corp. Insured) | | 310,000 | 311,132 |
| 5.5% 8/15/18 (Nat'l. Pub. Fin. Guarantee Corp. Insured) | | 220,000 | 220,834 |
|
| TOTAL MASSACHUSETTS | | | 2,220,994,466 |
|
| Virgin Islands - 0.4% | | | |
| Virgin Islands Pub. Fin. Auth.: | | | |
| Series 2009 A, 6.75% 10/1/37 | | 4,000,000 | 4,528,080 |
| Series 2009 A1, 5% 10/1/39 | | 1,500,000 | 1,627,635 |
| Series 2009 B, 5% 10/1/25 | | 2,800,000 | 3,106,544 |
|
| TOTAL VIRGIN ISLANDS | | | 9,262,259 |
|
| TOTAL MUNICIPAL BONDS | | | |
| (Cost $2,076,354,456) | | | 2,234,610,842 |
| TOTAL INVESTMENT PORTFOLIO - 98.2% | | | |
| (Cost $2,076,354,456) | | | 2,234,610,842 |
| NET OTHER ASSETS (LIABILITIES) - 1.8% | | | 40,787,588 |
| NET ASSETS - 100% | | | $2,275,398,430 |
Legend
(a) Security exempt from registration under Rule 144A of the Securities Act of 1933. These securities may be resold in transactions exempt from registration, normally to qualified institutional buyers. At the end of the period, the value of these securities amounted to $6,806,872 or 0.3% of net assets.
(b) Security or a portion of the security purchased on a delayed delivery or when-issued basis.
(c) Coupon rates for floating and adjustable rate securities reflect the rates in effect at period end.
(d) Private activity obligations whose interest is subject to the federal alternative minimum tax for individuals.
(e) Restricted securities - Investment in securities not registered under the Securities Act of 1933 (excluding 144A issues). At the end of the period, the value of restricted securities (excluding 144A issues) amounted to $6,966,485 or 0.3% of net assets.
Additional information on each restricted holding is as follows:
| Security | Acquisition Date | Acquisition Cost |
| Massachusetts Health & Edl. Facilities Auth. Rev. (Blood Research Institute Proj.) Series A, 6.5% 2/1/22 | 9/3/92 | $6,504,545 |
Investment Valuation
All investments are categorized as Level 2 under the Fair Value Hierarchy. The inputs or methodology used for valuing securities may not be an indication of the risk associated with investing in those securities. For more information on valuation inputs please refer to the Investment Valuation section in the accompanying Notes to Financial Statements.
Other Information
The distribution of municipal securities by revenue source, as a percentage of total Net Assets, is as follows (Unaudited):
| Special Tax | 20.7% |
| Education | 19.7% |
| Health Care | 18.7% |
| Water & Sewer | 11.3% |
| General Obligations | 11.0% |
| Transportation | 11.0% |
| Others* (Individually Less Than 5%) | 7.6% |
| | 100.0% |
* Includes net other assets
See accompanying notes which are an integral part of the financial statements.
Fidelity® Massachusetts Municipal Income Fund
Financial Statements
Statement of Assets and Liabilities
| | | January 31, 2016 |
| Assets | | |
Investment in securities, at value — See accompanying schedule:
Unaffiliated issuers (cost $2,076,354,456) | | $2,234,610,842 |
| Cash | | 15,377,482 |
| Receivable for investments sold | | 17,089,988 |
| Receivable for fund shares sold | | 1,833,894 |
| Interest receivable | | 23,925,291 |
| Prepaid expenses | | 3,900 |
| Other receivables | | 4,026 |
| Total assets | | 2,292,845,423 |
| Liabilities | | |
| Payable for investments purchased on a delayed delivery basis | $13,830,964 | |
| Payable for fund shares redeemed | 642,358 | |
| Distributions payable | 2,036,639 | |
| Accrued management fee | 678,906 | |
| Other affiliated payables | 171,360 | |
| Other payables and accrued expenses | 86,766 | |
| Total liabilities | | 17,446,993 |
| Net Assets | | $2,275,398,430 |
| Net Assets consist of: | | |
| Paid in capital | | $2,113,666,703 |
| Undistributed net investment income | | 973,095 |
| Accumulated undistributed net realized gain (loss) on investments | | 2,502,246 |
| Net unrealized appreciation (depreciation) on investments | | 158,256,386 |
| Net Assets, for 180,410,446 shares outstanding | | $2,275,398,430 |
| Net Asset Value, offering price and redemption price per share ($2,275,398,430 ÷ 180,410,446 shares) | | $12.61 |
See accompanying notes which are an integral part of the financial statements.
Statement of Operations
| | | Year ended January 31, 2016 |
| Investment Income | | |
| Interest | | $79,168,505 |
| Expenses | | |
| Management fee | $7,951,554 | |
| Transfer agent fees | 1,606,026 | |
| Accounting fees and expenses | 395,742 | |
| Custodian fees and expenses | 23,250 | |
| Independent trustees' compensation | 9,235 | |
| Registration fees | 19,785 | |
| Audit | 56,450 | |
| Legal | 10,915 | |
| Miscellaneous | 56,227 | |
| Total expenses before reductions | 10,129,184 | |
| Expense reductions | (24,488) | 10,104,696 |
| Net investment income (loss) | | 69,063,809 |
| Realized and Unrealized Gain (Loss) | | |
| Net realized gain (loss) on: | | |
| Investment securities: | | |
| Unaffiliated issuers | | 10,265,740 |
| Total net realized gain (loss) | | 10,265,740 |
| Change in net unrealized appreciation (depreciation) on investment securities | | (23,137,534) |
| Net gain (loss) | | (12,871,794) |
| Net increase (decrease) in net assets resulting from operations | | $56,192,015 |
See accompanying notes which are an integral part of the financial statements.
Statement of Changes in Net Assets
| | Year ended January 31, 2016 | Year ended January 31, 2015 |
| Increase (Decrease) in Net Assets | | |
| Operations | | |
| Net investment income (loss) | $69,063,809 | $69,084,817 |
| Net realized gain (loss) | 10,265,740 | 361,311 |
| Change in net unrealized appreciation (depreciation) | (23,137,534) | 129,200,718 |
| Net increase (decrease) in net assets resulting from operations | 56,192,015 | 198,646,846 |
| Distributions to shareholders from net investment income | (68,957,843) | (68,963,938) |
| Distributions to shareholders from net realized gain | (7,490,890) | (3,864,615) |
| Total distributions | (76,448,733) | (72,828,553) |
| Share transactions | | |
| Proceeds from sales of shares | 336,980,121 | 296,294,216 |
| Reinvestment of distributions | 49,412,841 | 46,977,243 |
| Cost of shares redeemed | (317,923,286) | (242,321,871) |
| Net increase (decrease) in net assets resulting from share transactions | 68,469,676 | 100,949,588 |
| Redemption fees | 21,279 | 8,585 |
| Total increase (decrease) in net assets | 48,234,237 | 226,776,466 |
| Net Assets | | |
| Beginning of period | 2,227,164,193 | 2,000,387,727 |
| End of period (including undistributed net investment income of $973,095 and undistributed net investment income of $945,301, respectively) | $2,275,398,430 | $2,227,164,193 |
| Other Information | | |
| Shares | | |
| Sold | 27,018,387 | 24,042,294 |
| Issued in reinvestment of distributions | 3,965,810 | 3,808,113 |
| Redeemed | (25,549,912) | (19,671,378) |
| Net increase (decrease) | 5,434,285 | 8,179,029 |
See accompanying notes which are an integral part of the financial statements.
Financial Highlights — Fidelity Massachusetts Municipal Income Fund
| | | | | | |
| Years ended January 31, | 2016 | 2015 | 2014 | 2013 | 2012 |
| Selected Per–Share Data | | | | | |
| Net asset value, beginning of period | $12.73 | $11.99 | $12.69 | $12.63 | $11.53 |
| Income from Investment Operations | | | | | |
| Net investment income (loss)A | .390 | .405 | .399 | .420 | .448 |
| Net realized and unrealized gain (loss) | (.079) | .763 | (.630) | .141 | 1.142 |
| Total from investment operations | .311 | 1.168 | (.231) | .561 | 1.590 |
| Distributions from net investment income | (.389) | (.405) | (.399) | (.418) | (.449) |
| Distributions from net realized gain | (.042) | (.023) | (.070) | (.083) | (.041) |
| Total distributions | (.431) | (.428) | (.469) | (.501) | (.490) |
| Redemption fees added to paid in capitalA,B | – | – | – | – | – |
| Net asset value, end of period | $12.61 | $12.73 | $11.99 | $12.69 | $12.63 |
| Total ReturnC | 2.54% | 9.91% | (1.79)% | 4.51% | 14.09% |
| Ratios to Average Net AssetsD | | | | | |
| Expenses before reductions | .46% | .46% | .46% | .46% | .46% |
| Expenses net of fee waivers, if any | .46% | .46% | .46% | .46% | .46% |
| Expenses net of all reductions | .46% | .46% | .46% | .46% | .46% |
| Net investment income (loss) | 3.13% | 3.29% | 3.28% | 3.31% | 3.74% |
| Supplemental Data | | | | | |
| Net assets, end of period (000 omitted) | $2,275,398 | $2,227,164 | $2,000,388 | $2,559,130 | $2,369,960 |
| Portfolio turnover rate | 11% | 8% | 11% | 19% | 11% |
A Calculated based on average shares outstanding during the period.
B Amount represents less than $.0005 per share.
C Total returns would have been lower if certain expenses had not been reduced during the applicable periods shown.
D Expense ratios reflect operating expenses of the Fund. Expenses before reductions do not reflect amounts reimbursed by the investment adviser or reductions from expense offset arrangements and do not represent the amount paid by the Fund during periods when reimbursements or reductions occur. Expenses net of fee waivers reflect expenses after reimbursement by the investment adviser but prior to reductions from expense offset arrangements. Expenses net of all reductions represent the net expenses paid by the Fund.
See accompanying notes which are an integral part of the financial statements.
Fidelity® Massachusetts Municipal Money Market Fund
Investment Summary/Performance (Unaudited)
Effective Maturity Diversification
| Days | % of fund's investments 1/31/16 | % of fund's investments 7/31/15 | % of fund's investments 1/31/15 |
| 1 - 7 | 77.4 | 80.6 | 73.4 |
| 8 - 30 | 4.0 | 2.5 | 1.9 |
| 31 - 60 | 3.6 | 4.2 | 3.8 |
| 61 - 90 | 4.2 | 3.8 | 2.7 |
| 91 - 180 | 8.3 | 3.2 | 12.7 |
| > 180 | 2.5 | 5.7 | 5.5 |
Effective maturity is determined in accordance with the requirements of Rule 2a-7 under the Investment Company Act of 1940.
Weighted Average Maturity
| | 1/31/16 | 7/31/15 | 1/31/15 |
| Fidelity Massachusetts Municipal Money Market Fund | 26 Days | 30 Days | 37 Days |
| Massachusetts Tax-Free Money Market Funds Average(a) | 26 Days | 31 Days | 38 Days |
(a) Source: iMoneyNet, Inc.
This is a weighted average of all the maturities of the securities held in a fund. Weighted Average Maturity (WAM) can be used as a measure of sensitivity to interest rate changes and market changes. Generally, the longer the maturity, the greater the sensitivity to such changes. WAM is based on the dollar-weighted average length of time until principal payments must be paid. Depending on the types of securities held in a fund, certain maturity shortening devices (e.g., demand features, interest rate resets, and call options) may be taken into account when calculating the WAM.
Weighted Average Life
| | 1/31/16 | 7/31/15 | 1/31/15 |
| Fidelity Massachusetts Municipal Money Market Fund | 27 Days | 32 Days | 41 Days |
Weighted Average Life (WAL) is the weighted average of the life of the securities held in a fund or portfolio and can be used as a measure of sensitivity to changes in liquidity and/or credit risk. Generally, the higher the value, the greater the sensitivity. WAL is based on the dollar-weighted average length of time until principal payments must be paid, taking into account any call options exercised by the issuer and any permissible maturity shortening features other than interest rate resets. The difference between WAM and WAL is that WAM takes into account interest rate resets and WAL does not. WAL for money market funds is not the same as WAL of a mortgage- or asset-backed security.
Asset Allocation (% of fund's net assets)
| As of January 31, 2016 |
| | Variable Rate Demand Notes (VRDNs) | 52.2% |
| | Other Municipal Debt | 27.2% |
| | Investment Companies | 15.5% |
| | Net Other Assets (Liabilities) | 5.1% |

| As of July 31, 2015 |
| | Variable Rate Demand Notes (VRDNs) | 56.0% |
| | Other Municipal Debt | 26.3% |
| | Investment Companies | 16.1% |
| | Net Other Assets (Liabilities) | 1.6% |

Current And Historical 7-Day Yields
| | 1/31/16 | 10/31/15 | 7/31/15 | 4/30/15 | 1/31/15 |
| Fidelity® Massachusetts Municipal Money Market Fund | 0.01% | 0.01% | 0.01% | 0.01% | 0.01% |
Yield refers to the income paid by the Fund over a given period. Yields for money market funds are usually for seven-day periods, as they are here, though they are expressed as annual percentage rates. Past performance is no guarantee of future results. Yield will vary and it's possible to lose money investing in the Fund. A portion of the Fund's expenses was reimbursed and/or waived. Absent such reimbursements and/or waivers the yield for the period ending January 31, 2016, the most recent period shown in the table, would have been -0.41%.
Fidelity® Massachusetts Municipal Money Market Fund
Investments January 31, 2016
Showing Percentage of Net Assets
| Variable Rate Demand Note - 52.2% | | | |
| | | Principal Amount | Value |
| Alabama - 0.1% | | | |
| Decatur Indl. Dev. Board Exempt Facilities Rev. (Nucor Steel Decatur LLC Proj.) Series 2003 A, 0.42% 2/5/16, VRDN (a)(b) | | $3,500,000 | $3,500,000 |
| Arizona - 0.0% | | | |
| Maricopa County Poll. Cont. Rev. (Arizona Pub. Svc. Co. Palo Verde Proj.) Series 2009 A, 0.2% 2/5/16, VRDN (b) | | 1,800,000 | 1,800,000 |
| Arkansas - 0.1% | | | |
| Osceola Solid Waste Disp. Rev. (Plum Point Energy Associates, LLC Proj.) Series 2006, 0.06% 2/5/16, LOC Royal Bank of Scotland PLC, VRDN (a)(b) | | 5,600,000 | 5,600,000 |
| Delaware - 0.1% | | | |
| Delaware Econ. Dev. Auth. Rev. (Delmarva Pwr. & Lt. Co. Proj.) Series 1999 A, 0.07% 2/5/16, VRDN (b) | | 4,400,000 | 4,400,000 |
| Georgia - 0.5% | | | |
| Burke County Indl. Dev. Auth. Poll. Cont. Rev. (Georgia Pwr. Co. Plant Vogtle Proj.): | | | |
| First Series 2009, 0.19% 2/1/16, VRDN (b) | | 10,000,000 | 10,000,000 |
| Series 2012, 0.21% 2/1/16, VRDN (a)(b) | | 700,000 | 700,000 |
| Series 2013, 0.17% 2/5/16, VRDN (b) | | 5,600,000 | 5,600,000 |
| Coweta County Dev. Auth. Poll. Cont. Rev. (Georgia Pwr. Co. Plant Yates Proj.) Series 2006, 0.18% 2/1/16, VRDN (b) | | 6,425,000 | 6,425,000 |
| Monroe County Dev. Auth. Poll. Cont. Rev.: | | | |
| (Georgia Pwr. Co. Plant Scherer Proj.) Series 1997, 0.18% 2/1/16, VRDN (b) | | 2,400,000 | 2,400,000 |
| (Georgia Pwr. Plant Co. Scherer Proj.) Series 2008, 0.18% 2/1/16, VRDN (b) | | 6,440,000 | 6,440,000 |
| | | | 31,565,000 |
| Indiana - 0.0% | | | |
| Michigan City Ltd. Oblig. Rev. (Palatek Proj.) 0.11% 2/5/16, LOC Comerica Bank, VRDN (a)(b) | | 3,090,000 | 3,090,000 |
| Louisiana - 0.0% | | | |
| Saint James Parish Gen. Oblig. (Nucor Steel Louisiana LLC Proj.) Series 2010 B1, 0.35% 2/5/16, VRDN (b) | | 3,400,000 | 3,400,000 |
| Massachusetts - 50.7% | | | |
| Boston Indl. Dev. Rev. (New Boston Seafood Ctr., Inc. Proj.) Series 1997, 0.03% 2/5/16, LOC Bank of America NA, VRDN (a)(b) | | 980,000 | 980,000 |
| Boston Wtr. & Swr. Commission Rev. Series 1994 A, 0.01% 2/5/16, LOC State Street Bank & Trust Co., Boston, VRDN (b) | | 18,505,000 | 18,505,000 |
| JPMorgan Chase Participating VRDN: | | | |
| Series Putters 16 5004, 0.01% 2/1/16 (Liquidity Facility JPMorgan Chase Bank) (b)(c) | | 11,900,000 | 11,900,000 |
| Series Putters 16 5005, 0.01% 2/1/16 (Liquidity Facility JPMorgan Chase Bank) (b)(c) | | 11,900,000 | 11,900,000 |
| Massachusetts Clean Wtr. Trust Participating VRDN: | | | |
| Series Clipper 05 36, 0.01% 2/5/16 (Liquidity Facility State Street Bank & Trust Co., Boston) (b)(c) | | 8,105,000 | 8,105,000 |
| Series Clipper 06 11, 0.04% 2/5/16 (Liquidity Facility State Street Bank & Trust Co., Boston) (b)(c) | | 34,300,000 | 34,300,000 |
| Series Putters 3159, 0.02% 2/5/16 (Liquidity Facility JPMorgan Chase Bank) (b)(c) | | 15,490,000 | 15,490,000 |
| Massachusetts Dept. of Trans. Metropolitan Hwy. Sys. Rev.: | | | |
| Series 2010 A1, 0.01% 2/5/16, LOC Citibank NA, VRDN (b) | | 58,350,000 | 58,350,000 |
| Series 2010 A3, 0.01% 2/5/16, LOC Landesbank Hessen-Thuringen, VRDN (b) | | 56,545,000 | 56,545,000 |
| Massachusetts Dev. Fin. Agcy. Indl. Dev. Rev.: | | | |
| (Charm Sciences, Inc. Proj.) Series 1999 A, 0.17% 2/5/16, LOC Bank of America NA, VRDN (a)(b) | | 1,000,000 | 1,000,000 |
| (Monkiewicz Realty Trust Proj.) 0.15% 2/5/16, LOC Bank of America NA, VRDN (a)(b) | | 1,800,000 | 1,800,000 |
| Massachusetts Dev. Fin. Agcy. Multi-family Hsg. Rev.: | | | |
| (Archstone Reading Apts. Proj.) Series 2004 A, 0.03% 2/5/16, LOC Freddie Mac, VRDN (a)(b) | | 24,840,000 | 24,840,000 |
| (Avalon Acton Apts. Proj.) Series 2006, 0.03% 2/5/16, LOC Fannie Mae, VRDN (a)(b) | | 38,500,000 | 38,500,000 |
| (Salem Heights Apts. Proj.) Series 2003 A, 0.03% 2/5/16, LOC Fed. Home Ln. Bank of Boston, VRDN (a)(b) | | 13,200,000 | 13,200,000 |
| (Tammy Brook Apts. Proj.) Series 2009, 0.03% 2/5/16, LOC Freddie Mac, VRDN (b) | | 6,140,000 | 6,140,000 |
| Massachusetts Dev. Fin. Agcy. Rev.: | | | |
| (Babson College Proj.) Series 2008 A, 0.01% 2/5/16, LOC Fed. Home Ln. Bank of Boston, VRDN (b) | | 1,500,000 | 1,500,000 |
| (Boston Univ. Proj.): | | | |
| Series U-6C, 0.01% 2/1/16, LOC TD Banknorth, NA, VRDN (b) | | 45,880,000 | 45,880,000 |
| Series U3, 0.01% 2/5/16, LOC Northern Trust Co., VRDN (b) | | 33,900,000 | 33,900,000 |
| (Briarwood Retirement Cmnty. Proj.) Series 2004 A, 0.01% 2/5/16, LOC Manufacturers & Traders Trust Co., VRDN (b) | | 13,110,000 | 13,110,000 |
| (Clark Univ. Proj.) 0.01% 2/5/16, LOC TD Banknorth, NA, VRDN (b) | | 33,200,000 | 33,200,000 |
| (College of the Holy Cross Proj.) Series 2008 A, 0.01% 2/1/16, LOC JPMorgan Chase Bank, VRDN (b) | | 33,185,000 | 33,185,000 |
| (Fifteen-O-Five West Housatonic LLC Proj.) Series 2007, 0.05% 2/5/16, LOC HSBC Bank U.S.A., NA, VRDN (a)(b) | | 2,165,000 | 2,165,000 |
| (Governor Dummer Academy Issues Proj.) Series 2006, 0.01% 2/5/16, LOC TD Banknorth, NA, VRDN (b) | | 4,125,000 | 4,125,000 |
| (ISO New England, Inc. Proj.) Series 2005, 0.01% 2/5/16, LOC TD Banknorth, NA, VRDN (b) | | 29,575,000 | 29,575,000 |
| (New England Deaconess Assoc. Proj.) Series 2011 B, 0.03% 2/5/16, LOC Manufacturers & Traders Trust Co., VRDN (b) | | 12,425,000 | 12,425,000 |
| (Olin College Proj.): | | | |
| Series 2008 C2, 0.02% 2/1/16, LOC RBS Citizens NA, VRDN (b) | | 19,300,000 | 19,300,000 |
| Series 2008 C3, 0.02% 2/1/16, LOC RBS Citizens NA, VRDN (b) | | 21,065,000 | 21,065,000 |
| (Partners HealthCare Sys. Proj.): | | | |
| Series 2011 K2, 0.01% 2/5/16 (Liquidity Facility Barclays Bank PLC), VRDN (b) | | 45,100,000 | 45,100,000 |
| Series 2014 M1, 0.01% 2/1/16, LOC U.S. Bank NA, Cincinnati, VRDN (b) | | 41,000,000 | 41,000,000 |
| (Seven Hills Foundation and Affiliates Proj.): | | | |
| Series 2008 A, 0.01% 2/5/16, LOC TD Banknorth, NA, VRDN (b) | | 8,655,000 | 8,655,000 |
| Series 2008 B, 0.01% 2/5/16, LOC TD Banknorth, NA, VRDN (b) | | 4,740,000 | 4,740,000 |
| (Simmons College Proj.) Series G, 0.01% 2/5/16, LOC JPMorgan Chase Bank, VRDN (b) | | 44,140,000 | 44,140,000 |
| (Wilber School Apts. Proj.) Series 2008 A, 0.01% 2/5/16, LOC Bank of America NA, VRDN (b) | | 6,500,000 | 6,500,000 |
| (Worcester Polytechnic Institute Proj.) Series 2008 A, 0.01% 2/5/16, LOC TD Banknorth, NA, VRDN (b) | | 23,145,000 | 23,145,000 |
| Participating VRDN: | | | |
| Series 15 XF0245, 0.02% 2/5/16 (Liquidity Facility JPMorgan Chase Bank) (b)(c) | | 8,135,000 | 8,135,000 |
| Series 2016 XF2207, 0.01% 2/5/16 (Liquidity Facility Citibank NA) (b)(c) | | 2,000,000 | 2,000,000 |
| Series 2016 XM0136, 0.02% 2/5/16 (Liquidity Facility JPMorgan Chase Bank) (b)(c)(d) | | 1,875,000 | 1,875,000 |
| Series MS 3373, 0.02% 2/5/16 (Liquidity Facility Morgan Stanley Bank, West Valley City Utah) (b)(c) | | 7,100,000 | 7,100,000 |
| Series MS 3389X, 0.02% 2/5/16 (Liquidity Facility Morgan Stanley Bank, West Valley City Utah) (b)(c) | | 2,500,000 | 2,500,000 |
| Series Putters 3840, 0.02% 2/5/16 (Liquidity Facility JPMorgan Chase Bank) (b)(c) | | 8,600,000 | 8,600,000 |
| Series ROC II R 11999X, 0.01% 2/5/16 (Liquidity Facility Citibank NA) (b)(c) | | 6,785,000 | 6,785,000 |
| Series 2006: | | | |
| 0.01% 2/5/16, LOC PNC Bank NA, VRDN (b) | | 14,535,000 | 14,535,000 |
| 0.01% 2/5/16, LOC TD Banknorth, NA, VRDN (b) | | 3,810,000 | 3,810,000 |
| Series 2010, 0.03% 2/5/16, LOC Manufacturers & Traders Trust Co., VRDN(b) | | 6,695,000 | 6,695,000 |
| Series 2014 M2, 0.01% 2/5/16, LOC Bank of New York, New York, VRDN (b) | | 39,200,000 | 39,200,000 |
| Massachusetts Gen. Oblig.: | | | |
| (Central Artery Proj.): | | | |
| Series 2000 A, 0.01% 2/5/16 (Liquidity Facility Citibank NA), VRDN (b) | | 73,200,000 | 73,200,000 |
| Series 2000 B, 0.01% 2/1/16 (Liquidity Facility Bank of America NA), VRDN (b) | | 65,400,000 | 65,400,000 |
| Participating VRDN: | | | |
| Series Clipper 07 06, 0.04% 2/5/16 (Liquidity Facility State Street Bank & Trust Co., Boston) (b)(c) | | 53,850,000 | 53,850,000 |
| Series Clipper 07 39, 0.01% 2/5/16 (Liquidity Facility State Street Bank & Trust Co., Boston) (b)(c) | | 31,500,000 | 31,500,000 |
| Series EGL 07 0149, 0.02% 2/5/16 (Liquidity Facility Citibank NA) (b)(c) | | 45,000,000 | 45,000,000 |
| Series Putters 2022, 0.02% 2/5/16 (Liquidity Facility JPMorgan Chase Bank) (b)(c) | | 35,995,000 | 35,995,000 |
| Series Putters 2648, 0.02% 2/5/16 (Liquidity Facility JPMorgan Chase Bank) (b)(c) | | 9,250,000 | 9,250,000 |
| Series Putters 3699, 0.02% 2/5/16 (Liquidity Facility JPMorgan Chase Bank) (b)(c) | | 10,800,000 | 10,800,000 |
| Series Putters 3896, 0.02% 2/5/16 (Liquidity Facility JPMorgan Chase Bank) (b)(c) | | 7,500,000 | 7,500,000 |
| Series Putters 3898, 0.02% 2/5/16 (Liquidity Facility JPMorgan Chase Bank) (b)(c) | | 4,000,000 | 4,000,000 |
| Series Putters 4320, 0.01% 2/1/16 (Liquidity Facility JPMorgan Chase Bank) (b)(c) | | 99,095,000 | 99,095,000 |
| Series 2001 C, 0.01% 2/5/16 (Liquidity Facility State Street Bank & Trust Co., Boston), VRDN (b) | | 206,905,000 | 206,904,997 |
| Series 2006 A, 0.01% 2/1/16 (Liquidity Facility Wells Fargo Bank NA), VRDN (b) | | 110,975,000 | 110,975,000 |
| Massachusetts Health & Edl. Facilities Auth. Rev.: | | | |
| (Amherst College Proj.): | | | |
| Series 1996 F, 0.01% 2/5/16, VRDN (b) | | 4,900,000 | 4,900,000 |
| Series 2005 I, 0.01% 2/5/16, VRDN (b) | | 7,325,000 | 7,325,000 |
| Series 2005 J1, 0.01% 2/5/16, VRDN (b) | | 5,500,000 | 5,500,000 |
| Series 2005 J2, 0.01% 2/1/16, VRDN (b) | | 7,700,000 | 7,700,000 |
| (Baystate Health Sys. Proj.): | | | |
| Series 2009 J1, 0.01% 2/5/16, LOC JPMorgan Chase Bank, VRDN (b) | | 39,000,000 | 39,000,000 |
| Series 2009 J2, 0.01% 2/1/16, LOC JPMorgan Chase Bank, VRDN (b) | | 41,250,000 | 41,250,000 |
| Series 2009 K, 0.01% 2/5/16, LOC Bank of America NA, VRDN (b) | | 9,500,000 | 9,500,000 |
| (Baystate Med. Ctr. Proj.) Series 2005 G, 0.01% 2/1/16, LOC Wells Fargo Bank NA, VRDN (b) | | 19,560,000 | 19,560,000 |
| (Boston Univ. Proj.) Series H, 0.01% 2/5/16, LOC State Street Bank & Trust Co., Boston, VRDN (b) | | 20,020,000 | 20,020,000 |
| (Children's Hosp. Proj.): | | | |
| Series 2010 N3, 0.01% 2/5/16, LOC U.S. Bank NA, Cincinnati, VRDN (b) | | 58,500,000 | 58,500,000 |
| Series 2010 N4, 0.01% 2/1/16, LOC Wells Fargo Bank NA, VRDN (b) | | 131,490,000 | 131,490,000 |
| (CIL Realty of Massachusetts Proj.) Series 2007, 0.01% 2/5/16, LOC HSBC Bank U.S.A., NA, VRDN (b) | | 9,110,000 | 9,110,000 |
| (Fairview Extended Care Proj.) Series B, 0.08% 2/5/16, LOC Bank of America NA, VRDN (b) | | 21,195,000 | 21,195,000 |
| (Harvard Univ. Proj.): | | | |
| Series R, 0.01% 2/1/16, VRDN (b) | | 37,205,000 | 37,205,000 |
| Series Y, 0.01% 2/5/16, VRDN (b) | | 91,880,000 | 91,880,000 |
| (Henry Heywood Memorial Hosp. Proj.): | | | |
| Series 2008 C, 0.01% 2/1/16, LOC TD Banknorth, NA, VRDN (b) | | 4,560,000 | 4,560,000 |
| Series 2009 C, 0.01% 2/1/16, LOC TD Banknorth, NA, VRDN (b) | | 10,590,000 | 10,590,000 |
| (Massachusetts Institute of Technology Proj.): | | | |
| Series 2001 J1, 0.01% 2/5/16, VRDN (b) | | 107,950,000 | 107,949,996 |
| Series 2001 J2, 0.01% 2/5/16, VRDN (b) | | 49,250,000 | 49,250,000 |
| (Northeast Hosp. Corp. Proj.) Series 2004 G, 0.07% 2/5/16, LOC JPMorgan Chase Bank, VRDN (b) | | 35,540,000 | 35,540,000 |
| (Partners HealthCare Sys., Inc. Proj.): | | | |
| Series 2005 F, 0.01% 2/5/16, LOC TD Banknorth, NA, VRDN (b) | | 85,675,000 | 85,675,000 |
| Series D5, 0.01% 2/1/16, VRDN (b) | | 200,000 | 200,000 |
| Series D6, 0.01% 2/1/16, VRDN (b) | | 970,000 | 970,000 |
| (Southcoast Health Sys. Obligated Group Proj.) Series 2008 C, 0.01% 2/5/16, LOC TD Banknorth, NA, VRDN (b) | | 43,995,000 | 43,995,000 |
| (Wellesley College Proj.): | | | |
| Series B, 0.01% 2/5/16, VRDN (b) | | 6,000,000 | 6,000,000 |
| Series I, 0.01% 2/5/16, VRDN (b) | | 39,500,000 | 39,500,000 |
| (Williams College Proj.): | | | |
| Series I, 0.01% 2/5/16, VRDN (b) | | 21,888,000 | 21,888,000 |
| Series J, 0.01% 2/5/16, VRDN (b) | | 28,815,000 | 28,815,000 |
| Participating VRDN: | | | |
| Series BA 15 XM0074, 0.03% 2/5/16 (Liquidity Facility Bank of America NA) (b)(c) | | 10,000,000 | 10,000,000 |
| Series BC 10 20W, 0.03% 2/5/16 (Liquidity Facility Barclays Bank PLC) (b)(c) | | 10,785,000 | 10,785,000 |
| Series Clipper 07 08, 0.01% 2/5/16 (Liquidity Facility State Street Bank & Trust Co., Boston) (b)(c) | | 15,450,000 | 15,450,000 |
| Series Putters 3529, 0.02% 2/5/16 (Liquidity Facility JPMorgan Chase Bank) (b)(c) | | 36,660,000 | 36,660,000 |
| Series Putters 3530, 0.02% 2/5/16 (Liquidity Facility JPMorgan Chase Bank) (b)(c) | | 8,000,000 | 8,000,000 |
| Series Putters 3531, 0.02% 2/5/16 (Liquidity Facility JPMorgan Chase Bank) (b)(c) | | 12,495,000 | 12,495,000 |
| Series Putters 3548, 0.02% 2/5/16 (Liquidity Facility JPMorgan Chase Bank) (b)(c) | | 9,925,000 | 9,925,000 |
| Series Putters 3650, 0.02% 2/5/16 (Liquidity Facility JPMorgan Chase Bank) (b)(c) | | 11,800,000 | 11,800,000 |
| Series ROC II R 11824, 0.01% 2/5/16 (Liquidity Facility Citibank NA) (b)(c) | | 4,665,000 | 4,665,000 |
| Series ROC II R 11913, 0.01% 2/5/16 (Liquidity Facility Citibank NA) (b)(c) | | 5,145,000 | 5,145,000 |
| Series 1999 G, 0.01% 2/5/16, VRDN (b) | | 11,390,000 | 11,389,994 |
| Series 2009 O-1, 0.02% 2/5/16, LOC Fed. Home Ln. Bank of Boston, VRDN (b) | | 18,165,000 | 18,165,000 |
| Massachusetts Hsg. Fin. Agcy. Hsg. Rev. (Princeton Westford Proj.) Series 2015 A, 0.01% 2/5/16, LOC Bank of America NA, VRDN (b) | | 4,800,000 | 4,800,000 |
| Massachusetts Hsg. Fin. Agcy. Multi-Family Rev.: | | | |
| (Princeton Crossing LP Proj.) Series 1996 A, 0.02% 2/5/16, LOC Fannie Mae, VRDN (a)(b) | | 20,300,000 | 20,300,000 |
| Series 2009 A, 0.01% 2/5/16, LOC Bank of New York, New York, LOC TD Banknorth, NA, VRDN (b) | | 5,230,000 | 5,230,000 |
| Series 2013 F, 0.02% 2/5/16, LOC TD Banknorth, NA, VRDN (a)(b) | | 13,250,000 | 13,250,000 |
| Massachusetts Indl. Fin. Agcy. Indl. Dev. Rev.: | | | |
| (Boutwell Owens & Co., Inc. Proj.) Series 1998, 0.25% 2/5/16, LOC Wells Fargo Bank NA, VRDN (a)(b) | | 240,000 | 240,000 |
| 0.01% 2/5/16, LOC TD Banknorth, NA, VRDN (b) | | 2,900,000 | 2,900,000 |
| Massachusetts Indl. Fin. Agcy. Rev. (Governor Dummer Academy Proj.) Series 1996, 0.01% 2/5/16, LOC TD Banknorth, NA, VRDN (b) | | 4,200,000 | 4,200,000 |
| Massachusetts Port Auth. Rev.: | | | |
| Series 2008 A, 0.01% 2/5/16, LOC State Street Bank & Trust Co., Boston, VRDN (b) | | 17,055,000 | 17,055,000 |
| Series 2010 D, 0.01% 2/5/16, LOC State Street Bank & Trust Co., Boston, VRDN (a)(b) | | 84,165,000 | 84,165,000 |
| Massachusetts Port Auth. Spl. Proj. Rev. (Harborside Hyatt Proj.) Series 2001 A, 0.02% 2/5/16, LOC U.S. Bank NA, Cincinnati, VRDN (a)(b) | | 32,100,000 | 32,100,000 |
| Massachusetts School Bldg. Auth. Dedicated Sales Tax Rev. Participating VRDN: | | | |
| Series 15 XF2203, 0.01% 2/5/16 (Liquidity Facility Citibank NA) (b)(c) | | 2,360,000 | 2,360,000 |
| Series EGL 14 C031A, 0.02% 2/5/16 (Liquidity Facility Citibank NA) (b)(c) | | 4,125,000 | 4,125,000 |
| Series EGL 15 0004, 0.01% 2/5/16 (Liquidity Facility Citibank NA) (b)(c) | | 57,460,000 | 57,460,000 |
| Series EGL 15 001, 0.01% 2/5/16 (Liquidity Facility Citibank NA) (b)(c) | | 56,710,000 | 56,710,000 |
| Series EGL 15 002, 0.01% 2/5/16 (Liquidity Facility Citibank NA) (b)(c) | | 64,000,000 | 64,000,000 |
| Series EGL 15 003, 0.01% 2/5/16 (Liquidity Facility Citibank NA) (b)(c) | | 48,340,000 | 48,340,000 |
| Series MS 30911, 0.02% 2/5/16 (Liquidity Facility Morgan Stanley Bank, West Valley City Utah) (b)(c) | | 2,700,000 | 2,700,000 |
| Series Putters 3691, 0.02% 2/5/16 (Liquidity Facility JPMorgan Chase Bank) (b)(c) | | 2,885,000 | 2,885,000 |
| Series Putters 3990, 0.02% 2/5/16 (Liquidity Facility JPMorgan Chase Bank) (b)(c) | | 3,000,000 | 3,000,000 |
| Series Putters 4357, 0.02% 2/5/16 (Liquidity Facility JPMorgan Chase Bank) (b)(c) | | 3,335,000 | 3,335,000 |
| Series Putters 4366, 0.02% 2/5/16 (Liquidity Facility JPMorgan Chase Bank) (b)(c) | | 3,750,000 | 3,750,000 |
| Series Putters 4420, 0.02% 2/5/16 (Liquidity Facility JPMorgan Chase Bank) (b)(c) | | 4,400,000 | 4,400,000 |
| Series RBC O 72, 0.01% 2/5/16 (Liquidity Facility Royal Bank of Canada) (b)(c) | | 10,000,000 | 10,000,000 |
| Series ROC II R 14021, 0.01% 2/5/16 (Liquidity Facility Citibank NA) (b)(c) | | 6,000,000 | 6,000,000 |
| Massachusetts St. Wtr. Resources Auth. Participating VRDN Series Putters 3690, 0.02% 2/5/16 (Liquidity Facility JPMorgan Chase Bank) (b)(c) | | 1,300,000 | 1,300,000 |
| Massachusetts Wtr. Resources Auth. Wtr. & Swr. Rev.: | | | |
| Participating VRDN: | | | |
| Series 15 XF0100, 0.02% 2/5/16 (Liquidity Facility JPMorgan Chase Bank) (b)(c) | | 17,550,000 | 17,550,000 |
| Series EGL 06 0054, 0.01% 2/5/16 (Liquidity Facility Citibank NA) (b)(c) | | 11,100,000 | 11,100,000 |
| Series ROC II R 11914, 0.01% 2/5/16 (Liquidity Facility Citibank NA) (b)(c) | | 10,205,000 | 10,205,000 |
| Series ROC II R 11968, 0.01% 2/5/16 (Liquidity Facility Citibank NA) (b)(c) | | 5,185,000 | 5,185,000 |
| Series 1999 B, 0.01% 2/5/16, LOC Landesbank Hessen-Thuringen, VRDN (b) | | 46,600,000 | 46,600,000 |
| Series 2002 C, 0.01% 2/1/16, LOC Landesbank Hessen-Thuringen, VRDN (b) | | 25,120,000 | 25,120,000 |
| | | | 3,242,882,987 |
| Nebraska - 0.1% | | | |
| Stanton County Indl. Dev. Rev. (Nucor Corp. Proj.) Series 1996, 0.42% 2/5/16, VRDN (a)(b) | | 3,400,000 | 3,400,000 |
| New Jersey - 0.1% | | | |
| Salem County Poll. Cont. Fin. Auth. Rev. (Pub. Svc. Elec. and Gas Co. Proj.): | | | |
| Series 2003 B1, 0.13% 2/5/16, VRDN (b) | | 5,800,000 | 5,800,000 |
| Series 2012 A, 0.2% 2/5/16, VRDN (a)(b) | | 3,400,000 | 3,400,000 |
| | | | 9,200,000 |
| Texas - 0.5% | | | |
| Calhoun Port Auth. Envir. Facilities Rev. (Formosa Plastics Corp. Proj.) Series 2012, 0.02% 2/5/16, LOC JPMorgan Chase Bank, VRDN (a)(b) | | 5,800,000 | 5,800,000 |
| Port Arthur Navigation District Envir. Facilities Rev. (Motiva Enterprises LLC Proj.): | | | |
| Series 2001 A, 0.2% 2/1/16, VRDN (b) | | 5,250,000 | 5,250,000 |
| Series 2004, 0.23% 2/5/16, VRDN (a)(b) | | 5,400,000 | 5,400,000 |
| Series 2009 A, 0.2% 2/1/16, VRDN (b) | | 1,200,000 | 1,200,000 |
| Series 2010 B, 0.2% 2/1/16, VRDN (b) | | 2,900,000 | 2,900,000 |
| Series 2010 D, 0.21% 2/1/16, VRDN (b) | | 11,100,000 | 11,100,000 |
| | | | 31,650,000 |
| Wyoming - 0.0% | | | |
| Converse County Envir. Impt. Rev. Series 1995, 0.22% 2/5/16, VRDN (a)(b) | | 200,000 | 200,000 |
| TOTAL VARIABLE RATE DEMAND NOTE | | | |
| (Cost $3,340,687,987) | | | 3,340,687,987 |
|
| Other Municipal Debt - 27.2% | | | |
| Massachusetts - 27.2% | | | |
| Arlington Gen. Oblig. BAN 2% 11/10/16 | | 8,232,000 | 8,334,685 |
| Attleboro Gen. Oblig. BAN 1% 3/18/16 | | 1,740,475 | 1,742,153 |
| Beverly Gen. Oblig. BAN 1.25% 4/23/16 | | 9,052,000 | 9,073,234 |
| Boston Gen. Oblig. Bonds: | | | |
| Series 2007 B, 5% 3/1/16 | | 6,545,000 | 6,570,080 |
| Series 2011 A, 5% 4/1/16 | | 7,115,000 | 7,170,974 |
| Series 2013 A, 5% 3/1/16 | | 1,650,000 | 1,656,299 |
| Series 2014 A, 5% 3/1/16 | | 5,900,000 | 5,922,416 |
| Series 2015 A, 5% 4/1/16 | | 6,500,000 | 6,550,956 |
| Series 2015 B, 4% 4/1/16 | | 10,045,000 | 10,107,641 |
| Boston Wtr. & Swr. Commission Rev. Series A, 0.12% 5/17/16, LOC State Street Bank & Trust Co., Boston, CP | | 6,250,000 | 6,250,000 |
| Cambridge Gen. Oblig. Bonds Series 2015 A, 2% 2/15/16 | | 5,585,000 | 5,588,971 |
| Concord & Carlisle Reg'l. School District Bonds 5% 3/15/16 | | 1,150,000 | 1,156,488 |
| Danvers Gen. Oblig. BAN 2% 8/19/16 | | 11,300,000 | 11,405,860 |
| East Bridgewater Massachusetts BAN 1.5% 3/11/16 | | 1,776,000 | 1,778,419 |
| Eastham Massachusetts BAN 2% 6/30/16 | | 18,000,000 | 18,122,754 |
| Falmouth Gen. Oblig. BAN 2% 12/16/16 | | 13,600,000 | 13,776,873 |
| Gloucester Gen. Oblig. BAN: | | | |
| Series 2015, 2% 8/12/16 | | 17,500,000 | 17,658,204 |
| 1.25% 2/5/16 | | 2,000,000 | 2,000,229 |
| 2% 2/3/17 | | 11,925,000 | 12,105,545 |
| Hingham Gen. Oblig. Bonds 5% 5/15/16 | | 2,168,716 | 2,197,479 |
| Holden Massachusetts Gen. Oblig. BAN 2% 6/17/16 | | 19,800,000 | 19,925,570 |
| Lexington Gen. Oblig.: | | | |
| BAN Series 2015 A, 1.25% 2/26/16 | | 4,351,905 | 4,355,009 |
| Bonds Series 2015, 2% 2/15/16 | | 1,928,000 | 1,929,336 |
| Marblehead Gen. Oblig. BAN 2% 8/5/16 | | 11,041,930 | 11,136,439 |
| Marlborough Gen. Oblig. BAN 1.5% 6/17/16 | | 35,200,000 | 35,361,497 |
| Massachusetts Bay Trans. Auth. Bonds Series 1992 B, 6.2% 3/1/16 | | 3,190,000 | 3,205,231 |
| Massachusetts Bay Trans. Auth. Sales Tax Rev. Bonds: | | | |
| Series 2004 B, 5.25% 7/1/16 | | 4,000,000 | 4,080,978 |
| Series A, 5.5% 7/1/16 | | 1,810,000 | 1,848,080 |
| Massachusetts Clean Wtr. Trust Bonds: | | | |
| (Pool Prog.) Series 2004 A, 5.25% 8/1/16 | | 1,200,000 | 1,229,915 |
| Series 13, 5% 8/1/16 (Escrowed to Maturity) | | 2,170,000 | 2,221,369 |
| Series 14, 3% 8/1/16 | | 1,325,000 | 1,342,749 |
| Series 2014, 2% 8/1/16 | | 6,290,000 | 6,345,319 |
| Massachusetts Dev. Fin. Agcy. Series 5, 0.09% 2/10/16, LOC TD Banknorth, NA, CP | | 8,537,000 | 8,537,000 |
| Massachusetts Dev. Fin. Agcy. Electrical Utils. Rev. Bonds (Nantucket Elec. Co. Proj.) Series 2005, 0.45% tender 3/11/16 (Massachusetts Elec. Co. Guaranteed), CP mode (a) | | 1,200,000 | 1,200,000 |
| Massachusetts Dev. Fin. Agcy. Rev.: | | | |
| Bonds Series WF 10 56C, 0.16%, tender 5/5/16 (Liquidity Facility Wells Fargo Bank NA) (b)(c)(e) | | 19,840,000 | 19,840,000 |
| Series 1, 0.07% 2/2/16, LOC JPMorgan Chase Bank, CP | | 7,300,000 | 7,300,000 |
| Massachusetts Gen. Oblig.: | | | |
| Bonds: | | | |
| Series 2004 B, 5.25% 8/1/16 | | 3,100,000 | 3,177,111 |
| Series 2006 D, 5% 8/1/16 (Pre-Refunded to 8/1/16 @ 100) | | 5,820,000 | 5,956,487 |
| Series 2006 E, 5% 11/1/16 (Pre-Refunded to 11/1/16 @ 100) | | 4,000,000 | 4,138,827 |
| Series 2008 A, 5% 8/1/16 | | 24,000,000 | 24,560,192 |
| Series 2009 A, 5% 3/1/16 | | 4,040,000 | 4,055,440 |
| Series 2011, 5% 5/1/16 | | 1,235,000 | 1,249,461 |
| Series 2012 A, 0.53% 9/1/16 (b) | | 2,595,000 | 2,596,075 |
| Series 2012 D, 0.35% 1/1/17 (b) | | 18,100,000 | 18,112,666 |
| Series 2013 A, 0.37% 2/1/17 (b) | | 13,700,000 | 13,711,931 |
| Series 2014 2, 2% 4/1/16 | | 3,000,000 | 3,008,863 |
| Series 2014 D, 0.01% 2/1/16 (b) | | 32,755,000 | 32,755,000 |
| Series 2015 A, 2% 7/1/16 | | 9,370,000 | 9,435,503 |
| 3% 8/1/16 | | 5,000,000 | 5,066,793 |
| RAN: | | | |
| Series 2015 A, 2% 4/27/16 | | 90,300,000 | 90,696,755 |
| Series 2015 B, 2% 5/25/16 | | 121,670,000 | 122,368,465 |
| Series 2015 C, 2% 6/22/16 | | 45,200,000 | 45,517,074 |
| 0.06% 4/21/16 (Liquidity Facility TD Banknorth, NA), CP | | 45,600,000 | 45,600,000 |
| Massachusetts Health & Edl. Facilities Auth. Rev.: | | | |
| Bonds: | | | |
| (Partners HealthCare Sys., Inc. Proj.): | | | |
| Series 2008 H1: | | | |
| 0.05% tender 3/4/16, CP mode | | 14,260,000 | 14,260,000 |
| 0.07% tender 3/1/16, CP mode | | 15,800,000 | 15,800,000 |
| 0.07% tender 3/2/16, CP mode | | 11,300,000 | 11,300,000 |
| 0.08% tender 2/1/16, CP mode | | 18,100,000 | 18,100,000 |
| 0.08% tender 4/5/16, CP mode | | 18,200,000 | 18,200,000 |
| Series 2008 H2: | | | |
| 0.05% tender 2/2/16, CP mode | | 17,900,000 | 17,900,000 |
| 0.07% tender 2/4/16, CP mode | | 17,890,000 | 17,890,000 |
| 0.07% tender 2/8/16, CP mode | | 12,700,000 | 12,700,000 |
| 0.07% tender 3/3/16, CP mode | | 12,700,000 | 12,700,000 |
| Series 2006 A, 5% 7/1/16 (Pre-Refunded to 7/1/16 @ 100) | | 6,200,000 | 6,319,754 |
| Series 2008 O, 5% 7/1/16 | | 19,910,000 | 20,298,143 |
| Series 2010 J2, 5% 7/1/16 | | 1,000,000 | 1,019,124 |
| Series EE: | | | |
| 0.02% 2/2/16, CP | | 30,101,000 | 30,101,000 |
| 0.02% 2/5/16, CP | | 25,584,000 | 25,584,000 |
| 0.02% 2/5/16, CP | | 42,500,000 | 42,500,000 |
| 0.02% 3/4/16, CP | | 33,100,000 | 33,100,000 |
| Massachusetts Indl. Fin. Agcy. Poll. Cont. Rev. Bonds (New England Pwr. Co. Proj.) Series 1993 B: | | | |
| 0.48% tender 2/5/16, CP mode | | 11,700,000 | 11,700,000 |
| 0.48% tender 3/10/16, CP mode | | 8,000,000 | 8,000,000 |
| Massachusetts Muni. Wholesale Elec. Co. Pwr. Supply Sys. Rev. Bonds: | | | |
| (Nuclear #6 Proj.) Series 2012 A, 5% 7/1/16 | | 4,000,000 | 4,076,718 |
| (Pwr. Supply Proj.) Series 2011, 5% 7/1/16 | | 4,160,000 | 4,240,016 |
| Massachusetts Port Auth. Rev.: | | | |
| Series 2012 A, 0.04% 3/9/16, LOC TD Banknorth, NA, CP | | 24,600,000 | 24,600,000 |
| Series 2012 B: | | | |
| 0.05% 3/9/16, LOC TD Banknorth, NA, CP (a) | | 51,000,000 | 51,000,000 |
| 0.07% 2/8/16, LOC TD Banknorth, NA, CP (a) | | 47,000,000 | 47,000,000 |
| Massachusetts School Bldg. Auth. Dedicated Sales Tax Rev.: | | | |
| Bonds Series 2016 A, 5% 11/15/16 | | 2,210,000 | 2,287,948 |
| Series A: | | | |
| 0.02% 2/1/16, LOC Bank of America NA, CP | | 47,800,000 | 47,800,000 |
| 0.03% 3/2/16, LOC Bank of America NA, CP | | 17,300,000 | 17,300,000 |
| 0.08% 5/16/16, LOC Bank of America NA, CP | | 26,250,000 | 26,250,000 |
| Series B: | | | |
| 0.03% 2/16/16, LOC Citibank NA, CP | | 46,500,000 | 46,500,000 |
| 0.03% 2/17/16, LOC Citibank NA, CP | | 22,800,000 | 22,800,000 |
| 0.04% 2/8/16, LOC Citibank NA, CP | | 5,000,000 | 5,000,000 |
| Series C: | | | |
| 0.03% 2/1/16, LOC Barclays Bank PLC, CP | | 18,200,000 | 18,200,000 |
| 0.03% 2/2/16, LOC Barclays Bank PLC, CP | | 18,200,000 | 18,200,000 |
| 0.05% 2/3/16, LOC Barclays Bank PLC, CP | | 2,000,000 | 2,000,000 |
| 0.05% 3/2/16, LOC Barclays Bank PLC, CP | | 18,200,000 | 18,200,000 |
| 0.06% 2/1/16, LOC Barclays Bank PLC, CP | | 10,900,000 | 10,900,000 |
| Massachusetts Spl. Oblig. Rev. Bonds Series 2005 A, 5.5% 6/1/16 | | 9,910,000 | 10,083,469 |
| Massachusetts State Dev. Fin. Agcy. Elec. Util. Rev. Bonds: | | | |
| (Nantucket Elec. Co. Proj.) Series 2007, 0.5% tender 2/8/16 (Massachusetts Elec. Co. Guaranteed), CP mode (a) | | 10,100,000 | 10,100,000 |
| Nantucket Elec. Co. Proj.) Series 2007, 0.5% tender 2/25/16 (Massachusetts Elec. Co. Guaranteed), CP mode (a) | | 800,000 | 800,000 |
| Massachusetts Wtr. Resources Auth. Wtr. & Swr. Rev.: | | | |
| Bonds: | | | |
| Series 2006 A, 5% 8/1/16 (Pre-Refunded to 8/1/16 @ 100) | | 9,190,000 | 9,404,243 |
| Series Solar 06 86, 0.1%, tender 2/4/16 (Liquidity Facility U.S. Bank NA, Cincinnati) (b)(c) | | 21,710,000 | 21,710,000 |
| Series 99, 0.06% 2/10/16, LOC State Street Bank & Trust Co., Boston, CP | | 39,000,000 | 39,000,000 |
| Milford Gen. Oblig. BAN: | | | |
| 1.5% 5/13/16 | | 6,000,000 | 6,020,832 |
| 2% 7/1/16 | | 15,400,000 | 15,512,462 |
| Norfolk County BAN 1.25% 3/24/16 | | 5,000,000 | 5,007,514 |
| Norwood Gen. Oblig. BAN 2% 7/29/16 | | 18,240,000 | 18,394,114 |
| Peabody Gen. Oblig. BAN 1.25% 3/24/16 | | 17,900,000 | 17,927,411 |
| Pittsfield Gen. Oblig. BAN: | | | |
| 1.25% 4/1/16 | | 13,754,055 | 13,777,908 |
| 1.5% 4/1/16 | | 16,345,415 | 16,377,954 |
| Plymouth Gen. Oblig. Bonds Series 2015, 4% 5/1/16 | | 1,985,000 | 2,003,014 |
| Quincy Gen. Oblig. BAN: | | | |
| 2% 6/17/16 | | 28,279,413 | 28,459,822 |
| 2% 12/23/16 | | 3,000,000 | 3,035,833 |
| RBC Muni. Products, Inc. Trust Bonds Series RBC E 42, 0.1%, tender 5/2/16 (Liquidity Facility Royal Bank of Canada) (b)(c)(e) | | 21,095,000 | 21,095,000 |
| Revere Gen. Oblig. BAN 1.25% 4/15/16 | | 14,900,000 | 14,931,866 |
| Shrewsbury Gen. Oblig. BAN 2% 7/29/16 | | 16,300,000 | 16,432,615 |
| Somerville Gen. Oblig. BAN Series 2015 B, 1.5% 6/10/16 | | 28,800,000 | 28,925,450 |
| Wakefield Gen. Oblig. BAN 1.5% 5/20/16 | | 5,975,000 | 5,996,632 |
| Wellesley Gen. Oblig. Bonds 2% 6/1/16 | | 2,150,000 | 2,162,050 |
| Westfield Gen. Oblig.: | | | |
| BAN: | | | |
| 1% 4/1/16 | | 5,087,646 | 5,094,997 |
| 1.25% 4/1/16 | | 11,868,500 | 11,889,473 |
| Bonds Series 2014, 3% 3/1/16 | | 2,000,000 | 2,004,551 |
| Weston Gen. Oblig.: | | | |
| BAN 1.25% 2/3/16 | | 9,148,298 | 9,148,848 |
| Bonds Series 2015, 5% 2/1/16 | | 1,257,000 | 1,257,000 |
| Worcester Gen. Oblig. BAN Series 2015 A, 2% 12/21/16 | | 9,835,744 | 9,960,864 |
| TOTAL OTHER MUNICIPAL DEBT | | | |
| (Cost $1,741,375,020) | | | 1,741,375,020 |
| | | Shares | Value |
|
| Investment Company - 15.5% | | | |
| Fidelity Municipal Cash Central Fund, 0.02% (f)(g) | | | |
| (Cost $987,328,000) | | 987,328,000 | 987,328,000 |
| TOTAL INVESTMENT PORTFOLIO - 94.9% | | | |
| (Cost $6,069,391,007) | | | 6,069,391,007 |
| NET OTHER ASSETS (LIABILITIES) - 5.1% | | | 326,629,366 |
| NET ASSETS - 100% | | | $6,396,020,373 |
Security Type Abbreviations
BAN – BOND ANTICIPATION NOTE
CP – COMMERCIAL PAPER
RAN – REVENUE ANTICIPATION NOTE
VRDN – VARIABLE RATE DEMAND NOTE (A debt instrument that is payable upon demand, either daily, weekly or monthly)
The date shown for securities represents the date when principal payments must be paid, taking into account any call options exercised by the issuer and any permissible maturity shortening features other than interest rate resets.
Legend
(a) Private activity obligations whose interest is subject to the federal alternative minimum tax for individuals.
(b) Coupon rates for floating and adjustable rate securities reflect the rates in effect at period end.
(c) Provides evidence of ownership in one or more underlying municipal bonds.
(d) Security exempt from registration under Rule 144A of the Securities Act of 1933. These securities may be resold in transactions exempt from registration, normally to qualified institutional buyers. At the end of the period, the value of these securities amounted to $1,875,000 or 0.0% of net assets.
(e) Restricted securities - Investment in securities not registered under the Securities Act of 1933 (excluding 144A issues). At the end of the period, the value of restricted securities (excluding 144A issues) amounted to $40,935,000 or 1.0% of net assets.
(f) Information in this report regarding holdings by state and security types does not reflect the holdings of the Fidelity Municipal Cash Central Fund.
(g) Affiliated fund that is available only to investment companies and other accounts managed by Fidelity Investments. The rate quoted is the annualized seven-day yield of the fund at period end. A complete unaudited listing of the fund's holdings as of its most recent quarter end is available upon request. In addition, each Fidelity Central Fund's financial statements, which are not covered by the Fund's Report of Independent Registered Public Accounting Firm, are available on the SEC's website or upon request.
Additional information on each restricted holding is as follows:
| Security | Acquisition Date | Cost |
| Massachusetts Dev. Fin. Agcy. Rev. Bonds Series WF 10 56C, 0.16%, tender 5/5/16 (Liquidity Facility Wells Fargo Bank NA) | 12/23/10 - 8/4/11 | $19,840,000 |
| RBC Muni. Products, Inc. Trust Bonds Series RBC E 42, 0.1%, tender 5/2/16 (Liquidity Facility Royal Bank of Canada) | 11/5/15 | $21,095,000 |
Affiliated Central Funds
Information regarding fiscal year to date income earned by the Fund from investments in Fidelity Central Funds is as follows:
| Fund | Income earned |
| Fidelity Municipal Cash Central Fund | $367,122 |
| Total | $367,122 |
Investment Valuation
All investments are categorized as Level 2 under the Fair Value Hierarchy. The inputs or methodology used for valuing securities may not be an indication of the risk associated with investing in those securities. For more information on valuation inputs please refer to the Investment Valuation section in the accompanying Notes to Financial Statements.
See accompanying notes which are an integral part of the financial statements.
Fidelity® Massachusetts Municipal Money Market Fund
Financial Statements
Statement of Assets and Liabilities
| | | January 31, 2016 |
| Assets | | |
Investment in securities, at value — See accompanying schedule:
Unaffiliated issuers (cost $5,082,063,007) | $5,082,063,007 | |
| Fidelity Central Funds (cost $987,328,000) | 987,328,000 | |
| Total Investments (cost $6,069,391,007) | | $6,069,391,007 |
| Cash | | 355,481,490 |
| Receivable for fund shares sold | | 47,285,248 |
| Interest receivable | | 8,176,272 |
| Distributions receivable from Fidelity Central Funds | | 17,173 |
| Prepaid expenses | | 11,409 |
| Other receivables | | 10,027 |
| Total assets | | 6,480,372,626 |
| Liabilities | | |
| Payable for investments purchased | $17,767,005 | |
| Payable for fund shares redeemed | 66,157,782 | |
| Distributions payable | 4,314 | |
| Accrued management fee | 191,176 | |
| Other affiliated payables | 55,654 | |
| Other payables and accrued expenses | 176,322 | |
| Total liabilities | | 84,352,253 |
| Net Assets | | $6,396,020,373 |
| Net Assets consist of: | | |
| Paid in capital | | $6,395,512,365 |
| Accumulated undistributed net realized gain (loss) on investments | | 508,008 |
| Net Assets, for 6,389,310,136 shares outstanding | | $6,396,020,373 |
| Net Asset Value, offering price and redemption price per share ($6,396,020,373 ÷ 6,389,310,136 shares) | | $1.00 |
See accompanying notes which are an integral part of the financial statements.
Statement of Operations
| | | Year ended January 31, 2016 |
| Investment Income | | |
| Interest | | $3,552,124 |
| Income from Fidelity Central Funds | | 367,122 |
| Total income | | 3,919,246 |
| Expenses | | |
| Management fee | $23,347,249 | |
| Transfer agent fees | 7,460,282 | |
| Accounting fees and expenses | 544,380 | |
| Custodian fees and expenses | 49,242 | |
| Independent trustees' compensation | 26,825 | |
| Registration fees | 42,207 | |
| Audit | 42,454 | |
| Legal | 23,109 | |
| Miscellaneous | 246,234 | |
| Total expenses before reductions | 31,781,982 | |
| Expense reductions | (28,510,699) | 3,271,283 |
| Net investment income (loss) | | 647,963 |
| Realized and Unrealized Gain (Loss) | | |
| Net realized gain (loss) on: | | |
| Investment securities: | | |
| Unaffiliated issuers | 1,235,776 | |
| Total net realized gain (loss) | | 1,235,776 |
| Net increase in net assets resulting from operations | | $1,883,739 |
See accompanying notes which are an integral part of the financial statements.
Statement of Changes in Net Assets
| | Year ended January 31, 2016 | Year ended January 31, 2015 |
| Increase (Decrease) in Net Assets | | |
| Operations | | |
| Net investment income (loss) | $647,963 | $645,053 |
| Net realized gain (loss) | 1,235,776 | 912,119 |
| Net increase in net assets resulting from operations | 1,883,739 | 1,557,172 |
| Distributions to shareholders from net investment income | (647,047) | (642,678) |
| Distributions to shareholders from net realized gain | (318,499) | (377,279) |
| Total distributions | (965,546) | (1,019,957) |
| Share transactions at net asset value of $1.00 per share | | |
| Proceeds from sales of shares | 13,267,152,631 | 13,937,649,945 |
| Reinvestment of distributions | 918,174 | 976,686 |
| Cost of shares redeemed | (13,574,616,851) | (13,690,765,862) |
| Net increase (decrease) in net assets and shares resulting from share transactions | (306,546,046) | 247,860,769 |
| Total increase (decrease) in net assets | (305,627,853) | 248,397,984 |
| Net Assets | | |
| Beginning of period | 6,701,648,226 | 6,453,250,242 |
| End of period | $6,396,020,373 | $6,701,648,226 |
See accompanying notes which are an integral part of the financial statements.
Financial Highlights — Fidelity Massachusetts Municipal Money Market Fund
| | | | | | |
| Years ended January 31, | 2016 | 2015 | 2014 | 2013 | 2012 |
| Selected Per–Share Data | | | | | |
| Net asset value, beginning of period | $1.00 | $1.00 | $1.00 | $1.00 | $1.00 |
| Income from Investment Operations | | | | | |
| Net investment income (loss)A | – | – | – | – | – |
| Net realized and unrealized gain (loss)A | – | – | – | – | – |
| Total from investment operationsA | – | – | – | – | – |
| Distributions from net investment incomeA | – | – | – | – | – |
| Distributions from net realized gain | –A | –A | – | – | – |
| Total distributionsA | – | – | – | – | – |
| Net asset value, end of period | $1.00 | $1.00 | $1.00 | $1.00 | $1.00 |
| Total ReturnB | .02% | .02% | .01% | .01% | .01% |
| Ratios to Average Net AssetsC,D | | | | | |
| Expenses before reductions | .49% | .49% | .50% | .50% | .50% |
| Expenses net of fee waivers, if any | .05% | .06% | .10% | .17% | .17% |
| Expenses net of all reductions | .05% | .06% | .10% | .17% | .17% |
| Net investment income (loss) | .01% | .01% | .01% | .01% | .01% |
| Supplemental Data | | | | | |
| Net assets, end of period (000 omitted) | $6,396,020 | $6,701,648 | $6,453,250 | $6,002,818 | $5,353,515 |
A Amount represents less than $.0005 per share.
B Total returns would have been lower if certain expenses had not been reduced during the applicable periods shown.
C Fees and expenses of any underlying Fidelity Central Funds are not included in the Fund's expense ratio. The Fund indirectly bears its proportionate share of the expenses of any underlying Fidelity Central Funds.
D Expense ratios reflect operating expenses of the Fund. Expenses before reductions do not reflect amounts reimbursed or waived or reductions from expense offset arrangements and do not represent the amount paid by the Fund during periods when reimbursements, waivers or reductions occur. Expenses net of fee waivers reflect expenses after reimbursement and waivers but prior to reductions from expense offset arrangements. Expenses net of all reductions represent the net expenses paid by the Fund.
See accompanying notes which are an integral part of the financial statements.
Notes to Financial Statements
For the period ended January 31, 2016
1. Organization.
Fidelity Massachusetts Municipal Income Fund (the Income Fund) and Fidelity Massachusetts Municipal Money Market Fund (the Money Market Fund) are funds of Fidelity Massachusetts Municipal Trust (the Trust). The Trust is registered under the Investment Company Act of 1940, as amended (the 1940 Act), as an open-end management investment company organized as a Massachusetts business trust. The Income Fund is a non-diversified fund. Each Fund is authorized to issue an unlimited number of shares. Effective January 1, 2016 shares of the Money Market Fund are only available for purchase by retail shareholders. Share transactions on the Statement of Changes in Net Assets may contain exchanges between affiliated funds. Each Fund may be affected by economic and political developments in the state of Massachusetts.
2. Investments in Fidelity Central Funds.
The Funds may invest in Fidelity Central Funds, which are open-end investment companies generally available only to other investment companies and accounts managed by the investment adviser and its affiliates. The Funds' Schedules of Investments list each of the Fidelity Central Funds held as of period end, if any, as an investment of each Fund, but do not include the underlying holdings of each Fidelity Central Fund. As an Investing Fund, each Fund indirectly bears its proportionate share of the expenses of the underlying Fidelity Central Funds.
The Money Market Central Funds seek preservation of capital and current income and are managed by Fidelity Investments Money Management, Inc. (FIMM), an affiliate of the investment adviser. Annualized expenses of the Money Market Central Funds as of their most recent shareholder report date are less than .005%.
A complete unaudited list of holdings for each Fidelity Central Fund is available upon request or at the Securities and Exchange Commission (the SEC) website at www.sec.gov. In addition, the financial statements of the Fidelity Central Funds, which are not covered by the Funds' Report of Independent Registered Public Accounting Firm, are available on the SEC website or upon request.
3. Significant Accounting Policies.
The financial statements have been prepared in conformity with accounting principles generally accepted in the United States of America (GAAP), which require management to make certain estimates and assumptions at the date of the financial statements. Actual results could differ from those estimates. Subsequent events, if any, through the date that the financial statements were issued have been evaluated in the preparation of the financial statements. The following summarizes the significant accounting policies of the Funds:
Investment Valuation. Investments are valued as of 4:00 p.m. Eastern time on the last calendar day of the period. The Board of Trustees (the Board) has delegated the day to day responsibility for the valuation of the Income Fund's investments to the Fidelity Management & Research Company (FMR) Fair Value Committee (the Committee). In accordance with valuation policies and procedures approved by the Board, the Income Fund attempts to obtain prices from one or more third party pricing vendors or brokers to value its investments. When current market prices, quotations or currency exchange rates are not readily available or reliable, investments will be fair valued in good faith by the Committee, in accordance with procedures adopted by the Board. Factors used in determining fair value vary by investment type and may include market or investment specific events, changes in interest rates and credit quality. The frequency with which these procedures are used cannot be predicted and they may be utilized to a significant extent. The Committee oversees the Income Fund's valuation policies and procedures and reports to the Board on the Committee's activities and fair value determinations. The Board monitors the appropriateness of the procedures used in valuing the Income Fund's investments and ratifies the fair value determinations of the Committee.
Each Fund categorizes the inputs to valuation techniques used to value its investments into a disclosure hierarchy consisting of three levels as shown below:
- Level 1 – quoted prices in active markets for identical investments
- Level 2 – other significant observable inputs (including quoted prices for similar investments, interest rates, prepayment speeds, etc.)
- Level 3 – unobservable inputs (including the Fund's own assumptions based on the best information available)
Valuation techniques used to value each Fund's investments by major category are as follows:
For the Income Fund, debt securities, including restricted securities, are valued based on evaluated prices received from third party pricing vendors or from brokers who make markets in such securities. Municipal securities are valued by pricing vendors who utilize matrix pricing which considers yield or price of bonds of comparable quality, coupon, maturity and type or by broker-supplied prices. When independent prices are unavailable or unreliable, debt securities may be valued utilizing pricing methodologies which consider similar factors that would be used by third party pricing vendors. Debt securities are generally categorized as Level 2 in the hierarchy but may be Level 3 depending on the circumstances.
For the Money Market Fund, as permitted by compliance with certain conditions under Rule 2a-7 of the 1940 Act, securities are valued at amortized cost, which approximates fair value. The amortized cost of an instrument is determined by valuing it at its original cost and thereafter amortizing any discount or premium from its face value at a constant rate until maturity. Securities held by a money market fund are generally high quality and liquid; however, they are reflected as Level 2 because the inputs used to determine fair value are not quoted prices in an active market.
For the Income Fund, changes in valuation techniques may result in transfers in or out of an assigned level within the disclosure hierarchy.
Investment Transactions and Income. For financial reporting purposes, the Funds' investment holdings and net asset value (NAV) include trades executed through the end of the last business day of the period. The NAV per share for processing shareholder transactions is calculated as of the close of business of the New York Stock Exchange (NYSE), normally 4:00 p.m. Eastern time and includes trades executed through the end of the prior business day for the Income Fund and trades executed through the end of the current business day for the Money Market Fund. Gains and losses on securities sold are determined on the basis of identified cost. Income and capital gain distributions from Fidelity Central Funds, if any, are recorded on the ex-dividend date. Interest income is accrued as earned and includes coupon interest and amortization of premium and accretion of discount on debt securities as applicable. Debt obligations may be placed on non-accrual status and related interest income may be reduced by ceasing current accruals and writing off interest receivables when the collection of all or a portion of interest has become doubtful based on consistently applied procedures. A debt obligation is removed from non-accrual status when the issuer resumes interest payments or when collectability of interest is reasonably assured.
Expenses. Expenses directly attributable to a fund are charged to that fund. Expenses attributable to more than one fund are allocated among the respective funds on the basis of relative net assets or other appropriate methods. Expense estimates are accrued in the period to which they relate and adjustments are made when actual amounts are known.
Income Tax Information and Distributions to Shareholders. Each year, each Fund intends to qualify as a regulated investment company under Subchapter M of the Internal Revenue Code, including distributing substantially all of its taxable income and realized gains. As a result, no provision for U.S. Federal income taxes is required. During the period, the Money Market Fund incurred a corporate tax liability on undistributed long-term capital gain which is included in Miscellaneous expense on the Statement of Operations. As of January 31, 2016, each Fund did not have any unrecognized tax benefits in the financial statements; nor is each Fund aware of any tax positions for which it is reasonably possible that the total amounts of unrecognized tax benefits will significantly change in the next twelve months. Each Fund files a U.S. federal tax return, in addition to state and local tax returns as required. Each Fund's federal income tax returns are subject to examination by the Internal Revenue Service (IRS) for a period of three fiscal years after they are filed. State and local tax returns may be subject to examination for an additional fiscal year depending on the jurisdiction.
Dividends are declared and recorded daily and paid monthly from net investment income. Distributions from realized gains, if any, are declared and recorded on the ex-dividend date. Income and capital gain distributions are determined in accordance with income tax regulations, which may differ from GAAP. In addition, the Funds claimed a portion of the payment made to redeeming shareholders as a distribution for income tax purposes.
Capital accounts within the financial statements are adjusted for permanent book-tax differences. These adjustments have no impact on net assets or the results of operations. Capital accounts are not adjusted for temporary book-tax differences which will reverse in a subsequent period.
Book-tax differences are primarily due to market discount and deferred trustees compensation.
The Funds purchase municipal securities whose interest, in the opinion of the issuer, is free from federal income tax. There is no assurance that the IRS will agree with this opinion. In the event the IRS determines that the issuer does not comply with relevant tax requirements, interest payments from a security could become federally taxable, possibly retroactively to the date the security was issued.
The federal tax cost of investment securities and unrealized appreciation (depreciation) as of period end were as follows for each Fund:
| | Tax cost | Gross unrealized appreciation | Gross unrealized depreciation | Net unrealized appreciation (depreciation) on securities |
Fidelity Massachusetts
Municipal Income Fund | $2,075,825,356 | $160,219,333 | $(1,433,847) | $158,785,486 |
Fidelity Massachusetts
Municipal Money
Market Fund | 6,069,391,007 | – | – | – |
The tax-based components of distributable earnings as of period end were as follows for each Fund:
| | Undistributed tax-exempt income | Undistributed long-term capital gain | Net unrealized appreciation (depreciation) on securities and other investments |
| Fidelity Massachusetts Municipal Income Fund | $445,771 | $2,502,246 | $158,785,486 |
| Fidelity Massachusetts Municipal Money Market Fund | 4,383 | 504,322 | – |
The tax character of distributions paid was as follows:
| January 31, 2016 | | | |
| | Tax-Exempt Income | Long-term Capital Gains | Total |
| Fidelity Massachusetts Municipal Income Fund | $68,957,843 | $7,490,890 | $76,448,733 |
| Fidelity Massachusetts Municipal Money Market Fund | 647,047 | 318,499 | 965,546 |
| January 31, 2015 | | | |
| | Tax-Exempt Income | Long-term Capital Gains | Total |
| Fidelity Massachusetts Municipal Income Fund | $68,963,938 | $3,864,615 | $72,828,553 |
| Fidelity Massachusetts Municipal Money Market Fund | 642,678 | 377,279 | 1,019,957 |
Short-Term Trading (Redemption) Fees. Shares held by investors in the Income Fund less than 30 days may be subject to a redemption fee equal to .50% of the NAV of shares redeemed. All redemption fees, which reduce the proceeds of the shareholder redemption, are retained by the Fund and accounted for as an addition to paid in capital.
Delayed Delivery Transactions and When-Issued Securities. During the period, the Funds transacted in securities on a delayed delivery or when-issued basis. Payment and delivery may take place after the customary settlement period for that security. The price of the underlying securities and the date when the securities will be delivered and paid for are fixed at the time the transaction is negotiated. The securities purchased on a delayed delivery or when-issued basis are identified as such in each applicable Fund's Schedule of Investments. The Funds may receive compensation for interest forgone in the purchase of a delayed delivery or when-issued security. With respect to purchase commitments, each applicable Fund identifies securities as segregated in its records with a value at least equal to the amount of the commitment. Losses may arise due to changes in the value of the underlying securities or if the counterparty does not perform under the contract's terms, or if the issuer does not issue the securities due to political, economic, or other factors.
Restricted Securities. The Funds may invest in securities that are subject to legal or contractual restrictions on resale. These securities generally may be resold in transactions exempt from registration or to the public if the securities are registered. Disposal of these securities may involve time-consuming negotiations and expense, and prompt sale at an acceptable price may be difficult. Information regarding restricted securities is included at the end of each applicable Fund's Schedule of Investments.
4. Purchases and Sales of Investments.
Purchases and sales of securities, other than short-term securities, for the Income Fund aggregated $319,012,864 and $246,430,852, respectively.
5. Fees and Other Transactions with Affiliates.
Management Fee. Fidelity Management & Research Company (the investment adviser) and its affiliates provide the Funds with investment management related services for which the Funds pay a monthly management fee. The management fee is the sum of an individual fund fee rate and an annualized group fee rate. The individual fund fee rate is applied to each Fund's average net assets. The group fee rate is based upon the average net assets of all the mutual funds advised by the investment adviser, including any mutual funds previously advised by the investment adviser that are currently advised by Fidelity SelectCo, LLC, an affiliate of the investment adviser. The group fee rate decreases as assets under management increase and increases as assets under management decrease. For the reporting period, each Fund's annual management fee rate expressed as a percentage of each Fund's average net assets was as follows.
| | Individual Rate | Group Rate | Total |
| Fidelity Massachusetts Municipal Income Fund | .25% | .11% | .36% |
| Fidelity Massachusetts Municipal Money Market Fund | .25% | .11% | .36% |
Transfer Agent Fees. Pursuant to the transfer agent contract approved by the Board of Trustees effective May 1, 2015, Fidelity Investments Institutional Operations Company, Inc. (FIIOC), an affiliate of the investment adviser, is the transfer, dividend disbursing and shareholder servicing agent for the Funds. FIIOC receives account fees and asset-based fees that vary according to account size and type of account. FIIOC pays for typesetting, printing and mailing of shareholder reports, except proxy statements. For the period, the transfer agent fees were equivalent to the following annual rates expressed as a percentage of average net assets:
| Fidelity Massachusetts Municipal Income Fund | .07% |
| Fidelity Massachusetts Municipal Money Market Fund | .12% |
Prior to May 1, 2015, Citibank, N.A. was the transfer, dividend disbursing and shareholder servicing agent for the Funds. Prior to May 8, 2015, Citibank, N.A. was the custodian for the Funds.
Accounting Fees. Fidelity Service Company, Inc. (FSC), an affiliate of the investment adviser, maintains each Fund's accounting records. The fee is based on the level of average net assets for each month.
Interfund Trades. The Funds may purchase from or sell securities to other Fidelity Funds under procedures adopted by the Board. The procedures have been designed to ensure these interfund trades are executed in accordance with Rule 17a-7 of the 1940 Act. For the Income Fund, interfund trades are included within the respective purchases and sales amounts shown in the Purchases and Sales of Investments note.
6. Committed Line of Credit.
The Income Fund participates with other funds managed by the investment adviser or an affiliate in a $4.25 billion credit facility (the "line of credit") to be utilized for temporary or emergency purposes to fund shareholder redemptions or for other short-term liquidity purposes. The participating funds have agreed to pay commitment fees on their pro-rata portion of the line of credit, which are reflected in Miscellaneous expenses on the Statement of Operations, and are as follows:
| Fidelity Massachusetts Municipal Income Fund | $3,156 |
During the period, the Income Fund did not borrow on this line of credit.
7. Expense Reductions.
The investment adviser or its affiliates voluntarily agreed to waive certain fees for the Money Market Fund in order to maintain a minimum annualized yield of .01%. Such arrangements may be discontinued by the investment adviser at any time. For the period, the amount of the waiver was $28,439,552.
Through arrangements with the Income Fund's and Money Market Fund's custodian, credits realized as a result of certain uninvested cash balances were used to reduce fund expenses. These expense reductions are noted in the table below.
| | Custody
expense
reduction |
| Fidelity Massachusetts Municipal Income Fund | $15,035 |
| Fidelity Massachusetts Municipal Money Market Fund | 43,364 |
In addition, during the period the investment adviser reimbursed and/or waived a portion of operating expenses as follows:
| | Amount |
| Fidelity Massachusetts Municipal Income Fund | $9,453 |
| Fidelity Massachusetts Municipal Money Market Fund | 27,783 |
8. Other.
The Funds' organizational documents provide former and current trustees and officers with a limited indemnification against liabilities arising in connection with the performance of their duties to the Funds. In the normal course of business, the Funds may also enter into contracts that provide general indemnifications. The Funds' maximum exposure under these arrangements is unknown as this would be dependent on future claims that may be made against the Funds. The risk of material loss from such claims is considered remote.
Report of Independent Registered Public Accounting Firm
To the Trustees of Fidelity Massachusetts Municipal Trust and the Shareholders of Fidelity Massachusetts Municipal Income Fund and Fidelity Massachusetts Municipal Money Market Fund:
We have audited the accompanying statements of assets and liabilities of Fidelity Massachusetts Municipal Income Fund and Fidelity Massachusetts Municipal Money Market Fund (the Funds), each a fund of Fidelity Massachusetts Municipal Trust, including the schedules of investments, as of January 31, 2016, and the related statements of operations for the year then ended, the statements of changes in net assets for each of the two years in the period then ended, and the financial highlights for each of the five years in the period then ended. These financial statements and financial highlights are the responsibility of the Funds' management. Our responsibility is to express an opinion on these financial statements and financial highlights based on our audits.
We conducted our audits in accordance with the standards of the Public Company Accounting Oversight Board (United States). Those standards require that we plan and perform the audit to obtain reasonable assurance about whether the financial statements and financial highlights are free of material misstatement. The Funds are not required to have, nor were we engaged to perform, an audit of their internal control over financial reporting. Our audits included consideration of internal control over financial reporting as a basis for designing audit procedures that are appropriate in the circumstances, but not for the purpose of expressing an opinion on the effectiveness of the Funds' internal control over financial reporting. Accordingly, we express no such opinion. An audit also includes examining, on a test basis, evidence supporting the amounts and disclosures in the financial statements, assessing the accounting principles used and significant estimates made by management, as well as evaluating the overall financial statement presentation. Our procedures included confirmation of securities owned as of January 31, 2016, by correspondence with the custodians and brokers; when replies were not received from brokers, we performed other auditing procedures. We believe that our audits provide a reasonable basis for our opinion.
In our opinion, such financial statements and financial highlights referred to above present fairly, in all material respects, the financial position of Fidelity Massachusetts Municipal Income Fund and Fidelity Massachusetts Municipal Money Market as of January 31, 2016, the results of their operations for the year then ended, the changes in their net assets for each of the two years in the period then ended, and the financial highlights for each of the five years in the period then ended, in conformity with accounting principles generally accepted in the United States of America.
DELOITTE & TOUCHE LLP
Boston, Massachusetts
March 15, 2016
Trustees and Officers
The Trustees, Members of the Advisory Board (if any), and officers of the trust and fund, as applicable, are listed below. The Board of Trustees governs the fund and is responsible for protecting the interests of shareholders. The Trustees are experienced executives who meet periodically throughout the year to oversee the fund's activities, review contractual arrangements with companies that provide services to the fund, oversee management of the risks associated with such activities and contractual arrangements, and review the fund's performance. Except for Elizabeth S. Acton, John Engler, and Geoffrey A. von Kuhn, each of the Trustees oversees 239 funds. Ms. Acton and Mr. Engler each oversees 234 funds. Mr. von Kuhn oversees 163 funds.
The Trustees hold office without limit in time except that (a) any Trustee may resign; (b) any Trustee may be removed by written instrument, signed by at least two-thirds of the number of Trustees prior to such removal; (c) any Trustee who requests to be retired or who has become incapacitated by illness or injury may be retired by written instrument signed by a majority of the other Trustees; and (d) any Trustee may be removed at any special meeting of shareholders by a two-thirds vote of the outstanding voting securities of the trust. Each Trustee who is not an interested person (as defined in the 1940 Act) of the trust and the fund is referred to herein as an Independent Trustee. Each Independent Trustee shall retire not later than the last day of the calendar year in which his or her 75th birthday occurs. The Independent Trustees may waive this mandatory retirement age policy with respect to individual Trustees. Officers and Advisory Board Members hold office without limit in time, except that any officer or Advisory Board Member may resign or may be removed by a vote of a majority of the Trustees at any regular meeting or any special meeting of the Trustees. Except as indicated, each individual has held the office shown or other offices in the same company for the past five years.
The fund’s Statement of Additional Information (SAI) includes more information about the Trustees. To request a free copy, call Fidelity at 1-800-544-8544.
Experience, Skills, Attributes, and Qualifications of the Trustees. The Governance and Nominating Committee has adopted a statement of policy that describes the experience, qualifications, attributes, and skills that are necessary and desirable for potential Independent Trustee candidates (Statement of Policy). The Board believes that each Trustee satisfied at the time he or she was initially elected or appointed a Trustee, and continues to satisfy, the standards contemplated by the Statement of Policy. The Governance and Nominating Committee also engages professional search firms to help identify potential Independent Trustee candidates who have the experience, qualifications, attributes, and skills consistent with the Statement of Policy. From time to time, additional criteria based on the composition and skills of the current Independent Trustees, as well as experience or skills that may be appropriate in light of future changes to board composition, business conditions, and regulatory or other developments, have also been considered by the professional search firms and the Governance and Nominating Committee. In addition, the Board takes into account the Trustees' commitment and participation in Board and committee meetings, as well as their leadership of standing and ad hoc committees throughout their tenure.
In determining that a particular Trustee was and continues to be qualified to serve as a Trustee, the Board has considered a variety of criteria, none of which, in isolation, was controlling. The Board believes that, collectively, the Trustees have balanced and diverse experience, qualifications, attributes, and skills, which allow the Board to operate effectively in governing the fund and protecting the interests of shareholders. Information about the specific experience, skills, attributes, and qualifications of each Trustee, which in each case led to the Board's conclusion that the Trustee should serve (or continue to serve) as a trustee of the fund, is provided below.
Board Structure and Oversight Function. Abigail P. Johnson is an interested person and currently serves as Chairman. The Trustees have determined that an interested Chairman is appropriate and benefits shareholders because an interested Chairman has a personal and professional stake in the quality and continuity of services provided to the fund. Independent Trustees exercise their informed business judgment to appoint an individual of their choosing to serve as Chairman, regardless of whether the Trustee happens to be independent or a member of management. The Independent Trustees have determined that they can act independently and effectively without having an Independent Trustee serve as Chairman and that a key structural component for assuring that they are in a position to do so is for the Independent Trustees to constitute a substantial majority for the Board. The Independent Trustees also regularly meet in executive session. Marie L. Knowles serves as Chairman of the Independent Trustees and as such (i) acts as a liaison between the Independent Trustees and management with respect to matters important to the Independent Trustees and (ii) with management prepares agendas for Board meetings.
Fidelity® funds are overseen by different Boards of Trustees. The fund's Board oversees Fidelity's investment-grade bond, money market, asset allocation and certain equity funds, and other Boards oversee Fidelity's high income, sector and other equity funds. The asset allocation funds may invest in Fidelity® funds that are overseen by such other Boards. The use of separate Boards, each with its own committee structure, allows the Trustees of each group of Fidelity® funds to focus on the unique issues of the funds they oversee, including common research, investment, and operational issues. On occasion, the separate Boards establish joint committees to address issues of overlapping consequences for the Fidelity® funds overseen by each Board.
The Trustees operate using a system of committees to facilitate the timely and efficient consideration of all matters of importance to the Trustees, the fund, and fund shareholders and to facilitate compliance with legal and regulatory requirements and oversight of the fund's activities and associated risks. The Board, acting through its committees, has charged FMR and its affiliates with (i) identifying events or circumstances the occurrence of which could have demonstrably adverse effects on the fund's business and/or reputation; (ii) implementing processes and controls to lessen the possibility that such events or circumstances occur or to mitigate the effects of such events or circumstances if they do occur; and (iii) creating and maintaining a system designed to evaluate continuously business and market conditions in order to facilitate the identification and implementation processes described in (i) and (ii) above. Because the day-to-day operations and activities of the fund are carried out by or through FMR, its affiliates, and other service providers, the fund's exposure to risks is mitigated but not eliminated by the processes overseen by the Trustees. While each of the Board's committees has responsibility for overseeing different aspects of the fund's activities, oversight is exercised primarily through the Operations and Audit Committees. In addition, an ad hoc Board committee of Independent Trustees has worked with FMR to enhance the Board's oversight of investment and financial risks, legal and regulatory risks, technology risks, and operational risks, including the development of additional risk reporting to the Board. The Operations Committee also worked and continues to work with FMR to enhance the stress tests required under SEC regulations for money market funds. Appropriate personnel, including but not limited to the fund's Chief Compliance Officer (CCO), FMR's internal auditor, the independent accountants, the fund's Treasurer and portfolio management personnel, make periodic reports to the Board's committees, as appropriate, including an annual review of Fidelity's risk management program for the Fidelity® funds. The responsibilities of each standing committee, including their oversight responsibilities, are described further under "Standing Committees of the Trustees."
Interested Trustees*:
Correspondence intended for a Trustee who is an interested person may be sent to Fidelity Investments, 245 Summer Street, Boston, Massachusetts 02210.
Name, Year of Birth; Principal Occupations and Other Relevant Experience+
Abigail P. Johnson (1961)
Year of Election or Appointment: 2009
Trustee
Chairman of the Board of Trustees
Ms. Johnson also serves as Trustee of other Fidelity® funds. Ms. Johnson serves as President (2013-present) and Chief Executive Officer (2014-present) of FMR LLC (diversified financial services company), President of Fidelity Financial Services (2012-present) and President of Personal, Workplace and Institutional Services (2005-present). Ms. Johnson is Chairman and Director of FMR Co., Inc. (investment adviser firm, 2011-present), Chairman and Director of FMR (investment adviser firm, 2011-present), and the Vice Chairman and Director (2007-present) of FMR LLC. Previously, Ms. Johnson served as President and a Director of FMR (2001-2005), a Trustee of other investment companies advised by FMR, Fidelity Investments Money Management, Inc. (investment adviser firm), and FMR Co., Inc. (2001-2005), Senior Vice President of the Fidelity® funds (2001-2005), and managed a number of Fidelity® funds. Ms. Abigail P. Johnson and Mr. Arthur E. Johnson are not related.
Geoffrey A. von Kuhn (1951)
Year of Election or Appointment: 2016
Trustee
Mr. von Kuhn also serves as Trustee or Member of the Advisory Board of other Fidelity funds. Mr. von Kuhn is Chief Administrative Officer for FMR LLC (diversified financial services company, 2013-present), a Director of Pembroke Real Estate, Inc. (2009-present), and a Director of Discovery Natural Resources LLC (2012-present). Previously, Mr. von Kuhn was a managing director of Crosby Group (private wealth management company, 2007-2013), a member of the management committee and senior executive in the Wealth Management Group of AmSouth Bank (2001-2006), and head of the U.S. private bank at Citigroup (2000-2001).
* Determined to be an “Interested Trustee” by virtue of, among other things, his or her affiliation with the trust or various entities under common control with FMR.
+ The information includes the Trustee's principal occupation during the last five years and other information relating to the experience, attributes, and skills relevant to the Trustee's qualifications to serve as a Trustee, which led to the conclusion that the Trustee should serve as a Trustee for the fund.
Independent Trustees:
Correspondence intended for an Independent Trustee may be sent to Fidelity Investments, P.O. Box 55235, Boston, Massachusetts 02205-5235.
Name, Year of Birth; Principal Occupations and Other Relevant Experience+
Elizabeth S. Acton (1951)
Year of Election or Appointment: 2013
Trustee
Ms. Acton also serves as Trustee or Member of the Advisory Board of other Fidelity® funds. Prior to her retirement in April 2012, Ms. Acton was Executive Vice President, Finance (2011-2012), Executive Vice President, Chief Financial Officer (2002-2011), and Treasurer (2004-2005) of Comerica Incorporated (financial services). Prior to joining Comerica, Ms. Acton held a variety of positions at Ford Motor Company (1983-2002), including Vice President and Treasurer (2000-2002) and Executive Vice President and Chief Financial Officer of Ford Motor Credit Company (1998-2000). Ms. Acton currently serves as a member of the Board of Directors and Audit and Finance Committees of Beazer Homes USA, Inc. (homebuilding, 2012-present).
John Engler (1948)
Year of Election or Appointment: 2014
Trustee
Mr. Engler also serves as Trustee or Member of the Advisory Board of other Fidelity® funds. He serves as president of the Business Roundtable (2011-present), and on the board of directors for Universal Forest Products (manufacturer and distributor of wood and wood-alternative products, 2003-present) and K12 Inc. (technology-based education company, 2012-present). Previously, Mr. Engler served as a trustee of The Munder Funds (2003-2014), president and CEO of the National Association of Manufacturers (2004-2011), member of the Board of Trustees of the Annie E. Casey Foundation (2004-2015), and as governor of Michigan (1991-2003). He is a past chairman of the National Governors Association.
Albert R. Gamper, Jr. (1942)
Year of Election or Appointment: 2006
Trustee
Mr. Gamper also serves as Trustee of other Fidelity® funds. Prior to his retirement in December 2004, Mr. Gamper served as Chairman of the Board of CIT Group Inc. (commercial finance). During his tenure with CIT Group Inc. Mr. Gamper served in numerous senior management positions, including Chairman (1987-1989; 1999-2001; 2002-2004), Chief Executive Officer (1987-2004), and President (2002-2003). Mr. Gamper currently serves as a member of the Board of Directors of Public Service Enterprise Group (utilities, 2000-present), and Member of the Board of Trustees of Barnabas Health Care System (1997-present). Previously, Mr. Gamper served as Chairman (2012-2015) and Vice Chairman (2011-2012) of the Independent Trustees of certain Fidelity® funds and as Chairman of the Board of Governors, Rutgers University (2004-2007).
Robert F. Gartland (1951)
Year of Election or Appointment: 2010
Trustee
Mr. Gartland also serves as Trustee of other Fidelity® funds. Mr. Gartland is Chairman and an investor in Gartland and Mellina Group Corp. (consulting, 2009-present). Previously, Mr. Gartland served as a partner and investor of Vietnam Partners LLC (investments and consulting, 2008-2011). Prior to his retirement, Mr. Gartland held a variety of positions at Morgan Stanley (financial services, 1979-2007) including Managing Director (1987-2007).
Arthur E. Johnson (1947)
Year of Election or Appointment: 2008
Trustee
Vice Chairman of the Independent Trustees
Mr. Johnson also serves as Trustee of other Fidelity® funds. Mr. Johnson serves as a member of the Board of Directors of Eaton Corporation plc (diversified power management, 2009-present), AGL Resources, Inc. (holding company, 2002-present) and Booz Allen Hamilton (management consulting, 2011-present). Prior to his retirement, Mr. Johnson served as Senior Vice President of Corporate Strategic Development of Lockheed Martin Corporation (defense contractor, 1999-2009). He previously served on the Board of Directors of IKON Office Solutions, Inc. (1999-2008) and Delta Airlines (2005-2007). Mr. Arthur E. Johnson is not related to Ms. Abigail P. Johnson.
Michael E. Kenneally (1954)
Year of Election or Appointment: 2009
Trustee
Mr. Kenneally also serves as Trustee of other Fidelity® funds. Prior to his retirement, Mr. Kenneally served as Chairman and Global Chief Executive Officer of Credit Suisse Asset Management. Before joining Credit Suisse, he was an Executive Vice President and Chief Investment Officer for Bank of America Corporation. Earlier roles at Bank of America included Director of Research, Senior Portfolio Manager and Research Analyst, and Mr. Kenneally was awarded the Chartered Financial Analyst (CFA) designation in 1991.
James H. Keyes (1940)
Year of Election or Appointment: 2007
Trustee
Mr. Keyes also serves as Trustee of other Fidelity® funds. Mr. Keyes serves as a member of the Board and Non-Executive Chairman of Navistar International Corporation (manufacture and sale of trucks, buses, and diesel engines, since 2002). Previously, Mr. Keyes served as a member of the Board of Pitney Bowes, Inc. (integrated mail, messaging, and document management solutions, 1998-2013). Prior to his retirement, Mr. Keyes served as Chairman (1993-2002) and Chief Executive Officer (1988-2002) of Johnson Controls (automotive, building, and energy) and as a member of the Board of LSI Logic Corporation (semiconductor technologies, 1984-2008).
Marie L. Knowles (1946)
Year of Election or Appointment: 2001
Trustee
Chairman of the Independent Trustees
Ms. Knowles also serves as Trustee of other Fidelity® funds. Prior to Ms. Knowles' retirement in June 2000, she served as Executive Vice President and Chief Financial Officer of Atlantic Richfield Company (ARCO) (diversified energy, 1996-2000). From 1993 to 1996, she was a Senior Vice President of ARCO and President of ARCO Transportation Company (pipeline and tanker operations). Ms. Knowles currently serves as a Director and Chairman of the Audit Committee of McKesson Corporation (healthcare service, since 2002). Ms. Knowles is a member of the Board of the Santa Catalina Island Company (real estate, 2009-present). Ms. Knowles is a Member of the Investment Company Institute Board of Governors and a Member of the Governing Council of the Independent Directors Council (2014-present). She also serves as a member of the Advisory Board for the School of Engineering of the University of Southern California. Previously, Ms. Knowles served as a Director of Phelps Dodge Corporation (copper mining and manufacturing, 1994-2007), URS Corporation (engineering and construction, 2000-2003) and America West (airline, 1999-2002). Ms. Knowles previously served as Vice Chairman of the Independent Trustees of certain Fidelity® funds (2012-2015).
+ The information includes the Trustee's principal occupation during the last five years and other information relating to the experience, attributes, and skills relevant to the Trustee's qualifications to serve as a Trustee, which led to the conclusion that the Trustee should serve as a Trustee for the fund.
Advisory Board Members and Officers:
Correspondence intended for an officer may be sent to Fidelity Investments, 245 Summer Street, Boston, Massachusetts 02210. Officers appear below in alphabetical order.
Name, Year of Birth; Principal Occupation
Marc R. Bryant (1966)
Year of Election or Appointment: 2015
Secretary and Chief Legal Officer (CLO)
Mr. Bryant also serves as Secretary and CLO of other funds. Mr. Bryant serves as CLO, Secretary, and Senior Vice President of Fidelity Management & Research Company (investment adviser firm, 2015-present) and FMR Co., Inc. (investment adviser firm, 2015-present); Secretary of Fidelity SelectCo, LLC (investment adviser firm, 2015-present) and Fidelity Investments Money Management, Inc. (investment adviser firm, 2015-present); and CLO of Fidelity Management & Research (Hong Kong) Limited (investment adviser firm, 2015-present). He is Senior Vice President and Deputy General Counsel of FMR LLC (diversified financial services company). Previously, Mr. Bryant served as Secretary and CLO of Fidelity Rutland Square Trust II (2010-2014) and Assistant Secretary of Fidelity's Fixed Income and Asset Allocation Funds (2013-2015). Prior to joining Fidelity Investments, Mr. Bryant served as a Senior Vice President and the Head of Global Retail Legal for AllianceBernstein L.P. (2006-2010), and as the General Counsel for ProFund Advisors LLC (2001-2006).
Jonathan Davis (1968)
Year of Election or Appointment: 2010
Assistant Treasurer
Mr. Davis also serves as Assistant Treasurer of other funds, and is an employee of Fidelity Investments. Previously, Mr. Davis served as Vice President and Associate General Counsel of FMR LLC (diversified financial services company, 2003-2010).
Adrien E. Deberghes (1967)
Year of Election or Appointment: 2010
Assistant Treasurer
Mr. Deberghes also serves as an officer of other funds. He is an employee of Fidelity Investments (2008-present). Prior to joining Fidelity Investments, Mr. Deberghes was Senior Vice President of Mutual Fund Administration at State Street Corporation (2007-2008), Senior Director of Mutual Fund Administration at Investors Bank & Trust (2005-2007), and Director of Finance for Dunkin' Brands (2000-2005).
Stephanie J. Dorsey (1969)
Year of Election or Appointment: 2013
President and Treasurer
Ms. Dorsey also serves as an officer of other funds. She is an employee of Fidelity Investments (2008-present) and has served in other fund officer roles. Prior to joining Fidelity Investments, Ms. Dorsey served as Treasurer (2004-2008) of the JPMorgan Mutual Funds and Vice President (2004-2008) of JPMorgan Chase Bank.
Howard J. Galligan III (1966)
Year of Election or Appointment: 2014
Chief Financial Officer
Mr. Galligan also serves as Chief Financial Officer of other funds. Mr. Galligan serves as President of Fidelity Pricing and Cash Management Services (FPCMS) (2014-present) and as a Director of Strategic Advisers, Inc. (investment adviser firm, 2008-present). Previously, Mr. Galligan served as Chief Administrative Officer of Asset Management (2011-2014) and Chief Operating Officer and Senior Vice President of Investment Support for Strategic Advisers, Inc. (2003-2011).
Scott C. Goebel (1968)
Year of Election or Appointment: 2015
Vice President
Mr. Goebel serves as Vice President of other funds and is an employee of Fidelity Investments (2001-present). Previously, Mr. Goebel served as Secretary of Fidelity SelectCo, LLC (investment adviser firm, 2013-2015), Fidelity Investments Money Management, Inc. (FIMM) (investment adviser firm, 2010-2015), and Fidelity Research and Analysis Company (FRAC) (investment adviser firm, 2010-2015); General Counsel, Secretary, and Senior Vice President of Fidelity Management & Research Company (investment adviser firm, 2008-2015) and FMR Co., Inc. (investment adviser firm, 2008-2015); Assistant Secretary of Fidelity Management & Research (Japan) Limited (investment adviser firm, 2008-2015) and FMR Investment Management (U.K.) Limited (investment adviser firm, 2008-2015); Chief Legal Officer (CLO) of Fidelity Management & Research (Hong Kong) Limited (investment adviser firm, 2008-2015); Secretary and CLO of certain Fidelity® funds (2008-2015); Assistant Secretary of FIMM (2008-2010), FRAC (2008-2010), and certain funds (2007-2008); and as Vice President and Secretary of Fidelity Distributors Corporation (FDC) (2005-2007).
Timothy Huyck (1964)
Year of Election or Appointment: 2015
Vice President of Fidelity's Money Market Funds
Mr. Huyck also serves as Vice President of other funds. Mr. Huyck serves as Chief Investment Officer of Fidelity's Money Market Funds (2015-present) and is an employee of Fidelity Investments (1990-present).
Chris Maher (1972)
Year of Election or Appointment: 2013
Assistant Treasurer
Mr. Maher serves as Assistant Treasurer of other funds. Mr. Maher is Vice President of Valuation Oversight and is an employee of Fidelity Investments. Previously, Mr. Maher served as Vice President of Asset Management Compliance (2013), Vice President of the Program Management Group of FMR (investment adviser firm, 2010-2013), and Vice President of Valuation Oversight (2008-2010).
Jason P. Pogorelec (1975)
Year of Election or Appointment: 2015
Assistant Secretary
Mr. Pogorelec also serves as Assistant Secretary of other funds. Mr. Pogorelec serves as Vice President, Associate General Counsel (2010-present) and is an employee of Fidelity Investments (2006-present).
John F. Papandrea (1972)
Year of Election or Appointment: 2016
Anti-Money Laundering (AML) Officer
Mr. Papandrea also serves as AML Officer of other funds. Mr. Papandrea is Vice President of FMR LLC (diversified financial services company, 2008-present) and is an employee of Fidelity Investments (2005-present).
Nancy D. Prior (1967)
Year of Election or Appointment: 2014
Vice President
Ms. Prior also serves as Vice President of other funds. Ms. Prior serves as a Director of Fidelity Investments Money Management, Inc. (FIMM) (investment adviser firm, 2014-present), President, Fixed Income (2014-present), Vice Chairman of FIAM LLC (investment adviser firm, 2014-present), and is an employee of Fidelity Investments (2002-present). Previously, Ms. Prior served as Vice President of Fidelity's Money Market Funds (2012-2014), President, Money Market and Short Duration Bond Group of Fidelity Management & Research (FMR) (investment adviser firm, 2013-2014), President, Money Market Group of FMR (2011-2013), Managing Director of Research (2009-2011), Senior Vice President and Deputy General Counsel (2007-2009), and Assistant Secretary of other Fidelity® funds (2008-2009).
Kenneth B. Robins (1969)
Year of Election or Appointment: 2009
Assistant Treasurer
Mr. Robins also serves as an officer of other funds. Mr. Robins serves as Executive Vice President of Fidelity Investments Money Management, Inc. (FIMM) (investment adviser firm, 2013-present) and is an employee of Fidelity Investments (2004-present). Previously, Mr. Robins served in other fund officer roles.
Stacie M. Smith (1974)
Year of Election or Appointment: 2013
Assistant Treasurer
Ms. Smith also serves as an officer of other funds. She is an employee of Fidelity Investments (2009-present) and has served in other fund officer roles. Prior to joining Fidelity Investments, Ms. Smith served as Senior Audit Manager of Ernst & Young LLP (1996-2009).
Renee Stagnone (1975)
Year of Election or Appointment: 2013
Deputy Treasurer
Ms. Stagnone also serves as Deputy Treasurer of other funds. Ms. Stagnone is an employee of Fidelity Investments (1997-present).
Christine J. Thompson (1958)
Year of Election or Appointment: 2015
Vice President of Fidelity's Bond Funds
Ms. Thompson also serves as Vice President of other funds. Ms. Thompson also serves as Chief Investment Officer of FMR's Bond Group (2010-present) and is an employee of Fidelity Investments (1985-present). Previously, Ms. Thompson served as Vice President of Fidelity's Bond Funds (2010-2012).
Michael H. Whitaker (1967)
Year of Election or Appointment: 2008
Chief Compliance Officer
Mr. Whitaker also serves as Chief Compliance Officer of other funds. Mr. Whitaker also serves as Compliance Officer of FMR Co., Inc. (investment adviser firm, 2014-present), FMR (investment adviser firm, 2014-present), and Fidelity Investments Money Management, Inc. (investment adviser firm, 2014-present) and is an employee of Fidelity Investments (2007-present). Prior to joining Fidelity Investments, Mr. Whitaker worked at MFS Investment Management where he served as Senior Vice President and Chief Compliance Officer (2004-2006), and Assistant General Counsel.
Joseph F. Zambello (1957)
Year of Election or Appointment: 2011
Deputy Treasurer
Mr. Zambello also serves as Deputy Treasurer of other funds. Mr. Zambello is an employee of Fidelity Investments (1991-present). Previously, Mr. Zambello served as Vice President of the Program Management Group of FMR (investment adviser firm, 2009-2011) and Vice President of the Transfer Agent Oversight Group (2005-2009).
Shareholder Expense Example
As a shareholder of a Fund, you incur two types of costs: (1) transaction costs, including redemption fees and (2) ongoing costs, including management fees and other Fund expenses. This Example is intended to help you understand your ongoing costs (in dollars) of investing in the Funds and to compare these costs with the ongoing costs of investing in other mutual funds.
The Example is based on an investment of $1,000 invested at the beginning of the period and held for the entire period (August 1, 2015 to January 31, 2016).
Actual Expenses
The first line of the accompanying table for each fund provides information about actual account values and actual expenses. You may use the information in this line, together with the amount you invested, to estimate the expenses that you paid over the period. Simply divide your account value by $1,000.00 (for example, an $8,600 account value divided by $1,000.00 = 8.6), then multiply the result by the number in the first line for a fund under the heading entitled "Expenses Paid During Period" to estimate the expenses you paid on your account during this period. A small balance maintenance fee of $12.00 that is charged once a year may apply for certain accounts with a value of less than $2,000. This fee is not included in the table below. If it was, the estimate of expenses you paid during the period would be higher, and your ending account value lower, by this amount. In addition, each Fund, as a shareholder in the underlying Fidelity Central Funds, will indirectly bear its pro-rata share of the fees and expenses incurred by the underlying Fidelity Central Funds. These fees and expenses are not included in the Fund's annualized expense ratio used to calculate the expense estimate in the table below.
Hypothetical Example for Comparison Purposes
The second line of the accompanying table for each fund provides information about hypothetical account values and hypothetical expenses based on a fund's actual expense ratio and an assumed rate of return of 5% per year before expenses, which is not the Fund's actual return. The hypothetical account values and expenses may not be used to estimate the actual ending account balance or expenses you paid for the period. You may use this information to compare the ongoing costs of investing in the Fund and other funds. To do so, compare this 5% hypothetical example with the 5% hypothetical examples that appear in the shareholder reports of the other funds. A small balance maintenance fee of $12.00 that is charged once a year may apply for certain accounts with a value of less than $2,000. This fee is not included in the table below. If it was, the estimate of expenses you paid during the period would be higher, and your ending account value lower, by this amount. In addition, each Fund, as a shareholder in the underlying Fidelity Central Funds, will indirectly bear its pro-rata share of the fees and expenses incurred by the underlying Fidelity Central Funds. These fees and expenses are not included in the Fund's annualized expense ratio used to calculate the expense estimate in the table below.
Please note that the expenses shown in the table are meant to highlight your ongoing costs only and do not reflect any transaction costs. Therefore, the second line of the table is useful in comparing ongoing costs only, and will not help you determine the relative total costs of owning different funds. In addition, if these transactional costs were included, your costs would have been higher.
| | Annualized Expense Ratio-A | Beginning
Account Value
August 1, 2015 | Ending
Account Value
January 31, 2016 | Expenses Paid
During Period-B
August 1, 2015
to January 31, 2016 |
| Fidelity Massachusetts Municipal Income Fund | .46% | | | |
| Actual | | $1,000.00 | $1,037.20 | $2.36 |
| Hypothetical-C | | $1,000.00 | $1,022.89 | $2.35 |
| Fidelity Massachusetts Municipal Money Market Fund | .04% | | | |
| Actual | | $1,000.00 | $1,000.10 | $.20 |
| Hypothetical-C | | $1,000.00 | $1,025.00 | $.20 |
A Annualized expense ratio reflects expenses net of applicable fee waivers.
B Expenses are equal to each Fund's annualized expense ratio, multiplied by the average account value over the period, multiplied by 184/365 (to reflect the one-half year period).
C 5% return per year before expenses
Distributions (Unaudited)
The Board of Trustees of each fund voted to pay to shareholders of record at the opening of business on record date, the following distributions per share derived from capital gains realized from sales of portfolio securities:
| Fund | Pay Date | Record Date | Capital Gains |
| Fidelity Massachusetts Municipal Income Fund | 03/14/16 | 03/11/16 | $0.01500 |
| Fidelity Massachusetts Municipal Money Market Fund | 03/14/16 | 03/11/16 | $0.00009 |
The funds hereby designate as capital gain dividend the amounts noted below for the taxable year ended January 31, 2016, or, if subsequently determined to be different, the net capital gain of such year.
| Fund | |
| Fidelity Massachusetts Municipal Income Fund | $10,306,442 |
|
| Fidelity Massachusetts Municipal Money Market Fund | $910,506 |
During fiscal year ended 2016, 100% of each fund's income dividends were free from federal income tax, and 3.88% and 10.98% of Fidelity Massachusetts Municipal Income Fund and Fidelity Massachusetts Municipal Money Market Fund's income dividends, respectively, were subject to the federal alternative minimum tax.
The fund will notify shareholders in January 2017 of amounts for use in preparing 2016 income tax returns.
Board Approval of Investment Advisory Contracts and Management Fees
Fidelity Massachusetts Municipal Income Fund / Fidelity Massachusetts Municipal Money Market Fund
Each year, the Board of Trustees, including the Independent Trustees (together, the Board), votes on the renewal of the management contract with Fidelity Management & Research Company (FMR) and the sub-advisory agreements (together, the Advisory Contracts) for each fund. The Board, assisted by the advice of fund counsel and Independent Trustees' counsel, requests and considers a broad range of information relevant to the renewal of the Advisory Contracts throughout the year.
The Board meets regularly and, at each of its meetings, covers an extensive agenda of topics and materials and considers factors that are relevant to its annual consideration of the renewal of each fund's Advisory Contracts, including the services and support provided to each fund and its shareholders. The Board has established four standing committees (Committees) — Operations, Audit, Fair Valuation, and Governance and Nominating — each composed of and chaired by Independent Trustees with varying backgrounds, to which the Board has assigned specific subject matter responsibilities in order to enhance effective decision-making by the Board. The Operations Committee, of which all of the Independent Trustees are members, meets regularly throughout the year and considers, among other matters, information specifically related to the annual consideration of the renewal of each fund's Advisory Contracts. The Board, acting directly and through its Committees, requests and receives information concerning the annual consideration of the renewal of each fund's Advisory Contracts. The Board also meets as needed to consider matters specifically related to the Board's annual consideration of the renewal of the Advisory Contracts. Members of the Board may also meet with trustees of other Fidelity funds through ad hoc joint committees to discuss certain matters relevant to all of the Fidelity funds.
At its September 2015 meeting, the Board unanimously determined to renew each fund's Advisory Contracts. In reaching its determination, the Board considered all factors it believed relevant, including (i) the nature, extent, and quality of the services to be provided to each fund and its shareholders (including the investment performance of each fund); (ii) the competitiveness of each fund's management fee and total expense ratio relative to peer funds; (iii) the total costs of the services to be provided by and the profits to be realized by Fidelity from its relationship with each fund; and (iv) the extent to which (if any) economies of scale exist and would be realized as each fund grows, and whether any economies of scale are appropriately shared with fund shareholders.
In considering whether to renew the Advisory Contracts for each fund, the Board reached a determination, with the assistance of fund counsel and Independent Trustees' counsel and through the exercise of its business judgment, that the renewal of the Advisory Contracts was in the best interests of each fund and its shareholders and that the compensation payable under the Advisory Contracts was fair and reasonable. The Board's decision to renew the Advisory Contracts was not based on any single factor, but rather was based on a comprehensive consideration of all the information provided to the Board at its meetings throughout the year. The Board, in reaching its determination to renew the Advisory Contracts, was aware that shareholders of each fund have a broad range of investment choices available to them, including a wide choice among funds offered by Fidelity's competitors, and that each fund's shareholders, who have the opportunity to review and weigh the disclosure provided by the fund in its prospectus and other public disclosures, have chosen to invest in that fund, which is part of the Fidelity family of funds.
Nature, Extent, and Quality of Services Provided. The Board considered Fidelity's staffing as it relates to the funds, including the backgrounds of investment personnel of Fidelity, and also considered the funds' investment objectives, strategies, and related investment philosophies. The Independent Trustees also had discussions with senior management of Fidelity's investment operations and investment groups. The Board considered the structure of the portfolio manager compensation program and whether this structure provides appropriate incentives to act in the best interests of each fund. Additionally, the Board considered the portfolio managers' investments, if any, in the funds that they manage.
Resources Dedicated to Investment Management and Support Services. The Board reviewed the general qualifications and capabilities of Fidelity's investment staff, including its size, education, experience, and resources, as well as Fidelity's approach to recruiting, training, managing, and compensating investment personnel. The Board noted that Fidelity has continued to increase the resources devoted to non-U.S. offices, including expansion of Fidelity's global investment organization. The Board also noted that Fidelity's analysts have extensive resources, tools and capabilities that allow them to conduct sophisticated quantitative and fundamental analysis, as well as credit analysis of issuers, counterparties and guarantors. Further, the Board considered that Fidelity's investment professionals have sufficient access to global information and data so as to provide competitive investment results over time, and that those professionals also have access to sophisticated tools that permit them to assess portfolio construction and risk and performance attribution characteristics continuously, as well as to transmit new information and research conclusions rapidly around the world. Additionally, in its deliberations, the Board considered Fidelity's trading, risk management, compliance, and technology and operations capabilities and resources, which are integral parts of the investment management process.
Shareholder and Administrative Services. The Board considered (i) the nature, extent, quality, and cost of advisory, administrative, and shareholder services performed by FMR, the sub-advisers (together with FMR, the Investment Advisers), and their affiliates under the Advisory Contracts and under separate agreements covering transfer agency and pricing and bookkeeping services for each fund; (ii) the nature and extent of the supervision of third party service providers, principally custodians, subcustodians, and pricing vendors; and (iii) the resources devoted to, and the record of compliance with, each fund's compliance policies and procedures.
The Board noted that the growth of fund assets over time across the complex allows Fidelity to reinvest in the development of services designed to enhance the value or convenience of the Fidelity funds as investment vehicles. These services include 24-hour access to account information and market information through telephone representatives and over the Internet, investor education materials and asset allocation tools, and the expanded availability of Fidelity Investor Centers.
Investment in a Large Fund Family. The Board considered the benefits to shareholders of investing in a Fidelity fund, including the benefits of investing in a fund that is part of a large family of funds offering a variety of investment disciplines and providing a large variety of mutual fund investor services. The Board noted that Fidelity had taken, or had made recommendations that resulted in the Fidelity funds taking, a number of actions over the previous year that benefited particular funds, including (i) continuing to dedicate additional resources to investment research and to the support of the senior management team that oversees asset management; (ii) continuing efforts to enhance Fidelity's global research capabilities; (iii) launching new funds and making other enhancements to meet client needs; (iv) reducing management fees and total expenses for certain index funds and diversified international funds; (v) continuing to launch dedicated lower cost underlying funds to meet portfolio construction needs related to expanding underlying fund options for Fidelity funds of funds, specifically for the Freedom Fund product lines; (vi) rationalizing product lines and gaining increased efficiencies through fund mergers; (vii) launching active fixed-income exchange-traded funds; (viii) continuing to develop, acquire and implement systems and technology to improve services to the funds and shareholders, strengthen information security, and increase efficiency; (ix) implementing investment enhancements to further strengthen Fidelity's target date product line to increase investors' probability of success in achieving their goals; (x) modifying the eligibility criteria for certain share classes to accommodate roll-over assets from employer-sponsored retirement plans; (xi) launching a new Class W of the Freedom Index Funds to attract and retain Fidelity record-kept retirement plan assets; and (xii) implementing changes to Fidelity's money market product line in response to recent money market regulatory reforms.
Investment Performance (for Fidelity Massachusetts Municipal Income Fund). The Board considered whether the fund has operated in accordance with its investment objective, as well as its record of compliance with its investment restrictions and its performance history.
The Board took into account discussions with representatives of the Investment Advisers about fund investment performance that occur at Board meetings throughout the year. In this regard the Board noted that as part of regularly scheduled fund reviews and other reports to the Board on fund performance, the Board considers annualized return information for the fund for different time periods, measured against a securities market index ("benchmark index") and a peer group of funds with similar objectives ("peer group"), if any. In its evaluation of fund investment performance at meetings throughout the year, the Board gave particular attention to information indicating underperformance of certain Fidelity funds for specific time periods and discussed with the Investment Advisers the reasons for such underperformance.
In addition to reviewing absolute and relative fund performance, the Independent Trustees periodically consider the appropriateness of fund performance metrics in evaluating the results achieved. In general, the Independent Trustees believe that fund performance should be evaluated based on gross performance (before fees and expenses but after transaction costs) compared to appropriate benchmark indices, over appropriate time periods that may include full market cycles, and on net performance (after fees and expenses) compared to peer groups, as applicable, over the same periods, taking into account relevant factors including the following: general market conditions; expectations for interest rate levels and credit conditions; issuer-specific information including credit quality; the potential for incremental return versus the fund's benchmark index weighed against the risks involved in obtaining that incremental return, including the risk of diminished or negative total returns; and fund cash flows and other factors. Depending on the circumstances, the Independent Trustees may be satisfied with a fund's performance notwithstanding that it lags its benchmark index or peer group for certain periods.
The Independent Trustees recognize that shareholders evaluate performance on a net basis over their own holding periods, for which one-, three-, and five-year periods are often used as a proxy. For this reason, the performance information reviewed by the Board also included net cumulative calendar year total return information for the fund and an appropriate benchmark index and peer group for the most recent one-, three-, and five-year periods.
Investment Performance (for Fidelity Massachusetts Municipal Money Market Fund). The Board considered whether the fund has operated in accordance with its investment objective, as well as its record of compliance with its investment restrictions and its performance history.
The Board took into account discussions with representatives of the Investment Advisers about fund investment performance that occur at Board meetings throughout the year. In this regard the Board noted that as part of regularly scheduled fund reviews and other reports to the Board on fund performance, the Board considers annualized return information for the fund for different time periods, measured against a peer group of funds with similar objectives ("peer group").
In addition to reviewing absolute and relative fund performance, the Independent Trustees periodically consider the appropriateness of fund performance metrics in evaluating the results achieved. In general, the Independent Trustees believe that fund performance should be evaluated based on gross performance (before fees and expenses but after transaction costs) compared to appropriate peer groups, over appropriate time periods that may include full market cycles, taking into account relevant factors including the following: general market conditions; expectations for interest rate levels and credit conditions; issuer-specific information including credit quality; the fund's market value NAV over time and its resilience under various stressed conditions; and fund cash flows and other factors.
The Board recognizes that in interest rate environments where many competitors waive fees to maintain a minimum yield, relative money market fund performance on a net basis (after fees and expenses) may not be particularly meaningful due to miniscule performance differences among competitor funds. Depending on the circumstances, the Independent Trustees may be satisfied with a fund's performance notwithstanding that it lags its peer group for certain periods.
The Independent Trustees recognize that shareholders evaluate performance on a net basis over their own holding periods, for which one-, three-, and five-year periods are often used as a proxy. For this reason, the performance information reviewed by the Board also included net cumulative calendar year total return information for the fund and an appropriate peer group for the most recent one-, three-, and five-year periods.
Based on its review, the Board concluded that the nature, extent, and quality of services provided to each fund under the Advisory Contracts should benefit the shareholders of each fund.
Competitiveness of Management Fee and Total Expense Ratio. The Board considered each fund's management fee and total expense ratio compared to "mapped groups" of competitive funds and classes created for the purpose of facilitating the Trustees' competitive analysis of management fees and total expenses. Fidelity creates "mapped groups" by combining similar Lipper investment objective categories that have comparable investment mandates. Combining Lipper investment objective categories aids the Board's management fee and total expense ratio comparisons by broadening the competitive group used for comparison.
Management Fee. The Board considered two proprietary management fee comparisons for the 12-month periods shown in basis points (BP) in the charts below. The group of Lipper funds used by the Board for management fee comparisons is referred to below as the "Total Mapped Group" and, for the reasons explained above, is broader than the Lipper peer group used by the Board for performance comparisons. The Total Mapped Group comparison focuses on a fund's standing in terms of gross management fees before expense reimbursements or caps relative to the total universe of funds with comparable investment mandates, regardless of whether their management fee structures also are comparable. Funds with comparable investment mandates offer exposure to similar types of securities. Funds with comparable management fee structures have similar management fee contractual arrangements (
e.g., flat rate charged for advisory services, all-inclusive fee rate,
etc.). "TMG %" represents the percentage of funds in the Total Mapped Group that had management fees that were lower than a fund's. For example, a hypothetical TMG % of 20% would mean that 80% of the funds in the Total Mapped Group had higher, and 20% had lower, management fees than a fund. The funds' actual TMG %s and the number of funds in the Total Mapped Group are in the charts below. The "Asset-Size Peer Group" (ASPG) comparison focuses on a fund's standing relative to a subset of non-Fidelity funds within the Total Mapped Group that are similar in size and management fee structure. For example, if a fund is in the first quartile of the ASPG, the fund's management fee ranks in the least expensive or lowest 25% of funds in the ASPG. The ASPG represents at least 15% of the funds in the Total Mapped Group with comparable asset size and management fee structures, subject to a minimum of 50 funds (or all funds in the Total Mapped Group if fewer than 50). Additional information, such as the ASPG quartile in which a fund's management fee rate ranked, is also included in the charts and considered by the Board.
Fidelity Massachusetts Municipal Income Fund
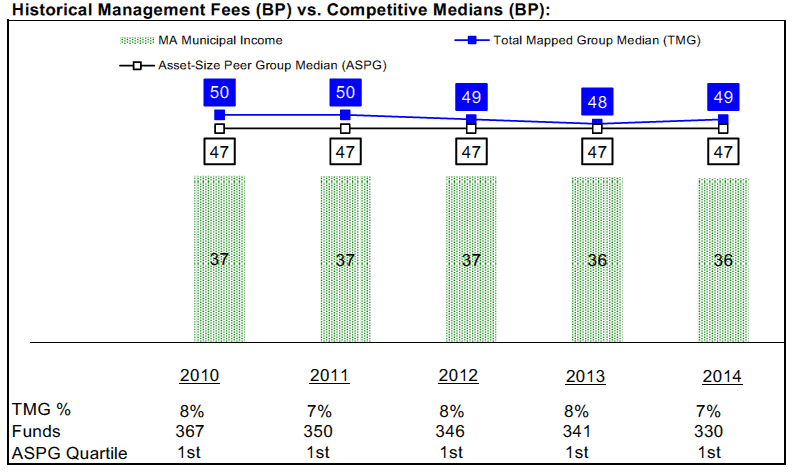
The Board noted that the fund's management fee rate ranked below the median of its Total Mapped Group and below the median of its ASPG for 2014.
Fidelity Massachusetts Municipal Money Market Fund
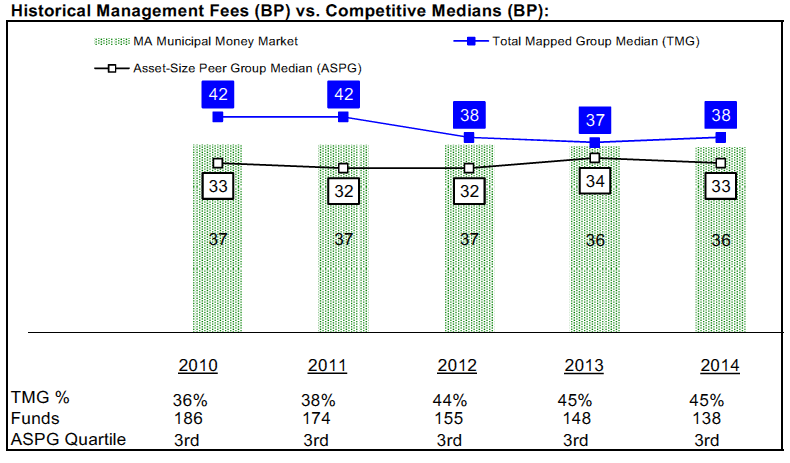
The Board noted that the fund's management fee rate ranked below the median of its Total Mapped Group and above the median of its ASPG for 2014. The Board noted that there is a relatively small number of state-specific funds in the Lipper objective.
The Board noted that, in 2014, the ad hoc Committee on Group Fee was formed by it and other Fidelity fund boards to conduct an in-depth review of the "group fee" component of the management fee of funds with such management fee structures. Committee focus included the mechanics of the group fee, the competitive landscape of group fee structures, Fidelity funds with no group fee component and investment products not included in group fee assets. The Board also considered that, for funds subject to the group fee, FMR agreed to voluntarily waive fees over a specified period of time in amounts designed to account for assets converted from certain funds to certain collective investment trusts.
Based on its review, the Board concluded that each fund's management fee is fair and reasonable in light of the services that the fund receives and the other factors considered.
Total Expense Ratio. In its review of each fund's total expense ratio, the Board considered the fund's management fee rate as well as other fund expenses, such as transfer agent fees, pricing and bookkeeping fees, and custodial, legal, and audit fees. The Board also noted that Fidelity may agree to waive fees and expenses from time to time, and the extent to which, if any, it has done so for the funds. As part of its review, the Board also considered the current and historical total expense ratios of each fund compared to competitive fund median expenses. Each fund is compared to those funds and classes in the Total Mapped Group (used by the Board for management fee comparisons) that have a similar sales load structure.
The Board noted that each fund's total expense ratio ranked below its competitive median for 2014. The Board considered that Fidelity has been voluntarily waiving part or all of the transfer agent fees and/or management fees to maintain a minimum yield for Fidelity Massachusetts Municipal Money Market Fund, and also noted that Fidelity may recover a portion of waived fees under certain circumstances.
Fees Charged to Other Fidelity Clients. The Board also considered Fidelity fee structures and other information with respect to clients of Fidelity, such as other funds advised or subadvised by Fidelity, pension plan clients, and other institutional clients with similar mandates. The Board noted the findings of the 2013 ad hoc joint committee (created with the board of other Fidelity funds), which reviewed and compared Fidelity's institutional investment advisory business with its business of providing services to the Fidelity funds, including the differences in services provided, fees charged, and costs incurred, as well as competition in their respective marketplaces.
Based on its review of total expense ratios and fees charged to other Fidelity clients, the Board concluded that each fund's total expense ratio was reasonable in light of the services that the fund and its shareholders receive and the other factors considered.
Costs of the Services and Profitability. The Board considered the revenues earned and the expenses incurred by Fidelity in conducting the business of developing, marketing, distributing, managing, administering and servicing each fund and servicing each fund's shareholders. The Board also considered the level of Fidelity's profits in respect of all the Fidelity funds.
On an annual basis, Fidelity presents to the Board information about the profitability of its relationship with each fund. Fidelity calculates profitability information for each fund, as well as aggregate profitability information for groups of Fidelity funds and all Fidelity funds, using a series of detailed revenue and cost allocation methodologies which originate with the books and records of Fidelity on which Fidelity's audited financial statements are based. The Audit Committee of the Board reviews any significant changes from the prior year's methodologies.
PricewaterhouseCoopers LLP (PwC), independent registered public accounting firm and auditor to Fidelity and certain Fidelity funds, has been engaged annually by the Board as part of the Board's assessment of Fidelity's profitability analysis. PwC's engagement includes the review and assessment of the methodologies used by Fidelity in determining the revenues and expenses attributable to Fidelity's mutual fund business, and completion of agreed-upon procedures in respect of the mathematical accuracy of fund profitability and its conformity to established allocation methodologies. After considering PwC's reports issued under the engagement and information provided by Fidelity, the Board concluded that while other allocation methods may also be reasonable, Fidelity's profitability methodologies are reasonable in all material respects.
The Board also reviewed Fidelity's non-fund businesses and fall-out benefits related to the mutual fund business as well as cases where Fidelity's affiliates may benefit from or be related to the funds' business.
The Board considered the costs of the services provided by and the profits realized by Fidelity in connection with the operation of each fund and was satisfied that the profitability was not excessive.
Economies of Scale. The Board considered whether there have been economies of scale in respect of the management of the Fidelity funds, whether the Fidelity funds (including each fund) have appropriately benefited from any such economies of scale, and whether there is potential for realization of any further economies of scale. The Board considered the extent to which each fund will benefit from economies of scale as assets grow through increased services to the fund, through waivers or reimbursements, or through fee or expense ratio reductions. The Board also noted that in 2013, it and the boards of other Fidelity funds created an ad hoc committee (the Economies of Scale Committee) to analyze whether Fidelity attains economies of scale in respect of the management and servicing of the Fidelity funds, whether the Fidelity funds have appropriately benefited from such economies of scale, and whether there is potential for realization of any further economies of scale.
The Board recognized that each fund's management contract incorporates a "group fee" structure, which provides for lower group fee rates as total group assets increase, and for higher group fee rates as total group assets decrease (with "group assets" defined to include fund assets under FMR's management plus sector fund assets previously under FMR's management and currently managed by Fidelity SelectCo, LLC). FMR calculates the group fee rates based on a tiered asset "breakpoint" schedule that varies based on asset class. The Board considered that the group fee is designed to deliver the benefits of economies of scale to fund shareholders when total Fidelity fund assets increase, even if assets of any particular fund are unchanged or have declined, because some portion of Fidelity's costs are attributable to services provided to all Fidelity funds, and all funds benefit if those costs can be allocated among more assets. The Board concluded that, given the group fee structure, fund shareholders will benefit from lower management fees as group assets increase at the fund complex level, regardless of whether Fidelity achieves any such economies of scale.
The Board concluded, taking into account the analysis of the Economies of Scale Committee, that economies of scale, if any, are being appropriately shared between fund shareholders and Fidelity.
Additional Information Requested by the Board. In order to develop fully the factual basis for consideration of the Fidelity funds' Advisory Contracts, the Board requested and received additional information on certain topics, including: (i) Fidelity's fund profitability methodology, profitability trends for certain funds, and the impact of certain factors on fund profitability results; (ii) portfolio manager changes that have occurred during the past year and the amount of the investment that each portfolio manager has made in the Fidelity fund(s) that he or she manages; (iii) Fidelity's compensation structure for portfolio managers, research analysts, and other key personnel, including its effects on fund profitability, the rationale for the compensation structure, and the extent to which current market conditions have affected retention and recruitment; (iv) the arrangements with and compensation paid to certain fund sub-advisers on behalf of the Fidelity funds; (v) Fidelity's voluntary waiver of its fees to maintain minimum yields for certain money market funds and classes as well as contractual waivers in place for certain funds; (vi) the methodology with respect to competitive fund data and peer group classifications; (vii) Fidelity's transfer agent fee, expense, and service structures for different funds and classes relative to competitive trends, and the impact of the increased use of omnibus accounts; (viii) Fidelity's long-term expectations for its offerings in the workplace investing channel; (ix) new developments in the retail and institutional marketplaces; and (x) the impact of money market reform on Fidelity's money market funds. In addition, the Board considered its discussions with Fidelity throughout the year regarding enhanced information security initiatives and the funds' fair valuation policies.
Based on its evaluation of all of the conclusions noted above, and after considering all factors it believed relevant, the Board concluded that the advisory fee structures are fair and reasonable, and that each fund's Advisory Contracts should be renewed.
Proxy Voting Results
A special meeting of shareholders was held on January 15, 2016. The results of votes taken among shareholders on the proposal before them are reported below. Each vote reported represents one dollar of net asset value held on the record date for the meeting.
PROPOSAL 1
| To elect a Board of Trustees. |
| | # of
Votes | % of
Votes |
| Elizabeth S. Acton | | |
| Affirmative | 3,099,140,855.91 | 96.585 |
| Withheld | 109,609,021.09 | 3.415 |
| TOTAL | 3,208,749,877.00 | 100.000 |
| John Engler | | |
| Affirmative | 3,093,798,797.83 | 96.418 |
| Withheld | 114,951,079.17 | 3.582 |
| TOTAL | 3,208,749,877.00 | 100.000 |
| Albert R. Gamper, Jr. | | |
| Affirmative | 3,092,671,799.84 | 96.383 |
| Withheld | 116,078,077.16 | 3.617 |
| TOTAL | 3,208,749,877.00 | 100.000 |
| Robert F. Gartland | | |
| Affirmative | 3,094,707,691.64 | 96.446 |
| Withheld | 114,042,185.36 | 3.554 |
| TOTAL | 3,208,749,877.00 | 100.000 |
| Abigail P. Johnson | | |
| Affirmative | 3,095,323,804.40 | 96.466 |
| Withheld | 113,426,072.60 | 3.534 |
| TOTAL | 3,208,749,877.00 | 100.000 |
| Arthur E. Johnson | | |
| Affirmative | 3,092,099,624.00 | 96.365 |
| Withheld | 116,650,253.00 | 3.635 |
| TOTAL | 3,208,749,877.00 | 100.000 |
| Michael E. Kenneally | | |
| Affirmative | 3,098,846,822.23 | 96.575 |
| Withheld | 109,903,054.77 | 3.425 |
| TOTAL | 3,208,749,877.00 | 100.000 |
| James H. Keyes | | |
| Affirmative | 3,094,129,530.99 | 96.428 |
| Withheld | 114,620,346.01 | 3.572 |
| TOTAL | 3,208,749,877.00 | 100.000 |
| Marie L. Knowles | | |
| Affirmative | 3,096,764,677.82 | 96.511 |
| Withheld | 111,985,199.18 | 3.489 |
| TOTAL | 3,208,749,877.00 | 100.000 |
| Geoffrey A. von Kuhn | | |
| Affirmative | 3,092,206,726.98 | 96.368 |
| Withheld | 116,543,150.02 | 3.632 |
| TOTAL | 3,208,749,877.00 | 100.000 |
| Proposal 1 reflects trust wide proposal and voting results. |
Corporate Headquarters
245 Summer St.
Boston, MA 02210
www.fidelity.com
MAS-ANN-0316
1.700542.119