


Searchable text section of graphics shown above
Forward-looking Statements
and Non-GAAP Disclosures
In addition to historical information, this presentation contains forward-looking statements, which are subject to certain risks and uncertainties. Forward-looking statements include information concerning possible or assumed future results of Old Second’s operations. Forward-looking statements generally include words such as believes, expects, anticipates and other similar expressions.
Stockholders should note that many factors could affect the future financial results of Old Second, causing those results to differ materially from those expressed in this presentation. These factors include operating, legal and regulatory risks; economic, political and competitive forces impacting our business; risk that our analysis of these risks and forces could be incorrect and/or that the strategies developed to address them could be unsuccessful; volatility in interest rates; and other risks and uncertainties which are summarized in our SEC filings.
Old Second undertakes no obligation to publicly revise or update these forward-looking statements to reflect events that arise after this presentation.
Statements in this presentation may also include adjusted non-GAAP financial measures governed by Regulation G. Generally, we believe that these measures and ratios provide users of our financial information a more accurate view of the performance of the interest-earning assets and interest-bearing liabilities and of our operating efficiency for comparative purposes with other financial holding companies. The reconciliation of each non-GAAP presentation is included herein.
Who We Are
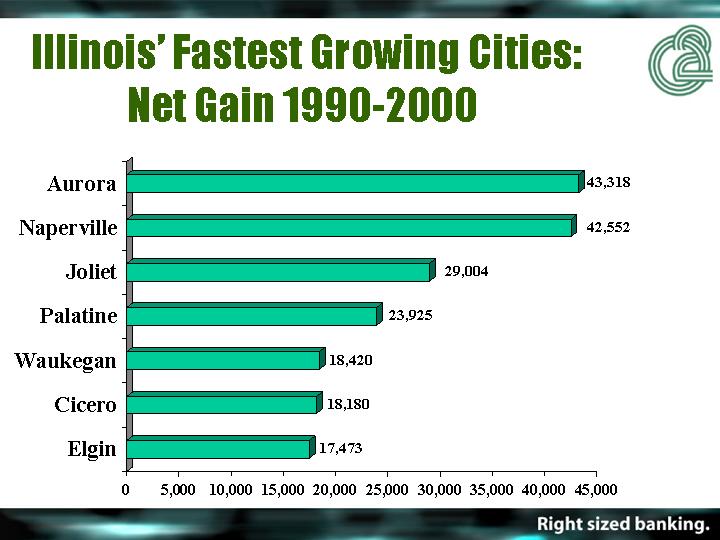
• $2.1 billion financial holding company headquartered in Aurora, Illinois
• 3 independently chartered community banks
• Trust & Investment Group with over $900 million under management
• Mortgage company
• 27 locations
• 58 ATM locations
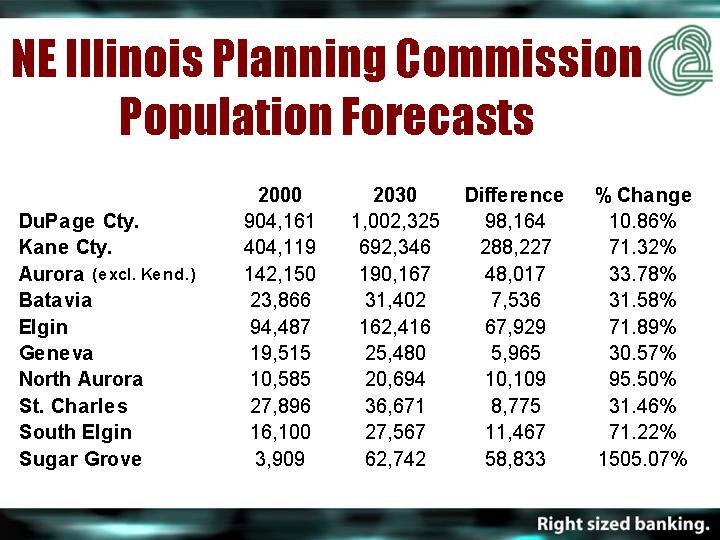
NE Illinois Planning Commission
Population Forecasts
|
| 2000 |
| 2030 |
| Difference |
| % Change |
|
DuPage Cty. |
| 904,161 |
| 1,002,325 |
| 98,164 |
| 10.86 | % |
Kane Cty. |
| 404,119 |
| 692,346 |
| 288,227 |
| 71.32 | % |
Aurora (excl. Kend.) |
| 142,150 |
| 190,167 |
| 48,017 |
| 33.78 | % |
Batavia |
| 23,866 |
| 31,402 |
| 7,536 |
| 31.58 | % |
Elgin |
| 94,487 |
| 162,416 |
| 67,929 |
| 71.89 | % |
Geneva |
| 19,515 |
| 25,480 |
| 5,965 |
| 30.57 | % |
North Aurora |
| 10,585 |
| 20,694 |
| 10,109 |
| 95.50 | % |
St. Charles |
| 27,896 |
| 36,671 |
| 8,775 |
| 31.46 | % |
South Elgin |
| 16,100 |
| 27,567 |
| 11,467 |
| 71.22 | % |
Sugar Grove |
| 3,909 |
| 62,742 |
| 58,833 |
| 1505.07 | % |
What Makes 02 Different
• One holding company, 3 charters
• Community focused operating philosophy based on local decisions and outstanding personalized service
• Strong 134 year heritage
• Positioned in rapidly growing Illinois markets
• Market leader in Kane and Kendall counties
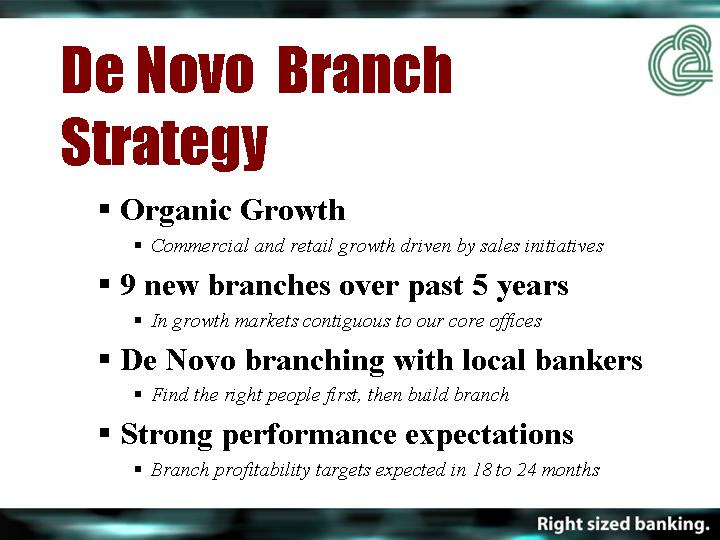
De Novo Branch Strategy
• Organic Growth
• Commercial and retail growth driven by sales initiatives
• 9 new branches over past 5 years
• In growth markets contiguous to our core offices
• De Novo branching with local bankers
• Find the right people first, then build branch
• Strong performance expectations
• Branch profitability targets expected in 18 to 24 months
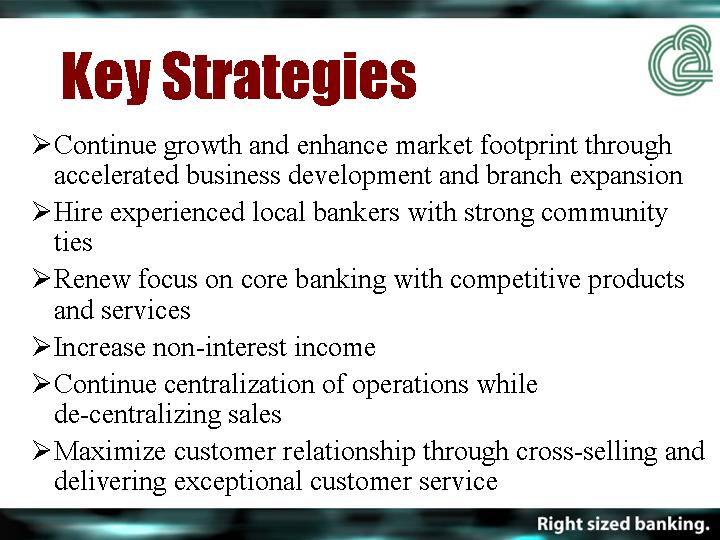
Key Strategies
• Continue growth and enhance market footprint through accelerated business development and branch expansion
• Hire experienced local bankers with strong community ties
• Renew focus on core banking with competitive products and services
• Increase non-interest income
• Continue centralization of operations while de-centralizing sales
• Maximize customer relationship through cross-selling and delivering exceptional customer service
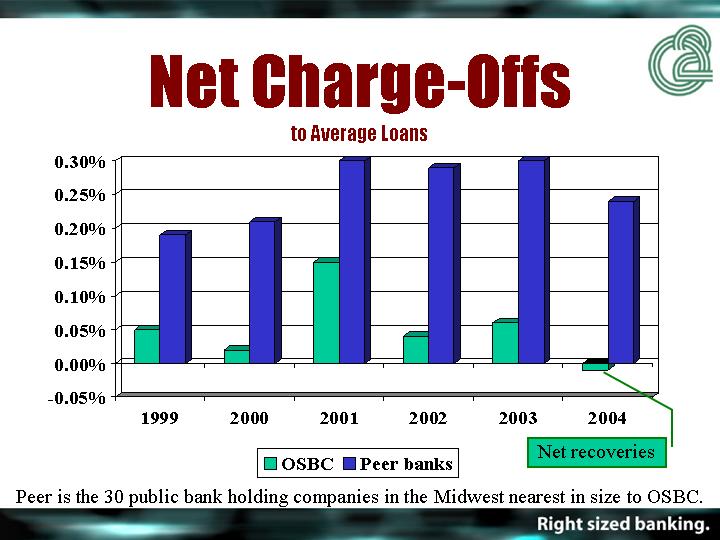
Net Charge-Offs
to Average Loans
[CHART]
Peer is the 30 public bank holding companies in the Midwest nearest in size to OSBC.
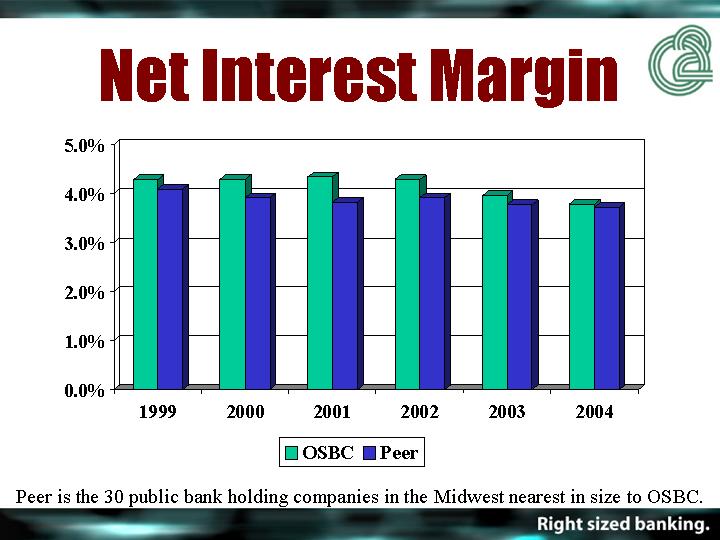
Net Interest Margin
[CHART]
Peer is the 30 public bank holding companies in the Midwest nearest in size to OSBC.
Efficiency Ratio
[CHART]
Peer is the 30 public bank holding companies in the Midwest nearest in size to OSBC.
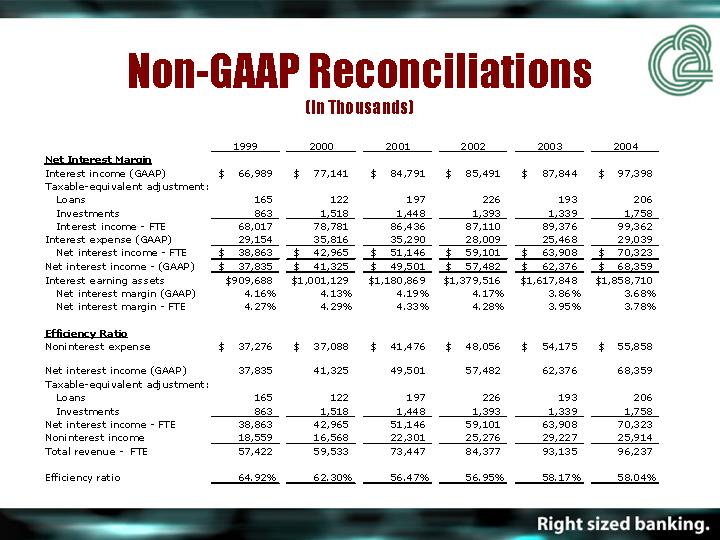
Non-GAAP Reconciliations
(In Thousands)
|
| 1999 |
| 2000 |
| 2001 |
| 2002 |
| 2003 |
| 2004 |
| ||||||||||||||||
Net Interest Margin |
|
|
|
|
|
|
|
|
|
|
|
|
| ||||||||||||||||
Interest income (GAAP) |
| $ | 66,989 |
| $ | 77,141 |
| $ | 84,791 |
| $ | 85,491 |
| $ | 87,844 |
| $ | 97,398 |
| ||||||||||
Taxable-equivalent adjustment: |
|
|
|
|
|
|
|
|
|
|
|
|
| ||||||||||||||||
Loans |
| 165 |
| 122 |
| 197 |
| 226 |
| 193 |
| 206 |
| ||||||||||||||||
Investments |
| 863 |
| 1,518 |
| 1,448 |
| 1,393 |
| 1,339 |
| 1,758 |
| ||||||||||||||||
Interest income - FTE |
| 68,017 |
| 78,781 |
| 86,436 |
| 87,110 |
| 89,376 |
| 99,362 |
| ||||||||||||||||
Interest expense (GAAP) |
| 29,154 |
| 35,816 |
| 35,290 |
| 28,009 |
| 25,468 |
| 29,039 |
| ||||||||||||||||
Net interest income - FTE |
| $ | 38,863 |
| $ | 42,965 |
| $ | 51,146 |
| $ | 59,101 |
| $ | 63,908 |
| $ | 70,323 |
| ||||||||||
Net interest income - (GAAP) |
| $ | 37,835 |
| $ | 41,325 |
| $ | 49,501 |
| $ | 57,482 |
| $ | 62,376 |
| $ | 68,359 |
| ||||||||||
Interest earning assets |
| $ | 909,688 |
| $ | 1,001,129 |
| $ | 1,180,869 |
| $ | 1,379,516 |
| $ | 1,617,848 |
| $ | 1,858,710 |
| ||||||||||
Net interest margin (GAAP) |
| 4.16 | % | 4.13 | % | 4.19 | % | 4.17 | % | 3.86 | % | 3.68 | % | ||||||||||||||||
Net interest margin - FTE |
| 4.27 | % | 4.29 | % | 4.33 | % | 4.28 | % | 3.95 | % | 3.78 | % | ||||||||||||||||
|
|
|
|
|
|
|
|
|
|
|
|
|
| ||||||||||||||||
Efficiency Ratio |
|
|
|
|
|
|
|
|
|
|
|
|
| ||||||||||||||||
Noninterest expense |
| $ | 37,276 |
| $ | 37,088 |
| $ | 41,476 |
| $ | 48,056 |
| $ | 54,175 |
| $ | 55,858 |
| ||||||||||
|
|
|
|
|
|
|
|
|
|
|
|
|
| ||||||||||||||||
Net interest income (GAAP) |
| 37,835 |
| 41,325 |
| 49,501 |
| 57,482 |
| 62,376 |
| 68,359 |
| ||||||||||||||||
Taxable-equivalent adjustment: |
|
|
|
|
|
|
|
|
|
|
|
|
| ||||||||||||||||
Loans |
| 165 |
| 122 |
| 197 |
| 226 |
| 193 |
| 206 |
| ||||||||||||||||
Investments |
| 863 |
| 1,518 |
| 1,448 |
| 1,393 |
| 1,339 |
| 1,758 |
| ||||||||||||||||
Net interest income - FTE |
| 38,863 |
| 42,965 |
| 51,146 |
| 59,101 |
| 63,908 |
| 70,323 |
| ||||||||||||||||
Noninterest income |
| 18,559 |
| 16,568 |
| 22,301 |
| 25,276 |
| 29,227 |
| 25,914 |
| ||||||||||||||||
Total revenue - FTE |
| 57,422 |
| 59,533 |
| 73,447 |
| 84,377 |
| 93,135 |
| 96,237 |
| ||||||||||||||||
|
|
|
|
|
|
|
|
|
|
|
|
|
| ||||||||||||||||
Efficiency ratio |
| 64.92 | % | 62.30 | % | 56.47 | % | 56.95 | % | 58.17 | % | 58.04 | % | ||||||||||||||||
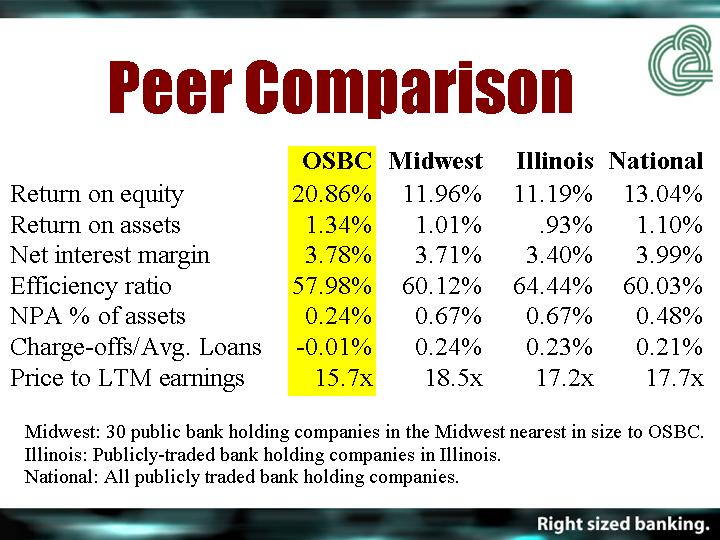
Peer Comparison
|
| OSBC |
| Midwest |
| Illinois |
| National |
|
Return on equity |
| 20.86 | % | 11.96 | % | 11.19 | % | 13.04 | % |
Return on assets |
| 1.34 | % | 1.01 | % | .93 | % | 1.10 | % |
Net interest margin |
| 3.78 | % | 3.71 | % | 3.40 | % | 3.99 | % |
Efficiency ratio |
| 57.98 | % | 60.12 | % | 64.44 | % | 60.03 | % |
NPA % of assets |
| 0.24 | % | 0.67 | % | 0.67 | % | 0.48 | % |
Charge-offs/Avg. Loans |
| -0.01 | % | 0.24 | % | 0.23 | % | 0.21 | % |
Price to LTM earnings |
| 15.7 | x | 18.5 | x | 17.2 | x | 17.7 | x |
Midwest: 30 public bank holding companies in the Midwest nearest in size to OSBC.
Illinois: Publicly-traded bank holding companies in Illinois.
National: All publicly traded bank holding companies.
Old Second Kane County
Market Leader
|
| 1999 |
| 2000 |
| 2001 |
| 2002 |
| 2003 |
| 2004 |
|
Old Second |
| 13.08 | % | 15.07 | % | 16.19 | % | 17.21 | % | 17.34 | % | 17.97 | % |
Harris Bank |
| 10.41 | % | 10.80 | % | 10.82 | % | 10.49 | % | 10.59 | % | 11.61 | % |
Fifth Third |
| 20.86 | % | 17.72 | % | 15.98 | % | 13.41 | % | 11.30 | % | 9.70 | % |
Bank One |
| 11.60 | % | 10.62 | % | 8.92 | % | 8.82 | % | 9.48 | % | 8.64 | % |
EFS |
| 6.02 | % | 6.88 | % | 6.73 | % | 7.20 | % | 7.35 | % | 7.80 | % |
1st Am Bank |
| 4.50 | % | 5.35 | % | 5.52 | % | 5.00 | % | 4.81 | % | 4.37 | % |
Remaining 36 banks each have less than 3% share of Kane County market.
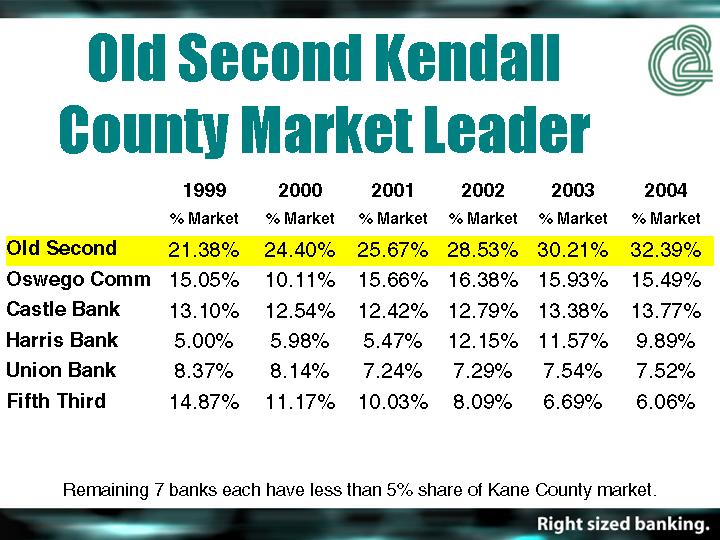
Old Second Kendall
County Market Leader
|
| 1999 |
| 2000 |
| 2001 |
| 2002 |
| 2003 |
| 2004 |
|
Old Second |
| 21.38 | % | 24.40 | % | 25.67 | % | 28.53 | % | 30.21 | % | 32.39 | % |
Oswego Comm |
| 15.05 | % | 10.11 | % | 15.66 | % | 16.38 | % | 15.93 | % | 15.49 | % |
Castle Bank |
| 13.10 | % | 12.54 | % | 12.42 | % | 12.79 | % | 13.38 | % | 13.77 | % |
Harris Bank |
| 5.00 | % | 5.98 | % | 5.47 | % | 12.15 | % | 11.57 | % | 9.89 | % |
Union Bank |
| 8.37 | % | 8.14 | % | 7.24 | % | 7.29 | % | 7.54 | % | 7.52 | % |
Fifth Third |
| 14.87 | % | 11.17 | % | 10.03 | % | 8.09 | % | 6.69 | % | 6.06 | % |
Remaining 7 banks each have less than 5% share of Kane County market.
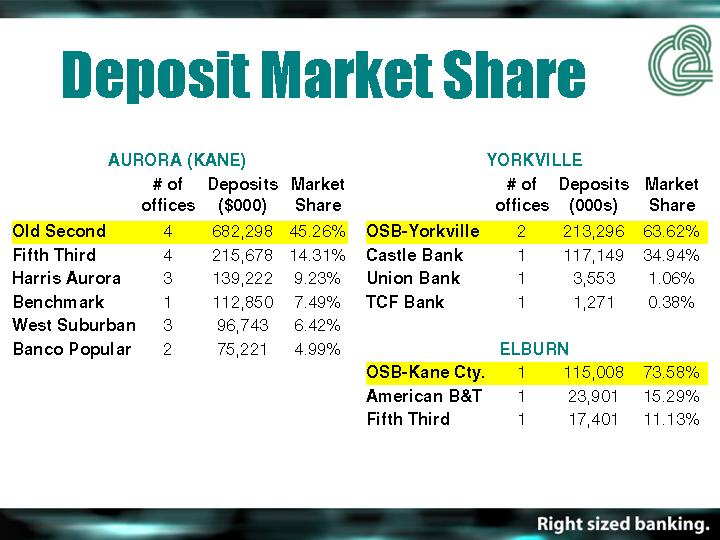
Deposit Market Share
AURORA (KANE)
|
| # of |
| Deposits |
| Market |
|
|
|
|
| ($000) |
|
|
|
Old Second |
| 4 |
| 682,298 |
| 45.26 | % |
Fifth Third |
| 4 |
| 215,678 |
| 14.31 | % |
Harris Aurora |
| 3 |
| 139,222 |
| 9.23 | % |
Benchmark |
| 1 |
| 112,850 |
| 7.49 | % |
West Suburban |
| 3 |
| 96,743 |
| 6.42 | % |
Banco Popular |
| 2 |
| 75,221 |
| 4.99 | % |
YORKVILLE
|
| # of |
| Deposits |
| Market |
|
|
|
|
| (000s) |
|
|
|
OSB-Yorkville |
| 2 |
| 213,296 |
| 63.62 | % |
Castle Bank |
| 1 |
| 117,149 |
| 34.94 | % |
Union Bank |
| 1 |
| 3,553 |
| 1.06 | % |
TCF Bank |
| 1 |
| 1,271 |
| 0.38 | % |
ELBURN
OSB-Kane Cty. |
| 1 |
| 115,008 |
| 73.58 | % |
American B&T |
| 1 |
| 23,901 |
| 15.29 | % |
Fifth Third |
| 1 |
| 17,401 |
| 11.13 | % |