Searchable text section of graphics shown above
[LOGO]
William B. Skoglund | J. Douglas Cheatham | James L. Eccher |
Chairman, President & CEO | Chief Financial Officer | President and CEO |
Old Second Bancorp, Inc. | Old Second Bancorp, Inc. | Old Second National Bank |
630-906-5483 | 630-906-5484 | 630-966-2433 |
Forward-looking Statements and Non-GAAP Disclosures | [LOGO] |
In addition to historical information, this presentation contains forward-looking statements, which are subject to certain risks and uncertainties. Forward-looking statements include information concerning possible or assumed future results of Old Second’s operations. Forward-looking statements generally include words such as believes, expects, anticipates and other similar expressions.
Stockholders should note that many factors could affect the future financial results of Old Second, causing those results to differ materially from those expressed in this presentation. These factors include operating, legal and regulatory risks; economic, political and competitive forces impacting our business; risk that our analysis of these risks and forces could be incorrect and/or that the strategies developed to address them could be unsuccessful; volatility in interest rates; and other risks and uncertainties which are summarized in our SEC filings.
Old Second undertakes no obligation to publicly revise or update these forward-looking statements to reflect events that arise after this presentation.
Statements in this presentation may also include adjusted non-GAAP financial measures governed by Regulation G. Generally, we believe that these measures and ratios provide users of our financial information a more accurate view of the performance of the interest-earning assets and interest-bearing liabilities and of our operating efficiency for comparative purposes with other financial holding companies. The reconciliation of each non-GAAP presentation is included herein.
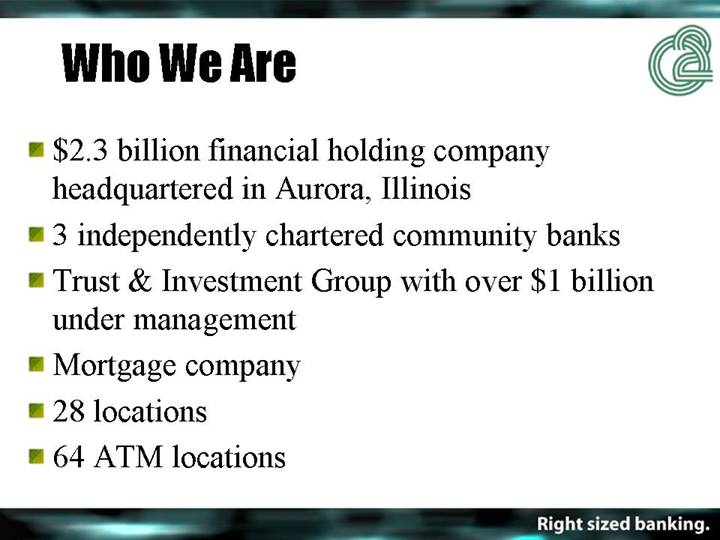
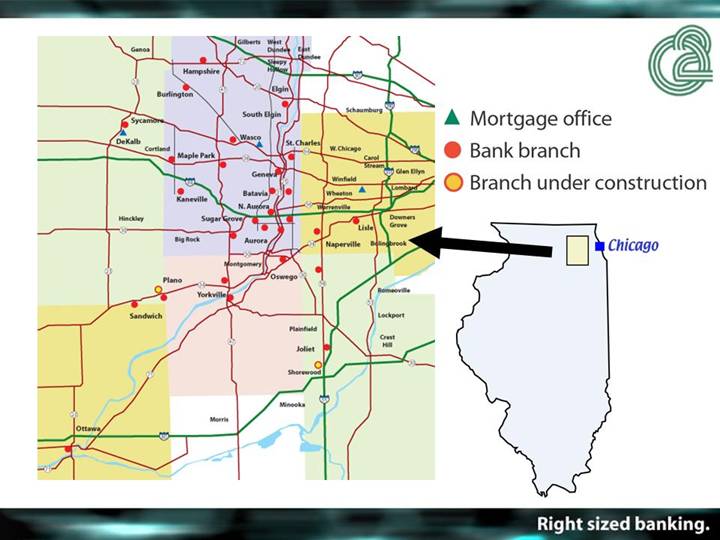
Who We Are
• $2.3 billion financial holding company headquartered in Aurora, Illinois
• 3 independently chartered community banks
• Trust & Investment Group with over $1 billion under management
• Mortgage company
• 28 locations
• 64 ATM locations
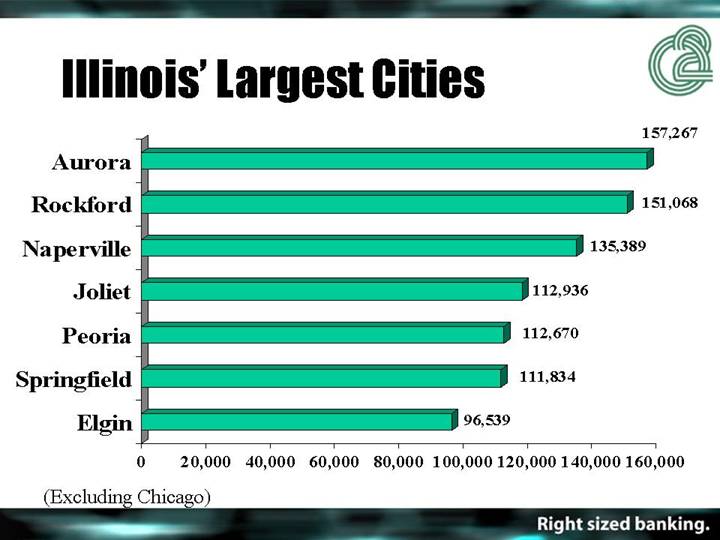
Illinois’ Largest Cities
[CHART]
(Excluding Chicago)
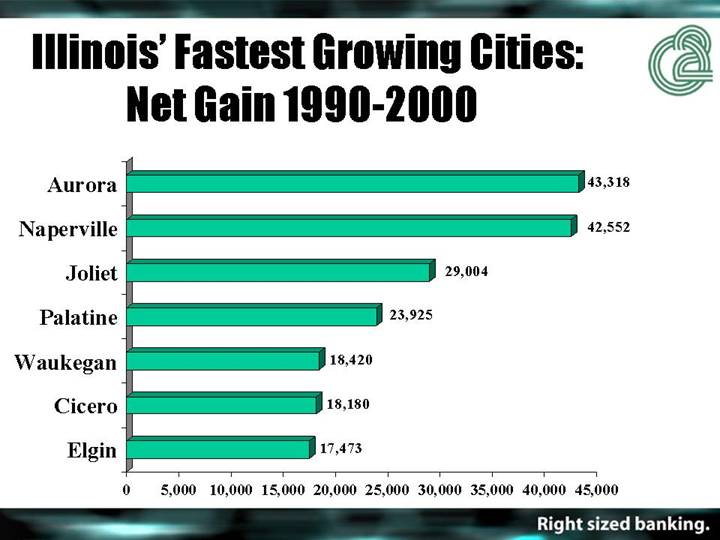
Illinois’ Fastest Growing Cities: Net Gain 1990-2000
[CHART]
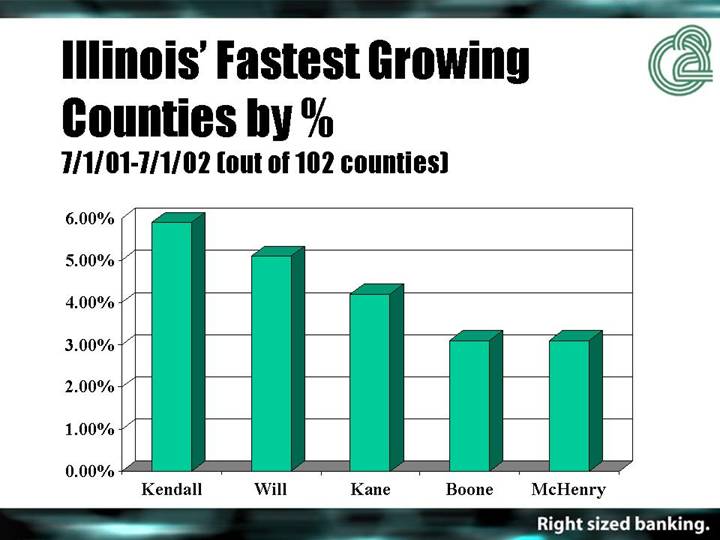
Illinois’ Fastest Growing Counties by %
7/1/01-7/1/02 (out of 102 counties)
[CHART]
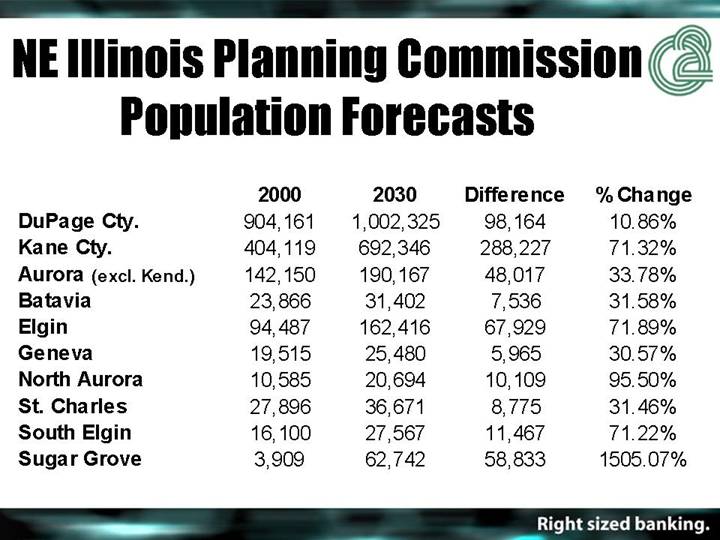
NE Illinois Planning Commission Population Forecasts
| | 2000 | | 2030 | | Difference | | % Change | |
DuPage Cty. | | 904,161 | | 1,002,325 | | 98,164 | | 10.86 | % |
Kane Cty. | | 404,119 | | 692,346 | | 288,227 | | 71.32 | % |
Aurora (excl. Kend.) | | 142,150 | | 190,167 | | 48,017 | | 33.78 | % |
Batavia | | 23,866 | | 31,402 | | 7,536 | | 31.58 | % |
Elgin | | 94,487 | | 162,416 | | 67,929 | | 71.89 | % |
Geneva | | 19,515 | | 25,480 | | 5,965 | | 30.57 | % |
North Aurora | | 10,585 | | 20,694 | | 10,109 | | 95.50 | % |
St. Charles | | 27,896 | | 36,671 | | 8,775 | | 31.46 | % |
South Elgin | | 16,100 | | 27,567 | | 11,467 | | 71.22 | % |
Sugar Grove | | 3,909 | | 62,742 | | 58,833 | | 1505.07 | % |
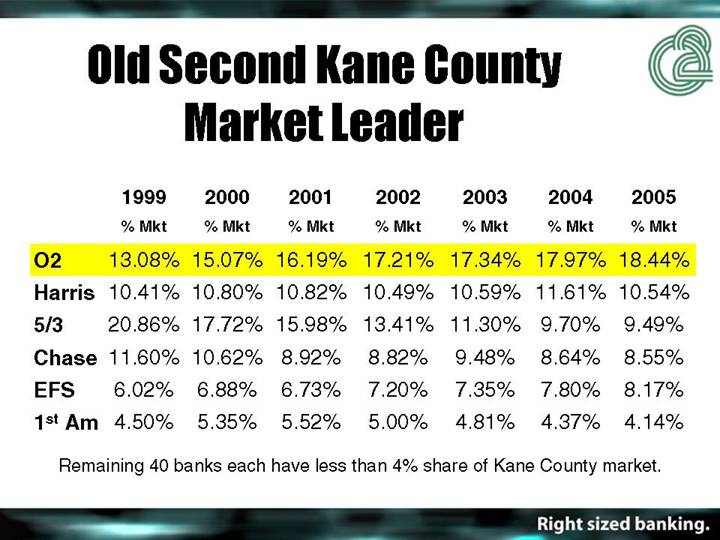
Old Second Kane County Market Leader
| | 1999 | | 2000 | | 2001 | | 2002 | | 2003 | | 2004 | | 2005 | |
| | % Mkt | | % Mkt | | % Mkt | | % Mkt | | % Mkt | | % Mkt | | % Mkt | |
| | | | | | | | | | | | | | | |
O2 | | 13.08 | % | 15.07 | % | 16.19 | % | 17.21 | % | 17.34 | % | 17.97 | % | 18.44 | % |
Harris | | 10.41 | % | 10.80 | % | 10.82 | % | 10.49 | % | 10.59 | % | 11.61 | % | 10.54 | % |
5/3 | | 20.86 | % | 17.72 | % | 15.98 | % | 13.41 | % | 11.30 | % | 9.70 | % | 9.49 | % |
Chase | | 11.60 | % | 10.62 | % | 8.92 | % | 8.82 | % | 9.48 | % | 8.64 | % | 8.55 | % |
EFS | | 6.02 | % | 6.88 | % | 6.73 | % | 7.20 | % | 7.35 | % | 7.80 | % | 8.17 | % |
1st Am | | 4.50 | % | 5.35 | % | 5.52 | % | 5.00 | % | 4.81 | % | 4.37 | % | 4.14 | % |
Remaining 40 banks each have less than 4% share of Kane County market.
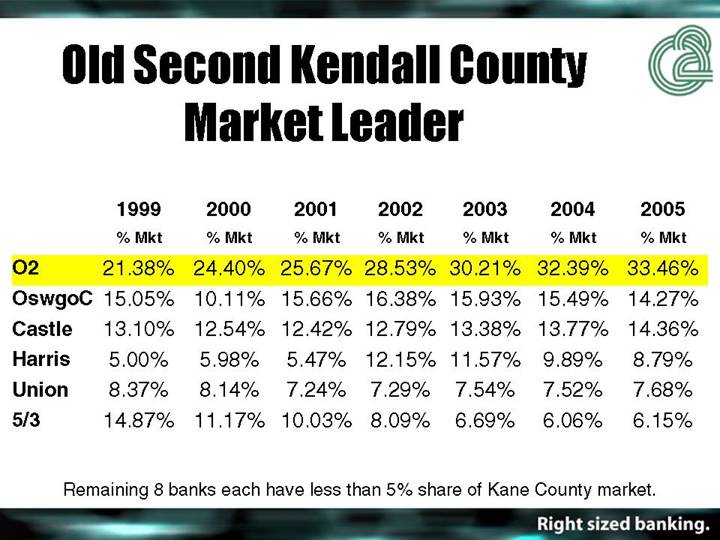
Old Second Kendall County Market Leader
| | 1999 | | 2000 | | 2001 | | 2002 | | 2003 | | 2004 | | 2005 | |
| | % Mkt | | % Mkt | | % Mkt | | % Mkt | | % Mkt | | % Mkt | | % Mkt | |
| | | | | | | | | | | | | | | |
O2 | | 21.38 | % | 24.40 | % | 25.67 | % | 28.53 | % | 30.21 | % | 32.39 | % | 33.46 | % |
OswgoC | | 15.05 | % | 10.11 | % | 15.66 | % | 16.38 | % | 15.93 | % | 15.49 | % | 14.27 | % |
Castle | | 13.10 | % | 12.54 | % | 12.42 | % | 12.79 | % | 13.38 | % | 13.77 | % | 14.36 | % |
Harris | | 5.00 | % | 5.98 | % | 5.47 | % | 12.15 | % | 11.57 | % | 9.89 | % | 8.79 | % |
Union | | 8.37 | % | 8.14 | % | 7.24 | % | 7.29 | % | 7.54 | % | 7.52 | % | 7.68 | % |
5/3 | | 14.87 | % | 11.17 | % | 10.03 | % | 8.09 | % | 6.69 | % | 6.06 | % | 6.15 | % |
Remaining 8 banks each have less than 5% share of Kane County market.
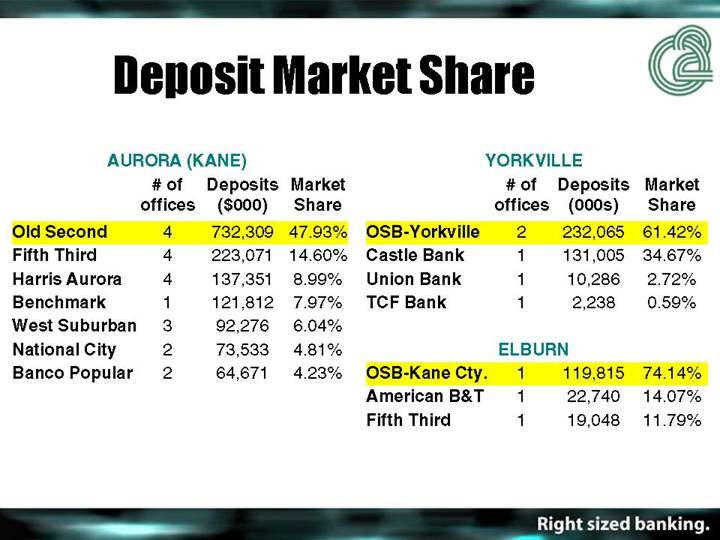
Deposit Market Share
AURORA (KANE)
| | # of | | Deposits | | Market | |
| | offices | | ($000) | | Share | |
Old Second | | 4 | | 732,309 | | 47.93 | % |
Fifth Third | | 4 | | 223,071 | | 14.60 | % |
Harris Aurora | | 4 | | 137,351 | | 8.99 | % |
Benchmark | | 1 | | 121,812 | | 7.97 | % |
West Suburban | | 3 | | 92,276 | | 6.04 | % |
National City | | 2 | | 73,533 | | 4.81 | % |
Banco Popular | | 2 | | 64,671 | | 4.23 | % |
YORKVILLE
| | # of | | Deposits | | Market | |
| | offices | | (000s) | | Share | |
OSB-Yorkville | | 2 | | 232,065 | | 61.42 | % |
Castle Bank | | 1 | | 131,005 | | 34.67 | % |
Union Bank | | 1 | | 10,286 | | 2.72 | % |
TCF Bank | | 1 | | 2,238 | | 0.59 | % |
ELBURN
OSB-Kane Cty. | | 1 | | 119,815 | | 74.14 | % |
American B&T | | 1 | | 22,740 | | 14.07 | % |
Fifth Third | | 1 | | 19,048 | | 11.79 | % |
Deposit Market Share
JOLIET (WILL)
| | # of | | Deposits | | Market | |
| | offices | | ($000) | | Share | |
1. 1st Midwest | | 8 | | 1,000,930 | | 36.48 | % |
2. Harris | | 7 | | 673,449 | | 24.54 | % |
3. JP Morgan | | 6 | | 291,517 | | 10.62 | % |
4. 1st American | | 2 | | 135,371 | | 4.93 | % |
17. Old Second | | 1 | | 7,621 | | 0.28 | % |
ELGIN
| | # of | | Deposits | | Market | |
| | offices | | ($000) | | Share | |
1. EFS | | 4 | | 449,189 | | 25.28 | % |
2. JP Morgan | | 5 | | 289,814 | | 16.31 | % |
3. Union | | 2 | | 282,985 | | 15.93 | % |
4. Elgin State | | 3 | | 199,177 | | 11.21 | % |
NAPERVILLE (DUPAGE/WILL)
| | # of | | Deposits | | Market | |
| | offices | | (000s) | | Share | |
1. Harris | | 6 | | 696,993 | | 19.83 | % |
2. MidAmerica | | 4 | | 542,417 | | 15.43 | % |
3. Regency | | 3 | | 449,433 | | 12.79 | % |
4. US Bank | | 3 | | 289,582 | | 8.24 | % |
14. Old Second | | 2 | | 64,542 | | 1.84 | % |
(Lisle/Naper) | | | | | | | |
SOUTH ELGIN/ELGIN
| | # of | | Deposits | | Market | |
| | offices | | ($000) | | Share | |
1. EFS | | 4 | | 449,189 | | 22.73 | % |
2. JP Morgan | | 6 | | 294,561 | | 14.90 | % |
3. Union | | 2 | | 282,985 | | 14.32 | % |
4. Elgin State | | 3 | | 199,177 | | 10.08 | % |
15. Old Second | | 1 | | 12,020 | | 0.61 | % |
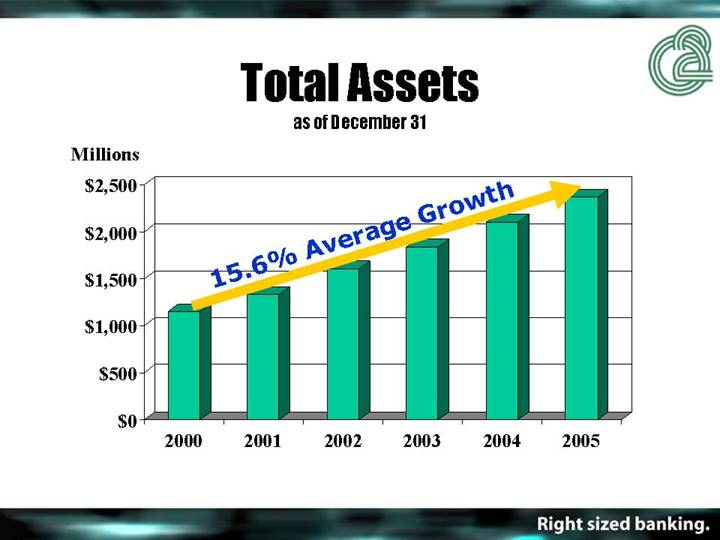
Total Assets
as of December 31
[CHART]
Total Loans
as of December 31
[CHART]
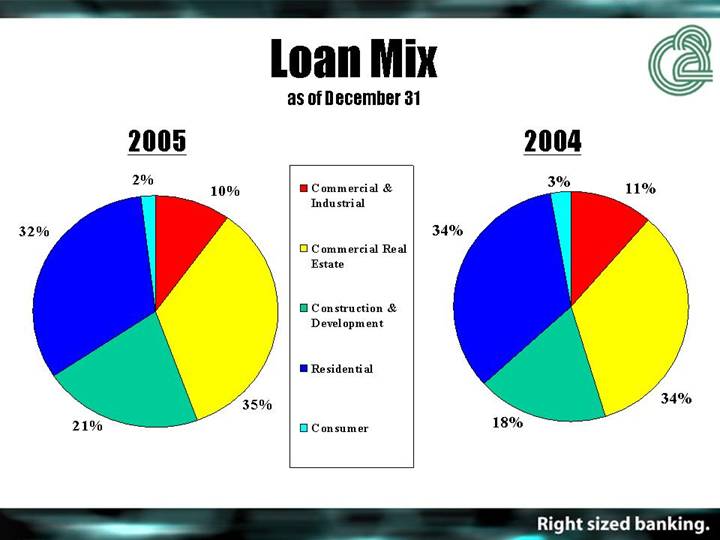
Loan Mix
as of December 31
2005 | | 2004 |
| | |
[CHART] | | [CHART] |
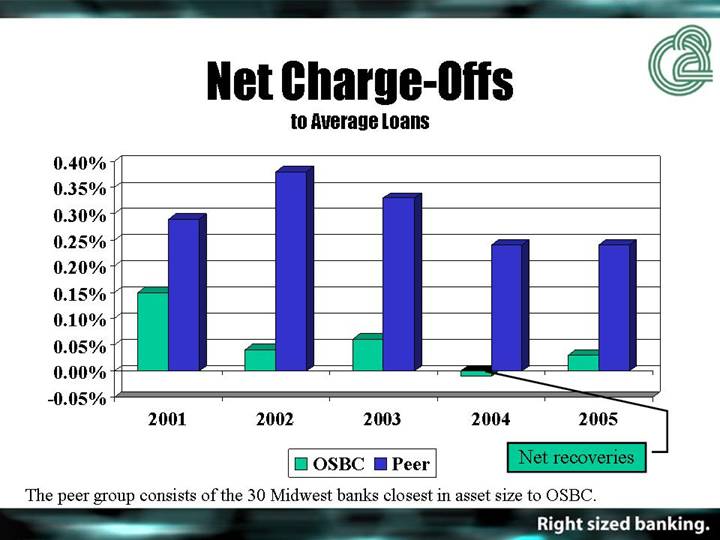
Net Charge-Offs
to Average Loans
[CHART]
The peer group consists of the 30 Midwest banks closest in asset size to OSBC.
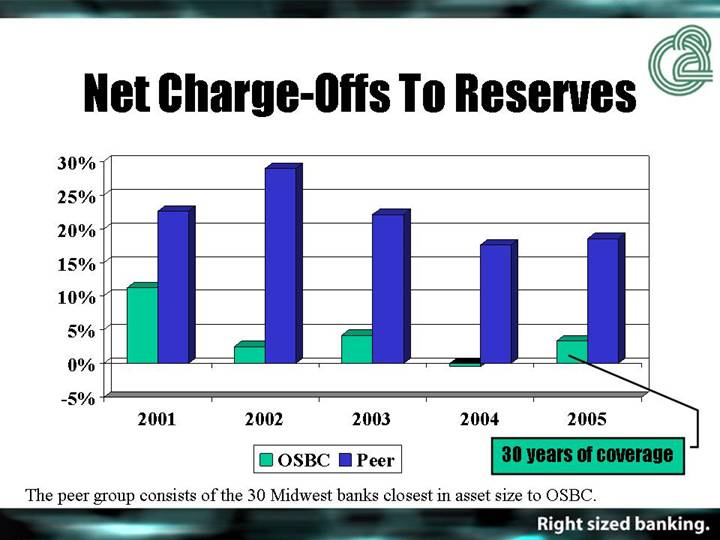
Net Charge-Offs To Reserves
[CHART]
The peer group consists of the 30 Midwest banks closest in asset size to OSBC.
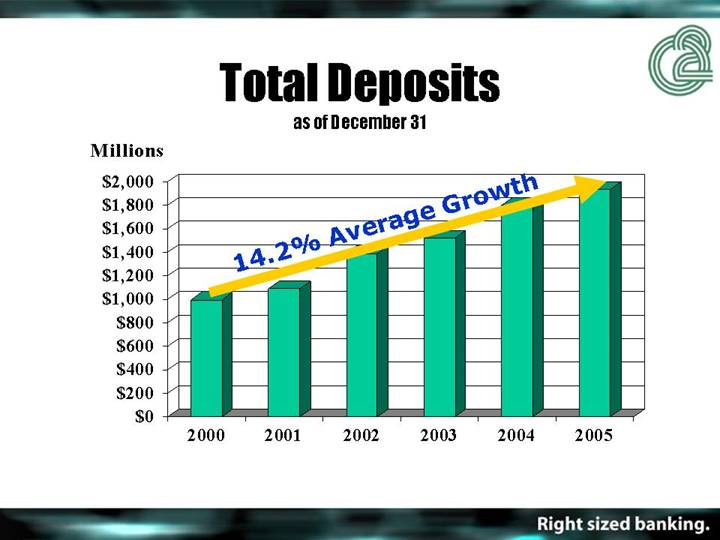
Total Deposits
as of December 31
[CHART]
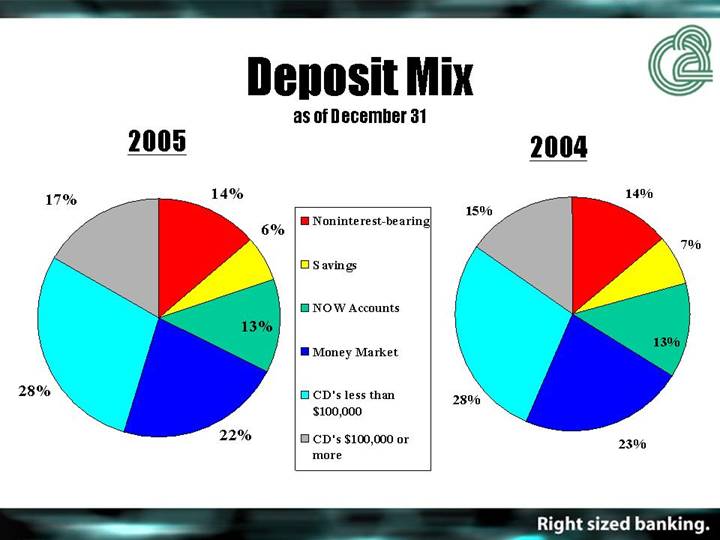
Deposit Mix
as of December 31
2005 | | 2004 |
| | |
[CHART] | | [CHART] |
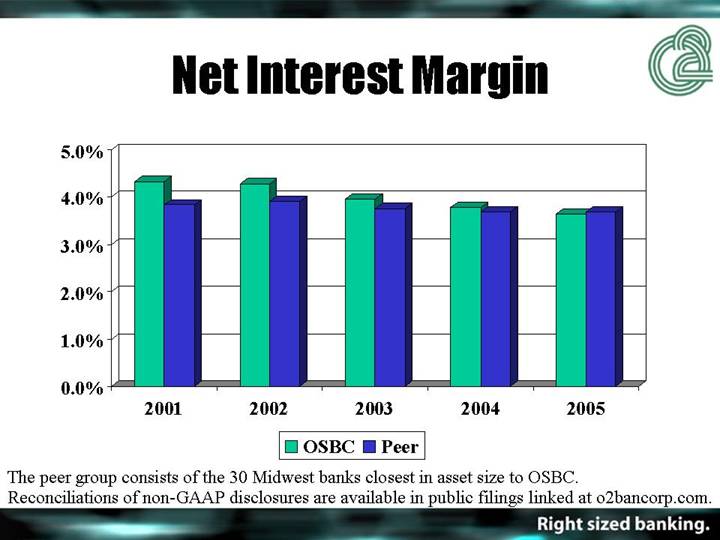
Net Interest Margin
[CHART]
The peer group consists of the 30 Midwest banks closest in asset size to OSBC.
Reconciliations of non-GAAP disclosures are available in public filings linked at o2bancorp.com.
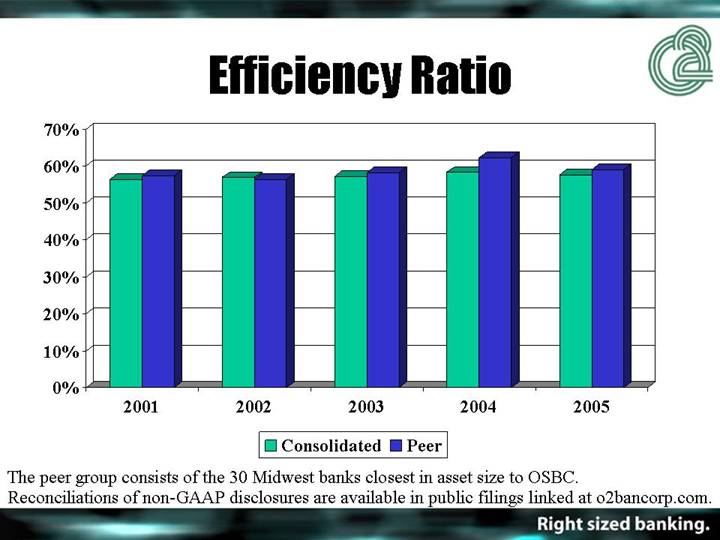
Efficiency Ratio
[CHART]
The peer group consists of the 30 Midwest banks closest in asset size to OSBC.
Reconciliations of non-GAAP disclosures are available in public filings linked at o2bancorp.com.
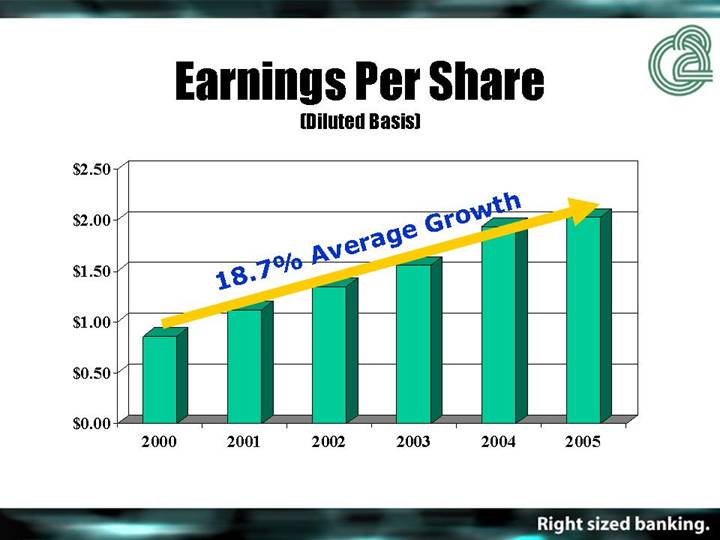
Earnings Per Share
(Diluted Basis)
[CHART]
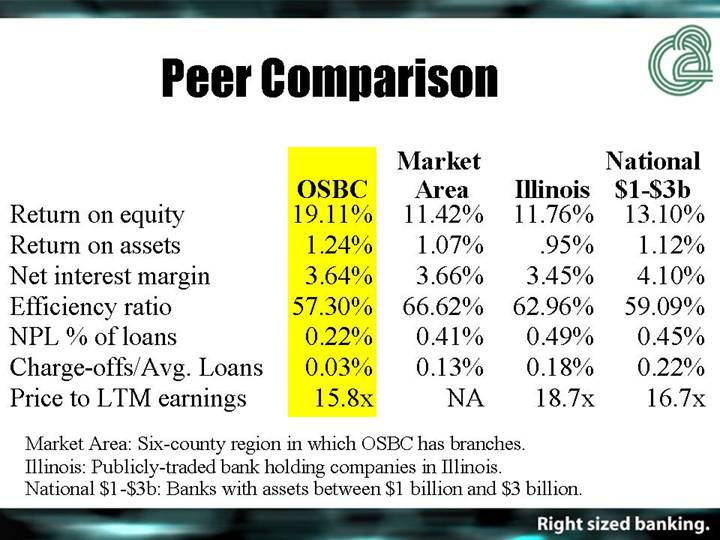
Peer Comparison
| | | | Market | | | | National | |
| | OSBC | | Area | | Illinois | | $1-$3b | |
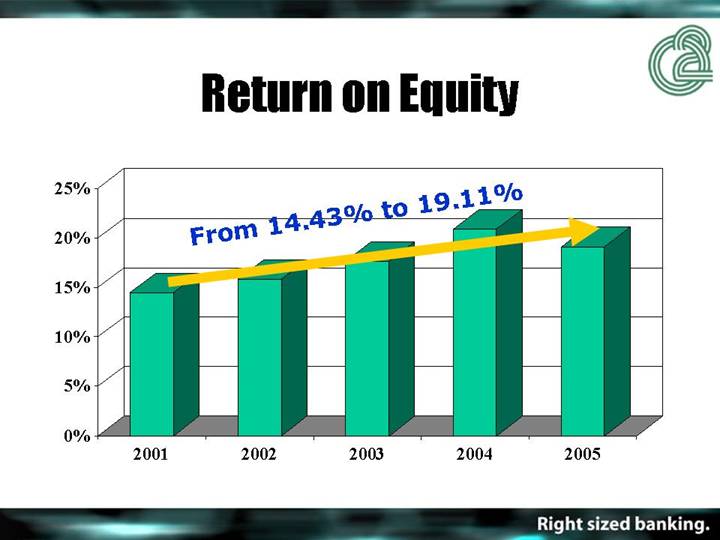
Return on equity | | 19.11 | % | 11.42 | % | 11.76 | % | 13.10 | % |
Return on assets | | 1.24 | % | 1.07 | % | .95 | % | 1.12 | % |
Net interest margin | | 3.64 | % | 3.66 | % | 3.45 | % | 4.10 | % |
Efficiency ratio | | 57.30 | % | 66.62 | % | 62.96 | % | 59.09 | % |
NPL % of loans | | 0.22 | % | 0.41 | % | 0.49 | % | 0.45 | % |
Charge-offs/Avg. Loans | | 0.03 | % | 0.13 | % | 0.18 | % | 0.22 | % |
Price to LTM earnings | | 15.8 | x | NA | | 18.7 | x | 16.7 | x |
Market Area: Six-county region in which OSBC has branches.
Illinois: Publicly-traded bank holding companies in Illinois.
National $1-$3b: Banks with assets between $1 billion and $3 billion.
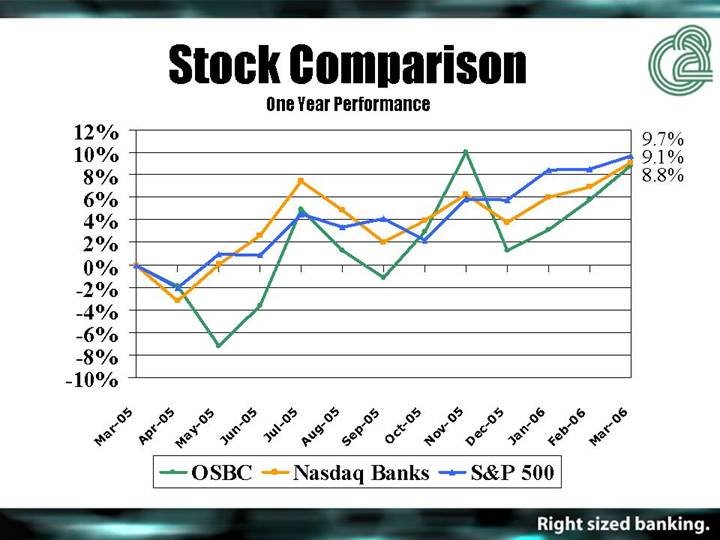
Stock Comparison
One Year Performance
[CHART]
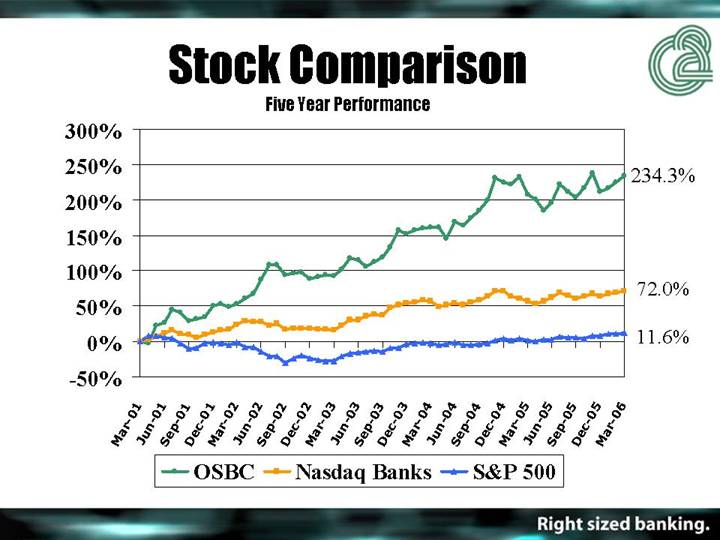
Stock Comparison
Five Year Performance
[CHART]