Exhibit 13.1

2007 ANNUAL REPORT

2007 Annual Report
Table of Contents
Letter to Stockholders | 2 |
| |
5-Year Performance Comparison | 3 |
| |
Financial Highlights | 4 |
| |
Management’s Discussion | 6-17 |
| |
Consolidated Balance Sheets | 19 |
| |
Consolidated Statements of Income | 20 |
| |
Consolidated Statements of Cash Flows | 21 |
| |
Consolidated Statements of Changes in Stockholders’ Equity | 22 |
| |
Notes to Consolidated Financial Statements | 23-50 |
| |
Report of Independent Auditors | 51-52 |
| |
Corporate Information | 53 |
| |
Bancorp and Subsidiaries Consolidating Balance Sheet | 54 |
| |
Bancorp Directors | 55 |
| |
Old Second Locations Map | 56 |
1
2007 Year End Letter to Stockholders
The year 2007 was a challenging year for the entire banking industry.
Despite the difficult economic climate, Old Second Bancorp, Inc., had a number of very positive results, especially when compared to others in the banking industry. Net income was $24.0 million, up slightly from the prior year’s income of $23.7 million, Earnings per share were $1.89 compared to $1.75 in 2006, an 8% increase, and our return on equity was 16.13% versus 15.29% in 2006.
Real estate markets and the economy were soft and slowed considerably in the second half of 2007. Despite these demanding market conditions, our net charge-offs were only 0.03% of loans, or $546,000, which compares very favorably to the rest of the industry.
We recognized a slow down in margin growth and earnings early in 2007 and undertook a number of cost saving initiatives that helped to improve the bottom line. These initiatives included headcount reductions of 8.5%, the elimination of our separate charters, merging of the mortgage company into the bank, closing three branches, centralizing operations and implementing other improvements that led to efficiencies.
Also, as part of capital management, we issued $25 million in trust preferred securities and used the proceeds to buy back our stock.
On November 5, 2007, the company entered into an agreement to acquire HeritageBanc, Inc. On February 8, 2008, we closed this acquisition and now have expanded our footprint into Will and Southern Cook counties. These new areas provide us with great growth opportunities and give us branches in the majority of top growth markets in northern Illinois. With this acquisition, we now have 35 branches and over $3 billion in assets. We also continue to have the #1 market share in Kane and Kendall counties and have expanded our presence in the Elgin and Joliet/Plainfield markets.
One of the brighter areas in 2007 was our wealth management group, which had assets grow to $1.2 billion while our revenue generated by that group grew from $8.3 million to $9.6 million, or an increase of $1.3 million (+ 16%) over the prior year.
We continue to grow our commercial lending group and have made some good additions to that area with a stronger emphasis on commercial and industrial lending.
On the retail side, our emphasis on sales and service helped us to attain 6,638 new checking accounts and increase our banking households to 56,300. Our “right-size” strategy of offering the best of what large banks offer with the quality and service offered by smaller banks continues to be very effective and I believe is what makes us the “bank of choice” in all of our major markets.
We expect economic and market conditions to continue to be a challenge in 2008. Real estate markets will likely stay soft and may not improve until later in 2008 and competition in our markets will remain very intense.
2
However, I remain optimistic about our performance relative to our peers. We believe that the strong demographics in our markets should allow us to experience growth levels above most other areas and should allow us to rebound faster than these other areas.
Our employees continue to be our #1 asset and strength. I am very encouraged by their efforts and attitudes and would like to especially thank them, especially in these trying times.
I would also like to thank our Directors for their guidance, our stockholders for their belief in us and our customers for their continued dedication.

| | |

|
William B. Skoglund Chairman |
5-Year Performance Comparison

Date | | Old Second
Bancorp | | NASDAQ
Bank Index | | S&P 500 | |
December 2002 | | $ | 100.00 | | $ | 100.00 | | $ | 100.00 | |
December 2003 | | $ | 136.31 | | $ | 133.01 | | $ | 128.63 | |
December 2004 | | $ | 178.49 | | $ | 151.12 | | $ | 142.59 | |
December 2005 | | $ | 174.09 | | $ | 148.22 | | $ | 149.58 | |
December 2006 | | $ | 169.87 | | $ | 168.65 | | $ | 173.15 | |
December 2007 | | $ | 158.62 | | $ | 135.14 | | $ | 182.64 | |
3
Old Second Bancorp, Inc. and Subsidiaries
Financial Highlights
(In thousands, except share data)
| | 2007 | | 2006 | | 2005 | | 2004 | | 2003 | |
Balance sheet items at year-end | | | | | | | | | | | |
Total assets | | $ | 2,658,576 | | $ | 2,459,140 | | $ | 2,367,830 | | $ | 2,105,019 | | $ | 1,839,689 | |
Loans, gross | | 1,891,110 | | 1,763,912 | | 1,704,382 | | 1,509,076 | | 1,319,538 | |
Deposits | | 2,113,618 | | 2,062,693 | | 1,935,278 | | 1,798,849 | | 1,524,634 | |
Securities sold under agreement to repurchase | | 53,222 | | 38,218 | | 57,625 | | 45,242 | | 47,848 | |
Federal funds purchased | | 165,100 | | 54,000 | | 170,000 | | 49,000 | | 102,700 | |
Other short-term borrowings | | 82,873 | | 73,090 | | 1,825 | | 26,786 | | 3,346 | |
Junior subordinated debentures | | 57,399 | | 31,625 | | 31,625 | | 31,625 | | 31,625 | |
Note payable | | 18,610 | | 16,425 | | 3,200 | | 2,700 | | 500 | |
Stockholders’ equity before other comprehensive income (loss) | | 147,918 | | 161,100 | | 156,824 | | 134,664 | | 113,989 | |
Stockholders’ equity | | 149,889 | | 158,555 | | 152,262 | | 134,988 | | 116,994 | |
| | | | | | | | | | | |
Results of operations for the year ended | | | | | | | | | | | |
Net interest and dividend income | | $ | 68,598 | | $ | 71,199 | | $ | 73,999 | | $ | 68,359 | | $ | 62,376 | |
Provision for loan losses | | 1,188 | | 1,244 | | 353 | | (2,900 | ) | 3,251 | |
Net income | | 23,972 | | 23,656 | | 27,683 | | 26,287 | | 22,108 | |
| | | | | | | | | | | |
Per share data | | | | | | | | | | | |
Basic earnings | | $ | 1.92 | | $ | 1.77 | | $ | 2.05 | | $ | 1.96 | | $ | 1.57 | |
Diluted earnings | | 1.89 | | 1.75 | | 2.03 | | 1.94 | | 1.56 | |
Dividends declared | | 0.59 | | 0.55 | | 0.51 | | 0.46 | | 0.40 | |
Stockholders’ equity as of December 31 | | 12.34 | | 12.08 | | 11.26 | | 10.06 | | 8.74 | |
| | | | | | | | | | | |
Weighted average diluted shares outstanding | | 12,655,306 | | 13,526,603 | | 13,661,024 | | 13,535,881 | | 14,198,908 | |
Weighted average basic shares outstanding | | 12,508,551 | | 13,367,062 | | 13,486,598 | | 13,413,263 | | 14,096,244 | |
Shares outstanding at year-end | | 12,149,296 | | 13,127,292 | | 13,520,073 | | 13,424,346 | | 13,387,480 | |
Note: On June 15, 2004, the board of directors declared a 2-for-1 stock split effected in the form of a stock dividend payable on July 28, 2004 to stockholders of record on July 16, 2004. All references to the number of common shares and per share amounts have been restated as appropriate to reflect the effect of the stock splits for all periods presented.
4
Old Second Bancorp, Inc.
and Subsidiaries
Management’s Discussion
and Analysis of Financial Condition
and Results of Operations
5
Old Second Bancorp, Inc. and Subsidiaries
Management’s Discussion and Analysis
of Financial Condition and Results of Operations
Overview
The following discussion provides additional information regarding the Company’s operations for the twelve-month periods ending December 31, 2007, 2006, and 2005, and financial condition at December 31, 2007 and 2006. This discussion should be read in conjunction with “Selected Consolidated Financial Data” and the Company’s consolidated financial statements and the accompanying notes thereto included or incorporated by reference elsewhere in this document.
Old Second Bancorp, Inc. is a financial services company with its main headquarters located in Aurora, Illinois. The consolidated financial statements include Old Second Bancorp, Inc. and its wholly-owned subsidiaries, which are together referred to as the “Company”:
· Old Second National Bank (“the Bank”).
· Old Second Financial, Inc., which provides insurance agency services.
· Old Second Capital Trust I, which was formed for the exclusive purpose of issuing trust preferred securities in an offering that was completed in July 2003. Old Second Capital Trust I is an unconsolidated subsidiary of the Company. See Notes A and J to the consolidated financial statements for further discussion.
· Old Second Capital Trust II, which was formed for the exclusive purpose of issuing trust preferred securities in an offering that was completed in April 2007. Old Second Capital Trust II is also an unconsolidated subsidiary of the Company and additional information is available in the notes cited above.
· Old Second Affordable Housing Fund, L.L.C., which was formed for the purpose of providing down payment assistance for home ownership to qualified individuals.
· Old Second Management, LLC (“OSM”), which was formed for the purpose of providing a possible future source of capital as well as providing certain tax advantages. Old Second Bank owns 100% of the common stock of OSM. Old Second Realty, LLC (“OSR”) is a Delaware real estate investment trust and 100% of the common stock of OSR is owned by OSM. As of January 2, 2007, there were various minority holders of preferred stock in OSR.
· Old Second Acquisition, Inc., which was formed as part of the November 5, 2007 Agreement and Plan of Merger between the Company, Old Second Acquisition, Inc., a wholly-owned subsidiary of the Company, and HeritageBanc, Inc. (“Heritage”). The parties consummated the merger on February 8, 2008, at which time, Old Second Acquisition, Inc. was merged with and into Heritage with Heritage as the surviving corporation as a wholly-owned subsidiary of the Company. Additionally, the parties merged Heritage Bank, a wholly- owned subsidiary of Heritage, with and into Old Second National Bank, with Old Second National Bank as the surviving bank. After the completion of the merger transaction, Heritage was dissolved and is no longer an existing subsidiary.
Inter-company transactions and balances are eliminated in consolidation. The results discussed in this document do not include any operations of Heritage as that transaction closed in 2008.
The Company provides financial services through its thirty- five banking locations located in Cook, Kane, Kendall, DeKalb, DuPage, LaSalle and Will counties in Illinois. One new location was opened on the western edge of Elgin in May 2007. With the February 2008 Heritage acquisition, the Company expanded its franchise into southwestern Cook County and the desirable, higher growth markets of the south Chicago suburbs by adding six additional banking locations. This allowed the Company to fill in its footprint surrounding the Chicago metropolitan area. With the application of relationship focused banking strategies, the Company expects to provide the new client base with wealth management services, and expanded mortgage, treasury and retail services that Old Second Bank is able to offer in addition to traditional loan and deposit products. The Company paid consideration of $43.0 million in cash and 1,563,636 shares of the Company’s stock valued at $27.50 per share to consummate the acquisition on February 8, 2008. The final terms of the credit facilities established with LaSalle Bank to complete the acquisition are detailed in Note J. Additional organizational changes that occurred during 2007 are also detailed in Note A.
Our primary deposit products are checking, NOW, money market, savings, and certificate of deposit accounts, and the Company’s primary lending products are commercial mortgages, construction lending, commercial and industrial loans, residential mortgages and installment loans. Major portions of the Company’s loans are secured by various forms of collateral including real estate, business assets, and consumer property while borrower cash flow is the primary source of repayment. The Bank also engages in trust operations.
The Company recorded net income of $24.0 million or $1.89 diluted earnings per share in 2007, which compares with
6
earnings of $23.7 million or $1.75 per diluted share in 2006, and $27.7 million, or $2.03 per diluted share in 2005. Basic earnings per share were $1.92 in 2007, $1.77 in 2006, and $2.05 in 2005. In 2007, balance sheet growth in earning assets, an increase in noninterest income, a reduction in provision for income taxes, and a decrease in advertising and other expenses combined to offset a lower net interest margin and increased personnel and occupancy costs. Earnings also improved in 2007 due to reduced expense from nonrecurring 2006 categories such as loss on settlement of pension obligation, and amortization of core deposit intangible assets, net of a $1.0 million adjustment, which reduced interest expense from short-term borrowings. The May 2007 repurchase of 973,251 shares of common stock reduced the shares outstanding, which also increased earnings per share. The provision for loan losses for 2007 substantially equaled the 2006 expense of $1.2 million with no fourth quarter addition recorded in either period.
Net interest income declined $2.6 million (3.7%) to $68.6 million in 2007, compared to a decrease of $2.8 million (3.8%) to $71.2 million in 2006. Even though there was an increase in earning assets in both years, the growth in earning assets in 2007 continued to be offset by a lower net interest margin. Average earning assets grew $136.6 million or 6.2% in 2007. Despite that growth, the net interest margin (tax equivalent basis) was 3.05% in 2007 and 3.34% in 2006. Year-end total assets were $2.66 billion as of December 31, 2007, an increase of $199.4 million (8.1%) from $2.46 billion as of December 31, 2006. Average assets were $2.52 billion, $2.38 billion, and $2.24 billion in 2007, 2006, and 2005, respectively.
Application of critical accounting policies
The Company’s consolidated financial statements are prepared in accordance with United States generally accepted accounting principles and follow general practices within the banking industry. Application of these principles requires management to make estimates, assumptions, and judgments that affect the amounts reported in the consolidated financial statements and accompanying notes. These estimates, assumptions, and judgments are based on information available as of the date of the consolidated financial statements. Future changes in information may affect these estimates, assumptions, and judgments; which, in turn, may affect amounts reported in the consolidated financial statements.
All significant accounting policies are presented in Note A to the consolidated financial statements. These policies, along with the disclosures presented in the other financial statement notes and in this discussion, provide information on how significant assets and liabilities are valued in the financial statements and on how those values are determined.
Management has determined that the Company’s accounting policies with respect to the allowance for loan losses is the accounting area requiring subjective or complex judgments that is most important to the Company’s financial position and results of operations, and therefore, is the Company’s only critical accounting policy. The allowance for loan losses represents management’s estimate of probable credit losses inherent in the loan portfolio. Determining the amount of the allowance for loan losses is considered a critical accounting estimate because it requires significant judgment and the use of estimates related to the amount and timing of expected future cash flows on impaired loans, estimated losses on pools of homogeneous loans based on historical loss experience, and consideration of current economic trends and conditions, all of which may be susceptible to significant change. The loan portfolio also represents the largest asset type on the consolidated balance sheet. The allowance for loan losses is a valuation allowance for credit losses, increased by the provision for loan losses and decreased by charge-offs less recoveries. Management estimates the allowance balance required using an assessment of various risk factors including, but not limited to, past loan loss experience, known and inherent risks in the portfolio, information about specific borrower situations and estimated collateral values, volume trends in delinquencies and nonaccruals, economic conditions, and other factors. Allocations of the allowance may be made for specific loans, but the entire allowance is available for losses inherent in the loan portfolio. A loan is considered impaired when it is probable that not all contractual principal or interest due will be received according to the original terms of the loan agreement. Management defines the measured value of an impaired loan based upon the present value of the future cash flows, discounted at the loan’s original effective interest rate, or the fair value of underlying collateral, if the loan is collateral dependent. Impaired loans at December 31, 2007 and 2006 were $25.8 million and $9.2 million respectively. In addition, a discussion of the factors driving changes in the amount of the allowance for loan losses is included in the Provision for Loan Losses section that follows.
Results of operations
Net interest income
Net interest income is the difference between interest income earned on earning assets and interest expense paid on interest bearing liabilities. As such, net interest income is affected by changes in the volume and yields on earning assets and the volume and rates paid on interest bearing liabilities. Net interest margin is the ratio of tax-equivalent net interest income to average earning assets. Decreases in net interest income during this period were primarily the result of the increase in the cost of funds exceeding the increase in the yield on earning assets. Even though the average tax- equivalent yield on earning assets increased 22 basis points from 6.45% in 2006, to 6.67% in 2007, the cost of funds on interest bearing liabilities increased 54 basis points from 3.62%, to 4.16% in the same period. The average net interest margin (tax equivalent) was 3.05%, 3.34%, and 3.64% in 2007, 2006, and 2005, respectively.
Net interest income was $68.6 million in 2007, $71.2 million in 2006, and $74.0 million in 2005. Average earning assets
7
were $2.36 billion in 2007, an increase of $136.6 million, or 6.2%, from $2.22 billion in 2006. Average earning assets were $2.11 billion in 2005. Average portfolio loans increased $76.9 million, or 4.4%, from $1.75 billion in 2006 to $1.83 billion in 2007. During 2006, average portfolio loans increased $130.8 million, or 8.1%, from $1.62 billion in 2005, to $1.75 billion in 2006. Average interest bearing liabilities were $2.09 billion in 2007, an increase of $140.7 million, or 7.2%, in 2006. Average interest bearing liabilities were $1.95 billion in 2006, an increase of $127.7 million, or 7.0%, from $1.82 billion in 2005. In 2006, management recorded an adjustment to interest expense on other short-term borrowings of $961,000 due to a reduction in estimate for accrued interest payable. Approximately $528,000 of this reduction related to 2006.
Changes in deposit funding composition also continued to have the effect of increasing interest costs and lowering the net interest margin in 2007. The average balances of lower- cost sources of funds such as interest-bearing transaction accounts and savings accounts declined $8.7 million, or 3.3%, and $12.1 million, or 10.6%, respectively, from December 31, 2006 to December 31, 2007. At the same time, noninterest-bearing deposits increased by a nominal amount while higher-cost sources of funds such as money market and time deposits increased $84.0 million, or 20.2% and $38.3 million, or 4.0%, respectively. Non-deposit funding costs also increased significantly in 2007 primarily due to the increase in average balances that occurred across all borrowing categories with the largest increase in the overnight borrowing category of federal funds purchased.
Given the Company’s mix of negatively gapped interest earning assets and interest bearing liabilities at December 31, 2006, the net interest margin was susceptible to a decrease in 2007, which exhibited a generally static rate environment during most of the year. The first half of year 2007 was also characterized by an inverted yield curve whereby shorter-term rates were higher than longer-term rates. The Federal Open Market Committee (“FOMC”) began to decrease the target for the Federal Funds rate by announcing a 50 basis points reduction on September 18, which was followed by two successive 25 basis point decreases on October 31 and December 11, 2007. These decreases lowered the target rate from 5.25% at January 1, 2007 to 4.25% at December 31, 2007. In 2007, the Bank’s prime rate decreased in correlation with the Federal Funds rate, moving from 8.25% on January 1, 2007 to 7.25% as of December 31, 2007. Increasing interest costs associated with generating continued deposit growth and other sources of funds in 2007 contributed to a decline in the net interest margin. Since the Company continued to be liability sensitive at December 31, 2007, it was generally positioned to benefit from interest rate decreases including the recent announcements of 75 and 50 basis points cuts on January 22 and 31, 2008 respectively. The Company’s liability sensitive position was somewhat reduced however, with the February 8, 2008 acquisition of Heritage.
Provision for loan losses
The Company recorded a $1.2 million provision for loan losses in both 2007 and 2006 with no provision in the fourth quarter of either year. The provision for loan losses was $353,000 in 2005. Provisions for loan losses are made to provide for probable and estimable losses inherent in the loan portfolio. Nonperforming loans increased to $6.0 million at December 31, 2007 from $2.2 million at December 31, 2006 and were $6.6 million at December 31, 2005. The increase in nonperforming loans in 2007 was primarily due to the addition of four real estate construction loans and one adjustable rate mortgage loan that were added in the fourth quarter, and a residential home equity loan that was added in the third quarter. The advance ratios of balances outstanding to the estimated collateral value for the fourth quarter loan additions are sufficient under the Company’s established credit review policies. The Company is in a first lien position on the home equity loan. All five of the nonperforming loan relationships identified in the fourth quarter were placed on nonaccrual status. Even with the current developments in the loan portfolio, management determined that no additional provision was required in the fourth quarter of 2007. In large part, this is because management had observed slower real estate building and development activity in the Company’s market areas during 2006. Even though the Company’s borrowers generally continued to meet their obligations during 2006, management believed that the general risk in this sector was greater than before, and increased the provision for loan losses despite a decrease in nonperforming loans. Management acted upon its growing concern with the general commercial real estate market, as well as the large concentration of commercial real estate loans held by the Company and increased its qualitative risk factors for this sector starting in 2006.
The ratio of the allowance for loan losses to nonperforming loans was 281.95% as of December 31, 2007, compared with 731.06% as of December 31, 2006 and 232.36% at December 31, 2005. Nonperforming loans are defined as non-accrual loans, restructured loans, and loans past due ninety days or more and still accruing interest. Net charge-offs in 2007, 2006 and 2005 were $546,000, $380,000, and $519,000, respectively. When compared with total loans, net charge-offs as a percentage of total average loans were 0.03%, 0.02%, and 0.03% in 2007, 2006, and 2005. The loan portfolio continues to represent the largest asset on the Consolidated Balance Sheets. When measured as a percentage of loans outstanding, the allowance for loan losses was 0.89% as of December 31, 2007 and 0.92% at December 31, 2006.
The allowance for loan losses consists of three components: (i) specific allocations established for losses resulting from an analysis developed through reviews of individual loans for which the recorded investment in the loan exceeds the measured value of the loan; (ii) reserves based on historical loss experience for each loan category; and (iii) reserves based on general current economic conditions as well as specific economic and other factors believed to be relevant to the Company’s loan portfolio. Management evaluates the
8
sufficiency of the allowance for loan loss based on the combined total of each of these components. The components of the allowance for loan losses represent an estimation done pursuant to Statement of Accounting Standard (“SFAS”) 5, Accounting for Contingencies, and SFAS 114, Accounting by Creditors for Impairment of a Loan; and SFAS 118 which amends several provisions of SFAS 114.
Specific allocations
Management reviews on a quarterly basis certain loans on nonaccrual, loans over 90 days past due, troubled debt restructurings or any loans considered doubtful or loss. The individual loan officers analyze these loans with the results reported to the Loan Review Committee on a Credit Management Report. From that report, management determines the amount of specific allocations by reviewing, on a credit-by credit basis, all loans considered impaired under SFAS 114 as amended by SFAS 118 as well as all problem and watch loans. SFAS 114 defines impaired loans as loans where, based on current information and events, it is probable that a creditor may be unable to collect all amounts due according to the original contractual terms of the loan agreement.
A problem loan is defined by the Company’s loan policy as “A credit that is inadequately protected by the current sound worth and paying capacity of the borrower or of the collateral pledged, if any. Loans so classified have a well-defined weakness that jeopardizes the liquidation of the debt. These loans are characterized by the distinct possibility that the Bank will sustain some loss if the deficiencies are not corrected. Loss potential, while existing in the aggregate amount of substandard loans, does not have to exist in individual loans classified”.
Specific allocations are discussed at the quarterly watch list meeting. The Vice President of Loan Review chairs this meeting. The committee consists of the Company’s President, Regional Senior Vice Presidents, the Executive Vice President of Credit & Chief Risk Officer, and other senior lenders who are members of the loan committee.
As of December 31, 2007, the Company had eighteen nonaccrual loans totaling $5.3 million with a specific allocation of $136,000 for those loans. The Company has no specific allocations for restructured or past due loans included in the allowance. As of December 31, 2006, the Company had fourteen nonaccrual loans totaling $1.6 million with a specific allocation of $133,000 for those loans. As of December 31, 2005, the Company had eleven nonaccrual loans totaling $3.8 million with an allocation of $476,000 for those loans. Impaired loans at December 31, 2007, 2006, and 2005 were $25.8 million, $9.2 million, and $8.5 million, respectively. The 2007 increase in impaired loans was primarily due to the third quarter addition of one commercial real estate borrowing relationship that has a specific allocation of approximately $763,000.
Historical reserves and management allocations
The component of the allowance for loan losses based on historical loan loss experience is determined using historical charge-off data for the last five years, with more weight placed on the most recent years. This calculation is done quarterly. Management considers a variety of factors to determine the appropriate level of allowance for inherent loan losses including but not limited to, past loan loss experience, known and inherent risks in the portfolio, information about specific borrower situations and estimated collateral values, volume trends in delinquencies and nonaccruals, economic conditions, and other factors. Allocations of the allowance may be made for specific loans, but the entire allowance is available for losses inherent in the loan portfolio. Beginning in 2006, the large concentration of commercial real estate loans held by the Company and management’s observation of slower building and development activity in the commercial real estate sector were specific considerations in determining the factors used to estimate the allowance for loan loss. All factors are considered on a quarterly basis and are adjusted when appropriate. In addition, various regulatory agencies, as an integral part of their examination process, periodically review the Company’s allowance for loan losses. Such agencies may require the Company to make additional provisions to the allowance based on their judgments about information available to them at the time of their examination.
The general component of the allowance recognizes probable inherent, but undetected, losses in the loan portfolio. Regardless of how management analyzes customer performance, ratings migration, economic conditions and interest rate risk, management believes there are additional potential risks that are unaccounted for in the process of making loans. This is due to several factors including, but not limited to:
· Timing delays in receiving information regarding a customer’s financial condition;
· Changes in individual business climates;
· The judgmental nature of individual loan evaluations and collateral assessments; and
· The open interpretation of economic trends.
The analysis of these factors involves a high degree of judgment by management. Because of the imprecision surrounding these factors, the bank estimates a range of inherent losses and maintains a general allowance that is not allocated to a specific category.
Historically, the Company has had minimal credit losses. The current allowance is weighted heavily toward the real estate portfolio due to its size in relation to the other portions of our portfolio. Starting in 2006, the Company made some reallocations in our reserves based on the review of the portfolio, the current economic conditions and the credit quality of the portfolio. While there can be no assurance that the allowance for loan losses will be adequate to cover all
9
losses, management believed that the allowance for loan losses was adequate at December 31, 2007.
Noninterest income
Noninterest income was $31.9 million for the year 2007, an increase of $3.1 million, or 11.0%, as compared to 2006. The increase in noninterest income in 2007 was primarily the result of increased income from trust department and mortgage banking operations. Noninterest income was $28.7 million in 2006 compared to $28.1 million in 2005.
Trust income was $8.7 million in the year 2007, an increase of $1.1 million, or 14.1%, from 2006 due principally to increased volume in estate administration activity coupled with an increase in assets under management. Assets under management were $1.1 billion, $1.0 billion, and $959.5 million at December 31, 2007, 2006, and 2005, respectively. Trust income increased to $7.6 million in 2006, an increase of $951,000, or 14.3%, from $6.6 million in 2005. Trust income has increased generally over all three periods due to greater volumes in both assets under management and estate administration activities. Assets under management increased in large part because of successful new business development activities.
Service charges on deposits were $8.6 million in 2007, an increase of $224,000, or 2.7%, from $8.3 million in 2006, primarily due to increased volumes from overdraft protection service fees. Service charges on deposits were $8.3 million in 2005. Mortgage banking income, including net gain on sales of mortgage loans, secondary market fees, and servicing income was $5.6 million in 2007, an increase of $751,000, or 15.5%, from $4.9 million in 2006. The largest increase in income from mortgage operations was in net gain on sales of mortgage loans, which resulted largely from a significant revision to secondary market execution processes. Mortgage banking income is largely volume-driven and mortgage activity is susceptible to changes in interest rates and general economic conditions. Mortgage-related noninterest income, principally gains on sales of mortgage loans, totaled $6.7 million in 2005. Loans sold were $232.4 million in 2007, $288.8 million in 2006, and $396.7 million in 2005. Originations in 2007 decreased as the decline in mortgage rates, which would typically spur an increase in refinancing activity, did not begin until late in 2007. Similarly, the decrease in originations in 2006 was primarily the result of rising mortgage rates during the first half of 2006, which decreased demand for mortgages.
Gains on sales of securities in 2007 were $674,000, an increase of $256,000, or 61.2%, as compared with $418,000 for 2006. There was a $14,000 loss recorded in 2005. Bank owned life insurance (“BOLI”) income decreased $41,000, or 2.0%, from $2.1 million to $2.0 million in 2007, due in large part to the decreasing interest rates available on the underlying insurance investments. BOLI income was $985,000 in 2005, but the Company purchased $20.0 million of BOLI during the fourth quarter of 2005, which substantially increased income in this category in 2006.
Interchange income from debit card usage was $2.0 million in 2007, an increase of $226,000, or 12.7%, from $1.8 million in 2006. The Company continued to increase the number of cards outstanding in 2007 because of successful cross-selling and other marketing efforts, and as customers continued to show a preference for this form of payment. Debit card interchange income was $1.5 million in 2005. Other income increased $661,000, or 18.1%, to $4.3 million in 2007, from $3.7 million in 2006. The comparative improvement in 2007 performance was primarily due to increased levels of fee income from processing of merchant credit card sales combined with annuity sales, mutual fund and letter of credit fees. Other income decreased to $3.7 million in 2006 from $4.0 million in 2005, principally due to a decrease in letter of credit fees in 2006.
Noninterest expense
Noninterest expense was $66.5 million during 2007, an increase of $1.3 million, or 2.1%, from $65.1 million in the prior year. Noninterest expense totaled $60.5 million in 2005. The efficiency ratio was 64.1%, 63.3%, and 57.6% for December 31, 2007, 2006, and 2005, respectively. This ratio measures noninterest expense as a percentage of the sum of net tax-equivalent interest income plus noninterest income. Because a financial institution’s largest noninterest expense is generally the cost of salary and benefits, management of this cost has a significant impact on efficiency. In 2007, salaries and benefits were $38.1 million compared to $35.9 million in 2006, an increase of $2.2 million or 6.2%. The increase in expense was primarily due to increases in bonus expense and profit sharing accruals as well as increases in mortgage and brokerage commissions coupled with increases in stock compensation and health insurance costs. The Company generally experiences increases in this category due to annual increases in salary and other compensation coupled with rising health care costs, but an evaluation of 2007 events is also required to understand current year fluctuations. The full time equivalent employee (“FTE”) figure decreased from 582 at December 31, 2006 to 541 at December 31, 2007. The FTE tally was smaller at December 31, 2007 primarily because of the 8.5% reduction in available positions that was announced April 13, 2007. Despite a reduction in workforce, there were overall increases in salaries and benefits as the Company shifted toward a performance based pay structure by placing emphasis upon commissions and bonus remuneration. The Company expects that the move away from the defined benefit pension plan that was settled in 2006 to the enhanced 401K and profit sharing structure will provide further opportunity to align individual performance with Company goals.
For 2006, salaries and benefits were $35.9 million compared to $35.6 million in 2005, and the nominal increase of $233,000 or 0.7% was due in large part to a decrease in accrued management bonus expense in 2006. The full time equivalent employee count increased from 548 at December 31, 2005 to 582 at December 31, 2006, primarily due to the increased staffing requirements at the five new banking locations opened in 2006.
10
Occupancy expenses were $5.4 million in 2007, $4.6 million in 2006, and $3.7 million in 2005. Furniture and equipment expenses were $6.4 million in 2007, $5.3 million in 2006, and $5.1 million in 2005. In 2007, net occupancy and furniture and equipment expenses increased $1.9 million, or 19.7%, from 2006. That increase was primarily attributable to the combined effect of the Company’s expansion and development into new markets, network and system integration costs from the bank charter consolidation, and third and fourth quarter 2007 recognition of accelerated leasehold depreciation and other associated impaired asset expense. The latter items resulted primarily from the July 2007 closing of three leased branches that had market overlap with existing locations. The bulk of future savings from these closures will begin in the first quarter of 2008 as two of the leases have now terminated. The expiration dates changed to December 31, 2007 and February 23, 2008 as the Company negotiated an accelerated exit from an original expiry date of March 31, 2009 at one of the closed locations while maintaining automated teller machine services at that site. The Company opened five new retail locations in 2006 and a new location on the western edge of Elgin in May 2007 and began the process of relocating a loan production office late in 2007 that will be completed in the first quarter of 2008. In 2006, net occupancy and furniture and equipment expense increased $1.1 million, or 12.5% from 2005. As mentioned previously, the Company expanded its market presence in 2006, which also increased the related facility expenses and was the primary cause of this increase.
Significant decreases in advertising expense were realized in 2007 in comparison to both 2006 and 2005. Other expense also decreased $525,000, or 3.4%, from $15.5 million in 2006 to $15.0 million in 2007, as the Company continued to emphasize cost control and review procedures. Lower expense levels were recorded in several categories, with some of the largest reductions in other employee related expenditures such as recruitment and travel as well as decreased audit fees. Other expenses had increased $1.5 million, or 10.8%, from $14.0 million in 2005, to $15.5 million in 2006. The increases in 2006 were primarily due to costs associated with the amortization and valuation of mortgage servicing rights, increased audit and compliance including ongoing compliance with Sarbanes-Oxley mandates, loan production related expenditures, rising costs associated with automatic teller machine operations and new employee recruitment fees.
Income taxes
The Company’s provisions for Federal and State of Illinois income taxes were $8.8 million, $9.9 million, and $13.6 million during the years ended December 31, 2007, 2006, and 2005. The effective income tax rates for these years were 26.9%, 29.4%, and 33.0%. Increased levels of tax-exempt income from securities helped to reduce income tax expense when comparing 2007 to 2006. In addition to the increased volume of tax-exempt assets, the average tax-equivalent yield on tax-exempt securities held by the Company increased from 5.47% as of December 31, 2006 to 5.98% or 51 basis points as of December 31, 2007. The reduction in effective tax rate in the latter two years was primarily attributable, however, to the formation of a real estate investment trust (REIT) in the fourth quarter of 2006. The REIT holds certain commercial real estate loans, and other real estate loans that were previously held by our main bank subsidiary. In addition to income tax benefits, which lowered the effective tax rate, the REIT ownership structure also provides the Company with an alternate vehicle for raising future capital as desired. A late 2007 change to Illinois tax law related to the deductibility of REIT dividends will eliminate the recognition of a substantial portion of the tax benefits related to this ownership structure beginning January 1, 2009.
Financial condition
Total assets were $2.66 billion as of December 31, 2007, an increase of $199.4 million, or 8.1%, from $2.46 billion as of December 31, 2006. The most significant growth in assets was in loans, which were $1.89 billion as of December 31, 2007, an increase of $127.2 million, or 7.2%, from $1.76 billion as of December 31, 2006. Total deposits increased $50.9 million, or 2.5%, during 2007. The largest increase in funding, however, was in federal funds purchased which grew $111.1 million, or 205.7%, to $165.1 million at December 31, 2007. Junior subordinated debentures also increased to $57.4 million, an increase of $25.8 million, or 81.5%, from $31.6 million at December 31, 2006.
Investments
Securities available for sale increased $88.0 million during 2007, from $472.9 million as of December 31, 2006, to $560.9 million as of December 31, 2007. At December 31, 2007, U.S. government agency securities and mortgage-backed agency securities were $210.6 million and $96.9 million respectively. The Company decreased its position in agency securities by $56.6 million, or 21.2%, as of December 31, 2007 while it simultaneously increased mortgage-backed agency securities by $77.3 million, or 394.2%. U.S. government agency securities comprised 37.5% of the portfolio as of December 31, 2007, and 56.5% of the portfolio as of December 31, 2006 whereas the mortgage-backed agency securities represented 17.3% and 4.1% of the investment portfolio as of the same dates. As of December 31, 2007, the Company held $73.9 million in collateralized mortgage obligations versus $26.7 million a year earlier. Mortgage-backed agency securities and collateralized mortgage obligations generally offered a higher rate of return during 2007. At December 31, 2007, state and political subdivision securities were $159.8 million, an increase of $10.1 million, or 6.8%, from $149.6 million a year earlier. State and political subdivision securities comprised 28.5% of the portfolio as of December 31, 2007, compared to 31.6% of the portfolio as of December 31, 2006. The net unrealized gains in the portfolio were $3.3 million at December 31, 2007 as compared to net unrealized losses of $4.2 million as of December 31, 2006, primarily due to changes in interest rates.
11
Loans
Total loans were $1.89 billion as of December 31, 2007, an increase of $127.2 million, or 7.2%, from $1.76 billion as of December 31, 2006. The largest increase was in residential real estate loans, which rose $47.3 million, or 8.1%, since December 31, 2006. Commercial real estate and construction and development loans increased $28.8 million and $24.4 million, respectively, since December 31, 2006. The loan portfolio generally reflects the economic profile of the communities in which the Company operates. Because the Company is located in markets with open areas for growth, real estate lending (including commercial, residential, and construction) comprises a significant portion of the portfolio. These categories comprised 88.1% of the portfolio as of December 31, 2007 compared to 88.7% of the portfolio as of December 31, 2006. The commercial and industrial loan sector also increased $21.5 million, or 12.2%, to $197.1 million at December 31, 2007, from $175.6 million at December 31, 2006. At the same time, installment loans increased $5.0 million, or 21.5%, to $28.4 million from $23.3 at December 31, 2006. The 2007 loan growth was substantially from within the Company’s market area including a nominal amount of participations purchased. The Company does not have any material direct exposure to sub prime loan products, as it has focused real estate lending on commercial real estate and construction and development loans, as well as on traditional loan products to residential borrowers.
The provision for loan losses was $1.2 million in both 2007 and 2006, respectively. As discussed in the Provision for Loan Losses section above, management identified a growing concern with the commercial real estate market generally, and the large concentration of commercial real estate loans held by the Company starting in 2006. These factors contributed to the increase in the provision for 2006 compared to 2005, in spite of the decline in nonperforming loans.
One measure of the adequacy of the allowance for loan losses is the ratio of the allowance to total loans. The allowance for loan losses as a percentage of total loans was 0.89% as of December 31, 2007, compared to 0.92% as of December 31, 2006. In management’s judgment, an adequate allowance for estimated losses has been established; however, there can be no assurance that losses will not exceed the estimated amounts in the future.
Management, along with many other financial institutions, remains cautious about the current economic environment and outlook. Furthermore, a sustained slowdown in the real estate market could adversely affect consumer confidence and collateral values. These events adversely affect cash flows generally for both commercial and individual borrowers, and as a result, the Company could experience increases in problem assets, delinquencies, and losses on loans in future periods.
Sources of funds
One of the Company’s primary sources of funds is customer deposits. Total deposits increased $50.9 million, or 2.5%, during 2007 to $2.11 billion as of December 31, 2007. Noninterest-bearing deposits decreased $9.1 million, or 3.2%, while NOW and savings deposits decreased $10.2 million, or 4.0%, and $7.8 million, or 7.5%, respectively. At the same time, money market accounts increased $59.5 million, or 13.3%. In 2007, time deposits increased $18.6 million, or 1.9%. The 2007 growth in money market accounts resulted from depositor preference for liquidity and check accessibility not offered in a traditional savings account and particularly as time deposit rates decreased in the fourth quarter. The balances in all borrowing categories increased with the largest increase in federal funds purchased and junior subordinated debentures. The former category increased to fund investment and loan portfolio growth, whereas the $25.8 subordinated debenture issuance served to provide the primary source of financing for the common stock tender offer that was completed in May 2007. The changes in deposit composition combined with increases in other borrowed funds as well as a generally higher cost of funds during most of 2007 adversely affected the net interest margin.
The Company also utilizes securities sold under repurchase agreements as a source of funds. These repurchase agreements, which are typically of short-term duration, were $53.2 million at December 31, 2007, which was an increase of $15.0 million, or 39.3%. As mentioned previously, the largest increase in funding was in the overnight federal funds purchased category, which grew to $165.1 million at December 31, 2007. The federal funds market is an efficient source of funds that generally reprices immediately in a declining rate environment. Other short-term borrowings increased by $9.8 million, or 13.4% to $82.9 million from $73.1 million. The note payable balance outstanding increased $2.2 million, or 13.3% to $18.6 million as of December 31, 2007 compared to $16.4 million as of December 31, 2006. A primary purpose of this note was to fund repurchases of the Company’s stock in 2006 whereas the 2007 increase related primarily to operating needs. Repurchased shares can be reissued from treasury stock as a future capital source or to fulfill employee related stock compensation plans, the interim repurchase of shares also enhanced return on equity and both the book value and earnings per share. Junior subordinated debentures increased $25.8 million, or 81.5%, to $57.4 million at December 31, 2007. The Company issued the new subordinated debenture in return for the aggregate net proceeds of a trust-preferred offering that occurred in April 2007. Those proceeds provided the primary source of financing for the common stock tender offer that was subsequently completed in May 2007. The Company is currently maintaining liquid assets and delivering consistent growth in core funding to provide funding for loan growth. Additional information on the final terms of the credit facilities that were established with LaSalle Bank to fund the February 8, 2008 acquisition of Heritage are detailed in Note J.
12
Capital
Total stockholders’ equity decreased $8.7 million, or 5.5%, to $149.9 million during 2007, from $158.6 million as of December 31, 2006. Net income of $24.0 million, reduced by dividends of $7.3 million, increased retained earnings to $209.9 million as of December 31, 2007. In the same year, a $4.5 million change to a net unrealized securities gain position from a $2.5 million net unrealized securities loss position at December 31, 2006 also increased stockholders’ equity. In 2006 retained earnings increased by net income of $23.7 million, less dividends of $7.3 million. During 2006, a $2.0 million decrease in unrealized net securities losses increased stockholders’ equity.
The Company repurchased 1,038,251 shares in 2007, resulting in an increase in treasury stock to 4,545,479 shares as of December 31, 2007. The repurchase of these shares increased treasury stock by $31.2 million, or 49.2%, to $94.8 million at December 31, 2007, from $63.5 million at December 31, 2006. While treasury stock decreased stockholders equity, it also increased earnings per share by reducing the number of shares outstanding. Return on average equity was 16.13%, 15.29%, and 19.11% in 2007, 2006, and 2005, respectively.
The exercise of stock options, related tax benefit, and stock-based compensation expense contributed $1.4 million to stockholders’ equity in 2007, and $1.1 million to stockholders’ equity in 2006.
The Company completed a sale of $31.6 million of cumulative trust preferred securities by its subsidiary, Old Second Capital Trust I (Nasdaq: OSBCP) in 2003. The trust preferred securities remain outstanding for a 30-year term, but subject to regulatory approval, they can be called in whole or in part at the Company’s discretion after an initial five-year period. Dividends are payable quarterly at an annual rate of 7.80% and are included in interest expense in the consolidated financial statements. The Company issued an additional $25.0 million of cumulative trust preferred securities through a private placement completed by its new unconsolidated subsidiary, Old Second Capital Trust II (“the Trust”) in April 2007. These trust preferred securities also mature in 30 years, but subject to the aforementioned regulatory approval, can be called in whole or in part on a quarterly basis commencing June 15, 2017. The quarterly cash distributions on the securities are fixed at 6.766% through June 15, 2017 and float at 150 basis points over the British Bankers Association three-month LIBOR rate thereafter. Trust preferred proceeds of $30.8 million and $49.3 million are held by outside investors and qualified as Tier 1 regulatory capital as of December 31, 2006 and 2007, respectively. An additional $6.5 million of Trust preferred proceeds qualified as Tier 2 regulatory capital as of December 31, 2007.
Bank regulatory agencies have adopted capital standards by which all banks and bank holding companies are evaluated. The Bank was also categorized as well capitalized as of both December 31, 2007 and 2006. Additional information regarding capital levels and minimum required levels can be found in Note R to the financial statements. Additional information related to the amount and form of consideration paid to consummate the February 8, 2008 acquisition of Heritage is outlined in Note X.
Quantitative and qualitative disclosure about market risk
Liquidity and market risk
Liquidity is the Company’s ability to fund operations, to meet depositor withdrawals, to provide for customer’s credit needs, and to meet maturing obligations and existing commitments. The liquidity of the Company principally depends on cash flows from operating activities, investment in and maturity of assets, changes in balances of deposits and borrowings, and its ability to borrow funds.
Net cash inflows from operations were $13.9 million during 2007. Net cash outflows from investing activities were $214.6 million in 2007, primarily as a result of $127.7 million in net principal disbursed on loans. Net cash outflows relating to securities available for sale were $79.4 million as a result of cash inflows of $214.3 million for the maturity and sale of securities available for sale, offset by cash outflows of $293.6 million for the purchases of securities available for sale. Net cash inflows from financing activities were $176.9 million in 2007, which included a net increase in deposits of $50.9 million and increases in securities sold under agreement to purchase, federal funds purchased, and proceeds from subordinated debentures of $15.0 million, $111.1 million and $25.8 million respectively. As mentioned previously the 2007 net increase of $2.2 million in note payable and $25.8 million of debenture proceeds were used primarily to repurchase the Company’s treasury shares.
Management of investing and financing activities along with market conditions determine the level and the stability of net interest cash flows. Management’s policy is to mitigate the impact of changes in market interest rates to the extent possible, so that balance sheet growth is the principal determinant of growth in net interest cash flows.
Net cash inflows from operations were $38.2 million during 2006. Net cash outflows from investing activities were $71.7 million in 2006, primarily as a result of $59.9 million in net principal disbursed on loans. Net cash outflows relating to securities available for sale were $1.2 million as a result of cash inflows of $169.1 million for the maturity and sale of securities available for sale, offset by cash outflows of $170.3 million for the purchases of securities available for sale. Net cash inflows from financing activities were $57.0 million in 2006, which included a net increase in deposits of $127.4 million and decreases in short-term borrowings, which includes federal funds purchased, and repurchase agreements sold of $44.7 million and $19.4 million respectively. The proceeds of $13.2 million from the note payable were used primarily to repurchase the Company’s treasury shares.
13
Net cash inflows from operations were $31.1 million during 2005. Net cash outflows from investing activities were $264.2 million in 2005, as a result of $196.1 million in net principal disbursed on loans. Net cash outflows relating to securities available for sale were $36.1 million as a result of cash inflows of $158.4 million for the maturity and sale of securities available for sale, offset by cash outflows of $194.5 million for the purchases of securities available for sale. Net cash inflows from financing activities were $239.5 million in 2005, which included a net increase in deposits of $136.4 million and an increase in short-term borrowings and federal funds and securities sold under repurchase agreements of $108.4 million.
Interest rate risk
The impact of movements in general market interest rates on a financial institution’s financial condition, including capital adequacy, earnings, and liquidity, is known as interest rate risk. Interest rate risk is the Company’s primary market risk. As a financial institution, accepting and managing this risk is an inherent aspect of the Company’s business. However, safe and sound management of interest rate risk requires that it be maintained at prudent levels.
The Company seeks to achieve consistent growth in net interest income and net income while managing volatility that arises from shifts in interest rates. The Bank’s Asset and Liability Management Committee (“ALCO”) oversees financial risk management by developing programs to measure and manage interest rate risks within authorized limits set by the Bank’s Board of Directors. ALCO also approves the Bank’s asset/liability management policies, oversees the formulation and implementation of strategies to improve balance sheet positioning and earnings, and reviews the Bank’s interest rate sensitivity position. Management uses net interest income simulation modeling tools to analyze and capture near-term and longer-term interest rate exposures.
The Company analyzes interest rate risk by examining the extent to which assets and liabilities are interest rate sensitive. The interest sensitivity gap is defined as the difference between the amount of interest earning assets maturing or repricing within a specific time period and the amount of interest-bearing liabilities maturing or repricing within that time period. A gap is considered positive when the amount of interest sensitive assets exceeds the amount of interest sensitive liabilities. A gap is considered negative when the amount of interest sensitive liabilities exceeds the amount of interest sensitive assets. During a period of rising interest rates, a negative gap would tend to result in a decrease in net interest income while a positive gap would tend to increase net interest income. The Company’s policy is to manage the balance sheet such that fluctuations in the net interest margin are minimized regardless of the level of interest rates.
The table on page 15 illustrates expected maturities and does not necessarily indicate the future impact of general interest rate movements on the Company’s net interest income because the repricing of certain assets and liabilities is discretionary and is subject to competitive and other pressures. As a result, assets and liabilities indicated as repricing within the same period may in fact reprice at different times and at different rate levels. Assets and liabilities are reported in the earliest time frame in which maturity or repricing may occur. Although securities available for sale are reported in the earliest period in which maturity or repricing may occur, these securities may be sold in response to changes in interest rates or liquidity needs.
The Company is also exposed to interest rate risk on loans held for sale and rate lock commitments as discussed in Note S.
Effects of inflation
In management’s opinion, changes in interest rates affect the financial condition of a financial institution to a far greater degree than changes in the inflation rate. While interest rates are greatly influenced by changes in the inflation rate, they do not change at the same rate or in the same magnitude as the inflation rate. Rather, interest rate volatility is based on changes in the expected rate of inflation, as well as on changes in monetary and fiscal policies. A financial institution’s ability to be relatively unaffected by changes in interest rates is a good indicator of its capability to perform in today’s volatile economic environment. The Company seeks to insulate itself from interest rate volatility by ensuring that rate sensitive assets and rate sensitive liabilities respond to changes in interest rates in a similar time frame and to a similar degree.
14
Expected Maturity of Interest-Earning Assets and Interest-Bearing Liabilities at December 31:
| | Expected Maturity Dates | |
| | 1 Year | | 2 Years | | 3 Years | | 4 Years | | 5 Years | | Thereafter | | Total | |
2007 Interest-earning Assets | | | | | | | | | | | | | | | |
Deposits with financial institutions | | $ | 403 | | $ | — | | $ | — | | $ | — | | $ | — | | $ | — | | $ | 403 | |
Average interest rate | | 3.54 | % | 0.00 | % | 0.00 | % | 0.00 | % | 0.00 | % | 0.00 | % | 3.54 | % |
Federal funds sold | | $ | 2,370 | | $ | — | | $ | — | | $ | — | | $ | — | | $ | — | | $ | 2,370 | |
Average interest rate | | 3.65 | % | 0.00 | % | 0.00 | % | 0.00 | % | 0.00 | % | 0.00 | % | 3.65 | % |
Securities (including FHLB/FRB stock) | | $ | 73,611 | | $ | 23,094 | | $ | 29,558 | | $ | 23,154 | | $ | 22,264 | | $ | 398,125 | | $ | 569,806 | |
Average interest rate | | 3.60 | % | 4.37 | % | 4.72 | % | 4.72 | % | 4.84 | % | 4.88 | % | 4.67 | % |
Fixed rate loans (including loans held for sale) | | $ | 174,078 | | $ | 112,190 | | $ | 200,723 | | $ | 154,861 | | $ | 219,906 | | $ | 178,201 | | $ | 1,039,959 | |
Average interest rate | | 6.49 | % | 6.21 | % | 6.29 | % | 6.99 | % | 6.96 | % | 6.67 | % | 6.67 | % |
Adjustable rate loans | | $ | 326,539 | | $ | 82,920 | | $ | 17,616 | | $ | 4,318 | | $ | 36,098 | | $ | 400,337 | | $ | 867,828 | |
Average interest rate | | 7.58 | % | 7.33 | % | 7.33 | % | 7.26 | % | 7.09 | % | 6.36 | % | 6.97 | % |
Total | | $ | 577,001 | | $ | 218,204 | | $ | 247,897 | | $ | 182,333 | | $ | 278,268 | | $ | 976,663 | | $ | 2,480,366 | |
| | | | | | | | | | | | | | | |
Interest-bearing Liabilities | | | | | | | | | | | | | | | |
Interest-bearing deposits | | $ | 1,505,178 | | $ | 38,848 | | $ | 26,588 | | $ | 10,918 | | $ | 6,540 | | $ | 253,997 | | $ | 1,842,069 | |
Average interest rate | | 4.27 | % | 4.36 | % | 4.48 | % | 4.96 | % | 4.66 | % | 1.38 | % | 3.88 | % |
Federal funds purchased | | $ | 165,100 | | $ | — | | $ | — | | $ | — | | $ | — | | $ | — | | $ | 165,100 | |
Average interest rate | | 4.09 | % | 0.00 | % | 0.00 | % | 0.00 | % | 0.00 | % | 0.00 | % | 4.09 | % |
Short-term borrowings | | $ | 136,095 | | $ | — | | $ | — | | $ | — | | $ | — | | $ | — | | $ | 136,095 | |
Average interest rate | | 3.60 | % | 0.00 | % | 0.00 | % | 0.00 | % | 0.00 | % | 0.00 | % | 3.60 | % |
Note payable | | $ | 18,610 | | $ | — | | $ | — | | $ | — | | $ | — | | $ | — | | $ | 18,610 | |
Average interest rate | | 6.14 | % | 0.00 | % | 0.00 | % | 0.00 | % | 0.00 | % | 0.00 | % | 6.14 | % |
Junior subordinated debentures | | $ | — | | $ | — | | $ | — | | $ | — | | $ | — | | $ | 57,399 | | $ | 57,399 | |
Average interest rate | | 0.00 | % | 0.00 | % | 0.00 | % | 0.00 | % | 0.00 | % | 7.34 | % | 7.34 | % |
Total | | $ | 1,824,983 | | $ | 38,848 | | $ | 26,588 | | $ | 10,918 | | $ | 6,540 | | $ | 311,396 | | $ | 2,219,273 | |
Period gap | | $ | (1,247,982 | ) | $ | 179,356 | | $ | 221,309 | | $ | 171,415 | | $ | 271,728 | | $ | 665,267 | | $ | 261,093 | |
Cumulative gap | | (1,247,982 | ) | (1,068,626 | ) | (847,317 | ) | (675,902 | ) | (404,174 | ) | 261,093 | | | |
| | | | | | | | | | | | | | | |
2006 Interest-earning Assets | | | | | | | | | | | | | | | |
Deposits with financial institutions | | $ | 5,493 | | $ | — | | $ | — | | $ | — | | $ | — | | $ | — | | $ | 5,493 | |
Average interest rate | | 5.08 | % | 0.00 | % | 0.00 | % | 0.00 | % | 0.00 | % | 0.00 | % | 5.08 | % |
Federal funds sold | | $ | 2,305 | | $ | — | | $ | — | | $ | — | | $ | — | | $ | — | | $ | 2,305 | |
Average interest rate | | 5.13 | % | 0.00 | % | 0.00 | % | 0.00 | % | 0.00 | % | 0.00 | % | 5.13 | % |
Securities (including FHLB/FRB stock) | | $ | 71,069 | | $ | 78,281 | | $ | 22,679 | | $ | 37,005 | | $ | 15,070 | | $ | 257,576 | | $ | 481,680 | |
Average interest rate | | 3.61 | % | 3.81 | % | 4.36 | % | 4.53 | % | 4.37 | % | 4.47 | % | 4.23 | % |
Fixed rate loans (including loans held for sale) | | $ | 123,697 | | $ | 139,001 | | $ | 118,012 | | $ | 216,625 | | $ | 163,927 | | $ | 125,577 | | $ | 886,839 | |
Average interest rate | | 7.06 | % | 6.11 | % | 6.08 | % | 6.21 | % | 7.01 | % | 6.46 | % | 6.48 | % |
Adjustable rate loans | | $ | 357,478 | | $ | 68,338 | | $ | 20,381 | | $ | 6,946 | | $ | 5,457 | | $ | 432,851 | | $ | 891,451 | |
Average interest rate | | 8.52 | % | 8.07 | % | 7.94 | % | 8.10 | % | 8.14 | % | 6.48 | % | 7.48 | % |
Total | | $ | 560,042 | | $ | 285,620 | | $ | 161,072 | | $ | 260,576 | | $ | 184,454 | | $ | 816,004 | | $ | 2,267,768 | |
| | | | | | | | | | | | | | | |
Interest-bearing Liabilities | | | | | | | | | | | | | | | |
Interest-bearing deposits | | $ | 1,267,640 | | $ | 180,957 | | $ | 28,554 | | $ | 24,173 | | $ | 10,602 | | $ | 270,137 | | $ | 1,782,063 | |
Average interest rate | | 4.17 | % | 4.60 | % | 4.53 | % | 4.60 | % | 4.96 | % | 1.47 | % | 3.82 | % |
Federal funds purchased | | $ | 54,000 | | $ | — | | $ | — | | $ | — | | $ | — | | $ | — | | $ | 54,000 | |
Average interest rate | | 5.30 | % | 0.00 | % | 0.00 | % | 0.00 | % | 0.00 | % | 0.00 | % | 5.30 | % |
Short-term borrowings | | $ | 111,308 | | $ | — | | $ | — | | $ | — | | $ | — | | $ | — | | $ | 111,308 | |
Average interest rate | | 5.06 | % | 0.00 | % | 0.00 | % | 0.00 | % | 0.00 | % | 0.00 | % | 5.06 | % |
Note payable | | $ | 16,425 | | $ | — | | $ | — | | $ | — | | $ | — | | $ | — | | $ | 16,425 | |
Average interest rate | | 6.50 | % | 0.00 | % | 0.00 | % | 0.00 | % | 0.00 | % | 0.00 | % | 6.50 | % |
Junior subordinated debentures | | $ | — | | $ | 31,625 | | $ | — | | $ | — | | $ | — | | $ | — | | $ | 31,625 | |
Average interest rate | | 0.00 | % | 7.80 | % | 0.00 | % | 0.00 | % | 0.00 | % | 0.00 | % | 7.80 | % |
Total | | $ | 1,449,373 | | $ | 212,582 | | $ | 28,554 | | $ | 24,173 | | $ | 10,602 | | $ | 270,137 | | $ | 1,995,421 | |
Period gap | | $ | (889,331 | ) | $ | 73,038 | | $ | 132,518 | | $ | 236,403 | | $ | 173,852 | | $ | 545,867 | | $ | 272,347 | |
Cumulative gap | | (889,331 | ) | (816,293 | ) | (683,775 | ) | (447,372 | ) | (273,520 | ) | 272,347 | | | |
| | | | | | | | | | | | | | | | | | | | | | | | | |
15
Off-balance sheet arrangements
Contractual Obligations, Commitments, Contingent Liabilities, and Off-Balance Sheet Arrangements
The Company has various financial obligations that may require future cash payments. The following table presents, as of December 31, 2007, significant fixed and determinable contractual obligations to third parties by payment date.
| | Within
One Year | | One to
Three Years | | Three to
Five Years | | Over
Five Years | | Total | |
Deposits without a stated maturity | | $ | 1,120,914 | | $ | — | | $ | — | | $ | — | | $ | 1,120,914 | |
Certificates of deposit | | 909,810 | | 65,435 | | 17,459 | | — | | 992,704 | |
Securities sold under repurchase agreements | | 53,222 | | — | | — | | — | | 53,222 | |
Federal funds purchased | | 165,100 | | — | | — | | — | | 165,100 | |
Other short-term borrowings | | 82,873 | | — | | — | | — | | 82,873 | |
Junior subordinated debentures | | — | | — | | — | | 57,399 | | 57,399 | |
Note payable | | 18,610 | | — | | — | | — | | 18,610 | |
Purchase obligations | | 2,518 | | 1,553 | | 19 | | 1 | | 4,091 | |
Operating leases | | 584 | | 355 | | 114 | | — | | 1,053 | |
Nonqualified voluntary deferred compensation | | 123 | | 862 | | 556 | | 681 | | 2,222 | |
Total | | $ | 2,353,754 | | $ | 68,205 | | $ | 18,148 | | $ | 58,081 | | $ | 2,498,188 | |
Purchase obligations represent obligations under agreements to purchase goods or services that are enforceable and legally binding on the Company and that specify all significant terms, including: fixed or minimum quantities to be purchased; fixed, minimum or variable price provisions; and the approximate timing of the transaction. The purchase obligation amounts presented above primarily relate to certain contractual payments for services provided for information technology, capital expenditures, and the outsourcing of certain operational activities.
Commitments: The following table details the amounts and expected maturities of significant commitments to extend credit as of December 31, 2007:
| | Within
One Year | | One to
Three Years | | Three to
Five Years | | Over
Five Years | | Total | |
Commitment to extend credit: | | | | | | | | | | | |
Commercial secured by real estate | | $ | 71,416 | | $ | 20,218 | | $ | 14,242 | | $ | 4,608 | | $ | 110,484 | |
Revolving open end residential | | 2,127 | | 1,992 | | 17,097 | | 109,043 | | 130,259 | |
Other | | 108,905 | | 4,308 | | 379 | | 1,199 | | 114,791 | |
Financial standby letters of credit | | 18,012 | | 1,267 | | — | | — | | 19,279 | |
Performance standby letters of credit | | 24,917 | | 3,539 | | 710 | | — | | 29,166 | |
Commercial letters of credit | | 1,236 | | — | | 11,307 | | — | | 12,543 | |
Total | | $ | 226,613 | | $ | 31,324 | | $ | 43,735 | | $ | 114,850 | | $ | 416,522 | |
Controls and procedures
The Chief Executive Officer and Chief Financial Officer have evaluated the effectiveness of the design and operation of the Company’s disclosure controls and procedures, as defined in Rule 13a-15(e) promulgated under the Securities and Exchange Act of 1934, as amended, as of December 31, 2007. Based on that evaluation, the Chief Executive Officer and Chief Financial Officer concluded that as of December 31, 2007 the Company’s disclosure controls and procedures are effective to ensure that information required to be disclosed by the Company is appropriately recorded, processed, summarized and reported.
Special note concerning forward-looking statements
This document (including information incorporated by reference) contains, and future oral and written statements of the Company and its management may contain, forward-looking statements, within the meaning of such term in the Private Securities Litigation Reform Act of 1995, with respect to the financial condition, results of operations, plans, objectives, future performance and business of the Company. Forward-looking statements, which may be based upon beliefs, expectations and assumptions of the Company’s management and on information currently available to
16
management, are generally identifiable by the use of words such as “believe,” “expect,” “anticipate,” “plan,” “intend,” “estimate,” “may,” “will,” “would,” “could,” “should” or other similar expressions. Additionally, all statements in this document, including forward-looking statements, speak only as of the date they are made, and the Company undertakes no obligation to update any statement in light of new information or future events.
The Company’s ability to predict results or the actual effect of future plans or strategies is inherently uncertain. Factors that could have a material adverse effect on the operations and future prospects of the Company and its subsidiaries include, but are not limited to, those set forth under item 1.A “Risk Factors” of the Form 10-K and as set forth below:
· The strength of the United States economy in general and the strength of the local economies in which the Company conducts its operations which may be less favorable than expected and may result in, among other things, a deterioration in the credit quality and value of the Company’s assets.
· Credit risks and the risks from concentrations (by geographic area and by industry) within the Company’s loan portfolio.
· The economic impact of past and any future terrorists attacks, acts of war or threats thereof and the response of the United States to any such threats and attacks.
· The effects of, and changes in, federal, state and local laws, regulations and policies affecting banking, securities, insurance and monetary and financial matters.
· The effects of changes in interest rates (including the effects of changes in the rate of prepayments of the Company’s assets) and the policies of the Board of Governors of the Federal Reserve System.
· The ability of the Company to compete with other financial institutions as effectively as the Company currently intends due to increases in competitive pressures in the financial services sector.
· The inability of the Company to obtain new customers and to retain existing customers.
· The timely development and acceptance of products and services, including products and services offered through alternative delivery channels such as the Internet.
· Technological changes implemented by the Company and by other parties, including third party vendors, which may be more difficult or more expensive than anticipated or which may have unforeseen consequences to the Company and its customers.
· The ability of the Company to develop and maintain secure and reliable electronic systems.
· The ability of the Company to retain key executives and employees and the difficulty that the Company may experience in replacing key executives and employees in an effective manner.
· Consumer spending and saving habits which may change in a manner that affects the Company’s business adversely.
· Business combinations and the integration of acquired businesses, which may be more difficult or expensive than expected.
· The costs, effects and outcomes of existing or future litigation.
· Changes in accounting policies and practices, as may be adopted by state and federal regulatory agencies and the Financial Accounting Standards Board, the Public Company Accounting Oversight Board, and the Securities and Exchange Commission.
· If our Real Estate Investment Trust (REIT) affiliate fails to qualify as a REIT, we may be subject to a higher consolidated effective tax rate. Old Second National Bank holds certain commercial real estate loans, residential real estate loans and other loans, and mortgage-backed investment securities in a real estate investment trust through its wholly owned subsidiary Old Second Management, LLC which is domiciled in Delaware. Qualification as a REIT involves application of specific provisions of the Internal Revenue Code relating to various asset, income, and investment tests. If the REIT fails to meet any of the required provisions for REITs, or there are changes in tax laws or interpretation thereof, it could no longer qualify as a REIT and the resulting tax consequences would increase our effective tax rate or cause us to have a tax liability for prior years. As noted previously, a late 2007 change to Illinois tax law related to the deductibility of REIT dividends will eliminate the recognition of a large portion of the tax benefits related to this ownership structure beginning January 1, 2009.
· The ability of the Company to manage the risks associated with the foregoing as well as anticipated.
These risks and uncertainties should be considered in evaluating forward-looking statements and undue reliance should not be placed on such statements.
17
Old Second Bancorp, Inc.
and Subsidiaries
Consolidated Statements
& Notes to Consolidated
Financial Statements
18
Old Second Bancorp, Inc. and Subsidiaries
Consolidated Balance Sheets
December 31, 2007 and 2006
(In thousands, except share data)
| | 2007 | | 2006 | |
Assets | | | | | |
Cash and due from banks | | $ | 60,804 | | $ | 80,727 | |
Interest bearing deposits with financial institutions | | 403 | | 5,493 | |
Federal funds sold | | 2,370 | | 2,305 | |
Short-term securities available for sale | | 1,162 | | — | |
Cash and cash equivalents | | 64,739 | | 88,525 | |
Securities available for sale | | 559,697 | | 472,897 | |
Federal Home Loan Bank and Federal Reserve Bank stock | | 8,947 | | 8,783 | |
Loans held for sale | | 16,677 | | 14,378 | |
Loans | | 1,891,110 | | 1,763,912 | |
Less: allowance for loan losses | | 16,835 | | 16,193 | |
Net loans | | 1,874,275 | | 1,747,719 | |
Premises and equipment, net | | 49,698 | | 48,404 | |
Other real estate owned | | — | | 48 | |
Mortgage servicing rights, net | | 2,482 | | 2,882 | |
Goodwill, net | | 2,130 | | 2,130 | |
Bank owned life insurance (BOLI) | | 47,936 | | 45,861 | |
Accrued interest and other assets | | 31,995 | | 27,513 | |
Total assets | | $ | 2,658,576 | | $ | 2,459,140 | |
| | | | | |
Liabilities | | | | | |
Deposits: | | | | | |
Noninterest bearing demand | | $ | 271,549 | | $ | 280,630 | |
Interest bearing: | | | | | |
Savings, NOW, and money market | | 849,365 | | 807,949 | |
Time | | 992,704 | | 974,114 | |
Total deposits | | 2,113,618 | | 2,062,693 | |
Securities sold under repurchase agreements | | 53,222 | | 38,218 | |
Federal funds purchased | | 165,100 | | 54,000 | |
Other short-term borrowings | | 82,873 | | 73,090 | |
Junior subordinated debentures | | 57,399 | | 31,625 | |
Note payable | | 18,610 | | 16,425 | |
Accrued interest and other liabilities | | 17,865 | | 24,534 | |
Total liabilities | | 2,508,687 | | 2,300,585 | |
| | | | | |
Stockholders’ Equity | | | | | |
Preferred stock, $1.00 par value; authorized 300,000 shares; none issued | | — | | — | |
Common stock, $1.00 par value; authorized 20,000,000 shares; issued 16,694,775 in 2007 and 16,634,520 in 2006, outstanding 12,149,296 in 2007 and 13,127,292 in 2006 | | 16,695 | | 16,635 | |
Additional paid-in capital | | 16,114 | | 14,814 | |
Retained earnings | | 209,867 | | 193,170 | |
Accumulated other comprehensive income (loss) | | 1,971 | | (2,545 | ) |
Treasury stock, at cost, 4,545,479 in 2007 and 3,507,228 shares in 2006 | | (94,758 | ) | (63,519 | ) |
Total stockholders’ equity | | 149,889 | | 158,555 | |
Total liabilities and stockholders’ equity | | $ | 2,658,576 | | $ | 2,459,140 | |
See accompanying notes to consolidated financial statements.
19
Old Second Bancorp, Inc. and Subsidiaries
Consolidated Statements of Income
Years Ended December 31, 2007, 2006, and 2005
(In thousands, except share data)
| | 2007 | | 2006 | | 2005 | |
Interest and dividend income | | | | | | | |
Loans, including fees | | $ | 131,626 | | $ | 123,614 | | $ | 102,649 | |
Loans held for sale | | 666 | | 487 | | 690 | |
Securities: | | | | | | | |
Taxable | | 17,334 | | 12,837 | | 12,064 | |
Tax-exempt | | 5,747 | | 5,011 | | 4,810 | |
Federal funds sold | | 317 | | 42 | | 7 | |
Interest bearing deposits | | 51 | | 38 | | 3 | |
Total interest and dividend income | | 155,741 | | 142,029 | | 120,223 | |
| | | | | | | |
Interest expense | | | | | | | |
Savings, NOW and money market deposits | | 24,491 | | 18,571 | | 11,988 | |
Time deposits | | 48,525 | | 40,965 | | 26,052 | |
Securities sold under repurchase agreements | | 2,391 | | 2,030 | | 1,303 | |
Federal funds purchased | | 3,115 | | 3,852 | | 3,942 | |
Other short-term borrowings | | 3,967 | | 2,456 | | 366 | |
Junior subordinated debentures | | 3,629 | | 2,467 | | 2,448 | |
Note payable | | 1,025 | | 489 | | 125 | |
Total interest expense | | 87,143 | | 70,830 | | 46,224 | |
Net interest and dividend income | | 68,598 | | 71,199 | | 73,999 | |
Provision for loan losses | | 1,188 | | 1,244 | | 353 | |
Net interest and dividend income after provision for loan losses | | 67,410 | | 69,955 | | 73,646 | |
| | | | | | | |
Noninterest income | | | | | | | |
Trust income | | 8,666 | | 7,595 | | 6,644 | |
Service charges on deposits | | 8,560 | | 8,336 | | 8,291 | |
Secondary mortgage fees | | 592 | | 716 | | 973 | |
Mortgage servicing income | | 623 | | 492 | | 196 | |
Net gain on sales of mortgage loans | | 4,391 | | 3,647 | | 5,535 | |
Securities gains (losses), net | | 674 | | 418 | | (14 | ) |
Increase in cash surrender value of bank owned life insurance | | 2,020 | | 2,061 | | 985 | |
Debit card interchange income | | 2,011 | | 1,785 | | 1,510 | |
Other income | | 4,318 | | 3,657 | | 4,029 | |
Total noninterest income | | 31,855 | | 28,707 | | 28,149 | |
| | | | | | | |
Noninterest expense | | | | | | | |
Salaries and employee benefits | | 38,108 | | 35,878 | | 35,645 | |
Loss on settlement of pension obligation | | — | | 1,467 | | — | |
Occupancy expense, net | | 5,380 | | 4,598 | | 3,695 | |
Furniture and equipment expense | | 6,415 | | 5,256 | | 5,066 | |
Amortization of core deposit intangible assets | | — | | 355 | | 355 | |
Advertising expense | | 1,567 | | 2,054 | | 1,719 | |
Other expense | | 15,003 | | 15,528 | | 14,020 | |
Total noninterest expense | | 66,473 | | 65,136 | | 60,500 | |
Income before income taxes | | 32,792 | | 33,526 | | 41,295 | |
Provision for income taxes | | 8,820 | | 9,870 | | 13,612 | |
Net income | | $ | 23,972 | | $ | 23,656 | | $ | 27,683 | |
| | | | | | | |
Basic earnings per share | | $ | 1.92 | | $ | 1.77 | | $ | 2.05 | |
Diluted earnings per share | | 1.89 | | 1.75 | | 2.03 | |
Dividends declared per share | | 0.59 | | 0.55 | | 0.51 | |
See accompanying notes to consolidated financial statements.
20
Old Second Bancorp, Inc. and Subsidiaries
Consolidated Statements of Cash Flows
Years Ended December 31, 2007, 2006, and 2005
(In thousands)
| | 2007 | | 2006 | | 2005 | |
Cash flows from operating activities | | | | | | | |
Net income | | $ | 23,972 | | $ | 23,656 | | $ | 27,683 | |
Adjustments to reconcile net income to net cash provided by operating activities: | | | | | | | |
Depreciation | | 4,690 | | 3,876 | | 3,361 | |
Amortization of leasehold improvements | | 524 | | 121 | | 154 | |
Amortization & recovery of mortgage servicing rights, net | | 637 | | 684 | | 156 | |
Provision for loan losses | | 1,188 | | 1,244 | | 353 | |
Provision for deferred tax expense (benefit) | | (664 | ) | (459 | ) | 1,075 | |
Origination of loans held for sale | | (230,592 | ) | (289,467 | ) | (388,090 | ) |
Proceeds from sale of loans held for sale | | 232,447 | | 288,838 | | 396,715 | |
Gain on sales of mortgage loans | | (4,391 | ) | (3,647 | ) | (5,535 | ) |
Change in current income taxes payable | | 155 | | 649 | | (471 | ) |
Increase in cash surrender value of bank owned life insurance | | (2,020 | ) | (2,061 | ) | (985 | ) |
Change in accrued interest receivable and other assets | | (6,155 | ) | 3,649 | | (7,751 | ) |
Change in accrued interest payable and other liabilities | | (6,650 | ) | 8,439 | | 42 | |
Net premium amortization on securities | | 730 | | 2,495 | | 3,561 | |
Securities (gains) losses, net | | (674 | ) | (418 | ) | 14 | |
Amortization of core deposit intangible assets | | — | | 355 | | 355 | |
Stock based compensation | | 685 | | 209 | | 6 | |
Tax benefit from stock options exercised | | — | | — | | 425 | |
Net cash provided by operating activities | | 13,882 | | 38,163 | | 31,068 | |
| | | | | | | |
Cash flows from investing activities | | | | | | | |
Proceeds from maturities and pre-refunds including pay down of securities available for sale | | 211,893 | | 168,786 | | 137,939 | |
Proceeds from sales of securities available for sale | | 2,364 | | 339 | | 20,415 | |
Purchases of securities available for sale | | (293,641 | ) | (170,314 | ) | (194,472 | ) |
Purchases of Federal Home Loan Bank stock | | (164 | ) | (365 | ) | (1,464 | ) |
Net change in loans | | (127,744 | ) | (59,910 | ) | (196,076 | ) |
Investment in unconsolidated subsidiary | | (774 | ) | — | | — | |
Purchase of bank owned life insurance | | (55 | ) | (565 | ) | (20,706 | ) |
Net sales of other real estate owned | | 48 | | 203 | | — | |
Net purchases of premises and equipment | | (6,508 | ) | (9,916 | ) | (9,792 | ) |
Net cash used in investing activities | | (214,581 | ) | (71,742 | ) | (264,156 | ) |
| | | | | | | |
Cash flows from financing activities | | | | | | | |
Net change in deposits | | 50,925 | | 127,415 | | 136,429 | |
Net change in securities sold under repurchase agreements | | 15,004 | | (19,407 | ) | 12,383 | |
Net change in federal funds purchased | | 111,100 | | (116,000 | ) | 121,000 | |
Net change in other short-term borrowings | | 9,783 | | 71,265 | | (24,961 | ) |
Proceeds from the issuance of junior subordinated debentures | | 25,774 | | — | | — | |
Proceeds from note payable | | 23,360 | | 13,225 | | 500 | |
Repayment of note payable | | (21,175 | ) | — | | — | |
Proceeds from exercise of stock options | | 466 | | 616 | | 930 | |
Tax benefit from stock options exercised | | 209 | | 286 | | — | |
Dividends paid | | (7,294 | ) | (7,230 | ) | (6,740 | ) |
Purchases of treasury stock | | (31,239 | ) | (13,181 | ) | — | |
Net cash provided by financing activities | | 176,913 | | 56,989 | | 239,541 | |
Net change in cash and cash equivalents | | (23,786 | ) | 23,410 | | 6,453 | |
Cash and cash equivalents at beginning of year | | 88,525 | | 65,115 | | 58,662 | |
Cash and cash equivalents at end of year | | $ | 64,739 | | $ | 88,525 | | $ | 65,115 | |
| | | | | | | |
Supplemental cash flow information | | | | | | | |
Income taxes paid | | $ | 8,664 | | $ | 8,952 | | $ | 14,083 | |
Interest paid for deposits | | 72,799 | | 57,240 | | 36,799 | |
Interest paid for borrowings | | 14,132 | | 11,385 | | 7,975 | |
Non-cash transfer of loans to other real estate | | — | | — | | 251 | |
Non-cash acquisition of land in exchange for loan forgiven | | — | | 60 | | — | |
Change in dividends declared not paid | | (19 | ) | 80 | | 144 | |
See accompanying notes to consolidated financial statements.
21
Old Second Bancorp, Inc. and Subsidiaries
Consolidated Statement of Changes in
Stockholders’ Equity
Years Ended December 31, 2007, 2006, and 2005
(In thousands, except share data)
| | Common
Stock | | Additional
Paid-In
Capital | | Retained
Earnings | | Accumulated
Other
Comprehensive
Income (Loss) | | Treasury
Stock | | Total
Stockholders’
Equity | |
Balance, December 31, 2004 | | $ | 16,497 | | $ | 12,480 | | $ | 156,025 | | $ | 324 | | $ | (50,338 | ) | 134,988 | |
Net income | | — | | — | | 27,683 | | — | | — | | 27,683 | |
Change in net unrealized gain (loss) on securities available for sale, net of $3,214 tax effect | | — | | — | | — | | (4,886 | ) | — | | (4,886 | ) |
Total comprehensive income | | | | | | | | | | | | 22,797 | |
Dividends declared, $.5 1 per share | | — | | — | | (6,884 | ) | — | | — | | (6,884 | ) |
Change in restricted stock | | 24 | | (24 | ) | — | | — | | — | | — | |
Stock options exercised | | 71 | | 859 | | — | | — | | — | | 930 | |
Tax benefit of stock options exercised | | — | | 425 | | — | | — | | — | | 425 | |
Stock-based compensation expense | | — | | 6 | | — | | — | | — | | 6 | |
Balance, December 31, 2005 | | $ | 16,592 | | $ | 13,746 | | $ | 176,824 | | $ | (4,562 | ) | $ | (50,338 | ) | $ | 152,262 | |
Net income | | — | | — | | 23,656 | | — | | — | | 23,656 | |
Change in net unrealized loss on securities available for sale, net of $1,337 tax effect | | — | | — | | — | | 2,017 | | — | | 2,017 | |
Total comprehensive income | | | | | | | | | | | | 25,673 | |
Dividends declared, $.55 per share | | — | | — | | (7,310 | ) | — | | — | | (7,310 | ) |
Stock options exercised | | 43 | | 573 | | — | | — | | — | | 616 | |
Tax benefit of stock options exercised | | — | | 286 | | — | | — | | — | | 286 | |
Stock-based compensation expense | | — | | 209 | | — | | — | | — | | 209 | |
Purchases of treasury stock | | — | | — | | — | | — | | (13,181 | ) | (13,181 | ) |
Balance, December 31, 2006 | | $ | 16,635 | | $ | 14,814 | | $ | 193,170 | | $ | (2,545 | ) | $ | (63,519 | ) | $ | 158,555 | |
Net income | | — | | — | | 23,972 | | — | | — | | 23,972 | |
Change in net unrealized gain (loss) on securities available for sale, net of $2,956 tax effect | | — | | — | | — | | 4,516 | | — | | 4,516 | |
Total comprehensive income | | | | | | | | | | | | 28,488 | |
Dividends declared, $.59 per share | | — | | — | | (7,275 | ) | — | | — | | (7,275 | ) |
Change in restricted stock | | 26 | | (26 | ) | — | | — | | — | | — | |
Stock options exercised | | 34 | | 432 | | — | | — | | — | | 466 | |
Tax benefit of stock options exercised | | — | | 209 | | — | | — | | — | | 209 | |
Stock-based compensation expense | | — | | 685 | | — | | — | | — | | 685 | |
Purchases of treasury stock | | — | | — | | — | | — | | (31,239 | ) | (31,239 | ) |
Balance, December 31, 2007 | | $ | 16,695 | | $ | 16,114 | | $ | 209,867 | | $ | 1,971 | | $ | (94,758 | ) | $ | 149,889 | |
See accompanying notes to consolidated financial statements.
22
Old Second Bancorp, Inc. and Subsidiaries
Notes to Consolidated Financial Statements
December 31, 2007, 2006, and 2005
(Table amounts in thousands, except per share data)
Note A: Summary of Significant Accounting Policies
Nature of Operations and Principles of Consolidation: As of January 1, 2007 Old Second Mortgage was dissolved as a separate entity and became part of Old Second National Bank of Aurora. As of June 30, 2007, the Company provided financial services through three subsidiary banks. On July 1, 2007, the Company merged its two state bank charters—Old Second Bank – Kane County and Old Second Bank – Yorkville—into its national bank charter, The Old Second National Bank of Aurora, and renamed the combined entity “Old Second National Bank”. The merger qualified as a tax-free reorganization and was accounted for as an internal reorganization. Old Second Acquisition, Inc., was formed as part of the November 5, 2007 Agreement and Plan of Merger between the Company, Old Second Acquisition, Inc., a wholly-owned subsidiary of Old Second Bancorp, Inc., and HeritageBanc, Inc. (“Heritage”). The parties consummated the merger on February 8, 2008, at which time, Old Second Acquisition, Inc. was merged with and into Heritage with Heritage as the surviving corporation as a wholly-owned subsidiary of the Company. Additionally, the parties merged Heritage Bank, a wholly-owned subsidiary of Heritage, with and into Old Second National Bank, with Old Second National Bank as the surviving bank. After the completion of the merger transaction, Heritage was dissolved and is no longer an existing subsidiary. Summary information related to the acquisition is outlined in Note X.
The consolidated financial statements include Old Second Bancorp, Inc. and its wholly owned subsidiaries; Old Second Financial, Inc., and Old Second National Bank (“Bank”) which includes its wholly-owned subsidiary Old Second Management, LLC that owns 100% of the common stock of its subsidiary Old Second Realty, LLC, which together are referred to as the “Company.” Inter-company transactions and balances are eliminated in consolidation.
As of December 31, 2007, the Company provided financial services through its offices located in Kane, Kendall, DeKalb, DuPage, LaSalle and Will counties in Illinois. Its primary deposit products are checking, NOW, money market, savings, and certificate of deposit accounts, and its primary lending products are commercial mortgages, construction lending, commercial and industrial loans, residential mortgages, and installment loans. A major portion of loans are secured by various forms of collateral including real estate, business assets, and consumer property, while borrower cash flow is the primary source of repayment. Old Second Financial, Inc. provides insurance agency services and the Bank engages in trust operations and also provides residential mortgage banking services. There are no significant concentrations of loans to any one industry or customer. However, the customers’ ability to repay their loans is dependent on the real estate market and general economic conditions in the area.
Use of Estimates: To prepare financial statements in conformity with accounting principles generally accepted in the United States of America management makes estimates and assumptions based on available information. These estimates and assumptions affect the amounts reported in the financial statements and the disclosures provided, and actual results could differ. The allowance for loan losses, valuation of loan servicing rights, valuation of deferred income taxes, evaluation of goodwill for impairment, and fair values of financial instruments are particularly subject to change.
Statements of Cash Flows: Cash and cash equivalents includes cash, deposits with other financial institutions with original maturities under 90 days, federal funds sold, short-term securities available for sale, and in 2006 an overnight repurchase agreement of $1.6 million which was held in a custody account and was collateralized by U.S. Treasury securities. There were no overnight repurchase agreements outstanding at December 31, 2007, and the short-term available for sale securities at December 31, 2007, consisted of federal agency discount notes that matured in January 2008. Net cash flows are reported for customer loan and deposit transactions, interest-bearing deposits in other financial
23
institutions, and federal funds purchased, other real estate owned, fixed assets, and repurchase agreements, and other short-term borrowings.
Interest-Bearing Time Deposits in Other Financial Institutions: Interestbearing deposits in other financial institutions mature within one year and are carried at cost.
Securities: Securities are classified as available for sale when they might be sold before maturity. Securities available for sale are carried at fair value, with unrealized holding gains and losses, net of income taxes, reported in accumulated other comprehensive income (loss). Interest income includes amortization of purchase premium or discount on a basis that approximates the level yield method. Realized gains and losses are determined on a trade date basis based on the amortized cost of the specific security sold.
On a quarterly basis, the Company makes an assessment to determine whether there have been any events or circumstances to indicate that a security on which there is an unrealized loss is impaired on an other than temporary basis. The Company considers many factors including the severity and duration of the impairment; the intent and ability of the Company to hold the security for a period of time sufficient for a recovery in value; recent events specific to the issuer or industry; and for debt securities, external credit ratings and recent downgrades. Securities on which there is an unrealized loss that is deemed to be other than temporary are written down to fair value with the write-down recorded as a realized loss and included in security gains (losses), net.
Federal Home Loan Bank and Federal Reserve Bank stock: The Company owns investments in the stock of the Federal Reserve Bank and the Federal Home Loan Bank of Chicago (“FHLBC”). No ready market exists for these stocks and they have no quoted market values. Federal Reserve Bank stock is redeemable at par, therefore, market value equals cost. The Bank, as a member of the FHLBC, is required to maintain an investment in the capital stock of the FHLB. The stock is redeemable at par by the FHLBC, and is therefore, carried at cost and periodically evaluated for impairment. The Company’s ability to redeem the shares owned is dependent on the redemption practices of the FHLBC. The Company records dividends in income on the ex-dividend date.
Loans Held for Sale: The Bank originates residential mortgage loans, which consist of loan products eligible for sale to the secondary market. Mortgage loans held for sale are carried at the lower of aggregate cost or market value. Gains on the sale of these mortgage loans are recorded in the period in which the loans are sold. Net unrealized losses, if any, are recorded as a valuation allowance and charged to earnings.
Mortgage Servicing Rights: The Bank is also involved in the business of servicing mortgage loans. Servicing activities include collecting principal, interest, and escrow payments from borrowers; making tax and insurance payments on behalf of the borrowers; monitoring delinquencies and executing foreclosure proceedings; and accounting for and remitting principal and interest payments to the investors. Mortgage servicing rights represent the right to a stream of cash flows and an obligation to perform specified residential mortgage servicing activities.
Mortgage loans that the Company is servicing for others aggregate to $223.4 million and $235.6 million at December 31, 2007 and 2006, respectively. Mortgage loans that the Company is servicing for others are not included in the Consolidated Balance Sheets. Fees received in connection with servicing loans for others are recognized as earned. Loan servicing costs are charged to expense as incurred.
Servicing rights are recognized separately as assets when they are acquired through sales of loans. For sales of mortgage loans prior to January 1, 2007, a portion of the cost of the loan was allocated to the servicing right based on relative fair values. The Company adopted Statement of Financial Accounting Standards (“SFAS”) No. 156 on January 1, 2007, with no material effect on the Company’s financial statements, and for sales of mortgage loans beginning in 2007, servicing rights are initially recorded at fair value with the income statement effect recorded in gains on sales of loans. Fair value is based on market prices for comparable mortgage servicing contracts, when available, or alternatively, is
24
based on a valuation model that calculates the present value of estimated future net servicing income. The valuation model incorporates assumptions that market participants would use in estimating future net servicing income, such as the cost to service, the discount rate, the custodial earnings rate, an inflation rate, ancillary income, prepayment speeds and default rates and losses. The Company compares the valuation model inputs and results to published industry data in order to validate the model results and assumptions. Residential mortgage loan servicing assets are subsequently measured using the amortization method, which requires servicing rights to be amortized into noninterest income in proportion to, and over the period of, the estimated future net servicing income of the underlying loans.
Servicing assets are evaluated for impairment based upon the fair value of the rights as compared to carrying amount. Impairment is determined by stratifying rights into groupings based on predominant risk characteristics, such as interest rate, loan type and investor type. Impairment is recognized through a valuation allowance for an individual grouping, to the extent that fair value is less than the carrying amount. If the Company later determines that all or a portion of the impairment no longer exists for a particular grouping, a reduction of the allowance may be recorded as an increase to income. Changes in valuation allowances are reported with other expense on the income statement. The fair values of servicing rights are subject to significant fluctuations as a result of changes in interest rates and the impact of these changes on estimated and actual prepayment speeds and default rates and losses.
Servicing fee income, which is reported on the income statement as mortgage servicing income, is recorded for fees earned for servicing loans. The fees are based on a contractual percentage of the outstanding principal; or a fixed amount per loan and are recorded as income when earned. The amortization of mortgage servicing rights is netted against loan servicing fee income. Servicing fees totaled $623,000, $492,000, and $196,000 for the years ended December 31, 2007, 2006, and 2005. Late fees and ancillary fees related to loan servicing are not material.
Advertising Costs: All advertising costs incurred by the Company are expensed in the period in which they are incurred.
Loans: Loans that management has the intent and ability to hold for the foreseeable future or until maturity or payoff are reported at the principal balance outstanding, net of unearned interest, deferred loan fees and costs, and an allowance for loan losses. Interest income is reported on the interest method and includes amortization of net deferred loan origination fees and costs over the loan term on a method that approximates the level yield method. The accrual of interest income is discontinued when full loan repayment is in doubt or when a loan becomes contractually past due by more than 90 days with respect to interest or principal unless that loan is well secured and in the process of collection. Consumer loans are typically charged off no later than 120 days past due. When a loan is placed in non-accrual status, any accrued, unpaid interest is reversed to the related income account. Interest on non-accrual loans is not recovered until it is actually paid by the borrower. Such payments can take the form of lump sums paid by the borrower, or more frequently, periodic installment payments. When a non-accrual loan has improved to the point where its collection is no longer in question, payments are applied to recovery of the non-accrual interest. As long as any question remains as to the collection of the loan, payments received on such loans are reported as principal reductions.
Allowance for Loan Losses: The allowance for loan losses represents management’s estimate of probable credit losses inherent in the loan portfolio. Determining the amount of the allowance for loan losses is inherently subjective, because it requires significant judgment and the use of estimates related to the amount and timing of expected future cash flows on impaired loans, estimated losses on pools of homogeneous loans based on historical loss experience, and consideration of current economic trends and conditions, all of which may be susceptible to significant change. Additions to the allowance for loan losses are expensed through the provision for loan losses and reductions in the allowance for loan losses are credited to the provision for loan losses. Loans believed by management to be uncollectible are charged against the allowance for loan losses and recoveries of previously charged-off loans are credited to the allowance for loan losses. Management estimates the allowance balance required using various risk factors including, but not limited to, past loan loss experience, known and inherent risks in the portfolio, information about specific borrower
25
situations and estimated collateral values, volume trends in delinquencies and nonaccruals, economic conditions, and other factors.
The methodology for determining the appropriate level of the allowance for loan losses consists of three components: (i) specific reserves established for expected losses resulting from analysis developed through specific credit allocations on individual loans for which the recorded investment in the loan exceeds the measured value of the loan; (ii) reserves based on historical loan loss experience for each loan category; and (iii) reserves based on general, current economic conditions as well as specific economic factors believed to be relevant to the markets in which the Company operates. Management believes that the allowance for loan losses is adequate to absorb credit losses inherent in the loan portfolio.
A loan is considered impaired when, based on current information and events, it is probable that the Company will be unable to collect all contractual principal or interest due according to the original terms of the agreement. Impaired loans are measured based on the present value of the future cash flows, discounted at the loan’s original effective interest rate, or the fair value of underlying collateral, if the loan is collateral dependent. Payments received on impaired loans are generally reported as principal reductions.
Premises and Equipment: Premises and equipment are stated at cost less accumulated depreciation and amortization. Depreciation is computed over estimated useful lives of ten to forty years for premises and five to seven years for furniture and equipment principally by the use of straight-line depreciation methods for book purposes, while accelerated depreciation is used for income tax purposes. Leasehold improvements are amortized over the shorter of the anticipated lease term including contractually anticipated renewals or the life of the improvement. When property is retired or otherwise disposed of, the stated amount, net of sale proceeds in the event of a sale of assets, is recognized as a gain or loss at the time of disposal. Expenditures for maintenance and repairs are expensed as incurred, and expenditures for major renovations that extend the useful life of the asset are capitalized.
Other Real Estate Owned: Real estate acquired in settlement of loans is recorded at fair value when acquired, less estimated costs to sell establishing a new cost basis. Any deficiency between the net book value and fair value at the foreclosure date is charged to the allowance for loan losses. If fair value declines after acquisition, the carrying amount is reduced to the lower of the initial amount or fair value less costs to sell. Such declines are included in other noninterest expense. Operating costs after acquisition are also expensed.
Goodwill and Other Intangibles: Goodwill is the excess of purchase price of an acquisition over the fair value of identified net assets acquired in an acquisition. Goodwill (and intangible assets deemed to have indefinite lives) is not amortized but is subject to annual impairment tests. Other intangible assets, including core deposit intangibles, were amortized over their useful lives. Goodwill is tested at least annually for impairment, or more often if events or other circumstances indicate that there may be impairment. No goodwill impairment was recorded in the years 2005, 2006, or 2007. Identified intangible assets are periodically reviewed to determine whether there have been any events or circumstances to indicate that the recorded amount is not recoverable.
Loan Commitments and Related Financial Instruments: Financial instruments include offbalance sheet credit instruments, such as commitments to make loans and commercial letters of credit, issued to meet customer financing needs. The face amount for these items represents the exposure to loss, before considering customer collateral or ability to repay. Such financial instruments are recorded when they are funded.
Trust Assets and Fees: Assets held in fiduciary or agency capacities are not included in the consolidated balance sheets because such amounts are not assets of the Company. Income from trust fees is recorded on an accrual basis and is included as a component of noninterest income.
Retirement Plan Costs: The Company had a tax-qualified noncontributory defined benefit retirement plan covering substantially all full-time and regular part-time employees of the Company that was terminated in December 2005.
26
Generally, benefits were based on years of service and compensation. Certain participants in the defined benefit plan were also covered by an unfunded supplemental retirement plan. The purpose of the supplemental retirement plan (SERP) was to extend full retirement benefits to individuals without regard to statutory limitations under tax-qualified plans. The Company paid all amounts due to participants of the supplemental retirement plan (SERP) in 2005. The Company paid benefits to all defined benefit plan participants prior to December 31, 2006.
Bank Owned Life Insurance: The Company has purchased life insurance policies on certain employees and is the owner and beneficiary of the policies. Upon adoption of EITF 06-5, which is discussed further below, bank owned life insurance is recorded at the amount that can be realized under the insurance contract at the balance sheet date, which is the cash surrender value adjusted for other charges or other amounts due that are probable at settlement. Prior to adoption of EITF 06-5, the Company recorded owned life insurance at its cash surrender value. It also had no other charges or probable amounts due at settlement related to these policies.
In September 2006, the FASB Emerging Issues Task Force finalized Issue No. 06-5, Accounting for Purchases of Life Insurance - Determining the Amount That Could Be Realized in Accordance with FASB Technical Bulletin No. 85-4 (Accounting for Purchases of Life Insurance) {Issue}. This Issue requires that a policyholder consider contractual terms of a life insurance policy in determining the amount that could be realized under the insurance contract. It also requires that if the contract provides for a greater surrender value if all individual policies in a group are surrendered at the same time, that the surrender value be determined based on the assumption that policies will be surrendered on an individual basis. Lastly, the Issue requires disclosure when there are contractual restrictions on the Company’s ability to surrender a policy. The adoption of EITF 06-5 on January 1, 2007, had no material impact on the Company’s financial condition or results of operation.
Long-term Incentive Plan: Effective January 1, 2006, the Company adopted SFAS No. 123(R), Share-based Payment
(“SFAS No. 123(R)”), using the modified prospective transition method. Accordingly, the Company has recorded stock-based employee compensation cost using the fair value method starting in 2006.
Prior to January 1, 2006, employee compensation expense under stock options was reported using the intrinsic value method. No material stockbased compensation cost is reflected in net income for the year ended December 31, 2005, as all options granted had an exercise price equal to or greater than the market price of the underlying common stock at date of grant.
The following table illustrates the effect on net income and earnings per share if expense was measured using the fair value recognition provisions of FASB Statement No. 123, Accounting for StockBased Compensation, for the year ended December 31, 2005:
| | 2005 | |
Net income as reported | | $ | 27,683 | |
Pro forma net income | | 26,143 | |
Basic earnings per share as reported | | 2.05 | |
Pro forma basic earnings per share | | 1.94 | |
Diluted earnings per share as reported | | 2.03 | |
Pro forma diluted earnings per share | | 1.91 | |
| | | | |
The pro forma effects were computed using option-pricing models with the following assumptions:
| | 2005 | |
Risk free interest rate | | 4.45 | % |
Expected option life, in years | | 5 | |
Expected stock price volatility | | 25.02 | % |
Dividend yield | | 1.70 | % |
The expected life was based on historical average holding period.
27
Income Taxes: Income tax expense is the total of the current year income tax due or refundable and the change in deferred tax assets and liabilities. Deferred tax assets and liabilities are the expected future tax amounts for the temporary differences between carrying amounts and tax basis of assets and liabilities, computed using enacted tax rates. The effect on deferred taxes of a change in tax rates is recognized in income in the period that includes the enactment date of the change. A valuation allowance is provided for any deferred tax asset for which it is more likely than not that the asset will not be realized. Changes in valuation allowances are recorded as a component of income tax expense if needed.
The Company adopted FASB Interpretation 48, Accounting for Uncertainty in Income Taxes (“FIN 48”), as of January 1, 2007. A tax position is recognized as a benefit only if it is “more likely than not” that the tax position would be sustained in a tax examination, with a tax examination being presumed to occur. The amount recognized is the largest amount of tax benefit that is greater than 50% likely of being realized on examination. For tax positions not meeting the “more likely than not” test, no tax benefit is recorded. The adoption had no effect on the Company’s financial statements. The Company and its subsidiaries are subject to U.S. federal income tax as well as income tax of the state of Illinois. The Company is no longer subject to examination by taxing authorities for years before 2003. The Company recognizes interest and/or penalties related to income tax matters in income tax expense. As of January 1, 2007, the Company had no material unrecognized tax benefits. The Company did not record a cumulative effect adjustment related to the adoption of FIN 48. There have been no material changes in unrecognized tax benefits since January 1, 2007. The Company did not have any material amounts accrued for interest and penalties at either January 1, 2007 or December 31, 2007.
Earnings Per Share: Basic earnings per share represent net income divided by the weighted-average number of common shares outstanding during the year. Diluted earnings per share includes the dilutive effects of additional potential common shares issuable under stock options and restricted stock, computed based on the treasury stock method using the average market price for the period. Earnings and dividends per share are restated for all stock splits and dividends through the date of issue of the consolidated financial statements.
Treasury Stock: Shares of Old Second Bancorp, Inc. may be acquired for reissuance in connection with stock option plans, for future stock dividend declarations, and for general corporate purposes. Treasury shares acquired are recorded at cost.
Mortgage Banking Derivatives: From time to time, the Company enters into mortgage banking derivatives such as forward contracts and interest rate lock commitments in the ordinary course of business. These derivatives may be designated as fair value hedges of loans held for sale. Accordingly, both the derivatives and the hedged loans held for sale are carried at fair value. The remaining derivatives are not designated as hedges and are carried at fair value. The net gain or loss on mortgage banking derivative is included in gain on sale of loans.
Comprehensive Income: Comprehensive income is the total of net income and certain other items that are charged or credited to stockholders’ equity. The Company includes changes in unrealized gains or losses, net of tax, on securities available for sale in other comprehensive income (loss). Comprehensive income is presented in the Consolidated Statement of Changes in Stockholders’ Equity and accumulated other comprehensive income (loss) is reported in the Consolidated Balance Sheets.
Transfers of Financial Assets: Transfers of financial assets are accounted for as sales, when control over the assets has been relinquished. Control over transferred assets is deemed to be surrendered when the assets have been isolated from the Company, the transferee obtains the right (free of conditions that constrain it from taking advantage of that right) to pledge or exchange the transferred assets, and the Company does not maintain effective control over the transferred assets through an agreement to repurchase them before their maturity.
28
Loss Contingencies: Loss contingencies, including claims and legal actions arising in the ordinary course of business, are recorded as liabilities when the likelihood of loss is probable and an amount or range of loss can be reasonably estimated. Management does not believe there now are such matters that will have a material effect on the financial statements.
Variable Interest Entity: In December 2003, the FASB revised FIN No. 46, Consolidation of Variable Interest Entities. FIN 46, as revised in December 2003, changes the accounting model for consolidation from one based on consideration of control through voting interests. Whether to consolidate an entity now considers whether that entity has sufficient equity at risk to enable it to operate without additional financial support, whether the equity owners in that entity lack the obligation to absorb expected losses or the right to receive residual returns of the entity, or whether voting rights in the entity are not proportional to the equity interest and substantially all the entity’s activities are conducted for an investor with few voting rights. As of December 31, 2004, the Company applied the provisions of revised FIN 46 to Old Second Capital Trust I, a wholly owned subsidiary trust that issued capital securities to third-party investors. As of April 2007, the Company applied the provisions of revised FIN 46 to Old Second Capital Trust II, a wholly owned subsidiary trust that issued capital securities to third-party investors. As a result, Old Second Capital Trust I and II are unconsolidated subsidiaries of the Company. The issuance of trust-preferred securities through this trust subsidiary is discussed further in Note J.
Segment Reporting: Operating segments are components of a business about which separate financial information is available and that is evaluated regularly by the chief operating decision maker in deciding how to allocate resources and assess performance. Public companies are required to report certain financial information about operating segments. The Company’s chief operating decision maker evaluates the operations of the Company as one operating segment, Community Banking. As a result, disclosure of separate segment information is not required. The Company offers the following products and services to external customers: deposits, loans and trust services. Revenues for each of these products and services are disclosed separately in the consolidated statements of income.
Dividend Restriction: Banking regulations require maintaining certain capital levels and may limit the dividends paid by the Bank to the Company or by the Company to stockholders.
Restrictions on Cash: Cash on hand or on deposit with the Federal Reserve Bank was required to meet regulatory reserve and clearing requirements. These balances do not earn interest.
Reclassifications: Some items in the prior year financial statements were reclassified to conform to the current presentation.
New Accounting Pronouncements: In February 2006, the FASB issued Statement of Financial Accounting Standards No. 155, Accounting for Certain Hybrid Financial Instruments (SFAS No. 155), which permits fair value remeasurement for hybrid financial instruments that contain an embedded derivative that otherwise would require bifurcation. Additionally, SFAS No. 155 clarifies the accounting guidance for beneficial interests in securitizations. Under SFAS No. 155, all beneficial interests in a securitization will require an assessment in accordance with SFAS No. 133 to determine if an embedded derivative exists within the instrument. In January 2007, the FASB issued Derivatives Implementation Group Issue B40, Application of Paragraph 13(b) to Securitized Interests in Prepayable Financial Assets (DIG Issue B40). DIG Issue B40 provides an exemption from the embedded derivative test of paragraph 13(b) of SFAS No. 133 for instruments that would otherwise require bifurcation if the test is met solely because of a prepayment feature included within the securitized interest and prepayment is not controlled by the security holder. SFAS No. 155 and DIG Issue B40 are effective for fiscal years beginning after September 15, 2006. The adoption of SFAS No. 155 and DIG Issue B40 on January 1, 2007 did not have an impact on the Company’s consolidated financial position or results of operations.
Effect of Newly Issued But Not Yet Effective Accounting Standards: In September 2006, the FASB issued Statement No. 157, Fair Value Measurements. This Statement defines fair value, establishes a framework for measuring fair value and
29
expands disclosures about fair value measurements. This Statement establishes a fair value hierarchy about the assumptions used to measure fair value and clarifies assumptions about risk and the effect of a restriction on the sale or use of an asset. The Statement does not change existing accounting rules governing what can or what must be recognized and reported at fair value in the Company’s financial statements, or disclosed at fair value in the Company’s notes to the financial statements. Additionally, this Statement does not eliminate practicability exceptions that exist in accounting pronouncements amended by this Statement when measuring fair value. As result, the Company will not be required to recognize any new assets or liabilities at fair value. The standard is effective for fiscal years beginning after November 15, 2007. The impact of adoption on January 1, 2008 was not material.
In February 2007, the FASB issued Statement No. 159, The Fair Value Option for Financial Assets and Financial Liabilities. The standard provides companies with an option to report selected financial assets and liabilities at fair value and establishes presentation and disclosure requirements designed to facilitate comparisons between companies that choose different measurement attributes for similar types of assets and liabilities. The new standard is effective for the Company on January 1, 2008. The Company did not elect the fair value option for any financial assets or financial liabilities as of January 1, 2008.
In September 2006, the FASB Emerging Issues Task Force finalized Issue No. 06-4, Accounting for Deferred Compensation and Postretirement Benefit Aspects of Endorsement Split-Dollar Life Insurance Arrangements. This issue requires that a liability be recorded during the service period when a split-dollar life insurance agreement continues after participants’ employment or retirement. The required accrued liability will be based on either the post-employment benefit cost for the continuing life insurance or based on the future death benefit depending on the contractual terms of the underlying agreement. This issue is effective for fiscal years beginning after December 15, 2007. The adoption of EITF 06-4 on January 1, 2008 had no effect on the Company’s financial statements.
On November 5, 2007, the Securities and Exchange Commission (“SEC”) issued Staff Accounting Bulletin (“SAB”) No. 109, Written Loan Commitments Recorded at Fair Value through Earnings (“SAB 109”). Previously, SAB 105, Application of Accounting Principles to Loan Commitments, stated that in measuring the fair value of a derivative loan commitment, a company should not incorporate the expected net future cash flows related to the associated servicing of the loan. SAB 109 supersedes SAB 105 and indicates that the expected net future cash flows related to the associated servicing of the loan should be included in measuring fair value for all written loan commitments that are accounted for at fair value through earnings. SAB 105 also indicated that internally-developed intangible assets should not be recorded as part of the fair value of a derivative loan commitment, and SAB 109 retains that view. SAB 109 is effective for derivative loan commitments issued or modified in fiscal quarters beginning after December 15, 2007. The Company is evaluating the potential impact, if any, that the adoption of SAB 109 will have on its financial statements.
In December 2007, the FASB issued Statement 141 (revised 2007), Business Combinations (Statement 141R) to change how an entity accounts for the acquisition of a business. When effective, this Statement will replace existing Statement 141 in its entirety. This Statement carries forward the existing requirements to account for all business combinations using the acquisition method (formerly called the purchase method). In general, this Statement will require acquisition-date fair value measurement of identifiable assets acquired, liabilities assumed, and noncontrolling interests in the acquiree. This Statement will eliminate the current cost–based purchase method under Statement 141. The new measurement requirements will result in the recognition of the full amount of acquisition-date goodwill, which includes amounts attributable to noncontrolling interests. The acquirer will recognize in income any gain or loss on the remeasurement to acquisition-date fair value of consideration transferred or of previously acquired equity interests in the acquiree. Neither the direct costs incurred to effect a business combination nor the costs the acquirer expects to incur under a plan to restructure an acquired business will be included as part of the business combination accounting. As a result, those costs will be charged to expense when incurred, except for debt or equity issuance costs, which will be accounted for in accordance with other generally accepted accounting principles. This Statement will also change the accounting for contingent consideration, in process research and development, contingencies, and restructuring costs. In
30
addition, changes in deferred tax asset valuation allowances and acquired income tax uncertainties in a business combination that occur after the measurement period will impact income taxes under this Statement.
This Statement is effective for fiscal years and interim periods within those fiscal years beginning on or after December 15, 2008. Early adoption is prohibited. The Company intends to adopt this Statement effective January 1, 2009 and apply its provisions prospectively. The Company currently does not believe that the adoption of this Statement will have a significant effect on its financial statements; however, the effect is dependent upon whether the company makes any future acquisitions and the specifics of those acquisitions. This Statement amends the goodwill impairment test requirements in Statement 142. For a goodwill impairment test as of a date after the effective date of this Statement, the value of the reporting unit and the amount of implied goodwill, calculated in the second step of the test, will be determined in accordance with the measurement and recognition guidance on accounting for business combinations under this Statement. This change could effect the determination of what amount, if any, should be recognized as an impairment loss for goodwill recorded before the effective date of this Statement. This accounting will be required when this Statement becomes effective (January 1, 2009 for the Company) and applies to goodwill related to acquisitions accounted for originally under Statement 141 as well as those accounted for under this Statement. The Company has $2.1 million of goodwill at December 31, 2007 related to previous business combinations and the Company has not yet determined the amount of goodwill recorded in connection with its acquisition of Heritage. The Company has not determined what effect, if any, this Statement will have on the results of its impairment testing subsequent to December 31, 2008.
In December 2007, the FASB issued Statement 160, Noncontrolling Interests in Consolidated Financial Statements: an amendment of ARB No. 51. The new Statement changes the accounting for, and the financial statement presentation of, noncontrolling equity interests in a consolidated subsidiary. This Statement replaces the existing minority-interest provisions of Accounting Research Bulletin (ARB) 51, Consolidated Financial Statements, by defining a new term— noncontrolling interests—to replace what were previously called minority interests. The new standard establishes noncontrolling interests as a component of the equity of a consolidated entity. The underlying principle of the new standard is that both the controlling interest and the noncontrolling interests are part of the equity of a single economic entity: the consolidated reporting entity. Classifying noncontrolling interests as a component of consolidated equity is a change from the current practice of treating minority interests as a mezzanine item between liabilities and equity or as a liability. The change affects both the accounting and financial reporting for noncontrolling interests in a consolidated subsidiary. This Statement includes reporting requirements intended to clearly identify and differentiate the interests of the parent and the interests of the noncontrolling owners. The reporting requirements are required to be applied retrospectively. This Statement is effective for fiscal years and interim periods within those fiscal years beginning on or after December 15, 2008. Early adoption is prohibited. The Company intends to adopt this Statement effective January 1, 2009 and apply its provisions prospectively. The Company will also present comparative financial statements that reflect the retrospective application of the disclosure and presentation provisions when it applies the requirements of this Statement. The Company is evaluating the impact that the adoption of this Statement will have on its financial statements.
In December 2007, the SEC staff issued Staff Accounting Bulletin No. 110, Share-Based Payment (“SAB 110”), which amends
SAB 107, Share-Based Payment, to permit public companies, under certain circumstances, to use the simplified method in SAB 107 for employee option grants after December 31, 2007. Use of the simplified method after December 2007 is permitted only for companies whose historical data about their employees’ exercise behavior does not provide a reasonable basis for estimating the expected term of the options. The Company currently uses the simplified method to estimate the expected term for employee option grants as adequate historical experience is not available to provide a reasonable estimate. SAB 110 is effective for employee options granted after December 31, 2007. The Company intends to adopt SAB 110 effective January 1, 2008 and continue applying the simplified method until enough historical experience is readily available to provide a reasonable estimate of the expected term for employee option grants.
31
Note B: Cash and Due from Banks
Old Second Bank is required to maintain reserve balances with the Federal Reserve Bank. In accordance with Federal Reserve Bank requirements, the average reserve balances were $16.8 million and $16.2 million, respectively at December 31, 2007 and 2006.
Note C: Securities
Securities available for sale at December 31 are summarized as follows:
| | Amortized
Cost | | Gross
Unrealized
Gains | | Gross
Unrealized
Losses | | Fair
Value | |
2007 | | | | | | | | | |
U.S. Treasury | | $ | 10,018 | | $ | 132 | | $ | — | | $ | 10,150 | |
U.S. government agencies | | 209,799 | | 955 | | (203 | ) | 210,551 | |
U.S. government agency mortgage-backed | | 95,839 | | 1,128 | | (92 | ) | 96,875 | |
States and political subdivisions | | 158,862 | | 1,440 | | (544 | ) | 159,758 | |
Collateralized mortgage obligations | | 73,518 | | 463 | | (40 | ) | 73,941 | |
Asset-backed and equity securities | | 9,559 | | 25 | | — | | 9,584 | |
| | $ | 557,595 | | $ | 4,143 | | $ | (879 | ) | $ | 560,859 | |
| | | | | | | | | |
2006 | | | | | | | | | |
U.S. Treasury | | $ | 10,014 | | $ | — | | $ | (384 | ) | $ | 9,630 | |
U.S. government agencies | | 270,439 | | 53 | | (3,325 | ) | 267,167 | |
U.S. government agency mortgage-backed | | 19,775 | | 31 | | (202 | ) | 19,604 | |
States and political subdivisions | | 149,843 | | 925 | | (1,126 | ) | 149,642 | |
Collateralized mortgage obligations | | 26,904 | | 2 | | (182 | ) | 26,724 | |
Asset-backed and equity securities | | 130 | | — | | — | | 130 | |
| | $ | 477,105 | | $ | 1,011 | | $ | (5,219 | ) | $ | 472,897 | |
The fair value of debt securities at year-end 2007 by contractual maturity were as follows. Securities not due at a single maturity date, primarily mortgage-backed securities, collateralized mortgage obligations, and asset-backed and equity securities are shown separately:
| | Amortized
Cost | | Weighted
Average
Yield | | Fair
Value | |
Due in one year or less | | $ | 73,695 | | 3.60% | | $ | 73,554 | |
Due after one year through five years | | 97,146 | | 4.66% | | 97,675 | |
Due after five years through ten years | | 137,292 | | 4.76% | | 138,880 | |
Due after ten years | | 70,546 | | 4.48% | | 70,350 | |
| | $ | 378,679 | | 4.46% | | $ | 380,459 | |
Mortgage-backed & collateralized mortgage obligations | | 169,357 | | 5.29% | | 170,816 | |
Asset-backed and equity securities | | 9,559 | | 6.05% | | 9,584 | |
| | $ | 557,595 | | 4.74% | | $ | 560,859 | |
At year-end 2007 and 2006, there were no holdings of securities of any one issuer, other than the U.S. government and its agencies, in an amount greater than 10% of shareholders’ equity.
32
Securities with unrealized losses at year-end 2007 and 2006, aggregated by investment category and length of time that individual securities have been in a continuous unrealized loss position, are as follows:
| | Less than 12 months
in an unrealized
loss position | | Greater than 12 months
in an unrealized
loss position | | Unrealized | |
| | Unrealized | | Fair | | Unrealized | | Fair | | Losses | |
| | Losses | | Value | | Losses | | Value | | Total | |
2007 | | | | | | | | | | | |
U.S. government agencies | | $ | — | | $ | — | | $ | 203 | | $ | 72,806 | | $ | 203 | |
U.S. government agency mortgage-backed | | 1 | | 57 | | 91 | | 4,602 | | 92 | |
States and political subdivisions | | 281 | | 19,602 | | 263 | | 31,586 | | 544 | |
Collateralized mortgage obligations | | 40 | | 13,049 | | — | | — | | 40 | |
| | $ | 322 | | $ | 32,708 | | $ | 557 | | $ | 108,994 | | $ | 879 | |
| | Less than 12 months
in an unrealized
loss position | | Greater than 12 months
in an unrealized
loss position | | Unrealized | |
| | Unrealized | | Fair | | Unrealized | | Fair | | Losses | |
| | Losses | | Value | | Losses | | Value | | Total | |
2006 | | | | | | | | | | | |
U.S. Treasury | | $ | — | | $ | — | | $ | 384 | | $ | 9,630 | | $ | 384 | |
U.S. government agencies | | 106 | | 46,489 | | 3,219 | | 199,113 | | 3,325 | |
U.S. government agency mortgage-backed | | 33 | | 5,296 | | 169 | | 6,438 | | 202 | |
States and political subdivisions | | 68 | | 18,751 | | 1,058 | | 71,284 | | 1,126 | |
Collateralized mortgage obligations | | 182 | | 21,877 | | — | | — | | 182 | |
| | $ | 389 | | $ | 92,413 | | $ | 4,830 | | $ | 286,465 | | $ | 5,219 | |
The unrealized losses in the securities portfolio are attributable to the changes in interest rates, which has caused the amortized cost to be more than the current fair value. When interest rates decrease, the individual securities typically will increase in value. The fair value is expected to recover as the securities approach their maturity date and/or market rates change. The change in value is not related to credit quality deterioration and the Company has the ability and intent to hold all securities in an unrealized loss position until recovery.
Securities with a fair value of approximately $411.6 million and $343.1 million at December 31, 2007, and 2006, were pledged to secure public deposits and securities sold under repurchase agreements and for other purposes required or permitted by law.
| | Years ended December 31, | |
| | 2007 | | 2006 | | 2005 | |
Proceeds from sales of securities | | $ | 2,364 | | $ | 339 | | $ | 20,415 | |
Gross realized gains on securities | | 695 | | 418 | | 5 | |
Gross realized losses on securities | | (21 | ) | — | | (19 | ) |
Securities gains (losses), net | | $ | 674 | | $ | 418 | | $ | (14 | ) |
Income tax (benefit) expense on net realized gains/ losses | | $ | 268 | | $ | 166 | | $ | (6 | ) |
33
Note D: Loans
Major classifications of loans at December 31 were as follows: | | | | | |
| | 2007 | | 2006 | |
Commercial and industrial | | $ | 197,124 | | $ | 175,621 | |
Real estate – commercial | | 633,909 | | 605,098 | |
Real estate – construction | | 399,087 | | 374,654 | |
Real estate – residential | | 634,266 | | 586,959 | |
Installment | | 28,350 | | 23,326 | |
| | $ | 1,892,736 | | $ | 1,765,658 | |
Net deferred loan fees and costs | | (1,626 | ) | (1,746 | ) |
| | $ | 1,891,110 | | $ | 1,763,912 | |
| | | | | | | | |
It is the policy of the Company to review each prospective credit in order to determine an adequate level of security or collateral to obtain prior to making a loan. The type of collateral, when required, will vary in ranges from liquid assets to real estate. The Company’s access to collateral, in the event of borrower default, is assured through adherence to state lending laws and the Company’s lending standards and credit monitoring procedures. The Bank generally makes loans within its market area. There are no significant concentrations of loans where the customers’ ability to honor loan terms is dependent upon a single economic sector.
Past due and non-accrual loans at December 31 were as follows: | | | | | | | |
| | 2007 | | 2006 | | 2005 | |
Non-accrual loans | | $ | 5,346 | | $ | 1,632 | | $ | 3,845 | |
Interest income recorded on non-accrual loans | | 179 | | 199 | | 334 | |
Interest income which would have been accrued on non-accrual loans | | 480 | | 325 | | 636 | |
Loans 90 days or more past due and still accruing interest | | 625 | | 583 | | 2,752 | |
| | | | | | | | | | |
Loans to principal officers, directors, and their affiliates, which are made in the ordinary course of business, in 2007 and 2006, were as follows at December 31:
| | 2007 | | 2006 | |
Beginning balance | | $ | 44,032 | | $ | 25,364 | |
New loans | | 50,745 | | 133,370 | |
Repayments and other reductions | | (69,946 | ) | (92,979 | ) |
Participations | | 4,564 | | (21,723 | ) |
Ending balance | | $ | 29,395 | | $ | 44,032 | |
No loans to principal officers, directors, and their affiliates were past due greater than 90 days at December 31, 2007.
Note E: Allowance for Loan Losses
Changes in the allowance for loan losses were as follows: | | | | | | | |
| | 2007 | | 2006 | | 2005 | |
Balance at beginning of year | | $ | 16,193 | | $ | 15,329 | | $ | 15,495 | |
Provision for loan losses | | 1,188 | | 1,244 | | 353 | |
Loans charged-off | | (1,069 | ) | (888 | ) | (1,049 | ) |
Recoveries | | 523 | | 508 | | 530 | |
Balance at end of year | | $ | 16,835 | | $ | 16,193 | | $ | 15,329 | |
34
Impaired loans aggregated $25.8 million and $9.2 million at December 31, 2007, and 2006, respectively. Average impaired loans in 2007 and 2006 totaled $17.2 million and $15.6 million, respectively. The majority of the loans deemed impaired were evaluated using the fair value of the collateral as the measurement method. The related allowance allocated to impaired loans as of December 31, 2007 and 2006 was $1.8 million and $1.9 million, respectively. There were no impaired loans without an associated allowance in 2007 or 2006. During 2007, 2006, and 2005, interest recognized on impaired loans, while they were considered impaired, was $1.0 million, $900,000, and $350,000, respectively. Interest income related to impaired loans was recognized on the accrual basis and is not significantly different than the interest income recognized on the cash basis.
Note F: Premises and Equipment
Premises and equipment at December 31 were as follows:
| | 2007 | | 2006 | |
| | Cost | | Accumulated
Depreciation | | Net Book
Value | | Cost | | Accumulated
Depreciation | | Net Book
Value | |
Land | | $ | 14,126 | | $ | — | | $ | 14,126 | | $ | 11,552 | | $ | — | | $ | 11,552 | |
Premises | | 39,246 | | 15,834 | | 23,412 | | 37,821 | | 14,604 | | 23,217 | |
Furniture and equipment | | 38,388 | | 26,228 | | 12,160 | | 36,433 | | 22,798 | | 13,635 | |
| | $ | 91,760 | | $ | 42,062 | | $ | 49,698 | | $ | 85,806 | | $ | 37,402 | | $ | 48,404 | |
| | | | | | | | | | | | | | | | | | | | |
Note G: Intangible Assets
There was no amortization expense relating to the core deposit intangible for the year ended December 31, 2007, whereas December 31, 2006, and 2005, were $355,000 for each of those years. The core deposit intangible was amortized in full as of December 31, 2006.
Note H: Mortgage Servicing Rights and Loans Held for Sale
| | 2007 | | 2006 | |
Loans held for sale at year-end are as follows: | | | | | |
Loans held for sale | | $ | 16,677 | | $ | 14,378 | |
Less: Allowance to adjust to lower of cost or market | | — | | — | |
Loans held for sale, net | | $ | 16,677 | | $ | 14,378 | |
Mortgage loans serviced for others are not reported as assets. The principal balances of these loans at year-end are as follows:
| | 2007 | | 2006 | |
Mortgage loan portfolios serviced for: | | | | | |
Federal Home Loan Mortgage Corporation | | $ | 10,078 | | $ | 8,041 | |
Federal National Mortgage Association | | 202,851 | | 218,006 | |
Illinois Housing Development Authority | | 10,397 | | 9,475 | |
Sterling Federal | | 32 | | 79 | |
| | | | | | | |
35
Custodial escrow balances maintained in connection with serviced loans were $1.8 million and $1.7 million at year-end 2007 and 2006.
Activity for capitalized mortgage servicing rights was as follows: | | | | | | | |
| | 2007 | | 2006 | | 2005 | |
Balance at beginning of year | | $ | 3,032 | | $ | 2,271 | | $ | 377 | |
Additions | | 237 | | 1,295 | | 2,110 | |
Less: amortization | | (700 | ) | (534 | ) | (216 | ) |
Balance at end of year | | 2,569 | | 3,032 | | 2,271 | |
| | | | | | | |
Changes in the valuation allowance for servicing assets were as follows: | | | | | | | |
Balance at beginning of year | | 150 | | — | | 60 | |
Provisions for impairment | | 250 | | 150 | | — | |
Less: recoveries | | (313 | ) | — | | (60 | ) |
Balance at end of year | | 87 | | 150 | | — | |
Net balance | | $ | 2,482 | | $ | 2,882 | | $ | 2,271 | |
| | | | | | | |
Fair value of mortgage servicing rights | | $ | 2,652 | | $ | 3,086 | | $ | 2,844 | |
Fair value at December 31, 2007 was determined using a discount rate of 9.0%, prepayment speeds from Andrew Davidson & Co., Inc., a risk analytics and consultant vendor and a weighted average delinquency rate of 1.35% and a weighted average foreclosure/bankruptcy rate of 0.36%. Fair value at December 31, 2006 was determined using a discount rate of 9.0%, prepayment speeds from Bloomberg, and a weighted average delinquency rate of 1.38% and a weighted average foreclosure/bankruptcy rate of 0.14%.
The weighted average amortization period is 6.6 years. Estimated amortization expense for each of the next five years is as follows:
2008 | | $ | 391 | |
2009 | | 334 | |
2010 | | 278 | |
2011 | | 232 | |
2012 | | 196 | |
Note I: Deposits
Major classifications of deposits at December 31 were as follows: | | | | | |
| | 2007 | | 2006 | |
Noninterest bearing | | $ | 271,549 | | $ | 280,630 | |
Savings | | 96,425 | | 104,229 | |
NOW accounts | | 247,262 | | 257,505 | |
Money market accounts | | 505,678 | | 446,215 | |
Certificates of deposit of less than $100,000 | | 599,034 | | 591,941 | |
Certificates of deposit of $100,000 or more | | 393,670 | | 382,173 | |
| | $ | 2,113,618 | | $ | 2,062,693 | |
The above table includes brokered certificates of deposit totaling $55.3 million and $60.8 million at December 31, 2007, and 2006, respectively.
36
At year-end 2007, scheduled maturities of time deposits were as follows:
2008 | | $ | 909,810 | |
2009 | | 38,848 | |
2010 | | 26,587 | |
2011 | | 10,919 | |
2012 | | 6,540 | |
Thereafter | | — | |
Total | | $ | 992,704 | |
The following table sets forth the amount and maturities of deposits of $100,000 or more at December 31, 2007:
3 months or less | | $ | 146,686 | |
Over 3 months through 6 months | | 109,635 | |
Over 6 months through 12 months | | 95,488 | |
Over 12 months | | 41,861 | |
| | $ | 393,670 | |
| | | | | |
The following table is a summary of borrowings as of December 31: | | | | | |
| | 2007 | | 2006 | |
Securities sold under agreement to repurchase | | $ | 53,222 | | $ | 38,218 | |
Federal funds purchased | | 165,100 | | 54,000 | |
FHLB advances | | 80,000 | | 70,000 | |
Treasury tax and loans | | 2,873 | | 3,090 | |
Junior subordinated debentures | | 57,399 | | 31,625 | |
Note payable | | 18,610 | | 16,425 | |
| | $ | 377,204 | | $ | 213,358 | |
The Company enters into sales of securities under agreements to repurchase (repurchase agreements) which generally mature within 1 to 90 days from the transaction date. These repurchase agreements are treated as financings and they are secured by securities with a carrying amount $56.0 million and $39.1 million at year-end 2007 and 2006. The securities sold under agreements to repurchase consisted of U.S. government agencies and mortgage-backed securities during the two-year reporting period.
The following table is a summary of additional information related to repurchase agreements:
| | 2007 | | 2006 | | 2005 | |
Average daily balance during the year | | $ | 53,323 | | $ | 46,461 | | $ | 45,993 | |
Average interest rate during the year | | 4.48 | % | 4.37 | % | 2.83 | % |
Maximum month-end balance during the year | | 58,509 | | 52,282 | | 57,625 | |
Weighted average interest rate at year-end | | 4.03 | % | 4.90 | % | 3.24 | % |
| | | | | | | | | | |
The Company’s borrowings at the Federal Home Loan Bank of Chicago (FHLBC) are limited to the lesser of 35% of total assets or 60% of the book value of certain mortgage loans. In addition, these notes were collateralized by FHLBC stock of $7.8 million and loans totaling $278.6 million at December 31, 2007. FHLBC stock of $7.6 million and loans totaling $178.5 million were pledged as of December 31, 2006. As of December 31, 2007, a short-term FHLB advance of $50 million that has a floating rate of four basis points above the FHLB federal funds effective rate was scheduled to mature on January 31, 2008. The January advance was renewed with substantially the same terms and a February 29, 2008 maturity. On that date, a new one-month floating FHLB advance using the same index pricing relationship was
37
Obtained. As of December 31, 2007, a 4.98% fixed-rate FHLB advance of $30 million was scheduled to mature on March 10, 2008.
The Bank is a Treasury Tax & Loan (TT&L) depository for the Federal Reserve Bank (FRB), and as such, accepts TT&L deposits. The Company is allowed to hold these deposits for the FRB until they are called. The interest rate is the federal funds rate less 25 basis points. Securities with a face value greater than or equal to the amount borrowed are pledged as a condition of borrowing TT&L deposits. As of December 31, 2007 and 2006, the TT&L deposits were $2.9 million and $3.1 million, respectively.
The Company completed the sale of $27.5 million of cumulative trust preferred securities by its unconsolidated subsidiary, Old Second Capital Trust I in June 2003. An additional $4.1 million of cumulative trust preferred securities was sold in the first week of July 2003. The costs associated with the tender offer of the cumulative trust preferred securities are being amortized over 30 years. The trust-preferred securities can remain outstanding for a 30-year term but, subject to regulatory approval, they can be called in whole or in part by the Company beginning on June 30, 2008 and from time to time thereafter. Cash distributions on the securities are payable quarterly at a fixed annual rate of 7.80%.
The Company issued an additional $25.0 million of cumulative trust preferred securities through a private placement completed by an additional unconsolidated subsidiary, Old Second Capital Trust II (“the Trust”) in April 2007. Although nominal in amount, the costs associated with that issuance are being amortized over 30 years. These trust preferred securities also mature in 30 years, but subject to the aforementioned regulatory approval, can be called in whole or in part on a quarterly basis commencing June 15, 2017. The quarterly cash distributions on the securities are fixed at 6.766% through June 15, 2017 and float at 150 basis points over the British Bankers Association three-month LIBOR rate thereafter. The Company issued a new $25.8 million subordinated debenture to the Trust in return for the aggregate net proceeds of this trust preferred offering and to provide the primary source of financing for the common stock tender offer that was completed in May 2007. The interest rate and payment frequency on the debenture are equivalent to the cash distribution basis on the trust preferred securities.
Both of the debentures issued by Old Second Bancorp, Inc. are recorded on the Consolidated Balance Sheets as junior subordinated debentures and the related interest expense for each issuance is included in the Consolidated Statements of Income.
The Company had a $30 million line of credit available with Marshall & Ilsley (“M&I”) under which there was a $18.6 million outstanding balance as of December 31, 2007 and a $16.4 million outstanding balance as of December 31, 2006. A revolving business note dated April 30, 2007 evidenced the line of credit and Company guarantee. The note provided that any outstanding principal bore interest at 0.90 percentage points over the British Bankers Association (BBA) one-month LIBOR rate and had a maturity date of April 29, 2008. The proceeds of the note were primarily used to repurchase common stock.
On January 31, 2008, the Company entered into a $75.5 million credit facility with LaSalle Bank National Association (“LaSalle”) pursuant to that certain Loan and Subordinated Debenture Purchase Agreement (the “Agreement”). This new credit facility replaced the above $30.0 million revolving credit facility between the Company and M&I.
The new $75.5 million credit facility is comprised of a $30.5 million senior debt facility and $45.0 million of subordinated debt. The senior debt facility is comprised of a $500,000 term loan with a maturity of March 31, 2018, and a revolving loan with a maturity of March 31, 2010. Management expects to renew the revolving loan on an annual basis. The subordinated debt matures on March 31, 2018. The interest rate on the senior debt facility resets quarterly, and is based on, at the Company’s option, either LaSalle’s prime rate or three-month LIBOR plus 90 basis points. The interest rate on the subordinated debt resets quarterly, and is equal to three-month LIBOR plus 150 basis points. The senior debt is secured with all of the issued and outstanding shares of the Bank.
38
The Agreement contains usual and customary provisions regarding acceleration upon the occurrence of an event of default by the Company under the Agreement, as described therein. The Agreement also contains certain customary representations and warranties and financial and negative covenants. The proceeds of the $45.0 million of subordinated debt were primarily used to finance the acquisition of HeritageBanc, Inc.
At year-end 2007, scheduled maturities of borrowings were as follows:
| | 2007 | | 2006 | |
| | Balance | | Weighted
Average
Rate | | Balance | | Weighted
Average
Rate | |
2007 | | N/A | | N/A | | $ | 181,733 | | 5.32 | % |
2008 | | $ | 319,805 | | 4.23 | % | — | | — | |
2009 | | — | | — | | — | | — | |
2010 | | — | | — | | — | | — | |
2011 | | — | | — | | — | | — | |
2012 | | — | | — | | — | | — | |
Thereafter | | 57,399 | | 7.34 | % | 31,625 | | 7.80 | % |
Total | | $ | 377,204 | | 4.70 | % | $ | 213,358 | | 5.69 | % |
Note K: Income Taxes
Income tax expense (benefit) for the year ended December 31 was as follows:
| | 2007 | | 2006 | | 2005 | |
Current federal | | $ | 9,484 | | $ | 9,311 | | $ | 10,707 | |
Current state | | — | | 1,018 | | 1,830 | |
Deferred federal | | (503) | | (474 | ) | 847 | |
Deferred state | | (161) | | 15 | | 228 | |
| | $ | 8,820 | | $ | 9,870 | | $ | 13,612 | |
The following were the components of the deferred tax assets and liabilities as of December 31:
| | 2007 | | 2006 | |
Allowance for loan losses | | $ | 7,098 | | $ | 6,762 | |
Deferred compensation | | 937 | | 847 | |
Amortization of core deposit intangible assets | | 394 | | 487 | |
Other assets | | 1,108 | | 696 | |
Deferred tax assets | | 9,537 | | 8,792 | |
| | | | | |
Accumulated depreciation | | (1,959 | ) | (2,227 | ) |
Accretion on securities | | (256 | ) | (235 | ) |
Mortgage servicing rights | | (1,083 | ) | (1,266 | ) |
Other liabilities | | (1,276 | ) | (765 | ) |
Deferred tax liabilities | | (4,574 | ) | (4,493 | ) |
| | 4,963 | | 4,299 | |
Tax (liability) benefit on net unrealized (gains) losses on securities | | (1,293 | ) | 1,663 | |
Net deferred tax asset | | $ | 3,670 | | $ | 5,962 | |
No valuation allowance for deferred tax assets was recorded at December 31, 2007 and 2006 as management believes it is more likely than not that all of the deferred tax assets will be realized because they were supported by recoverable taxes paid in prior years.
39
The components of the provision for deferred income tax expense (benefit) were as follows:
| | 2007 | | 2006 | | 2005 | |
Provision for loan losses | | $ | (336 | ) | $ | (663 | ) | $ | 48 | |
Depreciation | | (268 | ) | (2 | ) | (337 | ) |
Pension expense | | — | | — | | 45 | |
Net premiums and discounts on securities | | 21 | | 60 | | 351 | |
Mortgage servicing rights | | (183 | ) | 316 | | 898 | |
Other, net | | 102 | | (170 | ) | 70 | |
| | $ | (664 | ) | $ | (459 | ) | $ | 1,075 | |
Effective tax rates differ from federal statutory rates applied to financial statement income due to the following:
| | 2007 | | 2006 | | 2005 | |
Tax at statutory federal income tax rate | | $ | 11,477 | | $ | 11,734 | | $ | 14,453 | |
Nontaxable interest income, net of disallowed interest deduction | | (1,776 | ) | (1,588 | ) | (1,611 | ) |
BOLI income | | (707 | ) | (721 | ) | (345 | ) |
State income taxes, net of federal benefit | | (105 | ) | 672 | | 1,338 | |
General business credit | | (152 | ) | (152 | ) | — | |
Other, net | | 83 | | (75 | ) | (223 | ) |
Tax at effective tax rate | | $ | 8,820 | | $ | 9,870 | | $ | 13,612 | |
Note L: Retirement Plans
In previous years the Company had a tax-qualified noncontributory defined benefit retirement plan covering substantially all full-time and regular part-time employees of the Company. Benefits were generally based on years of service and compensation. Certain participants in the defined benefit plan were also covered by an unfunded supplemental retirement plan. The purpose of the supplemental retirement plan was to extend full retirement benefits to individuals without regard to statutory limitations under tax-qualified plans.
As of December 31, 2005, the defined benefit and supplemental retirement plans were terminated. Prior to December 31, 2005, all amounts due were paid to participants of the supplemental retirement plan. Prior to December 31, 2006, all amounts due were paid to participants of the defined benefit plan.
40
The following table sets forth the plans’ status and amounts recognized in the financial statements prior to the final distribution that occurred in 2006:
| | 2006 | | 2005 | |
Accumulated benefit obligation | | $ | — | | $ | 13,811 | |
| | | | | |
Change in the projected benefit obligation | | | | | |
Projected benefit obligation at beginning of year | | $ | 13,811 | | $ | 19,079 | |
Service cost | | — | | 1,778 | |
Interest cost | | 577 | | 1,022 | |
Actuarial loss | | 1,055 | | 1,985 | |
Curtailment | | — | | (7,902 | ) |
Settlement | | (15,246 | ) | — | |
Benefits paid | | (197 | ) | (2,151 | ) |
Benefit obligation at end of year | | $ | — | | $ | 13,811 | |
| | | | | |
Change in plan assets | | | | | |
Fair value of plan assets at beginning of year | | $ | 13,922 | | $ | 12,167 | |
Actual return on plan assets | | 611 | | 416 | |
Employer contributions | | 910 | | 3,490 | |
Settlement | | (15,246 | ) | — | |
Benefits paid | | (197 | ) | (2,151 | ) |
Fair value of the asset at end of year | | $ | — | | $ | 13,922 | |
| | | | | |
Accrued pension cost | | | | | |
Funded status | | $ | — | | $ | 111 | |
Unrecognized net actuarial loss (gain) | | — | | 674 | |
Accrued benefit cost | | $ | — | | $ | 785 | |
| | | | | |
Net periodic pension cost | | | | | |
Service cost | | $ | — | | $ | 1,778 | |
Interest cost | | 577 | | 1,022 | |
Expected return on assets | | (611 | ) | (869 | ) |
Amortization of unrecognized: | | | | | |
Net loss (gain) | | 54 | | 346 | |
Prior service cost | | — | | 13 | |
Additional cost due to curtailment | | — | | 378 | |
Net periodic pension cost | | $ | 20 | | $ | 2,668 | |
| | | | | |
Amounts applicable to the supplemental retirement plan | | | | | |
Projected benefit obligation | | $ | — | | $ | 1,958 | |
Accumulated benefit obligation | | — | | 1,276 | |
| | | | | |
Key assumptions: | | | | | |
Discount rate | | 4.73 | % | 5.25 | % |
Long-term rate of return on assets | | 5.00 | % | 7.50 | % |
Salary increases | | N/A | | 5.00 | % |
41
The pension plan weighted-average asset allocation at December 31, 2005, the measurement date, by asset category was as follows:
| | Plan Assets
2005 | |
Asset Category: | | | |
Equity securities | | 47.6 | % |
Bonds | | 34.9 | % |
Money markets | | 17.5 | % |
Total net periodic benefit cost | | 100.0 | % |
The investment return objective for the pension plan was to maximize total return, with a targeted minimum of 7.5%. Asset allocation called for 40 to 70% in equity securities, 25 to 60% in bonds, and 0 to 20% in money markets. The investment objectives changed in 2006 to facilitate the termination of the plan and the distribution of benefits to all plan participants that was completed prior to December 31, 2006.
Note M: Employee Benefit Plans
Old Second Bancorp, Inc. Employees 401(k) Savings Plan and Trust
The Company sponsors a qualified, tax-exempt pension plan qualifying under section 401(k) of the Internal Revenue Code. Virtually all employees are eligible to participate after meeting certain age and service requirements. Eligible employees are permitted to contribute up to a dollar limit set by law of their compensation to the 401(k) plan. Pursuant to the plan, the Company matches up to 100% of a participant’s deferral into the 401(k) plan limited up to 6% of each participant’s salary. The profit sharing portion of the 401(k) plan arrangement provides an annual discretionary contribution to the retirement account of each employee based in part on the Company’s profitability in a given year, and on each participant’s annual compensation. Participants can choose between several different investment options under the 401(k) plan, including shares of the Company’s common stock.
The total expense relating to the 401(k) plan was approximately $2.2 million in 2007, $2.0 million in 2006, and $1.3 million in 2005.
Old Second Bancorp, Inc. Voluntary Deferred Compensation Plan for Executives
The Company sponsors an executive deferred compensation plan, which is a means by which certain executives may voluntarily defer a portion of their salary or bonus. This plan is an unfunded, nonqualified deferred compensation arrangement. Company obligations under this arrangement as of December 31, 2007 and December 31, 2006 were $2.2 million and $2.0 million.
Note N: Long-Term Incentive Plan
The Long-Term Incentive Plan (the “Incentive Plan”) authorizes the issuance of up to 1,333,332 shares of the Company’s common stock, including the granting of qualified stock options (“Incentive Stock Options”), nonqualified stock options, restricted stock, and stock appreciation rights. Total shares issuable under the plan were 116,531 at year-end 2007. Stock based awards may be granted to selected directors and officers or employees at the discretion of the board of directors. All stock options were granted for a term of ten years.
Vesting of stock options granted in 2004 and prior years was accelerated to immediately vest all options as of December 20, 2005. Options granted in 2005 were immediately vested and options granted subsequent to 2006 vest over three years. Restricted stock vests three years from the grant date. Awards under the Incentive Plan become fully vested upon a merger or change in control of the Company
42
Total compensation cost that has been charged against income for those plans was $685,000 in 2007, $209,000 in 2006, and $6,000 in 2005. The total income tax benefit was $240,000, $73,000, and $2,000 in 2007, 2006, and 2005, respectively. Previously, the Company granted stock options that were accounted for using the intrinsic value method and recorded no compensation costs related to the plan.
The fair value of each option award is estimated on the date of grant using a closed form option valuation (Binomial) model that uses the assumptions noted in the table below. Expected volatilities are based on the previous five year historical volatilities of the Company’s common stock. The Company uses historical data to estimate option exercise and post-vesting termination behavior. The expected term of options granted is based on historical data and represents the period of time that options granted are expected to be outstanding, which takes into account that the options are not transferable. The risk-free interest rate for the expected term of the option is based on the U.S. Treasury yield curve in effect at the time of the grant.
The fair value of options granted was determined using the following weightedaverage assumptions as of grant date:
| | 2007 | | 2006 | | 2005 | |
Risk-free interest rate | | 3.38 | % | 4.63 | % | 4.45 | % |
Expected term (years) | | 5 | | 5 | | 5 | |
Expected stock price volatility | | 24.23 | % | 23.45 | % | 25.02 | % |
Dividend yield | | 2.30 | % | 1.80 | % | 1.70 | % |
As of December 31, 2007, there was $889,000 of total unrecognized compensation cost related to nonvested stock options granted under the Plan. The cost is expected to be recognized over a weighted-average period of 2.6 years.
A summary of stock option activity in the Incentive Plan is as follows:
| | Shares | | Weighted
Average
Exercise
Price | | Weighted-
Average
Remaining
Contractual
Term | | Aggregate
Intrinsic
Value | |
Beginning outstanding | | 682,411 | | $ | 22.60 | | | | | |
Granted | | 93,000 | | 27.75 | | | | | |
Exercised | | (34,613) | | 13.47 | | | | | |
Expired | | — | | — | | | | | |
Ending outstanding | | 740,798 | | $ | 23.67 | | 6.3 | | $ | 3,679,599 | |
| | | | | | | | | |
Exercisable at end of year | | 598,466 | | $ | 22.59 | | 5.5 | | $ | 3,679,599 | |
A summary of changes in the Company’s nonvested options in the Incentive Plan is as follows:
| | 2007 | |
| | Shares | | Weighted
Average
Grant Date
Fair Value | |
Nonvested at January 1 | | 74,000 | | $ | 7.35 | |
Granted | | 93,000 | | 6.10 | |
Vested | | (24,668 | ) | 7.35 | |
Nonvested at December 31 | | 142,332 | | $ | 6.53 | |
43
A summary of stock option activity as of each year is as follows:
| | 2007 | | 2006 | | 2005 | |
Intrinsic value of options exercised | | $ | 527,505 | | $ | 720,038 | | $ | 1,546,611 | |
Cash received from option exercises | | 466,258 | | 615,732 | | 930,240 | |
Tax benefit realized from option exercises | | 209,657 | | 285,706 | | 425,385 | |
Weighted average fair value of options granted | | $ | 6.10 | | $ | 7.35 | | $ | 8.21 | |
Restricted stock was granted beginning in 2005 under the Incentive Plan. There were 26,184 shares issued in 2007, 1,517 in 2006, and 20,406 in 2005. These shares are subject to forfeiture until certain restrictions have lapsed including employment for a specific period. Compensation expense is recognized over the vesting period of the shares based on the market value of the shares at issue date.
A summary of changes in the Company’s nonvested shares of restricted stock is as follows:
| | 2007 | |
| | Shares | | Weighted
Average
Grant Date
Fair Value | |
Nonvested at January 1 | | 20,423 | | $ | 31.27 | |
Granted | | 26,184 | | 29.20 | |
Vested | | — | | — | |
Forfeited | | (542 | ) | (31.34 | ) |
Nonvested at December 31 | | 46,065 | | $ | 30.09 | |
As of December 31, 2007, there was $628,000 of total unrecognized compensation cost related to nonvested shares granted under the Plan. The cost is expected to be recognized over a weighted-average period of 1.7 years. There were no shares vested during the years ended December 31, 2007, 2006, and 2005.
Note O: Earnings per Share
| | 2007 | | 2006 | | 2005 | |
Basic Earnings Per Share: | | | | | | | |
Weighted-average common shares outstanding | | 12,508,551 | | 13,367,062 | | 13,486,598 | |
Net income available to common stockholders | | $ | 23,972 | | $ | 23,656 | | $ | 27,683 | |
Basic earnings per share | | $ | 1.92 | | $ | 1.77 | | $ | 2.05 | |
| | | | | | | |
Diluted Earnings Per Share: | | | | | | | |
Weighted-average common shares outstanding | | 12,508,551 | | 13,367,062 | | 13,486,598 | |
Dilutive effect of restricted shares | | 16,273 | | 3,051 | | — | |
Dilutive effect of stock options | | 130,482 | | 156,490 | | 174,426 | |
Diluted average common shares outstanding | | 12,655,306 | | 13,526,603 | | 13,661,024 | |
Net income available to common stockholders | | $ | 23,972 | | $ | 23,656 | | $ | 27,683 | |
Diluted earnings per share | | $ | 1.89 | | $ | 1.75 | | $ | 2.03 | |
| | | | | | | |
Number of antidilutive options excluded from diluted earnings per share calculation | | 373,000 | | 224,906 | | 213,406 | |
44
Note P: Other Comprehensive Income
The following table summarizes the related income tax effect for the components of Other Comprehensive Income as of December 31:
| | 2007 | | 2006 | | 2005 | |
Unrealized holding gains (losses) on available for sale securities arising during the period | | $ | 8,146 | | $ | 3,772 | | $ | (8,114 | ) |
Related tax (expense) benefit | | (3,224 | ) | (1,503 | ) | 3,220 | |
Holding gains (losses) after tax | | 4,922 | | 2,269 | | (4,894 | ) |
| | | | | | | |
Less: Reclassification adjustment for the net gains and losses realized during the period | | | | | | | |
Realized gains | | $ | 695 | | $ | 418 | | $ | 5 | |
Realized losses | | (21 | ) | — | | (19 | ) |
Net realized gains (losses) | | 674 | | 418 | | (14 | ) |
Income tax (expense) benefit on net realized gains (losses) | | (268 | ) | (166 | ) | 6 | |
Net realized gains (losses) after tax | | 406 | | 252 | | (8 | ) |
Total other comprehensive income (loss) | | $ | 4,516 | | $ | 2,017 | | $ | (4,886 | ) |
Note Q: Commitments
In the normal course of business, there are outstanding commitments that are not reflected in the financial statements. Commitments include financial instruments that involve, to varying degrees, elements of credit, interest rate, and liquidity risk. In management’s opinion, these do not represent unusual risks and management does not anticipate significant losses as a result of these transactions. The Company uses the same credit policies in making commitments and conditional obligations as it does for on-balance sheet instruments. Standby letters of credit, performance standby letters of credit, and commercial letters of credit outstanding at December 31, 2007 were approximately $61.0 million. As of December 31, 2007, firm commitments to fund loans in the future were approximately $355.5 million, of which $35.6 million were fixed rate and $319.9 million were variable rates. Standby letters of credit, performance standby letters of credit, and commercial letters of credit outstanding at December 31, 2006 were approximately $59.1 million. As of December 31, 2006, firm commitments to fund loans in the future were approximately $355.0 million, of which $52.7 million were fixed rate and $302.3 million were variable rate. As of December 31, 2007, there were other commitments and contingent liabilities arising in the normal course of business that, in management’s opinion, will not have a material effect on future financial results.
Certain subsidiaries of the Company and branches of the Bank occupy certain facilities under long-term operating leases, some of which include provisions for future rent increases, and, in addition, lease certain software and data processing and other equipment. The estimated aggregate minimum annual rental commitments under these leases total $584,000 in 2008, $236,000 in 2009, $119,000 in 2010, $83,000 in 2011, and $31,000 in 2012. The Company also receives rental income on certain leased properties. As of December 31, 2007, aggregate future minimum rentals to be received under non-cancelable leases totaled $40,000. Total operating lease expense, net of rental income, recorded under all operating leases was $739,000 in 2007, $628,000 in 2006, and $459,000 in 2005.
Legal proceedings
The Company and its subsidiaries have, from time to time, collection suits in the ordinary course of business against its debtors and are defendants in legal actions arising from normal business activities. Management, after consultation with legal counsel, believes that the ultimate liabilities, if any, resulting from these actions will not have a material adverse effect on the financial position of the Bank or on the consolidated financial position of the Company.
A verdict for approximately $2.0 million was entered in the Circuit Court of LaSalle County on January 17, 2007 in favor of Old Second Bank – Yorkville, a wholly owned subsidiary of the Company, and against an insurance company. The insurance company filed a Notice of Appeal on February 8, 2007 in the Third District Appellate Court of Illinois and oral argument took place in January of 2008. As a result, the Company will not record any amount of the judgment as income until all appeals have been exhausted and the matter has been concluded in the Company’s favor.
45
Note R: Capital
The Company and the Bank are subject to regulatory capital requirements administered by federal banking agencies. Capital adequacy guidelines and prompt corrective action regulations involve quantitative measures of assets, liabilities, and certain off-balance sheet items calculated under regulatory accounting practices. Capital amounts and classifications are also subject to qualitative judgments by regulators. Failure to meet capital requirements can initiate regulatory action.
Prompt corrective action regulations provide five classifications: well capitalized, adequately capitalized, undercapitalized, significantly undercapitalized, and critically undercapitalized, although these terms are not used to represent overall financial condition. If adequately capitalized, regulatory approval is required to accept brokered deposits. If undercapitalized, capital distributions are limited, as is asset growth and expansion, and plans for capital restoration are required. Actual and required capital amounts (in thousands) and ratios are presented below at year-end.
As of the Company’s and the Bank’s most recent regulatory notification, the Company and the Bank were categorized as well capitalized. Management is not aware of any conditions or events since the most recent regulatory notification that would change the Company’s or the Bank’s categories. The accompanying table shows the capital ratios of the Company and the Bank as of December 31, 2007 and December 31, 2006. Since the merger of the two state bank charters into the renamed Old Second National Bank occurred in the third quarter of 2007, the December 31, 2006 bank capital ratios are of the lead subsidiary bank prior to that internal reorganization.
Capital levels and minimum required levels at year-end:
| | Actual
at year-end | | Minimum Required
for Capital
Adequacy Purposes | | Minimum Required
to be Well
Capitalized | |
| | Amount | | Ratio | | Amount | | Ratio | | Amount | | Ratio | |
2007: | | | | | | | | | | | | | |
Total capital to risk weighted assets | | | | | | | | | | | | | |
Consolidated | | $ | 218,140 | | 10.58 | % | $ | 164,945 | | 8.00 | % | N/A | | N/A | |
Old Second Bank | | 235,867 | | 11.45 | | 164,798 | | 8.00 | | 205,997 | | 10.00 | |
Tier 1 capital to risk weighted assets | | | | | | | | | | | | | |
Consolidated | | 194,846 | | 9.45 | | 82,474 | | 4.00 | | N/A | | N/A | |
Old Second Bank | | 219,041 | | 10.63 | | 82,424 | | 4.00 | | 123,636 | | 6.00 | |
Tier 1 capital to average assets | | | | | | | | | | | | | |
Consolidated | | 194,846 | | 7.50 | | 103,918 | | 4.00 | | N/A | | N/A | |
Old Second Bank | | 219,041 | | 8.44 | | 103,811 | | 4.00 | | 129,764 | | 5.00 | |
| | | | | | | | | | | | | |
2006: | | | | | | | | | | | | | |
Total capital to risk weighted assets | | | | | | | | | | | | | |
Consolidated | | $ | 205,640 | | 10.82 | % | $ | 152,044 | | 8.00 | % | N/A | | N/A | |
Old Second Bank | | 148,894 | | 11.31 | | 105,318 | | 8.00 | | 131,648 | | 10.00 | |
Tier 1 capital to risk weighted assets | | | | | | | | | | | | | |
Consolidated | | 189,456 | | 9.97 | | 76,010 | | 4.00 | | N/A | | N/A | |
Old Second Bank | | 137,802 | | 10.46 | | 52,697 | | 4.00 | | 79,045 | | 6.00 | |
Tier 1 capital to average assets | | | | | | | | | | | | | |
Consolidated | | 189,456 | | 7.90 | | 95,927 | | 4.00 | | N/A | | N/A | |
Old Second Bank | | 137,802 | | 8.36 | | 65,934 | | 4.00 | | 82,417 | | 5.00 | |
National and state bank regulations and capital guidelines limit the amount of dividends that may be paid by the Bank without prior regulatory approval. At December 31, 2007, approximately $46.9 million was available for the payment of dividends by the Bank to the Company.
46
The Company purchased 65,000 common shares in the first quarter of 2007 to complete a share repurchase plan that was publicly announced on May 18, 2006. The Company culminated an April 17, 2007 tender offer with a purchase of 973,251 shares of common stock on May 24, 2007. The Company financed the latter repurchase from the aggregate net proceeds of a private placement of $25.0 million of aggregate face value trust preferred securities issued by a trust established by the Company. Trust preferred securities qualify as regulatory capital and the Company continues to treat the maximum allowable under regulatory guidelines as Tier 1 capital. Trust preferred securities qualifying as Tier 1 regulatory capital were $49.3 million and $30.8 million as of December 31, 2007 and 2006. An additional $6.5 million of Trust preferred securities qualified as Tier 2 regulatory capital as of December 31, 2007.
The Company repurchased common shares because management believes that, given the nature of the business, assets and prospects and the market price of the common shares, coupled with the expected lower cost of capital offered by the trust preferred securities that substantially funded the repurchase of shares, the Company will be able to reduce the number of shares outstanding, which should increase earnings per share and return on equity.
Note S: Mortgage Banking Derivatives
Commitments to fund certain mortgage loans (interest rate locks) to be sold into the secondary market and forward commitments for the future delivery of mortgage loans to third party investors are considered derivatives. It is the Company’s practice to enter into forward commitments for the future delivery of residential mortgage loans when interest rate lock commitments are entered into in order to economically hedge the effect of changes in interest rates resulting from its commitments to fund the loans. These mortgage banking derivatives are not designated in hedge relationships pursuant to SFAS 133. At year-end 2007, the Company had approximately $16.6 million of interest rate lock commitments and $16.6 million of forward commitments for the future delivery of residential mortgage loans. The fair value of these mortgage banking derivatives was reflected by a derivative asset of $66,000 and a derivative liability of $66,000. At year-end 2006, the Company had approximately $18.9 million of interest rate lock commitments and $17.3 million of forward commitments for the future delivery of residential mortgage loans. The fair value of these mortgage banking derivatives was reflected by a derivative asset of $137,000 and a derivative liability of $76,000. Fair values were estimated based on changes in mortgage interest rates from the date of the commitments. Changes in the fair values of these mortgage-banking derivatives are included in net gains on sales of loans.
Note T: Fair Values of Financial Instruments
The estimated fair values approximate carrying amount for all items except those described in the following table. Security fair values are based upon market price or dealer quotes, and if no such information is available, on the rate and term of the security. Fair values of loans were estimated for portfolios of loans with similar financial characteristics, such as type and fixed or variable interest rate terms. Cash flows were discounted using current rates at which similar loans would be made to borrowers with similar ratings and for similar maturities. The fair value of time deposits is estimated using discounted future cash flows at current rates offered for deposits of similar remaining maturities. The fair values of borrowings were estimated based on interest rates available to the Company for debt with similar terms and remaining maturities. The fair value of off-balance sheet items is not considered material. The fair value of mortgage banking derivatives is discussed above in Note S.
47
The carrying amount and estimated fair values of financial instruments were as follows:
| | 2007 | | 2006 | |
| | Carrying
Amount | | Fair
Value | | Carrying
Amount | | Fair
Value | |
Financial assets: | | | | | | | | | |
Cash and due from banks and federal funds sold | | $ | 63,174 | | $ | 63,174 | | $ | 83,032 | | $ | 83,032 | |
Interest bearing deposits with financial institutions | | 403 | | 403 | | 5,493 | | 5,493 | |
Securities available for sale | | 560,859 | | 560,859 | | 472,897 | | 472,897 | |
FHLB and FRB Stock | | 8,947 | | 8,947 | | 8,783 | | 8,783 | |
Bank owned life insurance | | 47,936 | | 47,936 | | 45,861 | | 45,861 | |
Loans, net and loans held for sale | | 1,890,952 | | 1,897,819 | | 1,762,097 | | 1,785,452 | |
Accrued interest receivable | | 14,273 | | 14,273 | | 13,560 | | 13,560 | |
| | $ | 2,586,544 | | $ | 2,593,411 | | $ | 2,391,723 | | $ | 2,415,078 | |
Financial liabilities: | | | | | | | | | |
Deposits | | $ | 2,113,618 | | $ | 2,118,862 | | $ | 2,062,693 | | $ | 2,058,366 | |
Securities sold under repurchase agreements | | 53,222 | | 53,222 | | 38,218 | | 38,218 | |
Federal funds purchased | | 165,100 | | 165,100 | | 54,000 | | 54,000 | |
Other short-term borrowings | | 82,873 | | 82,873 | | 73,090 | | 73,090 | |
Junior subordinated debentures | | 57,399 | | 56,067 | | 31,625 | | 32,045 | |
Note payable | | 18,610 | | 18,610 | | 16,425 | | 16,425 | |
Accrued interest payable | | 7,013 | | 7,013 | | 6,801 | | 6,801 | |
| | $ | 2,497,835 | | $ | 2,503,651 | | $ | 2,282,852 | | $ | 2,278,945 | |
Note U: Parent Company Condensed Financial Information | | | | | |
| | | | | |
Condensed Balance Sheets as of December 31 were as follows: | | | | | |
| | | | | |
| | 2007 | | 2006 | |
Assets | | | | | |
Noninterest-bearing deposit with bank subsidiary | | $ | 2,094 | | $ | 2,219 | |
Investment in subsidiaries | | 225,057 | | 204,661 | |
Other assets | | 1,895 | | 2,049 | |
| | $ | 229,046 | | $ | 208,929 | |
| | | | | |
Liabilities and Stockholders’ Equity | | | | | |
Junior subordinated debentures | | $ | 57,399 | | $ | 31,625 | |
Other liabilities | | 21,758 | | 18,749 | |
Stockholders’ equity | | 149,889 | | 158,555 | |
| | $ | 229,046 | | $ | 208,929 | |
48
Condensed Statements of Income for the years ended December 31 were as follows:
| | 2007 | | 2006 | | 2005 | |
Operating Income | | | | | | | |
Cash dividends received from subsidiaries | | $ | 13,389 | | $ | 9,073 | | $ | 8,788 | |
Other income | | 173 | | 229 | | 3 | |
| | 13,562 | | 9,302 | | 8,791 | |
Operating Expenses | | | | | | | |
Junior subordinated debentures interest expense | | 3,629 | | 2,467 | | 2,448 | |
Other interest expense | | 1,025 | | 489 | | 125 | |
Other expenses | | 3,011 | | 3,590 | | 2,125 | |
| | 7,665 | | 6,546 | | 4,698 | |
Income before income taxes and equity in undistributed net income of subsidiaries | | 5,897 | | 2,756 | | 4,093 | |
Income tax benefit | | (2,969 | ) | (2,491 | ) | (1,850 | ) |
Income before equity in undistributed net income of subsidiaries | | 8,866 | | 5,247 | | 5,943 | |
Equity in undistributed net income of subsidiaries | | 15,106 | | 18,409 | | 21,740 | |
Net income | | $ | 23,972 | | $ | 23,656 | | $ | 27,683 | |
Condensed Statements of Cash Flows for the years ended December 31 were as follows:
| | 2007 | | 2006 | | 2005 | |
Cash Flows from Operating Activities | | | | | | | |
Net income | | $ | 23,972 | | $ | 23,656 | | $ | 27,683 | |
Adjustments to reconcile net income to net cash from operating activities: | | | | | | | |
Equity in undistributed net income of subsidiaries | | (15,106 | ) | (18,409 | ) | (21,740 | ) |
Change in taxes payable | | 757 | | 243 | | (48 | ) |
Change in other assets | | 154 | | (324 | ) | 100 | |
Securities gains | | (163 | ) | (227 | ) | (145 | ) |
Stock-based compensation | | 685 | | 209 | | 6 | |
Tax benefit from exercise of stock options | | — | | — | | 425 | |
Other, net | | 86 | | 44 | | 57 | |
Net cash from operating activities | | 10,385 | | 5,192 | | 6,338 | |
| | | | | | | |
Cash Flows from Investing Activities | | | | | | | |
Proceeds from the sales and maturities of securities available for sale | | 163 | | 227 | | 145 | |
Investment in unconsolidated subsidiary | | (774 | ) | — | | — | |
Net cash (used in) provided by investing activities | | (611 | ) | 227 | | 145 | |
| | | | | | | |
Cash Flows from Financing Activities | | | | | | | |
Dividends paid | | (7,294 | ) | (7,230 | ) | (6,740 | ) |
Proceeds from note payable | | 2,185 | | 13,225 | | 500 | |
Purchases of treasury stock | | (31,239 | ) | (13,181 | ) | — | |
Proceeds from the issuance of junior subordinated debentures | | 25,774 | | — | | — | |
Proceeds from exercise of stock options | | 466 | | 616 | | 930 | |
Tax benefit from exercise of stock options | | 209 | | 286 | | — | |
Net cash used in financing activities | | (9,899 | ) | (6,284 | ) | (5,310 | ) |
Net change in cash and cash equivalents | | (125 | ) | (865 | ) | 1,173 | |
Cash and cash equivalents at beginning of year | | 2,219 | | 3,084 | | 1,911 | |
Cash and cash equivalents at end of year | | $ | 2,094 | | $ | 2,219 | | $ | 3,084 | |
49
Note V: Summary of Quarterly Financial Information (unaudited)
The following represents unaudited quarterly financial information for the periods indicated:
| | 2007 | | 2006 | |
| | 4th | | 3rd | | 2nd | | 1st | | 4th | | 3rd | | 2nd | | 1st | |
Interest income | | $ | 40,195 | | $ | 40,186 | | $ | 38,631 | | $ | 36,729 | | $ | 36,857 | | $ | 36,422 | | $ | 35,258 | | $ | 33,492 | |
Interest expense | | 22,434 | | 22,878 | | 21,581 | | 20,250 | | 19,182 | | 19,123 | | 17,168 | | 15,357 | |
Net interest income | | 17,761 | | 17,308 | | 17,050 | | 16,479 | | 17,675 | | 17,299 | | 18,090 | | 18,135 | |
Provision for loan losses | | — | | 600 | | 588 | | — | | — | | 400 | | 400 | | 444 | |
Securities gains | | 181 | | 11 | | — | | 482 | | — | | — | | 191 | | 227 | |
Income before taxes | | 8,967 | | 8,191 | | 7,766 | | 7,868 | | 8,904 | | 6,596 | | 9,408 | | 8,618 | |
Net income | | 6,421 | | 6,077 | | 5,726 | | 5,748 | | 6,237 | | 4,948 | | 6,366 | | 6,105 | |
Basic earnings per share | | 0.53 | | 0.50 | | 0.45 | | 0.44 | | 0.47 | | 0.37 | | 0.47 | | 0.45 | |
Diluted earnings per share | | 0.52 | | 0.49 | | 0.45 | | 0.43 | | 0.47 | | 0.37 | | 0.46 | | 0.45 | |
Dividends paid per share | | 0.15 | | 0.15 | | 0.15 | | 0.14 | | 0.14 | | 0.14 | | 0.14 | | 0.13 | |
| | | | | | | | | | | | | | | | | | | | | | | | | |
Note W: Stockholders’ Rights Plan
On September 17, 2002, the Company’s Board of Directors adopted a Stockholders’ Rights Plan. The Plan provided for the distribution of one right on October 10, 2002, for each share of the Company’s outstanding common stock as of September 27, 2002. The rights have no immediate economic value to stockholders because they cannot be exercised unless and until a person, group or entity acquires 15% or more of the Company’s common stock or announces a tender offer. The Plan also permits the Company’s Board of Directors to redeem each right for one cent under various circumstances. In general, the Plan provides that if a person, group or entity acquires a 15% or larger stake in the Company or announces a tender offer, and the Company’s Board chooses not to redeem the rights, all holders of rights, other than the 15% stockholder, will be able to purchase a certain amount of the Company’s common stock for half of its market price.
Note X: Acquisition
As outlined in the overview section of the Management Discussion and Analysis and Note A, Old Second Acquisition, Inc., was formed as part of the November 5, 2007 Agreement and Plan of Merger between the Company, Old Second Acquisition, Inc., a wholly-owned subsidiary of the Company, and HeritageBanc, Inc. (“Heritage”). The parties consummated the merger on February 8, 2008, at which time, Old Second Acquisition, Inc. was merged with and into Heritage with Heritage as the surviving corporation as a wholly-owned subsidiary of the Company. Additionally, the parties merged Heritage Bank, a wholly-owned subsidiary of Heritage, with and into Old Second National Bank, with Old Second National Bank as the surviving bank. After the completion of the merger transaction, Heritage was dissolved and is no longer an existing subsidiary. The Company paid consideration of $43.0 million in cash and 1,563,636 shares of Company stock valued at $27.50 per share, for a total transaction value of $86.0 million, to consummate the acquisition of 100% of the outstanding stock of Heritage on February 8, 2008. The final terms of the credit facilities established with LaSalle Bank to finance the acquisition are also detailed in Note J. Heritage will be included in the Company’s financial results from the date of acquisition.
The primary reasons for acquiring Heritage were for the Company to expand its footprint surrounding the Chicago metropolitan area, grow wealth management, treasury, and mortgage service operations as well as enhance future earnings capacity related to sales of traditional bank loan and deposit products, and to a lesser extent provide the potential for cost savings through consolidation of operations. Company management makes assumptions based on variables that will allow the Company to determine a purchase price that will be successful in having the Company selected as the acquirer and yet provides the potential for increased value for the Company’s shareholders. The Company is in the process of obtaining third-party valuations in order to allocate the purchase price to the fair value of assets acquired and liabilities assumed. Those disclosures will be made in the Company’s quarterly report for the period ending March 31, 2008.
50
Report of Independent
Registered Public Accounting Firm
Report of Independent Registered Public Accounting Firm
Board of Directors and Stockholders
Old Second Bancorp, Inc. and Subsidiaries
We have audited the accompanying consolidated balance sheets of Old Second Bancorp, Inc. (a Delaware Corporation) and Subsidiaries as of December 31, 2007 and 2006, and the related consolidated statements of income, changes in stockholders’ equity and cash flows for each of the two years in the period ended December 31, 2007. These financial statements are the responsibility of the Company’s management. Our responsibility is to express an opinion on these financial statements based on our audits.
We conducted our audits in accordance with the standards of the Public Company Accounting Oversight Board (United States). Those standards require that we plan and perform the audit to obtain reasonable assurance about whether the financial statements are free of material misstatement. An audit includes examining, on a test basis, evidence supporting the amounts and disclosures in the financial statements. An audit also includes assessing the accounting principles used and significant estimates made by management, as well as evaluating the overall financial statement presentation. We believe that our audits provide a reasonable basis for our opinion.
In our opinion, the consolidated financial statements referred to above present fairly, in all material respects, the consolidated financial position of Old Second Bancorp, Inc. and Subsidiaries as of December 31, 2007 and 2006, and the consolidated results of its operations and its cash flows for each of the two years in the period ended December 31, 2007, in conformity with accounting principles generally accepted in the United States of America.
We also have audited, in accordance with the standards of the Public Company Accounting Oversight Board (United States), Old Second Bancorp, Inc. and Subsidiaries’ internal control over financial reporting as of December 31, 2007, based on criteria established in Internal Control — Integrated Framework issued by the Committee of Sponsoring Organizations of the Treadway Commission (COSO) and our report dated March 14, 2008, expressed an unqualified opinion.

Chicago, Illinois
March 14, 2008
51
Report of Independent
Registered Public Accounting Firm
Report of Independent Registered Public Accounting Firm
The Board of Directors and Shareholders of
Old Second Bancorp, Inc.
We have audited the accompanying Consolidated Statements of Income, Cash Flows and Changes in Stockholders’ Equity of Old Second Bancorp, Inc. and Subsidiaries for the year ended December 31, 2005. These financial statements are the responsibility of the Company’s management. Our responsibility is to express an opinion on these financial statements based on our audit.
We conducted our audit in accordance with the standards of the Public Company Accounting Oversight Board (United States). Those standards require that we plan and perform the audit to obtain reasonable assurance about whether the financial statements are free of material misstatement. An audit includes examining, on a test basis, evidence supporting the amounts and disclosures in the financial statements. An audit also includes assessing the accounting principles used and significant estimates made by management, as well as evaluating the overall financial statement presentation. We believe that our audit provides a reasonable basis for our opinion.
In our opinion, the financial statements referred to above present fairly, in all material respects, the consolidated financial operations of Old Second Bancorp, Inc. and Subsidiaries and their cash flows for the year ended December 31, 2005, in conformity with U.S. generally accepted accounting principles.

Chicago, Illinois
February 10, 2006
52
Old Second Bancorp, Inc. and Subsidiaries
Corporate Information
Corporate Office
37 River Street
Aurora, Illinois 60506-4172
(630) 892-0202
www.oldsecond.com
Market for the Company’s Common Stock
The Company’s common stock trades on The Nasdaq Stock Market under the symbol “OSBC”. As of December 31, 2007, the Company had approximately 1,092 stockholders of record of its common stock. The following table sets forth the range of prices during each quarter for 2007 and 2006. Stock prices have been restated to reflect stock splits.
| | 2007 | | 2006 | |
| | High | | Low | | Dividend | | High | | Low | | Dividend | |
First quarter | | $ | 29.87 | | $ | 27.16 | | $ | 0.14 | | $ | 32.83 | | $ | 30.38 | | $ | 0.13 | |
Second quarter | | 30.27 | | 27.61 | | 0.15 | | 33.20 | | 29.25 | | 0.14 | |
Third quarter | | 30.73 | | 25.81 | | 0.15 | | 31.40 | | 29.51 | | 0.14 | |
Fourth quarter | | 30.92 | | 25.96 | | 0.15 | | 31.17 | | 29.06 | | 0.14 | |
| | | | | | | | | | | | | | | | | | | |
Form 10-K and Other Information
We maintain a website at http://www.oldsecond.com. We make available free of charge on or through the Company’s website, the Company’s annual report on Form 10-K, quarterly reports on Form 10-Q, current reports on Form 8-K and amendments to those reports filed or furnished pursuant to Section 13(a) or 15(d) of the Exchange Act as soon as reasonably practicable after we electronically file such material with, or furnish it to, the Securities and Exchange Commission. The Company’s code of conduct and charters of the Company’s various committees of the Board of Directors are also available on the website. We will also provide copies of the Company’s filings free of charge upon written request to J. Douglas Cheatham, Executive Vice President and Chief Financial Officer, Old Second Bancorp, Inc., 37 South River Street, Aurora, Illinois 60506-4172.
Transfer Agent/Stockholder Services
Inquires related to stockholders records, stock transfers, changes of ownership, change of address and dividend payments should be sent to the transfer agent at the following address:
Old Second Bancorp, Inc.
c/o Robin Hodgson, 1st VP Executive Administration
37 River Street
Aurora, Illinois 60506-4172
(630) 906-5480
rhodgson@oldsecond.com
53
Old Second Bancorp, Inc. and Subsidiaries
Consolidating Balance Sheet
December 31, 2007
(In thousands)
| | Old Second | | Old Second | | Old Second | | Old Second | | Old Second | |
| | National | | Financial, | | Bancorp, Inc. | | Consolidating | | Bancorp, Inc. | |
| | Bank | | Inc. | | Parent Only | | Adjustments | | Consolidated | |
Assets | | | | | | | | | | | |
Cash and due from banks | | $ | 60,804 | | $ | 28 | | $ | 2,094 | | $ | (2,122 | ) | $ | 60,804 | |
Interest bearing deposits with financial institutions | | 403 | | — | | — | | — | | 403 | |
Federal funds sold | | 2,370 | | — | | — | | — | | 2,370 | |
Short-term securities available for sale | | 1,162 | | — | | — | | — | | 1,162 | |
Cash and cash equivalents | | 64,739 | | 28 | | 2,094 | | (2,122 | ) | 64,739 | |
Securities available for sale | | 559,697 | | — | | — | | — | | 559,697 | |
FHLB and FRB stocks | | 8,947 | | — | | — | | — | | 8,947 | |
Loans held for sale | | 16,677 | | — | | — | | — | | 16,677 | |
Loans | | 1,891,110 | | — | | — | | — | | 1,891,110 | |
Less: allowance for loan losses | | 16,835 | | — | | — | | — | | 16,835 | |
Net loans | | 1,874,275 | | — | | — | | — | | 1,874,275 | |
Premises and equipment, net | | 49,698 | | — | | — | | — | | 49,698 | |
Mortgage servicing rights, net | | 2,482 | | — | | — | | — | | 2,482 | |
Goodwill, net | | 2,130 | | — | | — | | — | | 2,130 | |
Bank owned life insurance | | 47,936 | | — | | — | | — | | 47,936 | |
Investment in subsidiaries | | 9 | | — | | 225,057 | | (223,432 | ) | 1,634 | |
Accrued interest and other assets | | 29,966 | | 19 | | 1,895 | | (1,519 | ) | 30,361 | |
Total assets | | $ | 2,656,556 | | $ | 47 | | $ | 229,046 | | $ | (227,073 | ) | $ | 2,658,576 | |
Liabilities | | | | | | | | | | | |
Deposits: | | | | | | | | | | | |
Demand | | $ | 273,671 | | $ | — | | $ | — | | $ | (2,122 | ) | $ | 271,549 | |
Interest bearing | | 1,842,069 | | — | | — | | — | | 1,842,069 | |
Total deposits | | 2,115,740 | | — | | — | | (2,122 | ) | 2,113,618 | |
Securities sold under repurchase agreements | | 53,222 | | — | | — | | — | | 53,222 | |
Federal funds purchased | | 165,100 | | — | | — | | — | | 165,100 | |
Other short-term borrowings | | 82,873 | | — | | — | | — | | 82,873 | |
Junior subordinated debentures | | — | | — | | 57,399 | | — | | 57,399 | |
Note payable | | — | | — | | 18,610 | | — | | 18,610 | |
Accrued interest and other liabilities | | 16,231 | | 5 | | 3,148 | | (1,519 | ) | 17,865 | |
Total liabilities | | 2,433,166 | | 5 | | 79,157 | | (3,641 | ) | 2,508,687 | |
Stockholders’ Equity | | | | | | | | | | | |
Common stock | | 2,160 | | 25 | | 16,695 | | (2,185 | ) | 16,695 | |
Surplus | | 35,651 | | — | | 16,114 | | (35,651 | ) | 16,114 | |
Retained earnings | | 183,608 | | 17 | | 209,867 | | (183,625 | ) | 209,867 | |
Accumulated other comprehensive gain | | 1,971 | | — | | 1,971 | | (1,971 | ) | 1,971 | |
Treasury stock | | — | | — | | (94,758 | ) | — | | (94,758 | ) |
Total stockholders’ equity | | 223,390 | | 42 | | 149,889 | | (223,432 | ) | 149,889 | |
Total liabilities and stockholders’ equity | | $ | 2,656,556 | | $ | 47 | | $ | 229,046 | | $ | (227,073 | ) | $ | 2,658,576 | |
54
Old Second Bancorp, Inc. and
Old Second National Bank Directors
| 
| | 
| | 
| | 
| | 
| |
| William Skoglund
Chairman, President & CEO,
Old Second Bancorp, Inc. &
Chairman, Old Second
National Bank | | James Eccher
President & CEO,
Old Second
National Bank | | Walter Alexander
President, Alexander
Lumber Company,
Senior Director | | Edward Banifas
Vice President, Alarm
Detection Systems, Inc. | | J. Douglas Cheatham
Excecutive Vice President &
Chief Financial Officer,
Old Second Bancorp, Inc. | |
| | | | | | | | | | |
| 
| | 
| | 
| | 
| | 
| |
| Marvin Fagel
President, Aurora Packing
Company & Chairman of the
Board & CEO, New City
Packing Company | | Barry Finn
President & CEO,
Rush-Copley
Medical Center | | William Kane
General Partner,
The Label Printers, Inc. | | Mary Krasner
General Partner/Owner,
Wyndham Deerpoint
Homes | | Kenneth Lindgren
President,
Daco Incorporated | |
| | | | | | | | | | |
| 
| | 
| | 
| | 
| | 
| |
| Jesse Maberry
Retired, Vice President,
Aurora Bearing Company | | D. Chet McKee
Retired, VP Special Projects,
Rush-Copley
Medical Center | | William Meyer
President, William F. Meyer
Company | | Gerald Palmer
Retired, Vice President &
General Manager,
Caterpillar, Inc. | | James Schmitz
Tax Consultant | |
Directors Emeriti James Benson, Retired Chairman of the Board, Old Second Bancorp, Inc. and Old Second National Bank Urban Hipp, Retired, Barber-Greene Company Gary McCarter, Retired, Farmers Group, Inc. Dorothy McEnroe, Retired, McEnroe Real Estate, LTD Daniel Ruddy, President, Construction Advisory Services, Inc. Edward Schmitt, Retired, Schmitt McDonalds Townsend Way, Jr., Retired, Richards - Wilcox Mfg. Co. | | |

| |
Old Second Headquarters, .37 South River Street, Aurora, Illinois | |
| |
Member FDIC | |
55
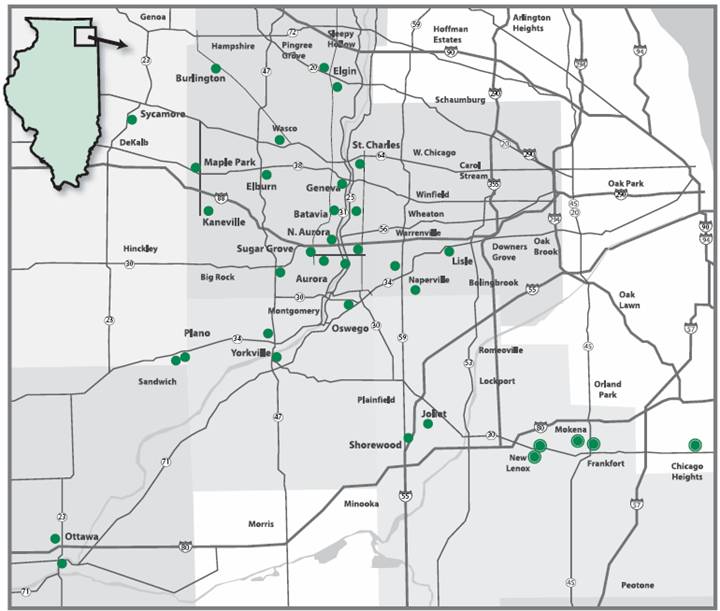
OLD SECOND NATIONAL BANK
37 S. River St., Aurora
1350 N. Farnsworth Ave., Aurora
4080 Fox Valley Ctr. Dr., Aurora
1230 N. Orchard Road, Aurora
555 Redwood Dr., Aurora
1991 W. Wilson St., Batavia
1078 E. Wilson St., Batavia
194 S. Main St., Burlington
749 N. Main St., Elburn
1000 S. McLean, Elgin
Rt. 20 & Nesler Rd., Elgin
23 S. Fourth St., Geneva
2761 Black Road, Joliet
2S101 Harter Rd., Kaneville
3101 Ogden Ave., Lisle
1100 S. County Line Rd., Maple Park
1964 Springbrook Sq., Naperville
200 W. John St., North Aurora
1200 Douglas Rd., Oswego
323 E. Norris Dr., Ottawa
In Wal-Mart, 4041 Veterans Dr., Ottawa
In Wal-Mart, 6800 W. Rte. 34, Plano
7050 Burroughs (Rt 34), Plano
801 S. Kirk Road, St. Charles
1015 Brook Forest Ave., Shorewood
Route 47 @ Cross St., Sugar Grove
1810 DeKaIb Ave., Sycamore
40W422 Route 64, Wasco
102 E. Van Emmon St., Yorkville
26 W. Countryside Pkwy., Yorkville
Locations from February 2008
Heritage Merger
195 W. Joe Orr Rd., Chicago Heights
20201 S. La Grange Rd., Frankfort
In Berkot’s, 20005 Wolf Rd., Mokena
951 E. Lincoln Highway, New Lenox
In Berkot’s, 2141 Calistoga, New Lenox
(630) 892-0202
Member FDIC
www.oldsecond.com
56
37 South River Street, Aurora, IL 60506-4172 · www.oldsecond.com