Exhibit 99.1
| 1 Bill Skoglund Doug Cheatham Chairman, President & CEO Chief Financial Officer 630-906-5483 630-906-5484 August 20, 2008 |
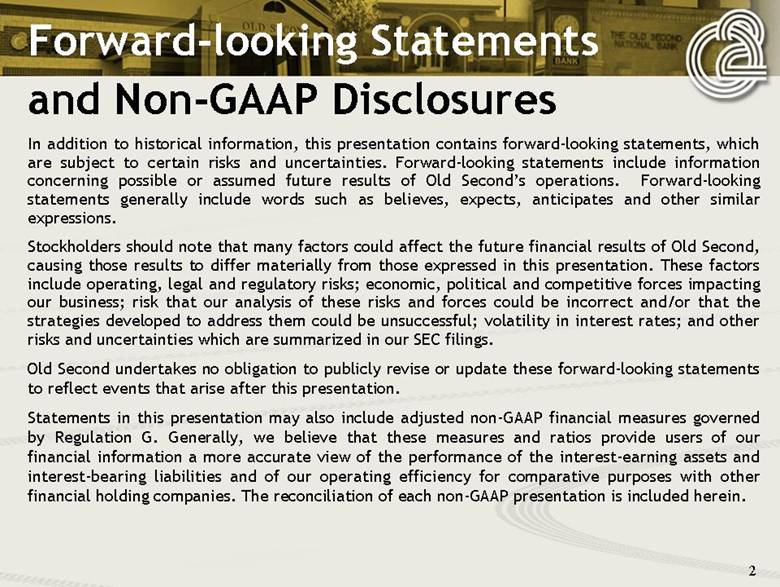
| 2 Forward-looking Statements In addition to historical information, this presentation contains forward-looking statements, which are subject to certain risks and uncertainties. Forward-looking statements include information concerning possible or assumed future results of Old Second’s operations. Forward-looking statements generally include words such as believes, expects, anticipates and other similar expressions. Stockholders should note that many factors could affect the future financial results of Old Second, causing those results to differ materially from those expressed in this presentation. These factors include operating, legal and regulatory risks; economic, political and competitive forces impacting our business; risk that our analysis of these risks and forces could be incorrect and/or that the strategies developed to address them could be unsuccessful; volatility in interest rates; and other risks and uncertainties which are summarized in our SEC filings. Old Second undertakes no obligation to publicly revise or update these forward-looking statements to reflect events that arise after this presentation. Statements in this presentation may also include adjusted non-GAAP financial measures governed by Regulation G. Generally, we believe that these measures and ratios provide users of our financial information a more accurate view of the performance of the interest-earning assets and interest-bearing liabilities and of our operating efficiency for comparative purposes with other financial holding companies. The reconciliation of each non-GAAP presentation is included herein. and Non-GAAP Disclosures |
| 3 Profile • Established in 1871 and Headquartered in Aurora, Illinois • $3.0 Billion in Assets • $2.2 Billion in Loans • $2.4 Billion in Deposits • Wealth Management Group with over $1.2 Billion Under Management: *Rapidly Growing with over $4.6 Million in Revenue *High Margin Business with a 53.8% Pre-Tax Margin • Deposit Market Share Leader in Kane and Kendall Counties (Illinois) • 35 Locations • 85 ATM Locations |
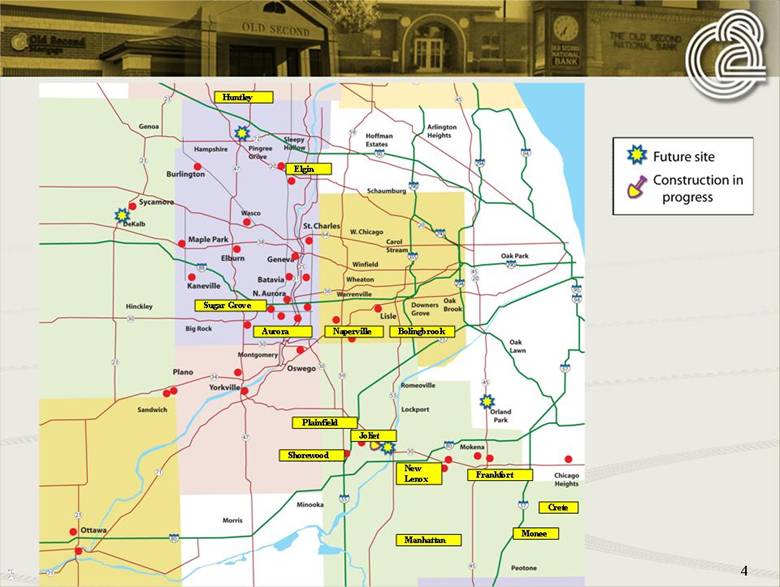
| Plainfield Huntley Monee Manhattan Bolingbrook Crete New Lenox Sugar Grove Frankfort Aurora Naperville Joliet Shorewood Elgin 4 |
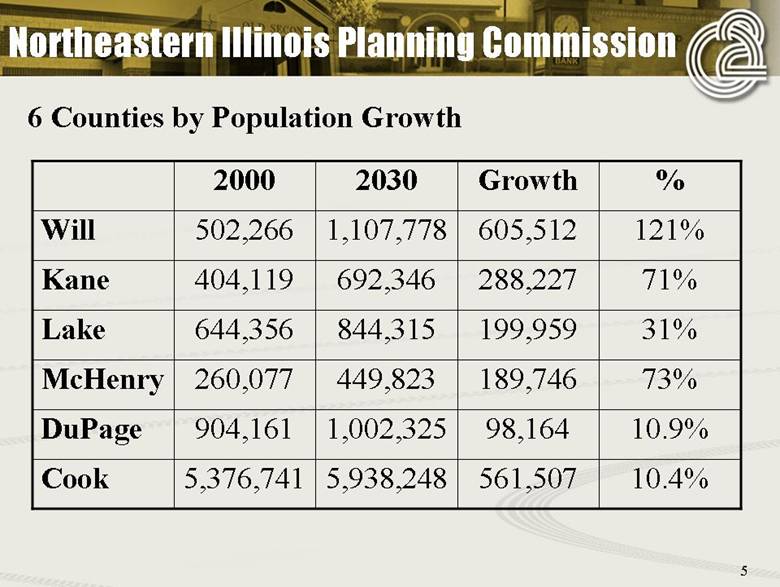
| 5 Northeastern Illinois Planning Commission 6 Counties by Population Growth 10.4% 561,507 5,938,248 5,376,741 Cook 10.9% 98,164 1,002,325 904,161 DuPage 73% 189,746 449,823 260,077 McHenry 31% 199,959 844,315 644,356 Lake 71% 288,227 692,346 404,119 Kane 121% 605,512 1,107,778 502,266 Will % Growth 2030 2000 |
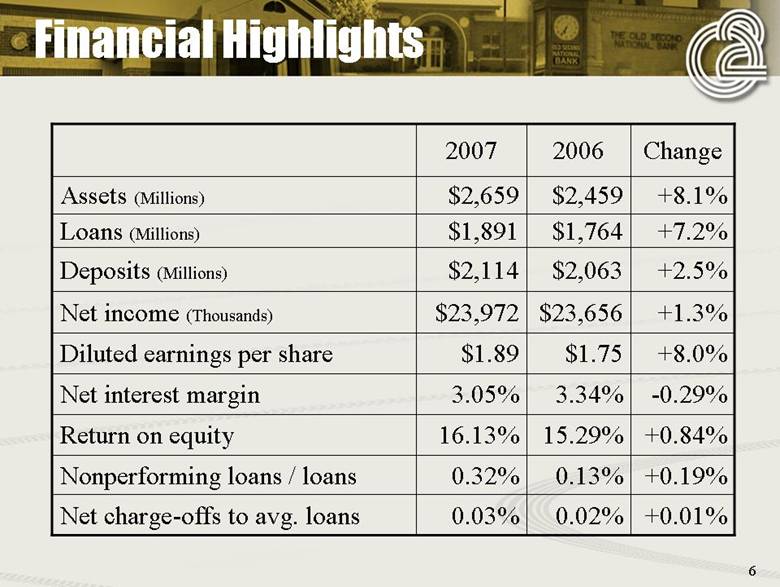
| 6 Financial Highlights Change 2006 2007 +0.01% 0.02% 0.03% Net charge-offs to avg. loans +0.19% 0.13% 0.32% Nonperforming loans / loans +0.84% 15.29% 16.13% Return on equity -0.29% 3.34% 3.05% Net interest margin +8.0% $1.75 $1.89 Diluted earnings per share +1.3% $23,656 $23,972 Net income (Thousands) +2.5% $2,063 $2,114 Deposits (Millions) +7.2% $1,764 $1,891 Loans (Millions) +8.1% $2,459 $2,659 Assets (Millions) |
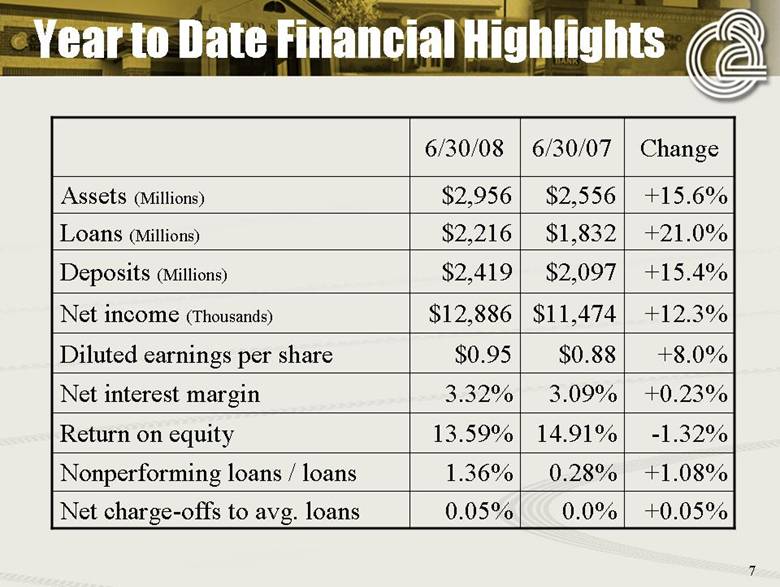
| 7 Year to Date Financial Highlights Change 6/30/07 6/30/08 +0.05% 0.0% 0.05% Net charge-offs to avg. loans +1.08% 0.28% 1.36% Nonperforming loans / loans -1.32% 14.91% 13.59% Return on equity +0.23% 3.09% 3.32% Net interest margin +8.0% $0.88 $0.95 Diluted earnings per share +12.3% $11,474 $12,886 Net income (Thousands) +15.4% $2,097 $2,419 Deposits (Millions) +21.0% $1,832 $2,216 Loans (Millions) +15.6% $2,556 $2,956 Assets (Millions) |
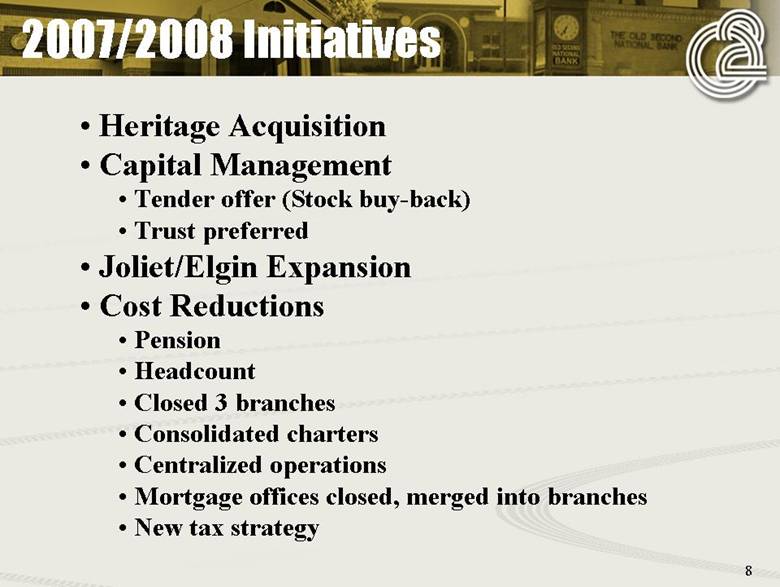
| 8 2007/2008 Initiatives • Heritage Acquisition • Capital Management • Tender offer (Stock buy-back) • Trust preferred • Joliet/Elgin Expansion • Cost Reductions • Pension • Headcount • Closed 3 branches • Consolidated charters • Centralized operations • Mortgage offices closed, merged into branches • New tax strategy |
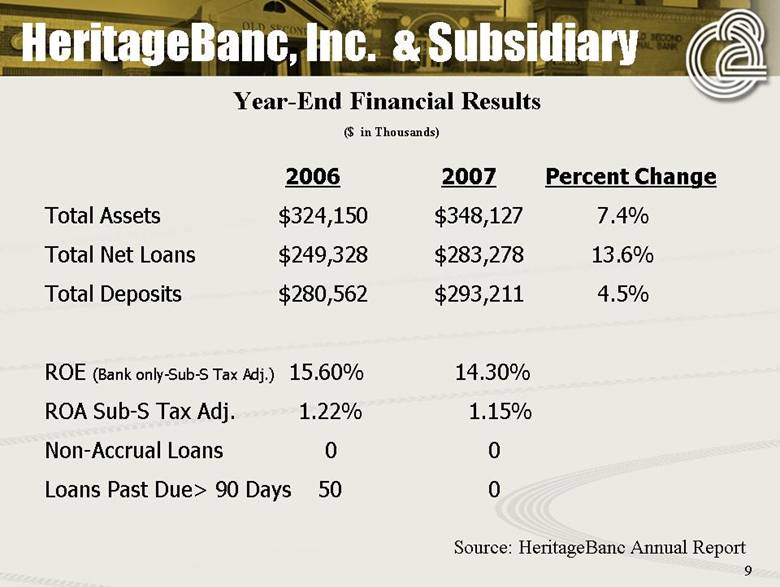
| 9 2006 2007 Percent Change Total Assets $324,150 $348,127 7.4% Total Net Loans $249,328 $283,278 13.6% Total Deposits $280,562 $293,211 4.5% ROE (Bank only-Sub-S Tax Adj.) 15.60% 14.30% ROA Sub-S Tax Adj. 1.22% 1.15% Non-Accrual Loans 0 0 Loans Past Due> 90 Days 50 0 Year-End Financial Results ($ in Thousands) Source: HeritageBanc Annual Report HeritageBanc, Inc. & Subsidiary |
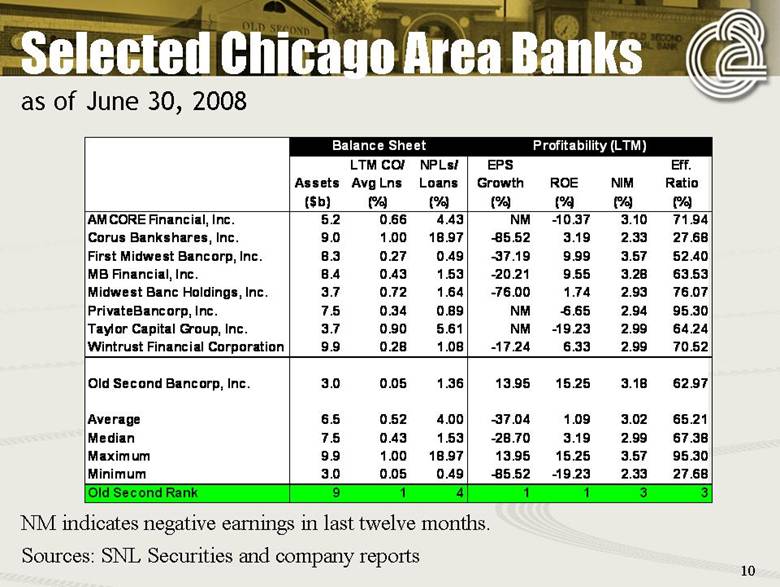
| 10 Selected Chicago Area Banks as of June 30, 2008 Balance Sheet Profitability (LTM) LTM CO/ NPLs/ EPS Eff. Assets Avg Lns Loans Growth ROE NIM Ratio ($b) (%) (%) (%) (%) (%) (%) AMCORE Financial, Inc. 5.2 0.66 4.43 NM -10.37 3.10 71.94 Corus Bankshares, Inc. 9.0 1.00 18.97 -85.52 3.19 2.33 27.68 First Midwest Bancorp, Inc. 8.3 0.27 0.49 -37.19 9.99 3.57 52.40 MB Financial, Inc. 8.4 0.43 1.53 -20.21 9.55 3.28 63.53 Midwest Banc Holdings, Inc. 3.7 0.72 1.64 -76.00 1.74 2.93 76.07 PrivateBancorp, Inc. 7.5 0.34 0.89 NM -6.65 2.94 95.30 Taylor Capital Group, Inc. 3.7 0.90 5.61 NM -19.23 2.99 64.24 Wintrust Financial Corporation 9.9 0.28 1.08 -17.24 6.33 2.99 70.52 Old Second Bancorp, Inc. 3.0 0.05 1.36 13.95 15.25 3.18 62.97 Average 6.5 0.52 4.00 -37.04 1.09 3.02 65.21 Median 7.5 0.43 1.53 -28.70 3.19 2.99 67.38 Maximum 9.9 1.00 18.97 13.95 15.25 3.57 95.30 Minimum 3.0 0.05 0.49 -85.52 -19.23 2.33 27.68 Old Second Rank 9 1 4 1 1 3 3 Sources: SNL Securities and company reports NM indicates negative earnings in last twelve months. |
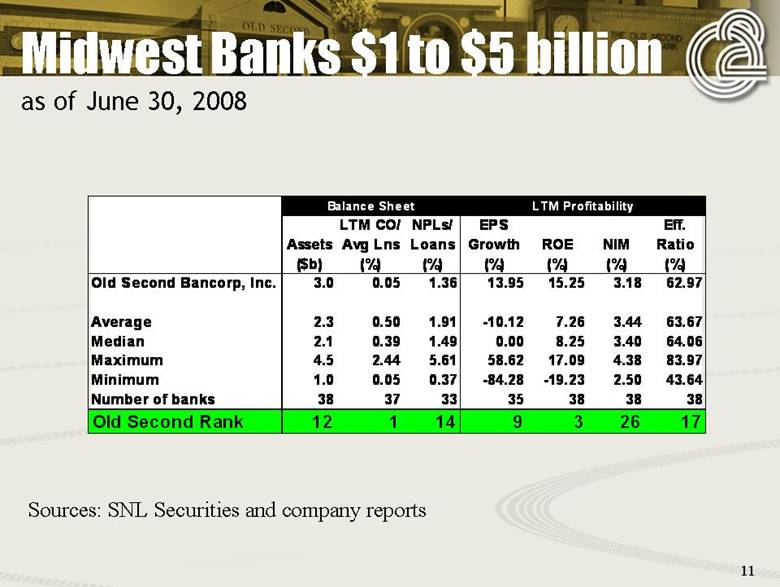
| 11 Midwest Banks $1 to $5 billion as of June 30, 2008 Balance Sheet LTM Profitability LTM CO/ NPLs/ EPS Eff. Assets Avg Lns Loans Growth ROE NIM Ratio ($b) (%) (%) (%) (%) (%) (%) Old Second Bancorp, Inc. 3.0 0.05 1.36 13.95 15.25 3.18 62.97 Average 2.3 0.50 1.91 -10.12 7.26 3.44 63.67 Median 2.1 0.39 1.49 0.00 8.25 3.40 64.06 Maximum 4.5 2.44 5.61 58.62 17.09 4.38 83.97 Minimum 1.0 0.05 0.37 -84.28 -19.23 2.50 43.64 Number of banks 38 37 33 35 38 38 38 Old Second Rank 12 1 14 9 3 26 17 Sources: SNL Securities and company reports |
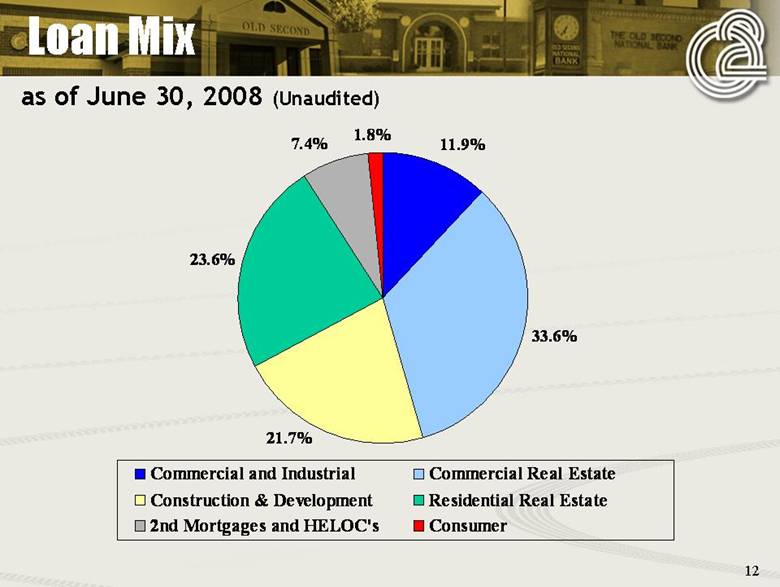
| 12 Loan Mix as of June 30, 2008 (Unaudited) 11.9% 33.6% 23.6% 7.4% 1.8% 21.7% Commercial and Industrial Commercial Real Estate Construction & Development Residential Real Estate 2nd Mortgages and HELOC’s Consumer |
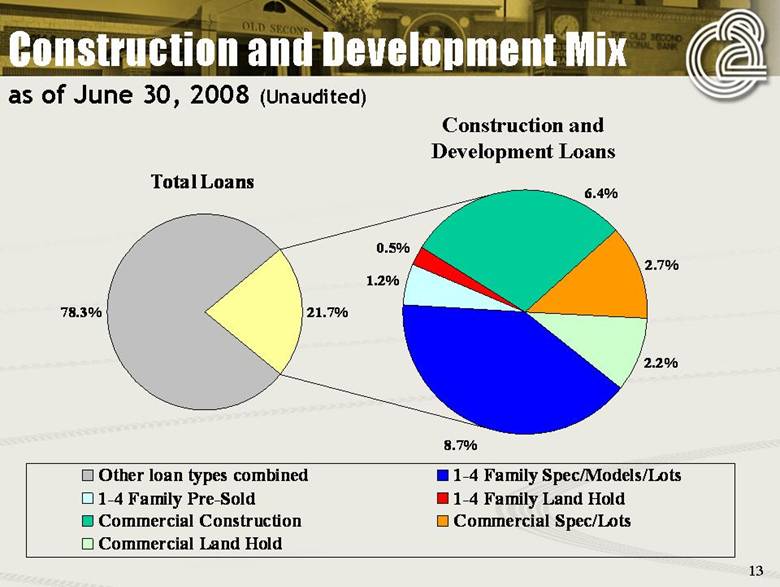
| 13 Construction and Development Mix Total Loans 78.3% 8.7% 1.2% 0.5% 2.7% 2.2% 21.7% 6.4% Other loan types combined 1-4 Family Spec/Models/Lots 1-4 Family Pre-Sold 1-4 Family Land Hold Commercial Construction Commercial Spec/Lots Commercial Land Hold Construction and Development Loans as of June 30, 2008 (Unaudited) |
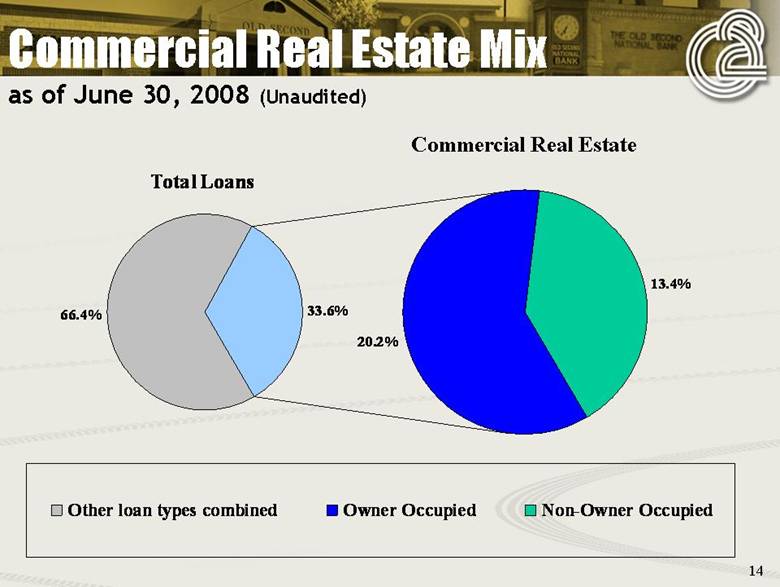
| 14 Commercial Real Estate Mix Total Loans 66.4% 20.2% 13.4% 33.6% Other loan types combined Owner Occupied Non-Owner Occupied Commercial Real Estate as of June 30, 2008 (Unaudited) |
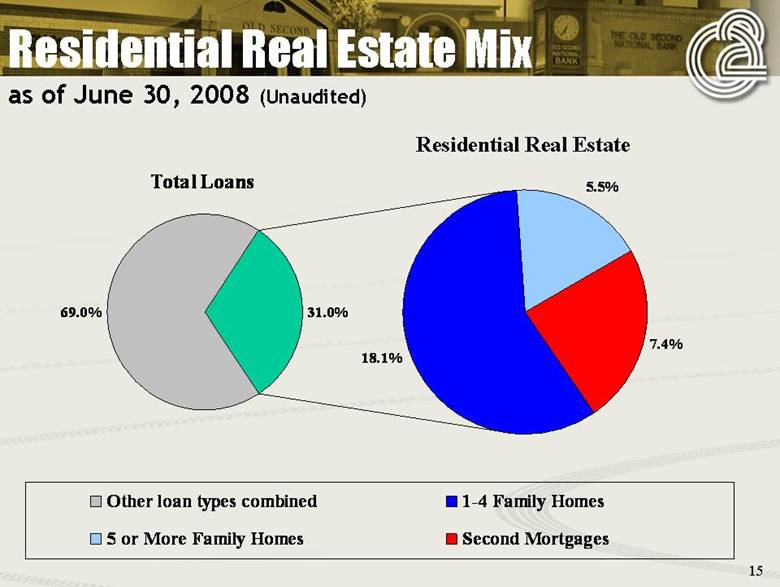
| 15 Residential Real Estate Mix Total Loans 69.0% 18.1% 5.5% 7.4% 31.0% Other loan types combined 1-4 Family Homes 5 or More Family Homes Second Mortgages Residential Real Estate as of June 30, 2008 (Unaudited) |
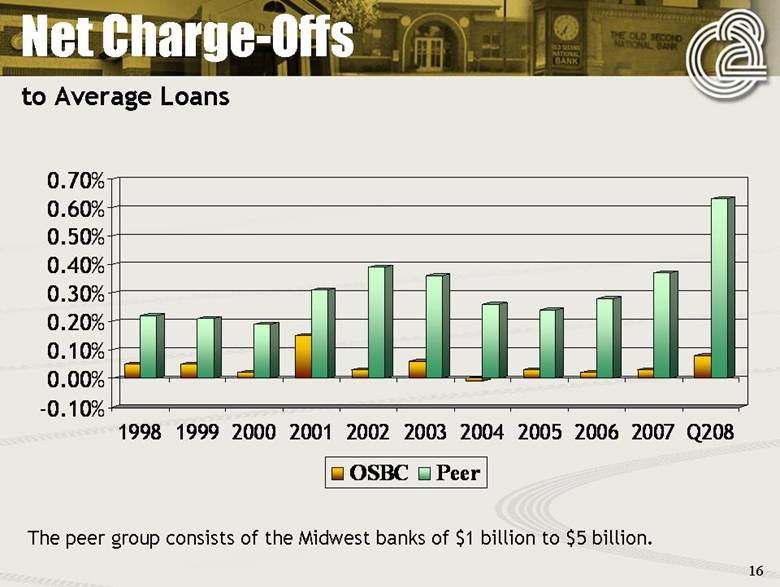
| 16 Net Charge-Offs -0.10% 0.00% 0.10% 0.20% 0.30% 0.40% 0.50% 0.60% 0.70% 1998 1999 2000 2001 2002 2003 2004 2005 2006 2007 Q208 OSBC Peer The peer group consists of the Midwest banks of $1 billion to $5 billion. to Average Loans |
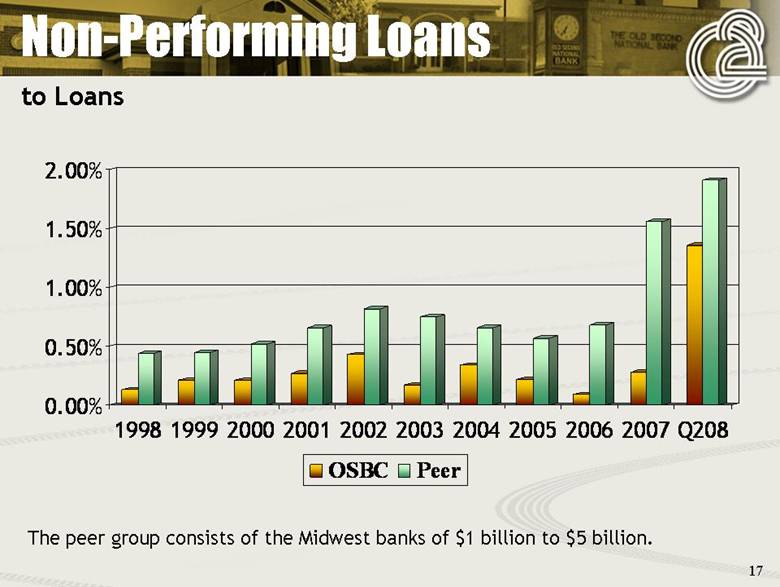
| 17 Non-Performing Loans 0.00% 0.50% 1.00% 1.50% 2.00% 1998 1999 2000 2001 2002 2003 2004 2005 2006 2007 Q208 OSBC Peer The peer group consists of the Midwest banks of $1 billion to $5 billion. to Loans |
| 18 Top 10 reasons for High Credit Quality 1. Good markets. 2. Strong credit culture/experienced lenders. 3. Relationship banking. Not just transactions. 4. Know the customers. 5. Know the markets. What works/what doesn’t. 6. Loan review--recognize problems early. Good workout staff. 7. No subprime/option ARMs, other exotic products in portfolio. 8. Basic lending--cash down, guarantees, etc. 9. Recognized slowing markets early. 10. Good credit processes. Underwriting/Loan docs/Servicing. |
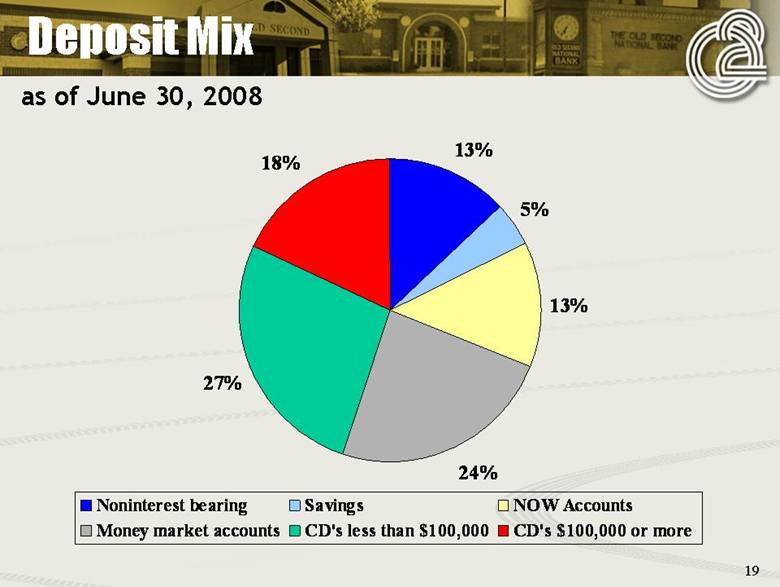
| 19 Deposit Mix as of June 30, 2008 13% 5% 13% 24% 27% 18% Noninterest bearing Savings NOW Accounts Money market accounts CD’s less than $100,000 CD’s $100,000 or more |
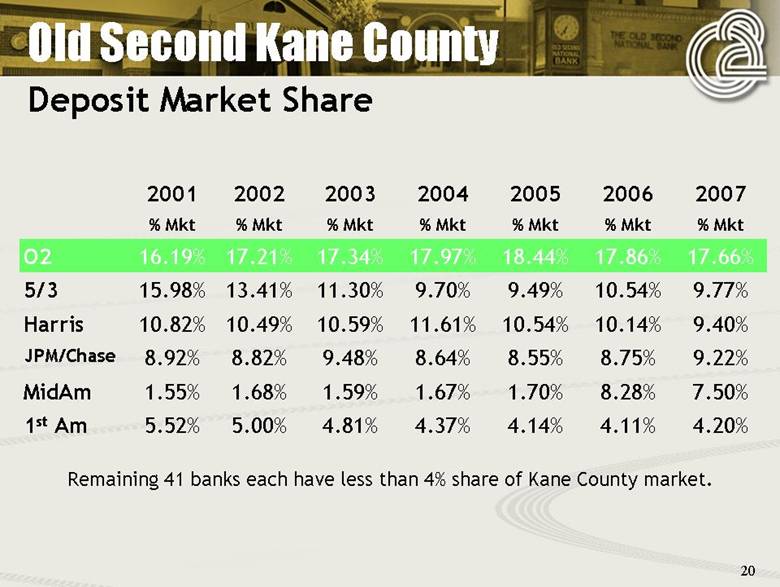
| 20 Old Second Kane County 9.77% 10.54% 9.49% 9.70% 11.30% 13.41% 15.98% 5/3 4.11% 8.28% 8.75% 10.14% 17.86% % Mkt 2006 4.14% 1.70% 8.55% 10.54% 18.44% % Mkt 2005 4.37% 1.67% 8.64% 11.61% 17.97% % Mkt 2004 4.81% 1.59% 9.48% 10.59% 17.34% % Mkt 2003 5.00% 1.68% 8.82% 10.49% 17.21% % Mkt 2002 5.52% 1.55% 8.92% 10.82% 16.19% % Mkt 2001 4.20% 1st Am 7.50% MidAm 9.22% JPM/Chase 9.40% Harris 17.66% O2 % Mkt 2007 Remaining 41 banks each have less than 4% share of Kane County market. Deposit Market Share |
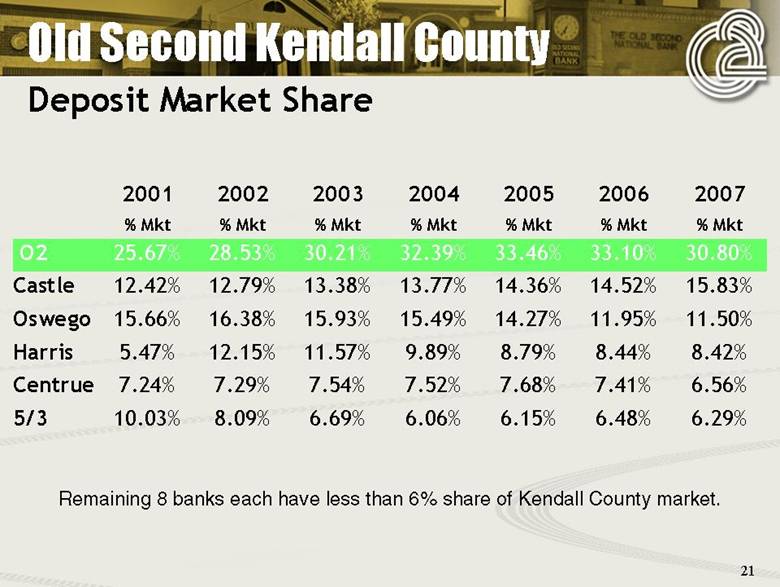
| 21 Old Second Kendall County Deposit Market Share 15.83% 14.52% 14.36% 13.77% 13.38% 12.79% 12.42% Castle 6.48% 7.41% 8.44% 11.95% 33.10% % Mkt 2006 6.15% 7.68% 8.79% 14.27% 33.46% % Mkt 2005 6.06% 7.52% 9.89% 15.49% 32.39% % Mkt 2004 6.69% 7.54% 11.57% 15.93% 30.21% % Mkt 2003 8.09% 7.29% 12.15% 16.38% 28.53% % Mkt 2002 10.03% 7.24% 5.47% 15.66% 25.67% % Mkt 2001 6.29% 5/3 6.56% Centrue 8.42% Harris 11.50% Oswego 30.80% O2 % Mkt 2007 Remaining 8 banks each have less than 6% share of Kendall County market. |
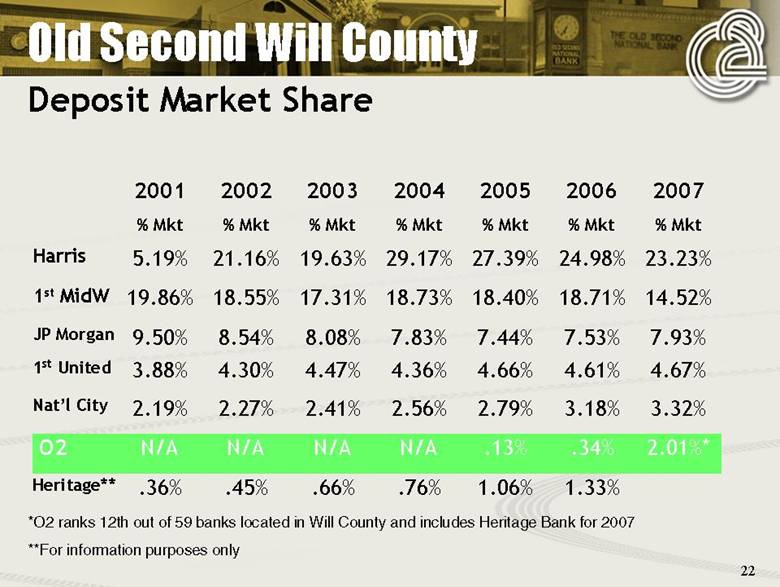
| 22 1.33% 1.06% .76% .66% .45% .36% Heritage** 14.52% 18.71% 18.40% 18.73% 17.31% 18.55% 19.86% 1st MidW .34% 3.18% 4.61% 7.53% 24.98% % Mkt 2006 .13% 2.79% 4.66% 7.44% 27.39% % Mkt 2005 N/A 2.56% 4.36% 7.83% 29.17% % Mkt 2004 N/A 2.41% 4.47% 8.08% 19.63% % Mkt 2003 N/A 2.27% 4.30% 8.54% 21.16% % Mkt 2002 N/A 2.19% 3.88% 9.50% 5.19% % Mkt 2001 2.01%* O2 3.32% Nat’l City 4.67% 1st United 7.93% JP Morgan 23.23% Harris % Mkt 2007 Old Second Will County Deposit Market Share *O2 ranks 12th out of 59 banks located in Will County and includes Heritage Bank for 2007 **For information purposes only |
| 23 • Credit quality • Earnings per share growth and ROE • Growth in loans and deposits • Heritage acquisition • Cost efficiencies • Other 2008 objectives/main issues |