Exhibit 13.1

2008 Annual Report
Table of Contents
Letter to Stockholders | | 2-3 |
| | |
Financial Highlights | | 4 |
| | |
Management’s Discussion | | 6-19 |
| | |
Consolidated Balance Sheets | | 21 |
| | |
Consolidated Statements of Income | | 22 |
| | |
Consolidated Statements of Cash Flows | | 23-24 |
| | |
Consolidated Statements of Changes in Stockholders’ Equity | | 25 |
| | |
Notes to Consolidated Financial Statements | | 26-59 |
| | |
Report of Independent Auditors | | 60 |
| | |
Corporate Information | | 61 |
| | |
Bancorp and Subsidiaries Consolidated Balance Sheet | | 62 |
| | |
Bancorp Directors | | 63 |
| | |
Old Second Locations Map | | 64 |
41
2008 Year End Letter to Stockholders
2008 was a very challenging year for Old Second and the entire banking industry.
In spite of these difficult times your Bank ended the year with net income of $11.8 million. Profits were down (50.7%) from 2007 and although we are disappointed with any decrease in net income, when compared to our peers we performed above most other banks.
Our past emphasis on conservative lending, ongoing cost controls, and our improvement in net interest margin, and increased fee income account for these results.
Our return on equity was 6.03% and earnings per share of $0.87 was down from $1.92 in 2007.
In 2008, we completed our purchase of the HeritageBanc, Inc., and have expanded our footprint into Will and southern Cook Counties. We now have 35 branches and continue to have a commanding #1 market share in Kane and Kendall Counties and good opportunity to grow and gain market share in Will, Dekalb, Dupage, LaSalle, and other contiguous counties.
An area of concern for banks is increasing credit problems. Our non-performing loans reached $108.6 million and other real estate owned was $15.2 million.
Net charge-offs for the year were $9.4 million (.41% of loans) and we added $30.3 million to the loan loss reserve, bringing the reserve to $44.9 million, or 1.82% of loans.
We believe this reserve is adequate to cover our problems as of 12/31/08; however, if this economy continues to deteriorate and real estate values continue to decline, more additions to the reserve are likely.
As an insurance policy against catastrophic economic events and to allow for growth, the Bancorp did participate in the United States Treasury’s TARP Capital Purchase Program (“CPP”). The Treasury implemented CPP to encourage financial institutions to increase the flow of financing to U.S. businesses and consumers to support the U.S. economy. The new capital is in the form of Preferred Stock in the amount of $73 million, on which we pay a 5% dividend and have issued warrants totaling 815,339 shares, convertible at a price of $13.43 per share.
With the CPP, we now have $336 million in regulatory capital and this moved our existing well capitalized regulatory ratio to an even stronger position that will allow us to grow and persevere even in the severe economic downturn we are now experiencing.
In fact, in 2008 our loans did increase by $380 million, $287 million of which came from the Heritage acquisition and $93 million from other growth opportunities.
Also our mortgage department experienced explosive growth in refinances and funded over $381 million in new mortgage loans.
42
Our key strategic initiatives in 2009 will be as follows:
1) Manage through this credit crisis.
2) Drive core deposit growth.
3) Grow loans strategically.
4) Focus on efficiencies and cost controls.
5) Continue double digit fee income growth.
· Ride the refinance wave.
· Expand derivative fee income.
· Maintain growth in Wealth Management.
6) Maintain net interest margin at target of the 3.50% range.
By accomplishing these goals we feel confident that we can earn our way through these difficult times and emerge as a stronger bank with the ability to take on the growth opportunities as they come back to our markets.
Many thanks to our Directors, shareholders, and our customers for the loyalty and faith in our organization and to our staff for their continued dedication and hard work.

43
Old Second Bancorp, Inc. and Subsidiaries
Financial Highlights
(In thousands, except share data)
| | 2008 | | 2007 | | 2006 | | 2005 | | 2004 | |
Balance sheet items at year-end | | | | | | | | | | | |
Total assets | | $ | 2,984,605 | | $ | 2,658,576 | | $ | 2,459,140 | | $ | 2,367,830 | | $ | 2,105,019 | |
Loans, gross | | 2,271,114 | | 1,891,110 | | 1,763,912 | | 1,704,382 | | 1,509,076 | |
Deposits | | 2,387,128 | | 2,113,618 | | 2,062,693 | | 1,935,278 | | 1,798,849 | |
Securities sold under repurchase agreements | | 46,345 | | 53,222 | | 38,218 | | 57,625 | | 45,242 | |
Federal funds purchased | | 28,900 | | 165,100 | | 54,000 | | 170,000 | | 49,000 | |
Other short-term borrowings | | 169,383 | | 82,873 | | 73,090 | | 1,825 | | 26,786 | |
Junior subordinated debentures | | 58,378 | | 57,399 | | 31,625 | | 31,625 | | 31,625 | |
Subordinated debt | | 45,000 | | — | | — | | — | | — | |
Notes payable and other borrowings | | 23,184 | | 18,610 | | 16,425 | | 3,200 | | 2,700 | |
Stockholders’ equity | | 193,096 | | 149,889 | | 158,555 | | 152,262 | | 134,988 | |
| | | | | | | | | | | |
Results of operations for the year-ended | | | | | | | | | | | |
Net interest and dividend income | | $ | 89,514 | | $ | 68,598 | | $ | 71,199 | | $ | 73,999 | | $ | 68,359 | |
Provision for loan losses | | 30,315 | | 1,188 | | 1,244 | | 353 | | (2,900 | ) |
Net income | | 11,824 | | 23,972 | | 23,656 | | 27,683 | | 26,287 | |
| | | | | | | | | | | |
Per share data | | | | | | | | | | | |
Basic earnings | | $ | 0.87 | | $ | 1.92 | | $ | 1.77 | | $ | 2.05 | | $ | 1.96 | |
Diluted earnings | | 0.86 | | 1.89 | | 1.75 | | 2.03 | | 1.94 | |
Dividends declared | | 0.63 | | 0.59 | | 0.55 | | 0.51 | | 0.46 | |
Stockholders’ equity as of December 31 | | 14.04 | | 12.34 | | 12.08 | | 11.26 | | 10.06 | |
| | | | | | | | | | | |
Weighted average diluted shares outstanding | | 13,689,214 | | 12,655,306 | | 13,526,603 | | 13,661,024 | | 13,535,881 | |
Weighted average basic shares outstanding | | 13,584,381 | | 12,508,551 | | 13,367,062 | | 13,486,598 | | 13,413,263 | |
Shares outstanding at year-end | | 13,755,884 | | 12,149,296 | | 13,127,292 | | 13,520,073 | | 13,424,346 | |
44
Old Second Bancorp, Inc.
and Subsidiaries
Management’s Discussion
and Analysis of Financial Condition
and Results of Operations
45
Old Second Bancorp, Inc. and Subsidiaries
Management’s Discussion and Analysis
of Financial Condition and Results of Operations
Overview
The following discussion provides additional information regarding the Company’s operations for the twelve-month periods ending December 31, 2008, 2007, and 2006, and financial condition at December 31, 2008 and 2007. This discussion should be read in conjunction with “Selected Consolidated Financial Data” and the Company’s consolidated financial statements and the accompanying notes thereto included or incorporated by reference elsewhere in this document.
Old Second Bancorp, Inc. is a financial services company with its main headquarters located in Aurora, Illinois. The consolidated financial statements include Old Second Bancorp, Inc. and its wholly-owned subsidiaries, which are together referred to as the “Company”:
· Old Second National Bank (“the Bank”).
· Old Second Financial, Inc., which provides insurance agency services.
· Old Second Capital Trust I, which was formed for the exclusive purpose of issuing trust preferred securities in an offering that was completed in July 2003. Old Second Capital Trust I is an unconsolidated subsidiary of the Company. See Notes A and K of the consolidated financial statements included in this annual report for further discussion.
· Old Second Capital Trust II, which was formed for the exclusive purpose of issuing trust preferred securities in an offering that was completed in April 2007. Old Second Capital Trust II is also an unconsolidated subsidiary of the Company and additional information is available in the notes cited above.
· Old Second Affordable Housing Fund, L.L.C., which was formed for the purpose of providing down payment assistance for home ownership to qualified individuals.
· Old Second Management, LLC (“OSM”), which was formed for the purpose of providing a possible future source of capital as well as providing certain tax advantages. Old Second Bank owns 100% of the common stock of OSM. Old Second Realty, LLC (“OSR”) is a Delaware real estate investment trust and 100% of the common stock of OSR is owned by OSM. As of January 2, 2007, there were various minority holders of preferred stock in OSR.
· Old Second Acquisition, Inc., which was formed as part of the November 5, 2007 Agreement and Plan of Merger between the Company, Old Second Acquisition, Inc., a wholly-owned subsidiary of the Company, and HeritageBanc, Inc. (“Heritage”). The parties consummated the merger on February 8, 2008, at which time, Old Second Acquisition, Inc. was merged with and into Heritage with Heritage as the surviving corporation as a wholly-owned subsidiary of the Company. Additionally, the parties merged Heritage Bank, a wholly-owned subsidiary of Heritage, with and into Old Second National Bank, with Old Second National Bank as the surviving bank. After the completion of the merger transaction, Heritage was dissolved and is no longer an existing subsidiary.
· Station I, LLC, a wholly owned subsidiary of Old Second National Bank, which was formed in August 2008 to hold property acquired by the Bank through foreclosure or in the ordinary course of collecting a debt previously contracted with a borrower.
Inter-company transactions and balances are eliminated in consolidation.
The Company provides financial services through its thirty-five banking locations located in Cook, Kane, Kendall, DeKalb, DuPage, LaSalle and Will counties in Illinois. As a result of the February 2008 merger, the franchise expanded into the southwestern section of Cook County, which includes the higher growth markets of the south Chicago suburbs. This acquisition provided additional market penetration by adding five retail-banking locations and allowed the Company to fill in its footprint surrounding the Chicago metropolitan area. The Company also offers insurance products in this new market area through Old Second Financial, Inc.
The Company began to realize the economic benefits of the transaction in the second quarter of 2008 as all of the major integration initiatives were completed. The acquired client base provided revenue opportunities for the corporate business unit as well as the Company’s retail and mortgage services operations. Likewise, wealth management and employee benefit services offerings were more expansive than the previous products and services offered. Access to remote capture services and other treasury management products also became available and complemented the traditional commercial deposit and loan products previously offered. The Company paid consideration of $43.0 million in cash and 1,563,636 shares of the Company’s common stock valued at $27.50 per share to consummate the Heritage acquisition. Details related to the allocation of the purchase price for this business combination are discussed in Note B of the financial statements included in this annual report. The terms of the credit facilities that were established to complete the acquisition are detailed in Note K of the financial statements included in this annual report. Additional organizational
46
Management’s Discussion – continued
changes that occurred during 2008 are also detailed in Note A of the financial statements included in this annual report.
Our primary deposit products are checking, NOW, money market, savings, and certificate of deposit accounts, and the Company’s primary lending products are commercial mortgages, construction lending, commercial and industrial loans, residential mortgages and installment loans. Major portions of the Company’s loans are secured by various forms of collateral including real estate, business assets, and consumer property while borrower cash flow is the primary source of repayment. The Bank also engages in trust operations.
The Company recorded net income of $11.8 million or $.86 diluted earnings per share in 2008, which compares with earnings of $24.0 million or $1.89 per diluted share in 2007, and $23.7 million, or $1.75 per diluted share in 2006. Basic earnings per share were $.87 in 2008, $1.92 in 2007, and $1.77 in 2006. In 2008, balance sheet growth in earning assets, including increases in net interest margin and increases in noninterest income were more than offset by increases in the provision for loan losses combined with increases in other expenses. The Company recorded an $30.3 million provision for loan losses in 2008, which included an addition of $21.2 million in the fourth quarter. The provision for loan losses for 2007 approximately equaled the 2006 expense of $1.2 million with no fourth quarter addition recorded in either period.
Net interest income increased $20.9 million (30.5%) to $89.5 million in 2008, compared to a decrease of $2.6 million (3.7%) to $68.6 million in 2007. The 2008 increase resulted from both an increase in assets as well as a general decrease in interest rates in 2008, which lowered the Company’s cost of funds. In addition to organic growth, the Company acquired $329.0 million in earning assets through the February acquisition, which included $283.6 million in loans and $45.4 million in investments. Average earning assets grew $337.0 million, or 14.3%, from December 31, 2007 to December 31, 2008. The net interest margin (tax-equivalent basis), expressed as a percentage of average earning assets, increased from 3.05% in the year ended December 31, 2007 to 3.45% in the year ended December 31, 2008. The net interest margin (tax equivalent basis) was 3.34% in 2006. Year-end total assets were $2.99 billion as of December 31, 2008, an increase of $326.0 million (12.3%) from $2.66 billion as of December 31, 2007. Average assets were $2.92 billion, $2.52 billion, and $2.38 billion in 2008, 2007, and 2006, respectively.
Application of critical accounting policies
The Company’s consolidated financial statements are prepared in accordance with United States generally accepted accounting principles and follow general practices within the banking industry. Application of these principles requires management to make estimates, assumptions, and judgments that affect the amounts reported in the consolidated financial statements and accompanying notes. These estimates, assumptions, and judgments are based on information available as of the date of the consolidated financial statements.
Future changes in information may affect these estimates, assumptions, and judgments; which, in turn, may affect amounts reported in the consolidated financial statements.
All significant accounting policies are presented in Note A of the financial statements included in this annual report. These policies, along with the disclosures presented in the other financial statement notes and in this discussion, provide information on how significant assets and liabilities are valued in the financial statements and on how those values are determined.
Management has determined that the Company’s accounting policies with respect to the allowance for loan losses is the accounting area requiring subjective or complex judgments that is most important to the Company’s financial position and results of operations, and therefore, is one of the Company’s most critical accounting policies. The allowance for loan losses represents management’s estimate of probable credit losses inherent in the loan portfolio. Determining the amount of the allowance for loan losses is considered a critical accounting estimate because it requires significant judgment and the amount of estimated losses on pools of homogeneous loans based on historical loss experience, and consideration of current economic trends and conditions, as well as estimated collateral valuations, all of which may be susceptible to significant change. The loan portfolio also represents the largest asset type on the consolidated balance sheet. The allowance for loan losses is a valuation allowance for credit losses, increased by the provision for loan losses and decreased by charge-offs less recoveries. Management estimates the allowance balance required using an assessment of various risk factors including, but not limited to, past loan loss experience, known and inherent risks in the portfolio, information about specific borrower situations and estimated collateral values, volume trends in delinquencies and nonaccruals, economic conditions, and other factors. Allocations of the allowance may be made for specific loans, but the entire allowance is available for losses inherent in the loan portfolio. A loan is considered impaired when it is probable that not all contractual principal or interest due will be received according to the original terms of the loan agreement. Management defines the measured value of an impaired loan based upon the present value of the future cash flows, discounted at the loan’s original effective interest rate, or the fair value of underlying collateral, if the loan is collateral dependent. Impaired loans at December 31, 2008 and 2007 were $108.6 million and $30.0 million, respectively. In addition, a discussion of the factors driving changes in the amount of the allowance for loan losses is included in the Provision for Loan Losses section that follows.
Another of the Company’s critical accounting policies relates to the fair value of various financial instruments including investment securities, derivative instruments and the expanded fair value measurement disclosures related to the recently adopted FAS 157 and the subsequent associated FASB issued Staff Positions (“FSP”) discussed in Note A.
47
Management’s Discussion – continued
Recent Developments
On January 16, 2009, the Company announced that the United States Department of the Treasury (“Treasury”) completed its investment of $73 million in Series B Fixed Rate Cumulative Perpetual Preferred Stock and warrants to purchase common stock of Old Second National Bank (“Bank”) as part of Treasury’s Troubled Asset Relief Program (“TARP”) Capital Purchase Program (“CPP”).
The Series B preferred shares issued to Treasury pay a dividend of 5% per year for the first five years and will reset to 9% per year thereafter. The Series B preferred shares are callable at their liquidation value of $1,000 per share and can be redeemed prior to then only with the approval of the Federal Reserve. Old Second also issued to Treasury a ten-year warrant to purchase 815,339 shares of common stock at an exercise price of $13.43 per share. The warrant is immediately exercisable.
Results of operations
Net interest income
Net interest income is the difference between interest income earned on earning assets and interest expense paid on interest bearing liabilities. As such, net interest income is affected by changes in the volume and yields on earning assets and the volume and rates paid on interest bearing liabilities. Net interest margin is the ratio of tax-equivalent net interest income to average earning assets. As discussed in the overview section, increases in net interest income during this period were primarily the result of growth in earning assets as well as the general decrease in rates in 2008. The average tax-equivalent yield on earning assets decreased 76 basis points from 6.67% in 2007, to 5.91% in 2008. However, the cost of funds on interest bearing liabilities decreased 131 basis points from 4.16%, to 2.85% in the same period. The average net interest margin (tax equivalent) was 3.45%, 3.05%, and 3.34% in 2008, 2007, and 2006, respectively.
Net interest income was $89.5 million in 2008, $68.6 million in 2007, and $71.2 million in 2006. Average earning assets were $2.69 billion in 2008, an increase of $337.0 million, or 14.3%, from $2.36 billion in 2007. Average earning assets were $2.22 billion in 2006. Average portfolio loans increased $356.5 million, or 19.5%, from $1.83 billion in 2007 to $2.18 billion in 2008. During 2007, average portfolio loans increased $76.9 million, or 4.4%, from $1.75 billion in 2006, to $1.83 billion in 2007. Average interest bearing liabilities were $2.39 billion in 2008, an increase of $300.0 million, or 14.3%, from 2007. Average interest bearing liabilities were $2.09 billion in 2007, an increase of $140.7 million, or 7.2%, from 1.95 billion in 2006. In 2006, management recorded an adjustment to interest expense on other short-term borrowings of $961,000 due to a reduction in estimate for accrued interest payable. Approximately $528,000 of this reduction related to 2006.
The major factor that reduced interest expense was the decline in rates that occurred throughout 2008. Changes in deposit funding composition did occur as account holders reacted to the change in rates, but had a lesser effect. The average balances of lower-cost sources of funds such as interest-bearing transaction accounts and savings accounts increased $40.3 million, or 16.1%, and $7.8 million, or 7.6%, respectively, from December 31, 2007 to December 31, 2008. At the same time, average non-interest-bearing deposits increased by $55.9 million, or 21.7% while higher-cost sources of funds such as money market and time deposits increased $54.7 million, or 11.0% and $100.1 million, or 10.2%, respectively. Non-deposit funding costs also decreased significantly in 2008 as lower interest rates more than offset higher borrowing levels.
Given the Company’s mix of negatively gapped interest earning assets and interest bearing liabilities at December 31, 2007, the net interest margin was generally positioned to increase during a declining rate environment, which occurred throughout 2008. The Federal Open Market Committee (“FOMC”) decreased the target for the Federal Funds rate by announcing a series of interest rate cuts in 2008. These decreases lowered the target rate from 4.25% at January 1, 2008 to 0.25% at December 31, 2008. The Bank’s prime rate decreased in correlation with the Federal Funds rate, moving from 7.25% on January 1, 2008 to 3.25% as of December 31, 2008. While interest costs associated with generating deposit growth and other sources of funds in 2008 generally increased funding costs through increased volume, these increases were more than offset by the amount of liabilities that repriced with the general decreases in market rates. The Company was asset sensitive at December 31, 2008, and this change was due in large part to the first quarter acquisition of Heritage as well as a general extension of many of the Company’s liabilities particularly with the large growth in certificates of deposit.
Provision for loan losses
In 2008, the Company recorded a $30.3 million provision for loan losses, which included an addition of $21.2 million in the fourth quarter. In both 2007 and 2006, the provision for loan losses was $1.2 million. Nonperforming loans increased to $108.6 million at December 31, 2008 from $6.0 million at December 31, 2007, and $2.2 million at December 31, 2006. Nonperforming loans are defined as non-accrual loans, restructured loans, and loans past due ninety days or more and still accruing interest. Net charge-offs in 2008, 2007 and 2006 were $8.9 million, $546,000, and $380,000 respectively. When compared with total loans, net charge-offs as a percentage of total average loans were 0.41%, 0.03%, and 0.02% in 2008, 2007 and 2006, respectively. Provisions for loan losses are made to provide for probable and estimable losses inherent in the loan portfolio. Approximately $53.6 million of the December 31, 2008 problem loan total was acquired through the Heritage Bank acquisition and these loans had a total specific allocation estimate of $2.9 million at December 31, 2008. Management believed that the $3.0 million allowance for loan losses assumed in the Heritage transaction in the first quarter was adequate to address the risks specific to the loan portfolio purchased.
48
Management’s Discussion – continued
Nonperforming loans increased in 2008 despite a fourth quarter conversion of $14.3 million to other real estate, which included $12.6 million from a single relationship. The remaining nonperforming loans at December 31, 2008 were concentrated in a small number of credit relationships. Six relationships make up 53.3% of the total, and ten relationships make up 61.7% of total nonperforming loans. Management reviewed the status of each of these relationships and made an estimated loss allocation for each relationship as disclosed below. The following narrative provides detail relative to each of the largest six nonperforming relationships.
· The first nonperforming relationship is with a residential investor in multi-family and 1-4 unit properties with a total exposure outstanding of $15.8 million, and an allocation for loss of $1.3 million. The various credits comprising this relationship are secured by two apartment buildings, and an assortment of approximately seventy one-to-four family investment properties, and two small commercial buildings. These credits were underwritten at 75-80% of the estimated collateral value at inception and were also supported by cash flow analysis. Management believes that the estimated value of these properties are sufficient to support the current exposure.
· The second nonperforming relationship is with a commercial and residential land developer with a total exposure outstanding of $14.6 million. This relationship consists of a $4.7 million loan on a retail building that is partially leased, a $5.7 million loan on retail-zoned land within the same project as the retail building, and a $4.2 million loan on a retail-zoned parcel in a separate project. In addition to placing the loans on nonaccrual status, management has estimated a loss allocation amount of $2.3 million based upon a review of the appraisals and the current legal status of these properties. Additionally, on the land financed by the $5.7 million loan, a retail building was constructed by the owner and was financed by his general contractor. Mechanic’s lien claims have been filed against that property. For the retail building, contractor financed building, and retail zoned lots in the first project, the Company is negotiating with the borrower and the general contractor to obtain deed to the property while simultaneously pursuing a foreclosure action. The outcome of these negotiations is not certain, but the Company believes this portion of the debt will be resolved through a negotiated plan. The remaining retail-zoned parcel is under a pending sale contract awaiting completion of due diligence and management believes such proceeds would be more than sufficient to satisfy the $4.2 million debt. Since culmination of that sale is not certain, the Company is also negotiating a possible deedin-lieu-of-foreclosure arrangement on this property while simultaneously pursuing a foreclosure action.
· The third largest nonperforming relationship is to a residential homebuilder with a total credit exposure of $8.5 million. This townhome project recently experienced a sales decline consistent with other such projects operating in the current economic environment. $6.1 million of this credit is secured by lots zoned for townhome construction. The remainder of the credit is secured by various completed and partially-completed townhome units within the same project. Despite continuing negotiations with the owners and guarantors to continue their support on this project, no agreement has been reached. As a result, this credit has been placed on nonaccrual with a specific allocation of approximately $1.5 million based upon the appraisals in file, which were adjusted downwards by management to be consistent with the estimated decline in value that has been observed in other, recently obtained appraisals for similar projects.
· The fourth largest nonperforming relationship is to a residential builder and developer with a total exposure of $7.5 million. This credit is on nonaccrual and has a specific allocation of $400,000. The relationship is comprised of debts that are secured by residential-zoned farmland, and a combination of completed residential lots and phased land slated for development in two other projects. One of these projects started approximately three years ago and experienced good sales volume until late 2007. Recent sales have been slow and management’s review of values obtained in recent appraisals indicated that the likely liquidation value required the specific allocation amount cited above. A second project opened in 2007 and sales activity has been stagnant. The borrower is working with the Company to provide additional collateral in exchange for extension/forbearance terms while the various properties continue to be marketed for sale. Management continues to pursue a variety of workout remedies with the borrower.
· The fifth largest nonperforming loan relationship is to a residential developer with a total exposure of $6.3 million. This loan is on nonaccrual and the amount outstanding is net of a $2.8 million charge-off that was taken in September 2008, and an additional $700,000 charge-off recorded in December 2008. A parcel of residential-zoned farmland secures this loan. The developer has ceased supporting the credit relationship. The amount charged-off in the third quarter reduced the exposure to approximately 65% of original land-only costs as supported by a current appraisal. In the fourth quarter review, management estimated that the value of this property had further weakened and reduced the exposure with a specific allocation of $1.4 million.
· The sixth largest nonperforming loan relationship is to a commercial and residential land developer with total exposure of $5.2 million. This loan is on nonaccrual and matured late in the fourth quarter. This project consists of land zoned for residential and commercial development. The land was appraised in the third quarter of 2008 at $9.5 million, but management now believes that valuation was overstated as it was based on comparables from a stronger economic period. The preliminary results of a new appraisal valuation in process indicate the value is closer to $3.7 million and as a result, management increased the estimate for the specific allocation amount to $1.8 million. Management continues to negotiate with the borrower but was informed in the first quarter of 2009 that an end buyer/option holder on the project has decided to abandon the zoning process that was in process for this property.
49
Management’s Discussion – continued
The next four largest nonperforming credits range in size from $2.0 million to $2.6 million and are comprised of one credit on income-producing residential real estate, one credit on income-producing commercial real estate, and two credits to small builders and developers. All of the properties are located in the greater Chicago area. All of these credits are on nonaccrual, and the total specific allocation is approximately $730,000 for these four relationships. In December, approximately $200,000 was charged-off for the residential real estate credit. These amounts were based upon the receipt of updated appraisals and/or management evaluations of the properties, and are believed to be adequate to cover the probable loss amounts inherent in these loans.
The remaining nonperforming loans consist of various small builder commercial real estate, residential real estate and small business credits. The Bank is pursuing foreclosure remedies in many of these cases. A total of $5.9 million of specific allocation has been recorded as the probable loss amount inherent in these credits.
The Company’s market areas have not experienced some of the more dramatic downturns in housing prices as reported in other areas of the country, but significant price declines have occurred throughout the Chicago area. As of the December 31, 2008 loan portfolio total, the Company had 16.5% invested in real estate construction and development loans and 40.9% invested in commercial real estate. The Company has generally limited its lending activity to locally known markets and construction lending is typically based upon cost instead of appraisal values. In addition to encouraging local real estate lending activities within nearby markets, versus purchased or out of territory loans, the Company has maintained its focus upon providing traditional loan products to residential borrowers.
The ratio of the allowance for loan losses to nonperforming loans was 37.99% as of December 31, 2008, compared with 281.95% as of December 31, 2007 and 731.06% as of December 31, 2006. While this ratio decreased at December 31, 2008, management believed the allowance coverage was sufficient due to the estimated loss potential. In addition to specific allocations on loans, management determines the amount to provide in the allowance for loan losses based upon a number of qualitative and other factors, including, but not limited to, loan growth, the quality and composition of the loan portfolio, and loan loss experience. Prior to 2008, the Company has had minimal credit losses. The current allowance is weighted heavily toward the real estate portfolio due to its size in relation to the other portions of our portfolio. With the continued increase in the amount of nonperforming loans in 2008, and the prolonged deceleration in real estate building and development activity as compared to prior years, management increased the factors for residential, development and commercial real estate loans. As the slowdown in the development and construction sector was observed, combined with the Company’s concentration in these types of loans, management concluded that it represented increased risk that warranted higher provisioning, particularly as it related to specific construction and development activities. These environmental factors are evaluated on an ongoing basis and are included in the assessment of the adequacy of the allowance for loan losses. When measured as a percentage of loans outstanding, the allowance for loan losses increased to 1.82% at December 31, 2008, as compared to 0.89% at December 31, 2007. In management’s judgment, an adequate allowance for estimated losses has been established; however, there can be no assurance that actual losses will not exceed the estimated amounts in the future.
The allowance for loan losses consists of three components: (i) specific allocations established for losses resulting from an analysis developed through reviews of individual loans for which the recorded investment in the loan exceeds the measured value of the loan; (ii) reserves based on historical loss experience for each loan category; and (iii) reserves based on general current economic conditions as well as specific economic and other factors believed to be relevant to the Company’s loan portfolio. Management evaluates the sufficiency of the allowance for loan losses based on the combined total of each of these components. The components of the allowance for loan losses represent an estimation performed pursuant to Statement of Financial Accounting Standard (“SFAS”) 5, Accounting for Contingencies, and SFAS 114, Accounting by Creditors for Impairment of a Loan, and SFAS 118 “Accounting by Creditors for Impairment of a Loan — Income Recognition and Disclosures,” which amended several provisions of SFAS 114.
Specific allocations
Management reviews on at least a quarterly basis certain loans on nonaccrual, loans over 90 days past due, troubled debt restructurings or any loans considered doubtful or loss. The individual loan officers analyze these loans with the results reported to the Loan Review Committee on a Credit Management Report. From that report, management determines the amount of specific allocations by reviewing, on a credit-by-credit basis, all loans considered impaired under SFAS 114 as amended by SFAS 118 as well as all problem and watch loans. SFAS 114 defines impaired loans as loans where, based on current information and events, it is probable that a creditor may be unable to collect all amounts due according to the original contractual terms of the loan agreement.
A problem loan is defined by the Company’s loan policy as “A credit that is inadequately protected by the current sound worth and paying capacity of the borrower or of the collateral pledged, if any. Loans so classified have a well-defined weakness that jeopardizes the liquidation of the debt. These loans are characterized by the distinct possibility that the Bank will sustain some loss if the deficiencies are not corrected. Loss potential, while existing in the aggregate amount of substandard loans, does not have to exist in individual loans classified”.
Specific allocations are discussed at the quarterly watch list meeting. The First Vice President of Loan Review chairs this meeting. The committee consists of the Company’s President, the Bank’s President and Chief Operating Officer, Regional
50
Management’s Discussion – continued
Senior Vice Presidents, the Company’s Executive Vice President of Credit & Chief Risk Officer, the Executive Vice President of Strategic Development and other senior lenders who serve as members of the loan committee.
As of December 31, 2008, the Company had a total of $106.5 million in nonaccrual loans, of which fifty seven nonaccrual loans totaling $75.6 million had a specific allocation of $15.2 million. The Company has no specific allocations for restructured loans, but did have two past due loans totaling approximately $2.0 million, which had a specific allocation estimate of $140,000 included in the allowance. As of December 31, 2007, the Company had eighteen nonaccrual loans totaling $5.3 million with a specific allocation of $136,000 for those loans. As of December 31, 2006, the Company had fourteen nonaccrual loans totaling $1.6 million with an allocation of $133,000 for those loans. Impaired loans at December 31, 2008, 2007, and 2006 were $108.6 million, $30.0 million, and $10.3 million respectively.
Historical reserves and management allocations
The component of the allowance for loan losses based on historical loan loss experience is determined using historical charge-off data for the last five years, with more weight placed on the most recent years. This calculation is done monthly and refined quarterly. Management considers a variety of factors to determine the appropriate level of allowance for inherent loan losses including but not limited to, past loan loss experience, known and inherent risks in the portfolio, information about specific borrower situations and estimated collateral values, volume trends in delinquencies and nonaccruals, economic conditions, and other factors. Allocations of the allowance may be made for specific loans, but the entire allowance is available for losses inherent in the loan portfolio. All factors are considered on a quarterly basis and are adjusted when appropriate. In addition, various regulatory agencies, as an integral part of their examination process, periodically review the Company’s allowance for loan losses. Such agencies may require the Company to make additional provisions to the allowance based on their judgments about information available to them at the time of their examination.
The general component of the allowance recognizes probable inherent, but undetected, losses in the loan portfolio. Regardless of how management analyzes customer performance, ratings migration, economic conditions and interest rate risk, management believes there are additional potential risks that are unaccounted for in the process of making loans. This is due to several factors including, but not limited to:
· Timing delays in receiving information regarding a customer’s financial condition;
· Changes in individual business climates;
· The judgmental nature of individual loan evaluations and collateral assessments; and
· The open interpretation of economic trends.
The analysis of these factors involves a high degree of judgment by management. Because of the imprecision surrounding these factors, the bank estimates a range of inherent losses and maintains a general allowance that is not allocated to a specific category.
Non-interest income
Non-interest income was $35.3 million for the year 2008, an increase of $3.4 million, or 10.7%, as compared to 2007. The increase in non-interest income in 2008 was primarily the result of increased income from mortgage banking operations and realized gains on sales of securities. Non-interest income was $31.9 million for 2007, an increase of $3.1 million, or 11.0%, as compared to 2006.
Trust income was $8.1 million in 2008, a decrease of $605,000, or 7.0%, from 2007 due principally to decreased volume in estate administration activity coupled with a decrease in assets under management as a result of the general decline in asset values in the second half of 2008. Assets under management were $924.8 million, $1.1 billion, and $1.0 billion at December 31, 2008, 2007, and 2006, respectively. Trust income increased to $8.7 million in 2007, an increase of $1.1 million, or 14.1%, from $7.6 million in 2006. Trust income increased generally in 2007 due to greater volumes in both assets under management and estate administration activities.
Service charges on deposits were $9.3 million in 2008, an increase of $758,000, or 8.9%, from $8.6 million in 2007, primarily due to increased volumes from commercial overdraft and account service charges. The latter item also increased in part due to the reduced commercial earnings credits that resulted from a lower interest rate environment, although fee structures were also changed in 2008.
Mortgage banking income, including net gain on sales of mortgage loans, secondary market fees, and servicing income was $7.3 million in 2008, an increase of $1.7 million, or 30.4%, from $5.6 million in 2007. Mortgage banking income was $4.9 million in 2006. The largest increase in income from mortgage operations was in net gain on sales of mortgage loans, which resulted largely from a significant revision to secondary market execution processes. Mortgage banking income is largely volume-driven and mortgage activity is susceptible to changes in interest rates and general economic conditions. Loans sold, including gains on sale totaled $318.7 million in 2008, $232.4 million in 2007, and $288.8 million in 2006. Originations in 2008 increased as mortgage rates decreased, which spurred an increase in refinancing activity. The decrease in 2007 mortgage originations was due largely to the fact that interest rates did not begin to decline until September of that year. The Company reengineered its secondary mortgage lending operations and system tools in the first half of 2007 including its approach to pricing, compensation and geographic distribution of lenders. This effort, in addition to an increase in cross sell opportunities from other business units in 2008, increased mortgage-banking income despite the ongoing market turbulence experienced in that sector.
51
Management’s Discussion – continued
Realized gains on sales of securities in 2008 were $1.9 million, an increase of $1.2 million, or 179.2%, as compared with $674,000 for 2007. Gains on sales of securities in 2006 totaled $418,000. In 2008, Bank-owned life insurance (“BOLI”) income decreased $1.4 million, or 69.5%, from 2007 levels. This performance decline was due in part to the continued decrease in interest rates available as well as losses recorded on the underlying insurance investments in both the quarter and year. The increase in cash surrender value of BOLI was $2.1 million in 2006. Interchange income from debit card usage continued to increase in 2008 as customers continued to respond favorably to rewards programs and generally showed a preference for this payment method. Interchange income from debit card usage was $2.4 million, $2.0 million and $1.8 million respectively in 2008, 2007 and 2006.
Other non-interest income in 2008 was $5.7 million, an increase of $1.4 million, or 32.5%, from $4.3 million in 2007. Some of the larger sources of increase in the other income category were credit card processing fees, automatic teller machine surcharge and interchange fees and letter of credit fees. Other income increased $661,000, or 18.1%, to $4.3 million in 2007, from $3.7 million in 2006. The comparative improvement in 2007 performance was primarily due to increased levels of fee income from processing of merchant credit card sales combined with annuity sales, mutual fund and letter of credit fees.
Non-interest expense
Non-interest expense was $80.3 million during 2008, an increase of $13.9 million, or 20.8%, from $66.5 million in the prior year. Approximately $881,000 of the aggregate non-interest expense increase was related to one-time merger costs and $492,000 of that amount was related to personnel costs. Non-interest expense totaled $65.1 million in 2006. The efficiency ratio, which is a non-GAAP measure, was 62.0%, 64.5%, and 63.3%, for December 31, 2008, 2007, and 2006, respectively. This ratio measures non-interest expense as a percentage of the sum of net tax-equivalent interest income plus non-interest income. Because a financial institution’s largest non-interest expense is generally the cost of salary and benefits, management of this cost has a significant impact on efficiency. Salaries and benefits expense was $44.5 million during the twelve months ended December 31, 2008, an increase of $6.4 million, or 16.8%, from $38.1 million for 2007. The 2008 increase in personnel expenses related to normal annual increases in compensation rates and increased staffing levels that included the addition of 57 full time equivalent (“FTE”) employees from Heritage. Accordingly, the FTE count rose from 541 in the fourth quarter of 2007 to 615 in the fourth quarter of 2008. The 2008 expense for the discretionary profit sharing, stock compensation and management bonus plans also increased in part due to the FTE increase from the acquisition. The 2008 commission expense related to mortgage loan sales activity increased substantially with the increased income from that line of business. In 2007, salaries and benefits were $38.1 million compared to $35.9 million in 2006, an increase of $2.2 million or 6.2%. The increase in expense in 2007 was primarily due to increases in bonus expense and profit sharing accruals as well as increases in mortgage and brokerage commissions coupled with increases in stock compensation and health insurance costs. The FTE count in the fourth quarter of 2006 was 582 and the decrease in employee count to 541 in the fourth quarter of 2007 was primarily due to the 8.5% reduction in available positions that was announced in April of 2007. The Company moved away from the defined benefit pension plan that was settled with the $1.5 million loss that was recorded in 2006 to the 401K and profit sharing structure adopted in 2007, which continued in 2008. Even though the profit sharing percentage decreased in 2008 as compared to 2007, the cost of that plan increased due in part to the increased number of employees discussed above.
Furniture and equipment expenses were $6.9 million in 2008, $6.4 million in 2007, and $5.3 million in 2006. In 2008, net occupancy and furniture and equipment expenses increased $1.1 million, or 9.0%, from 2007, whereas in 2007 it increased $1.9 million, or 19.7%, from 2006. On a comparative basis, facility expense in 2008 incorporated a full year of expense for one new retail branch that opened in May 2007, the relocation of a leasehold facility to an owned location in the third quarter of 2008, as well as the addition of five Heritage retail locations in February 2008. An additional $55,000 was due to a one-time settlement charge to close a leased mortgage origination office that was vacated in the first quarter of 2008. The largest category increases in occupancy expense for the year to date period, however, were for real estate taxes and maintenance expenses. Furniture and fixture costs increased $294,000 due to one-time conversion costs related to the acquisition. This category also increased due to systems enhancements, including expanded off site systems recovery infrastructure. In 2007, the increases from 2006 were primarily attributable to the combined effect of the Company’s expansion and development into new markets, network and system integration costs from a July bank charter consolidation, and third and fourth quarter 2007 recognition of accelerated leasehold depreciation and other associated impaired asset expense. The latter expense resulted primarily from the July 2007 closing of three leased branches that had market overlap with existing locations. The Company opened five new retail locations in 2006 and a new location on the western edge of Elgin in May 2007, which also increased the related 2007 facility expenses as compared to 2006.
Amortization of core deposit and other intangible assets totaled $1.1 million in 2008 and $355,000 in 2006. The 2008 resumption in amortization resulted from the February 2008 acquisition of Heritage, whereas the intangible asset amortization from prior acquisitions had been fully recognized as of December 31, 2006. Advertising expenses were $2.0 million in 2008, $1.6 million in 2007, and $2.1 million in 2006. There was an increase in marketing initiatives in 2008, which included $29,000 in one time acquisition costs as well increased direct mail costs, a grand opening celebration for a new location as well as a general increase in sponsorship of local community events.
52
Management’s Discussion – continued
Other expenses were $19.8 million in 2008, $15.0 million in 2007, and $15.5 million in 2006. A major factor in the 2008 increase was the resumption of Federal Deposit Insurance Corporation (“FDIC”) insurance premiums as available credits expired in 2007. Additionally, in response to the crisis affecting the U.S. banking system and financial markets, the U.S. Congress passed, and the President signed into law, the Emergency Economic Stabilization Act of 2008 (the “Stabilization Act”). This Act authorized the Secretary of the U.S. Treasury and the FDIC to implement various temporary emergency programs to improve confidence in the financial system. As a result of all the above events, including the Company’s decision to opt into the extended deposit insurance programs developed under the Stabilization Act, the FDIC deposit insurance premium was $1.5 million in 2008 as compared to nothing in 2007. This premium amount also included the estimated cost to increase the amount of insurance coverage on deposit accounts held at Old Second National Bank generally, from $100,000 to $250,000 as well as providing unlimited coverage on certain no and low interest transaction accounts. Expanded disclosures related to deposit insurance coverage are available at the FDIC website as well as the retail offices of the Bank. The increased coverage is effective during the period from October 3, 2008 until December 31, 2009.
In addition to the FDIC related expenses described above, other expense increased $512,000 due to a mortgage servicing rights net impairment that was recognized in 2008 as compared to a $63,000 net recovery that was recorded in 2007. The net impairment amount recognized in 2006 was $150,000. Annual expenses related to telephone, loan valuation and collection related activity and debit card processing costs also increased in 2008 as compared to prior years. Correspondent bank fees also increased through much of 2008 as the earnings credits declined with the general decline in market interest rates. Other expenses decreased generally in 2007 as compared to 2006 due in large part to reductions in other employee related expenditures such as recruitment and travel as well as decreased audit fees.
Income taxes
The Company’s provisions for Federal and State of Illinois income taxes were $2.3 million, $8.8 million, and $9.9 million during the years ended December 31, 2008, 2007, and 2006, respectively. The effective income tax rates for these years were 16.4%, 26.9%, and 29.4%, respectively. With the lower level of earnings in 2008, the portion of earnings that was taxable declined significantly in comparison to 2007 and 2006. There were also changes in the state tax structure in 2008 as compared to 2007. Under the revised tax law, OSM, an investment subsidiary of the Bank, no longer qualifies as an excluded company and its receipts now require inclusion in the unitary tax return. This change was offset somewhat by a decline in the apportionment factor in 2008 as compared to 2007. The reduction in effective tax rate in 2007 as compared to 2006 was due in large part to the formation of OSM in the fourth quarter of 2006.
The above Illinois tax law revision also changed the deductibility of real estate investment trust (“REIT”) dividends beginning January 1, 2009, which will eliminate the recognition of a substantial portion of the tax benefits related to this ownership structure. OSM owns 100% of the common stock of a REIT, which holds fixed and variable rate real estate loans that were previously held by the Bank subsidiary. The general decrease in market and loan portfolio interest rates lowered the amount of interest income generated by the REIT in 2008, as did a decrease in the loan balances and an increase in provision expense recognized by that subsidiary. In addition to providing income tax benefits, which lowered the effective tax rate, the REIT ownership structure also provides the Company with a vehicle for raising future capital as desired.
Financial condition
Total assets were $2.98 billion as of December 31, 2008, an increase of $326.0 million, or 12.3%, from $2.66 billion as of December 31, 2007. The most significant growth in assets was in loans, which were $2.27 billion as of December 31, 2008, an increase of $380.0 million, or 20.1%, from $1.89 billion as of December 31, 2007. Heritage contributed $286.6 million of that increase at the February acquisition date. Securities available for sale decreased $154.5 million during 2008 and served to provide funding for loan growth. Total deposits were $2.39 billion as of December 31, 2008 an increase of $273.5 million, or 12.9%, from $2.11 billion as of December 31, 2007, also due in large part to the acquisition. The largest change in funding, however, was a decrease in federal funds purchased of $136.2 million, or 82.5%, during 2008. In addition to the $45.0 million in subordinated debt obtained in conjunction with the acquisition, other short-term debt, primarily Federal Home Loan Bank advances, also increased to $169.4 million at December 31, 2008, an increase of $86.5 million, or 104.4%, from $82.9 million at December 31, 2007.
Investments
Securities available-for-sale decreased $154.5 million during 2008, from $560.9 million as of December 31, 2007, to $406.4 million as of December 31, 2008. At December 31, 2008, U.S. government agency securities and mortgage-backed agency securities were $96.4 million and $87.3 million, respectively. The Company decreased its position in agency securities by $114.2 million, or 54.2%, as of December 31, 2008 while it simultaneously decreased mortgage-backed agency securities by $9.6 million, or 9.9%. U.S. government agency securities comprised 23.7% of the portfolio as of December 31, 2008, and 37.5% of the portfolio as of December 31, 2007 whereas the mortgage-backed agency securities represented 21.5% and 17.3% of the investment portfolio as of the same dates. As of December 31, 2008, the Company held $59.3 million in collateralized mortgage obligations versus $73.9 million at December 31, 2007. The largest dollar investment category decreases were in United States government agency and United States government agency mortgage-backed as well as collateralized mortgage-backed securities. All of the decreases were largely due to the increased volume of called securities and mortgage pass-
53
Management’s Discussion – continued
through payments received in a declining rate environment. At December 31, 2008, state and political subdivision securities totaled $151.6 million, a decrease of $8.2 million, or 5.1%, from $159.8 million at December 31, 2007. State and political subdivision securities comprised 37.3% of the portfolio as of December 31, 2008, compared to 28.5% of the portfolio as of December 31, 2007. At December 31, 2008, U.S. Treasury Securities were $1.6 million, a decrease of $8.6 million, or 84.6%, from $10.2 million at December 31, 2007, primarily due to security sales. Collateralized debt obligations increased slightly in 2008 to $10.3 at December 31, 2008 from $9.5 million at December 31, 2007 despite a sale in the second quarter of 2008. As mentioned above, the cash flows from the security calls, prepayments, maturities and sales were generally used to fund loan growth. The net unrealized losses in the portfolio were $3.4 million at December 31, 2008 as compared to net unrealized gains of $3.3 million as of December 31, 2007, primarily due to changes in interest rates although there was a decline in the value of the collateralized debt obligations due to declines in market liquidity despite no deterioration in credit quality at December 31, 2008.
Loans
Total loans were $2.27 billion as of December 31, 2008, an increase of $380.0 million, or 20.1%, from $1.89 billion as of December 31, 2007. The loan portfolio increase included organic portfolio growth as well as the $286.6 million in loans that were acquired in the Heritage acquisition. Heritage had a portfolio distribution similar to the Company and the types of loans held in the portfolio did not change dramatically in 2008. The following comparisons are based upon revised 2007 classification totals whereby construction balances were decreased $27.3 million and commercial real estate was increased by a like amount. The largest category increase was in commercial real estate loans, which rose $268.4 million, or 40.6%, since December 31, 2007. Residential real estate and commercial and industrial loan sector increased $67.0 million and $46.9 million, respectively, since December 31, 2007.
The loan portfolio generally reflects the profile of the communities in which the Company operates, and the local economy has been affected by the overall decline in economic conditions including real estate related activity and valuations. Because the Company is located in growth areas with significant open space, real estate lending (including commercial, residential, and construction) has been and continues to be a sizeable portion of the portfolio. As noted previously, a substantial portion of the loan growth in 2008 was acquired in the Heritage transaction and its loan portfolio mix also had a substantial real estate component. These categories comprised 88.3% of the portfolio as of December 31, 2008 compared to 88.2% of the portfolio as of December 31, 2007. The construction and development loan sector also increased $1.9 million, or 0.52%, to $373.7 million at December 31, 2008, from $371.8 million at December 31, 2007. At the same time, installment loans and lease financing receivables decreased $4.1 million, or 14.4%, to $24.3 million from $28.4 million at December 31, 2007. The 2008 loan growth was substantially from within the Company’s market area including a nominal amount of participations purchased.
The provision for loan losses was $30.3 million and $1.2 million in 2008 and 2007, respectively. As discussed in the Provision for Loan Losses section above, management concluded that the increase in the amount of nonperforming loans and net charge-offs in 2008, combined with the prolonged deceleration in real estate building and development activity as compared to prior years represented increased risk that warranted higher provisioning. Accordingly, management increased the qualitative loan factors related to estimating the provision for loan losses. These factors along with increased specific allocations contributed to the increase in the provision for 2008 compared to 2007.
One measure of the adequacy of the allowance for loan losses is the ratio of the allowance to total loans. The allowance for loan losses as a percentage of total loans was 1.82% as of December 31, 2008, compared to 0.89% as of December 31, 2007. In management’s judgment, an adequate allowance for estimated losses has been established; however, there can be no assurance that losses will not exceed the estimated amounts in the future.
Management, along with many other financial institutions, remains cautious about the current economic environment and outlook. Furthermore, the sustained slowdown in the real estate market could continue to adversely affect consumer confidence and collateral values. These events adversely affect cash flows generally for both commercial and individual borrowers, and as a result, the Company could continue to experience increases in problem assets, delinquencies, and losses on loans in future periods.
Other Assets
Other real estate owned (“OREO”) totaled $15.2 million at December 31, 2008. Of this amount, $12.6 million is attributable to one project that was acquired in December 2008 in satisfaction of the outstanding debt. That project is comprised of residential townhomes, residential townhome lots, lots zoned for condominiums, and lots zoned for retail. Management based the estimated value of these assets primarily upon recent appraisals. The remaining OREO consists of $1.3 million in residential lots located in four different communities, $360,000 in a single commercial building, and $1.0 million in five single-family residences.
Goodwill and other intangible assets are reviewed for potential impairment on an annual basis, or more often if events or circumstances indicate that there may be impairment, in accordance with SFAS No. 142, “Goodwill and Other Intangible Assets and SFAS No. 144, “Accounting for the Impairment or Disposal of Long-Lived Assets.” Goodwill is tested for impairment at the reporting unit level and an impairment loss is recorded to the extent that the carrying amount of goodwill exceeds its implied fair value. The Company employs general industry practices in evaluating the impairment of its goodwill and
54
Management’s Discussion – continued
other intangible assets. The Company calculates the value of goodwill using a combination of the following valuation methods: dividend discount analysis under the income approach, which calculates the present value of all excess cash flows plus the present value of a terminal value, the price/earnings multiple under the market approach and the change in control premium to market price approach. Management performed its annual review of goodwill at September 30, 2008 and updated that review at December 31, 2008, as the stock prices in the financial services sector generally remained out of favor. Based upon these reviews, management determined there was no impairment of goodwill as of December 31, 2008. No assurance can be given that future impairment tests will not result in a charge to earnings. Goodwill and core deposit and other intangible assets related to Heritage were $56.9 million and $8.9 million at acquisition. Additional information related to goodwill and other intangible assets is found in Note H of the financial statements included in this annual report.
Liquidity
Total deposits increased $273.5 million, or 12.9%, during 2008 to $2.39 billion as of December 31, 2008. In February 2008, the Company acquired $294.4 million of deposit growth through the acquisition of Heritage. Non-interest-bearing deposits increased $46.5 million, or 17.1%, while lower cost sources of funds such as NOW and savings deposits increased $27.6 million, or 11.2%, and $13.6 million, or 14.1%, respectively. At the same time, money market accounts increased $37.6 million, or 7.4%. In 2008, time deposits increased $148.1 million, or 14.9% in part, from the certificates of deposit acquired from Heritage, as well as customers moving to lock in interest rates in a declining interest rate environment. To enhance future deposit growth and retention, the Company also opted to participate in the enhanced FDIC insurance coverage that became available in November 2008 and is set to expire in December 2009.
The most significant borrowing in 2008 occurred on January 31, 2008, when the Company entered into a $75.5 million credit facility with LaSalle Bank National Association (now Bank of America). Part of this new credit facility replaced a $30.0 million revolving line of credit facility previously held between the Company and Marshall & Ilsley Bank and was not a significant source of new funds. The $75.5 million credit facility was comprised of a $30.5 million senior debt facility and $45.0 million of new subordinated debt. The proceeds of the $45.0 million of subordinated debt issuance were used to finance the Heritage acquisition costs and qualify as Tier 2 regulatory capital. Additional terms related to the Bank of America credit facility are discussed in Note K of the financial statements included in this annual report. Other major borrowing category changes from December 31, 2007 included a decrease of $136.2 million, or 82.5%, in overnight federal funds purchased and an $87.0 million increase in short term Federal Home Loan Bank of Chicago (“FHLBC”) advances, which was included in other short-term borrowings. The cost of interest-bearing liabilities decreased substantially in 2008, from 4.16% to 2.85%, or 131 basis points, which significantly improved the net interest margin.
Capital
Total stockholders’ equity increased $43.2 million, or 28.8%, to $193.1 million during 2008, from $149.9 million as of December 31, 2007. Net income of $11.8 million, reduced by dividends of $8.7 million, increased retained earnings to $213.0 million as of December 31, 2008. In the same year, a $4.0 million change to a $2.0 million net unrealized securities loss position from a $2.0 million net unrealized securities gain position at December 31, 2007, combined with the 2008 incurrence of a $95,000 net unrealized loss on a cash flow hedge decreased stockholders’ equity. In 2007 retained earnings increased by net income of $24.0 million, less dividends of $7.3 million. During 2007, a $4.5 million change to a $2.0 million net unrealized securities gain position from a $2.5 million net unrealized securities loss position at December 31, 2006 also increased stockholders’ equity.
Treasury repurchase activity in 2008 decreased significantly from 2007. The Company is limited in its ability to repurchased shares in the future because of restrictions imposed by the United States Department of Treasury as a result of the Company’s participation in the Capital Purchase Program. The Company repurchased 2,968 shares in 2008, resulting in an increase in treasury stock to 4,548,447 shares as of December 31, 2008. The repurchase of these shares increased treasury stock by $41,000 or less than 0.1% at December 31, 2008. The Company had repurchased 1,038,251 shares in 2007, resulting in an increase in treasury stock to 4,545,479 shares as of December 31, 2007. The repurchase of these shares increased treasury stock by $31.2 million, or 49.2%, to $94.8 million at December 31, 2007. Treasury stock repurchased decreases stockholders’ equity, but also increases earnings per share by reducing the number of shares outstanding. Return on average equity was 6.03%, 16.13%, and 15.29% in 2008, 2007, and 2006, respectively.
The Company issued 1,563,636 shares of Company stock valued at $27.50 per share to consummate the acquisition of Heritage on February 8, 2008 and this issuance contributed $43.0 million to stockholders’ equity in 2008. Additionally, the exercise of stock options, related tax benefit, and stock-based compensation expense contributed $1.2 million and $1.4 million to stockholders’ equity in 2008 and 2007, respectively.
The Company completed a sale of $31.6 million of cumulative trust preferred securities by its subsidiary, Old Second Capital Trust I (Nasdaq: OSBCP), in July 2003. The trust preferred securities remain outstanding for a 30-year term but, subject to regulatory approval, they can be called in whole or in part at the Company’s discretion after an initial five-year period, which has since passed. The Company does not currently intend on seeking regulatory approval to call these securities. Dividends are payable quarterly at an annual rate of 7.80% and are included in interest expense in
55
Management’s Discussion – continued
the consolidated financial statements. The Company issued an additional $25.0 million of cumulative trust preferred securities through a private placement completed by its new unconsolidated subsidiary, Old Second Capital Trust II (“the Trust”) in April 2007. These trust preferred securities also mature in 30 years, but subject to the aforementioned regulatory approval, can be called in whole or in part in 2017. The quarterly cash distributions on the securities are fixed at 6.766% through June 15, 2017 and float at 150 basis points over the British Bankers Association three-month LIBOR rate thereafter. Trust preferred proceeds of $56.6 million are held by outside investors and qualified as Tier 1 regulatory capital as of December 31, 2008. Additionally, the $45.0 million in subordinated debt that was obtained to finance the February acquisition qualified as Tier 2 regulatory capital as of December 31, 2008. At December 31, 2007, trust preferred proceeds of $49.3 million qualified as Tier 1 regulatory capital and $6.5 million qualified as Tier 2 regulatory capital.
Bank regulatory agencies have adopted capital standards by which all banks and bank holding companies are evaluated. The Company and Old Second National Bank were each categorized as “well capitalized” as of both December 31, 2008 and 2007. Additional information regarding capital levels and minimum required levels can be found in Note S of the financial statements included in this annual report. Additional information related to the amount and form of consideration paid to consummate the February 8, 2008 acquisition of Heritage is outlined in Note B of the financial statements included in this annual report, whereas information on borrowing related to that transaction is outlined in Note K of the financial statements included in this annual report.
As discussed in the recent developments section of this document, the Company announced on January 16, 2009 that the Treasury had completed its investment of $73 million in Series B fixed rate cumulative perpetual preferred stock and warrants to purchase common stock of the Company as part of Treasury’s TARP CPP. The $73.0 million received by the Company in connection with this investment qualifies as Tier 1 regulatory capital.
Quantitative and qualitative disclosure about market risk
Liquidity and market risk
Liquidity is the Company’s ability to fund operations, to meet depositor withdrawals, to provide for customer’s credit needs, and to meet maturing obligations and existing commitments. The liquidity of the Company principally depends on cash flows from operating activities, investment in and maturity of assets, changes in balances of deposits and borrowings, and its ability to borrow funds. The Company monitors and tests borrowing capacity at correspondent banks as well as the Federal Home Loan Bank and Federal Reserve Banks of Chicago as part of its liquidity management process.
Additionally, the $73.0 million cash proceeds from the Treasury discussed immediately above is a new source of liquidity that became available to the Company in January 2009.
Net cash inflows from operating activities were $41.7 million during 2008, compared with $13.9 million in 2007. Proceeds from sale of loans held-for-sale, net of funds used to originate loans held-for-sale, were a source of inflow for 2007 and outflow for 2008. Interest received, net of interest paid, combined with changes in other assets and liabilities were a source of outflow for 2007 and inflow for 2008. Management of investing and financing activities, as well as market conditions, determines the level and the stability of net interest cash flows. Management’s policy is to mitigate the impact of changes in market interest rates to the extent possible, so that balance sheet growth is a principal determinant of growth in net interest cash flows.
Net cash inflows from investing activities, which included cash paid for the net assets acquired from Heritage as detailed in the supplemental cash flow information, were $28.1 million in 2008, compared to net cash outflows of $214.6 million in 2007. The cash paid for the acquisition, net of cash and cash equivalents retained, was $38.9 million. In 2008, securities transactions accounted for a net inflow of $190.1 million, and net principal disbursed on loans accounted for net outflows of $117.4 million. In 2007, securities transactions accounted for a net outflow of $79.5 million, and net principal disbursed on loans accounted for net outflows of $127.7 million. Additionally, while not large in amount, the purchase of FHLBC stock increased the Company’s borrowing privileges as outlined in Note K of the financial statements included in this annual report. Cash outflows for property and equipment were $6.1 million in 2008 compared to $6.5 million in 2007.
Net cash outflows from financing activities in 2008, were $61.3 million, and the deposit, borrowing and other liabilities that were assumed in the Heritage acquisition are enumerated in the supplemental cash flow information provided. Significant cash outflows from financing activities in 2008 included reductions of $153.3 million and $20.8 million in federal funds purchased and net decreases in customer deposits, respectively. The largest financing cash inflows in 2008 were $82.4 million in other short-term borrowings, which consists primarily of Federal Home Loan Bank advances. Additionally, $45.0 million in subordinated debt proceeds were used to finance the Heritage acquisition. Details related to the financing of the Heritage transaction and other borrowings are provided in Note K of the financial statements included in this annual report. Cash inflows from financing activities in 2007 were $176.9 million, which included net increases in customer deposits and federal funds purchased of $50.9 million and $111.1 million, respectively. Proceeds from the issuance of junior subordinated debentures also increased funding $25.8 million in 2007. The largest financing outflow in 2007 was the $31.2 million paid to purchase treasury stock.
56
Management’s Discussion – continued
Net cash inflows from operations were $38.2 million during 2006. Net cash outflows from investing activities were $71.8 million in 2006, primarily as a result of $59.9 million in net principal disbursed on loans. Net cash outflows relating to securities available-for-sale were $1.6 million. Net cash inflows from financing activities were $57.0 million in 2006, which included a net increase in deposits of $127.4 million and other short-term borrowings of $71.3 million. The largest financing decrease in 2006 was the net change in federal funds purchased. The proceeds of $13.2 million from the note payable were used primarily to repurchase the Company’s treasury shares.
Interest rate risk
As part of its normal operations, the Company is subject to interest-rate risk on the assets it invests in (primarily loans and securities) and the liabilities it funds with (primarily customer deposits and borrowed funds), as well as its ability to manage such risk. Fluctuations in interest rates may result in changes in the fair market values of the Company’s financial instruments, cash flows, and net interest income. Like most financial institutions, the Company has an exposure to changes in both short-term and long-term interest rates.
The Company manages various market risks in its normal course of operations, including credit, liquidity and interest-rate risk. Other types of market risk, such as foreign currency exchange risk and commodity price risk, do not arise in the normal course of the Company’s business activities and operations. In addition, since the Company does not hold a trading portfolio, it is not exposed to significant market risk from trading activities. The changes in the Company’s interest rate risk exposures from December 31, 2007 are outlined in the table below.
Like most financial institutions, the Company’s net income can be significantly influenced by a variety of external factors, including: overall economic conditions, policies and actions of regulatory authorities, the amounts of and rates at which assets and liabilities reprice, variances in prepayment of loans and securities other than those that are assumed, early withdrawal of deposits, exercise of call options on borrowings or securities, competition, a general rise or decline in interest rates, changes in the slope of the yield-curve, changes in historical relationships between indices (such as LIBOR and prime), and balance sheet growth or contraction. The Company’s asset and liability committee seeks to manage interest rate risk under a variety of rate environments by structuring the Company’s balance sheet and off-balance sheet positions, which includes interest rate swap derivatives as discussed in Note W of the financial statements included in this annual report. The risk is monitored and managed within approved policy limits.
The Company utilizes simulation analysis to quantify the impact on income before income taxes under various rate scenarios. Specific cash flows, repricing characteristics, and embedded options of the assets and liabilities held by the Company are incorporated into the simulation model. Earnings at risk is calculated by comparing the income before income taxes of a stable interest rate environment to the income before income taxes of a different interest rate environment in order to determine the percentage change. The Company had less net interest income at risk exposure at December 31, 2008, due in part, to the balance sheet changes that resulted from the addition of Heritage. Given the Company’s mix of negatively gapped interest earning assets and interest bearing liabilities at December 31, 2007, the net interest margin was generally positioned to increase in 2008, which exhibited a declining rate environment throughout the year. The Federal Open Market Committee decreased the target for the Federal Funds rate by announcing a series of interest rate cuts in 2008. These decreases lowered the target rate from 4.25% at January 1, 2008 to 0.25% at December 31, 2008. The Bank’s prime rate decreased in correlation with the Federal Funds rate, moving from 7.25% on January 1, 2008 to 3.25% on December 31, 2008. While interest costs associated with generating deposit growth and other sources of funds in 2008 increased funding costs, these increases were more than offset by the amount of liabilities that repriced with the general decreases in market rates.
The following table summarizes the affect on annual income before income taxes based upon an immediate increase or decrease in interest rates of 50, 100, and 200 basis points and no change in the slope of the yield curve. The December 31, 2008 section of the table does not show model changes for a 200 basis point decrease due to the low interest rate environment at that time:
Analysis of Net Interest Income Sensitivity
| | Immediate Changes in Rates | |
| | -200 | | +200 | | -100 | | +100 | | -50 | | +50 | |
December 31, 2008: | | | | | | | | | | | | | |
Dollar change | | N/A | | $ | 442 | | $ | (1,951 | ) | $ | 401 | | $ | (1,061 | ) | $ | 285 | |
Percent change | | N/A | | +0.5 | % | -2.3 | % | +0.5 | % | -1.2 | % | +0.3 | % |
| | | | | | | | | | | | | |
December 31, 2007: | | | | | | | | | | | | | |
Dollar change | | $ | 7,347 | | $ | (12,647 | ) | $ | 4,775 | | $ | (6,138 | ) | $ | 2,636 | | $ | (2,720 | ) |
Percent change | | +9.7 | % | -16.6 | % | +6.3 | % | -8.1 | % | +3.5 | % | -3.6 | % |
| | | | | | | | | | | | | | | | | | | |
57
Management’s Discussion – continued
The amounts and assumptions used in the simulation model should not be viewed as indicative of expected actual results. Actual results will differ from simulated results due to timing, magnitude and frequency of interest rate changes as well as changes in market conditions and management strategies. The above results do not take into account any management action to mitigate potential risk.
Effects of inflation
In management’s opinion, changes in interest rates affect the financial condition of a financial institution to a far greater degree than changes in the inflation rate. While interest rates are greatly influenced by changes in the inflation rate, they do not change at the same rate or in the same magnitude as the inflation rate. Rather, interest rate volatility is based on changes in the expected rate of inflation, as well as on changes in monetary and fiscal policies. A financial institution’s ability to be relatively unaffected by changes in interest rates is a good indicator of its capability to perform in today’s volatile economic environment. The Company seeks to insulate itself from interest rate volatility by ensuring that rate sensitive assets and rate sensitive liabilities respond to changes in interest rates in a similar time frame and to a similar degree.
Off-balance sheet arrangements
Contractual Obligations, Commitments, Contingent Liabilities, and Off-Balance Sheet Arrangements
The Company has various financial obligations that may require future cash payments. The following table presents, as of December 31, 2008, significant fixed and determinable contractual obligations to third parties by payment date.
| | Within One Year | | One to Three Years | | Three to Five Years | | Over Five Years | | Total | |
Deposits without a stated maturity | | $ | 1,246,296 | | $ | — | | $ | — | | $ | — | | $ | 1,246,296 | |
Certificates of deposit | | 882,830 | | 198,470 | | 59,298 | | 235 | | 1,140,832 | |
Securities sold under repurchase agreements | | 46,345 | | — | | — | | — | | 46,345 | |
Federal funds purchased | | 28,900 | | — | | — | | — | | 28,900 | |
Other short-term borrowings | | 169,383 | | — | | — | | — | | 169,383 | |
Junior subordinated debentures | | — | | — | | — | | 58,378 | | 58,378 | |
Subordinated debt | | — | | — | | — | | 45,000 | | 45,000 | |
Notes payable and other borrowings | | — | | 22,684 | | — | | 500 | | 23,184 | |
Purchase obligations | | 1,218 | | 620 | | 99 | | — | | 1,937 | |
Operating leases | | 108 | | 137 | | 93 | | 194 | | 532 | |
Nonqualified voluntary deferred compensation | | 156 | | 645 | | 349 | | 492 | | 1,642 | |
Total | | $ | 2,374,493 | | $ | 223,298 | | $ | 59,839 | | $ | 104,799 | | $ | 2,762,429 | |
Purchase obligations represent obligations under agreements to purchase goods or services that are enforceable and legally binding on the Company and that specify all significant terms, including: fixed or minimum quantities to be purchased; fixed, minimum or variable price provisions; and the approximate timing of the transaction. The purchase obligation amounts presented above primarily relate to certain contractual payments for services provided for information technology, capital expenditures, and the outsourcing of certain operational activities.
Commitments: The following table details the amounts and expected maturities of significant commitments to extend credit as of December 31, 2008:
| | Within
One Year | | One to
Three Years | | Three to
Five Years | | Over
Five Years | | Total | |
Commitment to extend credit: | | | | | | | | | | | |
Commercial secured by real estate | | $ | 67,779 | | $ | 21,698 | | $ | 25,234 | | $ | 4,296 | | $ | 119,007 | |
Revolving open end residential | | 4,169 | | 9,256 | | 40,326 | | 109,272 | | 163,023 | |
Other | | 141,952 | | 11,678 | | 517 | | 1,861 | | 156,008 | |
Financial standby letters of credit | | 15,453 | | 6,031 | | — | | — | | 21,484 | |
Performance standby letters of credit | | 26,954 | | 1,328 | | — | | — | | 28,282 | |
Commercial letters of credit | | 2,647 | | 10,494 | | — | | — | | 13,141 | |
Total | | $ | 258,954 | | $ | 60,485 | | $ | 66,077 | | $ | 115,429 | | $ | 500,945 | |
In addition to the above obligations and commitments, the Company also has interest rate derivatives that include a risk participation agreement. Details on these interest rate swap agreements are found in Note W of the financial statements included in this annual report.
58
Management’s Discussion – continued
Controls and procedures
The Chief Executive Officer and Chief Financial Officer have evaluated the effectiveness of the design and operation of the Company’s disclosure controls and procedures, as defined in Rule 13a-15(e) promulgated under the Securities and Exchange Act of 1934, as amended, as of December 31, 2008. Based on that evaluation, the Chief Executive Officer and Chief Financial Officer concluded that as of December 31, 2008 the Company’s disclosure controls and procedures designed to ensure that information required to be disclosed by an issuer in the reports that it files or submits under the Act is accumulated and communicated to the issuer’s management, including its principal executive and principal financial officers, as appropriate to allow timely decisions regarding required disclosure.
Special note concerning forward-looking statements
This document (including information incorporated by reference) contains, and future oral and written statements of the Company and its management may contain, forward-looking statements, within the meaning of such term in the Private Securities Litigation Reform Act of 1995, with respect to the financial condition, results of operations, plans, objectives, future performance and business of the Company. Forward-looking statements, which may be based upon beliefs, expectations and assumptions of the Company’s management and on information currently available to management, are generally identifiable by the use of words such as “believe,” “expect,” “anticipate,” “plan,” “intend,” “estimate,” “may,” “will,” “would,” “could,” “should” or other similar expressions. Additionally, all statements in this document, including forward-looking statements, speak only as of the date they are made, and the Company undertakes no obligation to update any statement in light of new information or future events.
The Company’s ability to predict results or the actual effect of future plans or strategies is inherently uncertain. Factors that could have a material adverse effect on the operations and future prospects of the Company and its subsidiaries include, but are not limited to, those set forth under item 1. A “Risk Factors” of the Form 10-K and as set forth below:
· The strength of the United States economy in general and the strength of the local economies in which the Company conducts its operations which may be less favorable than expected and may result in, among other things, a deterioration in the credit quality and value of the Company’s assets.
· Credit risks and the risks from concentrations (by geographic area and by industry) within the Company’s loan portfolio.
· The economic impact of past and any future terrorist attacks, acts of war or threats thereof and the response of the United States to any such threats and attacks.
· The effects of, and changes in, federal, state and local laws, regulations and policies affecting banking, securities, insurance and monetary and financial matters.
· The effects of changes in interest rates (including the effects of changes in the rate of prepayments of the Company’s assets) and the policies of the Board of Governors of the Federal Reserve System.
· The ability of the Company to compete with other financial institutions as effectively as the Company currently intends due to increases in competitive pressures in the financial services sector.
· The inability of the Company to obtain new customers and to retain existing customers.
· The timely development and acceptance of products and services, including products and services offered through alternative delivery channels such as the Internet.
· Technological changes implemented by the Company and by other parties, including third party vendors, which may be more difficult or more expensive than anticipated or which may have unforeseen consequences to the Company and its customers.
· The ability of the Company to develop and maintain secure and reliable electronic systems.
· The ability of the Company to retain key executives and employees and the difficulty that the Company may experience in replacing key executives and employees in an effective manner.
· Consumer spending and saving habits which may change in a manner that affects the Company’s business adversely.
· Business combinations and the integration of acquired businesses, which may be more difficult or expensive than expected.
· The costs, effects and outcomes of existing or future litigation.
· Changes in accounting policies and practices, as may be adopted by state and federal regulatory agencies and the Financial Accounting Standards Board, the Public Company Accounting Oversight Board, and the Securities and Exchange Commission.
· The ability of the Company to manage the risks associated with the foregoing as well as anticipated.
These risks and uncertainties should be considered in evaluating forward-looking statements and undue reliance should not be placed on such statements.
59
Old Second Bancorp, Inc.
and Subsidiaries
Consolidated Statements
& Notes to Consolidated
Financial Statements
60
Old Second Bancorp, Inc. and Subsidiaries
Consolidated Balance Sheets
December 31, 2008 and 2007
(In thousands, except share data)
| | 2008 | | 2007 | |
Assets | | | | | |
Cash and due from banks | | $ | 66,099 | | $ | 60,804 | |
Interest bearing deposits with financial institutions | | 809 | | 403 | |
Federal funds sold | | 5,497 | | 2,370 | |
Short-term securities available-for-sale | | 809 | | 1,162 | |
Cash and cash equivalents | | 73,214 | | 64,739 | |
Securities available-for-sale | | 405,577 | | 559,697 | |
Federal Home Loan Bank and Federal Reserve Bank stock | | 13,044 | | 8,947 | |
Loans held-for-sale | | 23,292 | | 16,677 | |
Loans | | 2,271,114 | | 1,891,110 | |
Less: allowance for loan losses | | 41,271 | | 16,835 | |
Net loans | | 2,229,843 | | 1,874,275 | |
Premises and equipment, net | | 62,522 | | 49,698 | |
Other real estate owned | | 15,212 | | — | |
Mortgage servicing rights, net | | 1,374 | | 2,482 | |
Goodwill | | 59,040 | | 2,130 | |
Core deposit and other intangible assets, net | | 7,821 | | — | |
Bank-owned life insurance (BOLI) | | 48,754 | | 47,936 | |
Accrued interest and other assets | | 44,912 | | 31,995 | |
Total assets | | $ | 2,984,605 | | $ | 2,658,576 | |
| | | | | |
Liabilities | | | | | |
Deposits: | | | | | |
Non-interest bearing demand | | $ | 318,092 | | $ | 271,549 | |
Interest bearing: | | | | | |
Savings, NOW, and money market | | 928,204 | | 849,365 | |
Time | | 1,140,832 | | 992,704 | |
Total deposits | | 2,387,128 | | 2,113,618 | |
Securities sold under repurchase agreements | | 46,345 | | 53,222 | |
Federal funds purchased | | 28,900 | | 165,100 | |
Other short-term borrowings | | 169,383 | | 82,873 | |
Junior subordinated debentures | | 58,378 | | 57,399 | |
Subordinated debt | | 45,000 | | — | |
Notes payable and other borrowings | | 23,184 | | 18,610 | |
Accrued interest and other liabilities | | 33,191 | | 17,865 | |
Total liabilities | | 2,791,509 | | 2,508,687 | |
| | | | | |
Stockholders’ Equity | | | | | |
Preferred stock, $1.00 par value; authorized 300,000 shares; none issued | | — | | — | |
Common stock, $1.00 par value; authorized 20,000,000 shares; issued 18,304,331 in 2008 and 16,694,775 in 2007, outstanding 13,755,884 in 2008 and 12,149,296 in 2007 | | 18,304 | | 16,695 | |
Additional paid-in capital | | 58,683 | | 16,114 | |
Retained earnings | | 213,031 | | 209,867 | |
Accumulated other comprehensive (loss) income | | (2,123 | ) | 1,971 | |
Treasury stock, at cost, 4,548,447 shares in 2008 and 4,545,479 shares in 2007 | | (94,799 | ) | (94,758 | ) |
Total stockholders’ equity | | 193,096 | | 149,889 | |
Total liabilities and stockholders’ equity | | $ | 2,984,605 | | $ | 2,658,576 | |
See accompanying notes to consolidated financial statements.
61
Old Second Bancorp, Inc. and Subsidiaries
Consolidated Statements of Income
Years Ended December 31, 2008, 2007, and 2006
(In thousands, except share data)
| | 2008 | | 2007 | | 2006 | |
Interest and dividend income | | | | | | | |
Loans, including fees | | $ | 135,335 | | $ | 131,626 | | $ | 123,614 | |
Loans held-for-sale | | 637 | | 666 | | 487 | |
Securities: | | | | | | | |
Taxable | | 15,745 | | 17,095 | | 12,537 | |
Tax-exempt | | 5,937 | | 5,747 | | 5,011 | |
Dividends from Federal Reserve Bank and Federal Home Loan Bank stock | | 83 | | 239 | | 300 | |
Federal funds sold | | 146 | | 317 | | 42 | |
Interest bearing deposits | | 44 | | 51 | | 38 | |
Total interest and dividend income | | 157,927 | | 155,741 | | 142,029 | |
| | | | | | | |
Interest expense | | | | | | | |
Savings, NOW and money market deposits | | 14,513 | | 24,491 | | 18,571 | |
Time deposits | | 42,046 | | 48,525 | | 40,965 | |
Securities sold under repurchase agreements | | 837 | | 2,391 | | 2,030 | |
Federal funds purchased | | 1,372 | | 3,115 | | 3,852 | |
Other short-term borrowings | | 2,593 | | 3,967 | | 2,456 | |
Junior subordinated debentures | | 4,281 | | 3,629 | | 2,467 | |
Subordinated debt | | 1,831 | | — | | — | |
Notes payable and other borrowings | | 940 | | 1,025 | | 489 | |
Total interest expense | | 68,413 | | 87,143 | | 70,830 | |
Net interest and dividend income | | 89,514 | | 68,598 | | 71,199 | |
Provision for loan losses | | 30,315 | | 1,188 | | 1,244 | |
Net interest and dividend income after provision for loan losses | | 59,199 | | 67,410 | | 69,955 | |
| | | | | | | |
Non-interest income | | | | | | | |
Trust income | | 8,061 | | 8,666 | | 7,595 | |
Service charges on deposits | | 9,318 | | 8,560 | | 8,336 | |
Secondary mortgage fees | | 890 | | 592 | | 716 | |
Mortgage servicing income | | 565 | | 623 | | 492 | |
Net gain on sales of mortgage loans | | 5,856 | | 4,391 | | 3,647 | |
Securities gains, net | | 1,882 | | 674 | | 418 | |
Increase in cash surrender value of bank-owned life insurance | | 616 | | 2,020 | | 2,061 | |
Debit card interchange income | | 2,366 | | 2,011 | | 1,785 | |
Other income | | 5,719 | | 4,318 | | 3,657 | |
Total non-interest income | | 35,273 | | 31,855 | | 28,707 | |
| | | | | | | |
Non-interest expense | | | | | | | |
Salaries and employee benefits | | 44,525 | | 38,108 | | 35,878 | |
Loss on settlement of pension obligation | | — | | — | | 1,467 | |
Occupancy expense, net | | 6,003 | | 5,380 | | 4,598 | |
Furniture and equipment expense | | 6,850 | | 6,415 | | 5,256 | |
Amortization of core deposit and other intangible assets | | 1,096 | | — | | 355 | |
Advertising expense | | 2,013 | | 1,567 | | 2,054 | |
Other expense | | 19,838 | | 15,003 | | 15,528 | |
Total non-interest expense | | 80,325 | | 66,473 | | 65,136 | |
Income before income taxes | | 14,417 | | 32,792 | | 33,526 | |
Provision for income taxes | | 2,323 | | 8,820 | | 9,870 | |
Net income | | $ | 11,824 | | $ | 23,972 | | $ | 23,656 | |
| | | | | | | |
Basic earnings per share | | $ | 0.87 | | $ | 1.92 | | $ | 1.77 | |
Diluted earnings per share | | 0.86 | | 1.89 | | 1.75 | |
Dividends declared per share | | 0.63 | | 0.59 | | 0.55 | |
See accompanying notes to consolidated financial statements.
62
Old Second Bancorp, Inc. and Subsidiaries
Consolidated Statements of Cash Flows
Years Ended December 31, 2008, 2007, and 2006
(In thousands)
| | 2008 | | 2007 | | 2006 | |
Cash flows from operating activities | | | | | | | |
Net income | | $ | 11,824 | | $ | 23,972 | | $ | 23,656 | |
Adjustments to reconcile net income to net cash provided by operating activities: | | | | | | | |
Depreciation | | 4,651 | | 4,690 | | 3,876 | |
Amortization of leasehold improvements | | 190 | | 524 | | 121 | |
Amortization and recovery of mortgage servicing rights, net | | 1,238 | | 637 | | 684 | |
Provision for loan losses | | 30,315 | | 1,188 | | 1,244 | |
Provision for deferred tax benefit | | (7,441 | ) | (664 | ) | (459 | ) |
Origination of loans held-for-sale | | (319,596 | ) | (230,592 | ) | (289,467 | ) |
Proceeds from sale of loans held-for-sale | | 318,707 | | 232,447 | | 288,838 | |
Gain on sales of mortgage loans | | (5,856 | ) | (4,391 | ) | (3,647 | ) |
Change in current income taxes payable | | (9,143 | ) | 155 | | 649 | |
Increase in cash surrender value of bank-owned life insurance | | (616 | ) | (2,020 | ) | (2,061 | ) |
Change in accrued interest receivable and other assets | | 2,530 | | (6,155 | ) | 3,649 | |
Change in accrued interest payable and other liabilities | | 14,146 | | (6,650 | ) | 8,439 | |
Net premium amortization on securities | | 604 | | 730 | | 2,495 | |
Securities gains, net | | (1,882 | ) | (674 | ) | (418 | ) |
Amortization of core deposit and other intangible assets | | 1,096 | | — | | 355 | |
Stock based compensation | | 908 | | 685 | | 209 | |
Loss on sale of other real estate owned | | 13 | | 15 | | 17 | |
Net cash provided by operating activities | | 41,688 | | 13,897 | | 38,180 | |
| | | | | | | |
Cash flows from investing activities | | | | | | | |
Proceeds from maturities and pre-refunds including pay down of securities available-for-sale | | 249,360 | | 211,893 | | 168,786 | |
Proceeds from sales of securities available-for-sale | | 67,326 | | 2,364 | | 339 | |
Purchases of securities available-for-sale | | (123,973 | ) | (293,641 | ) | (170,314 | ) |
Purchases of Federal Reserve Bank and Federal Home Loan Bank stock | | (2,627 | ) | (164 | ) | (365 | ) |
Net change in loans | | (117,418 | ) | (127,744 | ) | (59,910 | ) |
Investment in unconsolidated subsidiary | | — | | (774 | ) | — | |
Proceeds from sale of other real estate owned | | 595 | | 33 | | 186 | |
Purchase of bank-owned life insurance | | (202 | ) | (55 | ) | (565 | ) |
Cash paid for acquisition, net of cash and cash equivalents retained | | (38,839 | ) | — | | — | |
Net purchases of premises and equipment | | (6,098 | ) | (6,508 | ) | (9,916 | ) |
Net cash provided by (used in) investing activities | | 28,124 | | (214,596 | ) | (71,759 | ) |
| | | | | | | |
Cash flows from financing activities | | | | | | | |
Net change in deposits | | (20,846 | ) | 50,925 | | 127,415 | |
Net change in securities sold under repurchase agreements | | (6,877 | ) | 15,004 | | (19,407 | ) |
Net change in federal funds purchased | | (153,300 | ) | 111,100 | | (116,000 | ) |
Net change in other short-term borrowings | | 82,429 | | 9,783 | | 71,265 | |
Proceeds from the issuance of subordinated debt | | 45,000 | | — | | — | |
Proceeds from junior subordinated debentures | | 979 | | 25,774 | | — | |
Proceeds from notes payable and other borrowings | | 7,149 | | 23,360 | | 13,225 | |
Repayment of note payable | | (7,825 | ) | (21,175 | ) | — | |
Proceeds from exercise of stock options | | 187 | | 466 | | 616 | |
Tax benefit from stock options exercised | | 68 | | 209 | | 286 | |
Tax benefit from dividend equivalent payment | | 15 | | — | | — | |
Dividends paid | | (8,275 | ) | (7,294 | ) | (7,230 | ) |
Purchases of treasury stock | | (41 | ) | (31,239 | ) | (13,181 | ) |
Net cash (used in) provided by financing activities | | (61,337 | ) | 176,913 | | 56,989 | |
Net change in cash and cash equivalents | | 8,475 | | (23,786 | ) | 23,410 | |
Cash and cash equivalents at beginning of year | | 64,739 | | 88,525 | | 65,115 | |
Cash and cash equivalents at end of year | | $ | 73,214 | | $ | 64,739 | | $ | 88,525 | |
Continued on page 24
63
Old Second Bancorp, Inc. and Subsidiaries
Consolidated Statements of Cash Flows
(continued)
Years Ended December 31, 2008, 2007, and 2006
(In thousands)
| | 2008 | | 2007 | | 2006 | |
Supplemental cash flow information | | | | | | | |
Income taxes paid | | $ | 13,739 | | $ | 8,664 | | $ | 8,952 | |
Interest paid for deposits | | 58,301 | | 72,799 | | 57,240 | |
Interest paid for borrowings | | 12,101 | | 14,132 | | 11,385 | |
Non-cash transfer of loans to other real estate owned | | 15,820 | | — | | — | |
Non-cash acquisition of land in exchange for loan forgiven | | — | | — | | 60 | |
Change in dividends declared not paid | | 385 | | (19 | ) | 80 | |
| | | | | | | |
Acquisition of HeritageBanc, Inc | | | | | | | |
Non-cash assets acquired: | | | | | | | |
Securities available-for-sale | | $ | 43,971 | | $ | — | | $ | — | |
Federal Home Loan Bank and Federal Reserve Bank Stock | | 1,470 | | — | | — | |
Loans, net | | 283,552 | | — | | — | |
Premises and equipment | | 11,567 | | — | | — | |
Goodwill | | 56,910 | | — | | — | |
Core deposit and other intangible asset | | 8,917 | | — | | — | |
Other assets | | 1,482 | | — | | — | |
Total noncash assets acquired | | $ | 407,869 | | $ | — | | $ | — | |
| | | | | | | |
Liabilities assumed: | | | | | | | |
Deposits | | 294,356 | | — | | — | |
Federal funds purchased | | 17,100 | | — | | — | |
Advances from the Federal Home Loan Bank | | 9,331 | | — | | — | |
Other liabilities | | 5,243 | | — | | — | |
Total liabilities assumed | | 326,030 | | — | | — | |
Net non-cash assets acquired | | $ | 81,839 | | $ | — | | $ | — | |
| | | | | | | |
Cash and cash equivalents acquired | | $ | 5,718 | | $ | — | | $ | — | |
| | | | | | | |
Stock issuance in lieu of cash paid in acquisition | | $ | 43,000 | | $ | — | | $ | — | |
See accompanying notes to consolidated financial statements.
64
Old Second Bancorp, Inc. and Subsidiaries
Consolidated Statement of Changes in
Stockholders’ Equity
Years Ended December 31, 2008, 2007, and 2006
(In thousands, except share data)
| | Common Stock | | Additional Paid-In Capital | | Retained Earnings | | Accumulated Other Comprehensive
Income (Loss) | | Treasury Stock | | Total Stockholders’ Equity | |
Balance, December 31, 2005 | | $ | 16,592 | | $ | 13,746 | | $ | 176,824 | | $ | (4,562 | ) | $ | (50,338 | ) | $ | 152,262 | |
Net income | | — | | — | | 23,656 | | — | | — | | 23,656 | |
Change in net unrealized loss on securities available-for-sale, net of $1,337 tax effect | | — | | — | | — | | 2,017 | | — | | 2,017 | |
Total comprehensive income | | | | | | | | | | | | 25,673 | |
Dividends declared, $.55 per share | | — | | — | | (7,310 | ) | — | | — | | (7,310 | ) |
Stock options exercised | | 43 | | 573 | | — | | — | | — | | 616 | |
Tax benefit of stock options exercised | | — | | 286 | | — | | — | | — | | 286 | |
Stock-based compensation expense | | — | | 209 | | — | | — | | — | | 209 | |
Purchases of treasury stock | | — | | — | | — | | — | | (13,181 | ) | (13,181 | ) |
Balance, December 31, 2006 | | $ | 16,635 | | $ | 14,814 | | $ | 193,170 | | $ | (2,545 | ) | $ | (63,519 | ) | $ | 158,555 | |
Net income | | — | | — | | 23,972 | | — | | — | | 23,972 | |
Change in net unrealized gain on securities available-for-sale, net of $2,956 tax effect | | — | | — | | — | | 4,516 | | — | | 4,516 | |
Total comprehensive income | | | | | | | | | | | | 28,488 | |
Dividends declared, $.59 per share | | — | | — | | (7,275 | ) | — | | — | | (7,275 | ) |
Change in restricted stock | | 26 | | (26 | ) | — | | — | | — | | — | |
Stock options exercised | | 34 | | 432 | | — | | — | | — | | 466 | |
Tax benefit of stock options exercised | | — | | 209 | | — | | — | | — | | 209 | |
Stock-based compensation expense | | — | | 685 | | — | | — | | — | | 685 | |
Purchases of treasury stock | | — | | — | | — | | — | | (31,239 | ) | (31,239 | ) |
Balance, December 31, 2007 | | $ | 16,695 | | $ | 16,114 | | $ | 209,867 | | $ | 1,971 | | $ | (94,758 | ) | $ | 149,889 | |
Net income | | — | | — | | 11,824 | | — | | — | | 11,824 | |
Change in net unrealized loss on securities available-for-sale net, of $2,657 tax effect | | — | | — | | — | | (3,999 | ) | — | | (3,999 | ) |
Change in unrealized loss on cash flow hedge, net of $63 tax effect | | — | | — | | — | | (95 | ) | — | | (95 | ) |
Total comprehensive income | | | | | | | | | | | | 7,730 | |
Dividends declared, $.63 per share | | — | | — | | (8,660 | ) | — | | — | | (8,660 | ) |
Common stock issued for the purchase of Heritage | | 1,564 | | 41,436 | | — | | — | | — | | 43,000 | |
Change in restricted stock | | 27 | | (27 | ) | — | | — | | — | | — | |
Stock options exercised | | 18 | | 169 | | — | | — | | — | | 187 | |
Tax benefit of stock options exercised | | — | | 68 | | — | | — | | — | | 68 | |
Tax benefit of dividend equivalent payments | | — | | 15 | | — | | — | | — | | 15 | |
Stock-based compensation expense | | — | | 908 | | — | | — | | — | | 908 | |
Purchases of treasury stock | | — | | — | | — | | — | | — | | (41 | ) |
Balance, December 31, 2008 | | $ | 18,304 | | $ | 58,683 | | $ | 213,031 | | $ | (2,123 | ) | $ | (94,799 | ) | $ | 193,096 | |
See accompanying notes to consolidated financial statements.
65
Old Second Bancorp, Inc. and Subsidiaries
Notes to Consolidated Financial Statements
December 31, 2008, 2007, and 2006
(Table amounts in thousands, except per share data)
Note A: Summary of Significant Accounting Policies
The consolidated financial statements include Old Second Bancorp, Inc. and its wholly owned subsidiaries; Old Second Financial, Inc., and Old Second National Bank (“Bank”) which includes its wholly-owned subsidiary Old Second Management, LLC which owns 100% of the common stock of its subsidiary Old Second Realty, LLC, and Station I, LLC, which together are referred to as the “Company.” Inter-company transactions and balances are eliminated in consolidation.
Nature of Operations and Principles of Consolidation: As of January 1, 2007, Old Second Mortgage was dissolved as a separate entity and became part of Old Second National Bank of Aurora. As of June 30, 2007, the Company provided financial services through three subsidiary banks. On July 1, 2007, the Company merged its two state bank charters—Old Second Bank — Kane County and Old Second Bank — Yorkville—into its national bank charter, The Old Second National Bank of Aurora, and renamed the combined entity “Old Second National Bank”. The merger qualified as a tax-free reorganization and was accounted for as an internal reorganization. Old Second Acquisition, Inc., was formed as part of the November 5, 2007 Agreement and Plan of Merger between the Company, Old Second Acquisition, Inc., a wholly-owned subsidiary of Old Second Bancorp, Inc., and HeritageBanc, Inc. (“Heritage”). The parties consummated the merger on February 8, 2008, at which time, Old Second Acquisition, Inc. was merged with and into Heritage with Heritage as the surviving corporation as a wholly-owned subsidiary of the Company. Additionally, the parties merged Heritage Bank, a wholly-owned subsidiary of Heritage, with and into Old Second National Bank, with Old Second National Bank as the surviving bank. After the completion of the merger transaction, Heritage was dissolved and is no longer an existing subsidiary. Summary information related to the acquisition is outlined in Note B.
As of December 31, 2008, the Company provided financial services through its offices located in Cook, Kane, Kendall, DeKalb, DuPage, LaSalle and Will counties in Illinois. Its primary deposit products are checking, NOW, money market, savings, and certificate of deposit accounts, and its primary lending products are commercial mortgages, construction lending, commercial and industrial loans, residential mortgages, and installment loans. A major portion of loans are secured by various forms of collateral including real estate, business assets, and consumer property, while borrower cash flow is the primary source of repayment. Old Second Financial, Inc. provides insurance agency services and the Bank engages in trust operations and also provides residential mortgage banking services. There are no significant concentrations of loans to any one industry or customer. However, the customers’ ability to repay their loans is dependent on the real estate market and general economic conditions in the area.
Use of Estimates: To prepare financial statements in conformity with accounting principles generally accepted in the United States of America, management makes estimates and assumptions based on available information. These estimates and assumptions affect the amounts reported in the financial statements and the disclosures provided, and actual results could differ. The allowance for loan losses, valuation of loan servicing rights, valuation of deferred income taxes, evaluation of goodwill and core deposit intangible assets for impairment, and fair values of financial instruments (including derivative contracts) are particularly subject to change.
Statements of Cash Flows: Cash and cash equivalents include cash, deposits with other financial institutions with original maturities under 90 days, federal funds sold, short-term securities available-for-sale, and in 2006, an overnight repurchase agreement of $1.6 million which was held in a custody account and was collateralized by U.S. Treasury securities. There were no overnight repurchase agreements outstanding at either December 31, 2008 or 2007, and the short term available-for-sale securities at both of those dates consisted of federal agency discount notes that matured
66
Note A: Summary of Significant Accounting Policies — continued
in January of the following year. Net cash flows are reported for customer loan and deposit transactions, interest-bearing deposits in other financial institutions, federal funds purchased, other real estate owned, fixed assets, repurchase agreements, and other short-term borrowings.
Interest-Bearing Deposits with Financial Institutions: Interest bearing deposits with financial institutions mature within one year and are carried at cost.
Securities: Securities are classified as available-for-sale when they might be sold before maturity. Securities available-for-sale are carried at fair value, with unrealized holding gains and losses, net of income taxes, reported in accumulated other comprehensive income (loss). Interest income includes amortization of purchase premium or discount on a basis that approximates the level yield method. Realized gains and losses are determined on a trade date basis based on the amortized cost of the specific security sold.
On a quarterly basis, the Company makes an assessment to determine whether there have been any events or circumstances to indicate that a security on which there is an unrealized loss is impaired on an other-than-temporary basis. The Company considers many factors including the severity and duration of the impairment; the intent and ability of the Company to hold the security for a period of time sufficient for a recovery in value; recent events specific to the issuer or industry; and for debt securities, external credit ratings and recent downgrades. Securities on which there is an unrealized loss that is deemed to be other-than-temporary are written down to fair value with the write-down recorded as a realized loss and included in security gains (losses), net.
Federal Home Loan Bank and Federal Reserve Bank stock: The Company owns investments in the stock of the Federal Reserve Bank (“FRB”) and the Federal Home Loan Bank of Chicago (“FHLBC”). No ready market exists for these stocks and they have no quoted market values. FRB stock is redeemable at par, therefore, market value equals cost. The Bank, as a member of the FHLBC, is required to maintain an investment in the capital stock of the FHLB. The stock is redeemable at par by the FHLBC, and is therefore, carried at cost and periodically evaluated for impairment. The Company’s ability to redeem the shares owned is dependent on the redemption practices of the FHLBC. The Company records dividends in income on the ex-dividend date.
Loans Held-for-Sale: The Bank originates residential mortgage loans, which consist of loan products eligible for sale to the secondary market. Mortgage loans held-for-sale are carried at the lower of aggregate cost or fair value. Gains on the sale of these mortgage loans are recorded in the period in which the loans are sold. Net unrealized losses, if any, are recorded as a valuation allowance and charged to earnings.
Mortgage Servicing Rights: The Bank is also involved in the business of servicing mortgage loans. Servicing activities include collecting principal, interest, and escrow payments from borrowers, making tax and insurance payments on behalf of the borrowers, monitoring delinquencies and executing foreclosure proceedings, and accounting for and remitting principal and interest payments to the investors. Mortgage servicing rights represent the right to a stream of cash flows and an obligation to perform specified residential mortgage servicing activities.
Mortgage loans that the Company is servicing for others aggregate to $197.8 million and $223.4 million at December 31, 2008 and 2007, respectively. Mortgage loans that the Company is servicing for others are not included in the Consolidated Balance Sheets. Fees received in connection with servicing loans for others are recognized as earned. Loan servicing costs are charged to expense as incurred.
Servicing rights are recognized separately as assets when they are acquired through sales of loans. For sales of mortgage loans prior to January 1, 2007, a portion of the cost of the loan was allocated to the servicing right based on relative fair values. The Company adopted Statement of Financial Accounting Standards (“SFAS”) No. 156 on January 1, 2007, with no material effect on the Company’s financial statements, and for sales of mortgage loans beginning in 2007, servicing rights are initially recorded at fair value with the income statement effect recorded in gains on sales of loans.
67
Note A: Summary of Significant Accounting Policies — continued
Fair value is based on market prices for comparable mortgage servicing contracts, when available, or alternatively, is based on a valuation model that calculates the present value of estimated future net servicing income. The valuation model incorporates assumptions that market participants would use in estimating future net servicing income, such as the cost to service, the discount rate, the custodial earnings rate, an inflation rate, ancillary income, prepayment speeds and default rates and losses. The Company compares the valuation model inputs and results to published industry data in order to validate the model results and assumptions. Residential mortgage loan servicing assets are subsequently measured using the amortization method, which requires servicing rights to be amortized into non-interest income in proportion to, and over the period of, the estimated future net servicing income of the underlying loans.
Servicing assets are evaluated for impairment based upon the fair value of the rights as compared to carrying amount. Impairment is determined by stratifying rights into groupings based on predominant risk characteristics, such as interest rate, loan type and investor type. Impairment is recognized through a valuation allowance for an individual grouping, to the extent that fair value is less than the carrying amount. If the Company later determines that all or a portion of the impairment no longer exists for a particular grouping, a reduction of the allowance may be recorded as an increase to income. Changes in valuation allowances are reported with other expense on the income statement. The fair values of servicing rights are subject to significant fluctuations as a result of changes in interest rates and the impact of these changes on estimated and actual prepayment speeds and default rates and losses.
Servicing fee income, which is reported on the Statements of Income as mortgage servicing income, is recorded for fees earned for servicing loans. The fees are based on a contractual percentage of the outstanding principal or a fixed amount per loan and are recorded as income when earned. The amortization of mortgage servicing rights is netted against loan servicing fee income. Servicing fees totaled $565,000, $623,000 and $492,000 for the years ended December 31, 2008, 2007 and 2006, respectively. Late fees and ancillary fees related to loan servicing are not material.
Advertising Costs: All advertising costs incurred by the Company are expensed in the period in which they are incurred.
Loans: Loans, including lease financing receivables that management has the intent and ability to hold for the foreseeable future or until maturity or payoff are reported at the principal balance outstanding, net of purchase premiums and discounts, unearned interest, net deferred loan fees and costs, and an allowance for loan losses. Interest income is reported on the interest method and includes amortization of net deferred loan origination fees and costs over the loan term on a method that approximates the level yield method. The accrual of interest income is discontinued when full loan repayment is in doubt or when a loan becomes contractually past due by more than 90 days with respect to interest or principal unless that loan is well secured and in the process of collection. Consumer loans are typically charged off no later than 120 days past due. When a loan is placed on non-accrual status, any accrued, unpaid interest is reversed to the related income account. Interest on non-accrual loans is not recovered until it is actually paid by the borrower. Such payments can take the form of lump sums paid by the borrower, or more frequently, periodic installment payments. When a non-accrual loan has improved to the point where its collection is no longer in question, payments are applied to recovery of the non-accrual interest. As long as any question remains as to the collection of the loan, payments received on such loans are reported as principal reductions.
Allowance for Loan Losses: The allowance for loan losses represents management’s estimate of probable credit losses inherent in the loan portfolio. Determining the amount of the allowance for loan losses is inherently subjective, because it requires significant judgment and the use of estimates related to the amount and timing of expected future cash flows on impaired loans, estimated losses on pools of homogeneous loans based on historical loss experience, and consideration of current economic trends and conditions, all of which may be susceptible to significant change. Additions to the allowance for loan losses are expensed through the provision for loan losses and reductions in the allowance for loan losses are credited to the provision for loan losses. Loans believed by management to be uncollectible are charged against the allowance for loan losses and recoveries of previously charged-off loans are credited to the allowance for loan losses. Management estimates the allowance balance required using various risk factors including, but
68
Note A: Summary of Significant Accounting Policies — continued
not limited to, past loan loss experience, known and inherent risks in the portfolio, information about specific borrower situations and estimated collateral values, volume trends in delinquencies and nonaccruals, economic conditions, and other factors.
The methodology for determining the appropriate level of the allowance for loan losses consists of three components: (i) specific reserves established for expected losses resulting from analysis developed through specific credit allocations on individual loans for which the recorded investment in the loan exceeds the measured value of the loan; (ii) reserves based on historical loan loss experience for each loan category; and (iii) reserves based on general, current economic conditions as well as specific economic factors believed to be relevant to the markets in which the Company operates. Management believes that the allowance for loan losses is adequate to absorb credit losses inherent in the loan portfolio.
A loan is considered impaired when, based on current information and events, it is probable that the Company will be unable to collect all contractual principal or interest due according to the original terms of the agreement. Impaired loans are measured based on the present value of the future cash flows, discounted at the loan’s original effective interest rate, or the fair value of underlying collateral, if the loan is collateral dependent. Payments received on impaired loans are generally reported as principal reductions.
Premises and Equipment: Premises and equipment are stated at cost less accumulated depreciation and amortization. Depreciation is computed over estimated useful lives of ten to forty years for premises and five to seven years for furniture and equipment principally by the use of straight-line depreciation methods for book purposes, while accelerated depreciation is used for income tax purposes. Leasehold improvements are amortized over the shorter of the anticipated lease term, including contractually anticipated renewals, or the life of the improvement. When property is retired or otherwise disposed of, the stated amount, net of sale proceeds in the event of a sale of assets, is recognized as a gain or loss at the time of disposal. Expenditures for maintenance and repairs are expensed as incurred, and expenditures for major renovations that extend the useful life of the asset are capitalized.
Other Real Estate Owned: Assets acquired in settlement of loans are recorded at fair value when acquired, less estimated costs to sell, establishing a new cost basis. Any deficiency between the net book value and fair value at the foreclosure date is charged to the allowance for loan losses. If fair value declines after acquisition, the carrying amount is reduced to the lower of the initial amount or fair value less costs to sell. Such declines are included in other non-interest expense. Operating costs after acquisition are also expensed.
Goodwill and Other Intangibles: Goodwill is the excess of purchase price of an acquisition over the fair value of identified net assets acquired in an acquisition. Goodwill (and intangible assets deemed to have indefinite lives) is not amortized but is subject to annual impairment tests. Other intangible assets, including core deposit intangibles, are amortized over their useful lives. Goodwill is tested at least annually for impairment, or more often if events or other circumstances indicate that there may be impairment. No goodwill impairment was recorded in the years 2008, 2007, or 2006. Identified intangible assets are periodically reviewed to determine whether there have been any events or circumstances to indicate that the recorded amount is not recoverable.
Loan Commitments and Related Financial Instruments: Financial instruments include off-balance sheet credit instruments, such as commitments to make loans and commercial letters of credit, issued to meet customer financing needs. The face amount for these items represents the exposure to loss, before considering customer collateral or ability to repay. Such financial instruments are recorded when they are funded.
Trust Assets and Fees: Assets held in fiduciary or agency capacities are not included in the consolidated balance sheets because such amounts are not assets of the Company. Income from trust fees is recorded on an accrual basis and is included as a component of non-interest income.
69
Note A: Summary of Significant Accounting Policies — continued
Retirement Plan Costs: The Company had a tax-qualified noncontributory defined benefit retirement plan covering substantially all full-time and regular part-time employees of the Company that was terminated in December 2005. Generally, benefits were based on years of service and compensation. The Company paid benefits to all defined benefit plan participants prior to December 31, 2006.
Bank-Owned Life Insurance: The Company has purchased life insurance policies on certain employees and is the owner and beneficiary of the policies. Upon adoption of EITF 06-5, which is discussed further below, bank-owned life insurance is recorded at the amount that can be realized under the insurance contract at the balance sheet date, which is the cash surrender value adjusted for other charges or other amounts due that are probable at settlement. Prior to adoption of EITF 06-5, the Company recorded bank-owned life insurance at its cash surrender value. It also had no other charges or probable amounts due at settlement related to these policies.
In September 2006, the FASB Emerging Issues Task Force finalized Issue No. 06-5, Accounting for Purchases of Life Insurance - Determining the Amount That Could Be Realized in Accordance with FASB Technical Bulletin No. 85-4 (Accounting for Purchases of Life Insurance) (“EITF 06-5”). EITF 06-5 requires that a policyholder consider contractual terms of a life insurance policy in determining the amount that could be realized under the insurance contract. It also requires that if the contract provides for a greater surrender value if all individual policies in a group are surrendered at the same time, that the surrender value be determined based on the assumption that policies will be surrendered on an individual basis. Lastly, EITF 06-5 requires disclosure when there are contractual restrictions on the Company’s ability to surrender a policy. The adoption of EITF 06-5 on January 1, 2007, had no material impact on the Company’s financial condition or results of operation.
Long-term Incentive Plan: Effective January 1, 2006, the Company adopted SFAS No. 123(R), Share-based Payment (“FAS No. 123(R)”), using the modified prospective transition method. Accordingly, the Company has recorded stock-based employee compensation cost using the fair value method starting in 2006. Additionally, in accordance with EITF 06-11 the tax benefit received on dividends paid to employees associated with their share-based awards recorded in additional paid-in capital until the award is settled through vesting is non-vested stock. Once the award is settled, the company would determine whether the cumulative tax deduction exceeded the cumulative compensation cost recognized in the income statement. The cumulative tax deduction would include both the deductions from the dividends and the deduction from the exercise or vesting of the award. If the tax benefit received from the cumulative deductions exceeds the tax effect of the recognized cumulative compensation cost, the excess would be recognized as an increase to additional paid-in capital.
Prior to January 1, 2006, employee compensation expense under stock options was reported using the intrinsic value method and no material stock based compensation cost was reflected in prior periods, as all options granted had an exercise price equal to or greater than the market price of the underlying common stock at date of grant. Although technically allowed in the plan document, management has not issued shares from treasury in the periods presented in the consolidated financial statements.
Income Taxes: Income tax expense is the total of the current year income tax due or refundable and the change in deferred tax assets and liabilities. Deferred tax assets and liabilities are the expected future tax amounts for the temporary differences between carrying amounts and tax basis of assets and liabilities, computed using enacted tax rates. The effect on deferred taxes of a change in tax rates is recognized in income in the period that includes the enactment date of the change. A valuation allowance is provided for any deferred tax asset for which it is more likely than not that the asset will not be realized. Changes in valuation allowances are recorded as a component of income tax expense if needed.
The Company adopted Financial Accounting Standards Board (“FASB”) Interpretation 48, Accounting for Uncertainty in Income Taxes (“FIN 48”), as of January 1, 2007. A tax position is recognized as a benefit only if it is “more likely than not” that the tax position would be sustained in a tax examination, with a tax examination being presumed to
70
Note A: Summary of Significant Accounting Policies — continued
occur. The amount recognized is the largest amount of tax benefit that is greater than 50% likely of being realized on examination. For tax positions not meeting the “more likely than not” test, no tax benefit is recorded. The adoption had no effect on the Company’s financial statements. The Company and its subsidiaries are subject to U.S. federal income tax as well as income tax of the state of Illinois. The Company is no longer subject to examination by taxing authorities for years before 2004. The Company recognizes interest and/or penalties related to income tax matters in income tax expense. As of January 1, 2007, the Company had no material unrecognized tax benefits. The Company did not record a cumulative effect adjustment related to the adoption of FIN 48. There have been no material changes in unrecognized tax benefits since January 1, 2007. The Company did not have any material amounts accrued for interest and penalties at either December 31, 2008 or December 31, 2007.
Earnings Per Share: Basic earnings per share represent net income divided by the weighted-average number of common shares outstanding during the year. Diluted earnings per share includes the dilutive effects of additional potential common shares issuable under stock options and restricted stock, computed based on the treasury stock method using the average market price for the period. Earnings and dividends per share are restated for all stock splits and dividends through the date of issue of the consolidated financial statements.
Treasury Stock: Shares of Old Second Bancorp, Inc. may be acquired for reissuance in connection with stock option plans, for future stock dividend declarations, and for general corporate purposes. Treasury shares acquired are recorded at cost.
Mortgage Banking Derivatives: From time to time, the Company enters into mortgage banking derivatives such as forward contracts and interest rate lock commitments in the ordinary course of business. These derivatives may be designated as fair value hedges of loans held-for-sale. Accordingly, both the derivatives and the hedged loans held-for-sale are carried at fair value. The remaining derivatives are not designated as hedges and are carried at fair value. The net gain or loss on mortgage banking derivatives is included in gain on sale of loans.
Derivative Financial Instruments: The Company occasionally enters into derivative financial instruments as part of its interest rate risk management strategies. These derivative financial instruments consist primarily of interest rate swaps. Under the guidance of SFAS No. 133, “Accounting for Derivative Instruments and Hedging Activities,” as amended, (“FAS 133”) all derivative instruments are recorded on the balance sheet, as either an other asset or other liability, at fair value. The accounting for the gain or loss resulting from changes in fair value depends on the intended use of the derivative. For a derivative used to hedge changes in fair value of a recognized asset or liability, or an unrecognized firm commitment, the gain or loss on the derivative will be recognized in earnings, together with the offsetting loss or gain on the hedged item. This results in an earnings impact only to the extent that the hedge is not completely effective in achieving offsetting changes in fair value. If it is determined that the derivative instrument is not highly effective as a hedge, hedge accounting is discontinued and the adjustment to fair value of the derivative instrument is recorded in earnings. For a derivative used to hedge changes in cash flows associated with forecasted transactions, the gain or loss on the effective portion of the derivative are deferred and reported as a component of accumulated other comprehensive income, which is a component of shareholders’ equity, until such time the hedged transaction affects earnings. For derivative instruments not accounted for as hedges, changes in fair value are recognized in non-interest income/expense. Counterparty risk is considered through loan covenant agreements and, as such, does not have a significant impact on the fair value of the swaps. Deferred gains and losses from derivatives that are terminated are amortized over the shorter of the original remaining term of the derivative or the remaining life of the underlying asset or liability.
Comprehensive Income: Comprehensive income is the total of net income and certain other items that are charged or credited to stockholders’ equity. The Company includes changes in unrealized gains or losses, net of tax, on securities available-for-sale and the effective portion of a derivative used to hedge cash flows associated with a forecasted transaction in other comprehensive income (loss). Comprehensive income is presented in the Consolidated Statement of Changes in Stockholders’ Equity and accumulated other comprehensive income (loss) is reported in the Consolidated Balance Sheets.
71
Note A: Summary of Significant Accounting Policies — continued
Transfers of Financial Assets: Transfers of financial assets are accounted for as sales, when control over the assets has been surrendered. Control over transferred assets is deemed to be surrendered when the assets have been isolated from the Company, the transferee obtains the right (free of conditions that constrain it from taking advantage of that right) to pledge or exchange the transferred assets, and the Company does not maintain effective control over the transferred assets through an agreement to repurchase them before their maturity.
Loss Contingencies: Loss contingencies, including claims and legal actions arising in the ordinary course of business, are recorded as liabilities when the likelihood of loss is probable and an amount or range of loss can be reasonably estimated. Management does not believe there currently are such matters that will have a material effect on the financial statements.
Variable Interest Entity: In December 2003, the FASB revised FIN No. 46, Consolidation of Variable Interest Entities (“FIN-46”). FIN 46, as revised in December 2003, changes the accounting model for consolidation from one based on consideration of control through voting interests. Determining whether to consolidate an entity now considers whether that entity has sufficient equity at risk to enable it to operate without additional financial support, whether the equity owners of that entity lack the obligation to absorb expected losses or the right to receive residual returns of the entity, or whether voting rights in the entity are not proportional to the equity interest and substantially all the entity’s activities are conducted for an investor with few voting rights. As of December 31, 2004, the Company applied the provisions of revised FIN 46 to Old Second Capital Trust I, a wholly-owned subsidiary trust that issued capital securities to third-party investors. As of April 2007, the Company applied the provisions of revised FIN 46 to Old Second Capital Trust II, a wholly-owned subsidiary trust that issued capital securities to third-party investors. As a result, Old Second Capital Trust I and II are unconsolidated subsidiaries of the Company. The issuance of trust-preferred securities through this trust subsidiary is discussed further in Note K.
Segment Reporting: Operating segments are components of a business about which separate financial information is available and that are evaluated regularly by the chief operating decision maker in deciding how to allocate resources and assess performance. Public companies are required to report certain financial information about operating segments. The Company’s chief operating decision maker evaluates the operations of the Company as one operating segment, Community Banking. As a result, disclosure of separate segment information is not required. The Company offers the following products and services to external customers: deposits, loans and trust services. Revenues for each of these products and services are disclosed separately in the Consolidated Statements of Income.
Dividend Restriction: Banking regulations require maintaining certain capital levels and may limit the dividends paid by the Bank to the Company or by the Company to stockholders. Additionally, the Company is prohibited from increasing its dividends without regulatory approval for as long as the United States Department of Treasury holds the Series B Fixed Rate Cumulative Perpetual Preferred Stock. This restriction became effective on January 16, 2009.
Restrictions on Cash: Cash on hand or on deposit with the Federal Reserve Bank was required to meet regulatory reserve and clearing requirements. These balances do not earn interest.
Reclassifications: Certain items in the prior year financial statements were reclassified to conform to the current presentation.
New Accounting Pronouncements: In September 2006, the FASB issued SFAS No. 157, Fair Value Measurements (“FAS 157”). This Statement defines fair value, establishes a framework for measuring fair value and expands disclosures about fair value measurements. The Statement also establishes a fair value hierarchy about the assumptions used to measure fair value and clarifies assumptions about risk and the effect of a restriction on the sale or use of an asset. This Statement was effective for fiscal years beginning after November 15, 2007. In February 2008, the FASB issued Staff Position (“FSP”) 157-2, Effective Date of FASB Statement No. 157. This FSP delays the effective date of FAS 157 for all non-financial assets and non-financial liabilities, except those that are recognized or disclosed at fair value on a
72
Note A: Summary of Significant Accounting Policies — continued
recurring basis (at least annually) to fiscal years beginning after November 15, 2008, and interim periods within those fiscal years. The impact of adoption was not material. In October 2008, the FASB issued FSP 157-3, Determining the Fair Value of a Financial Asset when the Market for That Asset Is Not Active. This FSP clarifies the application of FAS 157 in a market that is not active. The impact of adoption was not material.
In February 2007, the FASB issued SFAS No. 159, The Fair Value Option for Financial Assets and Financial Liabilities (“FAS 159”). FAS 159 provides companies with an option to report selected financial assets and liabilities at fair value and establishes presentation and disclosure requirements designed to facilitate comparisons between companies that choose different measurement attributes for similar types of assets and liabilities. FAS 159 was effective for the Company on January 1, 2008. The Company did not elect the fair value option for any financial assets or financial liabilities as of December 31, 2008.
In September 2006, the FASB Emerging Issues Task Force finalized Issue No. 06-4, Accounting for Deferred Compensation and Postretirement Benefit Aspects of Endorsement Split-Dollar Life Insurance Arrangements (“EITF 06-4”). EITF 06-4 requires that a liability be recorded during the service period when a split-dollar life insurance agreement continues after participants’ employment or retirement. The required accrued liability must be based on either the post-employment benefit cost for the continuing life insurance or based on the future death benefit depending on the contractual terms of the underlying agreement. EITF 06-4 was effective for fiscal years beginning after December 15, 2007. The impact of adoption was not material.
On November 5, 2007, the SEC issued Staff Accounting Bulletin (“SAB”) No. 109, Written Loan Commitments Recorded at Fair Value through Earnings (“SAB 109”). Previously, SAB 105, Application of Accounting Principles to Loan Commitments (“SAB 109”), stated that in measuring the fair value of a derivative loan commitment, a company should not incorporate the expected net future cash flows related to the associated servicing of the loan. SAB 109 supersedes SAB 105 and indicates that the expected net future cash flows related to the associated servicing of the loan should be included in measuring fair value for all written loan commitments that are accounted for at fair value through earnings. SAB 105 also indicated that internally-developed intangible assets should not be recorded as part of the fair value of a derivative loan commitment, and SAB 109 retains that view. SAB 109 was effective for derivative loan commitments issued or modified in fiscal quarters beginning after December 15, 2007. The impact of adoption was not material.
In December 2007, the SEC issued Staff Accounting Bulletin No. 110, Share-Based Payment (“SAB No.110”) which expresses the views of the SEC regarding the use of a “simplified” method, as discussed in SAB No. 107, in developing an estimate of expected term of “plain vanilla” share options in accordance with FAS No. 123(R). The SEC concluded that a company could, under certain circumstances, continue to use the simplified method for share option grants after December 31, 2007. The Company does not use the simplified method for share options and therefore SAB No. 110 has no impact on the Company’s consolidated financial statements.
Effect of Newly Issued But Not Yet Effective Accounting Standards: In December 2007, the FASB issued SFAS No. 141 (revised 2007), Business Combinations (“FAS 141(R)”), which establishes principles and requirements for how an acquirer recognizes and measures in its financial statements the identifiable assets acquired, the liabilities assumed, and any non-controlling interest in an acquiree, including the recognition and measurement of goodwill acquired in a business combination. FAS No. 141(R) is effective for fiscal years beginning on or after December 15, 2008. Earlier adoption is prohibited. The adoption of this standard is not expected to have a material effect on the Company’s 2008 results of operations or financial position.
In December 2007, the FASB issued SFAS No. 160, Noncontrolling Interest in Consolidated Financial Statements, an amendment of ARB No. 51 (“FAS No. 160”), which will change the accounting and reporting for minority interests, which will be recharacterized as noncontrolling interests and classified as a component of equity within the consolidated balance sheets. FAS No. 160 is effective as of the beginning of the first fiscal year beginning on or after December
73
Note A: Summary of Significant Accounting Policies — continued
15, 2008. Earlier adoption is prohibited and the Company does not expect the adoption of FAS No. 160 to have a significant impact on its results of operations or financial position.
In March 2008, the FASB issued SFAS No. 161, Disclosures about Derivative Instruments and Hedging Activities, an amendment of SFAS No. 133 (“FAS No. 161”). FAS No. 161 amends and expands the disclosure requirements of SFAS No. 133 for derivative instruments and hedging activities. FAS No. 161 requires qualitative disclosure about objectives and strategies for using derivative and hedging instruments, quantitative disclosures about fair value amounts of the instruments and gains and losses on such instruments, as well as disclosures about credit-risk features in derivative agreements. FAS No. 161 is effective for financial statements issued for fiscal years and interim periods beginning after November 15, 2008, with early application encouraged. The adoption of this standard is not expected to have a material effect on the Company’s results of operations or financial position.
In May 2008, the FASB issued FASB Statement No. 162, The Hierarchy of Generally Accepted Accounting Principles (“SFAS 162”). SFAS 162 is intended to improve financial reporting by identifying a consistent framework, or hierarchy, for selecting accounting principles to be used in preparing financial statements that are presented in conformity with U.S. generally accepted accounting principles for nongovernmental entities. SFAS 162 is effective 60 days following the SEC’s approval of the PCAOB amendments to AU Section 411, The Meaning of Present Fairly in Conformity with Generally Accepted Accounting Principles. Management does not believe that the adoption of SFAS 162 will have a material impact on the Company’s financial statements.
In June 2008, the FASB issued FASB Staff Position (“FSP”) EITF 03-6-1, Determining Whether Instruments Granted in Share-Based Payment Transactions Are Participating Securities (“FSP EITF 03-6-1”). FSP EITF 03-6-1 provides that unvested share-based payment awards that contain nonforfeitable rights to dividends or dividend equivalents (whether paid or unpaid) are participating securities and shall be included in the computation of earnings per share pursuant to the two-class method. FSP EITF 03-6-1 will be effective on January 1, 2009. All previously reported earnings per share data will be retrospectively adjusted to conform with the provisions of FSP EITF 03-6-1. Management is currently evaluating the provisions of FSP EITF 03-6-1 and its potential effect on its financial statements.
Note B: Business Combination
Old Second Acquisition, Inc., was formed as part of the November 5, 2007 Agreement and Plan of Merger between the Company, Old Second Acquisition, Inc., a wholly-owned subsidiary of the Company, and HeritageBanc, Inc. (“Heritage”), located in Chicago Heights, Illinois. The parties consummated the merger on February 8, 2008, at which time, Old Second Acquisition, Inc. was merged with and into Heritage with Heritage as the surviving corporation as a wholly-owned subsidiary of the Company. Additionally, the parties merged Heritage Bank, a wholly-owned subsidiary of Heritage, with and into Old Second National Bank, with Old Second National Bank as the surviving bank. After the completion of the merger transaction, Heritage was dissolved and is no longer an existing subsidiary. The purchase price was paid through a combination of cash and approximately 1.6 million shares of the Company’s common stock totaling $86.0 million, excluding transaction costs. The transaction generated approximately $56.9 million in goodwill and $8.9 million in intangible assets subject to amortization.
The business combination was accounted for under the purchase method of accounting. Accordingly, the results of operations of Heritage have been included in the Company’s results of operations since the date of acquisition. Under this method of accounting, the purchase price is allocated to the respective assets acquired and liabilities assumed based on their estimated fair values, net of applicable income tax effects. The excess cost over fair value of net assets acquired is recorded as goodwill. As of December 31, 2008 the Company estimates that $53.2 million of the goodwill amount will be tax deductible.
74
Note B: Business Combination — continued
Purchase Price of Heritage (in thousands): | | | |
Market value (market value per share of $27.50) of the Company’s common stock issued | | $ | 43,000 | |
Cash paid | | 43,000 | |
Transaction costs | | 1,557 | |
Total purchase price | | $ | 87,557 | |
| | | |
Allocation of the purchase price | | | |
Historical net assets of Heritage as of February 8, 2008 | | $ | 22,929 | |
Fair market value adjustments as of February 8, 2008 | | | |
Real estate | | 529 | |
Equipment | | (134 | ) |
Artwork | | (30 | ) |
Loans | | (122 | ) |
Goodwill | | 56,910 | |
Core deposit intangible and other intangible assets | | 8,917 | |
Time deposits | | (1,111 | ) |
FHLB advances | | (331 | ) |
Total purchase price | | $ | 87,557 | |
The following is the unaudited pro forma consolidated results of operations of the Company for the twelve months ended December 31, 2008 as though Heritage had been acquired as of January 1, 2006.
| | Years Ended December 31, | |
| | 2008 | | 2007 | | 2006 | |
Net interest income after provision for loan losses | | $ | 58,949 | | $ | 78,399 | | $ | 81,212 | |
Non-interest income | | 35,491 | | 34,084 | | 30,767 | |
Non-interest expense | | 85,904 | | 77,654 | | 74,976 | |
Income before income taxes | | 8,536 | | 34,829 | | 37,003 | |
Income taxes | | 1,033 | | 10,736 | | 11,741 | |
Net income | | $ | 7,503 | | $ | 24,093 | | $ | 25,262 | |
| | | | | | | |
Per common share information | | | | | | | |
Earnings | | $ | 0.55 | | $ | 1.71 | | $ | 1.69 | |
Diluted earnings | | $ | 0.54 | | $ | 1.69 | | $ | 1.67 | |
| | | | | | | | | | |
Average common shares issued and outstanding | | 13,746,726 | | 14,072,187 | | 14,930,698 | |
Average diluted common shares outstanding | | 13,851,559 | | 14,218,942 | | 15,090,239 | |
Included in the pro forma results of operations for the year ended December 31, 2008 was one-time pretax merger costs of $3.9 million.
Note C: Cash and Due from Banks
Old Second Bank is required to maintain reserve balances with the Federal Reserve Bank. In accordance with Federal Reserve Bank requirements, the average reserve balances were $10.9 million and $16.8 million, at December 31, 2008 and 2007, respectively.
75
Note D: Securities
Securities available-for-sale at December 31 are summarized as follows:
| | Amortized
Cost | | Unrealized
Gains | | Unrealized
Losses | | Fair
Value | |
2008 | | | | | | | | | |
U.S. Treasury | | $ | 1,496 | | $ | 72 | | $ | — | | $ | 1,568 | |
U.S. government agencies | | 95,290 | | 1,178 | | (113 | ) | 96,355 | |
U.S. government agency mortgage-backed | | 86,062 | | 1,396 | | (208 | ) | 87,250 | |
States and political subdivisions | | 150,313 | | 2,939 | | (1,659 | ) | 151,593 | |
Collateralized mortgage obligations | | 58,684 | | 711 | | (125 | ) | 59,270 | |
Collateralized debt obligations | | 17,834 | | — | | (7,567 | ) | 10,267 | |
Equity securities | | 99 | | — | | (16 | ) | 83 | |
| | $ | 409,778 | | $ | 6,296 | | $ | (9,688 | ) | $ | 406,386 | |
2007 | | | | | | | | | |
U.S. Treasury | | $ | 10,018 | | $ | 132 | | $ | — | | $ | 10,150 | |
U.S. government agencies | | 209,799 | | 955 | | (203 | ) | 210,551 | |
U.S. government agency mortgage-backed | | 95,839 | | 1,128 | | (92 | ) | 96,875 | |
States and political subdivisions | | 158,862 | | 1,440 | | (544 | ) | 159,758 | |
Collateralized mortgage obligations | | 73,518 | | 463 | | (40 | ) | 73,941 | |
Collateralized debt obligations | | 9,507 | | 25 | | — | | 9,532 | |
Equity securities | | 52 | | — | | — | | 52 | |
| | $ | 557,595 | | $ | 4,143 | | $ | (879 | ) | $ | 560,859 | |
The fair value, amortized cost and weighted average yield of debt securities at December 31, 2008 by contractual maturity, were as follows. Securities not due at a single maturity date, primarily mortgage-backed securities, collateralized mortgage obligations, and asset-backed and equity securities are shown separately:
| | Amortized
Cost | | Weighted
Average
Yield | | Fair
Value | |
Due in one year or less | | $ | 15,664 | | 3.48% | | $ | 15,801 | |
Due after one year through five years | | 76,930 | | 3.79% | | 78,236 | |
Due after five years through ten years | | 91,466 | | 4.44% | | 93,309 | |
Due after ten years | | 63,039 | | 4.58% | | 62,170 | |
| | $ | 247,099 | | 4.21% | | $ | 249,516 | |
Mortgage-backed and collateralized mortgage obligations | | 144,746 | | 5.29% | | 146,520 | |
Asset-backed and equity securities | | 17,933 | | 4.06% | | 10,350 | |
| | $ | 409,778 | | 4.59% | | $ | 406,386 | |
At December 31, 2008 and 2007, there were no holdings of securities of any one issuer, other than the U.S. government and its agencies, in an amount greater than 10% of shareholders’ equity.
76
Note D: Securities — continued
Securities with unrealized losses at December 31, 2008 and 2007, aggregated by investment category and length of time that individual securities have been in a continuous unrealized loss position, are as follows:
| | Less than 12 months
in an unrealized
loss position | | Greater than 12 months
in an unrealized
loss position | | | |
| | Unrealized
Losses | | Fair
Value | | Unrealized
Losses | | Fair
Value | | Unrealized
Loss Total | |
2008 | | | | | | | | | | | | | | | | |
U.S. Treasury | | $ | — | | $ | — | | $ | — | | $ | — | | $ | — | |
U.S. government agencies | | 113 | | 9,489 | | — | | — | | 113 | |
U.S. government agency mortgage-backed | | 131 | | 14,996 | | 77 | | 1,838 | | 208 | |
States and political subdivisions | | 1,279 | | 38,659 | | 380 | | 8,849 | | 1,659 | |
Collateralized mortgage obligations | | 125 | | 10,230 | | — | | — | | 125 | |
Collateralized debt obligations | | 7,567 | | 10,267 | | — | | — | | 7,567 | |
Equity securities | | 16 | | 31 | | — | | — | | 16 | |
| | $ | 9,231 | | $ | 83,672 | | $ | 457 | | $ | 10,687 | | $ | 9,688 | |
| | Less than 12 months
in an unrealized
loss position | | Greater than 12 months
in an unrealized
loss position | | | |
| | Unrealized | | Fair | | Unrealized | | Fair | | Unrealized | |
| | Losses | | Value | | Losses | | Value | | Loss Total | |
2007 | | | | | | | | | | | | | | | | |
U.S. Treasury | | $ | — | | $ | — | | $ | — | | $ | — | | $ | — | |
U.S. government agencies | | — | | — | | 203 | | 72,806 | | 203 | |
U.S. government agency mortgage-backed | | 1 | | 57 | | 91 | | 4,602 | | 92 | |
States and political subdivisions | | 281 | | 19,602 | | 263 | | 31,586 | | 544 | |
Collateralized mortgage obligations | | 40 | | 13,049 | | — | | — | | 40 | |
Asset-backed and equity securities | | — | | — | | — | | — | | — | |
| | $ | 322 | | $ | 32,708 | | $ | 557 | | $ | 108,994 | | $ | 879 | |
| | Less than 12 months
in an unrealized
loss position | | Greater than 12 months
in an unrealized
loss position | | | |
| | Unrealized | | Fair | | Unrealized | | Fair | | Unrealized | |
| | Losses | | Value | | Losses | | Value | | Loss Total | |
2006 | | | | | | | | | | | | | | | | |
U.S. Treasury | | $ | — | | $ | — | | $ | 384 | | $ | 9,630 | | $ | 384 | |
U.S. government agencies | | 106 | | 46,489 | | 3,219 | | 199,113 | | 3,325 | |
U.S. government agency mortgage-backed | | 33 | | 5,296 | | 169 | | 6,438 | | 202 | |
States and political subdivisions | | 68 | | 18,751 | | 1,058 | | 71,284 | | 1,126 | |
Collateralized mortgage obligations | | 182 | | 21,877 | | — | | — | | 182 | |
| | $ | 389 | | $ | 92,413 | | $ | 4,830 | | $ | 286,465 | | $ | 5,219 | |
Recognition of other-than-temporary impairment was not necessary in the years ended December 31, 2008, 2007 or 2006. The change in fair values related to interest rate fluctuations and were not related to credit quality deterioration. An increase in rates will generally cause a decrease in the fair value of individual securities while a decrease in rates typically results in an increase in fair value. In addition to the impact of rate changes upon pricing, uncertainty in the financial markets in 2008 has resulted in reduced liquidity for certain investments, particularly the collateralized debt obligations, which also impacted market pricing at December 31, 2008. The Company has the ability and intent to hold all securities until recovery.
77
Note D: Securities — continued
Securities with a fair value of approximately $355.8 million and $411.6 million at December 31, 2008 and 2007, respectively were pledged to secure public deposits and securities sold under repurchase agreements and for other purposes required or permitted by law.
| | Years ended December 31, | |
| | 2008 | | 2007 | | 2006 | |
Proceeds from sales of securities | | $ | 67,326 | | $ | 2,364 | | $ | 339 | |
Gross realized gains on securities | | 1,955 | | 695 | | 418 | |
Gross realized losses on securities | | (73 | ) | (21 | ) | — | |
Securities gains, net | | $ | 1,882 | | $ | 674 | | $ | 418 | |
Income tax expense on net realized gains | | $ | 746 | | $ | 268 | | $ | 166 | |
Note E: Loans
Major classifications of loans at December 31 were as follows:
| | 2008 | | 2007 | |
Commercial and industrial | | $ | 244,019 | | $ | 197,124 | |
Real estate - commercial | | 929,576 | | 661,217 | |
Real estate - construction | | 373,704 | | 371,779 | |
Real estate - residential | | 701,221 | | 634,266 | |
Installment | | 19,116 | | 19,714 | |
Overdraft | | 761 | | 714 | |
Lease financing receivables | | 4,396 | | 7,922 | |
| | $ | 2,272,793 | | $ | 1,892,736 | |
Net deferred loan fees and costs | | (1,679 | ) | (1,626 | ) |
| | $ | 2,271,114 | | $ | 1,891,110 | |
It is the policy of the Company to review each prospective credit in order to determine an adequate level of security or collateral to obtain prior to making a loan. The type of collateral, when required, will vary from liquid assets to real estate. The Company’s access to collateral, in the event of borrower default, is assured through adherence to state lending laws and the Company’s lending standards and credit monitoring procedures. The Bank generally makes loans within its market area. There are no significant concentrations of loans where the customers’ ability to honor loan terms is dependent upon a single economic sector, although the real estate categories listed above represent 88.3% and 88.2% of the portfolio at December 31, 2008 and 2007, respectively.
Past due and non-accrual loans at December 31 were as follows:
| | 2008 | | 2007 | | 2006 | |
Non-accrual loans | | $ | 106,511 | | $ | 5,346 | | $ | 1,632 | |
Interest income recorded on non-accrual loans | | 4,064 | | 179 | | 199 | |
Interest income which would have been accrued on non-accrual loans | | 7,714 | | 480 | | 325 | |
Loans 90 days or more past due and still accruing interest | | 2,119 | | 625 | | 583 | |
| | | | | | | | | | |
There were no troubled debt restructurings for the two-year period ended December 31, 2007. Additionally, there were no troubled debt restructurings not included in the non-accrual loans listed above for the period ending December 31, 2008.
78
Note E: Loans — continued
Loans to principal officers, directors, and their affiliates, which are made in the ordinary course of business, were as follows at December 31:
| | 2008 | | 2007 | |
Beginning balance | | $ | 29,395 | | $ | 44,032 | |
New loans | | 30,798 | | 50,745 | |
Repayments and other reductions | | (37,118 | ) | (69,946 | ) |
Participations | | 462 | | 4,564 | |
Ending balance | | $ | 23,537 | | $ | 29,395 | |
No loans to principal officers, directors, and their affiliates were past due greater than 90 days at December 31, 2008 or 2007.
Note F: Allowance for Loan Losses
Changes in the allowance for loan losses were as follows:
| | 2008 | | 2007 | | 2006 | |
Balance at beginning of year | | $ | 16,835 | | $ | 16,193 | | $ | 15,329 | |
Addition resulting from acquisition | | 3,039 | | — | | — | |
Provision for loan losses | | 30,315 | | 1,188 | | 1,244 | |
Loans charged-off | | (9,383 | ) | (1,069 | ) | (888 | ) |
Recoveries | | 465 | | 523 | | 508 | |
Balance at end of year | | $ | 41,271 | | $ | 16,835 | | $ | 16,193 | |
Impaired loans aggregated $108.6 million and $30.0 million at December 31, 2008 and 2007, respectively. Average impaired loans in 2008 and 2007 totaled $41.2 million and $19.5 million, respectively. There were no impaired loans without any associated allowance. The majority of the loans deemed impaired were evaluated using the fair value of the collateral as the measurement method with which to determine the specific allocation amount. The related allowance specifically allocated to impaired loans as of December 31, 2008 and 2007 was $15.3 million and $1.8 million, respectively. During 2008, 2007, and 2006, interest recognized on impaired loans, while they were considered impaired, was $474,000, $1.0 million, and $900,000, respectively. Interest income related to impaired loans was recognized on the accrual basis and is not significantly different than the interest income recognized on the cash basis.
Note G: Premises and Equipment
Premises and equipment at December 31 were as follows:
| | 2008 | | 2007 | |
| | Cost | | Accumulated
Depreciation/
Amortization | | Net Book
Value | | Cost | | Accumulated
Depreciation/
Amortization | | Net Book
Value | |
Land | | $ | 19,651 | | $ | — | | $ | 19,651 | | $ | 14,126 | | $ | — | | $ | 14,126 | |
Buildings | | 46,569 | | 16,071 | | 30,498 | | 38,090 | | 14,962 | | 23,129 | |
Leasehold improvements | | 908 | | 522 | | 386 | | 1,156 | | 872 | | 283 | |
Furniture and equipment | | 41,584 | | 29,597 | | 11,987 | | 38,388 | | 26,228 | | 12,160 | |
| | $ | 108,712 | | $ | 46,190 | | $ | 62,522 | | $ | 91,760 | | $ | 42,062 | | $ | 49,698 | |
79
Note H: Goodwill and Intangibles
The Company added $56.9 million in goodwill and $8.9 million in core deposit and other intangible assets as of February 8, 2008 as a result of the Heritage acquisition. At December 31, 2008, the expected amortization of intangible assets is $1.2 million for the year ending December 31, 2009, $1.1 million for the year ending December 31, 2010, $847,000 for the year ending December 31, 2011, $780,000 for the year ending December 31, 2012, and $732,000 for the year ending December 31, 2013. On February 8, 2008, the weighted average amortization period of core deposit and other intangible assets, net was 4.79 years.
Changes in the carrying amount of goodwill and other intangible assets were as follows:
| | 2008 | |
| | Goodwill | | Core Deposit and
Other Intangibles | |
Balance, January 1 | | $ | 2,130 | | $ | — | |
Addition resulting from acquisition | | 56,910 | | 8,917 | |
Amortization | | — | | (1,096 | ) |
Balance, December 31 | | $ | 59,040 | | $ | 7,821 | |
Note I: Mortgage Servicing Rights and Loans Held-for-Sale
Loans held-for-sale at December 31 are as follows: | | | | | |
| | | | | |
| | 2008 | | 2007 | |
Loans held-for-sale | | $ | 23,292 | | $ | 16,677 | |
Less: Allowance to adjust to lower of cost or fair value | | — | | — | |
Loans held-for-sale, net | | $ | 23,292 | | $ | 16,677 | |
Mortgage loans serviced for others are not reported as assets. The principal balances of these loans at December 31, 2008 are as follows:
| | 2008 | | 2007 | |
Mortgage loan portfolios serviced for: | | | | | |
Federal Home Loan Mortgage Corporation | | $ | 7,527 | | $ | 10,078 | |
Federal National Mortgage Association | | 180,623 | | 202,851 | |
Illinois Housing Development Authority | | 9,634 | | 10,397 | |
Sterling Federal | | 22 | | 32 | |
| | | | | | | |
Custodial escrow balances maintained in connection with serviced loans were $1.7 million and $1.8 million at December 31, 2008 and 2007, respectively.
80
Note I: Mortgage Servicing Rights and Loans Held-for-Sale — continued
Activity for capitalized mortgage servicing rights was as follows:
| | 2008 | | 2007 | | 2006 | |
Balance at beginning of year | | $ | 2,569 | | $ | 3,032 | | $ | 2,271 | |
Additions | | 130 | | 237 | | 1,295 | |
Less: Sale of MSR | | | | | | | |
Less: amortization | | (726 | ) | (700 | ) | (534 | ) |
Balance at end of year | | 1,973 | | 2,569 | | 3,032 | |
| | | | | | | |
Changes in the valuation allowance for servicing assets were as follows: | | | | | | | |
Balance at beginning of year | | 87 | | 150 | | — | |
Provisions for impairment | | 1,072 | | 250 | | 150 | |
Less: Valuation related to MSR sold | | — | | — | | — | |
Less: recoveries | | (560 | ) | (313 | ) | — | |
Balance at end of year | | 599 | | 87 | | 150 | |
Net balance | | $ | 1,374 | | $ | 2,482 | | $ | 2,882 | |
| | | | | | | |
Fair value of mortgage servicing rights | | $ | 1,382 | | $ | 2,652 | | $ | 3,086 | |
Fair value at December 31, 2008 was determined using a discount rate of 9.9%, prepayment assumptions of 24.1% CPR from Andrew Davidson & Co., Inc., a risk analytics and consultant vendor, a weighted average delinquency rate of 2.33% and a weighted average foreclosure/bankruptcy rate of 0.47%. Fair value at December 31, 2007 was determined using a discount rate of 9.0%, prepayment assumptions of 14.4% CPR from Andrew Davidson & Co., Inc., a weighted average delinquency rate of 1.35% and a weighted average foreclosure/bankruptcy rate of 0.36%.
The weighted average amortization period is 3.5 years. Estimated amortization expense for each of the next five years is as follows:
2009 | | $ | 458 | |
2010 | | 326 | |
2011 | | 241 | |
2012 | | 183 | |
2013 | | 144 | |
Note J: Deposits
Major classifications of deposits at December 31 were as follows:
| | 2008 | | 2007 | |
Non-interest bearing | | $ | 318,092 | | $ | 271,549 | |
Savings | | 109,991 | | 96,425 | |
NOW accounts | | 274,888 | | 247,262 | |
Money market accounts | | 543,325 | | 505,678 | |
Certificates of deposit of less than $100,000 | | 696,240 | | 599,034 | |
Certificates of deposit of $100,000 or more | | 444,592 | | 393,670 | |
| | $ | 2,387,128 | | $ | 2,113,618 | |
The above table includes brokered certificates of deposit totaling $102.4 million and $55.3 million at December 31, 2008 and 2007, respectively.
81
Note J: Deposits — continued
At year-end 2008, scheduled maturities of time deposits were as follows:
2009 | | $ | 882,087 | |
2010 | | 107,474 | |
2011 | | 91,738 | |
2012 | | 12,705 | |
2013 | | 46,593 | |
Thereafter | | 235 | |
Total | | $ | 1,140,832 | |
The following table sets forth the amount and maturities of deposits of $100,000 or more at December 31, 2008:
3 months or less | | $ | 88,080 | |
Over 3 months through 6 months | | 117,629 | |
Over 6 months through 12 months | | 137,271 | |
Over 12 months | | 101,612 | |
| | $ | 444,592 | |
Note K: Borrowings
The following table is a summary of borrowings as of December 31:
| | 2008 | | 2007 | |
Securities sold under agreement to repurchase | | $ | 46,345 | | $ | 53,222 | |
Federal funds purchased | | 28,900 | | 165,100 | |
FHLB advances | | 167,018 | | 80,000 | |
Treasury tax and loan | | 2,365 | | 2,873 | |
Junior subordinated debentures | | 58,378 | | 57,399 | |
Subordinated debt | | 45,000 | | — | |
Note payable and other borrowings | | 23,184 | | 18,610 | |
| | $ | 371,190 | | $ | 377,204 | |
The Company enters into sales of securities under agreements to repurchase (repurchase agreements) which generally mature within 1 to 90 days from the transaction date. These repurchase agreements are treated as financings and they are secured by mortgage-backed securities with a carrying amount $48.5 million and $56.0 million at December 31, 2008 and 2007. The securities sold under agreements to repurchase consisted of U.S. government agencies at December 31, 2008 and 2007.
The following table is a summary of additional information related to repurchase agreements:
| | 2008 | | 2007 | | 2006 | |
Average daily balance during the year | | $ | 45,183 | | $ | 53,323 | | $ | 46,461 | |
Average interest rate during the year | | 1.85 | % | 4.48 | % | 4.37 | % |
Maximum month-end balance during the year | | 60,014 | | 58,509 | | 52,282 | |
Weighted average interest rate at year-end | | 0.95 | % | 4.03 | % | 4.90 | % |
| | | | | | | | | | |
82
Note K: Borrowings — continued
The Company’s borrowings at the FHLB are limited to the lesser of 35% of total assets or 60% of the book value of certain mortgage loans. In addition, these notes were collateralized by FHLB stock of $9.3 million and loans totaling $318.4 million at December 31, 2008. FHLB stock of $7.8 million and loans totaling $278.6 million were similarly pledged at December 31, 2007. An FHLB advance of $165 million that was outstanding at December 31, 2008 matured on January 20, 2009 and was replaced with a $165 million FHLB advance that is scheduled to mature on February 20, 2009. Additionally, an FHLB advance of $2 million that was outstanding on December 31, 2008 is scheduled to mature on May 11, 2009.
The Bank is a Treasury Tax & Loan (“TT&L”) depository for the Federal Reserve Bank (FRB), and as such, accepts TT&L deposits. The Company is allowed to hold these deposits for the FRB until they are called. The interest rate is the federal funds rate less 25 basis points. Securities with a face value greater than or equal to the amount borrowed are pledged as a condition of holding TT&L deposits.
The Company completed the sale of $27.5 million of cumulative trust preferred securities by its unconsolidated subsidiary, Old Second Capital Trust I in June 2003. An additional $4.1 million of cumulative trust preferred securities was sold in the first week of July 2003. The costs associated with the tender offers of the cumulative trust preferred securities are being amortized over 30 years. The trust-preferred securities can remain outstanding for a 30-year term but, subject to regulatory approval, they can be called in whole or in part by the Company beginning on June 30, 2008 and from time to time thereafter. Cash distributions on the securities are payable quarterly at a fixed annual rate of 7.80%. The Company issued a new $32.6 million subordinated debenture to the Trust in return for the aggregate net proceeds of this trust preferred offering. The interest rate and payment frequency on the debenture are equivalent to the cash distribution basis on the trust preferred securities.
The Company issued an additional $25.0 million of cumulative trust preferred securities through a private placement completed by an additional unconsolidated subsidiary, Old Second Capital Trust II (“the Trust”) in April 2007. Although nominal in amount, the costs associated with that issuance are being amortized over 30 years. These trust preferred securities also mature in 30 years, but subject to the aforementioned regulatory approval, can be called in whole or in part on a quarterly basis commencing June 15, 2017. The quarterly cash distributions on the securities are fixed at 6.766% through June 15, 2017 and float at 150 basis points over the British Bankers Association three-month LIBOR rate thereafter. The Company issued a new $25.8 million subordinated debenture to the Trust in return for the aggregate net proceeds of this trust preferred offering and to provide the primary source of financing for the common stock tender offer that was completed in May 2007. The interest rate and payment frequency on the debenture are equivalent to the cash distribution basis on the trust preferred securities.
Both of the debentures issued by Old Second Bancorp, Inc. are recorded on the Consolidated Balance Sheets as junior subordinated debentures and the related interest expense for each issuance is included in the Consolidated Statements of Income.
The Company had a $30 million revolving line of credit available with Marshall & Ilsley Bank (“M&I”) which had an outstanding balance of $18.6 million as of December 31, 2007. On January 31, 2008, the Company entered into a $75.5 million credit facility with LaSalle Bank National Association, (now Bank of America NA), which was comprised of a $30.5 million senior debt facility and $45.0 million of subordinated debt. The senior debt facility included a $500,000 term loan with a maturity of March 31, 2018, and a revolving loan with a maturity of March 31, 2010. The revolving loan replaced the $30.0 million revolving line of credit facility previously held with M&I. At December 31, 2008, $17.6 million was outstanding on that line. Pending approval and negotiations with Bank of America NA, management expects to renew the revolving loan after it matures in 2010. The subordinated debt matures on March 31, 2018. The interest rate on the senior debt facility resets quarterly, and is based on, at the Company’s option, either the Bank of America NA prime rate or three-month LIBOR plus 90 basis points. The interest rate on the subordinated debt resets quarterly, and is equal to three-month LIBOR plus 150 basis points. The senior debt is secured with all of the issued and outstanding shares of Old Second National Bank.
83
Note K: Borrowings — continued
The above credit facility agreement contains usual and customary provisions regarding acceleration upon the occurrence of an event of default by the Company under the agreement, as described therein. The agreement also contains certain customary representations and warranties and financial and negative covenants. At December 31, 2008, the Company did not comply with one of the financial covenants contained within that credit agreement. The lender subsequently granted the Company a waiver as of December 31, 2008 of that covenant with no significant additional consideration or change in terms. The Company’s compliance with the requirements of the loan agreement are measured quarterly. The proceeds of the $45.0 million of subordinated debt were primarily used to finance the acquisition of Heritage, including transaction costs. The $30.5 million borrowing facility is for general corporate purposes and was primarily used in the past to repurchase common stock.
Scheduled maturities and weighted average rates of borrowings for the years ended December 31, were as follows:
| | 2008 | | 2007 | |
| | Balance | | Weighted
Average
Rate | | Balance | | Weighted
Average
Rate | |
2009 | | $ | 244,628 | | 0.51% | | $ | 319,805 | | 4.23% | |
2010 | | 22,684 | | 4.73% | | — | | — | |
2011 | | — | | — | | — | | — | |
2012 | | — | | — | | — | | — | |
2013 | | — | | — | | — | | — | |
Thereafter | | 103,378 | | 6.43% | | 57,399 | | 7.34% | |
Total | | $ | 371,190 | | 2.43% | | $ | 377,204 | | 4.70% | |
Note L: Income Taxes
Income tax expense (benefit) for the year ended December 31 was as follows:
| | 2008 | | 2007 | | 2006 | |
Current federal | | $ | 9,340 | | $ | 9,484 | | $ | 9,311 | |
Current state | | 424 | | — | | 1,018 | |
Deferred federal | | (6,298 | ) | (503 | ) | (474 | ) |
Deferred state | | (1,143 | ) | (161 | ) | 15 | |
| | $ | 2,323 | | $ | 8,820 | | $ | 9,870 | |
84
Note L: Income Taxes — continued
The following were the components of the deferred tax assets and liabilities as of December 31:
| | 2008 | | 2007 | |
Allowance for loan losses | | $ | 17,391 | | $ | 7,098 | |
Deferred compensation | | 692 | | 937 | |
Amortization of core deposit intangible assets | | 445 | | 394 | |
Other assets | | 1,450 | | 1,108 | |
Deferred tax assets | | 19,978 | | 9,537 | |
| | | | | |
Accumulated depreciation on premises and equipment | | (1,854 | ) | (1,959 | ) |
Accretion on securities | | (136 | ) | (256 | ) |
Mortgage servicing rights | | (831 | ) | (1,083 | ) |
Goodwill amortization | | (2,924 | ) | — | |
Other liabilities | | (1,829 | ) | (1,276 | ) |
Deferred tax liabilities | | (7,574 | ) | (4,574 | ) |
| | 12,404 | | 4,963 | |
Tax benefit (liability) on net unrealized losses (gains) on securities | | 1,364 | | (1,293 | ) |
Net deferred tax asset | | $ | 13,768 | | $ | 3,670 | |
No valuation allowance for deferred tax assets was recorded at December 31, 2008 and 2007 as management believes it is more likely than not that all of the deferred tax assets will be realized because they were supported by recoverable taxes paid in prior years. The Company considered FIN 48 through December 31, 2008 in making the determination not to record a tax reserve.
The components of the provision for deferred income tax expense (benefit) were as follows:
| | 2008 | | 2007 | | 2006 | |
Provision for loan losses | | $ | (10,293 | ) | $ | (336 | ) | $ | (663 | ) |
Deferred Compensation | | 245 | | (90 | ) | (158 | ) |
Amortization of core deposit intangible assets | | (51 | ) | 94 | | (50 | ) |
Depreciation | | (105 | ) | (268 | ) | (2 | ) |
Net premiums and discounts on securities | | (120 | ) | 21 | | 60 | |
Mortgage servicing rights | | (252 | ) | (183 | ) | 316 | |
Goodwill | | 2,924 | | — | | — | |
Other, net | | 211 | | 98 | | 38 | |
| | $ | (7,441 | ) | $ | (664 | ) | $ | (459 | ) |
Effective tax rates differ from federal statutory rates applied to financial statement income due to the following:
| | 2008 | | 2007 | | 2006 | |
Tax at statutory federal income tax rate | | $ | 4,952 | | $ | 11,477 | | $ | 11,734 | |
Nontaxable interest income, net of disallowed interest deduction | | (1,984 | ) | (1,776 | ) | (1,588 | ) |
BOLI income | | (215 | ) | (707 | ) | (721 | ) |
State income taxes, net of federal benefit | | (467 | ) | (105 | ) | 672 | |
General business credit | | (152 | ) | (152 | ) | (152 | ) |
Other, net | | 189 | | 83 | | (75 | ) |
Tax at effective tax rate | | $ | 2,323 | | $ | 8,820 | | $ | 9,870 | |
85
Note M: Retirement Plans
In previous years the Company had a tax-qualified noncontributory defined benefit retirement plan covering substantially all full-time and regular part-time employees of the Company. Benefits were generally based on years of service and compensation.
As of December 31, 2005, the defined benefit retirement plan was terminated. Prior to December 31, 2006, all amounts due were paid to participants of the defined benefit plan.
The following table sets forth the plans’ status and amounts recognized in the financial statements prior to the final distribution that occurred in 2006:
| | 2006 | |
Accumulated benefit obligation | | $ | — | |
Change in the projected benefit obligation | | | |
Projected benefit obligation at beginning of year | | $ | 13,811 | |
Service cost | | — | |
Interest cost | | 577 | |
Actuarial loss | | 1,055 | |
Curtailment | | — | |
Settlement | | (15,246 | ) |
Benefits paid | | (197 | ) |
Benefit obligation at end of year | | $ | — | |
Change in plan assets | | | |
Fair value of plan assets at beginning of year | | $ | 13,922 | |
Actual return on plan assets | | 611 | |
Employer contributions | | 910 | |
Settlement | | (15,246 | ) |
Benefits paid | | (197 | ) |
Fair value of the asset at end of year | | $ | — | |
Accrued pension cost | | | |
Funded status | | $ | — | |
Unrecognized net actuarial loss (gain) | | — | |
Unrecognized net transition asset | | — | |
Accrued benefit cost | | $ | — | |
Net periodic pension cost | | | |
Service cost | | $ | — | |
Interest cost | | 577 | |
Expected return on assets | | (611 | ) |
Amortization of unrecognized: | | | |
Net loss (gain) | | 54 | |
Prior service cost | | — | |
Additional cost due to curtailment | | — | |
Net periodic pension cost | | $ | 20 | |
| | | |
Amounts applicable to the supplemental retirement plan | | | |
Projected benefit obligation | | $ | — | |
Accumulated benefit obligation | | — | |
Key assumptions: | | | |
Discount rate | | 4.73 | % |
Long-term rate of return on assets | | 5.00 | % |
Salary increases | | N/A | |
The investment objectives changed in 2006 to facilitate the termination of the plan and the distribution of benefits to all plan participants that was completed prior to December 31, 2006.
86
Note N: Employee Benefit Plans
Old Second Bancorp, Inc. Employees 401(k) Savings Plan and Trust
The Company sponsors a qualified, tax-exempt pension plan qualifying under section 401(k) of the Internal Revenue Code. Virtually all employees are eligible to participate after meeting certain age and service requirements. Eligible employees are permitted to contribute up to a dollar limit set by law of their compensation to the 401(k) plan. Pursuant to the plan, the Company matches up to 100% of a participant’s deferral into the 401(k) plan limited to 6% of each participant’s salary. The profit sharing portion of the 401(k) plan arrangement provides an annual discretionary contribution to the retirement account of each employee based in part on the Company’s profitability in a given year, and on each participant’s annual compensation. Participants can choose between several different investment options under the 401(k) plan, including shares of the Company’s common stock.
The total expense relating to the 401(k) plan was approximately $2.1 million, $2.2 million, and $2.0 million in 2008, 2007 and 2006, respectively.
Old Second Bancorp, Inc. Voluntary Deferred Compensation Plan for Executives
The Company sponsors an executive deferred compensation plan, which is a means by which certain executives may voluntarily defer a portion of their salary or bonus. This plan is an unfunded, nonqualified deferred compensation arrangement. Company obligations under this arrangement as of December 31, 2008 and December 31, 2007 were $1.6 million and $2.2 million and are included in other liabilities.
Note O: Long-Term Incentive Plan
The Long-Term Incentive Plan (the “Incentive Plan”) authorizes the issuance of up to 1,333,332 shares of the Company’s common stock, including the granting of qualified stock options, non-qualified stock options, restricted stock, restricted stock units, and stock appreciation rights. Total shares issuable under the plan were 664,277 at December 31, 2008. Stock based awards may be granted to selected directors and officers or employees at the discretion of the board of directors. No stock options were granted in 2008. Stock options granted in 2007 and 2006 were for a term of ten years.
Vesting of stock options granted in 2004 and prior years was accelerated to immediately vest all options as of December 20, 2005. Options granted in 2005 were immediately vested and options granted subsequent to 2006 vest over three years. Restricted stock vests three years from the grant date. Awards under the Incentive Plan become fully vested upon a merger or change in control of the Company.
Total compensation cost that has been charged against income for those plans was $1.0 million, $685,000, $209,000 in 2008, 2007 and 2006, respectively. The total income tax benefit was $355,000, $240,000 and $73,000 in 2008, 2007 and 2006, respectively.
The fair value of each option award is estimated on the date of grant using a closed form option valuation (Binomial) model that uses the assumptions noted in the table below. Expected volatilities are based on the previous five year historical volatilities of the Company’s common stock. The Company uses historical data to estimate option exercise and post-vesting termination behavior. The expected term of options granted is based on historical data and represents the period of time that options granted are expected to be outstanding, which takes into account that the options are not transferable. The risk-free interest rate for the expected term of the option is based on the U.S. Treasury yield curve in effect at the time of the grant.
87
Note O: Long-Term Incentive Plan – Continued
No options were granted in 2008. The fair value of options granted in 2007 and 2006 was determined using the following weighted-average assumptions as of grant date:
| | 2007 | | 2006 | |
Risk-free interest rate | | 3.38 | % | 4.63 | % |
Expected term (years) | | 5 | | 5 | |
Expected stock price volatility | | 24.23 | % | 23 .45 | % |
Dividend yield | | 2.30 | % | 1.80 | % |
As of December 31, 2008, there was $528,000 of total unrecognized compensation cost related to non-vested stock options granted under the Plan. The cost is expected to be recognized over a weighted-average period of 1.8 years.
A summary of stock option activity in the Incentive Plan is as follows:
| | Shares | | Weighted
Average
Exercise
Price | | Weighted-
Average
Remaining
Contractual
Term | | Aggregate
Intrinsic
Value | |
Beginning outstanding | | 740,798 | | $ | 23.67 | | | | | |
Granted | | — | | — | | | | | |
Exercised | | (18,666 | ) | 10.03 | | | | | |
Expired | | — | | — | | | | | |
Ending outstanding | | 722,132 | | $ | 24.03 | | 5.3 | | $ | 209,460 | |
| | | | | | | | | |
Exercisable at end of year | | 635,470 | | $ | 23.46 | | 4.8 | | $ | 209,460 | |
A summary of changes in the Company’s non-vested options in the Incentive Plan is as follows:
| | 2008 | |
| | Shares | | Weighted
Average
Grant Date
Fair Value | |
Nonvested at January 1 | | 142,332 | | $ | 6.53 | |
Granted | | — | | — | |
Forfeited | | — | | — | |
Vested | | (55,670 | ) | 6.65 | |
Nonvested at December 31 | | 86,662 | | $ | 6.45 | |
A summary of stock option activity as of each year is as follows:
| | 2008 | | 2007 | | 2006 | |
Intrinsic value of options exercised | | $ | 171,269 | | $ | 527,505 | | $ | 720,038 | |
Cash received from option exercises | | 187,266 | | 466,258 | | 615,732 | |
Tax benefit realized from option exercises | | 68,063 | | 209,657 | | 285,706 | |
Weighted average fair value of options granted | | N/A | | $ | 6.10 | | $ | 7.35 | |
| | | | | | | | | | |
Restricted stock was granted beginning in 2005 under the Incentive Plan. There were 27,254 shares issued in 2008, 26,184 in 2007, and 1,517 in 2006. These shares are subject to forfeiture until certain restrictions have lapsed including employment for a specific period. Compensation expense is recognized over the vesting period of the shares based on the market value of the shares at issue date.
88
Note O: Long-Term Incentive Plan – Continued
A summary of changes in the Company’s non-vested shares of restricted stock is as follows:
| | 2008 | |
| | Shares | | Weighted
Average
Grant Date
Fair Value | |
Nonvested at January 1 | | 46,065 | | $ | 30.09 | |
Granted | | 27,254 | | 27.75 | |
Vested | | (20,008 | ) | 31.16 | |
Forfeited | | — | | — | |
Nonvested at December 31 | | 53,311 | | $ | 28.49 | |
As of December 31, 2008, there was $712,000 of total unrecognized compensation cost related to non-vested shares granted under the Plan. The cost is expected to be recognized over a weighted-average period of 2.0 years. There were 20,008 shares that vested during the year ended December 31, 2008 and none vested during years ended December 31, 2007 and 2006.
Note P: Earnings per Share
| | 2008 | | 2007 | | 2006 | |
Basic Earnings Per Share: | | | | | | | |
Weighted-average common shares outstanding | | 13,584,381 | | 12,508,551 | | 13,367,062 | |
Net income available to common stockholders | | $ | 11,824 | | $ | 23,972 | | $ | 23,656 | |
Basic earnings per share | | $ | 0.87 | | $ | 1.92 | | $ | 1.77 | |
| | | | | | | |
Diluted Earnings Per Share: | | | | | | | |
Weighted-average common shares outstanding | | 13,584,381 | | 12,508,551 | | 13,367,062 | |
Dilutive effect of restricted shares | | 32,970 | | 16,273 | | 3,051 | |
Dilutive effect of stock options | | 71,863 | | 130,482 | | 156,490 | |
Diluted average common shares outstanding | | 13,689,214 | | 12,655,306 | | 13,526,603 | |
Net income available to common stockholders | | $ | 11,824 | | $ | 23,972 | | $ | 23,656 | |
Diluted earnings per share | | $ | 0.86 | | $ | 1.89 | | $ | 1.75 | |
| | | | | | | |
Number of antidilutive options excluded from diluted earnings per share calculation | | 475,000 | | 373,000 | | 224,906 | |
89
Note Q: Other Comprehensive Income
The following table summarizes the related income tax effect for the components of Other Comprehensive Income as of December 31:
| | 2008 | | 2007 | | 2006 | |
Unrealized holding (losses) gains on available-for-sale securities arising during the period | | $ | (4,774 | ) | $ | 8,146 | | $ | 3,772 | |
Related tax benefit (expense) | | 1,911 | | (3,224 | ) | (1,503 | ) |
Holding (losses) gains after tax | | (2,863 | ) | 4,922 | | 2,269 | |
| | | | | | | |
Less: Reclassification adjustment for the net gains and losses realized during the period | | | | | | | |
Realized gains | | 1,955 | | 695 | | 418 | |
Realized losses | | (73 | ) | (21 | ) | — | |
Net realized gains | | 1,882 | | 674 | | 418 | |
Income tax benefit on net realized gains | | (746 | ) | (268 | ) | (166 | ) |
Net realized gains after tax | | 1,136 | | 406 | | 252 | |
Other comprehensive (loss) income on available-for-sale securities | | (3,999 | ) | 4,516 | | 2,017 | |
| | | | | | | |
Changes in fair value of derivatives used for cashflow hedges arising during the period | | (158 | ) | — | | — | |
Related tax benefit | | 63 | | — | | — | |
Other comprehensive loss on cash flow hedge | | (95 | ) | — | | — | |
Total other comprehensive (loss) income | | $ | (4,094 | ) | $ | 4,516 | | $ | 2,017 | |
Note R: Commitments
In the normal course of business, there are outstanding commitments that are not reflected in the financial statements. Commitments include financial instruments that involve, to varying degrees, elements of credit, interest rate, and liquidity risk. In management’s opinion, these do not represent unusual risks and management does not anticipate significant losses as a result of these transactions. The Company uses the same credit policies in making commitments and conditional obligations as it does for on-balance-sheet instruments. Financial standby letters of credit, performance standby letters of credit, and commercial letters of credit outstanding at December 31, 2008 totaled $62.9 million. As of December 31, 2008, firm commitments to fund loans in the future were approximately $438.0 million, of which $84.9 million were fixed rate and $353.1 million were variable rate. Finacial standby letters of credit, performance standby letters of credit, and commercial letters of credit outstanding at December 31, 2007 were approximately $61.0 million. As of December 31, 2007, firm commitments to fund loans in the future totaled $355.5 million, of which $35.6 million were fixed rate and $319.9 million were variable rate. As of December 31, 2008, there were other commitments and contingent liabilities arising in the normal course of business that, in management’s opinion, will not have a material effect on future financial results.
Certain branches of the Bank occupy certain facilities under long-term operating leases, and, in addition, the Company leases certain software and data processing and other equipment. Some of these leases and contracts contain escalation clauses, with the majority of these escalation clauses based on a flat percentage increase for each annual period covered. The range of percentage increases is between 2% and 5%. Also, most of the leases and contracts contain renewal clauses that can be invoked by the Company upon notification of the lessor. The estimated aggregate minimum annual rental commitments under these leases total $1.6 million in 2009, $705,000 in 2010, $300,000 in 2011, $182,000 in 2012 and $107,000 in 2013. In addition, the Company also receives rental income on certain leased properties. The estimated rental income to be received is $255,000 in 2009, $203,000 in 2010, $46,000 in 2011, $49,000 in 2012 and $49,000 in 2013. Total operating lease expense, net of rental income, recorded under all operating leases was $423,000 in 2008, $739,000 in 2007 and $628,000 in 2006.
90
Note R: Commitments – Continued
Legal proceedings
The Company and its subsidiaries have, from time to time, collection suits in the ordinary course of business against its debtors and are defendants in legal actions arising from normal business activities. Management, after consultation with legal counsel, believes that the ultimate liabilities, if any, resulting from these actions will not have a material adverse effect on the financial position of the Bank or on the consolidated financial position of the Company.
A verdict for approximately $2.0 million was entered in the Circuit Court of LaSalle County on January 17, 2007 in favor of Old Second Bank — Yorkville, a wholly owned subsidiary of the Company, and against an insurance company. The insurance company filed a Notice of Appeal on February 8, 2007 in the Third District Appellate Court of Illinois and oral argument took place in January of 2008. On February 27, 2009, the Appellate Court issued a split decision reversing the trial court ruling against West American. The Company is currently in the process of seeking a review from the Illinois Supreme Court of the Appellate Court’s decision. As a result, the Company has not recorded any amount of the original judgment.
Note S: Capital
The Company and the Bank are subject to regulatory capital requirements administered by the federal banking agencies. Capital adequacy guidelines and prompt corrective action regulations involve quantitative measures of assets, liabilities, and certain off-balance sheet items calculated under regulatory accounting practices. Capital amounts and classifications are also subject to qualitative judgments by regulators. Failure to meet capital requirements can initiate regulatory action.
Prompt corrective action regulations provide five classifications: well capitalized, adequately capitalized, undercapitalized, significantly undercapitalized, and critically undercapitalized, although these terms are not used to represent overall financial condition. If adequately capitalized, regulatory approval is required to accept brokered deposits. If undercapitalized, capital distributions are limited, as is asset growth and expansion, and plans for capital restoration are required. Actual and required capital amounts (in thousands) and ratios are presented below at year-end.
As of the Company’s and the Bank’s most recent regulatory notification, the Company and the Bank were categorized as well capitalized. Management is not aware of any conditions or events since the most recent regulatory notification that would change the Company’s or the Bank’s categories. The accompanying table shows the capital ratios of the Company and the Bank as of December 31, 2008 and 2007.
91
Note S: Capital — continued
Capital levels and minimum required levels at December 31, 2008:
| | Actual
at year-end | | Minimum Required
for Capital
Adequacy Purposes | | Minimum Required
to be Well
Capitalized | |
| | Amount | | Ratio | | Amount | | Ratio | | Amount | | Ratio | |
2008: | | | | | | | | | | | | | |
Total capital to risk weighted assets | | | | | | | | | | | | | |
Consolidated | | $ | 263,260 | | 10.76 | % | $ | 195,732 | | 8.00 | % | N/A | | N/A | |
Old Second Bank | | 282,066 | | 11.54 | | 195,540 | | 8.00 | | 244,425 | | 10.00 | |
Tier 1 capital to risk weighted assets | | | | | | | | | | | | | |
Consolidated | | 187,548 | | 7.66 | | 97,936 | | 4.00 | | N/A | | N/A | |
Old Second Bank | | 251,390 | | 10.29 | | 97,722 | | 4.00 | | 146,583 | | 6.00 | |
Tier 1 capital to average assets | | | | | | | | | | | | | |
Consolidated | | 187,548 | | 6.50 | | 115,414 | | 4.00 | | N/A | | N/A | |
Old Second Bank | | 251,390 | | 8.72 | | 115,317 | | 4.00 | | 144,146 | | 5.00 | |
| | | | | | | | | | | | | |
2007: | | | | | | | | | | | | | |
Total capital to risk weighted assets | | | | | | | | | | | | | |
Consolidated | | $ | 218,140 | | 10.58 | % | $ | 164,945 | | 8.00 | % | N/A | | N/A | |
Old Second Bank | | 235,867 | | 11.45 | | 164,798 | | 8.00 | | 205,997 | | 10.00 | |
Tier 1 capital to risk weighted assets | | | | | | | | | | | | | |
Consolidated | | 194,846 | | 9.45 | | 82,474 | | 4.00 | | N/A | | N/A | |
Old Second Bank | | 219,041 | | 10.63 | | 82,424 | | 4.00 | | 123,636 | | 6.00 | |
Tier 1 capital to average assets | | | | | | | | | | | | | |
Consolidated | | 194,846 | | 7.50 | | 103,918 | | 4.00 | | N/A | | N/A | |
Old Second Bank | | 219,041 | | 8.44 | | 103,811 | | 4.00 | | 129,764 | | 5.00 | |
National and state bank regulations and capital guidelines limit the amount of dividends that may be paid by the Bank without prior regulatory approval. At December 31, 2008, approximately $40.3 million was available for the payment of dividends by the Bank to the Company.
Total trust preferred proceeds of $56.6 million are held by outside investors and qualified as Tier 1 regulatory capital as of December 31, 2008. Additionally, the $45.0 million in subordinated debt that was obtained to finance the February 2008 acquisition qualified as Tier 2 regulatory capital as of December 31, 2008. At December 31, 2007, Trust preferred proceeds of $49.3 million qualified and Tier 1 regulatory capital and $6.5 million qualified as Tier 2 regulatory capital.
As discussed in the capital section of the management discussion and analysis section, the Company announced on January 16, 2009 that the United States Department of the Treasury (“Treasury”) had completed its investment of $73 million in Series B fixed rate cumulative perpetual preferred stock and warrants to purchase common stock of the Company as part of Treasury’s TARP Capital Purchase Program. The entire amount received by the Company qualifies as Tier 1 regulatory capital at the holding company level.
Note T: Mortgage Banking Derivatives
Commitments to fund certain mortgage loans (interest rate locks) to be sold into the secondary market and forward commitments for the future delivery of mortgage loans to third party investors are considered derivatives. It is the Company’s practice to enter into forward commitments for the future delivery of residential mortgage loans when interest rate lock commitments are entered into in order to economically hedge the effect of changes in interest rates resulting from its commitments to fund the loans. These mortgage banking derivatives are not designated in hedge relationships pursuant to SFAS No. 133. At December 31, 2008, the Company had approximately $49.3 million of interest rate lock commitments and $49.3 million of forward commitments for the future delivery of
92
Note T: Mortgage Banking Derivatives — continued
residential mortgage loans. The fair value of these mortgage banking derivatives was reflected by a derivative asset of $148,000 and a derivative liability of $148,000 and recorded in other assets and other liabilities, respectively, on the Consolidated Balance Sheets. At December 31, 2007, the Company had approximately $16.6 million of interest rate lock commitments and $16.6 million of forward commitments for the future delivery of residential mortgage loans. The fair value of these mortgage banking derivatives was reflected by a derivative asset of $66,000 and a derivative liability of $66,000. Fair values were estimated based on changes in mortgage interest rates from the date of the commitments. Changes in the fair values of these mortgage banking derivatives are included in net gains on sales of loans. The Company sold $310.5 million in loans to investors of which Countrywide received $82.9 million or 26.7%, Chase Manhattan Bank received 82.9 million or 26.7%, GMAC received $62.1 million or 20.0% and Franklin American received $38.7 million or 12.5%.
Note U: Fair Values of Financial Instruments
The estimated fair values approximate carrying amount for all items except those described in the following table. Security fair values are based upon market prices or dealer quotes, and if no such information is available, on the rate and term of the security. Fair values of loans were estimated for portfolios of loans with similar financial characteristics, such as type and fixed or variable interest rate terms. Cash flows were discounted using current rates at which similar loans would be made to borrowers with similar ratings and for similar maturities. The fair value of time deposits is estimated using discounted future cash flows at current rates offered for deposits of similar remaining maturities. The fair values of borrowings were estimated based on interest rates available to the Company for debt with similar terms and remaining maturities. The fair value of off-balance sheet items is not considered material. The fair value of mortgage banking derivatives is discussed above in Note T.
The carrying amount and estimated fair values of financial instruments were as follows:
| | 2008 | | 2007 | |
| | Carrying
Amount | | Fair
Value | | Carrying
Amount | | Fair
Value | |
Financial assets: | | | | | | | | | |
Cash due from banks and federal funds sold | | $ | 71,596 | | $ | 71,596 | | $ | 63,174 | | $ | 63,174 | |
Interest bearing deposits with financial institutions | | 809 | | 809 | | 403 | | 403 | |
Securities available-for-sale | | 406,386 | | 406,386 | | 560,859 | | 560,859 | |
FHLB and FRB Stock | | 13,044 | | 13,044 | | 8,947 | | 8,947 | |
Bank-owned life insurance | | 48,754 | | 48,754 | | 47,936 | | 47,936 | |
Loans, net and loans held-for-sale | | 2,264,550 | | 2,266,331 | | 1,890,952 | | 1,897,819 | |
Accrued interest receivable | | 11,910 | | 11,910 | | 14,273 | | 14,273 | |
| | $ | 2,817,049 | | $ | 2,818,830 | | $ | 2,586,544 | | $ | 2,593,411 | |
Financial liabilities: | | | | | | | | | |
Deposits | | $ | 2,387,128 | | $ | 2,408,381 | | $ | 2,113,618 | | $ | 2,118,862 | |
Securities sold under repurchase agreements | | 46,345 | | 46,348 | | 53,222 | | 53,222 | |
Federal funds purchased | | 28,900 | | 28,900 | | 165,100 | | 165,100 | |
Other short-term borrowings | | 169,383 | | 169,463 | | 82,873 | | 82,873 | |
Junior subordinated debentures | | 58,378 | | 56,269 | | 57,399 | | 56,067 | |
Subordinated debt | | 45,000 | | 44,940 | | — | | — | |
Notes payable and other borrowings | | 23,184 | | 23,372 | | 18,610 | | 18,610 | |
Accrued interest payable | | 5,023 | | 5,023 | | 7,013 | | 7,013 | |
| | $ | 2,763,341 | | $ | 2,782,696 | | $ | 2,497,835 | | $ | 2,501,747 | |
93
Note V: Fair Value Option and Fair Value Measurements
Fair Value Measurement
FAS 157 defines fair value as the exchange price that would be received for an asset or paid to transfer a liability (an exit price) in the principal or most advantageous market for the asset or liability in an orderly transaction between market participants on the measurement date. FAS 157 also establishes a fair value hierarchy, which requires an entity to maximize the use of observable inputs and minimize the use of unobservable inputs when measuring fair value. The standard describes three levels of inputs that may be used to measure fair value:
Level 1: Quoted prices (unadjusted) for identical assets or liabilities in active markets that the Company has the ability to access as of the measurement date.
Level 2: Significant observable inputs other than Level 1 prices, such as quoted prices for similar assets or liabilities, quoted prices in markets that are not active, and other inputs that are observable or can be corroborated by observable market data.
Level 3: Significant unobservable inputs that reflect a company’s own assumptions about the assumptions that market participants would use in pricing an asset or liability.
The Company uses the following methods and significant assumptions to estimate fair value:
· Investment securities available-for-sale are valued primarily by a third party pricing agent and both the market and income valuation approaches are implemented using the following types of inputs:
· U.S. treasury securities are priced using the market approach and utilizing live data feeds from active market exchanges for identical securities.
· Government-sponsored agency debt securities are primarily priced using available market information through processes such as benchmark curves, market valuations of like securities, sector groupings and matrix pricing.
· Other government-sponsored agency securities, mortgage-backed securities and some of the actively traded REMICs and CMOs are primarily priced using available market information including benchmark yields, prepayment speeds, spreads and volatility of similar securities.
· Other inactive government-sponsored agency securities are primarily priced using consensus pricing and dealer quotes.
· State and political subdivisions are largely grouped by characteristics, i.e., geographical data and source of revenue in trade dissemination systems. Because some securities are not traded daily and due to other grouping limitations, active market quotes are often obtained using benchmarking for like securities.
· Collateralized debt obligations (“CDO”) held by the Company are collateralized by trust preferred security issuances of other financial institutions. These securities are not traded daily and are primarily priced using available market information through processes such as benchmark curves, market valuations of like securities, knowledge of credit events in underlying collateral, and standard fixed income techniques.
· Marketable equity securities are priced using available market information.
· Residential mortgage loans eligible for sale in the secondary market are carried at the lower of cost or fair value. The fair value of loans held-for-sale is determined, when possible, using quoted secondary market prices. If no such quoted price exists, the fair value of a loan is determined using quoted prices for a similar asset or assets, adjusted for the specific attributes of that loan.
· Lending related commitments to fund certain residential mortgage loans (interest rate locks) to be sold in the secondary market and forward commitments for the future delivery of mortgage loans to third party investors are considered derivatives. Fair values are estimated based on observable changes in mortgage interest rates from the date of the commitment and do not typically involve significant judgments by management.
94
Note V: Fair Value Option and Fair Value Measurements — continued
· The fair value of mortgage servicing rights is based on a valuation model that calculates the present value of estimated net servicing income. The valuation model incorporates assumptions that market participants would use in estimating future net servicing income to derive the resultant value. The Company is able to compare the valuation model inputs, such as the discount rate, prepayment speeds, weighted average delinquency and foreclosure/bankruptcy rates to widely available published industry data for reasonableness.
· Interest rate swap positions, both assets and liabilities, are valued by means of Bloomberg pricing models using an income approach based upon readily observable market parameters such as interest rate yield curves in liquid markets.
· The Company has one risk participation agreement (“RPA”) in an interest rate swap contract issued by a correspondent bank, which is discussed in Note W. While the swap is valued by means of Bloomberg pricing models using an income approach based upon readily observable market parameters, the market value of the associated credit risk contained in the RPA is estimated using a probability of default rate, which is derived from management’s internal risk rating system.
· The fair value of impaired loans with specific allocations of the allowance for loan losses is generally based on recent real estate appraisals. These appraisals may utilize a single valuation approach or a combination of approaches including comparable sales and the income approach. Adjustments are routinely made in the appraisal process by the appraisers to adjust for differences between the comparable sales and income data available. Such adjustments are typically significant and result in a Level 3 classification of the inputs for determining fair value.
Assets and Liabilities Measured at Fair Value on a Recurring Basis:
The table below presents the balance of assets and liabilities at December 31, 2008 measured at fair value on a recurring basis:
| | December 31, 2008 | |
| | Level 1 | | Level 2 | | Level 3 | | Total | |
Assets: | | | | | | | | | |
Investment securities available-for-sale | | $ | 22,779 | | $ | 383,555 | | $ | 52 | | $ | 406,386 | |
Other assets (Interest rate swap agreements) | | — | | 4,860 | | — | | 4,860 | |
Other assets (Forward loan commitments to investors) | | — | | (148 | ) | — | | (148 | ) |
Total | | $ | 22,779 | | $ | 388,267 | | $ | 52 | | $ | 411,098 | |
| | | | | | | | | |
Liabilities: | | | | | | | | | |
Other liabilities (Interest rate swap agreements) | | $ | — | | $ | 5,018 | | $ | — | | $ | 5,018 | |
Other liabilities (Interest rate lock commitments to borrowers) | | — | | (148 | ) | — | | (148 | ) |
Other liabilities (Risk Participation Agreement)) | | — | | — | | 26 | | 26 | |
Total | | $ | — | | $ | 4,870 | | $ | 26 | | $ | 4,896 | |
In 2008, there were no material changes or amounts in Level 3 assets or liabilities measured at fair value on a recurring basis.
Assets and Liabilities Measured at Fair Value on a Non-recurring Basis:
The Company may be required, from time to time, to measure certain other financial instruments at fair value on a non-recurring basis in accordance with FAS 157. These assets consist of mortgage servicing rights, impaired loans and loans held-for-sale (“LHFS”). Adjustments to fair value on LHFS primarily result from application of lower-of-cost-or-fair value accounting. At December 31, 2008 LHFS were valued at the lower-of-cost basis. For assets measured at fair value on a non-recurring basis on hand at December 31, 2008, the following table provides the level of valuation assumptions used to determine each valuation and the carrying value of the related assets:
95
Note V: Fair Value Option and Fair Value Measurements — continued
| | December 31, 2008 | |
| | Level 1 | | Level 2 | | Level 3 | | Total | |
Mortgage servicing rights(1) | | $ | — | | $ | — | | $ | 1,374 | | $ | 1,374 | |
Loans(2) | | — | | — | | 65,792 | | 65,792 | |
Total | | $ | — | | $ | — | | $ | 67,166 | | $ | 67,166 | |
(1) Mortgage servicing rights, which are carried at the lower-of-cost or fair value, totaled approximately $1.4 million, which is net of a valuation reserve amount of approximately $599,000. A net recovery of $512,000 was included in earnings for the year ending December 31, 2008.
(2) Represents carrying value and related write-downs of loans for which adjustments are based on the appraised value of collateral for collateral-dependent loans, had a carrying amount of $85.2 million, with a valuation allowance of $15.3 million, resulting in an additional provision for loan losses of $13.5 million for the year ending December 31, 2008. The carrying value of loans fully charged off is zero.
Note W: Interest Rate Swaps
The Company utilizes interest rate swap agreements as part of its asset liability management strategy to help manage its interest rate risk position. The notional amount of the interest rate swaps does not represent amounts exchanged by the parties. The amount exchanged is determined by reference to the notional amount and the other terms of the individual interest rate swap agreements.
Interest Rate Swap Designated a Cash Flow Hedge
The interest rate swap notional amount entered into on October 24, 2008 totaled $45.0 million as of December 31, 2008, was designated as a cash flow hedge of certain subordinated debentures and was determined to be fully effective during the period presented. As such, no amount of ineffectiveness has been included in net income. Therefore, the aggregate fair value of the swap is recorded in other liabilities with changes in fair value recorded in other comprehensive loss. The amount included in accumulated other comprehensive loss would be reclassified to current earnings should the hedge no longer be considered effective. The Company expects the hedge to remain fully effective during the remaining terms of the swap. There was no such subordinated debenture or associated interest rate swap as of December 31, 2007.
Summary information about the interest-rate swap designated as a cash flow hedge as of year-end is as follows:
| | 2008 | |
Notional amount | | $ | 45,000,000 | |
Weighted average pay rate | | 2.86 | % |
Weighted average receive rate | | 3.54 | % |
Weighted average maturity | | 0.25 | |
Unrealized loss | | $ | 95,229 | |
Interest income recorded on this swap transaction totaled $61,000 for year ended December 31, 2008 and was reported as a reduction to interest expense on subordinated debentures. At December 31, 2008, the Company expected the unrealized loss to be a potential adjustment to interest expense in 2009.
Other Interest Rate Swaps
The Company also has interest rate derivative positions that are not designated as hedging instruments. These derivative positions relate to transactions in which the Bank enters into an interest rate swap with a client while at the same time entering into an offsetting interest rate swap with another financial institution. In connection with each transaction, the Bank agrees to pay interest to the client on a notional amount at a variable interest rate and receive interest from the client on the same notional amount at a fixed interest rate. At the same time, the Bank agrees to pay another financial institution the same fixed interest rate on the same notional amount and receive the same variable
96
Note W: Interest Rate Swaps — continued
interest rate on the same notional amount. The transaction allows the client to effectively convert a variable rate loan to a fixed rate and also is part of the Company’s interest rate risk management strategy. Because the Bank acts as an intermediary for the client, changes in the fair value of the underlying derivative contracts offset each other and do not impact the results of operations. Fair value measurements are discussed in Note V above. At December 31, 2008, the notional amount of non-hedging interest rate swaps was $52.6 million with a weighted average maturity of 4.5 yrs. There were no interest rate swaps as of December 31, 2007.
On October 8, 2008, the Bank entered into a risk participation agreement (“RPA”) in a swap transaction with a correspondent bank and received a participation payment. As a participant in the RPA agreement, the Bank is not a party to the swap transaction, but it does act as a financial guarantor of 26.49% of the close out value of the swap should the counterparty to the swap transaction default or otherwise fail to perform its payment obligation which ends June 27, 2011. The Bank estimates the market value of the RPA monthly and includes the estimated change in value in its quarterly operating results. The maximum theoretical upper bound of dollar exposure of this credit risk is approximately $707,000 and is derived by assuming interest rates reached an effective rate of 0.0%. The actual potential credit risk of the RPA at December 31, 2008 was approximately $448,000.
Note X: Parent Company Condensed Financial Information
Condensed Balance Sheets as of December 31 were as follows:
| | 2008 | | 2007 | |
Assets | | | | | |
Non-interest-bearing deposit with bank subsidiary | | $ | 10 | | $ | 2,094 | |
Investment in subsidiaries | | 315,456 | | 225,057 | |
Securities available-for-sale | | — | | — | |
Other assets | | 2,758 | | 1,895 | |
| | $ | 318,224 | | $ | 229,046 | |
Liabilities and Stockholders’ Equity | | | | | |
Junior subordinated debentures | | $ | 58,378 | | $ | 57,399 | |
Subordinated debt | | 45,000 | | — | |
Other liabilities | | 21,750 | | 21,758 | |
Stockholders’ equity | | 193,096 | | 149,889 | |
| | $ | 318,224 | | $ | 229,046 | |
Condensed Statements of Income for the years ended December 31 were as follows:
| | 2008 | | 2007 | | 2006 | |
Operating Income | | | | | | | |
Cash dividends received from subsidiaries | | $ | 11,171 | | $ | 13,389 | | $ | 9,073 | |
Other income | | 155 | | 173 | | 229 | |
| | 11,326 | | 13,562 | | 9,302 | |
Operating Expenses | | | | | | | |
Junior subordinated debentures interest expense | | 4,281 | | 3,629 | | 2,467 | |
Subordinated debt | | 1,831 | | — | | — | |
Other interest expense | | 794 | | 1,025 | | 489 | |
Other expenses | | 3,277 | | 3,011 | | 3,590 | |
| | 10,183 | | 7,665 | | 6,546 | |
Income before income taxes and equity in undistributed net income of subsidiaries | | 1,143 | | 5,897 | | 2,756 | |
Income tax benefit | | (3,969 | ) | (2,969 | ) | (2,491 | ) |
Income before equity in undistributed net income of subsidiaries | | 5,112 | | 8,866 | | 5,247 | |
Equity in undistributed net income of subsidiaries | | 6,712 | | 15,106 | | 18,409 | |
Net income | | $ | 11,824 | | $ | 23,972 | | $ | 23,656 | |
97
Note X: Parent Company Condensed Financial Information — continued
Condensed Statements of Cash Flows for the years ended December 31 were as follows:
| | 2008 | | 2007 | | 2006 | |
Cash Flows from Operating Activities | | | | | | | |
Net income | | $ | 11,824 | | $ | 23,972 | | $ | 23,656 | |
Adjustments to reconcile net income to net cash from operating activities: | | | | | | | |
Equity in undistributed net income of subsidiaries | | (6,712 | ) | (15,106 | ) | (18,409 | ) |
Change in taxes payable | | (342 | ) | 757 | | 243 | |
Change in other assets | | (990 | ) | 154 | | (324 | ) |
Securities gains | | — | | (163 | ) | (227 | ) |
Stock-based compensation | | 908 | | 685 | | 209 | |
Other, net | | 412 | | 86 | | 44 | |
Net cash provided by operating activities | | 5,100 | | 10,385 | | 5,192 | |
| | | | | | | |
Cash Flows from Investing Activities | | | | | | | |
Proceeds from the sales and maturities of securities available-for-sale | | — | | 163 | | 227 | |
Investment in unconsolidated subsidiary | | — | | (774 | ) | — | |
Outlays for business acquisitions | | (87,557 | ) | — | | — | |
Net cash (used in) provided by investing activities | | (87,557 | ) | (611 | ) | 227 | |
| | | | | | | |
Cash Flows from Financing Activities | | | | | | | |
Dividends paid | | (8,275 | ) | (7,294 | ) | (7,230 | ) |
Proceeds from notes payable and other borrowings | | (560 | ) | 2,185 | | 13,225 | |
Purchases of treasury stock | | (41 | ) | (31,239 | ) | (13,181 | ) |
Proceeds from the issuance of subordinated debt | | 45,000 | | — | | — | |
Proceeds from junior subordinated debentures | | 979 | | 25,774 | | — | |
Proceeds from the issuance of common stock | | 43,000 | | — | | — | |
Proceeds from stock options exercised | | 187 | | 466 | | 616 | |
Tax benefit from stock options exercised | | 68 | | 209 | | 286 | |
Tax benefit from dividend equivalent payment | | 15 | | — | | — | |
Net cash used in financing activities | | 80,373 | | (9,899 | ) | (6,284 | ) |
Net change in cash and cash equivalents | | (2,084 | ) | (125 | ) | (865 | ) |
Cash and cash equivalents at beginning of year | | 2,094 | | 2,219 | | 3,084 | |
Cash and cash equivalents at end of year | | $ | 10 | | $ | 2,094 | | $ | 2,219 | |
Note Y: Summary of Quarterly Financial Information (unaudited)
The following represents unaudited quarterly financial information for the periods indicated:
| | 2008 | | 2007 | |
| | 4th | | 3rd | | 2nd | | 1st | | 4th | | 3rd | | 2nd | | 1st | |
Interest income | | $ | 37,710 | | $ | 39,195 | | $ | 40,230 | | $ | 40,792 | | $ | 40,195 | | $ | 40,186 | | $ | 38,631 | | $ | 36,729 | |
Interest expense | | 14,297 | | 15,562 | | 17,702 | | 20,852 | | 22,434 | | 22,878 | | 21,581 | | 20,250 | |
Net interest income | | 23,413 | | 23,633 | | 22,528 | | 19,940 | | 17,761 | | 17,308 | | 17,050 | | 16,479 | |
Provision for loan losses | | 21,215 | | 6,300 | | 1,900 | | 900 | | — | | 600 | | 588 | | — | |
Securities gains (loss) | | 519 | | (20 | ) | 1,075 | | 308 | | 181 | | 11 | | — | | 482 | |
Income before taxes | | (9,702 | ) | 5,470 | | 10,640 | | 7,739 | | 8,967 | | 8,191 | | 7,766 | | 7,868 | |
Net income (loss) | | (5,183 | ) | 4,121 | | 7,322 | | 5,564 | | 6,421 | | 6,077 | | 5,726 | | 5,748 | |
Basic earnings per share | | (0.39 | ) | 0.30 | | 0.53 | | 0.43 | | 0.53 | | 0.50 | | 0.45 | | 0.44 | |
Diluted earnings per share | | (0.39 | ) | 0.30 | | 0.53 | | 0.42 | | 0.52 | | 0.49 | | 0.45 | | 0.43 | |
Dividends paid per share | | 0.16 | | 0.16 | | 0.16 | | 0.15 | | 0.15 | | 0.15 | | 0.15 | | 0.14 | |
| | | | | | | | | | | | | | | | | | | | | | | | | |
98
Note Z: Stockholders’ Rights Plan
On September 17, 2002, the Company’s Board of Directors adopted a Stockholders’ Rights Plan. The Plan provided for the distribution of one right on October 10, 2002, for each share of the Company’s outstanding common stock as of September 27, 2002. The rights have no immediate economic value to stockholders because they cannot be exercised unless and until a person, group or entity acquires 15% or more of the Company’s common stock or announces a tender offer. The Plan also permits the Company’s Board of Directors to redeem each right for one cent under various circumstances. In general, the Plan provides that if a person, group or entity acquires a 15% or larger stake in the Company or announces a tender offer, and the Company’s Board chooses not to redeem the rights, all holders of rights, other than the 15% stockholder, will be able to purchase a certain amount of the Company’s common stock for half of its market price.
99
REPORT OF INDEPENDENT REGISTERED PUBLIC ACCOUNTING FIRM
Audit * Tax * Advisory
Grant Thornton LLP
175 W Jackson Boulevard,
Chicago, IL 60604-2687
T 312.856.0200
F 312.565.4719
www.GrantThornton.com
Board of Directors and Stockholders
Old Second Bancorp, Inc. and Subsidiaries
We have audited the accompanying consolidated balance sheets of Old Second Bancorp, Inc. (a Delaware Corporation) and Subsidiaries as of December 31, 2008 and 2007, and the related consolidated statements of income, changes in stockholders’ equity and cash flows for each of the three years in the period ended December 31, 2008. These financial statements are the responsibility of the Company’s management. Our responsibility is to express an opinion on these financial statements based on our audits.
We conducted our audits in accordance with the standards of the Public Company Accounting Oversight Board (United States). Those standards require that we plan and perform the audit to obtain reasonable assurance about whether the financial statements are free of material misstatement. An audit includes examining, on a test basis, evidence supporting the amounts and disclosures in the financial statements. An audit also includes assessing the accounting principles used and significant estimates made by management, as well as evaluating the overall financial statement presentation. We believe that our audits provide a reasonable basis for our opinion.
In our opinion, the consolidated financial statements referred to above present fairly, in all material respects, the consolidated financial position of Old Second Bancorp, Inc. and Subsidiaries as of December 31, 2008 and 2007, and the consolidated results of its operations and its cash flows for each of the three years in the period ended December 31, 2008, in conformity with accounting principles generally accepted in the United States of America.
We also have audited, in accordance with the standards of the Public Company Accounting Oversight Board (United States), Old Second Bancorp, Inc. and Subsidiaries’ internal control over financial reporting as of December 31, 2008, based on criteria established in Internal Control - Integrated Framework issued by the Committee of Sponsoring Organizations of the Treadway Commission (“COSO”) and our report dated March 15, 2009, expressed an unqualified opinion.

Chicago, Illinois
March 15, 2009
100
Old Second Bancorp, Inc. and Subsidiaries
Corporate Information
Corporate Office
37 River Street
Aurora, Illinois 60506-4173
(630) 892-0202
www.oldsecond.com
Market for the Company’s Common Stock
The Company’s common stock trades on The Nasdaq Stock Market under the symbolOSBC”. As of December 31, 2008, the Company had approximately 1,080 stockholders of record of its common stock. The following table sets forth the range of prices during each quarter for 2008 and 2007. Stock prices have been restated to reflect stock splits.
| | 2008 | | 2007 | |
| | High | | Low | | Dividend | | High | | Low | | Dividend | |
First quarter | | $ | 29.38 | | $ | 24.05 | | $ | 0.15 | | $ | 29.87 | | $ | 27.16 | | $ | 0.14 | |
Second quarter | | 28.51 | | 11.53 | | 0.16 | | 30.27 | | 27.61 | | 0.15 | |
Third quarter | | 26.97 | | 10.65 | | 0.16 | | 30.73 | | 25.81 | | 0.15 | |
Fourth quarter | | 21.35 | | 11.11 | | 0.16 | | 30.92 | | 25.96 | | 0.15 | |
| | | | | | | | | | | | | | | | | | | |
Form 10-K and Other Information
We maintain a website at http://www.oldsecond.com. We make available free of charge on or through the Company’s website, the Company’s annual report on Form 10-K, quarterly reports on Form 10-Q, current reports on Form 8-K and amendments to those reports filed or furnished pursuant to Section 13(a) or 15(d) of the Exchange Act as soon as reasonably practicable after we electronically file such material with, or furnish it to, the Securities and Exchange Commission. The Company’s code of conduct and charters of the Company’s various committees of the Board of Directors are also available on the website. We will also provide copies of the Company’s filings free of charge upon written request to J. Douglas Cheatham, Executive Vice President and Chief Financial Officer, Old Second Bancorp, Inc., 37 South River Street, Aurora, Illinois 60506-4173.
Transfer Agent/Stockholder Services
Inquiries related to stockholders records, stock transfers, changes of ownership, change of address and dividend payments should be sent to the transfer agent at the following address:
Old Second Bancorp, Inc.
c/o Robin Hodgson, 1st VP Executive Administration
37 River Street
Aurora, Illinois 60506-4173
(630) 906-5480
rhodgson@oldsecond.com
101
Old Second Bancorp, Inc. and Subsidiaries
Consolidating Balance Sheet
December 31, 2008
(In thousands)
| | Old Second
National
Bank | | Old Second
Financial,
Inc. | | Old Second
Bancorp, Inc.
Parent Only | | Consolidating
Adjustments | | Old Second
Bancorp, Inc.
Consolidated | |
Assets | | | | | | | | | | | |
Cash and due from banks | | $ | 66,099 | | $ | 42 | | $ | 10 | | $ | (52 | ) | $ | 66,099 | |
Interest bearing deposits with financial institutions | | 809 | | — | | — | | — | | 809 | |
Federal funds sold | | 5,497 | | — | | — | | — | | 5,497 | |
Short-term securities available-for-sale | | 809 | | — | | — | | — | | 809 | |
Cash and cash equivalents | | 73,214 | | 42 | | 10 | | (52 | ) | 73,214 | |
Securities available-for-sale | | 405,577 | | — | | — | | — | | 405,577 | |
Federal Home Loan Bank and Federal Reserve Bank stock | | 13,044 | | — | | — | | — | | 13,044 | |
Loans held-for-sale | | 23,292 | | — | | — | | — | | 23,292 | |
Loans | | 2,271,114 | | — | | — | | — | | 2,271,114 | |
Less: allowance for loan losses | | 41,271 | | — | | — | | — | | 41,271 | |
Net loans | | 2,229,813 | | — | | — | | — | | 2,229,843 | |
Premises and equipment, net | | 62,522 | | — | | — | | — | | 62,522 | |
Other real estate owned | | 15,212 | | — | | — | | — | | 15,212 | |
Mortgage servicing rights, net | | 1,374 | | — | | — | | — | | 1,374 | |
Goodwill | | 59,040 | | — | | — | | — | | 59,040 | |
Core deposit and other intangible assets, net | | 7,821 | | — | | — | | — | | 7,821 | |
Bank-owned life insurance | | 48,754 | | — | | — | | — | | 48,754 | |
Investment in subsidiaries | | 8 | | — | | 315,456 | | (313,703 | ) | 1,761 | |
Accrued interest and other assets | | 41,986 | | 3 | | 2,758 | | (1,596 | ) | 43,151 | |
Total assets | | $ | 2,981,687 | | $ | 45 | | $ | 318,224 | | $ | (315,351 | ) | $ | 2,984,605 | |
Liabilities | | | | | | | | | | | |
Deposits: | | | | | | | | | | | |
Non-interest demand | | $ | 318,144 | | $ | — | | $ | — | | $ | (52 | ) | $ | 318,092 | |
Interest bearing: | | | | | | | | | | | |
Savings, NOW, and money market | | 928,204 | | — | | — | | — | | 928,204 | |
Time | | 1,140,832 | | — | | — | | — | | 1,140,832 | |
Total deposits | | 2,387,180 | | — | | — | | (52 | ) | 2,387,128 | |
Securities sold under repurchase agreements | | 46,345 | | — | | — | | — | | 46,345 | |
Federal funds purchased | | 28,900 | | — | | — | | — | | 28,900 | |
Other short-term borrowings | | 169,383 | | — | | — | | — | | 169,383 | |
Junior subordinated debentures | | — | | — | | 58,378 | | — | | 58,378 | |
Subordinated debt | | — | | — | | 45,000 | | — | | 45,000 | |
Notes payable and other borrowings | | 5,134 | | — | | 18,050 | | — | | 23,184 | |
Accrued interest and other liabilities | | 31,086 | | 1 | | 3,700 | | (1,596 | ) | 33,191 | |
Total liabilities | | 2,668,845 | | 1 | | 125,128 | | (1,648 | ) | 2,791,509 | |
Stockholders’ Equity | | | | | | | | | | | |
Common stock | | 2,160 | | 25 | | 18,304 | | (2,185 | ) | 18,304 | |
Additional paid-in-capital | | 123,208 | | — | | 58,683 | | (123,208 | ) | 58,683 | |
Retained earnings | | 190,318 | | 19 | | 213,031 | | (190,337 | ) | 213,031 | |
Accumulated other comprehensive loss | | (2,027 | ) | — | | (2,123 | ) | 2,027 | | (2,123 | ) |
Treasury stock | | — | | — | | (94,799 | ) | — | | (94,799 | ) |
Total stockholders’ equity | | 320,548 | | 44 | | 193,096 | | (313,703 | ) | 193,096 | |
Total liabilities and stockholders’ equity | | $ | 2,989,393 | | $ | 45 | | $ | 318,224 | | $ | (315,351 | ) | $ | 2,984,605 | |
102
Old Second Bancorp, Inc. and
Old Second National Bank Directors

| | 
| | 
| | 
| | 
|
| | | | | | | | |
William Skoglund | | James Eccher | | Edward Bonifas | | J. Douglas Cheatham | | Marvin Fagel |
Chairman, President & CEO, | | President & CEO, | | Vice President,Alarm | | Executive Vice President & | | President,Aurora Packing |
Old Second Bancorp, Inc.& | | Old Second | | Detection Systems, Inc. | | Chief Financial Officer; | | Company & Chairman of the |
Chairman, Old Second | | National Bank | | | | Old Second Bancorp, Inc. | | Board & CEO, New City |
National Bank | | | | | | | | Packing Company |

| | 
| | 
| | 
| | 
|
| | | | | | | | |
Barry Finn | | William Kane | | Mary Krasner | | John Ladowicz | | Kenneth Lindgren |
President & CEO,
Rush-Copley | | General Partner;
The Label Printers, Inc. | | General Partner/Owner,
Wyndham Deerpoint Homes | | Former Chairman & CEO,
HeritageBanc Inc. & Heritage | | President,
Daco Incorporated |
Medical Center | | | | | | Bank | | |

| | 
| | 
| | 
| |
| | | | | | | |
D. Chet McKee | | William Meyer | | Gerald Palmer | | James Schmitz | |
Retired,VP Special Projects, | | President, William F. Meyer | | Retired,Vice President & | | Tax Consultant | |
Rush-Copley | | Company | | General Manager; Caterpillar; | | | |
Medical Center | | | | Inc. | | | |
Directors Emeriti
Walter Alexander, President, Alexander Lumber Company
James Benson, Retired Chairman of the Board, Old Second Bancorp, Inc. and Old Second National Bank
Urban Hipp, Retired, Barber-Greene Company
Jesse Maberry, Retired, Aurora Bearing Company
Gary McCarter, Retired, Farmers Group, Inc.
Edward Schmitt, Retired, Schmitt McDonalds
Townsend Way, Jr., Retired, Richards -Wilcox Mfg. Co.
Member FDIC
103
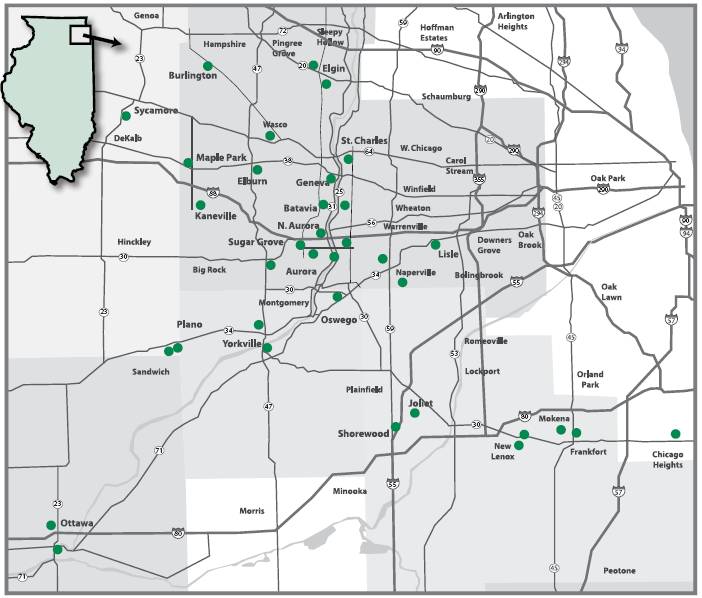
OLD SECOND NATIONAL BANK
37 S. River St., Aurora
1350 N. Farnsworth Ave., Aurora
4080 Fox Valley Ctr. Dr., Aurora
1230 N. Orchard Road, Aurora
555 Redwood Dr., Aurora
1991 W. Wilson St., Batavia
1078 E. Wilson St., Batavia
194 S. Main St., Burlington
195 W. Joe Orr Rd., Chicago Heights
749 N. Main St., Elburn
1000 S. McLean, Elgin
Rt. 20 & Nesler Rd., Elgin | | 20201 S. La Grange Rd., Frankfort
23 S. Fourth St., Geneva
850 Essington Road, Joliet
25101 Harter Rd., Kaneville
3101 Ogden Ave., Lisle
1100 S. County Line Rd., Maple Park
In Berkot’s, 20005 Wolf Rd., Mokena
1964 Springbrook Sq., Naperville
951 E. Lincoln Highway, New Lenox
In Berkot’s, 2141 Calistoga, New Lenox
200 W. John St., North Aurora
1200 Douglas Rd.,Oswego | | 323 E. Norris Dr., Ottawa
In Wal-Mart, 4041 Veterans Dr., Ottawa
In Wal-Mart, 6800 W. Rte. 34, Plano
7050 Burroughs (Rt 34), Plano
801 S. Kirk Road, St. Charles
1015 Brook Forest Ave., Shorewood
Route 47 @ Cross St., Sugar Grove
1810 DeKalb Ave., Sycamore
40W422 Route 64,Wasco
102 E.Van Emmon St.,Yorkville
26 W. Countryside Pkwy.,Yorkville |
1-877-866-0202
Member FDIC
www.oldsecond.com
104