Exhibit 99.1
July 28, 2009 1 |
William B. Skoglund J. Douglas Cheatham Chairman, President & CEO Chief Financial Officer Old Second Bancorp, Inc. Old Second Bancorp, Inc. 630-906-5483 630-906-5484 Rod Sloan Chief Risk Officer Old Second Bancorp, Inc. 630-906-5459 2 |
Forward-looking Statements and Non-GAAP Disclosures In addition to historical information, this presentation contains forward-looking statements, which are subject to certain risks and uncertainties. Forward-looking statements include information concerning possible or assumed future results of Old Second’s operations. Forward-looking statements generally include words such as believes, expects, anticipates and other similar expressions. Stockholders should note that many factors could affect the future financial results of Old Second, causing those results to differ materially from those expressed in this presentation. These factors include operating, legal and regulatory risks; economic, political and competitive forces impacting our business; risk that our analysis of these risks and forces could be incorrect and/or that the strategies developed to address them could be unsuccessful; volatility in interest rates; and other risks and uncertainties which are summarized in our SEC filings. Old Second undertakes no obligation to publicly revise or update these forward-looking statements to reflect events that arise after this presentation. Statements in this presentation may also include adjusted non-GAAP financial measures governed by Regulation G. Generally, we believe that these measures and ratios provide users of our financial information a more accurate view of the performance of the interest-earning assets and interest-bearing liabilities and of our operating efficiency for comparative purposes with other financial holding companies. 3 |
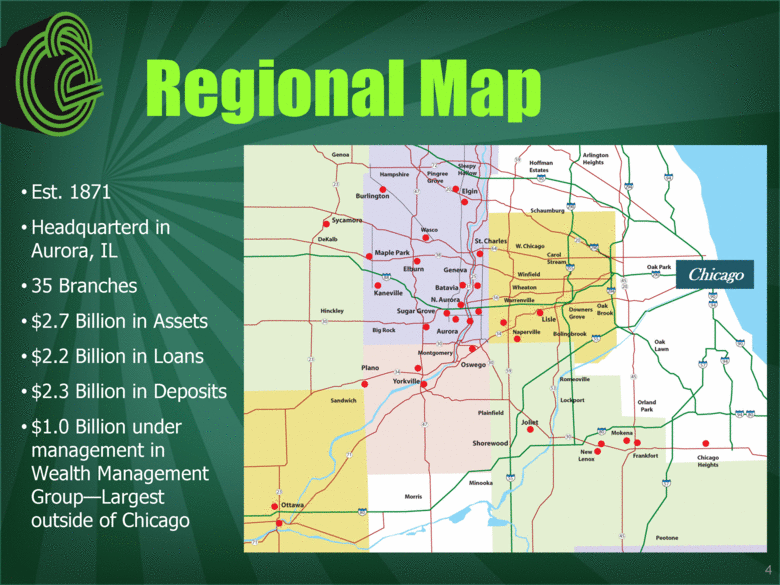
Regional Map Est. 1871 Headquarterd in Aurora, IL 35 Branches $2.7 Billion in Assets $2.2 Billion in Loans $2.3 Billion in Deposits $1.0 Billion under management in Wealth Management Group—Largest outside of Chicago Chicago 4 |
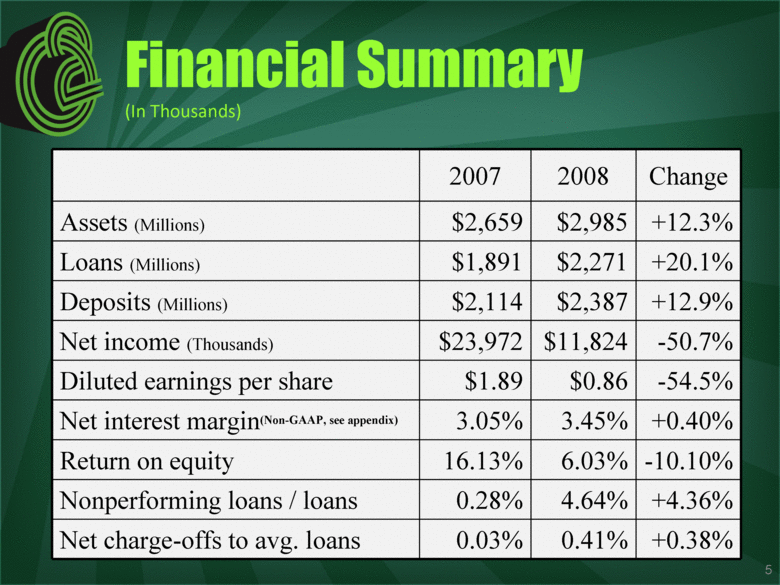
2007 2008 Change Assets (Millions) $2,659 $2,985 +12.3% Loans (Millions) $1,891 $2,271 +20.1% Deposits (Millions) $2,114 $2,387 +12.9% Net income (Thousands) $23,972 $11,824 -50.7% Diluted earnings per share $1.89 $0.86 -54.5% Net interest margin(Non-GAAP, see appendix) 3.05% 3.45% +0.40% Return on equity 16.13% 6.03% -10.10% Nonperforming loans / loans 0.28% 4.64% +4.36% Net charge-offs to avg. loans 0.03% 0.41% +0.38% Financial Summary (In Thousands) 5 |
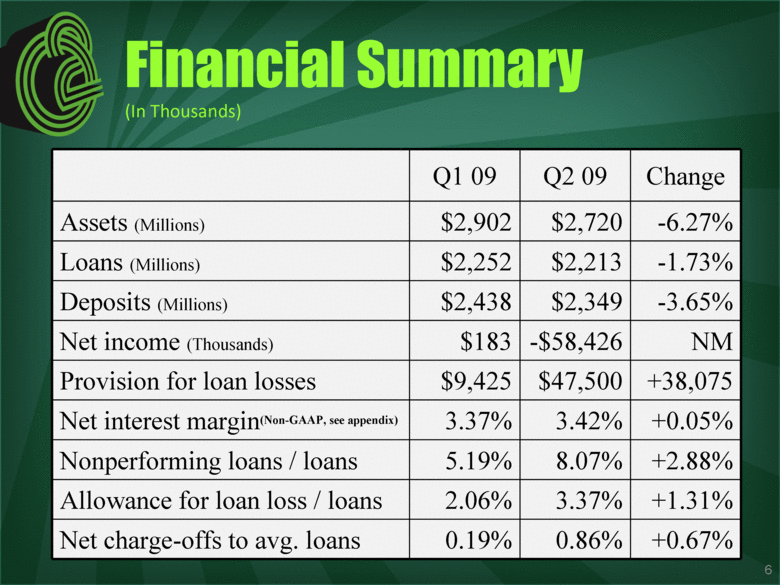
Q1 09 Q2 09 Change Assets (Millions) $2,902 $2,720 -6.27% Loans (Millions) $2,252 $2,213 -1.73% Deposits (Millions) $2,438 $2,349 -3.65% Net income (Thousands) $183 -$58,426 NM Provision for loan losses $9,425 $47,500 +38,075 Net interest margin(Non-GAAP, see appendix) 3.37% 3.42% +0.05% Nonperforming loans / loans 5.19% 8.07% +2.88% Allowance for loan loss / loans 2.06% 3.37% +1.31% Net charge-offs to avg. loans 0.19% 0.86% +0.67% Financial Summary (In Thousands) 6 |
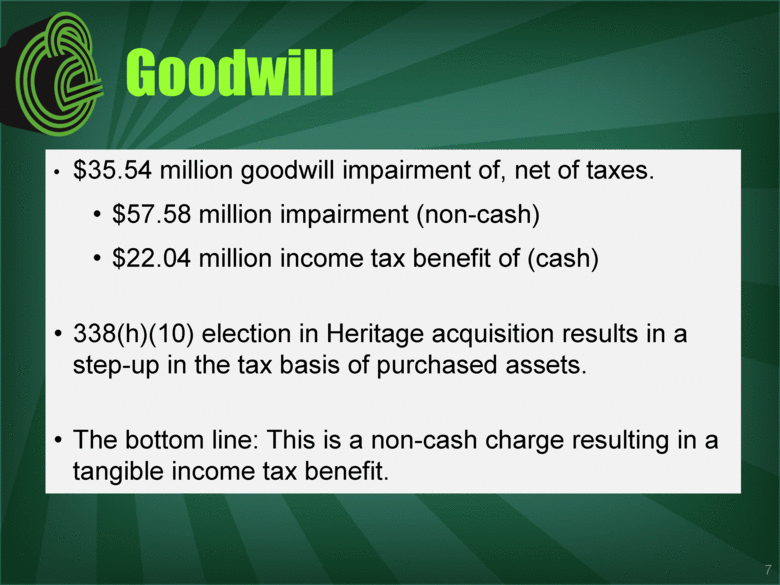
Goodwill $35.54 million goodwill impairment of, net of taxes. $57.58 million impairment (non-cash) $22.04 million income tax benefit of (cash) 338(h)(10) election in Heritage acquisition results in a step-up in the tax basis of purchased assets. The bottom line: This is a non-cash charge resulting in a tangible income tax benefit. 7 |
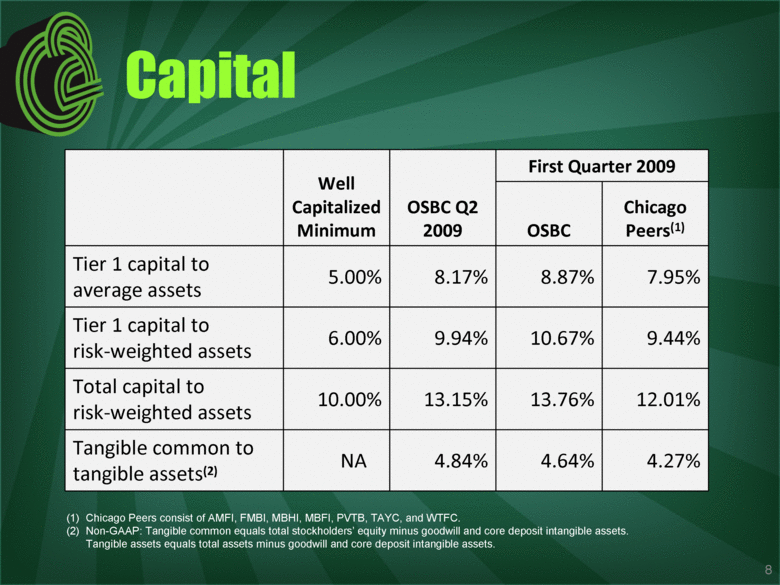
Well Capitalized Minimum OSBC Q2 2009 First Quarter 2009 OSBC Chicago Peers(1) Tier 1 capital to average assets 5.00% 8.17% 8.87% 7.95% Tier 1 capital to risk-weighted assets 6.00% 9.94% 10.67% 9.44% Total capital to risk-weighted assets 10.00% 13.15% 13.76% 12.01% Tangible common to tangible assets(2) NA 4.84% 4.64% 4.27% Capital (1) Chicago Peers consist of AMFI, FMBI, MBHI, MBFI, PVTB, TAYC, and WTFC. (2) Non-GAAP: Tangible common equals total stockholders’ equity minus goodwill and core deposit intangible assets. Tangible assets equals total assets minus goodwill and core deposit intangible assets. 8 |
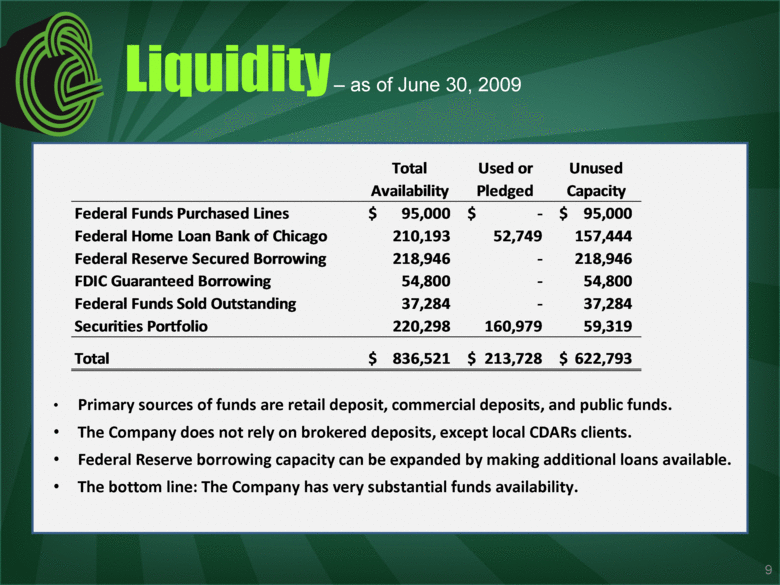
Liquidity – as of June 30, 2009 Primary sources of funds are retail deposit, commercial deposits, and public funds. The Company does not rely on brokered deposits, except local CDARs clients. Federal Reserve borrowing capacity can be expanded by making additional loans available. The bottom line: The Company has very substantial funds availability. 9 Total Used or Unused Availability Pledged Capacity Federal Funds Purchased Lines 95,000 $ - $ 95,000 $ Federal Home Loan Bank of Chicago 210,193 52,749 157,444 Federal Reserve Secured Borrowing 218,946 - 218,946 FDIC Guaranteed Borrowing 54,800 - 54,800 Federal Funds Sold Outstanding 37,284 - 37,284 Securities Portfolio 220,298 160,979 59,319 Total 836,521 $ 213,728 $ 622,793 $ |
Net Interest Margin Chicago Peers consist of AMFI, FMBI, MBHI, MBFI, PVTB, TAYC, and WTFC. 10 2.00% 2.50% 3.00% 3.50% 4.00% Q1 06 Q2 06 Q3 06 Q4 06 Q1 07 Q2 07 Q3 07 Q4 07 Q1 08 Q2 08 Q3 08 Q4 08 Q1 09 Q2 09 OSBC Chicago Peer |
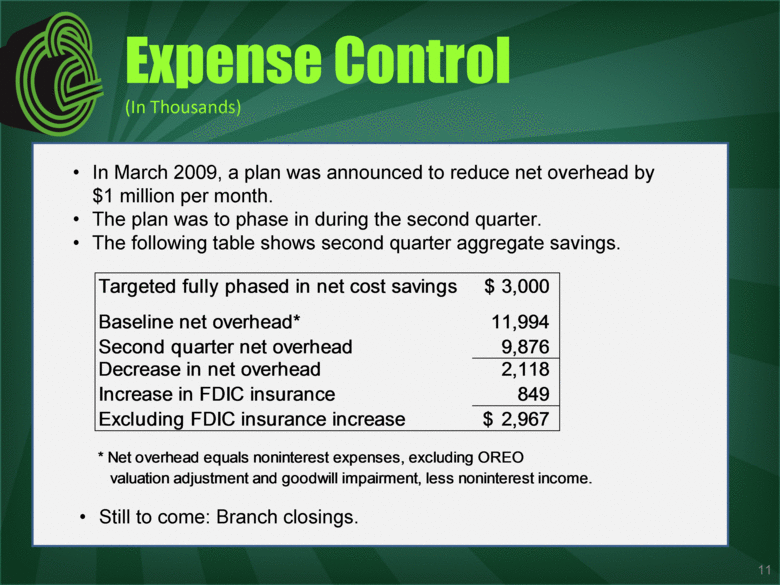
Expense Control (In Thousands) In March 2009, a plan was announced to reduce net overhead by $1 million per month. The plan was to phase in during the second quarter. The following table shows second quarter aggregate savings. Still to come: Branch closings. 11 Targeted fully phased in net cost savings 3,000 $ Baseline net overhead* 11,994 Second quarter net overhead 9,876 Decrease in net overhead 2,118 Increase in FDIC insurance 849 Excluding FDIC insurance increase 2,967 $ * Net overhead equals noninterest expenses, excluding OREO valuation adjustment and goodwill impairment, less noninterest income. |
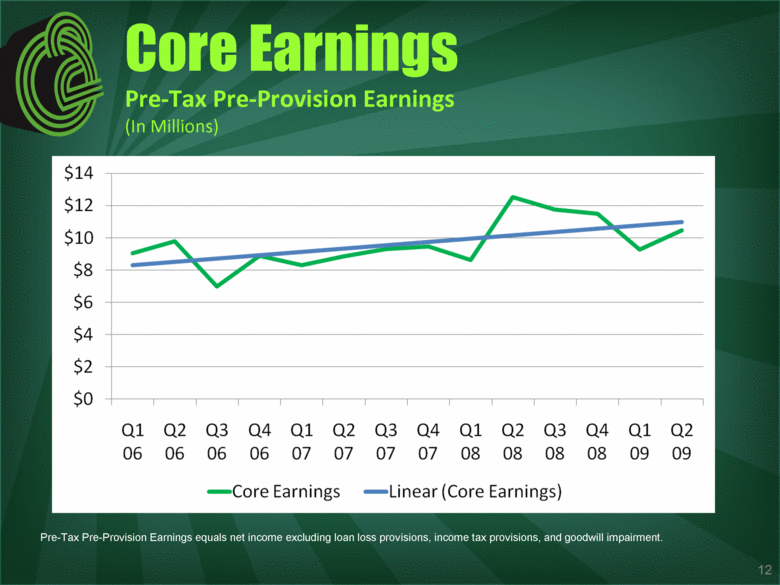
Pre-Tax Pre-Provision Earnings equals net income excluding loan loss provisions, income tax provisions, and goodwill impairment. Core Earnings Pre-Tax Pre-Provision Earnings (In Millions) $14 $12 $10 $8 $6 $4 $2 $0 Q1 06 Q2 06 Q3 06 Q4 06 Q1 07 Q2 07 Q3 07 Q4 07 Q1 08 Q2 08 Q3 08 Q4 08 Q1 09 Q2 09 12 |
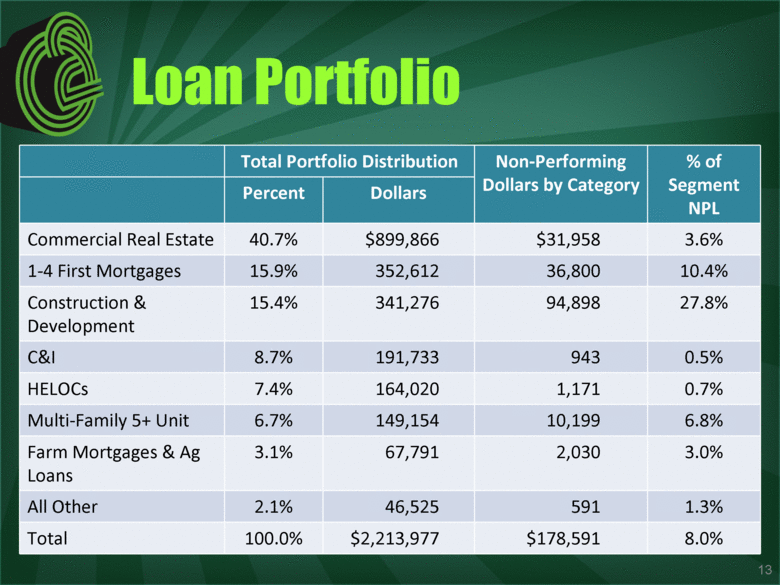
Loan Portfolio Total Portfolio Distribution Non-Performing Dollars by Category % of Segment NPL Percent Dollars Commercial Real Estate 40.7% $899,866 $31,958 3.6% 1-4 First Mortgages 15.9% 352,612 36,800 10.4% Construction & Development 15.4% 341,276 94,898 27.8% C&I 8.7% 191,733 943 0.5% HELOCs 7.4% 164,020 1,171 0.7% Multi-Family 5+ Unit 6.7% 149,154 10,199 6.8% Farm Mortgages & Ag Loans 3.1% 67,791 2,030 3.0% All Other 2.1% 46,525 591 1.3% Total 100.0% $2,213,977 $178,591 8.0% 13 |
Construction & Development Composition % of C&D Portfolio % of Segment NPL Homebuilder Lots & Spec/Model Homes 44.0% 37.2% Land Only 20.1% 27.5% Speculative Commercial Lots & Buildings 18.9% 29.9% Other Construction 17.0% 1.6% 20% FAS 5 pool established for non-impaired adversely-rated loans. % of portfolio in C&D is 15.3%, down from a peak of 22% in early 2008. Minimal amount of city condo construction. Most homebuilder exposure is ready-for-build residential lots for low-priced/mid-priced homes. Less than 1% of the homebuilder exposure is outside N Illinois or NW Indiana. Regular re-appraisal process performed on large credits. Only 0.87% of the C&D portfolio is 30-89 days past due and still accruing. 14 |
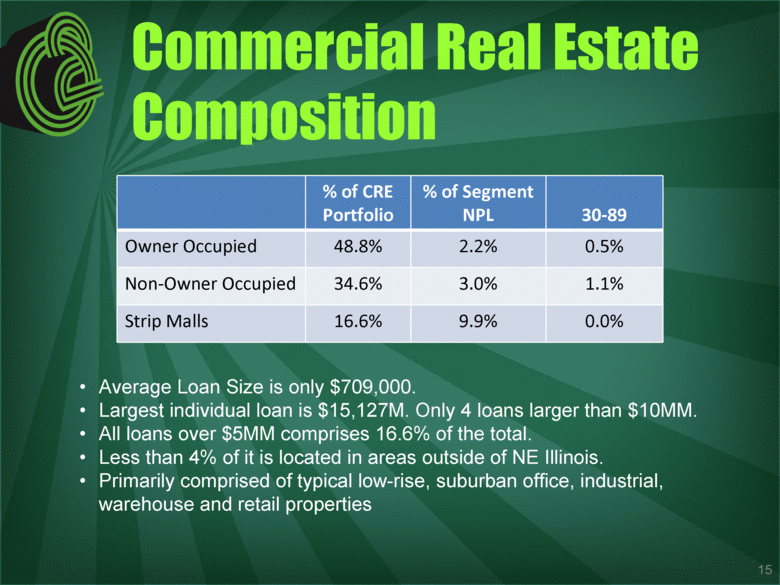
Commercial Real Estate Composition % of CRE Portfolio % of Segment NPL 30-89 Owner Occupied 48.8% 2.2% 0.5% Non-Owner Occupied 34.6% 3.0% 1.1% Strip Malls 16.6% 9.9% 0.0% Average Loan Size is only $709,000. Largest individual loan is $15,127M. Only 4 loans larger than $10MM. All loans over $5MM comprises 16.6% of the total. Less than 4% of it is located in areas outside of NE Illinois. Primarily comprised of typical low-rise, suburban office, industrial, warehouse and retail properties 15 |
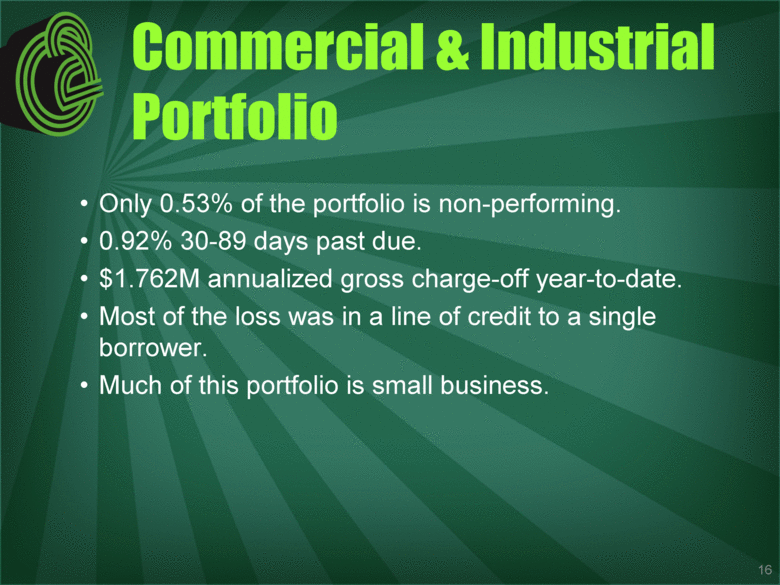
Commercial & Industrial Portfolio Only 0.53% of the portfolio is non-performing. 0.92% 30-89 days past due. $1.762M annualized gross charge-off year-to-date. Most of the loss was in a line of credit to a single borrower. Much of this portfolio is small business. 16 |
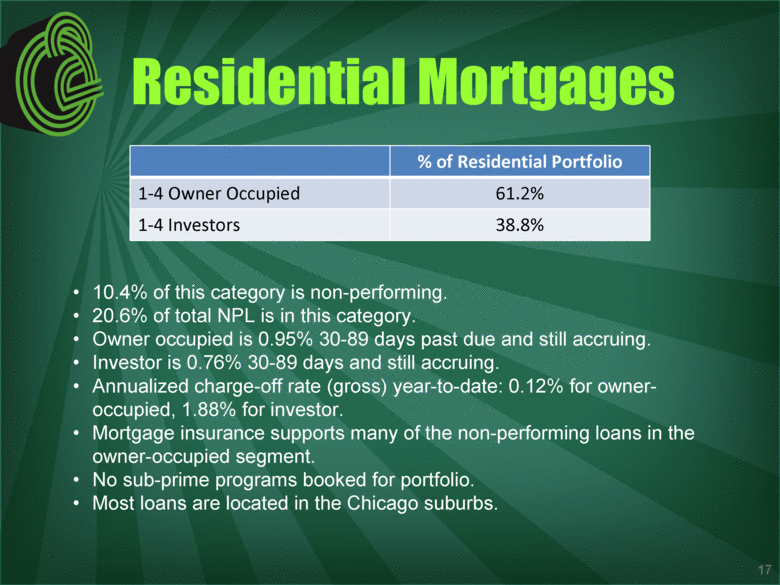
Residential Mortgages 10.4% of this category is non-performing. 20.6% of total NPL is in this category. Owner occupied is 0.95% 30-89 days past due and still accruing. Investor is 0.76% 30-89 days and still accruing. Annualized charge-off rate (gross) year-to-date: 0.12% for owner-occupied, 1.88% for investor. Mortgage insurance supports many of the non-performing loans in the owner-occupied segment. No sub-prime programs booked for portfolio. Most loans are located in the Chicago suburbs. % of Residential Portfolio 1-4 Owner Occupied 61.2% 1-4 Investors 38.8% 17 |
HELOC Portfolio 0.71% of the portfolio is non-performing. 0.33% 30-89 days past due and still accruing. 0.92% annualized gross charge-off rate. October 2008 portfolio review indicated 74% were FICO scored above 720. Loss-given-default will be elevated due to value deflation, but defaults are few. 18 |
Credit Quality Summary Problems heavily concentrated in construction loans. A high % of C&D credits has already experienced adverse migration. The mark-to-no-market conundrum. Elapsed time can benefit valuations in well-positioned locations. Indicators do not suggest severe impact on CRE from economic conditions. Substantially increased resources in workout. 19 |
Business Highlights Strong core banking franchise with good fundamental earnings Expanding NIM while gaining market share in largest markets Community-based relationship model delivering large bank product capabilities Proactively taking steps to improve credit quality Strong regulatory capital base and good liquidity position Experienced management team Lowered expenses by over $1 million per month Record profits in mortgage division while gaining leading market share position in Kane and Kendall County High Margin Wealth Management Group $1.0 Billion in Assets 53% Pre-Tax Margin $9.2 Million in Revenue 20 |
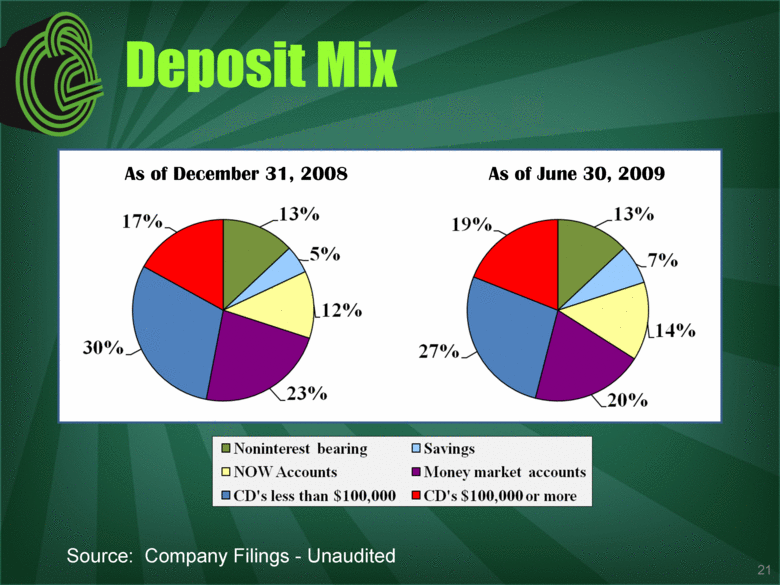
Deposit Mix Source: Company Filings - Unaudited As of June 30, 2009 As of December 31, 2008 17% 30% 13% 5% 12% 23% 19% 13% 7% 14% 20% 27% Noninterest bearing NOW Accounts CD’s less than $100,000 Savings Money Market accounts CD’s $100,000 or more 21 |
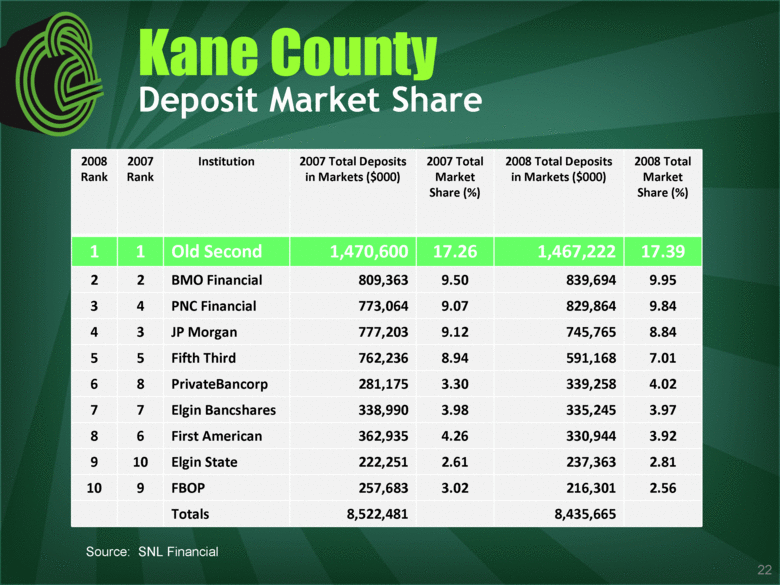
2008 Rank 2007 Rank Institution 2007 Total Deposits in Markets ($000) 2007 Total Market Share (%) 2008 Total Deposits in Markets ($000) 2008 Total Market Share (%) 1 1 Old Second 1,470,600 17.26 1,467,222 17.39 2 2 BMO Financial 809,363 9.50 839,694 9.95 3 4 PNC Financial 773,064 9.07 829,864 9.84 4 3 JP Morgan 777,203 9.12 745,765 8.84 5 5 Fifth Third 762,236 8.94 591,168 7.01 6 8 PrivateBancorp 281,175 3.30 339,258 4.02 7 7 Elgin Bancshares 338,990 3.98 335,245 3.97 8 6 First American 362,935 4.26 330,944 3.92 9 10 Elgin State 222,251 2.61 237,363 2.81 10 9 FBOP 257,683 3.02 216,301 2.56 Totals 8,522,481 8,435,665 Kane County Deposit Market Share Source: SNL Financial 22 |
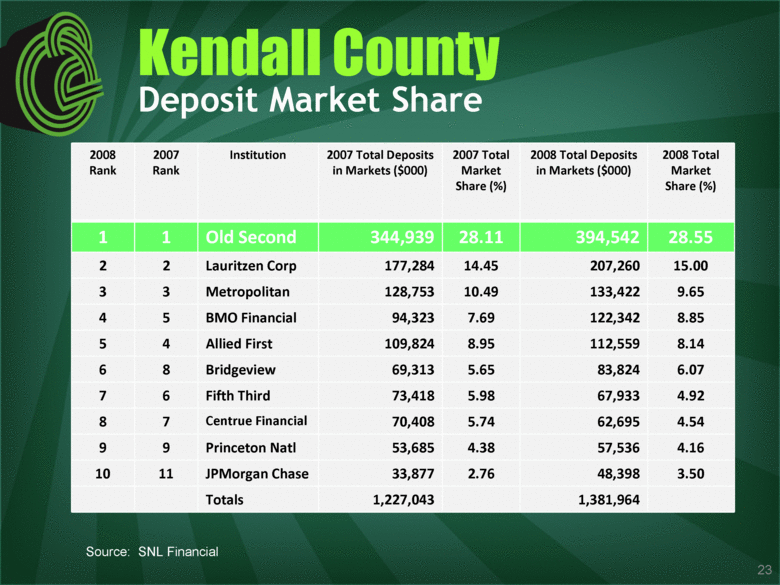
2008 Rank 2007 Rank Institution 2007 Total Deposits in Markets ($000) 2007 Total Market Share (%) 2008 Total Deposits in Markets ($000) 2008 Total Market Share (%) 1 1 Old Second 344,939 28.11 394,542 28.55 2 2 Lauritzen Corp 177,284 14.45 207,260 15.00 3 3 Metropolitan 128,753 10.49 133,422 9.65 4 5 BMO Financial 94,323 7.69 122,342 8.85 5 4 Allied First 109,824 8.95 112,559 8.14 6 8 Bridgeview 69,313 5.65 83,824 6.07 7 6 Fifth Third 73,418 5.98 67,933 4.92 8 7 Centrue Financial 70,408 5.74 62,695 4.54 9 9 Princeton Natl 53,685 4.38 57,536 4.16 10 11 JPMorgan Chase 33,877 2.76 48,398 3.50 Totals 1,227,043 1,381,964 Source: SNL Financial Kendall County Deposit Market Share 23 |
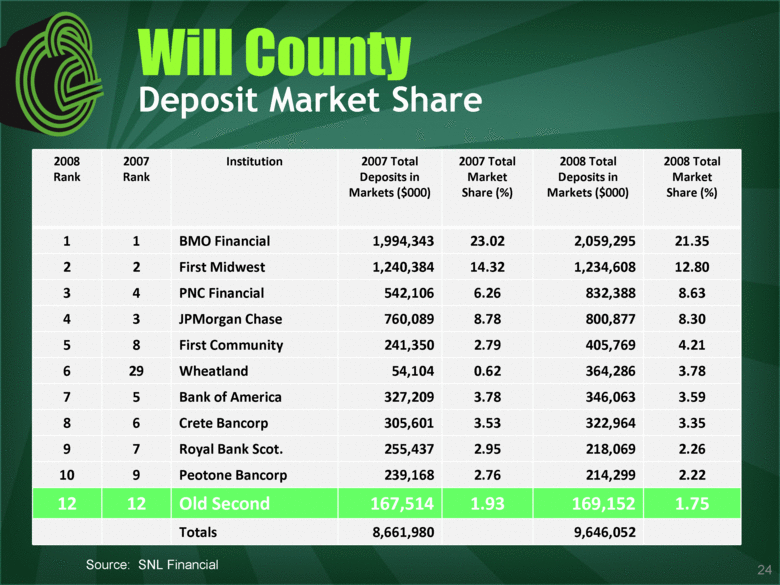
2008 Rank 2007 Rank Institution 2007 Total Deposits in Markets ($000) 2007 Total Market Share (%) 2008 Total Deposits in Markets ($000) 2008 Total Market Share (%) 1 1 BMO Financial 1,994,343 23.02 2,059,295 21.35 2 2 First Midwest 1,240,384 14.32 1,234,608 12.80 3 4 PNC Financial 542,106 6.26 832,388 8.63 4 3 JPMorgan Chase 760,089 8.78 800,877 8.30 5 8 First Community 241,350 2.79 405,769 4.21 6 29 Wheatland 54,104 0.62 364,286 3.78 7 5 Bank of America 327,209 3.78 346,063 3.59 8 6 Crete Bancorp 305,601 3.53 322,964 3.35 9 7 Royal Bank Scot. 255,437 2.95 218,069 2.26 10 9 Peotone Bancorp 239,168 2.76 214,299 2.22 12 12 Old Second 167,514 1.93 169,152 1.75 Totals 8,661,980 9,646,052 Source: SNL Financial Will County Deposit Market Share 24 |
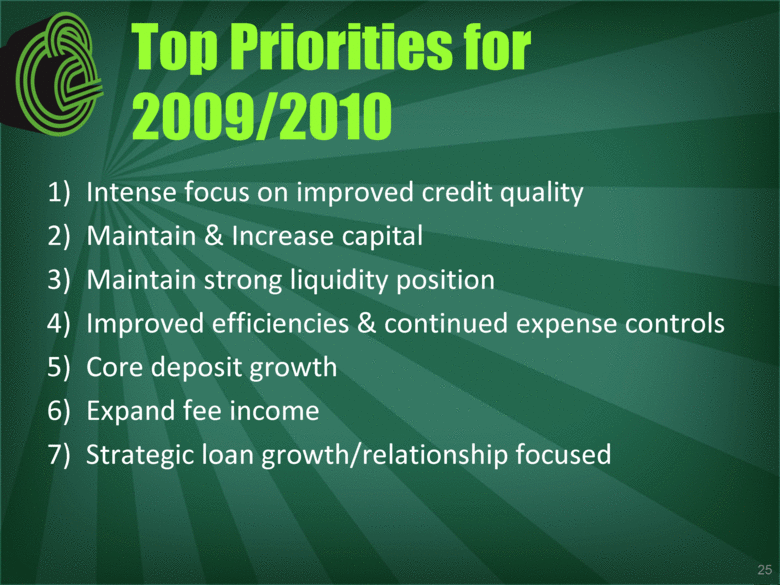
Top Priorities for 2009/2010 1) Intense focus on improved credit quality 2) Maintain & Increase capital 3) Maintain strong liquidity position 4) Improved efficiencies & continued expense controls 5) Core deposit growth 6) Expand fee income 7) Strategic loan growth/relationship focused 25 |
Appendix: Reconciliation of Non-GAAP Disclosure Net Interest Margin Interest income (GAAP) $ 35,713 $ 33,788 $ 155,741 $ 157,927 Taxable-equivalent adjustment: Loans 56 55 194 215 Investments 771 762 3,095 3,197 Interest income - FTE 36,540 34,605 159,030 161,339 Interest expense (GAAP) 13,507 12,114 87,143 68,413 Net interest income - FTE $ 23,033 $ 22,491 $ 71,887 $ 92,926 Net interest income - (GAAP) $ 22,206 $ 21,674 $ 68,598 $ 89,514 Average interest earning assets $ 2,774,892 $ 2,635,707 $ 2,355,624 $ 2,692,648 Net interest margin (GAAP) 3.25% 3.30% 2.91% 3.32% Net interest margin - FTE 3.37% 3.42% 3.05% 3.45% Three Months Ended Year Ended 3/31/2009 6/30/2009 12/31/2007 12/31/2008 26 |