Exhibit 99.1
Old Second Bancorp, Inc. | | For Immediate Release |
(NASDAQ: OSBC) | | July 24, 2013 |
Contact: | J. Douglas Cheatham |
| Chief Financial Officer |
| (630) 906-5484 |
Old Second Bancorp, Inc. Announces Second Quarter Net Income of $3.5 million
Continues to maintain strong capital ratios, improving asset quality and expense control.
Loan loss reserve release reflects overall credit quality management.
AURORA, IL, July 24, 2013 – Old Second Bancorp, Inc. (the “Company” or “Old Second”) (NASDAQ: OSBC), parent company of Old Second National Bank (the “Bank”), today announced results of operations for the second quarter of 2013. The Company reported net income of $3.5 million, compared to net income of $1.3 million in the second quarter of 2012. The Company’s net income available to common shareholders of $2.2 million, or $0.15 per diluted share, for the quarter compared to net income available to common shareholders of $14,000, or $0.00 per diluted share, in the second quarter of 2012.
The Company reported net income of $8.9 million in the first half of 2013, compared to a loss of $1.7 million in the first half of 2012. The Company’s net income available to common shareholders of $6.4 million, or $0.45 per diluted share, for the first half of 2013, compared to a net loss available to common shareholders of $4.2 million, or $0.29 per diluted share, in the first half of 2012.
Chairman Bill Skoglund said “Our second quarter and six month results are encouraging as we continue to transition to consistent, high quality earnings. The economic and competitive environments remain challenging and we expect to be further tested as we progress through 2013. We have received benefit from our traditional community banking programs in business and personal lending, deposit services, card services, wealth management and residential mortgage banking. Further, our experienced and dedicated professional staff (augmented by several key additions) has continued to excel at our relationship approach to banking related services. Last, our customers remain loyal to Old Second as a long standing organization with outstanding quality and deep roots in our market areas.
Mr. Skoglund continued “Customers continue to be cautious in expanding their businesses in an uncertain economy. Our managers are fortifying relationships and building pipelines with current and prospective clients. We expect to grow our businesses and provide outstanding service while continuing to maintain our disciplined approach. Of course, dependable, high caliber earnings have been and will continue to be a top priority.”
“As we work through transition, it is critical that we be viewed as an institution that is unquestionably strong and stable. To that end, our strength continues as measured in several ways -- by declining Classified Assets (down to $141.1 million at June 30 from $168.0 million at March 31) and our Bank Leverage Capital Ratio (at 10.40% on June 30 compared to 9.94% for March 31 and 9.35% for June 30, 2012).”
The Company’s release of $1.8 million from its loan loss reserve for the second quarter of 2013 benefited earnings and compares to a $200,000 provision in the second quarter of 2012 and a $2.5 million release in the first quarter of 2013. The second quarter release was done under our established loan loss reserve methodology. The allowance for loan losses was 55.9% of nonperforming loans as of June 30, 2013, an increase from 55.3% as of March 31, 2013, and 35.8% a year earlier. Old Second further improved its overall asset quality by maintaining an elevated level of investment securities.
1
2013 Financial Highlights/Overview
Earnings
· Second quarter net income before taxes of $3.5 million compared to net income before taxes of $1.3 million in the second quarter of 2012. The increase was primarily due to release of $1.8 million in loan loss reserves and reduced other real estate expenses.
· In 2013, net income declined from $5.5 million in the first quarter to $3.5 million in the second quarter. This decline primarily resulted from a $514,000 decline in net interest income, a reduction in the amount of loan loss reserve release from $2.5 million in the first quarter to a $1.8 million release in the second quarter and reduced gains on securities sales from $1.5 million in first quarter to $745,000 in the second quarter.
· Second quarter net income available to common stockholders of $2.2 million compared to net income available to common stockholders of $14,000 in the same quarter of 2012.
· The tax-equivalent net interest margin was 3.07% during the second quarter of 2013 compared to 3.65% in the same quarter of 2012. The second quarter of 2013 was a decrease of 11 basis points compared to the first quarter of 2013.
· Noninterest income of $21.1 million was $219,000 higher in the first half of 2013 than in the same period of 2012 reflecting higher gains on securities sold, recapture of expense previously recorded on restricted stock awards and one time card services revenue.
· Noninterest expenses of $43.7 million were $3.4 million or 7.1% lower in the first half of 2013 than in the same period of 2012, reflecting overall expense control and reduced expenses in most categories most notably in other real estate owned (“OREO”) expenses (down $3.8 million year over year on elevated but improved valuation adjustment expense) and legal fees at least partially on accounting recovery of some legal fees paid on OREO.
Capital
| | June 30, | | March 31, | | Basis Point | |
| | 2013 | | 2013 | | Change | |
The Bank’s leverage capital ratio | | 10.40% | | 9.94% | | 0.46% | |
The Bank’s total capital ratio | | 16.30% | | 15.79% | | 0.51% | |
The Company’s leverage capital ratio | | 5.46% | | 5.11% | | 0.35% | |
The Company’s total capital ratio | | 14.70% | | 14.33% | | 0.37% | |
The Company’s tangible common equity to tangible assets | | (0.18)% | | 0.05% | | (0.23)% | |
Asset Quality & Earning Assets Review
· Nonperforming loans declined $19.9 million (24.1%) during the six months of 2013 to $62.7 million as of June 30, 2013, from $82.6 million as of December 31, 2012. Our June 30, 2013, lower level of nonperforming loans as measured at quarter-end was the lowest since June 30, 2008. Nonperforming loans declined primarily because of successful negotiations by our staff with guarantors and movement to OREO, as well as loans being upgraded to accruing status when borrowers financial condition showed meaningful improvement.
· Loans that were classified as performing but 30 to 89 days past due and still accruing interest decreased to $4.3 million at June 30, 2013, from $12.9 million at December 31, 2012, and from $6.4 million at June 30, 2012.
2
· OREO declined from $72.4 million at December 31, 2012, to $59.5 million at June 30, 2013. OREO dispositions totaling $19.5 million in the six month period were somewhat offset by new OREO and improvements to existing OREO of $11.2 million. Valuation write-downs of properties held for sale reduced the reported total by $4.7 million with related expense recognized.
· Securities available-for-sale increased $5.1 million during 2013 to $584.9 million from $579.9 million at December 31, 2012. At $290.9 million (49.7% of the portfolio) and $168.5 million (28.8% of total) asset-backed securities and collateralized mortgage-backed securities, respectively, were the largest components of the portfolio as of June 30, 2013. The Company’s asset-backed securities were heavily oriented to those backed by student loan debt under a guarantee from the U.S. Department of Education.
3
Net Interest Income
ANALYSIS OF AVERAGE BALANCES,
TAX EQUIVALENT INTEREST AND RATES
Three Months ended June 30, 2013, and 2012
(Dollar amounts in thousands - unaudited)
| | 2013 | | | 2012 | | |
| | Average | | | | | | | | | Average | | | | | | | | |
| | Balance | | | Interest | | | Rate | | | Balance | | | Interest | | | Rate | | |
Assets | | | | | | | | | | | | | | | | | | | |
Interest bearing deposits | | $ | 43,933 | | | $ | 27 | | | 0.24% | | | $ | 56,486 | | | $ | 35 | | | 0.25% | | |
Securities: | | | | | | | | | | | | | | | | | | | |
Taxable | | 569,877 | | | 2,698 | | | 1.89 | | | 364,475 | | | 1,856 | | | 2.04 | | |
Non-taxable (tax equivalent) | | 20,752 | | | 268 | | | 5.17 | | | 11,165 | | | 157 | | | 5.62 | | |
Total securities | | 590,629 | | | 2,966 | | | 2.01 | | | 375,640 | | | 2,013 | | | 2.14 | | |
Dividends from FRB and FHLB stock | | 10,742 | | | 76 | | | 2.83 | | | 12,382 | | | 77 | | | 2.49 | | |
Loans and loans held-for-sale 1 | | 1,118,892 | | | 13,974 | | | 4.94 | | | 1,293,446 | | | 17,688 | | | 5.41 | | |
Total interest earning assets | | 1,764,196 | | | 17,043 | | | 3.83 | | | 1,737,954 | | | 19,813 | | | 4.52 | | |
Cash and due from banks | | 22,948 | | | - | | | - | | | 34,279 | | | - | | | - | | |
Allowance for loan losses | | (38,228) | | | - | | | - | | | (48,353) | | | - | | | - | | |
Other noninterest bearing assets | | 194,782 | | | - | | | - | | | 240,075 | | | - | | | - | | |
Total assets | | $ | 1,943,698 | | | | | | | | | $ | 1,963,955 | | | | | | | | |
Liabilities and Stockholders’ Equity | | | | | | | | | | | | | | | | | | | |
NOW accounts | | $ | 297,918 | | | $ | 65 | | | 0.09% | | | $ | 279,205 | | | $ | 67 | | | 0.10% | | |
Money market accounts | | 319,236 | | | 115 | | | 0.14 | | | 310,497 | | | 135 | | | 0.17 | | |
Savings accounts | | 230,822 | | | 41 | | | 0.07 | | | 214,873 | | | 52 | | | 0.10 | | |
Time deposits | | 497,262 | | | 1,800 | | | 1.45 | | | 576,099 | | | 2,342 | | | 1.64 | | |
Interest bearing deposits | | 1,345,238 | | | 2,021 | | | 0.60 | | | 1,380,674 | | | 2,596 | | | 0.76 | | |
Securities sold under repurchase agreements | | 24,692 | | | - | | | - | | | 4,636 | | | 1 | | | 0.09 | | |
Other short-term borrowings | | 769 | | | - | | | - | | | 3,132 | | | 1 | | | 0.13 | | |
Junior subordinated debentures | | 58,378 | | | 1,314 | | | 9.00 | | | 58,378 | | | 1,220 | | | 8.36 | | |
Subordinated debt | | 45,000 | | | 205 | | | 1.80 | | | 45,000 | | | 224 | | | 1.97 | | |
Notes payable and other borrowings | | 500 | | | 4 | | | 3.16 | | | 500 | | | 4 | | | 3.16 | | |
Total interest bearing liabilities | | 1,474,577 | | | 3,544 | | | 0.96 | | | 1,492,320 | | | 4,046 | | | 1.09 | | |
Noninterest bearing deposits | | 357,802 | | | - | | | - | | | 373,869 | | | - | | | - | | |
Other liabilities | | 35,202 | | | - | | | - | | | 26,774 | | | - | | | - | | |
Stockholders’ equity | | 76,117 | | | - | | | - | | | 70,992 | | | - | | | - | | |
Total liabilities and stockholders’ equity | | $ | 1,943,698 | | | | | | | | | $ | 1,963,955 | | | | | | | | |
Net interest income (tax equivalent) | | | | | $ | 13,499 | | | | | | | | | $ | 15,767 | | | | | |
Net interest income (tax equivalent) to total earning assets | | | | | | | | 3.07% | | | | | | | | | 3.65% | | |
Interest bearing liabilities to earning assets | | 83.58% | | | | | | | | | 85.87% | | | | | | | | |
1 Interest income from loans is shown on a tax equivalent basis as discussed in the table on page 18 and includes fees of $551,000 and $519,000 for the second quarter of 2013 and 2012, respectively. Nonaccrual loans are included in the above stated average balances.
Note: Tax equivalent basis is calculated using a marginal tax rate of 35%.
4
ANALYSIS OF AVERAGE BALANCES,
TAX EQUIVALENT INTEREST AND RATES
Six Months ended June 30, 2013, and 2012
(Dollar amounts in thousands - unaudited)
| | 2013 | | 2012 | |
| | Average | | | | | | | | | Average | | | | | | | | |
| | Balance | | | Interest | | | Rate | | | Balance | | | Interest | | | Rate | | |
Assets | | | | | | | | | | | | | | | | | | | |
Interest bearing deposits | | $ | 56,395 | | | $ | 69 | | | 0.24% | | | $ | 50,252 | | | $ | 60 | | | 0.24% | | |
Securities: | | | | | | | | | | | | | | | | | | | |
Taxable | | 559,114 | | | 4,996 | | | 1.79 | | | 345,681 | | | 3,354 | | | 1.94 | | |
Non-taxable (tax equivalent) | | 15,407 | | | 451 | | | 5.85 | | | 10,872 | | | 316 | | | 5.81 | | |
Total securities | | 574,521 | | | 5,447 | | | 1.90 | | | 356,553 | | | 3,670 | | | 2.06 | | |
Dividends from FRB and FHLB stock | | 10,971 | | | 152 | | | 2.77 | | | 12,854 | | | 151 | | | 2.35 | | |
Loans and loans held-for-sale 1 | | 1,131,210 | | | 28,945 | | | 5.09 | | | 1,325,558 | | | 35,462 | | | 5.29 | | |
Total interest earning assets | | 1,773,097 | | | 34,613 | | | 3.89 | | | 1,745,217 | | | 39,343 | | | 4.46 | | |
Cash and due from banks | | 26,411 | | | - | | | - | | | 25,344 | | | - | | | - | | |
Allowance for loan losses | | (38,609) | | | - | | | - | | | (49,857) | | | - | | | - | | |
Other noninterest bearing assets | | 199,076 | | | - | | | - | | | 240,031 | | | - | | | - | | |
Total assets | | $ | 1,959,975 | | | | | | | | | $ | 1,960,735 | | | | | | | | |
Liabilities and Stockholders’ Equity | | | | | | | | | | | | | | | | | | | |
NOW accounts | | $ | 294,504 | | | $ | 129 | | | 0.09% | | | $ | 278,141 | | | $ | 139 | | | 0.10% | | |
Money market accounts | | 324,279 | | | 238 | | | 0.15 | | | 305,629 | | | 301 | | | 0.20 | | |
Savings accounts | | 226,380 | | | 82 | | | 0.07 | | | 210,019 | | | 114 | | | 0.11 | | |
Time deposits | | 501,450 | | | 3,653 | | | 1.47 | | | 584,830 | | | 4,947 | | | 1.70 | | |
Interest bearing deposits | | 1,346,613 | | | 4,102 | | | 0.61 | | | 1,378,619 | | | 5,501 | | | 0.80 | | |
Securities sold under repurchase agreements | | 22,490 | | | 1 | | | 0.01 | | | 3,156 | | | 1 | | | 0.06 | | |
Other short-term borrowings | | 22,182 | | | 19 | | | 0.17 | | | 6,648 | | | 4 | | | 0.12 | | |
Junior subordinated debentures | | 58,378 | | | 2,601 | | | 8.91 | | | 58,378 | | | 2,417 | | | 8.28 | | |
Subordinated debt | | 45,000 | | | 401 | | | 1.77 | | | 45,000 | | | 461 | | | 2.03 | | |
Notes payable and other borrowings | | 500 | | | 8 | | | 3.18 | | | 500 | | | 8 | | | 3.16 | | |
Total interest bearing liabilities | | 1,495,163 | | | 7,132 | | | 0.96 | | | 1,492,301 | | | 8,392 | | | 1.13 | | |
Noninterest bearing deposits | | 355,651 | | | - | | | - | | | 370,815 | | | - | | | - | | |
Other liabilities | | 34,398 | | | - | | | - | | | 24,367 | | | - | | | - | | |
Stockholders’ equity | | 74,763 | | | - | | | - | | | 73,252 | | | - | | | - | | |
Total liabilities and stockholders’ equity | | $ | 1,959,975 | | | | | | | | | $ | 1,960,735 | | | | | | | | |
Net interest income (tax equivalent) | | | | | $ | 27,481 | | | | | | | | | $ | 30,951 | | | | | |
Net interest income (tax equivalent) to total earning assets | | | | | | | | 3.13% | | | | | | | | | 3.57% | | |
Interest bearing liabilities to earning assets | | 84.32% | | | | | | | | | 85.51% | | | | | | | | |
1 Interest income from loans is shown on a tax equivalent basis as discussed in the table on page 18 and includes fees of $1.2 million and $936,000 for the first six months of 2013 and 2012, respectively. Nonaccrual loans are included in the above stated average balances.
Note: Tax equivalent basis is calculated using a marginal tax rate of 35%.
Net interest and dividend income decreased $3.5 million, from $30.8 million in the first half of 2012, to $27.3 million in the first half of 2013. Average earning assets increased $27.9 million, or 1.6%, from $1.75 billion in the first half of 2012, to $1.77 billion in the first half of 2013 as a result of growth in investment securities. Management continued to emphasize asset quality in securities and new loan originations continued to be limited. Average loans, including loans held for sale, decreased $194.3 million from the first half of 2012 to the first half of 2013. The net interest margin was 3.07% for the second quarter of 2013 compared to 3.65% on this metric for second quarter of 2012.
5
Asset Quality
Loan Charge-offs, net of (recoveries) | | Three Months Ended | | Year to Date | |
(in thousands) | | June 30, | | June 30, | |
| | 2013 | | 2012 | | 2013 | | 2012 | |
Real estate-construction | | | | | | | | | |
Homebuilder | | $ | (305) | | $ | 287 | | $ | (302) | | $ | 919 | |
Land | | (1) | | - | | (2) | | (666) | |
Commercial speculative | | 718 | | 1,514 | | (49) | | 1,798 | |
All other | | 2 | | 137 | | 1 | | 120 | |
Total real estate-construction | | 414 | | 1,938 | | (352) | | 2,171 | |
Real estate-residential | | | | | | | | | |
Investor | | 64 | | 1,887 | | (85) | | 3,047 | |
Owner occupied | | 70 | | 427 | | 51 | | 1,097 | |
Revolving and junior liens | | 701 | | 513 | | 1,050 | | 809 | |
Total real estate-residential | | 835 | | 2,827 | | 1,016 | | 4,953 | |
Real estate-commercial, nonfarm | | | | | | | | | |
Owner general purpose | | (19) | | 309 | | (38) | | 1,139 | |
Owner special purpose | | (260) | | (1,150) | | (143) | | 1,226 | |
Non-owner general purpose | | 161 | | 3,342 | | (156) | | 4,374 | |
Non-owner special purpose | | - | | 124 | | (824) | | 78 | |
Retail properties | | 631 | | 2 | | (542) | | 3,901 | |
Total real estate-commercial, nonfarm | | 513 | | 2,627 | | (1,703) | | 10,718 | |
Real estate-commercial, farm | | - | | - | | - | | - | |
Commercial | | - | | 93 | | 235 | | 97 | |
Other | | 30 | | 39 | | 59 | | 56 | |
| | $ | 1,792 | | $ | 7,524 | | $ | (745) | | $ | 17,995 | |
Charge-offs for second quarter 2013 were primarily from previously established specific reserves on nonaccrual loans deemed uncollectible. Charge off activity continued to be improved from last year.
| | Nonperforming Loans as of | | June 30, 2013
Dollar change From | |
(in thousands) | | June 30, | | March 31, | | June 30, | | March 31, | | June 30, | |
| | 2013 | | 2013 | | 2012 | | 2013 | | 2012 | |
Real estate-construction | | $ | 6,303 | | $ | 8,040 | | $ | 20,213 | | $ | (1,737) | | $ | (13,910) | |
Real estate-residential: | | | | | | | | | | | |
Investor | | 13,662 | | 8,524 | | 13,631 | | 5,138 | | 31 | |
Owner occupied | | 7,927 | | 8,269 | | 15,103 | | (342) | | (7,176) | |
Revolving and junior liens | | 3,431 | | 3,776 | | 3,138 | | (345) | | 293 | |
Real estate-commercial, nonfarm | | 31,190 | | 38,588 | | 57,123 | | (7,398) | | (25,933) | |
Real estate-commercial, farm | | 53 | | 2,417 | | 2,278 | | (2,364) | | (2,225) | |
Commercial | | 104 | | 210 | | 1,091 | | (106) | | (987) | |
| | $ | 62,670 | | $ | 69,824 | | $ | 112,577 | | $ | (7,154) | | $ | (49,907) | |
Nonperforming loans consist of nonaccrual loans, nonperforming restructured accruing loans and loans 90 days or greater past due still accruing. The largest decrease in the nonperforming loans since June 30, 2012 was in the real estate–commercial, nonfarm segment as this segment’s upgrades and migration to OREO were greater than the migration of loans to nonperforming status.
6
| | Classified loans as of | | June 30, 2013
Dollar Change From | |
(in thousands) | | June 30, | | March 31, | | June 30, | | March 31, | | June 30, | |
| | 2013 | | 2013 | | 2012 | | 2013 | | 2012 | |
Real estate-construction | | $ | 7,005 | | $ | 12,656 | | $ | 25,180 | | $ | (5,651) | | $ | (16,180) | |
Real estate-residential: | | | | | | | | | | | |
Investor | | 13,968 | | 8,913 | | 19,198 | | 5,055 | | (5,230) | |
Owner occupied | | 11,008 | | 10,463 | | 17,908 | | 545 | | (2,404) | |
Revolving and junior liens | | 5,086 | | 5,722 | | 4,324 | | (636) | | 762 | |
Real estate-commercial, nonfarm | | 43,827 | | 61,442 | | 85,135 | | (17,615) | | (41,308) | |
Real estate-commercial, farm | | 53 | | 2,417 | | 2,278 | | (2,364) | | (2,225) | |
Commercial | | 705 | | 747 | | 1,409 | | (42) | | (704) | |
Other | | 1 | | 1 | | 7 | | - | | (6) | |
| | $ | 81,653 | | $ | 102,361 | | $ | 155,439 | | $ | (20,708) | | $ | (67,295) | |
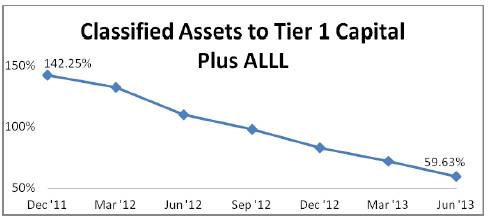
Classified loans include nonaccrual, performing troubled debt restructurings and all other loans considered substandard. All three components are down since June 30, 2012. Classified assets include both classified loans and OREO. Management monitors a ratio of classified assets to the sum of Bank Tier 1 capital and the allowance for loan and lease loss reserve. This ratio reflects another measure of overall improvement in loan related asset quality. The decline in both classified loans and OREO in second quarter improved this ratio for the tenth straight quarter.
7
Allowance for Loan and Lease Losses
Below is a reconciliation for the activity for the periods indicated (in thousands):
| | Three Months Ending | |
| | 6/30/2013 | | 3/31/2013 | | 6/30/2012 | |
| | | | | | | |
Allowance at beginning of quarter | | $ | 38,634 | | $ | 38,597 | | $ | 47,610 | |
Charge-offs: | | | | | | | |
Commercial | | 25 | | 254 | | 98 | |
Real estate - commercial | | 1,018 | | 508 | | 4,059 | |
Real estate - construction | | 894 | | 4 | | 1,940 | |
Real estate - residential | | 1,014 | | 585 | | 2,895 | |
Consumer and other loans | | 134 | | 172 | | 138 | |
Total charge-offs | | 3,085 | | 1,523 | | 9,130 | |
Recoveries: | | | | | | | |
Commercial | | 25 | | 19 | | 4 | |
Real estate - commercial | | 505 | | 2,724 | | 1,433 | |
Real estate - construction | | 480 | | 770 | | 2 | |
Real estate - residential | | 179 | | 404 | | 68 | |
Consumer and other loans | | 104 | | 143 | | 99 | |
Total recoveries | | 1,293 | | 4,060 | | 1,606 | |
Net charge-offs (recoveries) | | 1,792 | | (2,537) | | 7,524 | |
(Release) provision for loan losses | | (1,800) | | (2,500) | | 200 | |
Allowance at end of year | | $ | 35,042 | | $ | 38,634 | | $ | 40,286 | |
| | | | | | | |
Average total loans (exclusive of loans held-for-sale) | | $ | 1,113,315 | | $ | 1,138,579 | | $ | 1,287,815 | |
Net charge-offs to average loans | | 0.16% | | (0.22)% | | 0.58% | |
Allowance at year end to average loans | | 3.15% | | 3.39% | | 3.13% | |
| | | | | | | |
Ending balance: Individually evaluated for impairment | | $ | 5,036 | | $ | 5,038 | | $ | 6,347 | |
Ending balance: Collectively evaluated for impairment | | $ | 30,006 | | $ | 33,596 | | $ | 33,939 | |
The coverage ratio of the allowance for loan losses to nonperforming loans was 55.9% as of June 30, 2013, which reflects an increase from 55.3% as of March 31, 2013. A decrease of $7.2 million, or 10.2%, in nonperforming loans in the three months drove the overall coverage ratio change. Management updated the estimated specific allocations in the second quarter after receiving more recent appraisals for detailed collateral valuations or information on cash flow trends related to the impaired credits. Management determined the estimated amount to provide in the allowance for loan losses based upon a number of considerations, including loan growth or contraction, the quality and composition of the loan portfolio and loan loss experience. The latter item was also weighted more heavily based upon recent loss experience. The construction and development (“C & D”) portfolio, which has accounted for significant losses in previous periods, has had diminished adverse migration and the remaining credits are exhibiting more stable credit characteristics. Management believes that adequate reserves have been established for the inherent risk of loss in the C & D portfolio.
Management regularly reviews the performance of the higher risk pool within commercial real estate loans and adjusts the population and the related loss factors taking into account adverse market trends, including collateral valuation, as well as assessments of the credits in that pool. Those assessments capture management’s estimate of the potential for adverse migration to an impaired status as well as its estimation of what the potential valuation impact from that migration would be if it were to occur. The amount of assets subject to this pool factor decreased by 51.0% at June 30, 2013, as compared to December 31, 2012. Management has also observed that many stresses in those credits were generally attributable to cyclical economic events that were showing some signs of stabilization. Those signs included a reduction in loan migration to watch status, as well as a decrease in 30 to 89 day past due loans and some stabilization in values of certain properties.
8
The above changes in estimates were made by management to be consistent with observable trends within loan portfolio segments and in conjunction with market conditions and credit review administration activities. Several environmental factors are also evaluated on an ongoing basis and are included in the assessment of the adequacy of the allowance for loan losses. Management determined that a combination of recoveries of prior amounts charged-off and an overall improvement in loan asset quality justified a loan loss reserve release in second quarter. When measured as a percentage of loans outstanding, the total allowance for loan losses decreased from 3.3% of total loans as of June 30, 2012, to 3.2% of total loans at June 30, 2013. In management’s judgment, an adequate allowance for estimated losses has been established for inherent losses at June 30, 2013; however, there can be no assurance that actual losses will not exceed the estimated amounts in the future.
Other Real Estate Owned
OREO decreased $6.2 million from $65.7 million at March 31, 2013 to $59.5 million at June 30, 2013. Disposition activity and valuation writedowns in the second quarter more than offset numerous but smaller dollar additions to OREO, leading to this overall decrease. In the second quarter of 2013, management successfully managed OREO transactions as shown below. As a result, OREO holdings in all categories (vacant land suitable for farming, single family residences, lots suitable for development, multi-family and commercial property) were down or essentially unchanged in the quarter. Overall, a net gain on sale of $386,000 was realized in the second quarter.
| | Three Months Ended | | Year to Date | |
(in thousands) | | June 30, | | June 30, | |
| | 2013 | | 2012 | | 2013 | | 2012 | |
Beginning balance | | $ | 65,663 | | $ | 101,680 | | $ | 72,423 | | $ | 93,290 | |
Property additions | | 4,196 | | 3,432 | | 11,181 | | 19,350 | |
Development improvements | | - | | 197 | | 50 | | 515 | |
Less: | | | | | | | | | |
Property disposals | | 7,804 | | 10,342 | | 19,465 | | 15,688 | |
Period valuation adjustments | | 2,590 | | 5,296 | | 4,724 | | 7,796 | |
Other real estate owned | | $ | 59,465 | | $ | 89,671 | | $ | 59,465 | | $ | 89,671 | |
The OREO valuation reserve decreased to $30.5 million, which is 33.9% of gross OREO at June 30, 2013. The valuation reserve represented 23.5% and 30.3% of gross OREO at June 30, 2012 and December 31, 2012, respectively. In management’s judgment, an adequate property valuation allowance has been established to present OREO at current estimates of fair value less costs to sell; however, there can be no assurance that additional losses will not be incurred on disposition or update to valuation in the future.
OREO Properties by Type
(in thousands) | | June 30, 2013 | | March 31, 2013 | | June 30, 2012 | |
| | Amount | | % of Total | | Amount | | % of Total | | Amount | | % of Total | |
Single family residence | | $ | 8,161 | | 14% | | $ | 9,854 | | 15% | | $ | 10,459 | | 12% | |
Lots (single family and commercial) | | 23,781 | | 40% | | 26,130 | | 40% | | 31,805 | | 35% | |
Vacant land | | 3,266 | | 5% | | 4,610 | | 7% | | 7,662 | | 9% | |
Multi-family | | 2,210 | | 4% | | 2,134 | | 3% | | 7,524 | | 8% | |
Commercial property | | 22,047 | | 37% | | 22,935 | | 35% | | 32,221 | | 36% | |
Total OREO properties | | $ | 59,465 | | 100% | | $ | 65,663 | | 100% | | $ | 89,671 | | 100% | |
9
March 31, 2013 data reflects a $2.6 million reclassification of OREO participations from a liability to a contra OREO asset which was reduced to $2.5 million at June 30, 2013. No adjustment has been made in June 30, 2012 data.
Net OREO Aging
(in thousands) | | June 30, 2013 | | March 31, 2013 | | June 30, 2012 | |
| | Amount | | % of Total | | Amount | | % of Total | | Amount | | % of Total | |
| | | | | | | | | | | | | |
0-90 Days | | $ | 4,025 | | 7% | | $ | 3,929 | | 6% | | $ | 3,418 | | 4% | |
91-180 Days | | 3,086 | | 5% | | 3,666 | | 5% | | 12,200 | | 14% | |
181 Days - 1 Year | | 6,380 | | 11% | | 5,661 | | 9% | | 25,748 | | 29% | |
1 Year to 2 Years | | 20,356 | | 34% | | 27,067 | | 41% | | 34,579 | | 39% | |
2 Years to 3 Years | | 17,404 | | 29% | | 17,101 | | 26% | | 9,463 | | 11% | |
3 Years to 4 Years | | 4,529 | | 8% | | 4,392 | | 7% | | 4,263 | | 5% | |
4 Years + | | 3,685 | | 6% | | 3,847 | | 6% | | - | | 0% | |
Total | | $ | 59,465 | | 100% | | $ | 65,663 | | 100% | | $ | 89,671 | | 100% | |
March 31, 2013 data reflects a $2.6 million reclassification of OREO participations from a liability to a contra OREO asset reduced to $2.5 million at June 30, 2013. No adjustment has been made in the June 30, 2012 data.
As part of our OREO management process, we age or track the time that OREO is held for sale. The table above shows that, in total, where 47% of our OREO at June 30, 2012, had been held for less than one year, that percentage dropped to 23% at June 30, 2013. When properties are tracked as being held for one to three years, the percentage of total OREO in that age class rose to 63% at June 30, 2013, up from 50% at June 30, 2012. While the dollar totals held for more than three years were smaller than other aging categories, a similar trend was found in properties held in OREO for more than three years (14% as of June 30, 2013, up 2% and 9% from March 31, 2013 and June 30, 2012, respectively) with approximately $3.7 million held for over four years at June 30, 2013.
Noninterest Income
| | Three Months Ended | | June 30, 2013
Dollar Change From | |
(in thousands) | | June 30, | | March 31, | | June 30, | | March 31, | | June 30, | |
| | 2013 | | 2013 | | 2012 | | 2013 | | 2012 | |
Noninterest income | | | | | | | | | | | |
Trust income | | $ | 1,681 | | $ | 1,491 | | $ | 1,463 | | $ | 190 | | $ | 218 | |
Service charges on deposits | | 1,799 | | 1,677 | | 1,893 | | 122 | | (94) | |
Residential mortgage revenue | | 2,821 | | 2,450 | | 2,272 | | 371 | | 549 | |
Securities gains, net | | 745 | | 1,453 | | 692 | | (708) | | 53 | |
Increase in cash surrender value of bank-owned life insurance | | 372 | | 407 | | 326 | | (35) | | 46 | |
Death benefit realized on bank-owned life insurance | | 375 | | - | | - | | 375 | | 375 | |
Debit card interchange income | | 900 | | 792 | | 1,113 | | 108 | | (213) | |
Lease revenue from other real estate owned | | 257 | | 408 | | 911 | | (151) | | (654) | |
Net gain on sales of other real estate owned | | 386 | | 181 | | 355 | | 205 | | 31 | |
Other income | | 1,147 | | 1,737 | | 1,371 | | (590) | | (224) | |
Total noninterest income | | $ | 10,483 | | $ | 10,596 | | $ | 10,396 | | $ | (113) | | $ | 87 | |
Portfolio management to lessen risk while maintaining and improving selected yields produced gains on securities sales in second quarter 2013 that are up from second quarter 2012. Other noninterest income in 2013 reflects recapture during first quarter of expense previously recorded for restricted stock awards and a new debit card agreement signed in second quarter.
10
Noninterest Expense
| | Three Months Ended | | June 30, 2013
Dollar Change From | |
(in thousands) | | June 30, | | March 31, | | June 30, | | March 31, | | June 30, | |
| | 2013 | | 2013 | | 2012 | | 2013 | | 2012 | |
Noninterest expense | | | | | | | | | | | |
Salaries and employee benefits | | $ | 9,177 | | $ | 9,032 | | $ | 8,823 | | $ | 145 | | $ | 354 | |
Occupancy expense, net | | | 1,242 | | | 1,279 | | | 1,207 | | | (37) | | | 35 | |
Furniture and equipment expense | | | 1,104 | | | 1,144 | | | 1,183 | | | (40) | | | (79) | |
FDIC insurance | | | 1,024 | | | 1,035 | | | 1,029 | | | (11) | | | (5) | |
General bank insurance | | | 491 | | | 849 | | | 841 | | | (358) | | | (350) | |
Amortization of core deposit intangible assets | | | 525 | | | 525 | | | 250 | | | - | | | 275 | |
Advertising expense | | | 328 | | | 166 | | | 264 | | | 162 | | | 64 | |
Debit card interchange expense | | | 362 | | | 344 | | | 453 | | | 18 | | | (91) | |
Legal fees | | | 486 | | | 323 | | | 770 | | | 163 | | | (284) | |
OREO valuation expense | | | 2,589 | | | 1,987 | | | 5,127 | | | 602 | | | (2,538) | |
Other OREO expense | | | 1,356 | | | 1,699 | | | 1,661 | | | (343) | | | (305) | |
Other expense | | | 3,510 | | | 3,144 | | | 3,026 | | | 366 | | | 484 | |
Total noninterest expense | | $ | 22,194 | | $ | 21,527 | | $ | 24,634 | | $ | 667 | | $ | (2,440) | |
Salaries and benefits are up from first quarter 2013 due to accrual of management bonus amounts under Board approved incentive plans. Amortization expense related to core deposit intangible assets increased from the June quarter in 2012 as the value of those deposits has dropped in the current historically low interest rate environment. Legal fees expenses dropped on accounting recoveries and management control of legal expense continued. OREO valuation expenses decreased from 2012 as property valuation declines, while still sizable, are more moderate than seen last year.
Additional Loan Detail
| | Major Classification of Loans as of | | June 30, 2013
Dollar Change From | |
(in thousands) | | June 30, | | March 31, | | June 30, | | March 31, | | June 30, | |
| | 2013 | | 2013 | | 2012 | | 2013 | | 2012 | |
Commercial | | $ | 86,173 | | $ | 84,332 | | $ | 90,051 | | $ | 1,841 | | $ | (3,878) | |
Real estate - commercial | | | 563,061 | | | 566,349 | | | 625,056 | | | (3,288) | | | (61,995) | |
Real estate - construction | | | 34,964 | | | 40,698 | | | 57,064 | | | (5,734) | | | (22,100) | |
Real estate - residential | | | 386,504 | | | 394,599 | | | 447,151 | | | (8,095) | | | (60,647) | |
Consumer | | | 2,793 | | | 2,908 | | | 3,321 | | | (115) | | | (528) | |
Overdraft | | | 505 | | | 584 | | | 520 | | | (79) | | | (15) | |
Lease financing receivables | | | 11,863 | | | 8,574 | | | 2,644 | | | 3,289 | | | 9,219 | |
Other | | | 16,371 | | | 15,022 | | | 12,235 | | | 1,349 | | | 4,136 | |
| | | 1,102,234 | | | 1,113,066 | | | 1,238,042 | | | (10,832) | | | (135,808) | |
Net deferred loan costs and (fees) | | | 469 | | | 236 | | | 92 | | | 233 | | | 377 | |
| | $ | 1,102,703 | | $ | 1,113,302 | | $ | 1,238,134 | | $ | (10,599) | | $ | (135,431) | |
While long term lending staff, along with additional new hires, are assisting in increasing loan pipelines, the lack of expansion by local businesses is still leading to weaker loan demand. Low line utilization along with upcoming loan maturities and difficult pricing competition continue. Additional pay downs along with the exodus of transactional business, although at a slower than historical pace, has contributed to the loan decline.
11
Additional Securities Detail
| | Securities at Fair Value as of | | June 30, 2013
Dollar Change From | |
(in thousands) | | June 30, | | March 31, | | June 30, | | March 31, | | June 30, | |
| | 2013 | | 2013 | | 2012 | | 2013 | | 2012 | |
| | | | | | | | | | | |
U.S. Treasury | | $ | 1,547 | | $ | 1,502 | | $ | 1,515 | | $ | 45 | | $ | 32 | |
U.S. government agencies | | 6,726 | | 69,265 | | 44,623 | | | (62,539) | | | (37,897) | |
U.S. government agency mortgage-backed | | 52,414 | | 76,352 | | 95,208 | | | (23,938) | | | (42,794) | |
States and political subdivisions | | 20,119 | | 27,015 | | 14,058 | | | (6,896) | | | 6,061 | |
Corporate Bonds | | 34,429 | | 38,579 | | 35,267 | | | (4,150) | | | (838) | |
Collateralized mortgage obligations | | 168,505 | | 131,669 | | 62,387 | | | 36,836 | | | 106,118 | |
Asset-backed securities | | 290,853 | | 220,737 | | 136,674 | | | 70,116 | | | 154,179 | |
Collateralized debt obligations | | 10,344 | | 10,627 | | 9,163 | | | (283) | | | 1,181 | |
| | $ | 584,937 | | $ | 575,746 | | $ | 398,895 | | $ | 9,191 | | $ | 186,042 | |
Second quarter purchases generally consisted of auction rate asset-backed securities backed by student loans with U.S. Department of Education guarantees. Other noteworthy purchases were made on Collateralized Mortgage Obligations and mortgage-backed securities, including some privately issued mortgage-backed securities. Sales were conducted to maintain yield while lowering market value risk.
Deposits Detail
| | As Of | | June 30, 2013
Dollar Change From | |
(in thousands) | | June 30, | | March 31, | | June 30, | | March 31, | | June 30, | |
| | 2013 | | 2013 | | 2012 | | 2013 | | 2012 | |
Noninterest bearing | | $ | 366,406 | | $ | 351,328 | | $ | 412,635 | | $ | 15,078 | | $ | (46,229) | |
Savings | | 227,687 | | 230,771 | | 213,634 | | (3,084) | | 14,053 | |
NOW accounts | | 287,492 | | 303,385 | | 272,330 | | (15,893) | | 15,162 | |
Money market accounts | | 312,773 | | 331,707 | | 314,236 | | (18,934) | | (1,463) | |
Certificates of deposits: | | | | | | | | | | | |
of less than $100,000 | | 306,302 | | 312,193 | | 347,789 | | (5,891) | | (41,487) | |
of $100,000 or more | | 189,963 | | 188,872 | | 209,400 | | 1,091 | | (19,437) | |
| | $ | 1,690,623 | | $ | 1,718,256 | | $ | 1,770,024 | | $ | (27,633) | | $ | (79,401) | |
The Company’s stable deposit base was impacted year over year by the expiration of the TAG program that provided FDIC insurance on large account balances. Income and property tax payments contributed to the linked quarter decline in deposits. In addition, we believe that some retail deposits were withdrawn to take advantage of other investment opportunities in both comparative periods.
Borrowings
One of the Company’s most significant borrowing relationships continued to be the $45.5 million credit facility with Bank of America. That credit facility began in January 2008 and was originally composed of a $30.5 million senior debt facility and $500,000 in term debt, as well as $45.0 million of subordinated debt. The subordinated debt and the term debt portion of the senior debt facility mature on March 31, 2018. The interest rate on the senior debt facility resets quarterly and is based on, at the Company’s option, either the lender’s prime rate or three-month LIBOR plus 90 basis points. The interest rate on the subordinated debt resets quarterly and is equal to three-month LIBOR plus 150 basis points. The Company had no principal outstanding balance on the senior line of credit when it matured but did have $500,000 in principal
12
outstanding in term debt and $45.0 million in principal outstanding in subordinated debt at the end of both December 31, 2012, and June 30, 2013. The term debt is secured by all of the outstanding capital stock of the Bank. The Company has made all required interest payments on the outstanding principal amounts on a timely basis. Pursuant to the Written Agreement defined below with the Federal Reserve Bank of Chicago (the “Federal Reserve”), the Company must receive the Federal Reserve’s approval prior to making any interest payments on the subordinated debt.
The credit facility agreement contains usual and customary provisions regarding acceleration of the senior debt upon the occurrence of an event of default by the Company under the senior debt agreement. The senior debt agreement also contains certain customary representations and warranties and financial and negative covenants. At June 30, 2013, the Company was out of compliance with one of the financial covenants contained within the credit agreement. Previously, the Company had been out of compliance with two of the financial covenants. The agreement provides that upon an event of default as the result of the Company’s failure to comply with a financial covenant, relating to the senior debt, the lender may (i) terminate all commitments to extend further credit, (ii) increase the interest rate on the revolving line of the term debt by 200 basis points, (iii) declare the senior debt immediately due and payable, and (iv) exercise all of its rights and remedies at law, in equity and/or pursuant to any or all collateral documents, including foreclosing on the collateral. The total outstanding principal amount of the senior debt is the $500,000 in term debt. Because the subordinated debt is treated as Tier 2 capital for regulatory capital purposes, the senior debt agreement does not provide the lender with any rights of acceleration or other remedies with regard to the subordinated debt upon an event of default caused by the Company’s failure to comply with a financial covenant.
The Company increased its securities sold under repurchase agreements $12.6 million, or 70.7%, from December 31, 2012. The Company’s other short-term borrowings decreased $100.0 million, from December 31, 2012 as a Federal Home Loan Bank of Chicago advance matured and was not replaced.
Capital
As of June 30, 2013, total stockholders’ equity was $71.1 million, which was a decrease of $1.5 million, or 2.0%, from $72.6 million as of December 31, 2012. This decrease was primarily attributable to the increase in the accumulated other comprehensive loss, specifically unrealized loss on securities available for sale in the second quarter of 2013. Unrealized loss on securities available for sale was $1.3 million at December 31, 2012 and $10.5 million at June 30, 2013 causing a reduction in capital of $9.2 million. Additionally, as discussed further below total stockholders’ equity benefited by the Company not accruing a dividend for the second quarter of 2013 on its Series B Perpetual Preferred Stock (the “Series B Stock”). As of June 30, 2013, the Company’s regulatory ratios of total capital to risk weighted assets, Tier 1 capital to risk weighted assets and Tier 1 leverage increased to 14.70%, 7.89% and 5.46%, respectively, compared to 13.62%, 6.81% and 4.85%, respectively, at December 31, 2012. The Company, on a consolidated basis, exceeded the minimum ratios to be deemed “adequately capitalized” under regulatory defined capital ratios at June 30, 2013. The same capital ratios at the Bank were 16.30%, 15.03% and 10.40%, respectively, at June 30, 2013, compared to 14.86%, 13.59%, and 9.67%, at December 31, 2012. The Bank’s ratios exceeded the heightened capital ratios agreed to in the consent order the Bank entered with the Office of the Comptroller of Currency (“OCC”) in the May 2011 Consent Order (“Consent Order”).
In July 2013, the Board of Governors of the Federal Reserve System and the Office of the Comptroller of the Currency issued their final rules for regulatory capital and the implementation of Basel III that will become effective for organizations such as ours on January 1, 2015. The final rule introduces enhanced standard capital standards to help ensure that the largest and most complex banking organizations have adequate capital. The final rule also introduces new capital requirements for smaller banking organizations such as ours, which are intended to address the risks generally associated with Community banking organizations. Management is reviewing the new rules to assess their impact of our organization.
13
In July 2011, the Company also entered into a written agreement (the “Written Agreement”) with the Federal Reserve designed to maintain the financial soundness of the Company. Key provisions of the Written Agreement include restrictions on the Company’s payment of dividends on its capital stock, restrictions on the Company taking dividends or other payments from the Bank that reduce the Bank’s capital, restrictions on subordinated debenture and trust preferred security distributions, restrictions on incurring additional debt or repurchasing stock, capital planning provisions, requirements to submit cash flow projections to the Reserve Bank, requirements to comply with certain notice provisions pertaining to changes in directors or senior management, requirements to comply with regulatory restrictions on indemnification and severance payments, and requirements to submit certain reports to the Reserve Bank. The Written Agreement also calls for the Company to serve as a source of strength for the Bank, including ensuring that the Bank complies with the Consent Order.
In addition to the above regulatory ratios, the Company’s non-GAAP tangible common equity to tangible assets decreased to (0.18)% at June 30, 2013, largely attributable to the increase in the accumulated other comprehensive loss. Specifically unrealized loss on securities available for sale rose sharply in the second quarter of 2013. The Tier 1 common equity to risk weighted assets increased to 0.48% at June 30, 2013. 2013 results compared to (0.13)% and (0.12)%, respectively, at December 31, 2012.
As previously announced in the third quarter of 2010, the Company elected to defer regularly scheduled interest payments on $58.4 million of junior subordinated debentures related to the trust preferred securities issued by its two statutory trust subsidiaries, Old Second Capital Trust I and Old Second Capital Trust II (the “Trust Preferred Securities”). Because of the deferral on the subordinated debentures, the trusts will defer regularly scheduled dividends on their Trust Preferred Securities. The total accumulated interest on the Trust Preferred Securities including compounded interest from July 1, 2010 on the deferred payments totaled $14.3 million at June 30, 2013.
Auctions were held and transactions were settled in first quarter 2013 reflecting Treasury’s efforts to conclude the Troubled Asset Relief Program Capital Purchase Program. All of the Old Second Bancorp Series B Stock held by Treasury was sold to third parties, including certain of our directors. At December 31, 2012, Old Second Bancorp carried $71.9 million of Series B Stock in Total Stockholders Equity. At June 30, 2013, the Company carried $72.4 million of Series B Stock, which reflected discount accretion but no dividend accrual for second quarter, as discussed below.
Following the completed auctions, the Company’s Board elected to stop accruing the dividend on the Series B Stock. Previously, the Company had declared and accrued the dividend on the Series B Stock quarterly throughout the deferral period. Given the discount reflected in the results of the auction, the Board believes that the Company will likely be able to repurchase the Series B Stock in the future at a price less than the face amount of the Series B Stock plus accrued and unpaid dividends. Therefore, under GAAP, the Company did not fully accrue the dividend on the Series B Stock in the first quarter and did not accrue for it in second quarter. The Company will continue to evaluate whether declaring dividends on the Series B Stock is appropriate in future periods. Pursuant to the terms of the Series B Stock, the dividends paid on the Series B Stock will increase from 5% to 9% in 2014.
Non-GAAP Presentations: Management has traditionally disclosed certain non-GAAP ratios to evaluate and measure the Company’s performance, including a net interest margin calculation. The net interest margin is calculated by dividing net interest income on a tax equivalent basis by average earning assets for the period. Management believes this measure provides investors with information regarding balance sheet profitability. Management also presents an efficiency ratio that is non-GAAP. The efficiency ratio is calculated by dividing adjusted noninterest expense by the sum of net interest income on a tax equivalent basis and adjusted noninterest income. Management believes this measure provides investors with information regarding the Company’s operating efficiency and how management evaluates performance internally. Consistent with industry practice, management also disclosed the tangible common equity to tangible assets and the Tier 1 common equity to risk weighted assets in the discussion immediately above and
14
in the following tables. The tables provide a reconciliation of each non-GAAP measure to the most comparable GAAP equivalent.
Forward Looking Statements: This report may contain forward-looking statements. Forward looking statements are identifiable by the inclusion of such qualifications as expects, intends, believes, may, likely or other indications that the particular statements are not based upon facts but are rather based upon the Company’s beliefs as of the date of this release. Actual events and results may differ significantly from those described in such forward-looking statements, due to changes in the economy, interest rates or other factors. Additionally, all statements in this document, including forward-looking statements, speak only as of the date they are made, and the Company undertakes no obligation to update any statement in light of new information or future events. For additional information concerning the Company and its business, including other factors that could materially affect the Company’s financial results, please review our filings with the Securities and Exchange Commission.
15
Financial Highlights (unaudited)
In thousands, except share data
| | As of and for the | | As of and for the | |
| | Three Months Ended | | Six Months Ended | |
| | June 30, | | June 30, | |
| | 2013 | | | | 2012 | | | | 2013 | | | | 2012 | |
Summary Statements of Operations: | | | | | | | | | | | | | | | |
Net interest and dividend income | | $ | 13,388 | | | | $ | 15,690 | | | | $ | 27,290 | | | | $ | 30,794 | |
(Release) provision for loan losses | | (1,800) | | | | 200 | | | | (4,300) | | | | 6,284 | |
Noninterest income | | 10,483 | | | | 10,396 | | | | 21,079 | | | | 20,860 | |
Noninterest expense | | 22,194 | | | | 24,634 | | | | 43,721 | | | | 47,086 | |
Provision for income taxes | | - | | | | - | | | | - | | | | - | |
Net income (loss) | | 3,477 | | | | 1,252 | | | | 8,948 | | | | (1,716) | |
Net income (loss) available to common stockholders | | 2,172 | | | | 14 | | | | 6,354 | | | | (4,177) | |
Key Ratios (annualized): | | | | | | | | | | | | | | | |
Return on average assets | | 0.72% | | | | 0.26% | | | | 0.92% | | | | (0.18%) | |
Return to common stockholders on average assets | | 0.45% | | | | 0.00% | | | | 0.65% | | | | (0.43%) | |
Return on average equity | | 18.32% | | | | 7.09% | | | | 24.14% | | | | (4.71%) | |
Return on average common equity | | 226.22% | | | | (23.08%) | | | | 487.57% | | | | (392.52%) | |
Net interest margin (non-GAAP tax equivalent)1 | | 3.07% | | | | 3.65% | | | | 3.13% | | | | 3.57% | |
Efficiency ratio (non-GAAP tax equivalent)1 | | 78.87% | | | | 70.07% | | | | 77.17% | | | | 69.67% | |
Tangible common equity to tangible assets2 | | (0.18%) | | | | (0.27%) | | | | (0.18%) | | | | (0.27%) | |
Tier 1 common equity to risk weighted assets2 | | 0.48% | | | | (0.12%) | | | | 0.48% | | | | (0.12%) | |
Company total capital to risk weighted assets 3 | | 14.70% | | | | 12.33% | | | | 14.70% | | | | 12.33% | |
Company tier 1 capital to risk weighted assets 3 | | 7.89% | | | | 6.16% | | | | 7.89% | | | | 6.16% | |
Company tier 1 capital to average assets | | 5.46% | | | | 4.81% | | | | 5.46% | | | | 4.81% | |
Bank total capital to risk weighted assets 3 | | 16.30% | | | | 13.25% | | | | 16.30% | | | | 13.25% | |
Bank tier 1 capital to risk weighted assets 3 | | 15.03% | | | | 11.99% | | | | 15.03% | | | | 11.99% | |
Bank tier 1 capital to average assets | | 10.40% | | | | 9.35% | | | | 10.40% | | | | 9.35% | |
Per Share Data: | | | | | | | | | | | | | | | |
Basic earnings (loss) per share | | $0.15 | | | | $0.00 | | | | $0.45 | | | | ($0.29) | |
Diluted earnings (loss) per share | | $0.15 | | | | $0.00 | | | | $0.45 | | | | ($0.29) | |
Dividends declared per share | | $0.00 | | | | $0.00 | | | | $0.00 | | | | $0.00 | |
Common book value per share | | ($0.09) | | | | ($0.09) | | | | ($0.09) | | | | ($0.09) | |
Tangible common book value per share | | ($0.25) | | | | ($0.39) | | | | ($0.25) | | | | ($0.39) | |
Ending number of shares outstanding | | 13,882,910 | | | | 14,084,328 | | | | 13,882,910 | | | | 14,084,328 | |
Average number of shares outstanding | | 13,882,910 | | | | 14,084,328 | | | | 13,978,979 | | | | 14,063,936 | |
Diluted average shares outstanding | | 14,077,778 | | | | 14,210,928 | | | | 14,117,431 | | | | 14,203,535 | |
End of Period Balances: | | | | | | | | | | | | | | | |
Loans | | $ | 1,102,703 | | | | $ | 1,238,134 | | | | $ | 1,102,703 | | | | $ | 1,238,134 | |
Deposits | | 1,690,623 | | | | 1,770,024 | | | | 1,690,623 | | | | 1,770,024 | |
Stockholders’ equity | | 71,102 | | | | 70,147 | | | | 71,102 | | | | 70,147 | |
Total earning assets | | 1,758,024 | | | | 1,740,665 | | | | 1,758,024 | | | | 1,740,665 | |
Total assets | | 1,932,934 | | | | 1,985,658 | | | | 1,932,934 | | | | 1,985,658 | |
Average Balances: | | | | | | | | | | | | | | | |
Loans | | $ | 1,113,315 | | | | $ | 1,287,815 | | | | $ | 1,125,877 | | | | $ | 1,318,629 | |
Deposits | | 1,703,040 | | | | 1,754,543 | | | | 1,702,264 | | | | 1,749,434 | |
Stockholders’ equity | | 76,117 | | | | 70,992 | | | | 74,763 | | | | 73,252 | |
Total earning assets | | 1,764,196 | | | | 1,737,954 | | | | 1,773,097 | | | | 1,745,217 | |
Total assets | | 1,943,698 | | | | 1,963,955 | | | | 1,959,975 | | | | 1,960,735 | |
1 Tabular disclosures of the tax equivalent calculation including the net interest margin and efficiency ratio for the quarters ending June 30, 2013, and 2012, respectively, are presented on page 19.
2 The information necessary to reconcile GAAP measures and the ratios of Tier 1 capital, total capital, tangible common equity or Tier 1 common equity, as applicable, to average total assets, risk-weighted assets or tangible assets, as applicable, is presented on page 20.
3 The Company and the Bank are subject to regulatory capital requirements administered by federal banking agencies. Those agencies define the basis for these calculations, including the prescribed methodology for the calculation of the amount of risk-weighted assets.
16
Old Second Bancorp, Inc. and Subsidiaries
Consolidated Balance Sheets
(In thousands)
| | | (unaudited) | | | | (audited) | |
| | | June 30, | | | | December 31, | |
| | | 2013 | | | | 2012 | |
Assets | | | | | | | | |
Cash and due from banks | | | $ | 12,264 | | | | $ | 44,221 | |
Interest bearing deposits with financial institutions | | | 55,594 | | | | 84,286 | |
Cash and cash equivalents | | | 67,858 | | | | 128,507 | |
Securities available-for-sale | | | 584,937 | | | | 579,886 | |
Federal Home Loan Bank and Federal Reserve Bank stock | | | 10,292 | | | | 11,202 | |
Loans held-for-sale | | | 4,498 | | | | 9,571 | |
Loans | | | 1,102,703 | | | | 1,150,050 | |
Less: allowance for loan losses | | | 35,042 | | | | 38,597 | |
Net loans | | | 1,067,661 | | | | 1,111,453 | |
Premises and equipment, net | | | 46,793 | | | | 47,002 | |
Other real estate owned, net | | | 59,465 | | | | 72,423 | |
Mortgage servicing rights, net | | | 5,301 | | | | 4,116 | |
Core deposit and other intangible asset, net | | | 2,226 | | | | 3,276 | |
Bank-owned life insurance (BOLI) | | | 54,586 | | | | 54,203 | |
Other assets | | | 29,317 | | | | 24,160 | |
Total assets | | | $ | 1,932,934 | | | | $ | 2,045,799 | |
| | | | | | | | |
Liabilities | | | | | | | | |
Deposits: | | | | | | | | |
Noninterest bearing demand | | | $ | 366,406 | | | | $ | 379,451 | |
Interest bearing: | | | | | | | | |
Savings, NOW, and money market | | | 827,952 | | | | 826,976 | |
Time | | | 496,265 | | | | 510,792 | |
Total deposits | | | 1,690,623 | | | | 1,717,219 | |
Securities sold under repurchase agreements | | | 30,510 | | | | 17,875 | |
Other short-term borrowings | | | - | | | | 100,000 | |
Junior subordinated debentures | | | 58,378 | | | | 58,378 | |
Subordinated debt | | | 45,000 | | | | 45,000 | |
Notes payable and other borrowings | | | 500 | | | | 500 | |
Other liabilities | | | 36,821 | | | | 34,275 | |
Total liabilities | | | 1,861,832 | | | | 1,973,247 | |
| | | | | | | | |
Stockholders’ Equity | | | | | | | | |
Preferred stock | | | 72,396 | | | | 71,869 | |
Common stock | | | 18,780 | | | | 18,729 | |
Additional paid-in capital | | | 66,162 | | | | 66,189 | |
Retained earnings | | | 19,958 | | | | 12,048 | |
Accumulated other comprehensive loss | | | (10,484 | ) | | | (1,327 | ) |
Treasury stock | | | (95,710 | ) | | | (94,956 | ) |
Total stockholders’ equity | | | 71,102 | | | | 72,552 | |
Total liabilities and stockholders’ equity | | | $ | 1,932,934 | | | | $ | 2,045,799 | |
17
Old Second Bancorp, Inc. and Subsidiaries
Consolidated Statements of Operations
(In thousands, except share data)
| | (unaudited) | | (unaudited) | |
| | Three Months Ended | | Year to Date | |
| | June 30, | | June 30, | |
| | 2013 | | | | 2012 | | | | 2013 | | | | 2012 | |
Interest and Dividend Income | | | | | | | | | | | | | | | |
Loans, including fees | | $ | 13,912 | | | | $ | 17,617 | | | | $ | 28,826 | | | | $ | 35,283 | |
Loans held-for-sale | | 45 | | | | 49 | | | | 86 | | | | 133 | |
Securities, taxable | | 2,698 | | | | 1,856 | | | | 4,996 | | | | 3,354 | |
Securities, tax exempt | | 174 | | | | 102 | | | | 293 | | | | 205 | |
Dividends from Federal Reserve Bank and Federal Home Loan Bank stock | | 76 | | | | 77 | | | | 152 | | | | 151 | |
Interest bearing deposits with financial institutions | | 27 | | | | 35 | | | | 69 | | | | 60 | |
Total interest and dividend income | | 16,932 | | | | 19,736 | | | | 34,422 | | | | 39,186 | |
Interest Expense | | | | | | | | | | | | | | | |
Savings, NOW, and money market deposits | | 221 | | | | 254 | | | | 449 | | | | 554 | |
Time deposits | | 1,800 | | | | 2,342 | | | | 3,653 | | | | 4,947 | |
Securities sold under repurchase agreements | | - | | | | 1 | | | | 1 | | | | 1 | |
Other short-term borrowings | | - | | | | 1 | | | | 19 | | | | 4 | |
Junior subordinated debentures | | 1,314 | | | | 1,220 | | | | 2,601 | | | | 2,417 | |
Subordinated debt | | 205 | | | | 224 | | | | 401 | | | | 461 | |
Notes payable and other borrowings | | 4 | | | | 4 | | | | 8 | | | | 8 | |
Total interest expense | | 3,544 | | | | 4,046 | | | | 7,132 | | | | 8,392 | |
Net interest and dividend income | | 13,388 | | | | 15,690 | | | | 27,290 | | | | 30,794 | |
(Release) provision for loan losses | | (1,800 | ) | | | 200 | | | | (4,300 | ) | | | 6,284 | |
Net interest and dividend income after provision for loan losses | | 15,188 | | | | 15,490 | | | | 31,590 | | | | 24,510 | |
Noninterest Income | | | | | | | | | | | | | | | |
Trust income | | 1,681 | | | | 1,463 | | | | 3,172 | | | | 3,114 | |
Service charges on deposits | | 1,799 | | | | 1,893 | | | | 3,475 | | | | 3,724 | |
Secondary mortgage fees | | 267 | | | | 311 | | | | 497 | | | | 607 | |
Mortgage servicing gain, net of changes in fair value | | 743 | | | | (397 | ) | | | 987 | | | | (210 | ) |
Net gain on sales of mortgage loans | | 1,811 | | | | 2,358 | | | | 3,787 | | | | 5,005 | |
Securities gains, net | | 745 | | | | 692 | | | | 2,198 | | | | 793 | |
Increase in cash surrender value of bank-owned life insurance | | 372 | | | | 326 | | | | 779 | | | | 821 | |
Death benefit realized on bank-owned life insurance | | 375 | | | | - | | | | 375 | | | | - | |
Debit card interchange income | | 900 | | | | 1,113 | | | | 1,692 | | | | 1,873 | |
Lease revenue from other real estate owned | | 257 | | | | 911 | | | | 665 | | | | 2,090 | |
Net gain on sales of other real estate owned | | 386 | | | | 355 | | | | 567 | | | | 378 | |
Other income | | 1,147 | | | | 1,371 | | | | 2,885 | | | | 2,665 | |
Total noninterest income | | 10,483 | | | | 10,396 | | | | 21,079 | | | | 20,860 | |
Noninterest Expense | | | | | | | | | | | | | | | |
Salaries and employee benefits | | 9,177 | | | | 8,823 | | | | 18,209 | | | | 17,872 | |
Occupancy expense, net | | 1,242 | | | | 1,207 | | | | 2,521 | | | | 2,442 | |
Furniture and equipment expense | | 1,104 | | | | 1,183 | | | | 2,248 | | | | 2,338 | |
FDIC insurance | | 1,024 | | | | 1,029 | | | | 2,059 | | | | 2,029 | |
General bank insurance | | 491 | | | | 841 | | | | 1,340 | | | | 1,687 | |
Amortization of core deposit and other intangible asset | | 525 | | | | 250 | | | | 1,050 | | | | 445 | |
Advertising expense | | 328 | | | | 264 | | | | 494 | | | | 582 | |
Debit card interchange expense | | 362 | | | | 453 | | | | 706 | | | | 795 | |
Legal fees | | 486 | | | | 770 | | | | 809 | | | | 1,455 | |
Other real estate expense | | 3,945 | | | | 6,788 | | | | 7,631 | | | | 11,442 | |
Other expense | | 3,510 | | | | 3,026 | | | | 6,654 | | | | 5,999 | |
Total noninterest expense | | 22,194 | | | | 24,634 | | | | 43,721 | | | | 47,086 | |
Income (loss) before income taxes | | 3,477 | | | | 1,252 | | | | 8,948 | | | | (1,716 | ) |
Provision for income taxes | | - | | | | - | | | | - | | | | - | |
Net income (loss) | | 3,477 | | | | 1,252 | | | | $ | 8,948 | | | | $ | (1,716 | ) |
Preferred stock dividends and accretion of discount | | 1,305 | | | | 1,238 | | | | 2,594 | | | | 2,461 | |
Net income (loss) available to common stockholders | | $ | 2,172 | | | | $ | 14 | | | | $ | 6,354 | | | | $ | (4,177 | ) |
| | | | | | | | | | | | | | | |
Basic income (loss) per share | | $ | 0.15 | | | | $0.00 | | | | $ | 0.45 | | | | $ | (0.29 | ) |
Diluted income (loss) per share | | 0.15 | | | | 0.00 | | | | 0.45 | | | | (0.29 | ) |
Dividends declared per share | | - | | | | - | | | | - | | | | - | |
18
The following tables provide a reconciliation of each non-GAAP measure to the most comparable GAAP equivalent. (Dollar amounts in thousands- unaudited)
| | Three Months Ended | | Year to Date | |
| | June 30, | | June 30, | |
| | 2013 | | | | 2012 | | | | 2013 | | | | 2012 | |
Net Interest Margin | | | | | | | | | | | | | | | |
Interest income (GAAP) | | $ | 16,932 | | | | $ | 19,736 | | | | $ | 34,422 | | | | $ | 39,186 | |
Taxable equivalent adjustment: | | | | | | | | | | | | | | | |
Loans | | 17 | | | | 22 | | | | 33 | | | | 46 | |
Securities | | 94 | | | | 55 | | | | 158 | | | | 111 | |
Interest income (TE) | | 17,043 | | | | 19,813 | | | | 34,613 | | | | 39,343 | |
Interest expense (GAAP) | | 3,544 | | | | 4,046 | | | | 7,132 | | | | 8,392 | |
Net interest income (TE) | | $ | 13,499 | | | | $ | 15,767 | | | | $ | 27,481 | | | | $ | 30,951 | |
Net interest income (GAAP) | | $ | 13,388 | | | | $ | 15,690 | | | | $ | 27,290 | | | | $ | 30,794 | |
Average interest earning assets | | $ | 1,764,196 | | | | $ | 1,737,954 | | | | $ | 1,773,097 | | | | $ | 1,745,217 | |
Net interest margin (GAAP) | | 3.04% | | | | 3.63% | | | | 3.10% | | | | 3.55% | |
Net interest margin (TE) | | 3.07% | | | | 3.65% | | | | 3.13% | | | | 3.57% | |
| | | | | | | | | | | | | | | |
| | | | | | | | | | | | | | | |
Efficiency Ratio | | | | | | | | | | | | | | | |
Noninterest expense | | $ | 22,194 | | | | $ | 24,634 | | | | $ | 43,721 | | | | $ | 47,086 | |
Less amortization of core deposit and other intangible asset | | 525 | | | | 250 | | | | 1,050 | | | | 445 | |
Less other real estate expense | | 3,945 | | | | 6,788 | | | | 7,631 | | | | 11,442 | |
Adjusted noninterest expense | | 17,724 | | | | 17,596 | | | | 35,040 | | | | 35,199 | |
Net interest income (GAAP) | | 13,388 | | | | 15,690 | | | | 27,290 | | | | 30,794 | |
Taxable-equivalent adjustment: | | | | | | | | | | | | | | | |
Loans | | 17 | | | | 22 | | | | 33 | | | | 46 | |
Securities | | 94 | | | | 55 | | | | 158 | | | | 111 | |
Net interest income (TE) | | 13,499 | | | | 15,767 | | | | 27,481 | | | | 30,951 | |
Noninterest income | | 10,483 | | | | 10,396 | | | | 21,079 | | | | 20,860 | |
Less death benefit related to bank-owned life insurance | | 375 | | | | - | | | | 375 | | | | - | |
Less litigation related income | | 4 | | | | 3 | | | | 15 | | | | 119 | |
Less securities gain, net | | 745 | | | | 692 | | | | 2,198 | | | | 793 | |
Less gain on sale of OREO | | 386 | | | | 355 | | | | 567 | | | | 378 | |
Adjusted noninterest income, plus net interest income (TE) | | 22,472 | | | | 25,113 | | | | 45,405 | | | | 50,521 | |
Efficiency ratio | | 78.87% | | | | 70.07% | | | | 77.17% | | | | 69.67% | |
19
| | (unaudited) | | | (unaudited) | |
| | As of June 30, | | | December 31, | |
(dollars in thousands) | | 2013 | | | | 2012 | | | | 2012 | |
| | | | | | | | | | | |
Tier 1 capital | | | | | | | | | | | |
Total stockholders’ equity | | $ | 71,102 | | | | $ | 70,147 | | | | $ | 72,552 | |
Tier 1 adjustments: | | | | | | | | | | | |
Trust preferred securities | | 27,195 | | | | 24,704 | | | | 24,626 | |
Cumulative other comprehensive loss | | 10,484 | | | | 3,965 | | | | 1,327 | |
Disallowed intangible assets | | (2,226 | ) | | | (4,233 | ) | | | (3,276 | ) |
Disallowed deferred tax assets | | - | | | | - | | | | - | |
Other | | (530 | ) | | | (353 | ) | | | (412 | ) |
Tier 1 capital | | $ | 106,025 | | | | $ | 94,230 | | | | $ | 94,817 | |
| | | | | | | | | | | |
Total capital | | | | | | | | | | | |
Tier 1 capital | | $ | 106,025 | | | | $ | 94,230 | | | | $ | 94,817 | |
Tier 2 additions: | | | | | | | | | | | |
Allowable portion of allowance for loan losses | | 17,016 | | | | 19,370 | | | | 17,656 | |
Additional trust preferred securities disallowed for tier 1 captial | | 29,430 | | | | 31,921 | | | | 31,999 | |
Subordinated debt | | 45,000 | | | | 45,000 | | | | 45,000 | |
Tier 2 additions subtotal | | 91,446 | | | | 96,291 | | | | 94,655 | |
Allowable Tier 2 | | 91,446 | | | | 94,230 | | | | 94,655 | |
Other Tier 2 capital components | | (6 | ) | | | (6 | ) | | | (6 | ) |
Total capital | | $ | 197,465 | | | | $ | 188,454 | | | | $ | 189,466 | |
| | | | | | | | | | | |
Tangible common equity | | | | | | | | | | | |
Total stockholders’ equity | | $ | 71,102 | | | | $ | 70,147 | | | | $ | 72,552 | |
Less: Preferred equity | | 72,396 | | | | 71,358 | | | | 71,869 | |
Intangible assets | | 2,226 | | | | 4,233 | | | | 3,276 | |
Tangible common equity | | $ | (3,520 | ) | | | $ | (5,444 | ) | | | $ | (2,593 | ) |
| | | | | | | | | | | |
Tier 1 common equity | | | | | | | | | | | |
Tangible common equity | | $ | (3,520 | ) | | | $ | (5,444 | ) | | | $ | (2,593 | ) |
Tier 1 adjustments: | | | | | | | | | | | |
Cumulative other comprehensive loss | | 10,484 | | | | 3,965 | | | | 1,327 | |
Other | | (530 | ) | | | (353 | ) | | | (412 | ) |
Tier 1 common equity | | $ | 6,434 | | | | $ | (1,832 | ) | | | $ | (1,678 | ) |
| | | | | | | | | | | |
Tangible assets | | | | | | | | | | | |
Total assets | | $ | 1,932,934 | | | | $ | 1,985,658 | | | | $ | 2,045,799 | |
Less: | | | | | | | | | | | |
Intangible assets | | 2,226 | | | | 4,233 | | | | 3,276 | |
Tangible assets | | $ | 1,930,708 | | | | $ | 1,981,425 | | | | $ | 2,042,523 | |
| | | | | | | | | | | |
Total risk-weighted assets | | | | | | | | | | | |
On balance sheet | | $ | 1,308,166 | | | | $ | 1,484,939 | | | | $ | 1,356,762 | |
Off balance sheet | | 35,125 | | | | 43,730 | | | | 34,804 | |
Total risk-weighted assets | | $ | 1,343,291 | | | | $ | 1,528,669 | | | | $ | 1,391,566 | |
| | | | | | | | | | | |
Average assets | | | | | | | | | | | |
Total average assets for leverage | | $ | 1,940,942 | | | | $ | 1,959,369 | | | | $ | 1,955,000 | |
20