United States
Securities and Exchange Commission
Washington, D.C. 20549
Form N-CSR
Certified Shareholder Report of Registered Management Investment Companies
811-3385
(Investment Company Act File Number)
Federated MDT Stock Trust
_______________________________________________________________
(Exact Name of Registrant as Specified in Charter)
Federated Investors Funds
4000 Ericsson Drive
Warrendale, Pennsylvania 15086-7561
(Address of Principal Executive Offices)
(412) 288-1900
(Registrant's Telephone Number)
John W. McGonigle, Esquire
Federated Investors Tower
1001 Liberty Avenue
Pittsburgh, Pennsylvania 15222-3779
(Name and Address of Agent for Service)
(Notices should be sent to the Agent for Service)
Date of Fiscal Year End: 10/31/16
Date of Reporting Period: 10/31/16
Item 1. Reports to Stockholders

Annual Shareholder Report
October 31, 2016
| Share Class | Ticker |
| A | FSTRX |
| Institutional | FMSTX |
| Service | FSTKX |
| R6 | FSTLX |
Federated MDT Stock Trust
Fund Established 1982
Dear Valued Shareholder,
I am pleased to present the Annual Shareholder Report for your fund covering the period from November 1, 2015 through October 31, 2016. This report includes Management's Discussion of Fund Performance, a complete listing of your fund's holdings, performance information and financial statements along with other important fund information.
In addition, our website, FederatedInvestors.com, offers easy access to Federated resources that include timely fund updates, economic and market insights from our investment strategists, and financial planning tools. We invite you to register to take full advantage of its capabilities.
Thank you for investing with Federated. I hope you find this information useful and look forward to keeping you informed.
Sincerely,
J. Christopher Donahue, President
Not FDIC Insured • May Lose Value • No Bank Guarantee
CONTENTS
| 1 |
| 6 |
| 7 |
| 12 |
| 16 |
| 18 |
| 19 |
| 20 |
| 29 |
| 30 |
| 32 |
| 38 |
| 45 |
| 45 |
Management's Discussion of Fund Performance (unaudited)
The total return of Federated MDT Stock Trust (the “Fund”), based on net asset value for the 12-month reporting period ended October 31, 2016, was 2.47% for the Class A Shares, 2.70% for the Institutional Shares, 2.50% for the Service Shares and 2.56%1 for the Class R6 Shares. The total return of the Russell 1000® Value Index (R1000V),2 the Fund's broad-based securities market index, was 6.37% for the same period. The total return of the Morningstar Large Value Funds Average (MLVFA),3 a peer group average for the Fund, was 3.72% for the same period. The Fund's and MLVFA's total returns for the most recently completed reporting period reflected actual cash flows, transaction costs and other expenses, which were not reflected in the total return of the R1000V.
During the reporting period, the Fund's investment strategy focused on stock selection, which was the most significant factor affecting the Fund's performance relative to the R1000V during the period.
The following discussion will focus on the performance of the Fund's Institutional Shares.
Market Overview
The reporting period did not favor a particular size of company, as the large-cap Russell Top 200® Index,4 the mid-cap Russell Midcap® Index,5 and the small-cap Russell 2000® Index6 all reported similar returns of just over four percent (4.28%, 4.17% and 4.11%, respectively). The differentiation was according to style: value-oriented stocks significantly outperformed growth-oriented stocks, as the market turned away from the growth stocks that it had favored in the prior reporting period. The Russell 3000® Value Index7 returned 6.55% over this reporting period, while the Russell 3000® Growth Index8 returned only 2.08%. Within the Russell 1000® Index9 (which contains both the Russell Top 200® Index and the Russell Midcap® Index), the R1000V, the benchmark for the Fund, returned 6.37%, while the Russell 1000® Growth Index10 returned 2.28%. During this reporting period, higher dividend-yield stocks generally outperformed lower yielding stocks across the domestic market.
The best performing sector in the R1000V during the reporting period was Utilities (17.55%), consistent with the outperformance of high dividend-yielding stocks. The Information Technology (13.83%) and Materials (13.75%) sectors were the second- and third-best performing sectors. Underperforming sectors during the same period included Real Estate (-7.01%) and Consumer Discretionary (-3.33%).
Annual Shareholder Report
STOCK SELECTION
Stock selection was the most important reason that the Fund underperformed the R1000V during the 12-month reporting period. The Fund chooses its holdings based on combinations of fundamental and technical factors. During the first nine months of the reporting period, stocks with combinations of factors that included high earnings to price underperformed significantly. The most heavily overweighted of these factor combinations in the Fund was high earnings to price and high structural earnings, a factor that the Fund uses to find stocks that are most likely to have strong repeatable earnings. Stocks with that combination of characteristics underperformed the benchmark during the first nine months of the period, and then turned and outperformed the benchmark in the last three months of the period. In spite of the last three months' outperformance, the net contribution from the stocks with those characteristics was negative. Additional net underperformance during the reporting period came from stocks with both high earnings to price and improving earnings estimates.
The most significant negative factor in the Fund's performance during the period was weak stock selection in the Energy and Consumer Discretionary sectors. The Information Technology sector, followed by the Industrials and Financials sectors, contributed the most positively to the Fund's performance versus the R1000V during the reporting period. All of the outperformance in these sectors was driven by favorable stock selection based on fundamentals rather than by sector selection, as the Fund is roughly sector-neutral.
Individual stocks enhancing the Fund's performance included Computer Sciences Corporation, Joy Global Inc., and HP Inc. These stocks all outperformed in the reporting period and were overweighted relative to the R1000V. Individual stocks detracting from the Fund's performance included Community Health Systems, Inc., Noble Corporation plc, and Ensco plc, all of which underperformed the benchmark and were overweighted by the Fund.
| 1 | The Fund's Class R6 Shares commenced operations on June 29, 2016. For the period prior to the commencement of operations of the Class R6 Shares, the performance information shown is for the Service Shares adjusted to reflect the expenses of the Fund's Class R6 Shares for each year for which the fund's Class R6 Shares expenses would have exceeded the actual expenses paid by the Fund's Service Shares. |
| 2 | Please see the footnotes to the line graphs below for definitions of, and further information about, the R1000V. |
| 3 | Please see the footnotes to the line graphs below for definitions of, and further information about, the MLVFA. |
| 4 | The Russell Top 200® Index measures the performance of the largest cap segment of the U.S. equity universe. The Russell Top 200® Index is a subset of the Russell 3000® Index. It includes approximately 200 of the largest securities based on a combination of their market cap and current index membership. The Russell Top 200® Index is constructed to provide a comprehensive and unbiased barometer for this very large-cap segment and is completely reconstituted annually to ensure new and growing equities are reflected. The index is unmanaged, and it is not possible to invest directly in an index. |
Annual Shareholder Report
| 5 | The Russell Midcap® Index measures the performance of the mid-cap segment of the U.S. equity universe. The Russell Midcap® Index is a subset of the Russell 1000® Index. It includes approximately 800 of the smallest securities based on a combination of their market cap and current index membership. The Russell Midcap® Index is constructed to provide a comprehensive and unbiased barometer for the mid-cap segment and is completely reconstituted annually to ensure larger stocks do not distort the performance and characteristics of the true mid-cap opportunity set. The index is unmanaged, and it is not possible to invest directly in an index. |
| 6 | The Russell 2000® Index measures the performance of the small-cap segment of the U.S. equity universe. The Russell 2000® Index is a subset of the Russell 3000® Index. It includes approximately 2,000 of the smallest securities based on a combination of their market cap and current index membership. The Russell 2000® is constructed to provide a comprehensive and unbiased small-cap barometer and is completely reconstituted annually to ensure larger stocks do not distort the performance and characteristics of the true small-cap opportunity set. The index is unmanaged, and it is not possible to invest directly in an index. |
| 7 | The Russell 3000® Value Index measures the performance of the broad value segment of the U.S. equity value universe. It includes those Russell 3000® Index companies with lower price-to-book ratios and lower forecasted growth values. The Russell 3000® Value Index is constructed to provide a comprehensive, unbiased and stable barometer of the broad value market. The Russell 3000® Value Index is completely reconstituted annually to ensure new and growing equities are included and that the represented companies continue to reflect value characteristics. The index is unmanaged, and it is not possible to invest directly in an index. |
| 8 | The Russell 3000® Growth Index measures the performance of the broad growth segment of the U.S. equity universe. It includes those Russell 3000® Index companies with higher price-to-book ratios and higher forecasted growth values. The Russell 3000® Growth Index is constructed to provide a comprehensive, unbiased and stable barometer of the broad growth market. The Russell 3000® Growth Index is completely reconstituted annually to ensure new and growing equities are included and that the represented companies continue to reflect growth characteristics. The index is unmanaged, and it is not possible to invest directly in an index. |
| 9 | The Russell 1000® Index measures the performance of the large-cap segment of the U.S. equity universe. The Russell 1000® Index is a subset of the Russell 3000® Index and includes approximately 1,000 of the largest securities based on a combination of their market cap and current index membership. The Russell 1000® Index is constructed to provide a comprehensive and unbiased barometer for the large-cap segment and is completely reconstituted annually to ensure new and growing equities are reflected. The index is unmanaged, and it is not possible to invest directly in an index. |
| 10 | The Russell 1000® Growth Index measures the performance of the large-cap growth segment of the U.S. equity universe. The Russell 1000® Growth Index includes those Russell 1000® companies with higher price-to-book ratios and higher forecasted growth values. The Russell 1000® Growth Index is constructed to provide a comprehensive and unbiased barometer for the large-cap growth segment. The Russell 1000® Growth Index is completely reconstituted annually to ensure new and growing equities are included and that the represented companies continue to reflect growth characteristics. The index is unmanaged, and it is not possible to invest directly in an index. |
Annual Shareholder Report
FUND PERFORMANCE AND GROWTH OF A $10,000 INVESTMENT
The graph below illustrates the hypothetical investment of $10,0001 in the Federated MDT Stock Trust (the “Fund”) from October 31, 2006 to October 31, 2016, compared to the Russell 1000® Value Index (R1000V)2 and the Morningstar Large Value Funds Average (MLVFA).3 The Average Annual Total Return table below shows returns for each class averaged over the stated periods.
Growth of a $10,000 INVESTMENT
Growth of $10,000 as of October 31, 2016
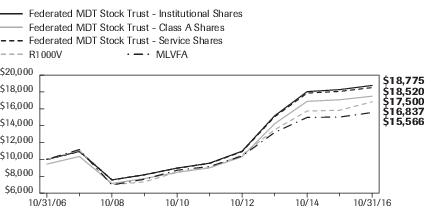
| Federated MDT Stock Trust - | Institutional Shares | Class A Shares | Service Shares | R1000V | MLVFA |
| F | F | F | I | I |
| 10/31/2006 | 10,000 | 9,450 | 10,000 | 10,000 | 10,000 |
| 10/31/2007 | 10,947 | 10,346 | 10,948 | 11,083 | 11,172 |
| 10/31/2008 | 7,574 | 7,159 | 7,576 | 7,005 | 6,973 |
| 10/31/2009 | 8,179 | 7,731 | 8,181 | 7,340 | 7,649 |
| 10/31/2010 | 8,971 | 8,471 | 8,964 | 8,493 | 8,717 |
| 10/31/2011 | 9,555 | 9,006 | 9,530 | 9,016 | 9,164 |
| 10/31/2012 | 10,977 | 10,323 | 10,924 | 10,539 | 10,406 |
| 10/31/2013 | 15,171 | 14,231 | 15,059 | 13,521 | 13,200 |
| 10/31/2014 | 18,043 | 16,889 | 17,872 | 15,746 | 14,984 |
| 10/31/2015 | 18,281 | 17,078 | 18,069 | 15,829 | 15,025 |
| 10/31/2016 | 18,775 | 17,500 | 18,520 | 16,837 | 15,566 |
41 graphic description end -->
| ■ | Total returns shown for Class A shares include the maximum sales charge of 5.50% ($10,000 investment minus $550 sales charge = $9,450). |
The Fund offers multiple share classes whose performance may be greater than or less than its other share class(es) due to differences in sales charges and expenses. See the Average Annual Total Return table below for the returns of additional classes not shown in the line graph above.
Average Annual Total Returns for the Period Ended 10/31/2016
(returns reflect all applicable sales charge as specified below in footnote #1)
| | 1 Year | 5 Years | 10 Years |
| Class A Shares4 | -3.17% | 12.93% | 5.75% |
| Institutional Shares4 | 2.70% | 14.46% | 6.50% |
| Service Shares | 2.50% | 14.21% | 6.35% |
| Class R6 Shares5 | 2.56% | 14.23% | 6.36% |
| R1000V | 6.37% | 13.31% | 5.35% |
| MLVFA | 3.72% | 11.34% | 4.91% |
Annual Shareholder Report
Performance data quoted represents past performance which is no guarantee of future results. Investment return and principal value will fluctuate so that an investor's shares, when redeemed, may be worth more or less than their original cost. Mutual fund performance changes over time and current performance may be lower or higher than what is stated. For current to the most recent month-end performance and after-tax returns, visit FederatedInvestors.com or call 1-800-341-7400. Returns shown do not reflect the deduction of taxes that a shareholder would pay on Fund distributions or the redemption of Fund shares. Mutual funds are not obligations of or guaranteed by any bank and are not federally insured.
| 1 | Represents a hypothetical investment of $10,000 in the Fund after deducting applicable sales charges for Class A Shares only, the maximum sales charge of 5.50% ($10,000 investment minus $550 sales charge = $9,450). The Fund's performance assumes the reinvestment of all dividends and distributions. The R1000V and the MLVFA have been adjusted to reflect reinvestment of dividends on securities in the indexes and the average. |
| 2 | The Russell 1000® Value Index measures the performance of the large-cap value segment of the U.S. equity universe. It includes those Russell 1000® Index companies with lower price-to-book ratios and lower expected growth values. The R1000V is constructed to provide a comprehensive and unbiased barometer for the large-cap value segment. The R1000V is completely reconstituted annually to ensure new and growing equities are included and that the represented companies continue to reflect value characteristics. The R1000V is not adjusted to reflect sales charges, expenses or other fees that the Securities and Exchange Commission (SEC) requires to be reflected in the Fund's performance. The index is unmanaged and unlike the Fund, is not affected by cash flows. It is not possible to invest directly in an index. |
| 3 | Morningstar figures represent the average of the total returns reported by all the funds designated by Morningstar as falling into the respective category indicated. They do not reflect sales charges. The Morningstar figures in the Growth of $10,000 line graph are based on historical return information published by Morningstar and reflect the return of the funds comprising the category in the year of publication. Because the funds designated by Morningstar as falling into the category can change over time, the Morningstar figures in the line graph may not match the Morningstar figures in the Average Annual Total Returns table, which reflect the return of the funds that currently comprise the category. |
| 4 | The Fund's Class A Shares and Institutional Shares commenced operations on May 1, 2014 and January 29, 2010, respectively. For the period prior to the commencement of operations of the Class A Shares and Institutional Shares, the performance information shown is for the Fund's Service Shares. The performance of the Service Shares has been adjusted to reflect the expenses of the Fund's Class A Shares for each year for which the Fund's Class A Shares' expenses would have exceeded the actual expenses paid by the Fund's Service Shares. The performance of the Service Shares has not been adjusted to reflect the expenses applicable to Institutional Shares since Institutional Shares have a lower expense ratio than the expense ratio of the Service Shares. The performance of Service Shares has been adjusted to remove any voluntary waiver of Fund expenses related to the Service Shares that may have occurred during the period prior to the commencement of operations of Institutional Shares. |
| 5 | The Fund's Class R6 Shares commenced operations on June 29, 2016. For the period prior to the commencement of operations of the Class R6 Shares, the performance information shown is for the Service Shares adjusted to reflect the expenses of the Fund's Class R6 Shares for each year for which the fund's Class R6 Shares' expenses would have exceeded the actual expenses paid by the Fund's Service Shares. |
Annual Shareholder Report
Portfolio of Investments Summary Table (unaudited)
At October 31, 2016, the Fund's sector composition1 was as follows:
| Sector Composition | Percentage of
Total Net Assets |
| Financial Services | 27.3% |
| Energy | 12.0% |
| IT Services | 11.0% |
| Public Utilities | 9.9% |
| Health Care | 9.8% |
| Consumer Staples | 7.5% |
| Basic Industries | 6.2% |
| Consumer Cyclicals | 5.7% |
| Capital Goods | 4.3% |
| Consumer Durables | 2.5% |
| Transportation | 1.8% |
| Cash Equivalents2 | 2.0% |
| Other Assets and Liabilities—Net3 | 0.0%4 |
| TOTAL | 100.0% |
| 1 | Except for Cash Equivalents and Other Assets and Liabilities, sector classifications are based upon, and individual portfolio securities are assigned to, the classifications of the Global Industry Classification Standard (GICS) except that the Adviser assigns a classification to securities not classified by the GICS and to securities for which the Adviser does not have access to the classification made by the GICS. |
| 2 | Cash Equivalents include any investments in money market mutual funds and/or overnight repurchase agreements. |
| 3 | Assets, other than investments in securities, less liabilities. See Statement of Assets and Liabilities. |
| 4 | Represents less than 0.1%. |
Annual Shareholder Report
Portfolio of Investments
October 31, 2016
| Shares | | | Value in
U.S. Dollars |
| | | COMMON STOCKS—98.0% | |
| | | Basic Industries—6.2% | |
| 181,698 | | Celanese Corp., Class A | $13,249,418 |
| 215,355 | 1 | Colfax Corp. | 6,846,135 |
| 77,200 | | Domtar, Corp. | 2,775,340 |
| 33,651 | | Kennametal, Inc. | 952,660 |
| 7,796 | | Reliance Steel & Aluminum Co. | 536,209 |
| 109,949 | | Walgreens Boots Alliance, Inc. | 9,096,081 |
| | | TOTAL | 33,455,843 |
| | | Capital Goods—4.3% | |
| 70,300 | | AGCO Corp. | 3,590,924 |
| 32,992 | 1 | First Solar, Inc. | 1,335,846 |
| 92,030 | | General Cable Corp. | 1,288,420 |
| 58,046 | | General Dynamics Corp. | 8,749,854 |
| 14,082 | | OshKosh Corp. | 753,387 |
| 60,100 | | Pitney Bowes, Inc. | 1,072,184 |
| 158,686 | 1 | SPX Corp. | 3,016,621 |
| 74,800 | | Trinity Industries, Inc. | 1,596,980 |
| 17,636 | | Triumph Group, Inc. | 417,973 |
| 24,921 | 1 | WESCO International, Inc. | 1,350,718 |
| | | TOTAL | 23,172,907 |
| | | Consumer Cyclicals—5.7% | |
| 54,815 | | Abercrombie & Fitch Co., Class A | 800,847 |
| 46,254 | | Best Buy Co., Inc. | 1,799,743 |
| 22,000 | | Big Lots, Inc. | 954,800 |
| 49,802 | | Dillard's Inc., Class A | 3,052,863 |
| 13,980 | | Foot Locker, Inc. | 933,445 |
| 17,900 | | Guess?, Inc. | 241,650 |
| 104,161 | | Kohl's Corp. | 4,557,044 |
| 28,742 | | PVH Corp. | 3,074,819 |
| 182,077 | | Target Corp. | 12,514,152 |
| 37,646 | | Wal-Mart Stores, Inc. | 2,635,973 |
| | | TOTAL | 30,565,336 |
Annual Shareholder Report
| Shares | | | Value in
U.S. Dollars |
| | | COMMON STOCKS—continued | |
| | | Consumer Durables—2.5% | |
| 313,726 | | Ford Motor Co. | $3,683,143 |
| 205,202 | | Goodyear Tire & Rubber Co. | 5,957,014 |
| 26,106 | | Whirlpool Corp. | 3,911,201 |
| | | TOTAL | 13,551,358 |
| | | Consumer Staples—7.5% | |
| 194,311 | | Campbell Soup Co. | 10,558,860 |
| 14,598 | | Ingredion, Inc. | 1,914,820 |
| 102,829 | | JM Smucker Co. | 13,502,476 |
| 76,600 | | Pilgrim's Pride Corp. | 1,672,944 |
| 162,996 | | Tyson Foods, Inc., Class A | 11,548,266 |
| 31,291 | | Whole Foods Market, Inc. | 885,222 |
| | | TOTAL | 40,082,588 |
| | | Energy—12.0% | |
| 54,307 | 1 | Chesapeake Energy Corp. | 299,232 |
| 87,040 | | Cimarex Energy Co. | 11,239,475 |
| 4,033 | 1 | Concho Resources, Inc. | 511,949 |
| 60,944 | | Diamond Offshore Drilling, Inc. | 1,004,966 |
| 378,479 | | Ensco PLC, Class A | 2,959,706 |
| 111,859 | | Exxon Mobil Corp. | 9,320,092 |
| 78,606 | | HollyFrontier Corp. | 1,961,220 |
| 74,085 | | Murphy Oil Corp. | 1,916,579 |
| 23,975 | 1 | Murphy USA, Inc. | 1,649,000 |
| 82,400 | | Nabors Industries Ltd. | 980,560 |
| 132,870 | | National-Oilwell Varco, Inc. | 4,265,127 |
| 416,473 | | Noble Corp. PLC | 2,057,377 |
| 48,146 | | NRG Energy, Inc. | 511,792 |
| 95,898 | | Occidental Petroleum Corp. | 6,991,923 |
| 19,900 | 1 | Oil States International, Inc. | 582,075 |
| 12,698 | | Pioneer Natural Resources, Inc. | 2,273,196 |
| 71,533 | | Rowan Companies PLC, Class A | 949,243 |
| 37,660 | 1 | Seadrill Ltd. | 80,216 |
| 45,200 | | Superior Energy Services, Inc. | 640,032 |
| 241,006 | | Valero Energy Corp. | 14,277,195 |
| | | TOTAL | 64,470,955 |
Annual Shareholder Report
| Shares | | | Value in
U.S. Dollars |
| | | COMMON STOCKS—continued | |
| | | Financial Services—27.3% | |
| 193,963 | | Aflac, Inc. | $13,358,232 |
| 8,100 | | American Financial Group, Inc. | 603,450 |
| 107,900 | | Assured Guaranty Ltd. | 3,225,131 |
| 377,407 | | Bank of America Corp. | 6,227,216 |
| 331,795 | | Bank of New York Mellon Corp. | 14,356,770 |
| 186,856 | | Citigroup, Inc. | 9,183,972 |
| 41,029 | | Everest Re Group Ltd. | 8,350,222 |
| 317,900 | | Fifth Third Bancorp | 6,917,504 |
| 257,223 | | First Horizon National Corp. | 3,963,806 |
| 207,879 | | JPMorgan Chase & Co. | 14,397,700 |
| 103,098 | | KeyCorp | 1,455,744 |
| 111,300 | | Navient Corp. | 1,422,414 |
| 146,522 | | PNC Financial Services Group, Inc. | 14,007,503 |
| 59,100 | | Popular, Inc. | 2,145,330 |
| 164,308 | | Prudential Financial, Inc. | 13,931,675 |
| 70,776 | | State Street Corp. | 4,969,183 |
| 299,214 | | SunTrust Banks, Inc. | 13,533,449 |
| 25,146 | | Synchrony Financial | 718,924 |
| 125,647 | | The Travelers Cos., Inc. | 13,592,492 |
| | | TOTAL | 146,360,717 |
| | | Health Care—9.8% | |
| 114,162 | | Anthem, Inc. | 13,911,782 |
| 297,869 | | Baxter International, Inc. | 14,175,586 |
| 204,789 | 1 | Community Health Systems, Inc. | 1,081,286 |
| 77,111 | 1 | HCA Holdings, Inc. | 5,901,305 |
| 6,680 | | Johnson & Johnson | 774,813 |
| 12,377 | 1 | Laboratory Corp. of America Holdings | 1,551,333 |
| 412,475 | | Pfizer, Inc. | 13,079,582 |
| 17,948 | | Zimmer Biomet Holdings, Inc. | 1,891,719 |
| | | TOTAL | 52,367,406 |
| | | IT Services—11.0% | |
| 311,750 | | Cisco Systems, Inc. | 9,564,490 |
| 30,700 | | GameStop Corp., Class A | 738,335 |
| 908,590 | | HP, Inc. | 13,165,469 |
| 381,703 | | Intel Corp. | 13,309,984 |
| 42,319 | | International Business Machines Corp. | 6,504,007 |
| 265,295 | | Juniper Networks, Inc. | 6,987,870 |
| 22,816 | 1 | NCR Corp. | 799,701 |
Annual Shareholder Report
| Shares | | | Value in
U.S. Dollars |
| | | COMMON STOCKS—continued | |
| | | IT Services—continued | |
| 148,508 | | NetApp, Inc. | $5,040,361 |
| 210,457 | | Vishay Intertechnology, Inc. | 2,967,444 |
| | | TOTAL | 59,077,661 |
| | | Public Utilities—9.9% | |
| 85,100 | | AES Corp. | 1,001,627 |
| 434,690 | | CenturyLink, Inc. | 11,554,060 |
| 140,634 | | Entergy Corp. | 10,361,913 |
| 127,245 | | FirstEnergy Corp. | 4,363,231 |
| 517,215 | | NiSource, Inc. | 12,030,421 |
| 284,818 | | Verizon Communications, Inc. | 13,699,746 |
| | | TOTAL | 53,010,998 |
| | | Transportation—1.8% | |
| 35,985 | | Copa Holdings SA, Class A | 3,318,897 |
| 55,300 | | Delta Air Lines, Inc. | 2,309,881 |
| 44,552 | 1 | JetBlue Airways Corp. | 778,769 |
| 60,028 | 1 | Spirit Aerosystems Holdings, Inc., Class A | 3,023,010 |
| | | TOTAL | 9,430,557 |
| | | TOTAL COMMON STOCKS
(IDENTIFIED COST $505,805,835) | 525,546,326 |
| | | INVESTMENT COMPANY—2.0% | |
| 10,395,786 | 2 | Federated Institutional Prime Value Obligations Fund, Institutional Shares, 0.45%3
(AT NET ASSET VALUE) | 10,395,786 |
| | | TOTAL INVESTMENTS—100.0%
(IDENTIFIED COST $516,201,621)4 | 535,942,112 |
| | | OTHER ASSETS AND LIABILITIES - NET—0.0%5 | 230,029 |
| | | TOTAL NET ASSETS—100% | $536,172,141 |
| 1 | Non-income-producing security. |
| 2 | Affiliated holding. |
| 3 | 7-day net yield. |
| 4 | The cost of investments for federal tax purposes amounts to $517,661,027. |
| 5 | Assets, other than investments in securities, less liabilities. See Statement of Assets and Liabilities. |
Note: The categories of investments are shown as a percentage of total net assets at October 31, 2016.
Annual Shareholder Report
Various inputs are used in determining the value of the Fund's investments. These inputs are summarized in the three broad levels listed below:
Level 1—quoted prices in active markets for identical securities.
Level 2—other significant observable inputs (including quoted prices for similar securities, interest rates, prepayment speeds, credit risk, etc.). Also includes securities valued at amortized cost.
Level 3—significant unobservable inputs (including the Fund's own assumptions in determining the fair value of investments).
The inputs or methodology used for valuing securities are not an indication of the risk associated with investing in those securities.
As of October 31, 2016, all investments of the Fund utilized Level 1 inputs in valuing the Fund's assets carried at fair value.
See Notes which are an integral part of the Financial Statements.
Annual Shareholder Report
Financial Highlights–Class A Shares
(For a Share Outstanding Throughout each Period)
| | Year Ended
October 31, | Period
Ended
10/31/20141 |
| 2016 | 2015 |
| Net Asset Value, Beginning of Period | $27.84 | $29.89 | $28.47 |
| Income From Investment Operations: | | | |
| Net investment income | 0.422 | 0.37 | 0.13 |
| Net realized and unrealized gain (loss) on investments | 0.16 | (0.00)3 | 1.44 |
| TOTAL FROM INVESTMENT OPERATIONS | 0.58 | 0.37 | 1.57 |
| Less Distributions: | | | |
| Distributions from net investment income | (0.42) | (0.36) | (0.15) |
| Distributions from net realized gain on investments | (1.91) | (2.06) | — |
| TOTAL DISTRIBUTIONS | (2.33) | (2.42) | (0.15) |
| Net Asset Value, End of Period | 26.09 | $27.84 | $29.89 |
| Total Return4 | 2.47% | 1.12% | 5.51% |
| Ratios to Average Net Assets: | | | |
| Net expenses | 0.98% | 0.99% | 0.99%5 |
| Net investment income | 1.65% | 1.28% | 1.04%5 |
| Expense waiver/reimbursement6 | 0.22% | 0.24% | 0.26%5 |
| Supplemental Data: | | | |
| Net assets, end of period (000 omitted) | $14,389 | $12,035 | $3,518 |
| Portfolio turnover | 88% | 77% | 34%7 |
| 1 | Reflects operations for the period from May 1, 2014 (date of initial investment) to October 31, 2014. |
| 2 | Per share number has been calculated using the average shares method. |
| 3 | Represents less than $0.01. |
| 4 | Based on net asset value, which does not reflect the sales charge, redemption fee or contingent deferred sales charge, if applicable. Total returns for periods less than one year are not annualized. |
| 5 | Computed on an annualized basis. |
| 6 | This expense decrease is reflected in both the net expense and net investment income ratios shown above. |
| 7 | Portfolio turnover is calculated at the Fund level. Percentage indicated was calculated for the fiscal year ended October 31, 2014. |
See Notes which are an integral part of the Financial Statements
Annual Shareholder Report
Financial Highlights–Institutional Shares
(For a Share Outstanding Throughout Each Period)
| Year Ended October 31 | 2016 | 2015 | 2014 | 2013 | 2012 |
| Net Asset Value, Beginning of Period | $27.85 | $29.90 | $28.56 | $22.30 | $22.52 |
| Income From Investment Operations: | | | | | |
| Net investment income | 0.481 | 0.42 | 0.37 | 0.411 | 0.26 |
| Net realized and unrealized gain (loss) on investments | 0.15 | (0.00)2 | 4.54 | 7.58 | 2.69 |
| TOTAL FROM INVESTMENT OPERATIONS | 0.63 | 0.42 | 4.91 | 7.99 | 2.95 |
| Less Distributions: | | | | | |
| Distributions from net investment income | (0.47) | (0.41) | (0.34) | (0.41) | (0.30) |
| Distributions from net realized gain on investments | (1.91) | (2.06) | (3.23) | (1.32) | (2.87) |
| TOTAL DISTRIBUTIONS | (2.38) | (2.47) | (3.57) | (1.73) | (3.17) |
| Net Asset Value, End of Period | $26.10 | $27.85 | $29.90 | $28.56 | $22.30 |
| Total Return3 | 2.70% | 1.32% | 18.93% | 38.21% | 14.88% |
| Ratios to Average Net Assets: | | | | | |
| Net expenses | 0.76% | 0.77% | 0.77% | 0.77% | 0.77% |
| Net investment income | 1.87% | 1.50% | 1.26% | 1.62% | 1.28% |
| Expense waiver/reimbursement4 | 0.22% | 0.22% | 0.23% | 0.24% | 0.28% |
| Supplemental Data: | | | | | |
| Net assets, end of period (000 omitted) | $241,699 | $244,104 | $165,122 | $39,056 | $33,523 |
| Portfolio turnover | 88% | 77% | 34% | 77% | 121% |
| 1 | Per share number has been calculated using the average shares method. |
| 2 | Represents less than $0.01. |
| 3 | Based on net asset value. |
| 4 | This expense decrease is reflected in both the net expense and net investment income ratios shown above. |
See Notes which are an integral part of the Financial Statements
Annual Shareholder Report
Financial Highlights–Service Shares
(For a Share Outstanding Throughout Each Period)
| Year Ended October 31 | 2016 | 2015 | 2014 | 2013 | 2012 |
| Net Asset Value, Beginning of Period | $27.85 | $29.90 | $28.56 | $22.31 | $22.53 |
| Income From Investment Operations: | | | | | |
| Net investment income | 0.421 | 0.37 | 0.30 | 0.351 | 0.23 |
| Net realized and unrealized gain (loss) on investments | 0.17 | (0.01) | 4.55 | 7.57 | 2.67 |
| TOTAL FROM INVESTMENT OPERATIONS | 0.59 | 0.36 | 4.85 | 7.92 | 2.90 |
| Less Distributions: | | | | | |
| Distributions from net investment income | (0.42) | (0.35) | (0.28) | (0.35) | (0.25) |
| Distributions from net realized gain on investments | (1.91) | (2.06) | (3.23) | (1.32) | (2.87) |
| TOTAL DISTRIBUTIONS | (2.33) | (2.41) | (3.51) | (1.67) | (3.12) |
| Net Asset Value, End of Period | $26.11 | $27.85 | $29.90 | $28.56 | $22.31 |
| Total Return2 | 2.50% | 1.10% | 18.68% | 37.85% | 14.63% |
| Ratios to Average Net Assets: | | | | | |
| Net expenses | 0.98% | 0.99% | 0.99% | 0.99% | 0.99% |
| Net investment income | 1.66% | 1.28% | 1.06% | 1.39% | 1.08% |
| Expense waiver/reimbursement3 | 0.24% | 0.23% | 0.23% | 0.25% | 0.28% |
| Supplemental Data: | | | | | |
| Net assets, end of period (000 omitted) | $251,246 | $277,253 | $313,714 | $228,665 | $178,109 |
| Portfolio turnover | 88% | 77% | 34% | 77% | 121% |
| 1 | Per share number has been calculated using the average shares method. |
| 2 | Based on net asset value. |
| 3 | This expense decrease is reflected in both the net expense and net investment income ratios shown above. |
See Notes which are an integral part of the Financial Statements
Annual Shareholder Report
Financial Highlights–Class R6 Shares
(For a Share Outstanding Throughout Each Period)
| | Period
Ended
10/31/20161 |
| Net Asset Value, Beginning of Period | $24.51 |
| Income From Investment Operations: | |
| Net investment income | 0.082 |
| Net realized and unrealized gain (loss) on investments | 1.62 |
| TOTAL FROM INVESTMENT OPERATIONS | 1.70 |
| Less Distributions: | |
| Distributions from net investment income | (0.10) |
| Net Asset Value, End of Period | $26.11 |
| Total Return3 | 6.95% |
| Ratios to Average Net Assets: | |
| Net expenses | 0.69%4 |
| Net investment income | 0.85%4 |
| Expense waiver/reimbursement5 | 0.24%4 |
| Supplemental Data: | |
| Net assets, end of period (000 omitted) | $28,838 |
| Portfolio turnover | 88%6 |
| 1 | Reflects operations for the period from June 29, 2016 (date of initial investment) to October 31, 2016. |
| 2 | Per share number has been calculated using the average shares method. |
| 3 | Based on net asset value. Total returns for periods less than one year are not annualized. |
| 4 | Computed on an annualized basis. |
| 5 | This expense decrease is reflected in both the net expense and net investment income ratios shown above. |
| 6 | Portfolio turnover is calculated at the Fund level. Percentage indicated was calculated for the fiscal year ended October 31, 2016. |
See Notes which are an integral part of the Financial Statements
Annual Shareholder Report
Statement of Assets and Liabilities
October 31, 2016
| Assets: | | |
| Total investment in securities, at value including $10,395,786 of investment in an affiliated holding (Note 5) (identified cost $516,201,621) | | $535,942,112 |
| Receivable for investments sold | | 4,539,072 |
| Receivable for shares sold | | 757,857 |
| Income receivable | | 574,342 |
| TOTAL ASSETS | | 541,813,383 |
| Liabilities: | | |
| Payable for investments purchased | $4,349,397 | |
| Payable for shares redeemed | 1,062,961 | |
| Payable for other service fees (Notes 2 and 5) | 57,589 | |
| Payable for investment adviser fee (Note 5) | 9,059 | |
| Payable for administrative fee (Note 5) | 1,149 | |
| Accrued expenses (Note 5) | 161,087 | |
| TOTAL LIABILITIES | | 5,641,242 |
| Net assets for 20,539,823 shares outstanding | | $536,172,141 |
| Net Assets Consists of: | | |
| Paid-in capital | | $496,777,564 |
| Net unrealized appreciation of investments | | 19,740,491 |
| Accumulated net realized gain on investments | | 18,910,584 |
| Undistributed net investment income | | 743,502 |
| TOTAL NET ASSETS | | $536,172,141 |
Annual Shareholder Report
Statement of Assets and Liabilities–continued
| Net Asset Value, Offering Price and Redemption Proceeds Per Share: | | |
| Class A Shares: | | |
| Net asset value per share ($14,388,789 ÷ 551,439 shares outstanding), no par value, unlimited shares authorized | | $26.09 |
| Offering price per share (100/94.50 of $26.09) | | $27.61 |
| Redemption proceeds per share | | $26.09 |
| Institutional Shares: | | |
| Net asset value per share ($241,698,968 ÷ 9,260,607 shares outstanding), no par value, unlimited shares authorized | | $26.10 |
| Offering price per share | | $26.10 |
| Redemption proceeds per share | | $26.10 |
| Service Shares: | | |
| Net asset value per share ($251,246,198 ÷ 9,623,136 shares outstanding), no par value, unlimited shares authorized | | $26.11 |
| Offering price per share | | $26.11 |
| Redemption proceeds per share | | $26.11 |
| Class R6 Shares: | | |
| Net asset value per share ($28,838,186 ÷ 1,104,641 shares outstanding), no par value, unlimited shares authorized | | $26.11 |
| Offering price per share | | $26.11 |
| Redemption proceeds per share | | $26.11 |
See Notes which are an integral part of the Financial Statements
Annual Shareholder Report
Statement of Operations
Year Ended October 31, 2016
| Investment Income: | | | |
| Dividends (including $36,327 received from an affiliated holding (Note 5) and net of foreign taxes withheld of $3,546) | | | $14,374,750 |
| Expenses: | | | |
| Investment adviser fee (Note 5) | | $4,058,051 | |
| Administrative fee (Note 5) | | 426,700 | |
| Custodian fees | | 28,758 | |
| Transfer agent fees (Note 2 and 5) | | 526,283 | |
| Directors'/Trustees' fees (Note 5) | | 12,226 | |
| Auditing fees | | 30,230 | |
| Legal fees | | 7,688 | |
| Other service fees (Notes 2 and 5) | | 622,502 | |
| Portfolio accounting fees | | 118,566 | |
| Share registration costs | | 85,618 | |
| Printing and postage | | 36,505 | |
| Miscellaneous (Note 5) | | 17,877 | |
| TOTAL EXPENSES | | 5,971,004 | |
| Waivers and Reimbursements: | | | |
| Waiver/reimbursement of investment adviser fee (Note 5) | $(1,157,900) | | |
| Waiver/reimbursements of other operating expenses (Notes 2 and 5) | (47,444) | | |
| TOTAL WAIVERS AND REIMBURSEMENTS | | (1,205,344) | |
| Net expenses | | | 4,765,660 |
| Net investment income | | | 9,609,090 |
| Realized and Unrealized Gain (Loss) on Investments: | | | |
| Net realized gain on investments | | | 20,653,036 |
| Net change in unrealized appreciation of investments | | | (15,838,738) |
| Net realized and unrealized gain on investments | | | 4,814,298 |
| Change in net assets resulting from operations | | | $14,423,388 |
See Notes which are an integral part of the Financial Statements
Annual Shareholder Report
Statement of Changes in Net Assets
| Year Ended October 31 | 2016 | 2015 |
| Increase (Decrease) in Net Assets | | |
| Operations: | | |
| Net investment income | $9,609,090 | $6,959,149 |
| Net realized gain on investments | 20,653,036 | 36,888,445 |
| Net change in unrealized appreciation/depreciation of investments | (15,838,738) | (37,135,039) |
| CHANGE IN NET ASSETS RESULTING FROM OPERATIONS | 14,423,388 | 6,712,555 |
| Distributions to Shareholders: | | |
| Distributions from net investment income | | |
| Class A Shares | (244,656) | (105,603) |
| Institutional Shares | (5,008,259) | (2,910,241) |
| Service Shares | (4,210,142) | (3,683,890) |
| Class R6 Shares | (114,949) | — |
| Distributions from net realized gain on investments | | |
| Class A Shares | (965,298) | (283,983) |
| Institutional Shares | (17,712,886) | (11,724,788) |
| Service Shares | (18,860,723) | (21,704,067) |
| CHANGE IN NET ASSETS RESULTING FROM DISTRIBUTIONS TO SHAREHOLDERS | (47,116,913) | (40,412,572) |
| Share Transactions: | | |
| Proceeds from sale of shares | 217,111,588 | 237,664,168 |
| Net asset value of shares issued to shareholders in payment of distributions declared | 43,546,190 | 38,042,729 |
| Cost of shares redeemed | (225,183,992) | (190,969,072) |
| CHANGE IN NET ASSETS RESULTING FROM SHARE TRANSACTIONS | 35,473,786 | 84,737,825 |
| Change in net assets | 2,780,261 | 51,037,808 |
| Net Assets: | | |
| Beginning of period | 533,391,880 | 482,354,072 |
| End of period (including undistributed net investment income of $743,502 and $712,418, respectively) | $536,172,141 | $533,391,880 |
See Notes which are an integral part of the Financial Statements
Annual Shareholder Report
Notes to Financial Statements
October 31, 2016
1. ORGANIZATION
Federated MDT Stock Trust (the “Fund”) is registered under the Investment Company Act of 1940, as amended (the “Act”), as a diversified, open-end management investment company. The Fund offers four classes of shares: Class A Shares, Institutional Shares, Service Shares, and Class R6 Shares. All shares of the Fund have equal rights with respect to voting, except on class-specific matters. The investment objective of the Fund is to provide growth of income and capital.
Effective June 29, 2016 the Fund began offering Class R6 Shares.
2. SIGNIFICANT ACCOUNTING POLICIES
The following is a summary of significant accounting policies consistently followed by the Fund in the preparation of its financial statements. These policies are in conformity with U.S. generally accepted accounting principles (GAAP).
Investment Valuation
In calculating its net asset value (NAV), the Fund generally values investments as follows:
| ■ | Equity securities listed on an exchange or traded through a regulated market system are valued at their last reported sale price or official closing price in their principal exchange or market. |
| ■ | Fixed-income securities are fair valued using price evaluations provided by a pricing service approved by the Fund's Board of Trustees (the “Trustees”). |
| ■ | Shares of other mutual funds or non-exchange-traded investment companies are valued based upon their reported NAVs. |
| ■ | Derivative contracts listed on exchanges are valued at their reported settlement or closing price, except that options are valued at the mean of closing bid and asked quotations. |
| ■ | Over-the-counter (OTC) derivative contracts are fair valued using price evaluations provided by a pricing service approved by the Trustees. |
| ■ | For securities that are fair valued in accordance with procedures established by and under the general supervision of the Trustees, certain factors may be considered such as: the last traded or purchase price of the security, information obtained by contacting the issuer or dealers, analysis of the issuer's financial statements or other available documents, fundamental analytical data, the nature and duration of restrictions on disposition, the movement of the market in which the security is normally traded, public trading in similar securities or derivative contracts of the issuer or comparable issuers, movement of a relevant index, or other factors including but not limited to industry changes and relevant government actions. |
If any price, quotation, price evaluation or other pricing source is not readily available when the NAV is calculated, or if the Fund cannot obtain price evaluations from a pricing service or from more than one dealer for an investment within a reasonable period of time as set forth in the Fund's valuation policies and procedures, the Fund uses the fair value of the investment determined in accordance with the procedures described below. There can be no assurance that the Fund could obtain the fair value assigned to an investment if it sold the investment at approximately the time at which the Fund determines its NAV per share.
Annual Shareholder Report
Fair Valuation and Significant Events Procedures
The Trustees have ultimate responsibility for determining the fair value of investments for which market quotations are not readily available. The Trustees have appointed a valuation committee (“Valuation Committee”) comprised of officers of the Fund, Federated MDTA LLC (“Adviser”) and certain of the Adviser's affiliated companies to assist in determining fair value and in overseeing the calculation of the NAV. The Trustees have also authorized the use of pricing services recommended by the Valuation Committee to provide fair value evaluations of the current value of certain investments for purposes of calculating the NAV. The Valuation Committee employs various methods for reviewing third-party pricing-service evaluations including periodic reviews of third-party pricing services' policies, procedures and valuation methods (including key inputs, methods, models and assumptions), transactional back-testing, comparisons of evaluations of different pricing services and review of price challenges by the Adviser based on recent market activity. In the event that market quotations and price evaluations are not available for an investment, the Valuation Committee determines the fair value of the investment in accordance with procedures adopted by the Trustees. The Trustees periodically review and approve the fair valuations made by the Valuation Committee and any changes made to the procedures.
Factors considered by pricing services in evaluating an investment include the yields or prices of investments of comparable quality, coupon, maturity, call rights and other potential prepayments, terms and type, reported transactions, indications as to values from dealers and general market conditions. Some pricing services provide a single price evaluation reflecting the bid-side of the market for an investment (a “bid” evaluation). Other pricing services offer both bid evaluations and price evaluations indicative of a price between the prices bid and asked for the investment (a “mid” evaluation). The Fund normally uses bid evaluations for any U.S. Treasury and Agency securities, mortgage-backed securities and municipal securities. The Fund normally uses mid evaluations for any other types of fixed-income securities and any OTC derivative contracts. In the event that market quotations and price evaluations are not available for an investment, the fair value of the investment is determined in accordance with procedures adopted by the Trustees.
The Trustees also have adopted procedures requiring an investment to be priced at its fair value whenever the Adviser determines that a significant event affecting the value of the investment has occurred between the time as of which the price of the investment would otherwise be determined and the time as of which the NAV is computed. An event is considered significant if there is both an affirmative expectation that the investment's value will change in response to the event and a reasonable basis for quantifying the resulting change in value. Examples of significant events that may occur after the close of the principal market on which a security is traded, or after the time of a price evaluation provided by a pricing service or a dealer, include:
| ■ | With respect to securities traded principally in foreign markets, significant trends in U.S. equity markets or in the trading of foreign securities index futures contracts; |
| ■ | Political or other developments affecting the economy or markets in which an issuer conducts its operations or its securities are traded; |
| ■ | Announcements concerning matters such as acquisitions, recapitalizations, litigation developments, or a natural disaster affecting the issuer's operations or regulatory changes or market developments affecting the issuer's industry. |
The Trustees have adopted procedures whereby the Valuation Committee uses a pricing service to determine the fair value of equity securities traded principally in foreign markets when the Adviser determines that there has been a significant trend in the U.S. equity markets or in index futures trading. For other significant events, the Fund may seek to obtain more
Annual Shareholder Report
current quotations or price evaluations from alternative pricing sources. If a reliable alternative pricing source is not available, the Fund will determine the fair value of the investment in accordance with the fair valuation procedures approved by the Trustees. The Trustees have ultimate responsibility for any fair valuations made in response to a significant event.
Repurchase Agreements
The Fund may invest in repurchase agreements for short-term liquidity purposes. It is the policy of the Fund to require the other party to a repurchase agreement to transfer to the Fund's custodian or sub-custodian eligible securities or cash with a market value (after transaction costs) at least equal to the repurchase price to be paid under the repurchase agreement. The eligible securities are transferred to accounts with the custodian or sub-custodian in which the Fund holds a “securities entitlement” and exercises “control” as those terms are defined in the Uniform Commercial Code. The Fund has established procedures for monitoring the market value of the transferred securities and requiring the transfer of additional eligible securities if necessary to equal at least the repurchase price. These procedures also allow the other party to require securities to be transferred from the account to the extent that their market value exceeds the repurchase price or in exchange for other eligible securities of equivalent market value.
The insolvency of the other party or other failure to repurchase the securities may delay the disposition of the underlying securities or cause the Fund to receive less than the full repurchase price. Under the terms of the repurchase agreement, any amounts received by the Fund in excess of the repurchase price and related transaction costs must be remitted to the other party.
The Fund may enter into repurchase agreements in which eligible securities are transferred into joint trading accounts maintained by the custodian or sub-custodian for investment companies and other clients advised by the Adviser and its affiliates. The Fund will participate on a pro rata basis with the other investment companies and clients in its share of the securities transferred under such repurchase agreements and in its share of proceeds from any repurchase or other disposition of such securities.
Investment Income, Gains and Losses, Expenses and Distributions
Investment transactions are accounted for on a trade-date basis. Realized gains and losses from investment transactions are recorded on an identified-cost basis. Interest income and expenses are accrued daily. Dividend income and distributions to shareholders are recorded on the ex-dividend date. Distributions of net investment income are declared and paid quarterly. Non-cash dividends included in dividend income, if any, are recorded at fair value. Amortization/accretion of premium and discount is included in investment income. Investment income, realized and unrealized gains and losses, and certain fund-level expenses are allocated to each class based on relative average daily net assets, except that Class A, Service Shares and Class R6 Shares may bear other service fees unique to that class. The detail of the total fund expense waivers and reimbursements of $1,205,344 is disclosed in various locations in this Note 2 and Note 5.
For the year ended October 31, 2016, an unaffiliated third-party waived $9,878 of portfolio accounting fees.
Dividends are declared separately for each class. No class has preferential dividend rights; differences in per share dividend rates are generally due to differences in separate class expenses.
Annual Shareholder Report
For the year ended October 31, 2016, transfer agent fees for the Fund were as follows:
| | Transfer
Agent Fees
Incurred | Transfer
Agent Fees
Reimbursed |
| Class A Shares | $15,304 | $(1,764) |
| Institutional Shares | 267,861 | (8,949) |
| Service Shares | 241,983 | (7,561) |
| Class R6 Shares | 1,135 | — |
| TOTAL | $526,283 | $(18,274) |
Other Service Fees
The Fund may pay other service fees up to 0.25% of the average daily net assets of the Fund's Class A Shares and Service Shares to unaffiliated financial intermediaries or to Federated Shareholder Services Company (FSSC) for providing services to shareholders and maintaining shareholder accounts. Financial intermediaries may include a company affiliated with management of Federated Investors, Inc. Subject to the terms described in the Expense Limitation note, FSSC may voluntarily reimburse the Fund for other service fees. For the year ended October 31, 2016, other service fees for the Fund were as follows:
| | Other
Service Fees
Incurred | Other
Service Fees
Reimbursed |
| Class A Shares | $35,209 | $(1,639) |
| Service Shares | 587,293 | (17,653) |
| TOTAL | $622,502 | $(19,292) |
Federal Taxes
It is the Fund's policy to comply with the Subchapter M provision of the Internal Revenue Code and to distribute to shareholders each year substantially all of its income. Accordingly, no provision for federal income tax is necessary. As of and during the year ended October 31, 2016, the Fund did not have a liability for any uncertain tax positions. The Fund recognizes interest and penalties, if any, related to tax liabilities as income tax expense in the Statement of Operations. As of October 31, 2016, tax years 2013 through 2016 remain subject to examination by the Fund's major tax jurisdictions, which include the United States of America and the Commonwealth of Massachusetts.
The Fund may be subject to taxes imposed by governments of countries in which it invests. Such taxes are generally based on either income or gains earned or repatriated. The Fund accrues and applies such taxes to net investment income, net realized gains and net unrealized gains as income and/or gains are earned.
When-Issued and Delayed-Delivery Transactions
The Fund may engage in when-issued or delayed-delivery transactions. The Fund records when-issued securities on the trade date and maintains security positions such that sufficient liquid assets will be available to make payment for the securities purchased. Securities purchased on a when-issued or delayed-delivery basis are marked to market daily and begin earning interest on the settlement date. Losses may occur on these transactions due to changes in market conditions or the failure of counterparties to perform under the contract.
Annual Shareholder Report
Other
The preparation of financial statements in conformity with GAAP requires management to make estimates and assumptions that affect the amounts of assets, liabilities, expenses and revenues reported in the financial statements. Actual results could differ from those estimated. The Fund applies Investment Company accounting and reporting guidance.
3. SHARES OF BENEFICIAL INTEREST
The following tables summarize share activity:
| Year Ended October 31 | 2016 | 2015 |
| Class A Shares: | Shares | Amount | Shares | Amount | |
| Shares sold | 368,832 | $9,309,626 | 346,618 | $9,875,039 | |
| Shares issued to shareholders in payment of distributions declared | 46,543 | 1,177,151 | 13,615 | 387,445 | |
| Shares redeemed | (296,216) | (7,515,289) | (45,665) | (1,282,362) | |
| NET CHANGE RESULTING FROM CLASS A SHARE TRANSACTIONS | 119,159 | $2,971,488 | 314,568 | $8,980,122 | |
| Year Ended October 31 | 2016 | 2015 |
| Institutional Shares: | Shares | Amount | Shares | Amount |
| Shares sold | 5,504,847 | $139,418,086 | 5,701,572 | $161,062,475 |
| Shares issued to shareholders in payment of distributions declared | 832,575 | 21,066,508 | 493,460 | 14,085,094 |
| Shares redeemed | (5,842,142) | (148,392,726) | (2,952,810) | (84,664,781) |
| NET CHANGE RESULTING FROM INSTITUTIONAL SHARE TRANSACTIONS | 495,280 | $12,091,868 | 3,242,222 | $90,482,788 |
| Year Ended October 31 | 2016 | 2015 |
| Service Shares: | Shares | Amount | Shares | Amount |
| Shares sold | 1,557,487 | $39,193,321 | 2,339,816 | $66,726,654 |
| Shares issued to shareholders in payment of distributions declared | 836,858 | 21,187,582 | 824,507 | 23,570,190 |
| Shares redeemed | (2,724,822) | (68,672,704) | (3,702,373) | (105,021,929) |
| NET CHANGE RESULTING FROM SERVICE SHARE TRANSACTIONS | (330,477) | $(8,291,801) | (538,050) | $(14,725,085) |
Annual Shareholder Report
| | Period Ended
10/31/20161 | Year Ended
10/31/2015 |
| Class R6 Shares: | Shares | Amount | Shares | Amount |
| Shares sold | 1,123,117 | $29,190,555 | — | $— |
| Shares issued to shareholders in payment of distributions declared | 4,426 | 114,949 | — | — |
| Shares redeemed | (22,902) | (603,273) | — | — |
| NET CHANGE RESULTING FROM CLASS R6 SHARE TRANSACTIONS | 1,104,641 | $28,702,231 | — | $— |
| NET CHANGE RESULTING FROM TOTAL FUND SHARE TRANSACTIONS | 1,388,603 | $35,473,786 | 3,018,740 | $84,737,825 |
| 1 | Reflects operations for the period from June 29, 2016 (date of initial investment) to October 31, 2016. |
4. FEDERAL TAX INFORMATION
The tax character of distributions as reported on the Statement of Changes in Net Assets for the years ended October 31, 2016 and 2015, was as follows:
| | 2016 | 2015 |
| Ordinary income1 | $19,542,508 | $16,733,001 |
| Long-term capital gains | $27,574,405 | $23,679,571 |
| 1 | For tax purposes, short-term capital gain distributions are considered ordinary income distributions. |
| | |
As of October 31, 2016, the components of distributable earnings on a tax basis were as follows:
| Undistributed ordinary income2 | $9,204,424 |
| Undistributed long-term capital gains | $11,909,068 |
| Net unrealized appreciation | $18,281,085 |
| 2 | For tax purposes, short-term capital gains are considered ordinary income in determining distributable earnings. |
| | |
The difference between book-basis and tax-basis net unrealized appreciation/depreciation is attributable to differing treatments for the deferral of losses on wash sales.
At October 31, 2016, the cost of investments for federal tax purposes was $517,661,027. The net unrealized appreciation of investments for federal tax purposes was $18,281,085. This consists of net unrealized appreciation from investments for those securities having an excess of value over cost of $53,776,372 and net unrealized depreciation from investments for those securities having an excess of cost over value of $35,495,287.
5. INVESTMENT ADVISER FEE AND OTHER TRANSACTIONS WITH AFFILIATES
Investment Adviser Fee
The advisory agreement between the Fund and the Adviser provides for an annual fee equal to 0.750% on the first $500 million in average daily net assets, 0.675% of the second $500 million in average daily net assets, 0.600% of the third $500 million in average daily net assets, 0.525% of the fourth $500 million in average daily net assets and 0.400% of average daily net assets in excess of $2 billion. Under the investment advisory contract, which is subject to annual review by the Fund's Trustees, the Adviser will waive or reimburse the Fund the amount, limited to the
Annual Shareholder Report
amount of the advisory fee, by which the Fund's aggregate annual operating expenses, including the investment advisory fee but excluding interest, taxes, brokerage commissions, expenses of registering and qualifying the Fund and its Shares under Federal and state laws, expenses of withholding taxes and extraordinary expenses, exceed 1.00% of its average daily net assets. Subject to the terms described in the Expense Limitation note, the Adviser may also voluntarily choose to waive any portion of its fee. For the year ended October 31, 2016, the Adviser waived $1,146,189 of its fee and reimbursed $18,274 of transfer agent fees.
Administrative Fee
Federated Administrative Services (FAS), under the Administrative Services Agreement, provides the Fund with administrative personnel and services. For purposes of determining the appropriate rate breakpoint, “Investment Complex” is defined as all of the Federated Funds subject to a fee under the Administrative Services Agreement. The fee paid to FAS is based on the average daily net assets of the Investment Complex as specified below, plus certain out-of-pocket expenses:
| Administrative Fee | Average Daily Net Assets
of the Investment Complex |
| 0.150% | on the first $5 billion |
| 0.125% | on the next $5 billion |
| 0.100% | on the next $10 billion |
| 0.075% | on assets in excess of $20 billion |
Subject to the terms described in the Expense Limitation note, FAS may voluntarily choose to waive any portion of its fee. For the year ended October 31, 2016, the annualized fee paid to FAS was 0.078% of average daily net assets of the Fund.
Distribution Services Fee
The Fund has adopted a Distribution Plan (the “Plan”) pursuant to Rule 12b-1 under the Act. Under the terms of the Plan, the Fund will compensate Federated Securities Corp. (FSC), the principal distributor, from the daily net assets of the Fund's Class A Shares to finance activities intended to result in the sale of these shares. The Plan provides that the Fund may incur distribution expenses at 0.05% of average daily net assets annually, to compensate FSC. Subject to the terms described in the Expense Limitation note, FSC may voluntarily choose to waive any portion of its fee. When FSC receives fees, it may pay some or all of them to financial intermediaries whose customers purchase shares. For the year ended October 31, 2016, the Fund's Class A Shares did not incur a distribution services fee; however, it may begin to incur this fee upon approval of the Trustees.
Other Services Fees
For the year ended October 31, 2016, FSSC received $30,919 and reimbursed $19,292 of the other service fees disclosed in Note 2.
Sales Charges
Front-end sales charges do not represent expenses of the Fund. They are deducted from the proceeds of sales of the Fund shares prior to investment. For the year ended October 31, 2016, FSC retained $5,626 in sales charges from the sale of Class A shares.
Expense Limitation
The Adviser and certain of its affiliates (which may include FSC, FAS and FSSC) on their own initiative have agreed to waive certain amounts of their respective fees and/or reimburse expenses. Total annual fund operating expenses (as shown in the financial highlights, excluding extraordinary expenses, expenses allocated from affiliated partnerships and proxy
Annual Shareholder Report
related expenses paid by the Fund, if any) paid by the Fund's Class A Shares, Institutional Shares, Service Shares and Class R6 Shares (after the voluntary waivers and reimbursements) will not exceed 0.98%, 0.76%, 0.98% and 0.69% (the “Fee Limit”), respectively, up to but not including the later of (the “Termination Date”): (a) January 1, 2017; or (b) the date of the Fund's next effective Prospectus. While the Adviser and its applicable affiliates currently do not anticipate terminating or increasing these arrangements prior to the Termination Date, these arrangements may only be terminated or the Fee Limit increased prior to the Termination Date with the agreement of the Trustees.
General
Certain Officers and Trustees of the Fund are Officers and Directors or Trustees of certain of the above companies. To efficiently facilitate payment, Directors'/Trustees' fees and certain expenses related to conducting meetings of the Directors/Trustees and other miscellaneous expenses are paid by an affiliate of the Adviser which in due course are reimbursed by the Fund. Such expenses may be included in Accrued and Miscellaneous Expenses on the Statement of Assets and Liabilities and Statement of Operations, respectively.
Transactions Involving Affiliated Holdings
Affiliated holdings are investment companies which are managed by the Adviser or an affiliate of the Adviser. The Adviser has agreed to reimburse the Fund for certain investment adviser fees as a result of transactions in other affiliated investment companies. For the year ended October 31, 2016, the Adviser reimbursed the Fund $11,711. Transactions with the affiliated holding during the year ended October 31, 2016, were as follows:
| | Federated
Institutional
Prime Value
Obligations Fund,
Institutional Shares |
| Balance of Shares Held 10/31/2015 | 11,320,712 |
| Purchases/Additions | 158,393,815 |
| Sales/Reductions | (159,318,741) |
| Balance of Shares Held 10/31/2016 | 10,395,786 |
| Value | $10,395,786 |
| Dividend Income | $36,327 |
6. Investment TRANSACTIONS
Purchases and sales of investments, excluding long-term U.S. government securities and short-term obligations, for the year ended October 31, 2016, were as follows:
| Purchases | $471,316,972 |
| Sales | $472,271,996 |
7. LINE OF CREDIT
The Fund participates with certain other Federated Funds, on a several basis, in an up to $500,000,000 unsecured, 364-day, committed, revolving line of credit (LOC) agreement. The LOC was made available to finance temporarily the repurchase or redemption of shares of the Fund, failed trades, payment of dividends, settlement of trades and for other short-term, temporary or emergency general business purposes. The Fund cannot borrow under the LOC if an inter-fund loan is outstanding. The Fund's ability to borrow under the LOC also is subject
Annual Shareholder Report
to the limitations of the Act and various conditions precedent that must be satisfied before the Fund can borrow. Loans under the LOC are charged interest at a fluctuating rate per annum equal to the highest, on any day, of (a) (i) the federal funds effective rate, (ii) the one month London Interbank Offer Rate (LIBOR), and (iii) 0.0%, plus (b) a margin. The LOC also requires the Fund to pay, quarterly in arrears and at maturity, its pro rata share of a commitment fee based on the amount of the lenders' commitment that has not been utilized. As of October 31, 2016, the Fund had no outstanding loans. During the year ended October 31, 2016, the Fund did not utilize the LOC.
8. INTERFUND LENDING
Pursuant to an Exemptive Order issued by the Securities and Exchange Commission, the Fund, along with other funds advised by subsidiaries of Federated Investors, Inc., may participate in an interfund lending program. This program provides an alternative credit facility allowing the Fund to borrow from other participating affiliated funds. As of October 31, 2016, there were no outstanding loans. During the year ended October 31, 2016, the program was not utilized.
9. Regulatory matters
On October 13, 2016, the SEC amended existing rules intended to modernize reporting and disclosure of information. These amendments relate to Regulation S-X which sets forth the form and content of financial statements. At this time, management is evaluating the implications of adopting these amendments and their impact on the financial statements and accompanying notes.
10. FEDERAL TAX INFORMATION (UNAUDITED)
For the fiscal year ended October 31, 2016, 72.07% of total ordinary income distributions made by the Fund are qualifying dividends which may be subject to a maximum rate of 15%, as provided for by the Jobs and Growth Tax Relief Act of 2003. Complete information is reported in conjunction with the reporting of your distributions on Form 1099-DIV. Of the ordinary income (including short-term capital gain) distributions made by the Fund during the year ended October 31, 2016, 69.31% qualify for the dividend received deduction available to corporate shareholders.
For the year ended October 31, 2016, the amount of long-term capital gains designated by the Fund was $27,574,405.
10. Subsequent event
Effective January 17, 2017, the Fund will change its name to Federated MDT Large Cap Value Fund.
The Fund has entered into an Agreement and Plan of Reorganization (the “Plan”) providing for the transfer of all or substantially all of the assets of the Hancock Horizon Value Fund (the “Hancock Fund”) based upon the terms and conditions set forth in the Plan. The Agreement is subject to the approval of the Hancock Fund shareholders at a special meeting of shareholders, currently scheduled for January 26, 2017. If the Plan is approved by the shareholders of the Hancock Fund, the “Termination Date” of the voluntary waiver and/or reimbursement of expenses described in the Expense Limitation note shall be changed to the later of: (a) February 1, 2018; or (b) the date of the Fund's next effective prospectus.
Annual Shareholder Report
Report of Independent Registered Public Accounting Firm
TO THE BOARD OF TRUSTEES ANd SHAREHOLDERS OF Federated MDT Stock Trust:
We have audited the accompanying statement of assets and liabilities, including the portfolio of investments, of Federated MDT Stock Trust (the “Fund”), as of October 31, 2016, and the related statement of operations for the year then ended, the statements of changes in net assets for each of the years in the two-year period then ended, and the financial highlights for each of the years or periods in the five-year period then ended. These financial statements and financial highlights are the responsibility of the Fund's management. Our responsibility is to express an opinion on these financial statements and financial highlights based on our audits.
We conducted our audits in accordance with the standards of the Public Company Accounting Oversight Board (United States). Those standards require that we plan and perform the audit to obtain reasonable assurance about whether the financial statements and financial highlights are free of material misstatement. An audit includes examining, on a test basis, evidence supporting the amounts and disclosures in the financial statements. Our procedures included confirmation of securities owned as of October 31, 2016, by correspondence with the custodian, transfer agent, and brokers or by other appropriate auditing procedures. An audit also includes assessing the accounting principles used and significant estimates made by management, as well as evaluating the overall financial statement presentation. We believe that our audits provide a reasonable basis for our opinion.
In our opinion, the financial statements and financial highlights referred to above present fairly, in all material respects, the financial position of the Federated MDT Stock Trust as of October 31, 2016, and the results of its operations for the year then ended, the changes in its net assets for each of the years in the two-year period then ended, and the financial highlights for each of the years or periods in the five-year period then ended, in conformity with U.S. generally accepted accounting principles.
Boston, Massachusetts
December 23, 2016
Annual Shareholder Report
Shareholder Expense Example (unaudited)
As a shareholder of the Fund, you incur ongoing costs, including management fees; and to the extent applicable, distribution (12b-1) fees and/or other service fees and other Fund expenses. This Example is intended to help you to understand your ongoing costs (in dollars) of investing in the Fund and to compare these costs with the ongoing costs of investing in other mutual funds. It is based on an investment of $1,000 invested at the beginning of the period and held for the entire period from May 1, 2016 to October 31, 2016.
ACTUAL EXPENSES
The first section of the table below provides information about actual account values and actual expenses. You may use the information in this section, together with the amount you invested, to estimate the expenses that you incurred over the period. Simply divide your account value by $1,000 (for example, an $8,600 account value divided by $1,000 = 8.6), then multiply the result by the number in the first section under the heading entitled “Expenses Paid During Period” to estimate the expenses attributable to your investment during this period.
HYPOTHETICAL EXAMPLE FOR COMPARISON PURPOSES
The second section of the table below provides information about hypothetical account values and hypothetical expenses based on the Fund's actual expense ratio and an assumed rate of return of 5% per year before expenses, which is not the Fund's actual return. Thus, you should not use the hypothetical account values and expenses to estimate the actual ending account balance or your expenses for the period. Rather, these figures are required to be provided to enable you to compare the ongoing costs of investing in the Fund with other funds. To do so, compare this 5% hypothetical example with the 5% hypothetical examples that appear in the shareholder reports of the other funds.
Annual Shareholder Report
Please note that the expenses shown in the table are meant to highlight your ongoing costs only. Therefore, the second section of the table is useful in comparing ongoing costs only, and will not help you determine the relative total costs of owning different funds.
| | Beginning
Account Value
5/1/2016 | Ending
Account Value
10/31/2016 | Expenses Paid
During Period1 |
| Actual: | | | |
| Class A Shares | $1,000 | $1,022.30 | $4.98 |
| Institutional Shares | $1,000 | $1,023.60 | $3.87 |
| Service Shares | $1,000 | $1,022.40 | $4.98 |
| Class R6 | $1,000 | $1,069.50 | $2.44 |
Hypothetical (assuming a 5% return
before expenses): | | | |
| Class A Shares | $1,000 | $1,020.21 | $4.98 |
| Institutional Shares | $1,000 | $1,021.32 | $3.86 |
| Service Shares | $1,000 | $1,020.21 | $4.98 |
| Class R6 Shares | $1,000 | $1,021.67 | $3.51 |
| 1 | “Actual” expense information for the Fund's Class R6 Shares is for the period from June 29, 2016 (date of initial investment) to October 31, 2016 and is equal to the Fund's annualized net expense ratio, multiplied by the average account value over the period, multiplied by 125/366 (to reflect the period from initial investment to October 31, 2016). “Actual” expense information for the Fund's Class A Shares, Institutional Shares and Service Shares is equal to the Fund's annualized net expense ratios, multiplied by the average account value over the period, multiplied by 184/366 (to reflect the one-half-year period). “Hypothetical” expense information for Class A Shares, Institutional Shares, Service Shares and Class R6 Shares is presented on the basis of the full one-half-year period to enable comparison to other funds. It is based on assuming the same net expense ratio and average account value over the period, but it is multiplied by 184/366 (to reflect the one-half-year period). The annualized net expense ratios are as follows: |
| | |
| Class A Shares | 0.98% |
| Institutional Shares | 0.76% |
| Service Shares | 0.98% |
| Class R6 Shares | 0.69% |
Annual Shareholder Report
Board of Trustees and Fund Officers
The Board of Trustees is responsible for managing the Fund's business affairs and for exercising all the Fund's powers except those reserved for the shareholders. The following tables give information about each Trustee and the senior officers of the Fund. Where required, the tables separately list Trustees who are “interested persons” of the Fund (i.e., “Interested” Trustees) and those who are not (i.e., “Independent” Trustees). Unless otherwise noted, the address of each person listed is Federated Investors Tower, 1001 Liberty Avenue, Pittsburgh, PA 15222. The address of all Independent Trustees listed is 4000 Ericsson Drive, Warrendale, PA 15086-7561; Attention: Mutual Fund Board. As of December 31, 2015, the Fund comprised one portfolio(s), and the Federated Fund Family consisted of 38 investment companies (comprising 122 portfolios). Unless otherwise noted, each Officer is elected annually. Unless otherwise noted, each Trustee oversees all portfolios in the Federated Fund Family and serves for an indefinite term. The Fund's Statement of Additional Information includes additional information about Fund Trustees and is available, without charge and upon request, by calling 1-800-341-7400.
Interested TRUSTEES Background
Name
Birth Date
Positions Held with Fund
Date Service Began | Principal Occupation(s) for Past Five Years,
Other Directorships Held and Previous Position(s) |
J. Christopher Donahue*
Birth Date: April 11, 1949
President and Trustee
Indefinite Term
Began serving: November 1999 | Principal Occupations: Principal Executive Officer and President of certain of the Funds in the Federated Fund Family; Director or Trustee of the Funds in the Federated Fund Family; President, Chief Executive Officer and Director, Federated Investors, Inc.; Chairman and Trustee, Federated Investment Management Company; Trustee, Federated Investment Counseling; Chairman and Director, Federated Global Investment Management Corp.; Chairman, Federated Equity Management Company of Pennsylvania and Passport Research, Ltd. (investment advisory subsidiary of Federated); Trustee, Federated Shareholder Services Company; Director, Federated Services Company.
Previous Positions: President, Federated Investment Counseling; President and Chief Executive Officer, Federated Investment Management Company, Federated Global Investment Management Corp. and Passport Research, Ltd. |
Annual Shareholder Report
Name
Birth Date
Positions Held with Fund
Date Service Began | Principal Occupation(s) for Past Five Years,
Other Directorships Held and Previous Position(s) |
Thomas R. Donahue*
Birth Date: October 20, 1958
Trustee
Indefinite Term
Began serving: May 2016 | Principal Occupations: Director or Trustee of certain of the funds in the Federated Fund Family; Chief Financial Officer, Treasurer, Vice President and Assistant Secretary, Federated Investors, Inc.; Chairman and Trustee, Federated Administrative Services; Chairman and Director, Federated Administrative Services, Inc.; Trustee and Treasurer, Federated Advisory Services Company; Director or Trustee and Treasurer, Federated Equity Management Company of Pennsylvania, Federated Global Investment Management Corp., Federated Investment Counseling, and Federated Investment Management Company; Director, MDTA LLC; Treasurer, Passport Research, LTD; Director, Executive Vice President and Assistant Secretary, Federated Securities Corp.; Director or Trustee and Chairman, Federated Services Company and Federated Shareholder Services Company; and Director and President, FII Holdings, Inc.
Previous Positions: Director, Federated Investors, Inc.; Assistant Secretary, Federated Investment Management Company, Federated Global Investment Management Company and Passport Research, LTD; Executive Vice President, Federated Securities Corp.; and Treasurer, FII Holdings, Inc. |
| * | Family relationships and reasons for “interested” status: J. Christopher Donahue and Thomas R. Donahue are brothers. Both are “interested” due to their beneficial ownership of shares of Federated Investors, Inc. and the positions they hold with Federated and its subsidiaries. Thomas R. Donahue and J. Christopher Donahue are sons of John F. Donahue, Chairman Emeritus of the Federated Funds. |
INDEPENDENT TRUSTEES Background
Name
Birth Date
Positions Held with Fund
Date Service Began | Principal Occupation(s) for Past Five Years,
Other Directorships Held, Previous Position(s) and Qualifications |
John T. Collins
Birth Date: January 24, 1947
Trustee
Indefinite Term
Began serving: October 2013 | Principal Occupations: Director or Trustee of the Federated Fund Family; Retired.
Other Directorships Held: Director, Chair of the Compensation Committee, Audit Committee member, KLX Corp.
Qualifications: Mr. Collins has served in several business and financial management roles and directorship positions throughout his career. Mr. Collins previously served as Chairman and CEO, The Collins Group, Inc. (a private equity firm). Mr. Collins serves as Chairman Emeriti, Bentley University. Mr. Collins previously served as Director, FleetBoston Financial Corp.; Director and Audit Committee Member, Bank of America Corp. and Director, Beth Israel Deaconess Medical Center (Harvard University Affiliate Hospital). |
Annual Shareholder Report
Name
Birth Date
Positions Held with Fund
Date Service Began | Principal Occupation(s) for Past Five Years,
Other Directorships Held, Previous Position(s) and Qualifications |
G. Thomas Hough
Birth Date: February 28, 1955
Trustee
Indefinite Term
Began serving: August 2015 | Principal Occupations: Director or Trustee of the Federated Fund Family; Retired.
Other Directorships Held: Director, Chair of the Audit Committee, Governance Committee, Publix Super Markets, Inc.; Director, Equifax, Inc.
Qualifications: Mr. Hough has served in accounting, business management and directorship positions throughout his career. Mr. Hough most recently held the position of Americas Vice Chair of Assurance with Ernst & Young LLP. Mr. Hough is an Executive Committee member of the United States Golf Association, he serves on the President's Cabinet and Business School Board of Visitors for the University of Alabama and is on the Business School Board of Visitors for Wake Forest University. |
Maureen Lally-Green
Birth Date: July 5, 1949
Trustee
Indefinite Term
Began serving: August 2009 | Principal Occupations: Director or Trustee of the Federated Fund Family; Interim Dean of the Duquesne University School of Law; Adjunct Professor of Law, Duquesne University School of Law.
Other Directorships Held: Director, CONSOL Energy Inc.
Qualifications: Judge Lally-Green has served in various legal and business roles and directorship positions throughout her career. Judge Lally-Green previously served as: Associate General Secretary, Diocese of Pittsburgh; a member of the Superior Court of Pennsylvania; and as a Professor of Law, Duquesne University School of Law. Judge Lally-Green also holds the positions on either a public or not for profit Board of Directors as follows: Member, Pennsylvania State Board of Education (public); Director and Chair, UPMC Mercy Hospital; Regent, St. Vincent Seminary; Director and Vice Chair, Our Campaign for the Church Alive!, Inc.; Director, Saint Vincent College; and Director and Chair, Cardinal Wuerl North Catholic High School, Inc. Judge Lally-Green has held the positions of: Director, Auberle; Director, Ireland Institute of Pittsburgh; Director, Saint Thomas More Society; and Director, Catholic High Schools of the Diocese of Pittsburgh, Inc. |
Peter E. Madden
Birth Date: March 16, 1942
Trustee
Indefinite Term
Began serving: November 1991 | Principal Occupation: Director or Trustee, and Chair of the Board of Directors or Trustees, of the Federated Fund Family; Retired.
Other Directorships Held: None.
Qualifications: Mr. Madden has served in several business management, mutual fund services and directorship positions throughout his career. Mr. Madden previously served as President, Chief Operating Officer and Director, State Street Bank and Trust Company (custodian bank) and State Street Corporation (financial services). He was Director, VISA USA and VISA International and Chairman and Director, Massachusetts Bankers Association. Mr. Madden served as Director, Depository Trust Corporation and Director, The Boston Stock Exchange. Mr. Madden also served as a Representative to the Commonwealth of Massachusetts General Court. |
Annual Shareholder Report
Name
Birth Date
Positions Held with Fund
Date Service Began | Principal Occupation(s) for Past Five Years,
Other Directorships Held, Previous Position(s) and Qualifications |
Charles F. Mansfield, Jr.
Birth Date: April 10, 1945
Trustee
Indefinite Term
Began serving: November 1999 | Principal Occupations: Director or Trustee of the Federated Fund Family; Management Consultant.
Other Directorships Held: None.
Qualifications: Mr. Mansfield has served in several banking, business management and educational roles and directorship positions throughout his career. Mr. Mansfield previously served as Chief Executive Officer, PBTC International Bank; Partner, Arthur Young & Company (now Ernst & Young LLP); Chief Financial Officer of Retail Banking Sector, Chase Manhattan Bank; Senior Vice President, HSBC Bank USA (formerly, Marine Midland Bank); Vice President, Citibank; Assistant Professor of Banking and Finance, Frank G. Zarb School of Business, Hofstra University; Executive Vice President DVC Group, Inc. (marketing, communications and technology). |
Thomas M. O'Neill
Birth Date: June 14, 1951
Trustee
Indefinite Term
Began serving: October 2006 | Principal Occupations: Director or Trustee, Chair of the Audit Committee of the Federated Fund Family; Sole Proprietor, Navigator Management Company (investment and strategic consulting).
Other Directorships Held: None.
Qualifications: Mr. O'Neill has served in several business, mutual fund and financial management roles and directorship positions throughout his career. Mr. O'Neill serves as Director, Medicines for Humanity and Director, The Golisano Children's Museum of Naples, Florida. Mr. O'Neill previously served as Chief Executive Officer and President, Managing Director and Chief Investment Officer, Fleet Investment Advisors; President and Chief Executive Officer, Aeltus Investment Management, Inc.; General Partner, Hellman, Jordan Management Co., Boston, MA; Chief Investment Officer, The Putnam Companies, Boston, MA; Credit Analyst and Lending Officer, Fleet Bank; Director and Consultant, EZE Castle Software (investment order management software); and Director, Midway Pacific (lumber). |
P. Jerome Richey
Birth Date: February 23, 1949
Trustee
Indefinite Term
Began serving: October 2013 | Principal Occupations: Director or Trustee of the Federated Fund Family; Management Consultant.
Other Directorships Held: None.
Qualifications: Mr. Richey has served in several business and legal management roles and directorship positions throughout his career. Mr. Richey most recently held the positions of Senior Vice Chancellor and Chief Legal Officer, University of Pittsburgh. Mr. Richey serves as Board Member, Epilepsy Foundation of Western Pennsylvania and Board member, World Affairs Council of Pittsburgh. Mr. Richey previously served as Chief Legal Officer and Executive Vice President, CONSOL Energy Inc. and Shareholder, Buchanan Ingersoll & Rooney PC (a law firm). |
Annual Shareholder Report
Name
Birth Date
Positions Held with Fund
Date Service Began | Principal Occupation(s) for Past Five Years,
Other Directorships Held, Previous Position(s) and Qualifications |
John S. Walsh
Birth Date: November 28, 1957
Trustee
Indefinite Term
Began serving: November 1999 | Principal Occupations: Director or Trustee of the Federated Fund Family; President and Director, Heat Wagon, Inc. (manufacturer of construction temporary heaters); President and Director, Manufacturers Products, Inc. (distributor of portable construction heaters); President, Portable Heater Parts, a division of Manufacturers Products, Inc.
Other Directorships Held: None.
Qualifications: Mr. Walsh has served in several business management roles and directorship positions throughout his career. Mr. Walsh previously served as Vice President, Walsh & Kelly, Inc. (paving contractors). |
OFFICERS
Name
Birth Date
Address
Positions Held with Fund
Date Service Began | Principal Occupation(s) for Past Five Years
and Previous Position(s) |
John W. McGonigle
Birth Date: October 26, 1938
EXECUTIVE VICE PRESIDENT AND SECRETARY
Officer since: January 1982 | Principal Occupations: Executive Vice President and Secretary of the Federated Fund Family; Vice Chairman, Executive Vice President, Secretary and Director, Federated Investors, Inc.
Previous Positions: Trustee, Federated Investment Management Company and Federated Investment Counseling; Director, Federated Global Investment Management Corp., Federated Services Company and Federated Securities Corp. |
Lori A. Hensler
Birth Date: January 6, 1967
TREASURER
Officer since: April 2013 | Principal Occupations: Principal Financial Officer and Treasurer of the Federated Fund Family; Senior Vice President, Federated Administrative Services; Financial and Operations Principal for Federated Securities Corp. and Edgewood Services, Inc.; and Assistant Treasurer, Federated Investors Trust Company. Ms. Hensler has received the Certified Public Accountant designation.
Previous Positions: Controller of Federated Investors, Inc.; Senior Vice President and Assistant Treasurer, Federated Investors Management Company; Treasurer, Federated Investors Trust Company; Assistant Treasurer, Federated Administrative Services, Federated Administrative Services, Inc., Federated Securities Corp., Edgewood Services, Inc., Federated Advisory Services Company, Federated Equity Management Company of Pennsylvania, Federated Global Investment Management Corp., Federated Investment Counseling, Federated Investment Management Company, Passport Research, Ltd., and Federated MDTA, LLC; Financial and Operations Principal for Federated Securities Corp., Edgewood Services, Inc. and Southpointe Distribution Services, Inc. |
Annual Shareholder Report
Name
Birth Date
Address
Positions Held with Fund
Date Service Began | Principal Occupation(s) for Past Five Years
and Previous Position(s) |
Richard B. Fisher
Birth Date: May 17, 1923
Vice President
Officer since: January 1982 | Principal Occupations: Vice Chairman or Vice President of some of the Funds in the Federated Fund Family; Vice Chairman, Federated Investors, Inc.; Chairman, Federated Securities Corp.
Previous Positions: President and Director or Trustee of some of the Funds in the Federated Fund Family; Executive Vice President, Federated Investors, Inc.; Director and Chief Executive Officer, Federated Securities Corp. |
Peter J. Germain
Birth Date: September 3, 1959
CHIEF LEGAL OFFICER
Officer since: January 2005 | Principal Occupations: Mr. Germain is Chief Legal Officer of the Federated Fund Family. He is General Counsel and Vice President, Federated Investors, Inc.; President, Federated Administrative Services and Federated Administrative Services, Inc.; Vice President, Federated Securities Corp.; Secretary, Federated Private Asset Management, Inc.; and Secretary, Retirement Plan Service Company of America. Mr. Germain joined Federated in 1984 and is a member of the Pennsylvania Bar Association.
Previous Positions: Deputy General Counsel, Special Counsel, Managing Director of Mutual Fund Services, Federated Investors, Inc.; Senior Vice President, Federated Services Company; and Senior Corporate Counsel, Federated Investors, Inc. |
Stephen Van Meter
Birth Date: June 5, 1975
CHIEF COMPLIANCE OFFICER AND SENIOR VICE PRESIDENT
Officer since: July 2015 | Principal Occupations: Senior Vice President and Chief Compliance Officer of the Federated Fund Family; Vice President and Chief Compliance Officer of Federated Investors, Inc. and Chief Compliance Officer of certain of its subsidiaries. Mr. Van Meter joined Federated in October 2011. He holds FINRA licenses under Series 3, 7, 24 and 66.
Previous Positions: Mr. Van Meter previously held the position of Compliance Operating Officer, Federated Investors, Inc. Prior to joining Federated, Mr. Van Meter served at the United States Securities and Exchange Commission in the positions of Senior Counsel, Office of Chief Counsel, Division of Investment Management and Senior Counsel, Division of Enforcement. |
Stephen F. Auth
Birth Date: September 13, 1956
101 Park Avenue
41st Floor
New York, NY 10178
CHIEF INVESTMENT OFFICER
Officer since: November 2002 | Principal Occupations: Stephen F. Auth is Chief Investment Officer of various Funds in the Federated Fund Family; Executive Vice President, Federated Investment Counseling, Federated Global Investment Management Corp. and Federated Equity Management Company of Pennsylvania.
Previous Positions: Executive Vice President, Federated Investment Management Company and Passport Research, Ltd. (investment advisory subsidiary of Federated); Senior Vice President, Global Portfolio Management Services Division; Senior Vice President, Federated Investment Management Company and Passport Research, Ltd.; Senior Managing Director and Portfolio Manager, Prudential Investments. |
Annual Shareholder Report
Evaluation and Approval of Advisory Contract–May 2016
Federated MDT Stock Trust (the “Fund”)
Following a review and recommendation of approval by the Fund's independent trustees, the Fund's Board of Trustees (the “Board”) reviewed and unanimously approved at its May 2016 meetings the continuation of the Fund's investment advisory contract for an additional one-year term. The Board's decision regarding the contract reflects the exercise of its business judgment after consideration of all of the information received on whether to continue the existing arrangements.
The Board had previously appointed a Senior Officer, whose duties include specified responsibilities relating to the process by which advisory fees are to be charged to a Federated fund. The Senior Officer has the authority to retain consultants, experts, or staff as may be reasonably necessary to assist in the performance of his duties, reports directly to the Board, and may be terminated only with the approval of a majority of the independent members of the Board. The Senior Officer prepared and furnished to the Board an independent, written evaluation that covered topics discussed below (the “Senior Officer's Evaluation”). The Board considered the Senior Officer's Evaluation, along with other information, in deciding to approve the investment advisory contract.
The Board is also familiar with and considered judicial decisions concerning allegedly excessive investment advisory fees, which have indicated that the following factors may be relevant to an adviser's fiduciary duty with respect to its receipt of compensation from a fund: the nature and quality of the services provided by an adviser to a fund and its shareholders, including the performance and fees and expenses of the fund and of comparable funds; an adviser's cost of providing the services, including the profitability to an adviser of providing advisory services to a fund; the extent to which an adviser may realize “economies of scale” as a fund grows larger and, if such economies of scale exist, whether they have been shared with a fund and its shareholders or the family of funds; any “fall-out financial benefits” that accrue to an adviser because of its relationship with a fund (including research services received from brokers that execute fund trades and any fees paid to affiliates of an adviser for services rendered to a fund); comparative fee and expense structures, including a comparison of fees paid to an adviser with those paid by similar funds; and the extent of care, conscientiousness and independence with which board members perform their duties and their expertise, including whether they are fully informed about all facts the board deems relevant to its consideration of an adviser's services and fees. The Board noted that the Securities and Exchange Commission (“SEC”) disclosure requirements regarding the basis for the Board's approval of the Fund's investment advisory contract generally track the factors listed above. Consistent with these judicial decisions and SEC disclosure requirements, the Board also considered management fees charged to
Annual Shareholder Report
institutional and other clients of Federated MDTA LLC (the “Adviser”) for what might be viewed as like services. The Board was aware of these factors and was guided by them in its review of the Fund's investment advisory contract to the extent it considered them to be appropriate and relevant, as discussed further below.
The Board considered and weighed these circumstances in light of its substantial accumulated experience in governing the Fund and working with Federated Investors, Inc. and its affiliates (“Federated”) on matters relating to the Federated funds, and was assisted in its deliberations by independent legal counsel. Throughout the year, and in connection with its May meetings, the Board requested and received substantial and detailed information about the Fund and the Federated organization that was in addition to the extensive materials that comprise and accompany the Senior Officer's Evaluation. Federated provided much of this information at each regular meeting of the Board, and furnished additional substantial information in connection with the May meetings at which the Board's formal review of the investment advisory contract occurred. At the May meetings, in addition to meeting in separate sessions of the independent trustees without management present, senior management of the Adviser also met with the independent trustees and their counsel to discuss the materials presented and any other matters thought relevant by the Adviser or the trustees. Between regularly scheduled meetings, the Board also received information on particular matters as the need arose. Thus, the Board's consideration of the investment advisory contract included review of the Senior Officer's Evaluation, accompanying data and additional information covering such matters as: the Adviser's investment philosophy, revenue, profitability, personnel and processes; investment and operating strategies; the Fund's short- and long-term performance (in absolute terms, both on a gross basis and net of expenses, as well as in relationship to its particular investment program and certain competitor or “peer group” funds and/or other benchmarks, as appropriate), and comments on the reasons for performance; the Fund's investment objectives; the Fund's expenses (including the advisory fee itself and the overall expense structure of the Fund, both in absolute terms and relative to similar and/or competing funds, with due regard for contractual or voluntary expense limitations); the use and allocation of brokerage commissions derived from trading the Fund's portfolio securities (if any); and the nature, quality and extent of the advisory and other services provided to the Fund by the Adviser and its affiliates. The Board also considered the preferences and expectations of Fund shareholders; the entrepreneurial risk assumed by the Adviser in sponsoring the Fund; the continuing state of competition in the mutual fund industry and market practices; the range of comparable fees for similar funds in the mutual fund industry; the Fund's relationship to the Federated funds which include a comprehensive array of funds with different investment objectives, policies and strategies which are generally available for exchange without the incurrence of additional sales charges; compliance and
Annual Shareholder Report
audit reports concerning the Federated funds and the Federated companies that service them (including communications from regulatory agencies), as well as Federated's responses to any issues raised therein; and relevant developments in the mutual fund industry and how the Federated funds and/or Federated are responding to them. The Board's evaluation process is evolutionary. The criteria considered and the emphasis placed on relevant criteria change in recognition of changing circumstances in the mutual fund marketplace.
While mindful that courts have cautioned against giving such comparisons too much weight, the Board has found the use of comparisons of the Fund's fees and expenses to other mutual funds with comparable investment programs to be relevant to its deliberations. In this regard, the Board was presented with, and considered, information regarding the contractual advisory fee rates, net advisory fee rates, total expense ratios and each element of the Fund's total expense ratio (i.e., gross and net advisory fees, custody fees, portfolio accounting fees and transfer agency fees) relative to the Fund's peers. The Board focused on comparisons with other similar mutual funds more heavily than non-mutual fund products or services because it is believed that they are more relevant. For example, other mutual funds are the products most like the Fund, they are readily available to Fund shareholders as alternative investment vehicles, and they are the type of investment vehicle in fact chosen and maintained by the Fund's investors. The range of their fees and expenses therefore appears to be a relevant indicator of what consumers have found to be reasonable in the precise marketplace in which the Fund competes.
The Board reviewed the contractual advisory fee rate, net advisory fee rate where partially waived and other expenses of the Fund and noted the position of the Fund's fee rates relative to its peers. In this regard, the Board noted that the contractual advisory fee rate was above the median of the relevant peer group, but the Board noted the applicable waivers and reimbursements and that the overall expense structure of the Fund remained competitive in the context of other factors considered by the Board. In this regard, the Board had been previously advised that, while comparisons to fund peer groups are relevant in judging the reasonableness of advisory fees, the Fund's quantitative focus makes fee and expense comparisons particularly difficult. Although the Fund's advisory fee was above the median of the peer range, the peer group of funds varied widely in their complexity, and the Board had been informed that the management of the Fund is among the more complex relative to its peers.
By contrast, the Senior Officer has reviewed Federated's fees for providing advisory services to products outside the Federated funds (e.g., institutional and separate accounts and sub-adviser services). He concluded that mutual funds and institutional accounts are inherently different products. Those differences include, but are not limited to, different types of targeted investors; being subject to different laws and regulations; different legal structures; different average account sizes and portfolio management techniques made necessary by different cash flows and different associated costs; and the time spent by portfolio
Annual Shareholder Report
managers and their teams, funds financial services, legal, compliance and risk management in reviewing securities pricing, addressing different administrative responsibilities, addressing different degrees of risk associated with management and a variety of different costs. The Senior Officer did not consider the fees for providing advisory services to these outside products to be determinative in judging the appropriateness of mutual fund advisory fees.
Following such evaluation, the Board concluded, within the context of its full deliberations, that the expenses of the Fund are reasonable and supported renewal of the investment advisory contract with respect to the Fund.
The Board considered the nature, extent and quality of the services provided to the Fund by the Adviser and the resources of the Adviser and its affiliates dedicated to the Fund. In this regard, the Board evaluated, among other things, the Adviser's personnel, experience, track record, overall reputation and willingness to invest in personnel and infrastructure that benefit the Fund. In addition, the Board reviewed the qualifications, backgrounds and responsibilities of the portfolio management team primarily responsible for the day-to-day management of the Fund. The Board noted the compliance programs of and the compliance-related resources provided to the Fund by the Adviser. The Fund's ability to deliver competitive performance when compared to its peer group was also deemed to be relevant by the Board as a useful indicator of how the Adviser is executing the Fund's investment program, which in turn was one of the Board's considerations in reaching a conclusion that the nature, extent, and quality of the Adviser's investment management services were such as to warrant continuation of the investment advisory contract.
In evaluating the Fund's investment performance, the Board considered performance results in light of the Fund's investment objective, strategies and risks, as disclosed in the Fund's prospectus. The Board particularly considered detailed investment reports on the Fund's performance provided to the Board throughout the year and in connection with the May meetings. The Senior Officer also reviewed information compiled by Federated, using data supplied by independent fund ranking organizations, regarding the performance of, and fees charged by, other mutual funds, noting his view that comparisons to fund peer groups may be helpful, though not conclusive, in judging the reasonableness of the proposed fees. The Board considered, in evaluating such comparisons, that in some cases individual funds may exhibit significant and unique differences in their objectives and management techniques when compared to other funds within an industry peer group, and that the Senior Officer had specifically noted that the Fund's quantitative focus makes fee and expense comparisons particularly difficult as the peer group of funds varied widely in their complexity, and the management of the Fund is among the more complex relative to its peers.
Annual Shareholder Report
For the periods covered by the Senior Officer's Evaluation, the Fund's performance for the three-year and five-year periods were above the median of the relevant peer group, and the Fund performance fell below the median of the relevant peer group for the one-year period. In addition, the Board was informed by the Adviser that, for the same periods, the Fund outperformed its benchmark index for the three-year and five-year periods, and underperformed its benchmark index for the one-year period. The Board discussed the Fund's performance with the Adviser and recognized the efforts being taken by the Adviser in the context of the other factors considered relevant by the Board.
Following such evaluation, the Board concluded, within the context of its full deliberations, that the performance of the Fund supported renewal of the advisory contract with respect to the Fund.
The Board also received financial information about Federated, including information regarding the compensation and ancillary (or “fall-out”) benefits Federated derived from its relationships with the Federated funds. This information covered not only the fees under the investment advisory contracts, but also fees received by Federated's subsidiaries for providing other services to the Federated funds under separate contracts (e.g., for serving as the Federated funds' administrator). The information also detailed any indirect benefit Federated may derive from its receipt of research services from brokers who execute Federated fund trades. In addition, the Board considered the fact that, in order for a fund to be competitive in the marketplace, Federated and its affiliates frequently waived fees and/or reimbursed expenses and have disclosed to fund investors and/or indicated to the Board their intention to do so in the future, where appropriate. Moreover, the Board receives regular reporting as to the institution, adjustment or elimination of these voluntary waivers. The Board considered Federated's previous reductions in contractual management fees to certain funds in response to the Senior Officer's recommendations.
Federated furnished information, requested by the Senior Officer, that reported revenues on a fund-by-fund basis and made estimates of the allocation of expenses on a fund-by-fund basis, using allocation methodologies specified by the Senior Officer. The Senior Officer noted that, while these cost allocation reports apply consistent allocation processes, the inherent difficulties in allocating costs continues to cause the Senior Officer to question the precision of the process and to conclude that such reports may be unreliable, since a single change in an allocation estimate may dramatically alter the resulting estimate of cost and/or profitability of a fund and may produce unintended consequences. The allocation information, including the Senior Officer's view that fund-by-fund estimations may be unreliable, was considered in the analysis by the Board.
Annual Shareholder Report
The Board and the Senior Officer also reviewed information compiled by Federated comparing profitability information for Federated to other publicly held fund management companies. In this regard, the Senior Officer concluded that Federated's profit margins did not appear to be excessive. The Senior Officer also noted that Federated appeared financially sound, with the resources to fulfill its obligations under its contracts with the Fund.
The Senior Officer's Evaluation also discussed the notion of possible realization of “economies of scale” as a fund grows larger. The Board considered in this regard that the Adviser has made significant and long-term investments in areas that support all of the Federated funds, such as personnel and processes for the portfolio management, shareholder services, compliance, internal audit, and risk management functions, as well as systems technology (including technology relating to cybersecurity), and that the benefits of these efforts (as well as any economies of scale, should they exist) were likely to be enjoyed by the fund family as a whole. The Board noted that the Adviser's investments in these areas are extensive. In addition, the Board considered that Federated and its affiliates have frequently waived fees and/or reimbursed expenses and that this has allowed fund shareholders to share potential economies of scale from a fund's inception. Federated, as it does throughout the year, and again in connection with the Board's review, furnished information relative to revenue sharing or adviser paid fees. Federated and the Senior Officer noted that this information should be viewed to determine if there was an incentive to either not apply breakpoints or to apply breakpoints at higher levels and should not be viewed to determine the appropriateness of advisory fees, because it would represent marketing and distribution expenses. Finally, the Board also noted the absence of any applicable regulatory or industry guidelines on this subject, which (as discussed in the Senior Officer's Evaluation) is compounded by the lack of any common industry practice or general pattern with respect to structuring fund advisory fees with “breakpoints” that serve to reduce the fee as a fund attains a certain size.
The Senior Officer noted that, subject to the comments and recommendations made within the Senior Officer's Evaluation, his observations and the information accompanying the Senior Officer's Evaluation supported a finding by the Board that the management fee for the Fund was reasonable. Under these circumstances, no changes were recommended to, and no objection was raised to, the continuation of the Fund's investment advisory contract.
In its decision to continue an existing investment advisory contract, the Board was mindful of the potential disruptions of the Fund's operations and various risks, uncertainties and other effects that could occur as a result of a decision to terminate or not renew an investment advisory contract. In particular, the Board recognized that many shareholders have invested in the Fund on the strength of the Adviser's industry standing and reputation and with the expectation that the Adviser will have a continuing role in providing advisory services to the Fund. Thus, the Board's approval of the investment advisory contract reflected the fact
Annual Shareholder Report
that it is the shareholders who have effectively selected the Adviser by virtue of having invested in the Fund. The Board concluded that, in light of the factors discussed above, including the nature, quality and scope of the services provided to the Fund by the Adviser and its affiliates, continuation of the investment advisory contract was appropriate.
The Board based its decision to approve the investment advisory contract on the totality of the circumstances and relevant factors and with a view to past and future long-term considerations. Not all of the factors and considerations identified above were necessarily relevant to the Fund, nor did the Board consider any one of them to be determinative. With respect to the factors that were relevant, the Board's decision to approve the continuation of the contract reflects its determination that Federated's performance and actions provided a satisfactory basis to support the decision to continue the existing arrangement.
Annual Shareholder Report
Voting Proxies on Fund Portfolio Securities
A description of the policies and procedures that the Fund uses to determine how to vote proxies, if any, relating to securities held in the Fund's portfolio is available, without charge and upon request, by calling 1-800-341-7400. A report on “Form N-PX” of how the Fund voted any such proxies during the most recent 12-month period ended June 30 is available via the Proxy Voting Record (Form N-PX) link associated with the Fund and share class name at www.FederatedInvestors.com/FundInformation. Form N-PX filings are also available at the SEC's website at www.sec.gov.
Quarterly Portfolio Schedule
The Fund files with the SEC a complete schedule of its portfolio holdings, as of the close of the first and third quarters of its fiscal year, on “Form N-Q.” These filings are available on the SEC's website at www.sec.gov and may be reviewed and copied at the SEC's Public Reference Room in Washington, DC. (Call 1-800-SEC-0330 for information on the operation of the Public Reference Room.) You may also access this information via the link to the Fund and share class name at www.FederatedInvestors.com/FundInformation.
Annual Shareholder Report
Mutual funds are not bank deposits or obligations, are not guaranteed by any bank and are not insured or guaranteed by the U.S. government, the Federal Deposit Insurance Corporation, the Federal Reserve Board or any other government agency. Investment in mutual funds involves investment risk, including the possible loss of principal.
This Report is authorized for distribution to prospective investors only when preceded or accompanied by the Fund's Prospectus, which contains facts concerning its objective and policies, management fees, expenses and other information.
Federated MDT Stock Trust
Federated Investors Funds
4000 Ericsson Drive
Warrendale, PA 15086-7561
Contact us at FederatedInvestors.com
or call 1-800-341-7400.
Federated Securities Corp., Distributor
CUSIP 313900508
CUSIP 313900409
CUSIP 313900102
CUSIP 313900607
29457 (12/16)
Federated is a registered trademark of Federated Investors, Inc.
2016 ©Federated Investors, Inc.
Item 2. Code of Ethics
(a) As of the end of the period covered by this report, the registrant has adopted a code of ethics (the "Section 406 Standards for Investment Companies - Ethical Standards for Principal Executive and Financial Officers") that applies to the registrant's Principal Executive Officer and Principal Financial Officer; the registrant's Principal Financial Officer also serves as the Principal Accounting Officer.
(c) There was no amendment to the registrant’s code of ethics described in Item 2(a) above during the period covered by the report.
(d) There was no waiver granted, either actual or implicit, from a provision to the registrant’s code of ethics described in Item 2(a) above during the period covered by the report.
(e) Not Applicable
(f)(3) The registrant hereby undertakes to provide any person, without charge, upon request, a copy of the code of ethics. To request a copy of the code of ethics, contact the registrant at 1-800-341-7400, and ask for a copy of the Section 406 Standards for Investment Companies - Ethical Standards for Principal Executive and Financial Officers.
Item 3. Audit Committee Financial Expert
The registrant's Board has determined that each of the following members of the Board's Audit Committee is an “audit committee financial expert,” and is "independent," for purposes of this Item: John T. Collins, G. Thomas Hough and Thomas M. O'Neill.
Item 4. Principal Accountant Fees and Services
(a) Audit Fees billed to the registrant for the two most recent fiscal years:
Fiscal year ended 2016 - $26,835
Fiscal year ended 2015 - $25,270
(b) Audit-Related Fees billed to the registrant for the two most recent fiscal years:
Fiscal year ended 2016 - $4,275
Fiscal year ended 2015 - $0
Fiscal year ended 2016- Audit consent fee for N-1A filing.
Amount requiring approval of the registrant’s audit committee pursuant to paragraph (c)(7)(ii) of Rule 2-01 of Regulation S-X, $0 and $0 respectively.
(c) Tax Fees billed to the registrant for the two most recent fiscal years:
Fiscal year ended 2016 - $0
Fiscal year ended 2015 - $0
Amount requiring approval of the registrant’s audit committee pursuant to paragraph (c)(7)(ii) of Rule 2-01 of Regulation S-X, $0 and $0 respectively.
(d) All Other Fees billed to the registrant for the two most recent fiscal years:
Fiscal year ended 2016 - $0
Fiscal year ended 2015 - $0
Amount requiring approval of the registrant’s audit committee pursuant to paragraph (c)(7)(ii) of Rule 2-01 of Regulation S-X, $0 and $0 respectively.
(e)(1) Audit Committee Policies regarding Pre-approval of Services.
The Audit Committee is required to pre-approve audit and non-audit services performed by the independent auditor in order to assure that the provision of such services do not impair the auditor’s independence. Unless a type of service to be provided by the independent auditor has received general pre-approval, it will require specific pre-approval by the Audit Committee. Any proposed services exceeding pre-approved cost levels will require specific pre-approval by the Audit Committee.
Certain services have the general pre-approval of the Audit Committee. The term of the general pre-approval is 12 months from the date of pre-approval, unless the Audit Committee specifically provides for a different period. The Audit Committee will annually review the services that may be provided by the independent auditor without obtaining specific pre-approval from the Audit Committee and may grant general pre-approval for such services. The Audit Committee will revise the list of general pre-approved services from time to time, based on subsequent determinations. The Audit Committee will not delegate its responsibilities to pre-approve services performed by the independent auditor to management.
The Audit Committee has delegated pre-approval authority to its Chairman. The Chairman will report any pre-approval decisions to the Audit Committee at its next scheduled meeting. The Committee will designate another member with such pre-approval authority when the Chairman is unavailable.
AUDIT SERVICES
The annual Audit services engagement terms and fees will be subject to the specific pre-approval of the Audit Committee. The Audit Committee must approve any changes in terms, conditions and fees resulting from changes in audit scope, registered investment company (RIC) structure or other matters.
In addition to the annual Audit services engagement specifically approved by the Audit Committee, the Audit Committee may grant general pre-approval for other Audit Services, which are those services that only the independent auditor reasonably can provide. The Audit Committee has pre-approved certain Audit services, all other Audit services must be specifically pre-approved by the Audit Committee.
AUDIT-RELATED SERVICES
Audit-related services are assurance and related services that are reasonably related to the performance of the audit or review of the Company’s financial statements or that are traditionally performed by the independent auditor. The Audit Committee believes that the provision of Audit-related services does not impair the independence of the auditor, and has pre-approved certain Audit-related services, all other Audit-related services must be specifically pre-approved by the Audit Committee.
TAX SERVICES
The Audit Committee believes that the independent auditor can provide Tax services to the Company such as tax compliance, tax planning and tax advice without impairing the auditor’s independence. However, the Audit Committee will not permit the retention of the independent auditor in connection with a transaction initially recommended by the independent auditor, the purpose of which may be tax avoidance and the tax treatment of which may not be supported in the Internal Revenue Code and related regulations. The Audit Committee has pre-approved certain Tax services, all Tax services involving large and complex transactions must be specifically pre-approved by the Audit Committee.
ALL OTHER SERVICES
With respect to the provision of services other than audit, review or attest services the pre-approval requirement is waived if:
| (1) | The aggregate amount of all such services provided constitutes no more than five percent of the total amount of revenues paid by the registrant, the registrant’s adviser (not including any sub-adviser whose role is primarily portfolio management and is subcontracted with or overseen by another investment adviser), and any entity controlling, controlled by, or under common control with the investment adviser that provides ongoing services to the registrant to its accountant during the fiscal year in which the services are provided; |
| (2) | Such services were not recognized by the registrant, the registrant’s adviser (not including any sub-adviser whose role is primarily portfolio management and is subcontracted with or overseen by another investment adviser), and any entity controlling, controlled by, or under common control with the investment adviser that provides ongoing services to the registrant at the time of the engagement to be non-audit services; and |
| (3) | Such services are promptly brought to the attention of the Audit Committee of the issuer and approved prior to the completion of the audit by the Audit Committee or by one or more members of the Audit Committee who are members of the board of directors to whom authority to grant such approvals has been delegated by the Audit Committee. |
The Audit Committee may grant general pre-approval to those permissible non-audit services classified as All Other services that it believes are routine and recurring services, and would not impair the independence of the auditor.
The SEC’s rules and relevant guidance should be consulted to determine the precise definitions of prohibited non-audit services and the applicability of exceptions to certain of the prohibitions.
PRE-APPROVAL FEE LEVELS
Pre-approval fee levels for all services to be provided by the independent auditor will be established annually by the Audit Committee. Any proposed services exceeding these levels will require specific pre-approval by the Audit Committee.
PROCEDURES
Requests or applications to provide services that require specific approval by the Audit Committee will be submitted to the Audit Committee by both the independent auditor and the Principal Accounting Officer and/or Internal Auditor, and must include a joint statement as to whether, in their view, the request or application is consistent with the SEC’s rules on auditor independence.
(e)(2) Percentage of services identified in items 4(b) through 4(d) that were approved by the registrants audit committee pursuant to paragraph (c)(7)(i)(C) of Rule 2-01 of Regulation S-X:
4(b)
Fiscal year ended 2016 – 0%
Fiscal year ended 2015 - 0%
Percentage of services provided to the registrants investment adviser and any entity controlling, controlled by, or under common control with the investment adviser that provides ongoing services to the registrant that were approved by the registrants audit committee pursuant to paragraph (c)(7)(i)(C) of Rule 2-01 of Regulation S-X, 0% and 0% respectively.
4(c)
Fiscal year ended 2016 – 0%
Fiscal year ended 2015 – 0%
Percentage of services provided to the registrants investment adviser and any entity controlling, controlled by, or under common control with the investment adviser that provides ongoing services to the registrant that were approved by the registrants audit committee pursuant to paragraph (c)(7)(i)(C) of Rule 2-01 of Regulation S-X, 0% and 0% respectively.
4(d)
Fiscal year ended 2016 – 0%
Fiscal year ended 2015 – 0%
Percentage of services provided to the registrants investment adviser and any entity controlling, controlled by, or under common control with the investment adviser that provides ongoing services to the registrant that were approved by the registrants audit committee pursuant to paragraph (c)(7)(i)(C) of Rule 2-01 of Regulation S-X, 0% and 0% respectively.
| (g) | Non-Audit Fees billed to the registrant, the registrant’s investment adviser, and certain entities controlling, controlled by or under common control with the investment adviser: |
Fiscal year ended 2016 - $4,275
Fiscal year ended 2015 - $0
| (h) | The registrant’s Audit Committee has considered that the provision of non-audit services that were rendered to the registrant’s adviser (not including any sub-adviser whose role is primarily portfolio management and is subcontracted with or overseen by another investment adviser), and any entity controlling, controlled by, or under common control with the investment adviser that provides ongoing services to the registrant that were not pre-approved pursuant to paragraph (c)(7)(ii) of Rule 2-01 of Regulation S-X is compatible with maintaining the principal accountant’s independence. |
In its required communications to the Audit Committee of the registrant’s Board, KPMG LLP (“KPMG”), the registrant’s independent public accountant, informed the Audit Committee that KPMG and/or covered person professionals within KPMG maintain lending relationships with certain owners of greater than 10% of the shares of the registrant and/or certain investment companies within the “investment company complex” as defined under Rule 2-01(f)(14) of Regulation S-X, which are affiliates of the registrant. KPMG has advised the Audit Committee that these lending relationships implicate Rule 2-01(c)(1)(ii)(A) of Regulation S-X (referred to as the “Loan Rule”). The Loan Rule prohibits an independent public accountant, or covered person professionals at such firm, from having a financial relationship (such as a loan) with a lender that is a record or beneficial owner of more than 10% of an audit client’s equity securities. For purposes of the Loan Rule, audit clients include the registrant, as well as all registered investment companies audited by KPMG (collectively, the “KPMG Funds”).
KPMG informed the Audit Committee that KPMG believes that these lending relationships described above do not and will not impair KPMG’s ability to exercise objective and impartial judgment in connection with financial statement audits of the registrant and a reasonable investor with knowledge of all relevant facts and circumstances would conclude that KPMG has been and is capable of objective and impartial judgment on all issues encompassed within KPMG’s audits.
On June 20, 2016, the Division of Investment Management of the Securities and Exchange Commission (“SEC”) issued a no-action letter to another mutual fund complex (see Fidelity Management & Research Company et al., No-Action Letter) related to similar Loan Rule matters as those described above. In that letter, the SEC Staff confirmed that it would not recommend enforcement action against an investment company that relied on the audit services performed by an independent public accountant where the Loan Rule was implicated in certain specified circumstances. In that letter, the SEC staff indicated that it would not recommend enforcement action against the investment company complex if the Loan Rule is implicated provided that: (1) the auditor has complied with PCAOB Rule 3526(b)(1) and 3526(b)(2); (2) the Loan Rule is implicated because of lending relationships; and (3) notwithstanding such lending relationships that implicate the Loan Rule, the auditor has concluded that it is objective and impartial with respect to the issues encompassed within its engagement as auditor of the funds. The circumstances described in the no-action letter are substantially similar to the circumstances that implicated the Loan Rule with respect to KPMG and the registrant. The relief provided in the SEC no-action letter is effective for 18 months from its June 20, 2016 issuance date.
If it were to be determined that the relief available under the no-action letter was improperly relied upon, or that the independence requirements under the federal securities laws were not otherwise complied with regarding the registrant, for certain periods, any of the registrant’s filings with the SEC which contain financial statements of the registrant for such periods may not comply with applicable federal securities laws, the registrant’s ability to offer shares under its current registration statement may be impacted, and certain financial reporting and/or other covenants with, and representations and warranties to, the registrant’s lender under its committed line of credit may be impacted. Such events could have a material adverse effect on the registrant and the KPMG Funds.
Item 5. Audit Committee of Listed Registrants
Not Applicable
Item 6. Schedule of Investments
(a) The registrant’s Schedule of Investments is included as part of the Report to Stockholders filed under Item 1 of this form.
(b) Not Applicable; Fund had no divestments during the reporting period covered since the previous Form N-CSR filing.
Item 7. Disclosure of Proxy Voting Policies and Procedures for Closed-End Management Investment Companies
Not Applicable
Item 8. Portfolio Managers of Closed-End Management Investment Companies
Not Applicable
Item 9. Purchases of Equity Securities by Closed-End Management Investment Company and Affiliated Purchasers
Not Applicable
Item 10. Submission of Matters to a Vote of Security Holders
No Changes to Report
Item 11. Controls and Procedures
(a) The registrant’s President and Treasurer have concluded that the
registrant’s disclosure controls and procedures (as defined in rule 30a-3(c) under the Act) are effective in design and operation and are sufficient to form the basis of the certifications required by Rule 30a-(2) under the Act, based on their evaluation of these disclosure controls and procedures within 90 days of the filing date of this report on Form N-CSR.
(b) There were no changes in the registrant’s internal control over financial reporting (as defined in rule 30a-3(d) under the Act) during the second fiscal quarter of the period covered by this report that have materially affected, or are reasonably likely to materially affect, the registrant’s internal control over financial reporting.
Item 12. Exhibits
(a)(1) Code of Ethics- Not Applicable to this Report.
(a)(2) Certifications of Principal Executive Officer and Principal Financial Officer.
(a)(3) Not Applicable.
(b) Certifications pursuant to 18 U.S.C. Section 1350.
SIGNATURES
Pursuant to the requirements of the Securities Exchange Act of 1934 and the Investment Company Act of 1940, the registrant has duly caused this report to be signed on its behalf by the undersigned, thereunto duly authorized.
Registrant Federated MDT Stock Trust
By /S/ Lori A. Hensler
Lori A. Hensler, Principal Financial Officer
Date December 23, 2016
Pursuant to the requirements of the Securities Exchange Act of 1934 and the Investment Company Act of 1940, this report has been signed below by the following persons on behalf of the registrant and in the capacities and on the dates indicated.
By /S/ J. Christopher Donahue
J. Christopher Donahue, Principal Executive Officer
Date December 23, 2016
By /S/ Lori A. Hensler
Lori A. Hensler, Principal Financial Officer
Date December 23, 2016