SECURITIES AND EXCHANGE COMMISSION
CERTIFIED SHAREHOLDER REPORT OF REGISTERED
MANAGEMENT INVESTMENT COMPANIES
Investment Company Act file number
PERMANENT PORTFOLIO FAMILY OF FUNDS
(Exact Name of Registrant as specified in charter)
600 Montgomery Street, Suite 4100, San Francisco, California 94111
(Address of Principal Executive Offices) (Zip Code)
MICHAEL J. CUGGINO, 600 Montgomery Street, Suite 4100, San Francisco, California 94111
(Name and Address of Agent For Service)
| | |
| Registrant’s telephone number, including area code: | | |
| |
| Date of fiscal year end: | | January 31, 2024 |
| |
| Date of reporting period: | | July 31, 2024 |
Form
N-CSR
is to be used by management investment companies to file reports with the Commission not later than 10 days after the transmission to stockholders of any report that is required to be transmitted to stockholders under Rule
30e-1
under the Investment Company Act of 1940 (17 CFR
270.30e-1).
The Commission may use the information provided on Form
N-CSR
in its regulatory, disclosure review, inspection, and policymaking roles.
A registrant is required to disclose the information specified by Form
N-CSR,
and the Commission will make this information public. A registrant is not required to respond to the collection of information contained in Form
N-CSR
unless the Form displays a currently valid Office of Management and Budget (“OMB”) control number. Please direct comments concerning the accuracy of the information collection burden estimate and any suggestions for reducing the burden to Secretary, Securities and Exchange Commission, 100 F Street, NE, Washington, DC 20549-1090. The OMB has reviewed this collection of information under the clearance requirements of 44 U.S.C. §3507.
| | |
|
| |
| | The Semi-Annual Shareholder Report for each share class in each Portfolio of Permanent Portfolio Family of Funds (“Registrant”) is included herein. |
Class A — PRPDX
Class C — PRPHX
Class I — PRPFX
Short-Term Treasury Portfolio
Class I — PRTBX
Class A — PRVDX
Class C — PRVHX
Class I — PRVBX
Aggressive Growth Portfolio
Class A — PAGDX
Class C — PAGHX
Class I — PAGRX
Semi-Annual Shareholder Report (July 31, 2024)
This Semi-Annual Shareholder Report contains important information about the Permanent Portfolio
®
(“Portfolio”) for the period of January 31, 2024 to July 31, 2024. You can find additional information about the Portfolio, online at
www.permanentportfoliofunds.com
. You can also get this information at no cost by calling the Portfolio’s Transfer Agent at (800) 341-8900 or the Portfolio’s Shareholder Services Office at (800) 531-5142, or by contacting your financial intermediary.
What were the Portfolio costs for the last six months?
(Based on a hypothetical $10,000 investment)
The below table explains the costs that you would have paid within the reporting period.
| | | | | | | | |
Portfolio and Share Class | | | | | Costs paid as a percentage
of a $10,000 investment | |
| Permanent Portfolio—Class A shares (PRPDX) | | $ | 56 | | | | .56 | % |
What are the Key Portfolio statistics you should know?
The following table outlines key Portfolio statistics that you should pay attention to:
| | | | |
| | |
| Portfolio’s total net assets | | $ | 3,376,855,475 | |
| | |
| Total number of Portfolio holdings | | | 175 | |
| | |
| Portfolio turnover rate as of end of reporting period | | | 12.87% | |
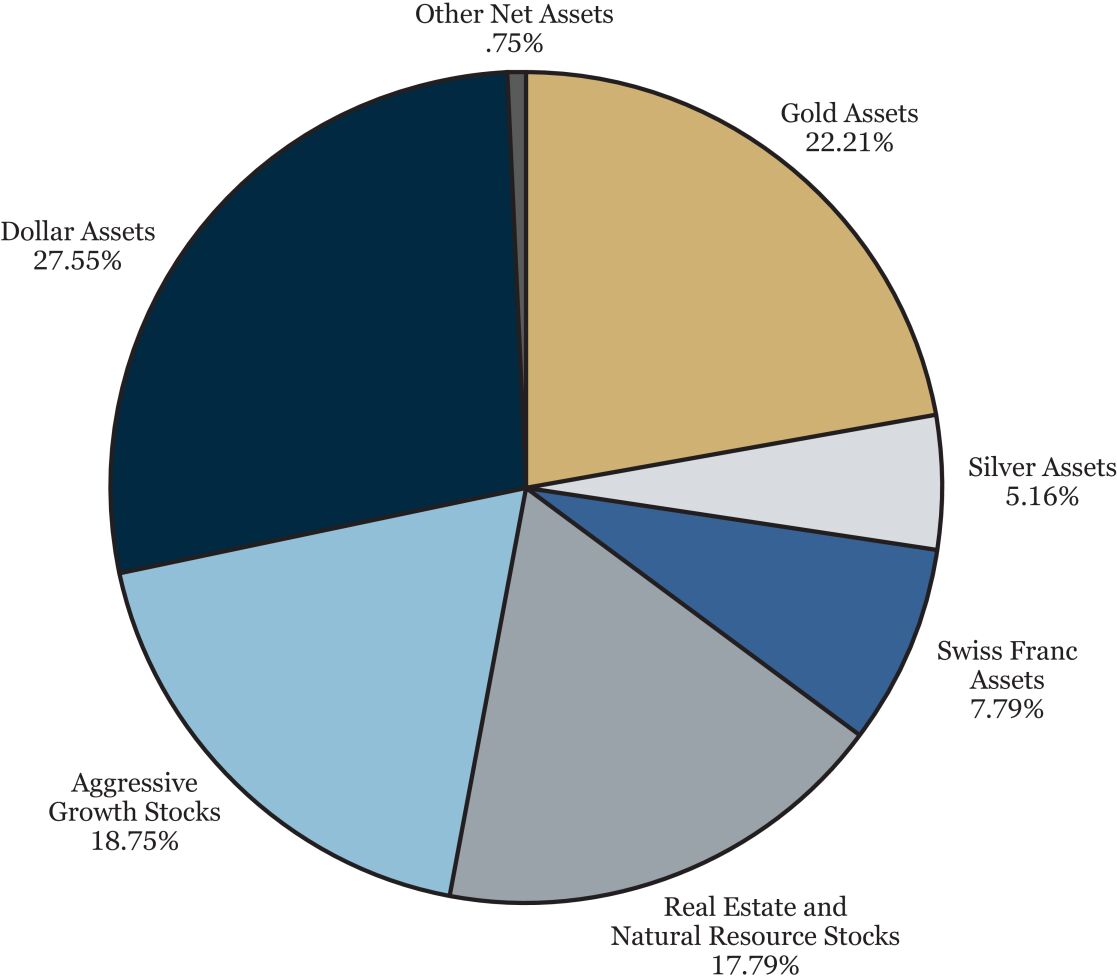
What is the Portfolio invested in?
The following pie chart shows Permanent Portfolio’s investment holdings by asset class, as a percentage of total net assets as of July 31, 2024.
How can you get additional information about the Portfolio?
| | |
 | | Select the QR code or you can find additional information about the Portfolio such as the prospectus, financial information, Portfolio holdings and proxy voting information at www.permanentportfoliofunds.com . |
Each year, the Portfolio sends to its shareholders an updated prospectus and other similar documents (each a “Report”). The mailing of the Reports may result in multiple copies of a Report being sent by the Portfolio to the same household. In order to reduce the volume of mail that the Portfolio sends to a household, the Portfolio may, whenever possible, only send one copy of a Report to shareholders who are members of the same family and share the same address of record. Shareholders may request, however, to receive individual copies of any Report, by contacting the Transfer Agent at (800) 341-8900. Shareholders who own shares of the Portfolio through a financial intermediary may also contact their financial intermediary with such a request. All such requests shall be implemented by the Portfolio within thirty days.
Distributed by Quasar Distributors, LLC
Semi-Annual Shareholder Report (July 31, 2024)
This Semi-Annual Shareholder Report contains important information about the Permanent Portfolio
®
(“Portfolio”) for the period of January 31, 2024 to July 31, 2024. You can find additional information about the Portfolio, online at
www.permanentportfoliofunds.com
. You can also get this information at no cost by calling the Portfolio’s Transfer Agent at (800) 341-8900 or the Portfolio’s Shareholder Services Office at (800) 531-5142, or by contacting your financial intermediary.
What were the Portfolio costs for the last six months?
(Based on a hypothetical $10,000 investment)
The below table explains the costs that you would have paid within the reporting period.
| | | | | | | | |
Portfolio and Share Class | | | | | Costs paid as a percentage
of a $10,000 investment | |
| Permanent Portfolio—Class C shares (PRPHX) | | $ | 96 | | | | .96 | % |
What are the Key Portfolio statistics you should know?
The following table outlines key Portfolio statistics that you should pay attention to:
| | | | |
| | |
| Portfolio’s total net assets | | $ | 3,376,855,475 | |
| | |
| Total number of Portfolio holdings | | | 175 | |
| | |
| Portfolio turnover rate as of end of reporting period | | | 12.87% | |
What is the Portfolio invested in?
The following pie chart shows Permanent Portfolio’s investment holdings by asset class, as a percentage of total net assets as of July 31, 2024.
How can you get additional information about the Portfolio?
| | |
| | Select the QR code or you can find additional information about the Portfolio such as the prospectus, financial information, Portfolio holdings and proxy voting information at www.permanentportfoliofunds.com . |
Each year, the Portfolio sends to its shareholders an updated prospectus and other similar documents (each a “Report”). The mailing of the Reports may result in multiple copies of a Report being sent by the Portfolio to the same household. In order to reduce the volume of mail that the Portfolio sends to a household, the Portfolio may, whenever possible, only send one copy of a Report to shareholders who are members of the same family and share the same address of record. Shareholders may request, however, to receive individual copies of any Report, by contacting the Transfer Agent at (800) 341-8900. Shareholders who own shares of the Portfolio through a financial intermediary may also contact their financial intermediary with such a request. All such requests shall be implemented by the Portfolio within thirty days.
Distributed by Quasar Distributors, LLC
Semi-Annual Shareholder Report (July 31, 2024)
This Semi-Annual Shareholder Report contains important information about the Permanent Portfolio
®
(“Portfolio”) for the period of January 31, 2024 to July 31, 2024. You can find additional information about the Portfolio, online at
www.permanentportfoliofunds.com
. You can also get this information at no cost by calling the Portfolio’s Transfer Agent at (800) 341-8900 or the Portfolio’s Shareholder Services Office at (800) 531-5142, or by contacting your financial intermediary.
What were the Portfolio costs for the last six months?
(Based on a hypothetical $10,000 investment)
The below table explains the costs that you would have paid within the reporting period.
| | | | | | | | |
Portfolio and Share Class | | | | | Costs paid as a percentage
of a $10,000 investment | |
| Permanent Portfolio—Class I shares (PRPFX) | | $ | 43 | | | | .43 | % |
What are the Key Portfolio statistics you should know?
The following table outlines key Portfolio statistics that you should pay attention to:
| | | | |
| | |
| Portfolio’s total net assets | | $ | 3,376,855,475 | |
| | |
| Total number of Portfolio holdings | | | 175 | |
| | |
| Portfolio turnover rate as of end of reporting period | | | 12.87% | |
What is the Portfolio invested in?
The following pie chart shows Permanent Portfolio’s investment holdings by asset class, as a percentage of total net assets as of July 31, 2024.
How can you get additional information about the Portfolio?
| | |
| | Select the QR code or you can find additional information about the Portfolio such as the prospectus, financial information, Portfolio holdings and proxy voting information at www.permanentportfoliofunds.com . |
Each year, the Portfolio sends to its shareholders an updated prospectus and other similar documents (each a “Report”). The mailing of the Reports may result in multiple copies of a Report being sent by the Portfolio to the same household. In order to reduce the volume of mail that the Portfolio sends to a household, the Portfolio may, whenever possible, only send one copy of a Report to shareholders who are members of the same family and share the same address of record. Shareholders may request, however, to receive individual copies of any Report, by contacting the Transfer Agent at (800) 341-8900. Shareholders who own shares of the Portfolio through a financial intermediary may also contact their financial intermediary with such a request. All such requests shall be implemented by the Portfolio within thirty days.
Distributed by Quasar Distributors, LLC
| | |
SHORT-TERM TREASURY PORTFOLIO | |  |
|
Semi-Annual Shareholder Report (July 31, 2024)
This Semi-Annual Shareholder Report contains important information about the Short-Term Treasury Portfolio (“Portfolio”) for the period of January 31, 2024 to July 31, 2024. You can find additional information about the Portfolio, online at
www.permanentportfoliofunds.com
. You can also get this information at no cost by calling the Portfolio’s Transfer Agent at (800) 341-8900 or the Portfolio’s Shareholder Services Office at (800) 531-5142, or by contacting your financial intermediary.
What were the Portfolio costs for the last six months?
(Based on a hypothetical $10,000 investment)
The below table explains the costs that you would have paid within the reporting period.
| | | | | | | | |
Portfolio and Share Class | | | | | Costs paid as a percentage
of a $10,000 investment | |
| Short-Term Treasury Portfolio—Class I shares (PRTBX) | | $ | 33 | | | | .33 | % |
What are the Key Portfolio statistics you should know?
The following table outlines key Portfolio statistics that you should pay attention to:
| | | | |
| | |
| Portfolio’s total net assets | | $ | 11,457,469 | |
| | |
| Total number of Portfolio holdings | | | 9 | |
| | |
| Portfolio turnover rate as of end of reporting period | | | 20.64% | |
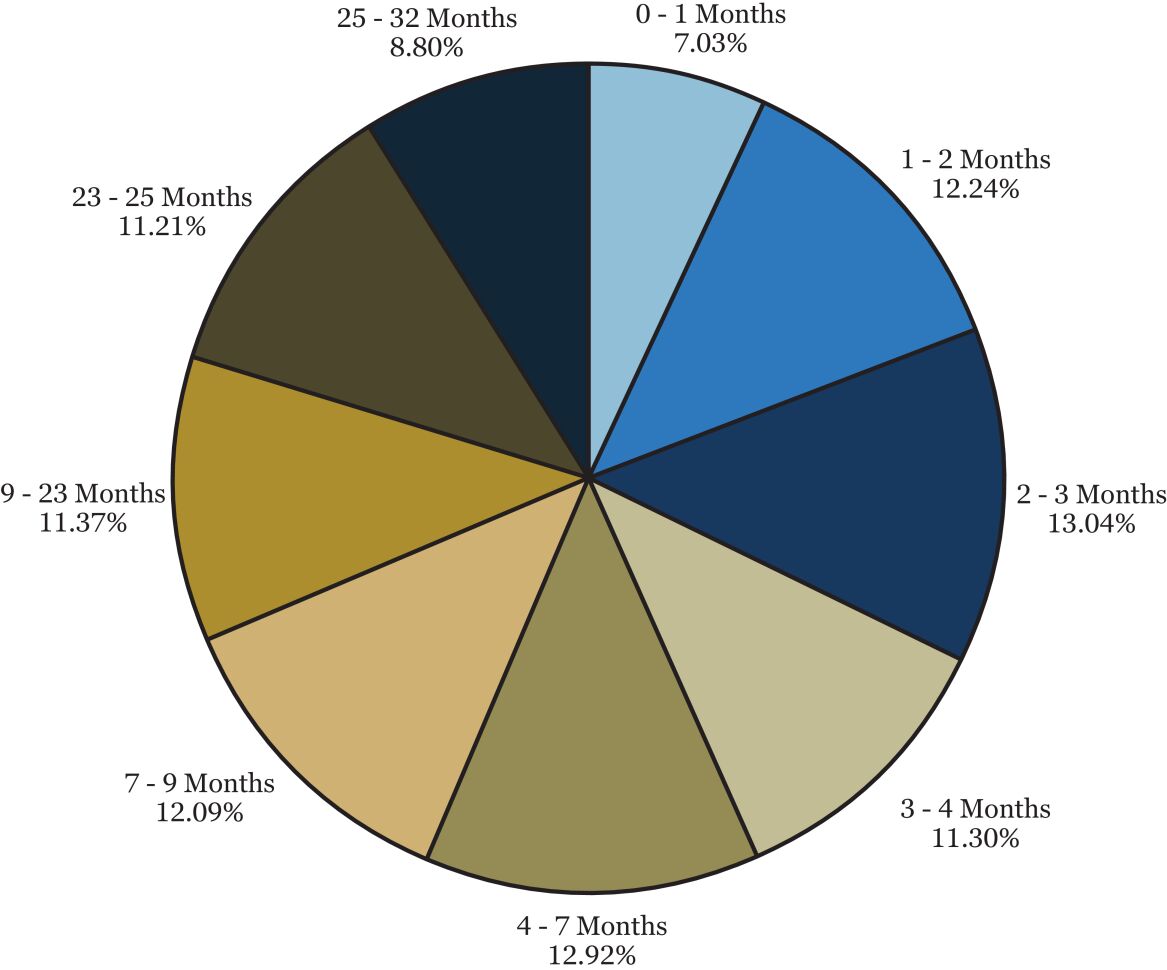
What is the Portfolio invested in?
The following pie chart shows Short-Term Treasury Portfolio’s investment holdings by months to maturity, as a percentage of investments as of July 31, 2024.
How can you get additional information about the Portfolio?
| | |
| | Select the QR code or you can find additional information about the Portfolio such as the prospectus, financial information, Portfolio holdings and proxy voting information at www.permanentportfoliofunds.com . |
Each year, the Portfolio sends to its shareholders an updated prospectus and other similar documents (each a “Report”). The mailing of the Reports may result in multiple copies of a Report being sent by the Portfolio to the same household. In order to reduce the volume of mail that the Portfolio sends to a household, the Portfolio may, whenever possible, only send one copy of a Report to shareholders who are members of the same family and share the same address of record. Shareholders may request, however, to receive individual copies of any Report, by contacting the Transfer Agent at (800) 341-8900. Shareholders who own shares of the Portfolio through a financial intermediary may also contact their financial intermediary with such a request. All such requests shall be implemented by the Portfolio within thirty days.
Distributed by Quasar Distributors, LLC
Semi-Annual Shareholder Report (July 31, 2024)
This Semi-Annual Shareholder Report contains important information about the Versatile Bond Portfolio (“Portfolio”) for the period of January 31, 2024 to July 31, 2024. You can find additional information about the Portfolio, online at
www.permanentportfoliofunds.com
. You can also get this information at no cost by calling the Portfolio’s Transfer Agent at (800) 341-8900 or the Portfolio’s Shareholder Services Office at (800) 531-5142, or by contacting your financial intermediary.
What were the Portfolio costs for the last six months?
(Based on a hypothetical $10,000 investment)
The below table explains the costs that you would have paid within the reporting period.
| | | | | | | | |
Portfolio and Share Class | | | | | Costs paid as a percentage
of a $10,000 investment | |
| Versatile Bond Portfolio—Class A shares (PRVDX) | | $ | 46 | | | | .46 | % |
What are the Key Portfolio statistics you should know?
The following table outlines key Portfolio statistics that you should pay attention to:
| | | | |
| | |
| Portfolio’s total net assets | | $ | 97,110,356 | |
| | |
| Total number of Portfolio holdings | | | 80 | |
| | |
| Portfolio turnover rate as of end of reporting period | | | 17.12% | |
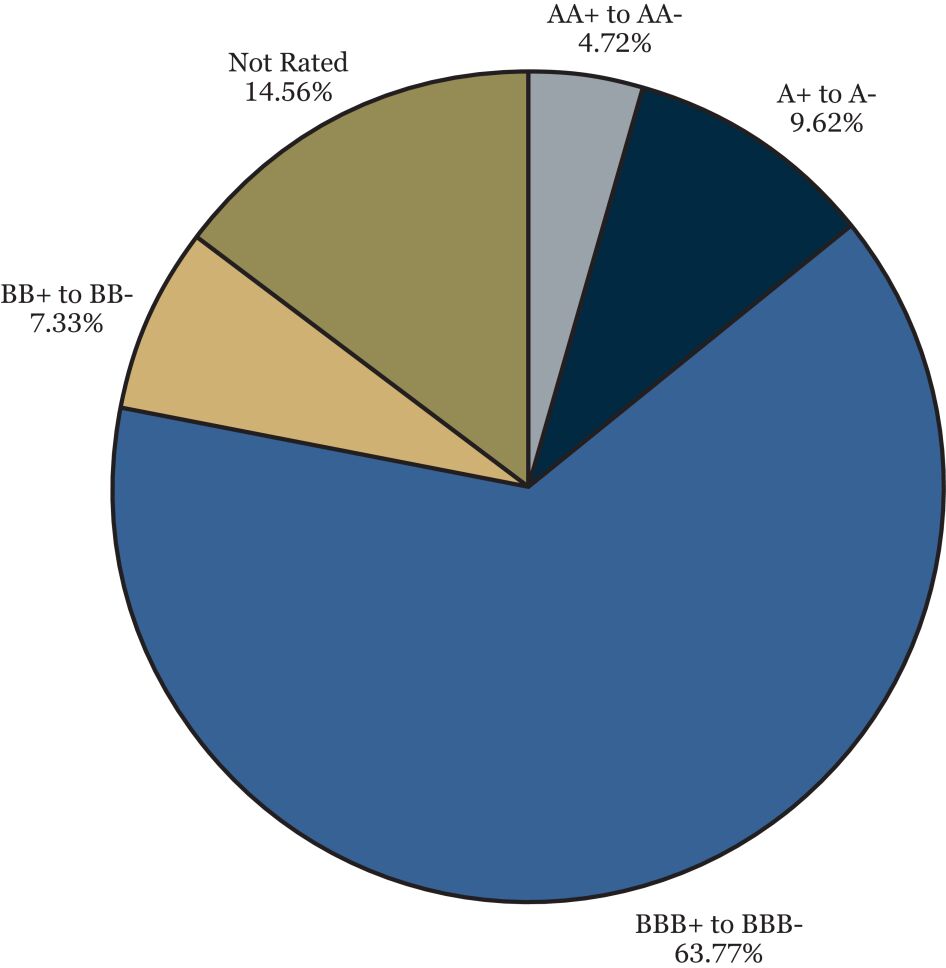
What is the Portfolio invested in?
The following pie chart shows Versatile Bond Portfolio’s investment holdings by S&P credit rating, as a percentage of investments as of July 31, 2024. Credit ratings range from AAA (highest) to D (lowest) based on S&P measures. Other rating agencies may rate the same securities differently. “Not Rated” securities are not rated by S&P. Credit ratings are only the opinions of the rating agencies issuing them, do not purport to reflect the risk of fluctuations in market value, are not guarantees as to the payment of interest and repayment of principal, and are subject to change.
How can you get additional information about the Portfolio?
| | |
| | Select the QR code or you can find additional information about the Portfolio such as the prospectus, financial information, Portfolio holdings and proxy voting information at www.permanentportfoliofunds.com . |
Each year, the Portfolio sends to its shareholders an updated prospectus and other similar documents (each a “Report”). The mailing of the Reports may result in multiple copies of a Report being sent by the Portfolio to the same household. In order to reduce the volume of mail that the Portfolio sends to a household, the Portfolio may, whenever possible, only send one copy of a Report to shareholders who are members of the same family and share the same address of record. Shareholders may request, however, to receive individual copies of any Report, by contacting the Transfer Agent at (800) 341-8900. Shareholders who own shares of the Portfolio through a financial intermediary may also contact their financial intermediary with such a request. All such requests shall be implemented by the Portfolio within thirty days.
Distributed by Quasar Distributors, LLC
Semi-Annual Shareholder Report (July 31, 2024)
This Semi-Annual Shareholder Report contains important information about the Versatile Bond Portfolio (“Portfolio”) for the period of January 31, 2024 to July 31, 2024. You can find additional information about the Portfolio, online at
www.permanentportfoliofunds.com
. You can also get this information at no cost by calling the Portfolio’s Transfer Agent at (800) 341-8900 or the Portfolio’s Shareholder Services Office at (800) 531-5142, or by contacting your financial intermediary.
What were the Portfolio costs for the last six months?
(Based on a hypothetical $10,000 investment)
The below table explains the costs that you would have paid within the reporting period.
| | | | | | | | |
Portfolio and Share Class | | Costs of a $10,000
investment | | | Costs paid as a percentage
of a $10,000 investment | |
| Versatile Bond Portfolio—Class C shares (PRVHX) | | $ | 83 | | | | .83 | % |
What are the Key Portfolio statistics you should know?
The following table outlines key Portfolio statistics that you should pay attention to:
| | | | |
| | |
| Portfolio’s total net assets | | $ | 97,110,356 | |
| | |
| Total number of Portfolio holdings | | | 80 | |
| | |
| Portfolio turnover rate as of end of reporting period | | | 17.12% | |
What is the Portfolio invested in?
The following pie chart shows Versatile Bond Portfolio’s investment holdings by S&P credit rating, as a percentage of investments as of July 31, 2024. Credit ratings range from AAA (highest) to D (lowest) based on S&P measures. Other rating agencies may rate the same securities differently. “Not Rated” securities are not rated by S&P. Credit ratings are only the opinions of the rating agencies issuing them, do not purport to reflect the risk of fluctuations in market value, are not guarantees as to the payment of interest and repayment of principal, and are subject to change.
How can you get additional information about the Portfolio?
| | |
| | Select the QR code or you can find additional information about the Portfolio such as the prospectus, financial information, Portfolio holdings and proxy voting information at www.permanentportfoliofunds.com . |
Each year, the Portfolio sends to its shareholders an updated prospectus and other similar documents (each a “Report”). The mailing of the Reports may result in multiple copies of a Report being sent by the Portfolio to the same household. In order to reduce the volume of mail that the Portfolio sends to a household, the Portfolio may, whenever possible, only send one copy of a Report to shareholders who are members of the same family and share the same address of record. Shareholders may request, however, to receive individual copies of any Report, by contacting the Transfer Agent at (800) 341-8900. Shareholders who own shares of the Portfolio through a financial intermediary may also contact their financial intermediary with such a request. All such requests shall be implemented by the Portfolio within thirty days.
Distributed by Quasar Distributors, LLC
Semi-Annual Shareholder Report (July 31, 2024)
This Semi-Annual Shareholder Report contains important information about the Versatile Bond Portfolio (“Portfolio”) for the period of January 31, 2024 to July 31, 2024. You can find additional information about the Portfolio, online at
www.permanentportfoliofunds.com
. You can also get this information at no cost by calling the Portfolio’s Transfer Agent at (800) 341-8900 or the Portfolio’s Shareholder Services Office at (800) 531-5142, or by contacting your financial intermediary.
What were the Portfolio costs for the last six months?
(Based on a hypothetical $10,000 investment)
The below table explains the costs that you would have paid within the reporting period.
| | | | | | | | |
Portfolio and Share Class | | | | | Costs paid as a percentage
of a $10,000 investment | |
| Versatile Bond Portfolio—Class I shares (PRVBX) | | $ | 33 | | | | .33 | % |
What are the Key Portfolio statistics you should know?
The following table outlines key Portfolio statistics that you should pay attention to:
| | | | |
| | |
| Portfolio’s total net assets | | $ | 97,110,356 | |
| | |
| Total number of Portfolio holdings | | | 80 | |
| | |
| Portfolio turnover rate as of end of reporting period | | | 17.12% | |
What is the Portfolio invested in?
The following pie chart shows Versatile Bond Portfolio’s investment holdings by S&P credit rating, as a percentage of investments as of July 31, 2024. Credit ratings range from AAA (highest) to D (lowest) based on S&P measures. Other rating agencies may rate the same securities differently. “Not Rated” securities are not rated by S&P. Credit ratings are only the opinions of the rating agencies issuing them, do not purport to reflect the risk of fluctuations in market value, are not guarantees as to the payment of interest and repayment of principal, and are subject to change.
How can you get additional information about the Portfolio?
| | |
| | Select the QR code or you can find additional information about the Portfolio such as the prospectus, financial information, Portfolio holdings and proxy voting information at www.permanentportfoliofunds.com . |
Each year, the Portfolio sends to its shareholders an updated prospectus and other similar documents (each a “Report”). The mailing of the Reports may result in multiple copies of a Report being sent by the Portfolio to the same household. In order to reduce the volume of mail that the Portfolio sends to a household, the Portfolio may, whenever possible, only send one copy of a Report to shareholders who are members of the same family and share the same address of record. Shareholders may request, however, to receive individual copies of any Report, by contacting the Transfer Agent at (800) 341-8900. Shareholders who own shares of the Portfolio through a financial intermediary may also contact their financial intermediary with such a request. All such requests shall be implemented by the Portfolio within thirty days.
Distributed by Quasar Distributors, LLC
| | |
AGGRESSIVE GROWTH PORTFOLIO | | |
|
Semi-Annual Shareholder Report (July 31, 2024)
This Semi-Annual Shareholder Report contains important information about the Aggressive Growth Portfolio (“Portfolio”) for the period of January 31, 2024 to July 31, 2024. You can find additional information about the Portfolio, online at
www.permanentportfoliofunds.com
. You can also get this information at no cost by calling the Portfolio’s Transfer Agent at (800) 341-8900 or the Portfolio’s Shareholder Services Office at (800) 531-5142, or by contacting your financial intermediary.
What were the Portfolio costs for the last six months?
(Based on a hypothetical $10,000 investment)
The below table explains the costs that you would have paid within the reporting period.
| | | | | | | | |
Portfolio and Share Class | | Costs of a $10,000
investment | | | Costs paid as a percentage
of a $10,000 investment | |
| Aggressive Growth Portfolio—Class A shares (PAGDX) | | $ | 81 | | | | .81 | % |
What are the Key Portfolio statistics you should know?
The following table outlines key Portfolio statistics that you should pay attention to:
| | | | |
| | |
| Portfolio’s total net assets | | $ | 41,465,129 | |
| | |
| Total number of Portfolio holdings | | | 36 | |
| | |
| Portfolio turnover rate as of end of reporting period | | | —% | |
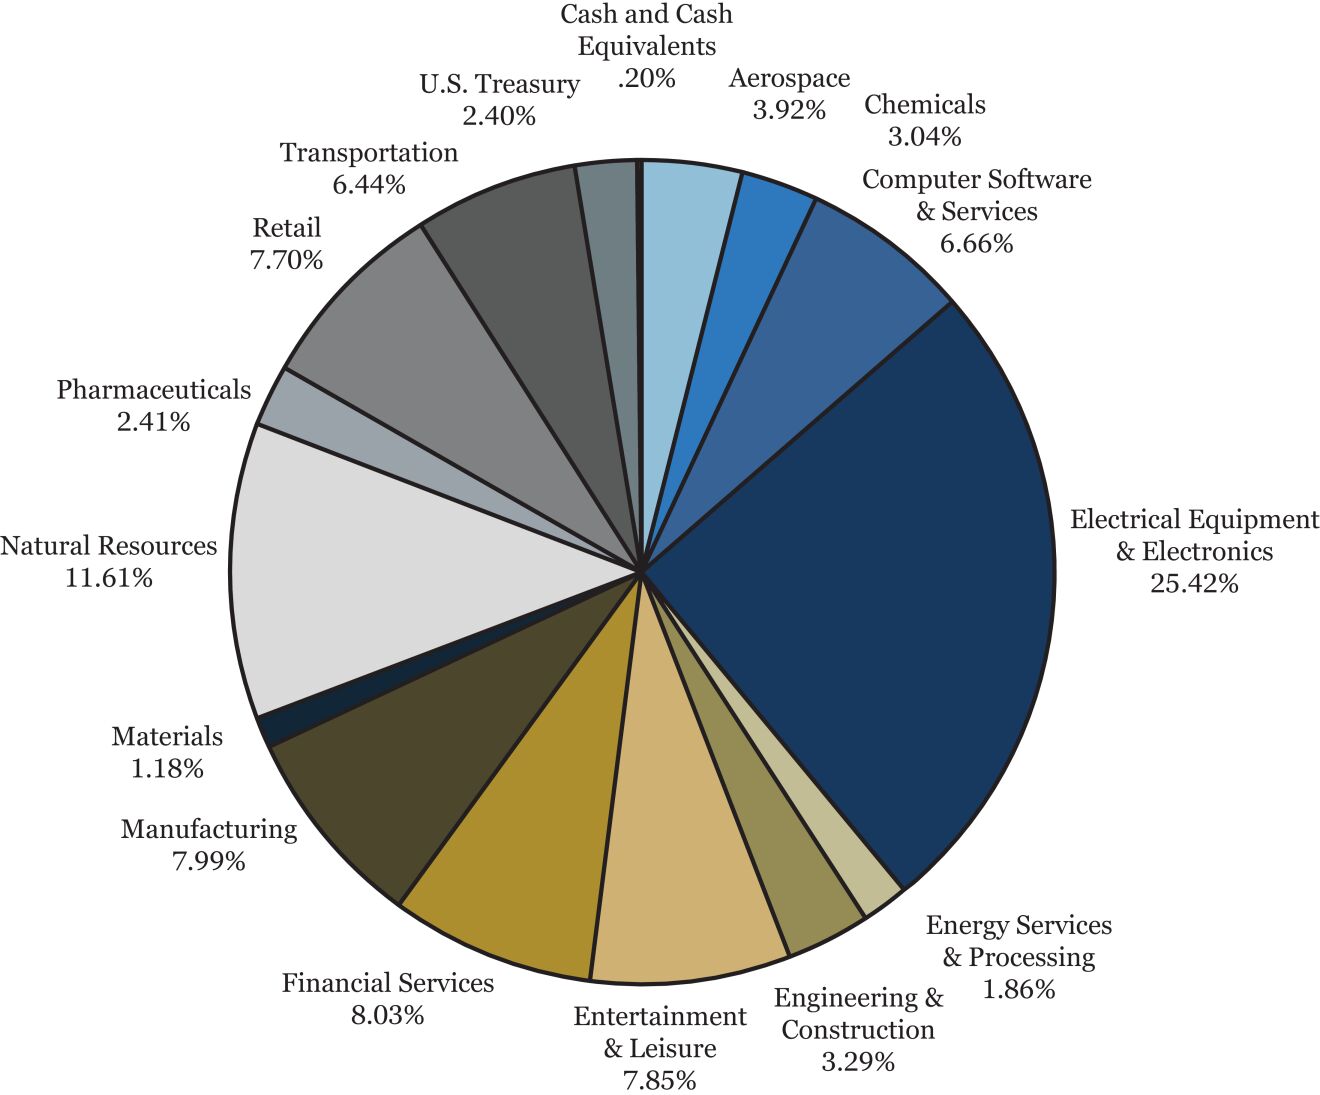
What is the Portfolio invested in?
The following pie chart shows Aggressive Growth Portfolio’s investment holdings by industry sector, as a percentage of total net assets as of July 31, 2024.
How can you get additional information about the Portfolio?
| | |
| | Select the QR code or you can find additional information about the Portfolio such as the prospectus, financial information, Portfolio holdings and proxy voting information at www.permanentportfoliofunds.com . |
Each year, the Portfolio sends to its shareholders an updated prospectus and other similar documents (each a “Report”). The mailing of the Reports may result in multiple copies of a Report being sent by the Portfolio to the same household. In order to reduce the volume of mail that the Portfolio sends to a household, the Portfolio may, whenever possible, only send one copy of a Report to shareholders who are members of the same family and share the same address of record. Shareholders may request, however, to receive individual copies of any Report, by contacting the Transfer Agent at (800) 341-8900. Shareholders who own shares of the Portfolio through a financial intermediary may also contact their financial intermediary with such a request. All such requests shall be implemented by the Portfolio within thirty days.
Distributed by Quasar Distributors, LLC
| | |
AGGRESSIVE GROWTH PORTFOLIO | | |
|
Semi-Annual Shareholder Report (July 31, 2024)
This Semi-Annual Shareholder Report contains important information about the Aggressive Growth Portfolio (“Portfolio”) for the period of January 31, 2024 to July 31, 2024. You can find additional information about the Portfolio, online at
www.permanentportfoliofunds.com
. You can also get this information at no cost by calling the Portfolio’s Transfer Agent at (800) 341-8900 or the Portfolio’s Shareholder Services Office at (800) 531-5142, or by contacting your financial intermediary.
What were the Portfolio costs for the last six months?
(Based on a hypothetical $10,000 investment)
The below table explains the costs that you would have paid within the reporting period.
| | | | | | | | |
Portfolio and Share Class | | Costs of a $10,000
investment | | | Costs paid as a percentage
of a $10,000 investment | |
| Aggressive Growth Portfolio—Class C shares (PAGHX) | | $ | 81 | | | | .81 | % |
What are the Key Portfolio statistics you should know?
The following table outlines key Portfolio statistics that you should pay attention to:
| | | | |
| | |
| Portfolio’s total net assets | | $ | 41,465,129 | |
| | |
| Total number of Portfolio holdings | | | 36 | |
| | |
| Portfolio turnover rate as of end of reporting period | | | —% | |
What is the Portfolio invested in?
The following pie chart shows Aggressive Growth Portfolio’s investment holdings by industry sector, as a percentage of total net assets as of July 31, 2024.
How can you get additional information about the Portfolio?
| | |
| | Select the QR code or you can find additional information about the Portfolio such as the prospectus, financial information, Portfolio holdings and proxy voting information at www.permanentportfoliofunds.com . |
Each year, the Portfolio sends to its shareholders an updated prospectus and other similar documents (each a “Report”). The mailing of the Reports may result in multiple copies of a Report being sent by the Portfolio to the same household. In order to reduce the volume of mail that the Portfolio sends to a household, the Portfolio may, whenever possible, only send one copy of a Report to shareholders who are members of the same family and share the same address of record. Shareholders may request, however, to receive individual copies of any Report, by contacting the Transfer Agent at (800) 341-8900. Shareholders who own shares of the Portfolio through a financial intermediary may also contact their financial intermediary with such a request. All such requests shall be implemented by the Portfolio within thirty days.
Distributed by Quasar Distributors, LLC
| | |
AGGRESSIVE GROWTH PORTFOLIO | | |
|
Semi-Annual Shareholder Report (July 31, 2024)
This Semi-Annual Shareholder Report contains important information about the Aggressive Growth Portfolio (“Portfolio”) for the period of January 31, 2024 to July 31, 2024. You can find additional information about the Portfolio, online at
www.permanentportfoliofunds.com
. You can also get this information at no cost by calling the Portfolio’s Transfer Agent at (800) 341-8900 or the Portfolio’s Shareholder Services Office at (800) 531-5142, or by contacting your financial intermediary.
What were the Portfolio costs for the last six months?
(Based on a hypothetical $10,000 investment)
The below table explains the costs that you would have paid within the reporting period.
| | | | | | | | |
Portfolio and Share Class | | | | | Costs paid as a percentage
of a $10,000 investment | |
| Aggressive Growth Portfolio—Class I shares (PAGRX) | | $ | 67 | | | | .67 | % |
What are the Key Portfolio statistics you should know?
The following table outlines key Portfolio statistics that you should pay attention to:
| | | | |
| | |
| Portfolio’s total net assets | | $ | 41,465,129 | |
| | |
| Total number of Portfolio holdings | | | 36 | |
| | |
| Portfolio turnover rate as of end of reporting period | | | —% | |
What is the Portfolio invested in?
The following pie chart shows Aggressive Growth Portfolio’s investment holdings by industry sector, as a percentage of total net assets as of July 31, 2024.
How can you get additional information about the Portfolio?
| | |
| | Select the QR code or you can find additional information about the Portfolio such as the prospectus, financial information, Portfolio holdings and proxy voting information at www.permanentportfoliofunds.com . |
Each year, the Portfolio sends to its shareholders an updated prospectus and other similar documents (each a “Report”). The mailing of the Reports may result in multiple copies of a Report being sent by the Portfolio to the same household. In order to reduce the volume of mail that the Portfolio sends to a household, the Portfolio may, whenever possible, only send one copy of a Report to shareholders who are members of the same family and share the same address of record. Shareholders may request, however, to receive individual copies of any Report, by contacting the Transfer Agent at (800) 341-8900. Shareholders who own shares of the Portfolio through a financial intermediary may also contact their financial intermediary with such a request. All such requests shall be implemented by the Portfolio within thirty days.
Distributed by Quasar Distributors, LLC
| | |
| Item 2. Code of Ethics. |
| |
| | Not applicable to semi-annual reports. |
|
| Item 3. Audit Committee Financial Expert. |
| |
| | Not applicable to semi-annual reports. |
|
| Item 4. Principal Accountant Fees and Services. |
| |
| | Not applicable to semi-annual reports. |
|
| Item 5. Audit Committee of Listed Registrants. |
| |
| | Not applicable to the Registrant. |
|
| Item 6. Investments. |
| |
| | Included in Item 7. |
|
| Item 7. Financial Statements and Financial Highlights For Open-End Management Investment Companies. |
| |
| | The Semi-Annual Financial Statements and Other Information of the Registrant for the six months ended July 31, 2024 is included herein. |
| | |
 | | Semi-Annual Financial Statements and Other Information Six Months Ended July 31, 2024 |
Permanent Portfolio®
Class A — PRPDX | Class C — PRPHX | Class I — PRPFX
Short-Term Treasury Portfolio
Class I — PRTBX
Versatile Bond Portfolio
Class A — PRVDX | Class C — PRVHX | Class I — PRVBX
Aggressive Growth Portfolio
Class A — PAGDX | Class C — PAGHX | Class I — PAGRX
Permanent Portfolio®, The Permanent Portfolio Family of Funds®, A Fund for All Seasons® and The Permanent Portfolio Family of Funds logo are registered trademarks of Pacific Heights Asset Management, LLC. This Report is Copyright© 2024 Permanent Portfolio Family of Funds. All rights reserved.
2
TABLE OF CONTENTS
3
PERMANENT PORTFOLIO®
Schedule of Investments
July 31, 2024 (Unaudited)
| | | | | | | | |
| Quantity | | | | | Market Value | |
| | | | GOLD ASSETS — 22.21% of Total Net Assets | | | | |
| | 217,320 Troy Oz. | | | Gold bullion (a) | | $ | 527,325,791 | |
| | 90,000 Coins | | | One-ounce gold coins (a) | | | 222,553,000 | |
| | | | | | | | |
| | | | Total Gold Assets (identified cost $328,396,837) | | $ | 749,878,791 | |
| | | | | | | | |
| | |
| | | | SILVER ASSETS — 5.16% of Total Net Assets | | | | |
| | 6,058,176 Troy Oz. | | | Silver bullion (a) | | $ | 174,342,194 | |
| | | | | | | | |
| | | | Total Silver Assets (identified cost $92,215,771) | | $ | 174,342,194 | |
| | | | | | | | |
| | | | | | | | |
| Principal Amount | | | | | | |
| | | | SWISS FRANC ASSETS — 7.79% of Total Net Assets | | | | |
| CHF | 500,164 | | | Swiss franc deposits | | $ | 569,824 | |
| | | | | | | | |
| | |
| CHF | 70,000,000 | | | 1.500% Swiss Confederation Bonds, 07-24-25 | | $ | 80,231,843 | |
| CHF | 65,000,000 | | | 1.250% Swiss Confederation Bonds, 05-28-26 | | | 74,841,641 | |
| CHF | 15,000,000 | | | 3.250% Swiss Confederation Bonds, 06-27-27 | | | 18,387,924 | |
| CHF | 80,000,000 | | | .514% Swiss Confederation Bonds, 06-22-29 (b) | | | 88,879,521 | |
| | | | | | | | |
| | | | Total Swiss Confederation bonds | | $ | 262,340,929 | |
| | | | | | | | |
| | | | Total Swiss Franc Assets (identified cost $246,400,512) | | $ | 262,910,753 | |
| | | | | | | | |
| | | | | | | | |
| Number of Shares | | | | | | |
| | | | REAL ESTATE AND NATURAL RESOURCE STOCKS — 17.79% of Total Net Assets | |
| | |
| | | | NATURAL RESOURCES — 8.97% of Total Net Assets | | | | |
| | 180,000 | | | APA Corporation | | $ | 5,614,200 | |
| | 160,000 | | | BHP Group, Ltd. (c) | | | 8,884,800 | |
| | 2,000,000 | | | Birchcliff Energy, Ltd. | | | 8,660,000 | |
| | 160,000 | | | BP, p.l.c. (c) | | | 5,662,400 | |
| | 500,000 | | | Cameco Corporation | | | 22,745,000 | |
| | 320,000 | | | Canadian Natural Resources Ltd. | | | 11,353,600 | |
| | 150,000 | | | Chevron Corporation | | | 24,070,500 | |
| | 150,000 | | | ConocoPhillips | | | 16,680,000 | |
| | 350,000 | | | Devon Energy Corporation | | | 16,460,500 | |
| | 150,000 | | | Exxon Mobil Corporation | | | 17,788,500 | |
| | 2,100,000 | | | Freeport-McMoRan, Inc. | | | 95,361,000 | |
| | 350,000 | | | Murphy Oil Corporation | | | 14,483,000 | |
| | 135,000 | | | Nutrien, Ltd. | | | 6,912,000 | |
| | 180,000 | | | Occidental Petroleum Corporation | | | 10,947,600 | |
| | 100,000 | | | Occidental Petroleum Corporation warrants (a) | | | 3,895,000 | |
| | 180,000 | | | Ovintiv, Inc. | | | 8,359,200 | |
| | 160,000 | | | Rio Tinto p.l.c (c) | | | 10,425,600 | |
| | 500,000 | | | South32 Limited (c) | | | 5,030,000 | |
| | 200,000 | | | Vale S.A. (c) | | | 2,170,000 | |
| | 175,000 | | | Viper Energy Partners LP | | | 7,467,250 | |
| | | | | | | | |
| | | | | | $ | 302,970,150 | |
| | | | | | | | |
Continued on following page.
4
PERMANENT PORTFOLIO®
Schedule of Investments
July 31, 2024 (Unaudited)
| | | | | | | | |
| Number of Shares | | | | | Market Value | |
| | | | REAL ESTATE — 8.82% of Total Net Assets | | | | |
| | 125,000 | | | Alexander & Baldwin, Inc. | | $ | 2,463,750 | |
| | 40,000 | | | American Tower Corporation | | | 8,816,000 | |
| | 60,000 | | | AvalonBay Communities, Inc. | | | 12,295,200 | |
| | 60,000 | | | Boston Properties, Inc. | | | 4,278,600 | |
| | 200,000 | | | Centerspace | | | 13,966,000 | |
| | 75,000 | | | Digital Realty Trust, Inc. | | | 11,211,750 | |
| | 60,000 | | | Essex Property Trust, Inc. | | | 16,701,600 | |
| | 100,000 | | | Federal Realty Investment Trust | | | 11,165,000 | |
| | 150,000 | | | Highwoods Properties, Inc. | | | 4,645,500 | |
| | 300,000 | | | Kimco Realty Corporation | | | 6,519,000 | |
| | 400,000 | | | Outfront Media, Inc. | | | 6,488,000 | |
| | 150,000 | | | Prologis, Inc. | | | 18,907,500 | |
| | 125,000 | | | Regency Centers Corporation | | | 8,417,500 | |
| | 100,000 | | | Simon Property Group, Inc. | | | 15,344,000 | |
| | 165,000 | | | Texas Pacific Land Corporation | | | 139,408,500 | |
| | 125,000 | | | UDR, Inc. | | | 5,008,750 | |
| | 250,000 | | | UMH Properties, Inc. | | | 4,440,000 | |
| | 100,000 | | | Vornado Realty Trust | | | 2,999,000 | |
| | 150,000 | | | Weyerhaeuser Company | | | 4,764,000 | |
| | | | | | | | |
| | | | | | $ | 297,839,650 | |
| | | | | | | | |
| | | | Total Real Estate and Natural Resource Stocks
(identified cost $310,539,817) | | $ | 600,809,800 | |
| | | | | | | | |
| |
| | | | AGGRESSIVE GROWTH STOCKS — 18.75% of Total Net Assets | |
| |
| | | | AEROSPACE — .88% of Total Net Assets | |
| | 55,000 | | | Lockheed Martin Corporation | | $ | 29,805,600 | |
| | | | | | | | |
| | | | | | $ | 29,805,600 | |
| | | | | | | | |
| | | | CHEMICALS — .58% of Total Net Assets | |
| | 55,000 | | | Air Products & Chemicals, Inc. | | $ | 14,511,750 | |
| | 55,000 | | | Albemarle Corporation | | | 5,151,850 | |
| | | | | | | | |
| | | | | | $ | 19,663,600 | |
| | | | COMPUTER SOFTWARE & SERVICES — 1.60% of Total Net Assets | |
| | 55,000 | | | Autodesk, Inc. (a) | | $ | 13,613,600 | |
| | 1,500,000 | | | Palantir Technologies, Inc. Class A (a) | | | 40,335,000 | |
| | | | | | | | |
| | | | | | $ | 53,948,600 | |
| | | | ELECTRICAL EQUIPMENT & ELECTRONICS — 3.91% of Total Net Assets | |
| | 200,000 | | | Broadcom, Inc. | | $ | 32,136,000 | |
| | 200,000 | | | Intel Corporation | | | 6,148,000 | |
| | 800,000 | | | NVIDIA Corporation | | | 93,616,000 | |
| | | | | | | | |
| | | | | | $ | 131,900,000 | |
| | | | ENERGY SERVICES & PROCESSING — .63% of Total Net Assets | |
| | 200,000 | | | HF Sinclair Corporation | | $ | 10,294,000 | |
| | 75,000 | | | Phillips 66 | | | 10,911,000 | |
| | | | | | | | |
| | | | | | $ | 21,205,000 | |
| | | | ENGINEERING & CONSTRUCTION — .90% of Total Net Assets | |
| | 175,000 | | | Fluor Corporation (a) | | $ | 8,417,500 | |
| | 125,000 | | | Lennar Corporation Class A | | | 22,116,250 | |
| | | | | | | | |
| | | | | | $ | 30,533,750 | |
Continued on following page.
5
PERMANENT PORTFOLIO®
Schedule of Investments
July 31, 2024 (Unaudited)
| | | | | | | | |
| Number of Shares | | | | | Market Value | |
| | | | ENTERTAINMENT & LEISURE — 2.45% of Total Net Assets | | | | |
| | 65,000 | | | Disney (Walt) Company | | $ | 6,089,850 | |
| | 150,000 | | | Meta Platforms, Inc. Class A | | | 71,224,500 | |
| | 65,000 | | | Wynn Resorts, Ltd. (a) | | | 5,383,300 | |
| | | | | | | | |
| | | | | | $ | 82,697,650 | |
| | | | FINANCIAL SERVICES — 1.64% of Total Net Assets | | | | |
| | 300,000 | | | Affirm Holdings, Inc. Class A (a) | | $ | 8,487,000 | |
| | 175,000 | | | Morgan Stanley | | | 18,061,750 | |
| | 175,000 | | | Schwab (Charles) Corporation | | | 11,408,250 | |
| | 50,000 | | | State Street Corporation | | | 4,248,500 | |
| | 50,000 | | | Visa, Inc. Class A | | | 13,283,500 | |
| | | | | | | | |
| | | | | | $ | 55,489,000 | |
| | | | MANUFACTURING — 1.83% of Total Net Assets | | | | |
| | 60,000 | | | Agilent Technologies, Inc. | | $ | 8,484,000 | |
| | 60,000 | | | Illinois Tool Works, Inc. | | | 14,836,800 | |
| | 60,000 | | | IPG Photonics Corporation (a) | | | 4,824,000 | |
| | 60,000 | | | Parker-Hannifin Corporation | | | 33,669,600 | |
| | | | | | | | |
| | | | | | $ | 61,814,400 | |
| | | | MATERIALS — .48% of Total Net Assets | | | | |
| | 100,000 | | | Nucor Corporation | | $ | 16,294,000 | |
| | | | | | | | |
| | | | | | $ | 16,294,000 | |
| | | | PHARMACEUTICALS — .54% of Total Net Assets | | | | |
| | 55,000 | | | Amgen, Inc. | | $ | 18,285,850 | |
| | | | | | | | |
| | | | | | $ | 18,285,850 | |
| | | | RETAIL — 1.80% of Total Net Assets | | | | |
| | 55,000 | | | Costco Wholesale Corporation | | $ | 45,210,000 | |
| | 100,000 | | | Williams-Sonoma, Inc. | | | 15,468,000 | |
| | | | | | | | |
| | | | | | $ | 60,678,000 | |
| | | | TRANSPORTATION — 1.51% of Total Net Assets | | | | |
| | 150,000 | | | Canadian Pacific Kansas City Limited | | $ | 12,573,000 | |
| | 55,000 | | | FedEx Corporation | | | 16,623,750 | |
| | 75,000 | | | Ryder System, Inc. | | | 10,512,000 | |
| | 175,000 | | | Uber Technologies, Inc. (a) | | | 11,282,250 | |
| | | | | | | | |
| | | | | | $ | 50,991,000 | |
| | | | | | | | |
| | | | Total Aggressive Growth Stocks (identified cost $192,173,060) | | $ | 633,306,450 | |
| | | | | | | | |
Continued on following page.
6
PERMANENT PORTFOLIO®
Schedule of Investments
July 31, 2024 (Unaudited)
| | | | | | | | |
| Principal Amount | | | | | Market Value | |
| | | | DOLLAR ASSETS — 27.55% of Total Net Assets | | | | |
| | |
| | | | CORPORATE BONDS — 25.72% of Total Net Assets | | | | |
| | |
| | | | AEROSPACE — .22% of Total Net Assets | | | | |
| $ | 7,500,000 | | | 2.930% Northrop Grumman Corporation, 01-15-25 | | $ | 7,414,043 | |
| | | | | | | | |
| | | | | | $ | 7,414,043 | |
| | | | CHEMICALS — 1.02% of Total Net Assets | | | | |
| | 10,000,000 | | | 4.650% Albemarle Corporation, 06-01-27 | | $ | 9,924,235 | |
| | 10,000,000 | | | 5.150% FMC Corporation, 05-18-26 | | | 10,015,205 | |
| | 7,500,000 | | | 3.750% RPM International, Inc., 03-15-27 | | | 7,283,411 | |
| | 7,500,000 | | | 3.600% Westlake Corporation, 08-15-26 | | | 7,319,269 | |
| | | | | | | | |
| | | | | | $ | 34,542,120 | |
| | | | COMPUTER SOFTWARE & SERVICES — .99% of Total Net Assets | | | | |
| | 33,500,000 | | | 4.750% Trimble, Inc., 12-01-24 | | $ | 33,321,948 | |
| | | | | | | | |
| | | | | | $ | 33,321,948 | |
| | | | CONSUMER PRODUCTS — 4.18% of Total Net Assets | | | | |
| | 25,000,000 | | | 3.222% B.A.T. Capital Corporation, 08-15-24 | | $ | 24,977,762 | |
| | 15,000,000 | | | 4.600% Conagra Brands, Inc., 11-01-25 | | | 14,902,965 | |
| | 10,000,000 | | | 7.125% Conagra Brands, Inc., 10-01-26 | | | 10,469,005 | |
| | 20,000,000 | | | 3.500% Imperial Brands, p.l.c., 07-26-26 (d) | | | 19,353,850 | |
| | 11,070,000 | | | 2.250% Mondelez International Holdings Netherlands B.V., 09-19-24 (d) | | | 11,010,167 | |
| | 2,810,000 | | | .750% Mondelez International Holdings Netherlands B.V., 09-24-24 (d) | | | 2,787,691 | |
| | 30,000,000 | | | 1.250% Pernod Ricard International Finance, LLC, 04-01-28 (d) | | | 26,557,305 | |
| | 15,000,000 | | | 3.500% Smucker (J. M.) Company, 03-15-25 | | | 14,805,023 | |
| | 5,000,000 | | | 3.375% Smucker (J. M.) Company, 12-15-27 | | | 4,809,265 | |
| | 11,500,000 | | | 2.250% Suntory Holdings, Ltd., 10-16-24 (d) | | | 11,416,964 | |
| | | | | | | | |
| | | | | | $ | 141,089,997 | |
| | | | ELECTRICAL EQUIPMENT & ELECTRONICS — .37% of Total Net Assets | |
| | 12,500,000 | | | 4.625% Avnet, Inc., 04-15-26 | | $ | 12,386,219 | |
| | | | | | | | |
| | | | | | $ | 12,386,219 | |
| | | | ENGINEERING & CONSTRUCTION — 1.01% of Total Net Assets | | | | |
| | 17,500,000 | | | 2.500% D.R. Horton, Inc., 10-15-24 | | $ | 17,383,739 | |
| | 9,313,000 | | | 4.750% Lennar Corporation, 11-29-27 | | | 9,316,059 | |
| | 7,500,000 | | | 5.500% PulteGroup, Inc., 03-01-26 | | | 7,540,793 | |
| | | | | | | | |
| | | | | | $ | 34,240,591 | |
| | | | ENTERTAINMENT & LEISURE — .07% of Total Net Assets | | | | |
| | 2,035,000 | | | 7.625% Disney (Walt) Company, 11-30-28 | | $ | 2,260,215 | |
| | | | | | | | |
| | | | | | $ | 2,260,215 | |
| | | | FINANCIAL SERVICES — 3.32% of Total Net Assets | | | | |
| | 7,500,000 | | | 3.500% Affiliated Managers Group, Inc., 08-01-25 | | $ | 7,365,555 | |
| | 7,500,000 | | | 6.750% AmSouth Bancorporation, 11-01-25 | | | 7,562,989 | |
| | 7,500,000 | | | 4.250% Associated Banc-Corp, 01-15-25 | | | 7,486,237 | |
| | 7,500,000 | | | 3.375% Citadel Finance, LLC, 03-09-26 (d) | | | 7,217,115 | |
| | 10,000,000 | | | 3.750% Intercontinental Exchange, Inc., 12-01-25 | | | 9,855,145 | |
| | 15,000,000 | | | 4.875% Janus Henderson Holdings, Inc., 08-01-25 | | | 14,922,892 | |
| | 15,000,000 | | | 4.700% Key Bank, N.A., 01-26-26 | | | 14,818,320 | |
| | 15,000,000 | | | 5.400% Manufacturers & Traders Trust Company, 11-21-25 | | | 15,041,273 | |
| | 5,000,000 | | | 4.875% Mastercard, Inc., 05-09-34 | | | 5,068,367 | |
| | 8,090,000 | | | 2.250% Regions Financial Corporation, 05-18-25 | | | 7,884,660 | |
| | 15,000,000 | | | .700% UBS Group, AG, 08-09-24 (d) | | | 14,981,460 | |
| | | | | | | | |
| | | | | | $ | 112,204,013 | |
Continued on following page.
7
PERMANENT PORTFOLIO®
Schedule of Investments
July 31, 2024 (Unaudited)
| | | | | | | | |
| Principal Amount | | | | | Market Value | |
| | | | INSURANCE — 1.52% of Total Net Assets | | | | |
| $ | 15,000,000 | | | 3.625% Alleghany Corporation, 05-15-30 | | $ | 14,250,172 | |
| | 5,000,000 | | | 4.500% Brown & Brown, Inc., 03-15-29 | | | 4,917,090 | |
| | 6,785,000 | | | 4.500% Horace Mann Educators Corporation, 12-01-25 | | | 6,687,751 | |
| | 15,000,000 | | | 4.350% Kemper Corporation, 02-15-25 | | | 14,895,000 | |
| | 7,500,000 | | | 4.400% Mercury General Corporation, 03-15-27 | | | 7,323,683 | |
| | 3,500,000 | | | 5.125% SBL Holdings, Inc., 11-13-26 (d) | | | 3,418,329 | |
| | | | | | | | |
| | | | | | $ | 51,492,025 | |
| | | | MANUFACTURING — 1.31% of Total Net Assets | | | | |
| | 15,000,000 | | | 2.750% Alcon Finance Corporation, 09-23-26 (d) | | $ | 14,377,200 | |
| | 10,000,000 | | | 4.625% Kennametal, Inc., 06-15-28 | | | 9,912,170 | |
| | 10,000,000 | | | 4.550% Keysight Technologies, Inc., 10-30-24 | | | 9,961,950 | |
| | 10,000,000 | | | 4.600% Keysight Technologies, Inc., 04-06-27 | | | 9,943,700 | |
| | | | | | | | |
| | | | | | $ | 44,195,020 | |
| | | | MATERIALS— .95% of Total Net Assets | | | | |
| | 8,702,000 | | | 2.500% Martin Marietta Materials, Inc., 03-15-30 | | $ | 7,725,744 | |
| | 7,500,000 | | | 2.400% Steel Dynamics, Inc., 06-15-25 | | | 7,303,125 | |
| | 7,250,000 | | | 4.500% Vulcan Materials Company, 04-01-25 | | | 7,199,943 | |
| | 10,000,000 | | | 3.000% WRKCO, Inc., 09-15-24 | | | 9,960,925 | |
| | | | | | | | |
| | | | | | $ | 32,189,737 | |
| | | | NATURAL RESOURCES — 2.94% of Total Net Assets | | | | |
| | 7,500,000 | | | 4.875% BHP Billiton Finance (USA) Limited, 02-27-26 | | $ | 7,502,047 | |
| | 5,250,000 | | | 3.900% Cimarex Energy Company, 05-15-27 | | | 4,823,081 | |
| | 5,000,000 | | | 4.375% Cimarex Energy Company, 03-15-29 | | | 4,559,297 | |
| | 4,500,000 | | | 3.900% Coterra Energy, Inc., 05-15-27 | | | 4,387,714 | |
| | 10,000,000 | | | 5.875% Devon Energy Corporation, 06-15-28 | | | 10,130,480 | |
| | 10,000,000 | | | 4.050% Mosaic (The) Company, 11-15-27 | | | 9,784,170 | |
| | 7,500,000 | | | 3.000% Nutrien, Ltd., 04-01-25 | | | 7,381,725 | |
| | 7,500,000 | | | 4.000% Nutrien, Ltd., 12-15-26 | | | 7,343,269 | |
| | 17,500,000 | | | 5.650% Ovintiv, Inc., 05-15-25 | | | 17,510,063 | |
| | 15,000,000 | | | 5.375% Ovintiv, Inc., 01-01-26 | | | 15,027,525 | |
| | 6,000,000 | | | 4.125% Parsley Energy, LLC, 02-15-28 (d) | | | 5,808,294 | |
| | 5,000,000 | | | 3.800% Yara International ASA, 06-06-26 (d) | | | 4,893,750 | |
| | | | | | | | |
| | | | | | $ | 99,151,415 | |
| | | | PHARMACEUTICALS — .34% of Total Net Assets | | | | |
| | 5,000,000 | | | 6.800% Bristol-Myers Squibb Company, 11-15-26 | | $ | 5,223,579 | |
| | 6,500,000 | | | 3.250% EMD Finance, LLC, 03-15-25 (d) | | | 6,409,553 | |
| | | | | | | | |
| | | | | | $ | 11,633,132 | |
Continued on following page.
8
PERMANENT PORTFOLIO®
Schedule of Investments
July 31, 2024 (Unaudited)
| | | | | | | | |
| Principal Amount | | | | | Market Value | |
| | | | REAL ESTATE — 4.29% of Total Net Assets | | | | |
| $ | 5,000,000 | | | 3.950% Brandywine Operating Partnership, L.P., 11-15-27 | | $ | 4,622,630 | |
| | 5,000,000 | | | 3.500% Camden Property Trust, 09-15-24 | | | 4,984,065 | |
| | 7,500,000 | | | 5.850% Camden Property Trust, 11-03-26 | | | 7,673,647 | |
| | 7,500,000 | | | 4.100% Camden Property Trust, 10-15-28 | | | 7,317,855 | |
| | 11,000,000 | | | 2.000% COPT Defense Properties, 01-15-29 | | | 9,569,895 | |
| | 15,000,000 | | | 3.125% Cubesmart, L.P., 09-01-26 | | | 14,446,260 | |
| | 5,000,000 | | | 2.625% Equinix, Inc., 11-18-24 | | | 4,956,883 | |
| | 5,000,000 | | | 1.250% Federal Realty Investment Trust, 02-15-26 | | | 4,718,533 | |
| | 7,500,000 | | | 4.125% Highwoods Realty, L.P., 03-15-28 | | | 7,159,830 | |
| | 10,000,000 | | | 3.850% Kimco Realty Corporation, 06-01-25 | | | 9,841,415 | |
| | 5,000,000 | | | 3.600% Regency Centers, L.P., 02-01-27 | | | 4,865,075 | |
| | 5,145,000 | | | 4.125% Regency Centers, L.P., 03-15-28 | | | 5,029,127 | |
| | 7,500,000 | | | 3.700% Regency Centers, L.P., 6-15-30 | | | 7,040,374 | |
| | 15,000,000 | | | 4.000% Retail Opportunity Investments Corporation, 12-15-24 | | | 14,898,870 | |
| | 12,500,000 | | | 3.625% Site Centers Corporation, 02-01-25 | | | 12,406,212 | |
| | 17,500,000 | | | 2.300% Sun Communities Operating Limited Partnership, 11-01-28 | | | 15,586,690 | |
| | 10,000,000 | | | 2.950% UDR, Inc., 09-01-26 | | | 9,587,125 | |
| | | | | | | | |
| | | | | | $ | 144,704,486 | |
| | | | RETAIL — 1.01% of Total Net Assets | | | | |
| | 7,500,000 | | | 1.750% Advance Auto Parts, Inc., 10-01-27 | | $ | 6,641,820 | |
| | 15,000,000 | | | 3.500% AutoNation, Inc., 11-15-24 | | | 14,896,012 | |
| | 5,000,000 | | | 4.500% AutoNation, Inc., 10-01-25 | | | 4,944,190 | |
| | 7,500,000 | | | 4.750% Starbucks Corporation, 02-15-26 | | | 7,492,410 | |
| | | | | | | | |
| | | | | | $ | 33,974,432 | |
| | | | TRANSPORTATION — 1.67% of Total Net Assets | | | | |
| | 7,500,000 | | | 2.875% Canadian Pacific Kansas City Limited, 11-15-29 | | $ | 6,862,462 | |
| | 5,000,000 | | | 3.350% CSX Corporation, 11-01-25 | | | 4,903,753 | |
| | 10,000,000 | | | 4.250% CSX Corporation, 03-15-29 | | | 9,892,960 | |
| | 7,500,000 | | | 3.875% Hunt (J.B.) Transport Services, Inc., 03-01-26 | | | 7,380,019 | |
| | 14,500,000 | | | 4.450% Penske Truck Leasing Company, L.P., 01-29-26 (d) | | | 14,344,132 | |
| | 7,500,000 | | | 2.500% Ryder System, Inc., 09-01-24 | | | 7,474,969 | |
| | 6,000,000 | | | 1.750% Ryder System, Inc., 09-01-26 | | | 5,628,663 | |
| | | | | | | | |
| | | | | | $ | 56,486,958 | |
| | | | UTILITIES — .51% of Total Net Assets | | | | |
| | 10,000,000 | | | 5.200% National Fuel Gas Company, 07-15-25 | | $ | 9,989,650 | |
| | 7,500,000 | | | 3.300% Xcel Energy, Inc., 06-01-25 | | | 7,370,602 | |
| | | | | | | | |
| | | | | | $ | 17,360,252 | |
| | | | | | | | |
| | | | | | $ | 868,646,603 | |
| | | | | | | | |
Continued on following page.
9
PERMANENT PORTFOLIO®
Schedule of Investments
July 31, 2024 (Unaudited)
| | | | | | | | |
| Principal Amount | | | | | Market Value | |
| | | | UNITED STATES TREASURY SECURITIES — 1.83% of Total Net Assets | | | | |
| $ | 12,500,000 | | | United States Treasury bills 5.356%, 09-10-24 (b) | | $ | 12,427,075 | |
| | 15,000,000 | | | United States Treasury bills 5.300%, 11-05-24 (b) | | | 14,795,959 | |
| | 15,000,000 | | | United States Treasury bills 5.125%, 01-23-25 (b) | | | 14,644,417 | |
| | 10,000,000 | | | United States Treasury bonds 1.125%, 01-15-25 | | | 9,822,962 | |
| | 10,000,000 | | | United States Treasury bonds 4.875%, 04-30-26 | | | 10,085,423 | |
| | | | | | | | |
| | | | | | $ | 61,775,836 | |
| | | | | | | | |
| | | | Total Dollar Assets (identified cost $940,397,045) | | $ | 930,422,439 | |
| | | | | | | | |
| | | | Total Portfolio — 99.25% of total net assets (identified cost $2,110,123,042) (e) | | $ | 3,351,670,427 | |
| | | | Other assets, less liabilities (.75% of total net assets) | | | 25,185,048 | |
| | | | | | | | |
| | | | Net assets applicable to outstanding shares | | $ | 3,376,855,475 | |
| | | | | | | | |
| | |
| | | | Notes: | | | | |
| | | | (a) Non-income producing. | | | | |
| | | | (b) Interest rate represents yield to maturity. | | | | |
| | | | (c) Sponsored American Depositary Receipt (ADR). | | | | |
| | | | (d) Security exempt from registration pursuant to Rule 144A under the Securities Act of 1933, as amended, and may be resold in transactions exempt from registration to qualified institutional investors. As of July 31, 2024, these securities amounted to $142,575,810, or 4.22% of Permanent Portfolio’s total net assets, and have been determined by the Portfolio’s investment adviser to be liquid. | | | | |
| | | | (e) Aggregate cost for book and federal income tax purposes are the same. | | | | |
See accompanying notes to financial statements.
10
SHORT-TERM TREASURY PORTFOLIO
Schedule of Investments
July 31, 2024 (Unaudited)
| | | | | | | | |
| Principal Amount | | | | | Market Value | |
| | | | UNITED STATES TREASURY SECURITIES — 99.02% of Total Net Assets | | | | |
| $ | 750,000 | | | United States Treasury bills 4.964%, 08-15-24 (a) | | $ | 748,473 | |
| | 1,400,000 | | | United States Treasury notes 1.250%, 08-31-24 | | | 1,394,997 | |
| | 1,500,000 | | | United States Treasury notes .625%, 10-15-24 | | | 1,486,012 | |
| | 1,300,000 | | | United States Treasury notes 1.500%, 10-31-24 | | | 1,287,890 | |
| | 1,500,000 | | | United States Treasury notes 1.375%, 01-31-25 | | | 1,472,955 | |
| | 1,400,000 | | | United States Treasury notes 2.625%, 04-15-25 | | | 1,378,096 | |
| | 1,300,000 | | | United States Treasury notes 4.125%, 06-15-26 | | | 1,295,676 | |
| | 1,350,000 | | | United States Treasury notes 1.500%, 08-15-26 | | | 1,277,774 | |
| | 1,000,000 | | | United States Treasury notes 4.250%, 03-15-27 | | | 1,003,405 | |
| | | | | | | | |
| | | | Total Portfolio — 99.02% of total net assets
(identified cost $11,371,880)(b) | | $ | 11,345,278 | |
| | | | Other assets, less liabilities (.98% of total net assets) | | | 112,191 | |
| | | | | | | | |
| | | | Net assets applicable to outstanding shares | | $ | 11,457,469 | |
| | | | | | | | |
| | |
| | | | Notes: | | | | |
| | | | (a) Interest rate represents yield to maturity. | | | | |
| | | | (b) Aggregate cost for book and federal income tax purposes are the same. | | | | |
See accompanying notes to financial statements.
11
VERSATILE BOND PORTFOLIO
Schedule of Investments
July 31, 2024 (Unaudited)
| | | | | | | | |
| Principal Amount | | | | | Market Value | |
| | | | CORPORATE BONDS — 88.49% of Total Net Assets | | | | |
| | |
| | | | AEROSPACE— 1.00% of Total Net Assets | | | | |
| $ | 1,000,000 | | | 4.200% Hexcel Corporation, 02-15-27 | | $ | 974,572 | |
| | | | | | | | |
| | | | | | $ | 974,572 | |
| | | | CHEMICALS — 2.02% of Total Net Assets | | | | |
| | 1,000,000 | | | 3.200% FMC Corporation, 10-01-26 | | $ | 960,264 | |
| | 1,000,000 | | | .875% Westlake Corporation, 08-15-24 | | | 997,981 | |
| | | | | | | | |
| | | | | | $ | 1,958,245 | |
| | | | COMPUTER SOFTWARE & SERVICES — 3.56% of Total Net Assets | | | | |
| | 500,000 | | | 1.000% Fortinent, Inc., 03-15-26 | | $ | 469,392 | |
| | 3,000,000 | | | 4.750% Trimble, Inc., 12-01-24 | | | 2,984,055 | |
| | | | | | | | |
| | | | | | $ | 3,453,447 | |
| | | | CONSUMER PRODUCTS — 12.28% of Total Net Assets | | | | |
| | 2,500,000 | | | 3.222% B.A.T. Capital Corporation, 08-15-24 | | $ | 2,497,776 | |
| | 1,000,000 | | | 7.125% Conagra Brands, Inc., 10-01-26 | | | 1,046,901 | |
| | 4,750,000 | | | 3.500% Imperial Brands, p.l.c., 07-26-26 (a) | | | 4,596,539 | |
| | 500,000 | | | 3.350% Johnson (S.C.) & Son, Inc., 09-30-24 (a) | | | 497,840 | |
| | 370,000 | | | .875% Mars, Inc., 07-16-26 (a) | | | 343,792 | |
| | 1,000,000 | | | 3.500% Smucker (J. M.) Company, 03-15-25 | | | 987,002 | |
| | 1,000,000 | | | 3.375% Smucker (J. M.) Company, 12-15-27 | | | 961,853 | |
| | 1,000,000 | | | 2.250% Suntory Holdings, Ltd., 10-16-24 (a) | | | 992,779 | |
| | | | | | | | |
| | | | | | $ | 11,924,482 | |
| | | | ELECTRICAL EQUIPMENT & ELECTRONICS — 1.28% of Total Net Assets | |
| | 1,250,000 | | | 4.625% Avnet, Inc., 04-15-26 | | $ | 1,238,622 | |
| | | | | | | | |
| | | | | | $ | 1,238,622 | |
| | | | ENERGY SERVICES & PROCESSING — 8.10% of Total Net Assets | | | | |
| | 5,543,600 | | | 4.750% El Paso Energy Capital Trust I, 03-31-28 (b) | | $ | 5,233,159 | |
| | 820,000 | | | 5.625% Hess Midstream Operations, LP, 02-15-26 (a) | | | 814,875 | |
| | 564,000 | | | 5.875% HF Sinclair Corporation, 04-01-26 | | | 568,615 | |
| | 1,250,000 | | | 5.000% Oneok, Inc., 03-01-26 | | | 1,249,239 | |
| | | | | | | | |
| | | | | | $ | 7,865,888 | |
| | | | ENGINEERING & CONSTRUCTION — 1.04% of Total Net Assets | | | | |
| | 1,000,000 | | | 5.500% PulteGroup, Inc., 03-01-26 | | $ | 1,005,439 | |
| | | | | | | | |
| | | | | | $ | 1,005,439 | |
| | | | FINANCIAL SERVICES — 8.19% of Total Net Assets | | | | |
| | 1,000,000 | | | 3.500% Affiliated Managers Group, Inc., 08-01-25 | | $ | 982,074 | |
| | 997,500 | | | 6.500% B. Riley Financial, Inc., 09-30-26 | | | 762,090 | |
| | 2,500,000 | | | 4.700% Key Bank, N.A., 01-26-26 | | | 2,469,720 | |
| | 375,000 | | | 4.625% KKR Group Finance Company IX, LLC, 04-01-61 | | | 288,750 | |
| | 3,000,000 | | | 2.900% Manufactuers & Traders Trust Company, 02-06-25 | | | 2,952,377 | |
| | 500,000 | | | 5.900% PNC Bank, N.A., 04-01-26 | | | 500,628 | |
| | | | | | | | |
| | | | | | $ | 7,955,639 | |
Continued on following page.
12
VERSATILE BOND PORTFOLIO
Schedule of Investments
July 31, 2024 (Unaudited)
| | | | | | | | |
| Principal Amount | | | | | Market Value | |
| | | | INSURANCE — 13.21% of Total Net Assets | | | | |
| $ | 500,000 | | | 4.200% Brown & Brown, Inc., 09-15-24 | | $ | 498,960 | |
| | 1,500,000 | | | 4.500% Brown & Brown, Inc., 03-15-29 | | | 1,475,127 | |
| | 2,000,000 | | | 4.550% Globe Life, Inc., 09-15-28 | | | 1,940,095 | |
| | 2,750,000 | | | 4.500% Horace Mann Educators Corporation, 12-01-25 | | | 2,710,584 | |
| | 3,000,000 | | | 4.350% Kemper Corporation, 02-15-25 | | | 2,979,000 | |
| | 1,000,000 | | | 3.750% Loews Corporation, 04-01-26 | | | 982,323 | |
| | 1,750,000 | | | 4.400% Mercury General Corporation, 03-15-27 | | | 1,708,860 | |
| | 750,000 | | | 7.450% Phoenix Companies, Inc., 01-15-32 | | | 532,500 | |
| | | | | | | | |
| | | | | | $ | 12,827,449 | |
| | | | MANUFACTURING — 7.27% of Total Net Assets | | | | |
| | 375,000 | | | 8.125% Babcock & Wilcox Enterprises, Inc., 02-28-26 | | $ | 332,100 | |
| | 3,000,000 | | | 4.625% Kennametal, Inc., 06-15-28 | | | 2,973,651 | |
| | 1,000,000 | | | 4.550% Keysight Technologies, Inc., 10-30-24 | | | 996,195 | |
| | 2,000,000 | | | 4.600% Keysight Technologies, Inc., 04-06-27 | | | 1,988,740 | |
| | 750,000 | | | 5.600% Nordson Corporation, 09-15-28 | | | 771,925 | |
| | | | | | | | |
| | | | | | $ | 7,062,611 | |
| | | | MATERIALS — 1.02% of Total Net Assets | | | | |
| | 1,000,000 | | | 2.800% Steel Dynamics, Inc., 12-15-24 | | $ | 989,375 | |
| | | | | | | | |
| | | | | | $ | 989,375 | |
| | | | NATURAL RESOURCES — 8.05% of Total Net Assets | | | | |
| | 1,000,000 | | | 3.900% Cimarex Energy Company, 05-15-27 | | $ | 918,682 | |
| | 500,000 | | | 1.625% Glencore Funding, LLC, 09-01-25 (a) | | | 480,243 | |
| | 3,000,000 | | | 5.650% Ovintiv, Inc., 05-15-25 | | | 3,001,725 | |
| | 1,000,000 | | | 5.375% Ovintiv, Inc., 01-01-26 | | | 1,001,835 | |
| | 2,500,000 | | | 4.125% Parsley Energy, LLC, 02-15-28 (a) | | | 2,420,122 | |
| | | | | | | | |
| | | | | | $ | 7,822,607 | |
| | | | REAL ESTATE— 13.41% of Total Net Assets | | | | |
| | 1,250,000 | | | 4.100% Camden Property Trust, 10-15-28 | | $ | 1,219,643 | |
| | 1,100,000 | | | 2.000% COPT Defense Properties, 01-15-29 | | | 956,990 | |
| | 1,250,000 | | | 3.125% Cubesmart, L.P., 09-01-26 | | | 1,203,855 | |
| | 750,000 | | | 2.250% Cubesmart, L.P., 12-15-28 | | | 674,775 | |
| | 538,000 | | | 3.375% Duke Realty, L.P., 12-15-27 | | | 503,706 | |
| | 500,000 | | | 7.600% First Industrial, L.P., 07-15-28 | | | 534,503 | |
| | 1,250,000 | | | 3.850% Kimco Realty Corporation, 06-01-25 | | | 1,230,177 | |
| | 1,250,000 | | | 3.250% Kimco Realty Corporation, 08-15-26 | | | 1,204,337 | |
| | 500,000 | | | 1.900% Kimco Realty Corporation, 03-01-28 | | | 453,932 | |
| | 1,000,000 | | | 3.600% Regency Centers, L.P., 02-01-27 | | | 973,015 | |
| | 1,000,000 | | | 3.700% Regency Centers, L.P., 06-15-30 | | | 938,716 | |
| | 2,250,000 | | | 4.000% Retail Opportunity Investments Corporation, 12-15-24 | | | 2,234,831 | |
| | 1,000,000 | | | 2.300% Sun Communities Operating Limited Partnership, 11-01-28 | | | 890,668 | |
| | | | | | | | |
| | | | | | $ | 13,019,148 | |
| | | | RETAIL — 2.56% of Total Net Assets | | | | |
| | 2,500,000 | | | 3.500% AutoNation, Inc., 11-15-24 | | $ | 2,482,669 | |
| | | | | | | | |
| | | | | | $ | 2,482,669 | |
| | | | TRANSPORTATION — 2.23% of Total Net Assets | | | | |
| | 1,083,000 | | | 6.700% Burlington Northern Santa Fe, LLC, 08-01-28 | | $ | 1,169,770 | |
| | 500,000 | | | 4.250% CSX Corporation, 03-15-29 | | | 494,648 | |
| | 500,000 | | | 2.500% Ryder System, Inc., 09-01-24 | | | 498,331 | |
| | | | | | | | |
| | | | | | $ | 2,162,749 | |
Continued on following page.
13
VERSATILE BOND PORTFOLIO
Schedule of Investments
July 31, 2024 (Unaudited)
| | | | | | | | |
| Principal Amount | | | | | Market Value | |
| | | | UTILITIES — 1.45% of Total Net Assets | | | | |
| $ | 498,000 | | | 3.600% Eastern Gas Transmission & Storage, Inc., 12-15-24 | | $ | 492,903 | |
| | 500,000 | | | 7.375% National Fuel Gas Company, 06-13-25 | | | 506,447 | |
| | 415,000 | | | 3.508% Niagara Mohawk Power Corporation, 10-01-24 (a) | | | 413,006 | |
| | | | | | | | |
| | | | | | $ | 1,412,356 | |
| | | | WASTE & ENVIRONMENTAL SERVICES — 1.82% of Total Net Assets | | | | |
| | 1,750,000 | | | 4.875% Republic Services, Inc., 04-01-29 | | $ | 1,768,372 | |
| | | | | | | | |
| | | | | | $ | 1,768,372 | |
| | | | | | | | |
| | | | Total Corporate Bonds (identified cost $87,677,552) | | $ | 85,923,670 | |
| | | | | | | | |
| | | | | | | | |
| Number of Shares | | | | | | |
| | | | PREFERRED STOCKS — 10.02% of Total Net Assets | | | | |
| |
| | | | COMMUNICATIONS SERVICES — 2.47% of Total Net Assets | |
| | 45,000 | | | 7.125% DigitalBridge Group, Inc., Preferred Class H (c) | | $ | 1,014,750 | |
| | 45,000 | | | 7.125% DigitalBridge Group, Inc., Preferred Class J (c) | | | 1,036,800 | |
| | 20,000 | | | 6.000% Telephone & Data Systems, Inc., Preferred Class VV (c) | | | 345,200 | |
| | | | | | | | |
| | | | | | $ | 2,396,750 | |
| | | | FINANCIAL SERVICES — 3.91% of Total Net Assets | | | | |
| | 15,000 | | | 5.625% Associated Banc-Corp, Preferred Class F (d) | | $ | 304,800 | |
| | 50,000 | | | 5.000% Capital One Financial Corporation, Preferred Class I (d) | | | 976,500 | |
| | 40,721 | | | 7.875% Compass Diversified Holdings, Preferred Class C (c) | | | 1,014,360 | |
| | 10,000 | | | 2.900% Manufacturers & Traders Trust Company, Preferred Class J (d) | | | 263,100 | |
| | 15,000 | | | 6.000% Merchants Bancorp, Preferred Class C (d) | | | 320,550 | |
| | 15,000 | | | 4.450% Schwab (Charles) Corporation, Preferred Class J (d) | | | 302,700 | |
| | 37,500 | | | 4.875% WaFD, Inc., Preferred Class A (d) | | | 618,750 | |
| | | | | | | | |
| | | | | | $ | 3,800,760 | |
| | | | INSURANCE — .43% of Total Net Assets | | | | |
| | 500,000 | | | 6.500% SBL Holdings, Inc., Perpetual Hybrid Subordinated (a)(c)(e) | | $ | 417,500 | |
| | | | | | | | |
| | | | | | $ | 417,500 | |
| | | | REAL ESTATE — 3.21% of Total Net Assets | | | | |
| | 45,000 | | | 6.375% CTO Realty Growth, Inc., Preferred Class A (c) | | $ | 983,700 | |
| | 65,000 | | | 6.250% Regency Centers Corporation, Preferred Class A (c) | | | 1,436,500 | |
| | 30,000 | | | 5.875% Regency Centers Corporation, Preferred Class B (c) | | | 697,500 | |
| | | | | | | | |
| | | | | | $ | 3,117,700 | |
| | | | | | | | |
| | | | Total Preferred Stocks (identified cost $10,963,526) | | $ | 9,732,710 | |
| | | | | | | | |
| | | | | | | | |
| Principal Amount | | | | | | |
| | | | UNITED STATES TREASURY SECURITIES — .51% of Total Net Assets | | | | |
| | 500,000 | | | United States Treasury bills 4.964%, 08-15-24 (f) | | $ | 498,982 | |
| | | | | | | | |
| | | | Total United States Treasury Securities (identified cost $498,972) | | $ | 498,982 | |
| | | | | | | | |
| | | | Total Portfolio — 99.02% of total net assets
(identified cost $99,140,050) (g) | | $ | 96,155,362 | |
| | | | Other assets, less liabilities (.98% of total net assets) | | | 954,994 | |
| | | | | | | | |
| | | | Net assets applicable to outstanding shares | | $ | 97,110,356 | |
| | | | | | | | |
Continued on following page.
14
VERSATILE BOND PORTFOLIO
Schedule of Investments
July 31, 2024 (Unaudited)
| | | | | | | | |
| | | | Notes: | | | | |
| | | | (a) Security exempt from registration pursuant to Rule 144A under the Securities Act of 1933, as amended, and may be resold in transactions exempt from registration to qualified institutional investors. As of July 31, 2024, these securities amounted to $10,976,696, or 11.30% of Versatile Bond Portfolio’s total net assets, and have been determined by the Portfolio’s investment adviser to be liquid. | | | | |
| | | | (b) Convertible security. | | | | |
| | | | (c) Cumulative, perpetual preferred stock. | | | | |
| | | | (d) Non-cumulative, perpetual preferred stock. | | | | |
| | | | (e) Variable or floating rate security whereby the interest rate is periodically reset. The interest rate shown reflects the rate in effect as of July 31, 2024. | | | | |
| | | | (f) Interest rate represents yield to maturity. | | | | |
| | | | (g) Aggregate cost for book and federal income tax purposes are the same. | | | | |
See accompanying notes to financial statements.
15
AGGRESSIVE GROWTH PORTFOLIO
Schedule of Investments
July 31, 2024 (Unaudited)
| | | | | | | | |
| Number of Shares | | | | | Market Value | |
| | | | AGGRESSIVE GROWTH STOCKS — 97.40% of Total Net Assets | | | | |
| | |
| | | | AEROSPACE — 3.92% of Total Net Assets | | | | |
| | 3,000 | | | Lockheed Martin Corporation | | $ | 1,625,760 | |
| | | | | | | | |
| | | | | | $ | 1,625,760 | |
| | | | CHEMICALS — 3.04% of Total Net Assets | | | | |
| | 3,000 | | | Air Products & Chemicals, Inc. | | $ | 791,550 | |
| | 5,000 | | | Albemarle Corporation | | | 468,350 | |
| | | | | | | | |
| | | | | | $ | 1,259,900 | |
| | | | COMPUTER SOFTWARE & SERVICES — 6.66% of Total Net Assets | | | | |
| | 3,000 | | | Autodesk, Inc. (a) | | $ | 742,560 | |
| | 75,000 | | | Palantir Technologies, Inc. Class A (a) | | | 2,016,750 | |
| | | | | | | | |
| | | | | | $ | 2,759,310 | |
| | | | ELECTRICAL EQUIPMENT & ELECTRONICS — 25.42% of Total Net Assets | |
| | 20,000 | | | Broadcom, Inc. | | $ | 3,213,600 | |
| | 10,000 | | | Intel Corporation | | | 307,400 | |
| | 60,000 | | | NVIDIA Corporation | | | 7,021,200 | |
| | | | | | | | |
| | | | | | $ | 10,542,200 | |
| | | | ENERGY SERVICES & PROCESSING — 1.86% of Total Net Assets | | | | |
| | 15,000 | | | HF Sinclair Corporation | | $ | 772,050 | |
| | | | | | | | |
| | | | | | $ | 772,050 | |
| | | | ENGINEERING & CONSTRUCTION — 3.29% of Total Net Assets | | | | |
| | 10,000 | | | Fluor Corporation (a) | | $ | 481,000 | |
| | 5,000 | | | Lennar Corporation Class A | | | 884,650 | |
| | | | | | | | |
| | | | | | $ | 1,365,650 | |
| | | | ENTERTAINMENT & LEISURE — 7.85% of Total Net Assets | | | | |
| | 5,000 | | | Disney (Walt) Company | | $ | 468,450 | |
| | 5,000 | | | Meta Platforms, Inc. Class A | | | 2,374,150 | |
| | 5,000 | | | Wynn Resorts, Ltd. (a) | | | 414,100 | |
| | | | | | | | |
| | | | | | $ | 3,256,700 | |
| | | | FINANCIAL SERVICES — 8.03% of Total Net Assets | | | | |
| | 15,000 | | | Affirm Holdings, Inc. Class A (a) | | $ | 424,350 | |
| | 10,000 | | | Morgan Stanley | | | 1,032,100 | |
| | 10,000 | | | Schwab (Charles) Corporation | | | 651,900 | |
| | 5,000 | | | State Street Corporation | | | 424,850 | |
| | 3,000 | | | Visa, Inc. Class A | | | 797,010 | |
| | | | | | | | |
| | | | | | $ | 3,330,210 | |
| | | | MANUFACTURING — 7.99% of Total Net Assets | | | | |
| | 4,000 | | | Agilent Technologies, Inc. | | $ | 565,600 | |
| | 3,000 | | | Illinois Tool Works, Inc. | | | 741,840 | |
| | 4,000 | | | IPG Photonics Corporation (a) | | | 321,600 | |
| | 3,000 | | | Parker-Hannifin Corporation | | | 1,683,480 | |
| | | | | | | | |
| | | | | | $ | 3,312,520 | |
| | | | MATERIALS — 1.18% of Total Net Assets | | | | |
| | 3,000 | | | Nucor Corporation | | $ | 488,820 | |
| | | | | | | | |
| | | | | | $ | 488,820 | |
Continued on following page.
16
AGGRESSIVE GROWTH PORTFOLIO
Schedule of Investments
July 31, 2024 (Unaudited)
| | | | | | | | |
| Number of Shares | | | | | Market Value | |
| | | | NATURAL RESOURCES — 11.61% of Total Net Assets | | | | |
| | 100,000 | | | Birchcliff Energy, Ltd. | | $ | 433,000 | |
| | 75,000 | | | Freeport-McMoRan, Inc. | | | 3,405,750 | |
| | 10,000 | | | Nutrien, Ltd. | | | 512,000 | |
| | 10,000 | | | Ovintiv, Inc. | | | 464,400 | |
| | | | | | | | |
| | | | | | $ | 4,815,150 | |
| | | | PHARMACEUTICALS — 2.41% of Total Net Assets | | | | |
| | 3,000 | | | Amgen, Inc. | | $ | 997,410 | |
| | | | | | | | |
| | | | | | $ | 997,410 | |
| | | | RETAIL — 7.70% of Total Net Assets | | | | |
| | 2,000 | | | Costco Wholesale Corporation | | $ | 1,644,000 | |
| | 10,000 | | | Williams-Sonoma, Inc. | | | 1,546,800 | |
| | | | | | | | |
| | | | | | $ | 3,190,800 | |
| | | | TRANSPORTATION — 6.44% of Total Net Assets | | | | |
| | 5,000 | | | Canadian Pacific Kansas City Limited | | $ | 419,100 | |
| | 3,000 | | | FedEx Corporation | | | 906,750 | |
| | 5,000 | | | Ryder System, Inc. | | | 700,800 | |
| | 10,000 | | | Uber Technologies, Inc. (a) | | | 644,700 | |
| | | | | | | | |
| | | | | | $ | 2,671,350 | |
| | | | | | | | |
| | | | Total Aggressive Growth Stocks (identified cost $11,000,585) | | $ | 40,387,830 | |
| | | | | | | | |
| Principal Amount | | | | | | |
| | | | UNITED STATES TREASURY SECURITIES — 2.40% of Total Net Assets | | | | |
| $ | 1,000,000 | | | United States Treasury bills 5.151%, 08-29-24 (b) | | $ | 995,924 | |
| | | | | | | | |
| | | | Total United States Treasury Securities (identified cost $995,924) | | $ | 995,924 | |
| | | | | | | | |
| | | | Total Portfolio — 99.80% of total net assets
(identified cost $11,996,509) (c) | | $ | 41,383,754 | |
| | | | Other assets, less liabilities (.20% of total net assets) | | | 81,375 | |
| | | | | | | | |
| | | | Net assets applicable to outstanding shares | | $ | 41,465,129 | |
| | | | | | | | |
| | |
| | | | Notes: | | | | |
| | | | (a) Non-income producing. | | | | |
| | | | (b) Interest rate represents yield to maturity. | | | | |
| | | | (c) Aggregate cost for book and federal income tax purposes are the same. | | | | |
See accompanying notes to financial statements.
17
STATEMENTS OF ASSETS AND LIABILITIES
July 31, 2024 (Unaudited)
| | | | | | | | | | | | | | | | |
| | | Permanent
Portfolio® | | | Short-Term
Treasury
Portfolio | | | Versatile
Bond
Portfolio | | | Aggressive
Growth
Portfolio | |
ASSETS | | | | | | | | | | | | | | | | |
Investments at market value (Notes 1, 5 & 6): | | | | | | | | | | | | | | | | |
Investments other than securities: | | | | | | | | | | | | | | | | |
Gold assets (identified cost $328,396,837; $—; $— and $—, respectively) | | $ | 749,878,791 | | | $ | — | | | $ | — | | | $ | — | |
Silver assets (identified cost $92,215,771; $—; $— and $—, respectively) | | | 174,342,194 | | | | — | | | | — | | | | — | |
Swiss franc deposits (identified cost $566,052; $—; $— and $—, respectively) | | | 569,824 | | | | — | | | | — | | | | — | |
| | | | | | | | | | | | | | | | |
| | | 924,790,809 | | | | — | | | | — | | | | — | |
Swiss franc bonds | | | 262,340,929 | | | | — | | | | — | | | | — | |
Real estate and natural resource stocks | | | 600,809,800 | | | | — | | | | — | | | | — | |
Aggressive growth stocks | | | 633,306,450 | | | | — | | | | — | | | | 40,387,830 | |
Corporate bonds | | | 868,646,603 | | | | — | | | | 85,923,670 | | | | — | |
Preferred stocks | | | — | | | | — | | | | 9,732,710 | | | | — | |
United States Treasury securities | | | 61,775,836 | | | | 11,345,278 | | | | 498,982 | | | | 995,924 | |
| | | | | | | | | | | | | | | | |
Total investments (identified cost $2,110,123,042; $11,371,880; $99,140,050 and $11,996,509, respectively) | | | 3,351,670,427 | | | | 11,345,278 | | | | 96,155,362 | | | | 41,383,754 | |
Cash | | | 8,366,039 | | | | 53,082 | | | | 4,994 | | | | — | |
Accounts receivable for shares of the portfolio sold | | | 3,709,394 | | | | 6,211 | | | | 109,469 | | | | 175,343 | |
Accrued dividends receivable | | | 799,725 | | | | — | | | | — | | | | 35,450 | |
Accrued interest receivable | | | 9,065,396 | | | | 58,203 | | | | 928,267 | | | | — | |
Accrued foreign taxes receivable | | | 6,784,718 | | | | — | | | | — | | | | — | |
Prepaid expenses | | | 194,334 | | | | 729 | | | | 4,053 | | | | 2,991 | |
| | | | | | | | | | | | | | | | |
Total assets | | | 3,380,590,033 | | | | 11,463,503 | | | | 97,202,145 | | | | 41,597,538 | |
| | | | |
LIABILITIES | | | | | | | | | | | | | | | | |
Bank overdraft | | | — | | | | — | | | | — | | | | 87,813 | |
Accounts payable for shares of the portfolio redeemed | | | 1,082,342 | | | | — | | | | 29,820 | | | | — | |
Accrued investment advisory fees | | | 2,230,601 | | | | 6,034 | | | | 51,291 | | | | 41,715 | |
Accrued distribution and service fees | | | 421,615 | | | | — | | | | 10,678 | | | | 2,881 | |
| | | | | | | | | | | | | | | | |
Total liabilities | | | 3,734,558 | | | | 6,034 | | | | 91,789 | | | | 132,409 | |
| | | | | | | | | | | | | | | | |
NET ASSETS | | $ | 3,376,855,475 | | | $ | 11,457,469 | | | $ | 97,110,356 | | | $ | 41,465,129 | |
| | | | | | | | | | | | | | | | |
Continued on following page.
18
STATEMENTS OF ASSETS AND LIABILITIES
July 31, 2024 (Unaudited)
| | | | | | | | | | | | | | | | |
| | | Permanent
Portfolio® | | | Short-Term
Treasury
Portfolio | | | Versatile
Bond
Portfolio | | | Aggressive
Growth
Portfolio | |
COMPONENTS OF NET ASSETS | | | | | | | | | | | | | | | | |
Capital stock | | $ | 58,615 | | | $ | 174 | | | $ | 1,495 | | | $ | 446 | |
Paid-in capital | | | 2,074,460,299 | | | | 11,282,713 | | | | 100,541,002 | | | | 9,281,742 | |
| | | | | | | | | | | | | | | | |
| | | 2,074,518,914 | | | | 11,282,887 | | | | 100,542,497 | | | | 9,282,188 | |
Total distributable earnings (deficit) | | | 1,302,336,561 | | | | 174,582 | | | | (3,432,141 | ) | | | 32,182,941 | |
| | | | | | | | | | | | | | | | |
NET ASSETS APPLICABLE TO OUTSTANDING SHARES | | $ | 3,376,855,475 | | | $ | 11,457,469 | | | $ | 97,110,356 | | | $ | 41,465,129 | |
| | | | | | | | | | | | | | | | |
| | | | |
COMPUTATION OF NET ASSETS | | | | | | | | | | | | | | | | |
| | | | |
CLASS I SHARES | | | | | | | | | | | | | | | | |
Net assets applicable to outstanding shares | | $ | 3,293,628,089 | | | $ | 11,457,469 | | | $ | 95,513,952 | | | $ | 40,453,002 | |
Shares outstanding | | | 57,136,538 | | | | 173,877 | | | | 1,469,447 | | | | 435,019 | |
Net asset value and redemption proceeds per share | | $ | 57.64 | | | $ | 65.89 | | | $ | 65.00 | | | $ | 92.99 | |
| | | | |
CLASS A SHARES | | | | | | | | | | | | | | | | |
Net assets applicable to outstanding shares | | $ | 38,410,677 | | | $ | — | | | $ | 76,070 | | | $ | 507,941 | |
Shares outstanding | | | 670,236 | | | | — | | | | 1,175 | | | | 5,495 | |
Net asset value per share | | $ | 57.31 | | | $ | — | | | $ | 64.76 | | | $ | 92.44 | |
Offering price per share (NAV per share plus maximum sales charge) (1) | | $ | 60.33 | | | $ | — | | | $ | 67.46 | | | $ | 97.31 | |
| | | | |
CLASS C SHARES | | | | | | | | | | | | | | | | |
Net assets applicable to outstanding shares | | $ | 44,816,709 | | | $ | — | | | $ | 1,520,334 | | | $ | 504,186 | |
Shares outstanding | | | 808,368 | | | | — | | | | 23,969 | | | | 5,867 | |
Net asset value per share | | $ | 55.44 | | | $ | — | | | $ | 63.43 | | | $ | 85.93 | |
Redemption proceeds per share (NAV per share less maximum contingent deferred sales charge) (2) | | $ | 54.89 | | | $ | — | | | $ | 62.80 | | | $ | 85.07 | |
| (1) | Maximum sales charge for Class A shares of 5.00% in Permanent Portfolio and Aggressive Growth Portfolio, and 4.00% in Versatile Bond Portfolio. |
| (2) | Maximum contingent deferred sales charge (CDSC) is 1.00% for Class C shares. The CDSC is eliminated one year after purchase. |
See accompanying notes to financial statements.
19
[THIS PAGE INTENTIONALLY LEFT BLANK]
20
STATEMENTS OF OPERATIONS
Six Months Ended July 31, 2024 (Unaudited)
| | | | | | | | | | | | | | | | |
| | | Permanent
Portfolio® | | | Short-Term
Treasury
Portfolio | | | Versatile
Bond
Portfolio | | | Aggressive
Growth
Portfolio | |
INVESTMENT INCOME (Note 1) | | | | | | | | | | | | | | | | |
Interest | | $ | 17,587,084 | | | $ | 197,641 | | | $ | 1,597,779 | | | $ | 471 | |
Dividends | | | 12,787,985 | | | | — | | | | 566,340 | | | | 245,183 | |
| | | | | | | | | | | | | | | | |
| | | 30,375,069 | | | | 197,641 | | | | 2,164,119 | | | | 245,654 | |
EXPENSES (Notes 3 & 4) | | | | | | | | | | | | | | | | |
Investment advisory fee | | | 12,417,552 | | | | 67,585 | | | | 573,018 | | | | 226,957 | |
Trustees’ fees and expenses | | | 354,353 | | | | 1,274 | | | | 12,746 | | | | 3,876 | |
Legal expense | | | 47,009 | | | | 183 | | | | 1,529 | | | | 510 | |
Distribution and service fees—Class A | | | 55,370 | | | | — | | | | 93 | | | | 344 | |
Distribution and service fees—Class C | | | 203,443 | | | | — | | | | 7,021 | | | | 1,763 | |
| | | | | | | | | | | | | | | | |
Total expenses | | | 13,077,727 | | | | 69,042 | | | | 594,407 | | | | 233,450 | |
Less waiver of investment advisory fee | | | — | | | | (32,014 | ) | | | (271,430 | ) | | | — | |
| | | | | | | | | | | | | | | | |
Net expenses | | | 13,077,727 | | | | 37,028 | | | | 322,977 | | | | 233,450 | |
| | | | | | | | | | | | | | | | |
Net investment income before foreign income taxes deducted at source | | | 17,297,342 | | | | 160,613 | | | | 1,841,142 | | | | 12,204 | |
Less foreign income taxes deducted at source, net of refundable taxes | | | (109,734 | ) | | | — | | | | — | | | | (4,034 | ) |
| | | | | | | | | | | | | | | | |
NET INVESTMENT INCOME | | | 17,187,608 | | | | 160,613 | | | | 1,841,142 | | | | 8,170 | |
| | | | | | | | | | | | | | | | |
| | | | |
NET REALIZED AND UNREALIZED GAIN ON INVESTMENTS AND FOREIGN CURRENCY (Notes 1, 5 & 6) | | | | | | | | | | | | | | | | |
| | | | |
Net realized gain (loss) on: | | | | | | | | | | | | | | | | |
Investments in securities | | | 53,333,035 | | | | (8,148 | ) | | | (265,118 | ) | | | 241,674 | |
Foreign currency transactions | | | 700,190 | | | | — | | | | — | | | | (20 | ) |
| | | | | | | | | | | | | | | | |
| | | 54,033,225 | | | | (8,148 | ) | | | (265,118 | ) | | | 241,654 | |
Change in unrealized appreciation (depreciation) of: | | | | | | | | | | | | | | | | |
Investments | | | 319,877,613 | | | | 95,106 | | | | 1,032,722 | | | | 7,203,468 | |
Translation of assets and liabilities in foreign currencies | | | (251,419 | ) | | | — | | | | — | | | | — | |
| | | | | | | | | | | | | | | | |
NET REALIZED AND UNREALIZED GAIN ON INVESTMENTS AND FOREIGN CURRENCY | | | 373,659,419 | | | | 86,958 | | | | 767,604 | | | | 7,445,122 | |
| | | | | | | | | | | | | | | | |
NET INCREASE IN NET ASSETS RESULTING FROM OPERATIONS | | $ | 390,847,027 | | | $ | 247,571 | | | $ | 2,608,746 | | | $ | 7,453,292 | |
| | | | | | | | | | | | | | | | |
See accompanying notes to financial statements.
21
STATEMENTS OF CHANGES IN NET ASSETS
| | | | | | | | |
| | | Permanent Portfolio® | |
| | | Six Months Ended
July 31, 2024
(Unaudited) | | | Year Ended
January 31, 2024 | |
OPERATIONS | | | | | | | | |
Net investment income | | $ | 17,187,608 | | | $ | 24,122,119 | |
Net realized gain (loss) on investments in securities | | | 53,333,035 | | | | (5,047,146 | ) |
Net realized gain on investments other than securities | | | — | | | | 5,756,650 | |
Net realized gain (loss) on foreign currency transactions | | | 700,190 | | | | (189,093 | ) |
Change in unrealized appreciation of investments | | | 319,877,613 | | | | 155,251,699 | |
Change in unrealized appreciation (depreciation) on translation of assets and liabilities in foreign currencies | | | (251,419 | ) | | | 326,758 | |
| | | | | | | | |
Net increase in net assets resulting from operations | | | 390,847,027 | | | | 180,220,987 | |
| | | | | | | | |
| | |
DISTRIBUTIONS TO SHAREHOLDERS (Note 2) | | | | | | | | |
Class I | | | — | | | | (39,747,346 | ) |
Class A | | | — | | | | (603,279 | ) |
Class C | | | — | | | | (287,324 | ) |
| | | | | | | | |
Total distributions to shareholders | | | — | | | | (40,637,949 | ) |
| | | | | | | | |
| | |
CAPITAL STOCK TRANSACTIONS | | | | | | | | |
Shares sold | | | | | | | | |
Class I | | | 292,326,664 | | | | 411,894,631 | |
Class A | | | 8,833,372 | | | | 24,462,028 | |
Class C | | | 5,587,900 | | | | 4,955,585 | |
Distributions reinvested | | | | | | | | |
Class I | | | — | | | | 30,941,706 | |
Class A | | | — | | | | 499,771 | |
Class C | | | — | | | | 228,450 | |
Shares redeemed | | | | | | | | |
Class I | | | (233,133,815 | ) | | | (599,096,886 | ) |
Class A | | | (20,250,880 | ) | | | (17,125,088 | ) |
Class C | | | (2,984,395 | ) | | | (5,974,294 | ) |
| | | | | | | | |
Net increase (decrease) from capital stock transactions | | | 50,378,846 | | | | (149,214,097 | ) |
| | | | | | | | |
NET INCREASE (DECREASE) IN NET ASSETS | | | 441,225,873 | | | | (9,631,059 | ) |
| | |
NET ASSETS AT BEGINNING OF PERIOD | | | 2,935,629,602 | | | | 2,945,260,661 | |
| | | | | | | | |
NET ASSETS AT END OF PERIOD | | $ | 3,376,855,475 | | | $ | 2,935,629,602 | |
| | | | | | | | |
| | | | | | | | |
| | |
SHARE TRANSACTIONS | | | | | | | | |
Shares sold | | | | | | | | |
Class I | | | 5,301,764 | | | | 8,465,425 | |
Class A | | | 160,833 | | | | 513,743 | |
Class C | | | 104,224 | | | | 105,520 | |
Distributions reinvested | | | | | | | | |
Class I | | | — | | | | 627,875 | |
Class A | | | — | | | | 10,185 | |
Class C | | | — | | | | 4,789 | |
Shares redeemed | | | | | | | | |
Class I | | | (4,292,431 | ) | | | (12,373,674 | ) |
Class A | | | (365,560 | ) | | | (348,699 | ) |
Class C | | | (56,607 | ) | | | (127,850 | ) |
| | | | | | | | |
INCREASE (DECREASE) IN SHARES OUTSTANDING | | | 852,223 | | | | (3,122,686 | ) |
| | | | | | | | |
Continued on following page.
22
| | | | | | | | | | | | | | | | | | | | | | |
| Short-Term Treasury Portfolio | | | Versatile Bond Portfolio | | | Aggressive Growth Portfolio | |
Six Months Ended
July 31, 2024
(Unaudited) | | | Year Ended
January 31, 2024 | | | Six Months Ended
July 31, 2024
(Unaudited) | | | Year Ended
January 31, 2024 | | | Six Months Ended
July 31, 2024
(Unaudited) | | | Year Ended
January 31, 2024 | |
| | | | | | | | | | | | | | | | | | | | | | |
| $ | 160,613 | | | $ | 225,814 | | | $ | 1,841,142 | | | $ | 3,137,577 | | | $ | 8,170 | | | $ | 150,238 | |
| | (8,148 | ) | | | (41,792 | ) | | | (265,118 | ) | | | (164,665 | ) | | | 241,674 | | | | 3,401,955 | |
| | — | | | | — | | | | — | | | | — | | | | — | | | | — | |
| | — | | | | — | | | | — | | | | — | | | | (20 | ) | | | 340 | |
| | 95,106 | | | | 211,277 | | | | 1,032,722 | | | | 1,485,212 | | | | 7,203,468 | | | | 3,654,421 | |
|
— |
| | | — | | | | — | | | | — | | | | — | | | | — | |
| | | | | | | | | | | | | | | | | | | | | | |
| | 247,571 | | | | 395,299 | | | | 2,608,746 | | | | 4,458,124 | | | | 7,453,292 | | | | 7,206,954 | |
| | | | | | | | | | | | | | | | | | | | | | |
| | | | | |
| | | | | | | | | | | | | | | | | | | | | | |
| | — | | | | (201,014 | ) | | | — | | | | (2,738,215 | ) | | | — | | | | (1,015,957 | ) |
| | — | | | | — | | | | — | | | | (2,897 | ) | | | — | | | | (2,888 | ) |
| | — | | | | — | | | | — | | | | (26,714 | ) | | | — | | | | (5,780 | ) |
| | | | | | | | | | | | | | | | | | | | | | |
| | — | | | | (201,014 | ) | | | — | | | | (2,767,826 | ) | | | — | | | | (1,024,625 | ) |
| | | | | | | | | | | | | | | | | | | | | | |
| | | | | |
| | | | | | | | | | | | | | | | | | | | | | |
| | | | | | | | | | | | | | | | | | | | | | |
| | 677,742 | | | | 2,228,668 | | | | 13,221,507 | | | | 40,527,502 | | | | 2,998,070 | | | | 7,107,105 | |
| | — | | | | — | | | | — | | | | 5,856 | | | | 283,145 | | | | 73,080 | |
| | — | | | | — | | | | 387,354 | | | | 916,168 | | | | 236,538 | | | | 54,670 | |
| | | | | | | | | | | | | | | | | | | | | | |
| | — | | | | 186,925 | | | | — | | | | 2,605,975 | | | | — | | | | 962,240 | |
| | — | | | | — | | | | — | | | | 2,539 | | | | — | | | | 2,887 | |
| | — | | | | — | | | | — | | | | 26,714 | | | | — | | | | 5,780 | |
| | | | | | | | | | | | | | | | | | | | | | |
| | (1,205,895 | ) | | | (2,938,703 | ) | | | (15,184,139 | ) | | | (37,998,163 | ) | | | (3,018,894 | ) | | | (10,797,645 | ) |
| | — | | | | — | | | | — | | | | (71,476 | ) | | | (2,754 | ) | | | (5,798 | ) |
| | — | | | | — | | | | (19,802 | ) | | | (547,880 | ) | | | (6,000 | ) | | | (1,811 | ) |
| | | | | | | | | | | | | | | | | | | | | | |
| | (528,153 | ) | | | (523,110 | ) | | | (1,595,080 | ) | | | 5,467,235 | | | | 490,105 | | | | (2,599,492 | ) |
| | | | | | | | | | | | | | | | | | | | | | |
| | (280,582 | ) | | | (328,825 | ) | | | 1,013,666 | | | | 7,157,533 | | | | 7,943,397 | | | | 3,582,837 | |
| | | | | |
| | 11,738,051 | | | | 12,066,876 | | | | 96,096,690 | | | | 88,939,157 | | | | 33,521,732 | | | | 29,938,895 | |
| | | | | | | | | | | | | | | | | | | | | | |
| $ | 11,457,469 | | | $ | 11,738,051 | | | $ | 97,110,356 | | | $ | 96,096,690 | | | $ | 41,465,129 | | | $ | 33,521,732 | |
| | | | | | | | | | | | | | | | | | | | | | |
| | | | | | | | | | | | | | | | | | | | | | |
| | | | | |
| | | | | | | | | | | | | | | | | | | | | | |
| | | | | | | | | | | | | | | | | | | | | | |
| | 10,430 | | | | 34,678 | | | | 207,817 | | | | 652,547 | | | | 33,731 | | | | 104,644 | |
| | — | | | | — | | | | — | | | | 94 | | | | 3,012 | | | | 983 | |
| | — | | | | — | | | | 6,244 | | | | 15,042 | | | | 2,895 | | | | 855 | |
| | | | | | | | | | | | | | | | | | | | | | |
| | — | | | | 2,923 | | | | — | | | | 42,127 | | | | — | | | | 13,984 | |
| | — | | | | — | | | | — | | | | 41 | | | | — | | | | 42 | |
| | — | | | | — | | | | — | | | | 440 | | | | — | | | | 90 | |
| | | | | | | | | | | | | | | | | | | | | | |
| | (18,599 | ) | | | (46,028 | ) | | | (238,296 | ) | | | (611,403 | ) | | | (34,849 | ) | | | (154,742 | ) |
| | — | | | | — | | | | — | | | | (1,146 | ) | | | (28 | ) | | | (83 | ) |
| | — | | | | — | | | | (318 | ) | | | (9,005 | ) | | | (71 | ) | | | (28 | ) |
| | | | | | | | | | | | | | | | | | | | | | |
| | (8,169 | ) | | | (8,427 | ) | | | (24,553 | ) | | | 88,737 | | | | 4,690 | | | | (34,255 | ) |
| | | | | | | | | | | | | | | | | | | | | | |
See accompanying notes to financial statements.
23
FINANCIAL HIGHLIGHTS
Permanent Portfolio®
| | | | | | | | | | | | | | | | | | | | | | | | |
| Class A Shares (PRPDX) (1) | | Six Months
Ended
July 31, 2024 | | | Year Ended January 31, | |
| | | (Unaudited) | | | 2024 | | | 2023 | | | 2022 | | | 2021 | | | 2020 | |
| | | | | | |
Net asset value, beginning of period | | $ | 50.61 | | | $ | 48.19 | | | $ | 47.92 | | | $ | 45.98 | | | $ | 40.86 | | | $ | 37.99 | |
| | | | | | | | | | | | | | | | | | | | | | | | |
| | | | | | |
Income from investment operations | | | | | | | | | | | | | | | | | | | | | | | | |
Net investment income (loss) (2) | | | .23 | | | | .30 | | | | .19 | | | | (.01) | | | | .16 | | | | .27 | |
Net realized and unrealized gain on investments and foreign currencies (3) | | | 6.47 | | | | 2.73 | | | | .68 | | | | 2.87 | | | | 7.37 | | | | 3.66 | |
| | | | | | | | | | | | | | | | | | | | | | | | |
Total income from investment operations | | | 6.70 | | | | 3.03 | | | | .87 | | | | 2.86 | | | | 7.53 | | | | 3.93 | |
| | | | | | |
Less distributions from | | | | | | | | | | | | | | | | | | | | | | | | |
Net investment income | | | — | | | | (.23 | ) | | | (.01 | ) | | | (.08 | ) | | | (.36 | ) | | | (.30 | ) |
Net realized gain on investments | | | — | | | | (.38 | ) | | | (.59 | ) | | | (.84 | ) | | | (2.05 | ) | | | (.76 | ) |
| | | | | | | | | | | | | | | | | | | | | | | | |
Total distributions | | | — | | | | (.61 | ) | | | (.60 | ) | | | (.92 | ) | | | (2.41 | ) | | | (1.06 | ) |
| | | | | | | | | | | | | | | | | | | | | | | | |
| | | | | | |
Net asset value, end of period | | $ | 57.31 | | | $ | 50.61 | | | $ | 48.19 | | | $ | 47.92 | | | $ | 45.98 | | | $ | 40.86 | |
| | | | | | | | | | | | | | | | | | | | | | | | |
| | | | | | |
Total return (4) | | | 13.24% | † | | | 6.33% | | | | 1.87% | | | | 6.18% | | | | 18.56% | | | | 10.45% | |
| | | | | | |
Ratios / supplemental data | | | | | | | | | | | | | | | | | | | | | | | | |
Net assets, end of period (in thousands) | | $ | 38,411 | | | $ | 44,285 | | | $ | 33,723 | | | $ | 48,095 | | | $ | 25,918 | | | $ | 9,752 | |
| | | | | | | | | | | | | | | | | | | | | | | | |
| | | | | | |
Portfolio turnover rate | | | 12.87% | † | | | 15.26% | | | | 27.58% | | | | 29.47% | | | | 41.03% | | | | 15.26% | |
Ratio of expenses to average net assets | | | 1.06% | * | | | 1.07% | | | | 1.07% | | | | 1.06% | | | | 1.08% | | | | 1.10% | |
Ratio of net investment income (loss) to average net assets | | | .84% | * | | | .62% | | | | .41% | | | | (.02)% | | | | .36% | | | | .68% | |
| (1) | Information contained herein is for each share of capital stock outstanding throughout each period. |
| (2) | Net investment income (loss) is based on average shares outstanding during the period. |
| (3) | Per share net realized and unrealized gains or losses on investments and foreign currencies may not correspond with the change in aggregate unrealized gains and losses in the Portfolio’s securities because of the timing of sales and repurchases of the Portfolio’s shares in relation to fluctuating market values for the Portfolio. |
| (4) | Assumes reinvestment of all dividends and distributions, and deduction of all fees and expenses. |
See accompanying notes to financial statements.
24
FINANCIAL HIGHLIGHTS
Permanent Portfolio®
| | | | | | | | | | | | | | | | | | | | | | | | |
| Class C Shares (PRPHX) (1) | | Six Months
Ended
July 31, 2024 | | | Year Ended January 31, | |
| | | (Unaudited) | | | 2024 | | | 2023 | | | 2022 | | | 2021 | | | 2020 | |
| | | | | | |
Net asset value, beginning of period | | $ | 49.15 | | | $ | 46.94 | | | $ | 47.04 | | | $ | 45.40 | | | $ | 40.45 | | | $ | 37.67 | |
| | | | | | | | | | | | | | | | | | | | | | | | |
| | | | | | |
Income from investment operations | | | | | | | | | | | | | | | | | | | | | | | | |
Net investment income (loss) (2) | | | .03 | | | | (.07 | ) | | | (.15 | ) | | | (.38 | ) | | | (.14 | ) | | | (.03 | ) |
Net realized and unrealized gain on investments and foreign currencies (3) | | | 6.26 | | | | 2.66 | | | | .64 | | | | 2.86 | | | | 7.24 | | | | 3.63 | |
| | | | | | | | | | | | | | | | | | | | | | | | |
Total income from investment operations | | | 6.29 | | | | 2.59 | | | | .49 | | | | 2.48 | | | | 7.10 | | | | 3.60 | |
| | | | | | |
Less distributions from | | | | | | | | | | | | | | | | | | | | | | | | |
Net investment income | | | — | | | | — | | | | — | | | | — | | | | (.10 | ) | | | (.06 | ) |
Net realized gain on investments | | | — | | | | (.38 | ) | | | (.59 | ) | | | (.84 | ) | | | (2.05 | ) | | | (.76 | ) |
| | | | | | | | | | | | | | | | | | | | | | | | |
Total distributions | | | — | | | | (.38 | ) | | | (.59 | ) | | | (.84 | ) | | | (2.15 | ) | | | (.82 | ) |
| | | | | | | | | | | | | | | | | | | | | | | | |
| | | | | | |
Net asset value, end of period | | $ | 55.44 | | | $ | 49.15 | | | $ | 46.94 | | | $ | 47.04 | | | $ | 45.40 | | | $ | 40.45 | |
| | | | | | | | | | | | | | | | | | | | | | | | |
| | | | | | |
Total return (4) | | | 12.80% | † | | | 5.55% | | | | 1.09% | | | | 5.41% | | | | 17.67% | | | | 9.62% | |
| | | | | | |
Ratios / supplemental data | | | | | | | | | | | | | | | | | | | | | | | | |
Net assets, end of period (in thousands) | | $ | 44,817 | | | $ | 37,389 | | | $ | 36,537 | | | $ | 30,038 | | | $ | 13,315 | | | $ | 6,314 | |
| | | | | | | | | | | | | | | | | | | | | | | | |
| | | | | | |
Portfolio turnover rate | | | 12.87% | † | | | 15.26% | | | | 27.58% | | | | 29.47% | | | | 41.03% | | | | 15.26% | |
Ratio of expenses to average net assets | | | 1.81% | * | | | 1.82% | | | | 1.82% | | | | 1.81% | | | | 1.83% | | | | 1.85% | |
Ratio of net investment income (loss) to average net assets | | | .11% | * | | | (.14)% | | | | (.33)% | | | | (.78)% | | | | (.34)% | | | | (.07)% | |
| (1) | Information contained herein is for each share of capital stock outstanding throughout each period. |
| (2) | Net investment income (loss) is based on average shares outstanding during the period. |
| (3) | Per share net realized and unrealized gains or losses on investments and foreign currencies may not correspond with the change in aggregate unrealized gains and losses in the Portfolio’s securities because of the timing of sales and repurchases of the Portfolio’s shares in relation to fluctuating market values for the Portfolio. |
| (4) | Assumes reinvestment of all dividends and distributions, and deduction of all fees and expenses. |
See accompanying notes to financial statements.
25
FINANCIAL HIGHLIGHTS
Permanent Portfolio®
| | | | | | | | | | | | | | | | | | | | | | | | |
| Class I Shares (PRPFX) (1) | | Six Months
Ended
July 31, 2024 | | | Year Ended January 31, | |
| | | (Unaudited) | | | 2024 | | | 2023 | | | 2022 | | | 2021 | | | 2020 | |
| | | | | | |
Net asset value, beginning of period | | $ | 50.85 | | | $ | 48.39 | | | $ | 48.13 | | | $ | 46.15 | | | $ | 40.96 | | | $ | 38.07 | |
| | | | | | | | | | | | | | | | | | | | | | | | |
| | | | | | |
Income from investment operations | | | | | | | | | | | | | | | | | | | | | | | | |
Net investment income (2) | | | .30 | | | | .42 | | | | .31 | | | | .12 | | | | .31 | | | | .39 | |
Net realized and unrealized gain on investments and foreign currencies (3) | | | 6.49 | | | | 2.75 | | | | .68 | | | | 2.88 | | | | 7.36 | | | | 3.65 | |
| | | | | | | | | | | | | | | | | | | | | | | | |
Total income from investment operations | | | 6.79 | | | | 3.17 | | | | .99 | | | | 3.00 | | | | 7.67 | | | | 4.04 | |
| | | | | | |
Less distributions from | | | | | | | | | | | | | | | | | | | | | | | | |
Net investment income | | | — | | | | (.33 | ) | | | (.14 | ) | | | (.18 | ) | | | (.43 | ) | | | (.39 | ) |
Net realized gain on investments | | | — | | | | (.38 | ) | | | (.59 | ) | | | (.84 | ) | | | (2.05 | ) | | | (.76 | ) |
| | | | | | | | | | | | | | | | | | | | | | | | |
Total distributions | | | — | | | | (.71 | ) | | | (.73 | ) | | | (1.02 | ) | | | (2.48 | ) | | | (1.15 | ) |
| | | | | | | | | | | | | | | | | | | | | | | | |
| | | | | | |
Net asset value, end of period | | $ | 57.64 | | | $ | 50.85 | | | $ | 48.39 | | | $ | 48.13 | | | $ | 46.15 | | | $ | 40.96 | |
| | | | | | | | | | | | | | | | | | | | | | | | |
| | | | | | |
Total return (4) | | | 13.35% | † | | | 6.61% | | | | 2.13% | | | | 6.44% | | | | 18.85% | | | | 10.73% | |
| | | | | | |
Ratios / supplemental data | | | | | | | | | | | | | | | | | | | | | | | | |
Net assets, end of period (in thousands) | | $ | 3,293,628 | | | $ | 2,853,956 | | | $ | 2,875,001 | | | $ | 2,825,470 | | | $ | 2,367,139 | | | $ | 1,926,723 | |
| | | | | | | | | | | | | | | | | | | | | | | | |
| | | | | | |
Portfolio turnover rate | | | 12.87% | † | | | 15.26% | | | | 27.58% | | | | 29.47% | | | | 41.03% | | | | 15.26% | |
Ratio of expenses to average net assets | | | .81% | * | | | .82% | | | | .82% | | | | .81% | | | | .83% | | | | .85% | |
Ratio of net investment income to average net assets | | | 1.11% | * | | | .86% | | | | .67% | | | | .25% | | | | .72% | | | | .97% | |
| (1) | Information contained herein is for each share of capital stock outstanding throughout each period. |
| (2) | Net investment income is based on average shares outstanding during the period. |
| (3) | Per share net realized and unrealized gains or losses on investments and foreign currencies may not correspond with the change in aggregate unrealized gains and losses in the Portfolio’s securities because of the timing of sales and repurchases of the Portfolio’s shares in relation to fluctuating market values for the Portfolio. |
| (4) | Assumes reinvestment of all dividends and distributions, and deduction of all fees and expenses. |
See accompanying notes to financial statements.
26
FINANCIAL HIGHLIGHTS
Short-Term Treasury Portfolio
| | | | | | | | | | | | | | | | | | | | | | | | |
| Class I Shares (PRTBX) (1) | | Six Months
Ended
July 31, 2024 | | | Year Ended January 31, | |
| | | (Unaudited) | | | 2024 | | | 2023 | | | 2022 | | | 2021 | | | 2020 | |
| | | | | | |
Net asset value, beginning of period | | $ | 64.48 | | | $ | 63.35 | | | $ | 64.22 | | | $ | 64.92 | | | $ | 65.07 | | | $ | 65.06 | |
| | | | | | | | | | | | | | | | | | | | | | | | |
| | | | | | |
Income (loss) from investment operations | | | | | | | | | | | | | | | | | | | | | | | | |
Net investment income (loss) (2) | | | .91 | | | | 1.30 | | | | .46 | | | | (.37 | ) | | | (.02 | ) | | | 1.06 | |
Net realized and unrealized gain (loss) on investments (3) | | | .50 | | | | .98 | | | | (1.33 | ) | | | (.33 | ) | | | .01 | | | | .02 | |
| | | | | | | | | | | | | | | | | | | | | | | | |
Total income (loss) from investment operations | | | 1.41 | | | | 2.28 | | | | (.87 | ) | | | (.70 | ) | | | (.01 | ) | | | 1.08 | |
| | | | | | |
Less distributions from | | | | | | | | | | | | | | | | | | | | | | | | |
Net investment income | | | — | | | | (1.15 | ) | | | — | | | | — | | | | (.14 | ) | | | (1.07 | ) |
| | | | | | | | | | | | | | | | | | | | | | | | |
Total distributions | | | — | | | | (1.15 | ) | | | — | | | | — | | | | (.14 | ) | | | (1.07 | ) |
| | | | | | | | | | | | | | | | | | | | | | | | |
| | | | | | |
Net asset value, end of period | | $ | 65.89 | | | $ | 64.48 | | | $ | 63.35 | | | $ | 64.22 | | | $ | 64.92 | | | $ | 65.07 | |
| | | | | | | | | | | | | | | | | | | | | | | | |
| | | | | | |
Total return (4) | | | 2.19% | † | | | 3.62% | | | | (1.35)% | | | | (1.08)% | | | | (.02)% | | | | 1.66% | |
| | | | | | |
Ratios / supplemental data | | | | | | | | | | | | | | | | | | | | | | | | |
Net assets, end of period (in thousands) | | $ | 11,457 | | | $ | 11,738 | | | $ | 12,067 | | | $ | 12,503 | | | $ | 13,159 | | | $ | 12,630 | |
| | | | | | | | | | | | | | | | | | | | | | | | |
| | | | | | |
Portfolio turnover rate | | | 20.64% | † | | | 21.97% | | | | —% | | | | —% | | | | 48.08% | | | | 55.42% | |
Ratio of expenses to average net assets: | | | | | | | | | | | | | | | | | | | | | | | | |
After Advisory Fee waiver | | | .65% | * | | | .65% | | | | .65% | | | | .65% | | | | .66% | | | | .66% | |
Before Advisory Fee waiver | | | 1.21% | * | | | 1.21% | | | | 1.21% | | | | 1.21% | | | | 1.22% | | | | 1.23% | |
Ratio of net investment income (loss) to average net assets: | | | | | | | | | | | | | | | | | | | | | | | | |
After Advisory Fee waiver | | | 2.82% | * | | | 2.02% | | | | .72% | | | | (.57)% | | | | (.02)% | | | | 1.62% | |
Before Advisory Fee waiver | | | 2.26% | * | | | 1.46% | | | | .16% | | | | (1.13)% | | | | (.58)% | | | | 1.05% | |
| (1) | Information contained herein is for each share of capital stock outstanding throughout each period. |
| (2) | Net investment income (loss) is based on average shares outstanding during the period. |
| (3) | Per share net realized and unrealized gains or losses on investments may not correspond with the change in aggregate unrealized gains and losses in the Portfolio’s securities because of the timing of sales and repurchases of the Portfolio’s shares in relation to fluctuating market values for the Portfolio. |
| (4) | Assumes reinvestment of all dividends and distributions, and deduction of all fees and expenses. |
See accompanying notes to financial statements.
27
FINANCIAL HIGHLIGHTS
Versatile Bond Portfolio
| | | | | | | | | | | | | | | | | | | | | | | | |
| Class A Shares (PRVDX) (1) | | Six Months
Ended
July 31, 2024 | | | Year Ended January 31, | |
| | | (Unaudited) | | | 2024 | | | 2023 | | | 2022 | | | 2021 | | | 2020 | |
| | | | | | |
Net asset value, beginning of period | | $ | 63.12 | | | $ | 62.02 | | | $ | 64.69 | | | $ | 64.38 | | | $ | 61.72 | | | $ | 58.27 | |
| | | | | | | | | | | | | | | | | | | | | | | | |
| | | | | | |
Income (loss) from investment operations | | | | | | | | | | | | | | | | | | | | | | | | |
Net investment income (2) | | | 1.13 | | | | 1.93 | | | | 1.32 | | | | .87 | | | | 2.21 | | | | 1.85 | |
Net realized and unrealized gain (loss) on investments (3) | | | .51 | | | | .97 | | | | (3.04 | ) | | | (.11 | ) | | | 3.41 | | | | 2.96 | |
| | | | | | | | | | | | | | | | | | | | | | | | |
Total income (loss) from investment operations | | | 1.64 | | | | 2.90 | | | | (1.72 | ) | | | .76 | | | | 5.62 | | | | 4.81 | |
| | | | | | |
Less distributions from | | | | | | | | | | | | | | | | | | | | | | | | |
Net investment income | | | — | | | | (1.80 | ) | | | (.95 | ) | | | (.45 | ) | | | (2.96 | ) | | | (1.36 | ) |
| | | | | | | | | | | | | | | | | | | | | | | | |
Total distributions | | | — | | | | (1.80 | ) | | | (.95 | ) | | | (.45 | ) | | | (2.96 | ) | | | (1.36 | ) |
| | | | | | | | | | | | | | | | | | | | | | | | |
| | | | | | |
Net asset value, end of period | | $ | 64.76 | | | $ | 63.12 | | | $ | 62.02 | | | $ | 64.69 | | | $ | 64.38 | | | $ | 61.72 | |
| | | | | | | | | | | | | | | | | | | | | | | | |
| | | | | | |
Total return (4) | | | 2.60% | † | | | 4.74% | | | | (2.63)% | | | | 1.17% | | | | 9.18% | | | | 8.29% | |
| | | | | | |
Ratios / supplemental data | | | | | | | | | | | | | | | | | | | | | | | | |
Net assets, end of period (in thousands) | | $ | 76 | | | $ | 74 | | | $ | 135 | | | $ | 121 | | | $ | 55 | | | $ | 13 | |
| | | | | | | | | | | | | | | | | | | | | | | | |
| | | | | | |
Portfolio turnover rate | | | 17.12% | † | | | 25.11% | | | | 25.68% | | | | 34.70% | | | | 29.89% | | | | 52.51% | |
Ratio of expenses to average net assets: | | | | | | | | | | | | | | | | | | | | | | | | |
After Advisory Fee waiver | | | .91% | * | | | .91% | | | | .90% | | | | .89% | | | | .92% | | | | .91% | |
Before Advisory Fee waiver | | | 1.47% | * | | | 1.47% | | | | 1.46% | | | | 1.45% | | | | 1.48% | | | | 1.47% | |
Ratio of net investment income to average net assets: | | | | | | | | | | | | | | | | | | | | | | | | |
After Advisory Fee waiver | | | 3.58% | * | | | 3.11% | | | | 2.13% | | | | 1.32% | | | | 3.49% | | | | 3.05% | |
Before Advisory Fee waiver | | | 3.02% | * | | | 2.55% | | | | 1.56% | | | | .76% | | | | 2.93% | | | | 2.49% | |
| (1) | Information contained herein is for each share of capital stock outstanding throughout each period. |
| (2) | Net investment income is based on average shares outstanding during the period. |
| (3) | Per share net realized and unrealized gains or losses on investments may not correspond with the change in aggregate unrealized gains and losses in the Portfolio’s securities because of the timing of sales and repurchases of the Portfolio’s shares in relation to fluctuating market values for the Portfolio. |
| (4) | Assumes reinvestment of all dividends and distributions, and deduction of all fees and expenses. |
See accompanying notes to financial statements.
28
FINANCIAL HIGHLIGHTS
Versatile Bond Portfolio
| | | | | | | | | | | | | | | | | | | | | | | | |
| Class C Shares (PRVHX) (1) | | Six Months
Ended
July 31, 2024 | | | Year Ended January 31, | |
| | | (Unaudited) | | | 2024 | | | 2023 | | | 2022 | | | 2021 | | | 2020 | |
| | | | | | |
Net asset value, beginning of period | | $ | 62.05 | | | $ | 61.19 | | | $ | 63.94 | | | $ | 63.86 | | | $ | 61.55 | | | $ | 58.14 | |
| | | | | | | | | | | | | | | | | | | | | | | | |
| | | | | | |
Income (loss) from investment operations | | | | | | | | | | | | | | | | | | | | | | | | |
Net investment income (2) | | | .89 | | | | 1.46 | | | | .87 | | | | .34 | | | | 1.76 | | | | 1.38 | |
Net realized and unrealized gain (loss) on investments (3) | | | .49 | | | | .93 | | | | (3.03 | ) | | | (.07 | ) | | | 3.34 | | | | 2.96 | |
| | | | | | | | | | | | | | | | | | | | | | | | |
Total income (loss) from investment operations | | | 1.38 | | | | 2.39 | | | | (2.16 | ) | | | .27 | | | | 5.10 | | | | 4.34 | |
| | | | | | |
Less distributions from | | | | | | | | | | | | | | | | | | | | | | | | |
Net investment income | | | — | | | | (1.53 | ) | | | (.59 | ) | | | (.19 | ) | | | (2.79 | ) | | | (.93 | ) |
| | | | | | | | | | | | | | | | | | | | | | | | |
Total distributions | | | — | | | | (1.53 | ) | | | (.59 | ) | | | (.19 | ) | | | (2.79 | ) | | | (.93 | ) |
| | | | | | | | | | | | | | | | | | | | | | | | |
| | | | | | |
Net asset value, end of period | | $ | 63.43 | | | $ | 62.05 | | | $ | 61.19 | | | $ | 63.94 | | | $ | 63.86 | | | $ | 61.55 | |
| | | | | | | | | | | | | | | | | | | | | | | | |
| | | | | | |
Total return (4) | | | 2.22% | † | | | 3.97% | | | | (3.36)% | | | | .43% | | | | 8.35% | | | | 7.49% | |
| | | | | | |
Ratios / supplemental data | | | | | | | | | | | | | | | | | | | | | | | | |
Net assets, end of period (in thousands) | | $ | 1,520 | | | $ | 1,120 | | | $ | 708 | | | $ | 375 | | | $ | 33 | | | $ | 12 | |
| | | | | | | | | | | | | | | | | | | | | | | | |
| | | | | | |
Portfolio turnover rate | | | 17.12% | † | | | 25.11% | | | | 25.68% | | | | 34.70% | | | | 29.89% | | | | 52.51% | |
Ratio of expenses to average net assets: | | | | | | | | | | | | | | | | | | | | | | | | |
After Advisory Fee waiver | | | 1.66% | * | | | 1.66% | | | | 1.65% | | | | 1.64% | | | | 1.67% | | | | 1.66% | |
Before Advisory Fee waiver | | | 2.22% | * | | | 2.22% | | | | 2.21% | | | | 2.20% | | | | 2.23% | | | | 2.22% | |
Ratio of net investment income to average net assets: | | | | | | | | | | | | | | | | | | | | | | | | |
After Advisory Fee waiver | | | 2.87% | * | | | 2.39% | | | | 1.43% | | | | .52% | | | | 2.84% | | | | 2.30% | |
Before Advisory Fee waiver | | | 2.31% | * | | | 1.83% | | | | .87% | | | | (.04)% | | | | 2.28% | | | | 1.74% | |
| (1) | Information contained herein is for each share of capital stock outstanding throughout each period. |
| (2) | Net investment income is based on average shares outstanding during the period. |
| (3) | Per share net realized and unrealized gains or losses on investments may not correspond with the change in aggregate unrealized gains and losses in the Portfolio’s securities because of the timing of sales and repurchases of the Portfolio’s shares in relation to fluctuating market values for the Portfolio. |
| (4) | Assumes reinvestment of all dividends and distributions, and deduction of all fees and expenses. |
See accompanying notes to financial statements.
29
FINANCIAL HIGHLIGHTS
Versatile Bond Portfolio
| | | | | | | | | | | | | | | | | | | | | | | | |
| Class I Shares (PRVBX) (1) | | Six Months
Ended
July 31, 2024 | | | Year Ended January 31, | |
| | | (Unaudited) | | | 2024 | | | 2023 | | | 2022 | | | 2021 | | | 2020 | |
| | | | | | |
Net asset value, beginning of period | | $ | 63.27 | | | $ | 62.19 | | | $ | 64.87 | | | $ | 64.50 | | | $ | 61.75 | | | $ | 58.30 | |
| | | | | | | | | | | | | | | | | | | | | | | | |
| | | | | | |
Income (loss) from investment operations | | | | | | | | | | | | | | | | | | | | | | | | |
Net investment income (2) | | | 1.21 | | | | 2.10 | | | | 1.46 | | | | 1.00 | | | | 2.37 | | | | 2.01 | |
Net realized and unrealized gain (loss) on investments (3) | | | .52 | | | | .96 | | | | (3.03 | ) | | | (.07 | ) | | | 3.41 | | | | 2.97 | |
| | | | | | | | | | | | | | | | | | | | | | | | |
Total income (loss) from investment operations | | | 1.73 | | | | 3.06 | | | | (1.57 | ) | | | .93 | | | | 5.78 | | | | 4.98 | |
| | | | | | |
Less distributions from | | | | | | | | | | | | | | | | | | | | | | | | |
Net investment income | | | — | | | | (1.98 | ) | | | (1.11 | ) | | | (.56 | ) | | | (3.03 | ) | | | (1.53 | ) |
| | | | | | | | | | | | | | | | | | | | | | | | |
Total distributions | | | — | | | | (1.98 | ) | | | (1.11 | ) | | | (.56 | ) | | | (3.03 | ) | | | (1.53 | ) |
| | | | | | | | | | | | | | | | | | | | | | | | |
| | | | | | |
Net asset value, end of period | | $ | 65.00 | | | $ | 63.27 | | | $ | 62.19 | | | $ | 64.87 | | | $ | 64.50 | | | $ | 61.75 | |
| | | | | | | | | | | | | | | | | | | | | | | | |
| | | | | | |
Total return (4) | | | 2.73% | † | | | 5.00% | | | | (2.39)% | | | | 1.43% | | | | 9.43% | | | | 8.58% | |
| | | | | | |
Ratios / supplemental data | | | | | | | | | | | | | | | | | | | | | | | | |
Net assets, end of period (in thousands) | | $ | 95,514 | | | $ | 94,903 | | | $ | 88,096 | | | $ | 119,167 | | | $ | 6,671 | | | $ | 21,335 | |
| | | | | | | | | | | | | | | | | | | | | | | | |
| | | | | | |
Portfolio turnover rate | | | 17.12% | † | | | 25.11% | | | | 25.68% | | | | 34.70% | | | | 29.89% | | | | 52.51% | |
Ratio of expenses to average net assets: | | | | | | | | | | | | | | | | | | | | | | | | |
After Advisory Fee waiver | | | .66% | * | | | .66% | | | | .65% | | | | .64% | | | | .67% | | | | .66% | |
Before Advisory Fee waiver | | | 1.22% | * | | | 1.22% | | | | 1.21% | | | | 1.20% | | | | 1.23% | | | | 1.22% | |
Ratio of net investment income to average net assets: | | | | | | | | | | | | | | | | | | | | | | | | |
After Advisory Fee waiver | | | 3.83% | * | | | 3.37% | | | | 2.34% | | | | 1.53% | | | | 3.85% | | | | 3.30% | |
Before Advisory Fee waiver | | | 3.27% | * | | | 2.81% | | | | 1.78% | | | | .97% | | | | 3.29% | | | | 2.74% | |
| (1) | Information contained herein is for each share of capital stock outstanding throughout each period. |
| (2) | Net investment income is based on average shares outstanding during the period. |
| (3) | Per share net realized and unrealized gains or losses on investments may not correspond with the change in aggregate unrealized gains and losses in the Portfolio’s securities because of the timing of sales and repurchases of the Portfolio’s shares in relation to fluctuating market values for the Portfolio. |
| (4) | Assumes reinvestment of all dividends and distributions, and deduction of all fees and expenses. |
See accompanying notes to financial statements.
30
FINANCIAL HIGHLIGHTS
Aggressive Growth Portfolio
| | | | | | | | | | | | | | | | | | | | | | | | |
| Class A Shares (PAGDX) (1) | | Six Months
Ended
July 31, 2024 | | | Year Ended January 31, | |
| | | (Unaudited) | | | 2024 | | | 2023 | | | 2022 | | | 2021 | | | 2020 | |
| | | | | | |
Net asset value, beginning of period | | $ | 75.58 | | | $ | 62.70 | | | $ | 73.81 | | | $ | 70.99 | | | $ | 57.99 | | | $ | 56.53 | |
| | | | | | | | | | | | | | | | | | | | | | | | |
| | | | | | |
Income (loss) from investment operations | | | | | | | | | | | | | | | | | | | | | | | | |
Net investment income (loss) (2) | | | (.07 | ) | | | .15 | | | | .07 | | | | (.32 | ) | | | .01 | | | | .15 | |
Net realized and unrealized gain (loss) on investments (3) | | | 16.93 | | | | 14.67 | | | | (6.98 | ) | | | 8.66 | | | | 23.39 | | | | 6.25 | |
| | | | | | | | | | | | | | | | | | | | | | | | |
Total income (loss) from investment operations | | | 16.86 | | | | 14.82 | | | | (6.91 | ) | | | 8.34 | | | | 23.40 | | | | 6.40 | |
| | | | | | |
Less distributions from | | | | | | | | | | | | | | | | | | | | | | | | |
Net realized gain on investments | | | — | | | | (1.94 | ) | | | (4.20 | ) | | | (5.52 | ) | | | (10.40 | ) | | | (4.94 | ) |
| | | | | | | | | | | | | | | | | | | | | | | | |
Total distributions | | | — | | | | (1.94 | ) | | | (4.20 | ) | | | (5.52 | ) | | | (10.40 | ) | | | (4.94 | ) |
| | | | | | | | | | | | | | | | | | | | | | | | |
| | | | | | |
Net asset value, end of period | | $ | 92.44 | | | $ | 75.58 | | | $ | 62.70 | | | $ | 73.81 | | | $ | 70.99 | | | $ | 57.99 | |
| | | | | | | | | | | | | | | | | | | | | | | | |
| | | | | | |
Total return (4) | | | 22.31% | † | | | 23.96% | | | | (8.78)% | | | | 11.01% | | | | 41.05% | | | | 11.63% | |
| | | | | | |
Ratios / supplemental data | | | | | | | | | | | | | | | | | | | | | | | | |
Net assets, end of period (in thousands) | | $ | 508 | | | $ | 190 | | | $ | 98 | | | $ | 131 | | | $ | 96 | | | $ | 68 | |
| | | | | | | | | | | | | | | | | | | | | | | | |
| | | | | | |
Portfolio turnover rate | | | —% | † | | | 11.72% | | | | .13% | | | | 4.30% | | | | 7.89% | | | | 2.52% | |
Ratio of expenses to average net assets | | | 1.46% | * | | | 1.46% | | | | 1.46% | | | | 1.46% | | | | 1.46% | | | | 1.48% | |
Ratio of net investment income (loss) to average net assets | | | (.15)% | * | | | .22% | | | | .11% | | | | (.39)% | | | | .02% | | | | .26% | |
| (1) | Information contained herein is for each share of capital stock outstanding throughout each period. |
| (2) | Net investment income (loss) is based on average shares outstanding during the period. |
| (3) | Per share net realized and unrealized gains or losses on investments may not correspond with the change in aggregate unrealized gains and losses in the Portfolio’s securities because of the timing of sales and repurchases of the Portfolio’s shares in relation to fluctuating market values for the Portfolio. |
| (4) | Assumes reinvestment of all dividends and distributions, and deduction of all fees and expenses. |
See accompanying notes to financial statements.
31
FINANCIAL HIGHLIGHTS
Aggressive Growth Portfolio
| | | | | | | | | | | | | | | | | | | | | | | | |
| Class C Shares (PAGHX) (1) | | Six Months
Ended
July 31, 2024 | | | Year Ended January 31, | |
| | | (Unaudited) | | | 2024 | | | 2023 | | | 2022 | | | 2021 | | | 2020 | |
| | | | | | |
Net asset value, beginning of period | | $ | 70.51 | | | $ | 59.05 | | | $ | 70.33 | | | $ | 68.35 | | | $ | 56.54 | | | $ | 55.64 | |
| | | | | | | | | | | | | | | | | | | | | | | | |
| | | | | | |
Income (loss) from investment operations | | | | | | | | | | | | | | | | | | | | | | | | |
Net investment loss (2) | | | (.39 | ) | | | (.32 | ) | | | (.38 | ) | | | (.91 | ) | | | (.45 | ) | | | (.31 | ) |
Net realized and unrealized gain (loss) on investments (3) | | | 15.81 | | | | 13.72 | | | | (6.70 | ) | | | 8.41 | | | | 22.66 | | | | 6.15 | |
| | | | | | | | | | | | | | | | | | | | | | | | |
Total income (loss) from investment operations | | | 15.42 | | | | 13.40 | | | | (7.08 | ) | | | 7.50 | | | | 22.21 | | | | 5.84 | |
| | | | | | |
Less distributions from | | | | | | | | | | | | | | | | | | | | | | | | |
Net realized gain on investments | | | — | | | | (1.94 | ) | | | (4.20 | ) | | | (5.52 | ) | | | (10.40 | ) | | | (4.94 | ) |
| | | | | | | | | | | | | | | | | | | | | | | | |
Total distributions | | | — | | | | (1.94 | ) | | | (4.20 | ) | | | (5.52 | ) | | | (10.40 | ) | | | (4.94 | ) |
| | | | | | | | | | | | | | | | | | | | | | | | |
| | | | | | |
Net asset value, end of period | | $ | 85.93 | | | $ | 70.51 | | | $ | 59.05 | | | $ | 70.33 | | | $ | 68.35 | | | $ | 56.54 | |
| | | | | | | | | | | | | | | | | | | | | | | | |
| | | | | | |
Total return (4) | | | 21.87% | † | | | 23.03% | | | | (9.46)% | | | | 10.20% | | | | 39.98% | | | | 10.80% | |
| | | | | | |
Ratios / supplemental data | | | | | | | | | | | | | | | | | | | | | | | | |
Net assets, end of period (in thousands) | | $ | 504 | | | $ | 215 | | | $ | 126 | | | $ | 139 | | | $ | 69 | | | $ | 49 | |
| | | | | | | | | | | | | | | | | | | | | | | | |
| | | | | | |
Portfolio turnover rate | | | —% | † | | | 11.72% | | | | .13% | | | | 4.30% | | | | 7.89% | | | | 2.52% | |
Ratio of expenses to average net assets | | | 2.21% | * | | | 2.21% | | | | 2.21% | | | | 2.21% | | | | 2.21% | | | | 2.23% | |
Ratio of net investment loss to average net assets | | | (.95)% | * | | | (.50)% | | | | (.64)% | | | | (1.14)% | | | | (.74)% | | | | (.53)% | |
| (1) | Information contained herein is for each share of capital stock outstanding throughout each period. |
| (2) | Net investment loss is based on average shares outstanding during the period. |
| (3) | Per share net realized and unrealized gains or losses on investments may not correspond with the change in aggregate unrealized gains and losses in the Portfolio’s securities because of the timing of sales and repurchases of the Portfolio’s shares in relation to fluctuating market values for the Portfolio. |
| (4) | Assumes reinvestment of all dividends and distributions, and deduction of all fees and expenses. |
See accompanying notes to financial statements.
32
FINANCIAL HIGHLIGHTS
Aggressive Growth Portfolio
| | | | | | | | | | | | | | | | | | | | | | | | |
| Class I Shares (PAGRX) (1) | | Six Months
Ended
July 31, 2024 | | | Year Ended January 31, | |
| | | (Unaudited) | | | 2024 | | | 2023 | | | 2022 | | | 2021 | | | 2020 | |
| | | | | | |
Net asset value, beginning of period | | $ | 75.93 | | | $ | 62.92 | | | $ | 74.06 | | | $ | 71.07 | | | $ | 57.99 | | | $ | 56.68 | |
| | | | | | | | | | | | | | | | | | | | | | | | |
| | | | | | |
Income (loss) from investment operations | | | | | | | | | | | | | | | | | | | | | | | | |
Net investment income (loss) (2) | | | .02 | | | | .33 | | | | .23 | | | | (.12 | ) | | | .17 | | | | .28 | |
Net realized and unrealized gain (loss) on investments (3) | | | 17.04 | | | | 14.73 | | | | (7.01 | ) | | | 8.67 | | | | 23.42 | | | | 6.28 | |
| | | | | | | | | | | | | | | | | | | | | | | | |
Total income (loss) from investment operations | | | 17.06 | | | | 15.06 | | | | (6.78 | ) | | | 8.55 | | | | 23.59 | | | | 6.56 | |
| | | | | | |
Less distributions from | | | | | | | | | | | | | | | | | | | | | | | | |
Net investment income | | | — | | | | (.11 | ) | | | (.16 | ) | | | (.04 | ) | | | (.11 | ) | | | (.31 | ) |
Net realized gain on investments | | | — | | | | (1.94 | ) | | | (4.20 | ) | | | (5.52 | ) | | | (10.40 | ) | | | (4.94 | ) |
| | | | | | | | | | | | | | | | | | | | | | | | |
Total distributions | | | — | | | | (2.05 | ) | | | (4.36 | ) | | | (5.56 | ) | | | (10.51 | ) | | | (5.25 | ) |
| | | | | | | | | | | | | | | | | | | | | | | | |
| | | | | | |
Net asset value, end of period | | $ | 92.99 | | | $ | 75.93 | | | $ | 62.92 | | | $ | 74.06 | | | $ | 71.07 | | | $ | 57.99 | |
| | | | | | | | | | | | | | | | | | | | | | | | |
| | | | | | |
Total return (4) | | | 22.47% | † | | | 24.28% | | | | (8.55)% | | | | 11.29% | | | | 41.39% | | | | 11.91% | |
| | | | | | |
Ratios / supplemental data | | | | | | | | | | | | | | | | | | | | | | | | |
Net assets, end of period (in thousands) | | $ | 40,453 | | | $ | 33,117 | | | $ | 29,715 | | | $ | 35,957 | | | $ | 31,039 | | | $ | 24,796 | |
| | | | | | | | | | | | | | | | | | | | | | | | |
| | | | | | |
Portfolio turnover rate | | | —% | † | | | 11.72% | | | | .13% | | | | 4.30% | | | | 7.89% | | | | 2.52% | |
Ratio of expenses to average net assets | | | 1.21% | * | | | 1.21% | | | | 1.21% | | | | 1.21% | | | | 1.21% | | | | 1.23% | |
Ratio of net investment income (loss) to average net assets | | | .05% | * | | | .49% | | | | .36% | | | | (.14)% | | | | .27% | | | | .47% | |
| (1) | Information contained herein is for each share of capital stock outstanding throughout each period. |
| (2) | Net investment income (loss) is based on average shares outstanding during the period. |
| (3) | Per share net realized and unrealized gains or losses on investments may not correspond with the change in aggregate unrealized gains and losses in the Portfolio’s securities because of the timing of sales and repurchases of the Portfolio’s shares in relation to fluctuating market values for the Portfolio. |
| (4) | Assumes reinvestment of all dividends and distributions, and deduction of all fees and expenses. |
See accompanying notes to financial statements.
33
NOTES TO FINANCIAL STATEMENTS
July 31, 2024 (Unaudited)
| 1. | SIGNIFICANT ACCOUNTING POLICIES |
Permanent Portfolio Family of Funds (“Fund”) was organized on September 21, 2015 as a Delaware statutory trust under the laws of the State of Delaware and is an open-end, series, management investment company registered under the Investment Company Act of 1940, as amended (“1940 Act”). The Fund is the successor to Permanent Portfolio Family of Funds, Inc., a Maryland corporation organized on December 14, 1981, pursuant to a plan of reorganization implemented on May 27, 2016. The Fund currently consists of the following four series (each a “Portfolio”): Permanent Portfolio®, Short-Term Treasury Portfolio, Versatile Bond Portfolio and Aggressive Growth Portfolio. Permanent Portfolio®, Short-Term Treasury Portfolio, Versatile Bond Portfolio and Aggressive Growth Portfolio commenced investment operations on December 1, 1982, September 21, 1987, November 12, 1991 and May 16, 1990, respectively. Effective May 31, 2016, existing shares of each Portfolio were renamed Class I shares, and Permanent Portfolio®, Versatile Bond Portfolio and Aggressive Growth Portfolio commenced offering Class A and Class C shares for purchase through brokers and dealers.
Each share class has equal rights as to earnings and assets except that each class bears different shareholder servicing and distribution expenses. Each share class has exclusive voting rights with respect to matters that affect just that class. Income, expenses (other than expenses attributable to a specific class), and realized and unrealized gains or losses on investments are allocated to each share class based on its relative net assets.
Each of the Fund’s Portfolios is an investment company, and accordingly, each Portfolio follows the investment company accounting and reporting guidance of the Financial Accounting Standards Board (FASB) Accounting Standards Codification “Financial Services — Investment Companies (Topic 946).” The preparation of financial statements in conformity with accounting principles generally accepted in the United States requires management to make estimates and assumptions that affect the reported amounts of assets and liabilities, the disclosure of contingent assets and liabilities at the date of the financial statements and the reported amounts of revenues and expenses earned and incurred, respectively, during the reporting period. Actual results could differ from those estimates.
Valuation of Investments
Each Portfolio’s assets are valued primarily at market value on the basis of the last quoted sales price on the exchange or system on which they are principally traded. Equity securities traded on the Nasdaq National Market System are normally valued at the Nasdaq Official Closing Price provided by Nasdaq, usually as of 4:00 p.m. Eastern Time each business day. Equity securities that are not traded on a listed exchange or system are valued at the last sales price in the over-the-counter market. If there is no trading in an investment on a business day, the investment will be valued at the mean between its closing bid and asked prices on the exchange or system on which the security is principally traded. Short-and long-term debt securities, including U.S. government and agency securities, listed corporate bonds, other fixed income securities and unlisted securities, are generally valued at the latest price furnished by an independent pricing service. Gold and silver bullion are valued at the closing spot settlement price on the New York Commodity Exchange. Gold and silver coins are valued at the price furnished by an independent pricing service. Deposits of Swiss francs and Swiss government bonds will be valued each business day at prices (converted
Continued on following page.
34
NOTES TO FINANCIAL STATEMENTS
July 31, 2024 (Unaudited)
into U.S. dollars) quoted by an independent pricing service. Foreign securities traded on an exchange are valued on the basis of market quotations most recently available from that exchange. All investments denominated in foreign currencies are converted into U.S. dollars using exchange rates obtained from an independent pricing service. Investments for which bona fide market quotations are not readily available, or investments for which the Fund’s investment adviser determines that a quotation or a price for a portfolio security provided by a dealer or an independent pricing service is not believed to be reflective of market value, are valued by the Valuation Committee of the Fund’s investment adviser pursuant to fair value procedures approved by the Fund’s Board of Trustees. The Fund’s investment adviser has been designated as the Fund’s valuation designee, effective September 8, 2022, with responsibility for fair valuation, subject to oversight by the Fund’s Board of Trustees.
The Fund has adopted authoritative fair value accounting standards which establish an authoritative definition of fair value and set out a hierarchy for measuring fair value. These standards require additional disclosures about the various inputs and valuation techniques used to develop the measurements of fair value, a discussion of changes in valuation techniques and related inputs during a reporting period and expanded disclosure of valuation levels for major security types. These inputs are summarized in the three broad levels listed below.
Level 1 — Quoted prices in active markets for identical assets
The Fund’s Level 1 valuation techniques use unadjusted quoted prices in active markets for assets or liabilities with sufficient frequency and volume to provide pricing information as the most reliable evidence of fair value.
Level 2 — Significant other observable inputs (including quoted prices for similar securities, interest rates, credit risk, etc.)
The Fund’s Level 2 valuation techniques include inputs other than quoted prices within Level 1 that are observable for an asset or liability, either directly or indirectly. Observable inputs may include quoted prices for similar assets or liabilities in active markets or quoted prices for identical or similar assets or liabilities in markets that are not active, in which there are few transactions, where prices may not be current, or where price quotations vary substantially over time or among market participants. Inputs that are observable for an asset or liability in Level 2 include such factors as interest rates, yield curves, foreign exchange rates, put or call provisions, credit risk and default rates for similar assets or liabilities.
Level 3 — Significant unobservable inputs (including the Fund’s own assumptions in determining the fair value of investments)
The Fund’s Level 3 valuation techniques include the use of unobservable inputs that reflect assumptions market participants may use or could be expected to use in pricing an asset or liability. Unobservable inputs are used to measure fair value to the extent that observable inputs are not available, and are developed based on the best information available under the circumstances. In developing unobservable inputs, market participant assumptions are used if they are reasonably available without undue cost and effort.
The Fund may record changes to valuations based on the amount that it might reasonably be expected to receive for an investment upon its current sale, consistent with the fair value measurement objective. Each determination is based on a consideration of all relevant factors,
Continued on following page.
35
NOTES TO FINANCIAL STATEMENTS
July 31, 2024 (Unaudited)
which are likely to vary from one pricing context to another. Examples of such factors may include, but are not limited to: (i) type of the investment; (ii) existence of any contractual restrictions on the investment’s disposition; (iii) price and extent of public trading in similar investments or of comparable investments; (iv) quotations or evaluated prices from broker-dealers and/or pricing services; (v) information obtained from the issuer, analysts, and/or the appropriate stock exchange (for exchange-traded securities); (vi) analysis of an issuer’s financial statements; (vii) evaluation of the forces that influence the issuer and the market(s) in which the investment is purchased and sold; and (viii) with respect to debt securities, maturity, coupon, creditworthiness, spread, currency denomination, and the movement of the market in which the security is normally traded. Because of the inherent uncertainties of valuation, the values reflected in the financial statements may materially differ from the value determined upon sale of those investments.
The following is a summary of the inputs used as of July 31, 2024 in valuing the Fund’s assets:
| | | | | | | | | | | | | | | | |
| | | Level 1
(Quoted Prices in
Active Markets for
Identical Assets) | | | Level 2
(Significant
Other Observable
Inputs) | | | Level 3
(Significant
Unobservable
Inputs) | | | Total | |
PERMANENT PORTFOLIO® | | | | | | | | | | | | | | | | |
Gold assets | | $ | 749,878,791 | | | $ | — | | | $ | — | | | $ | 749,878,791 | |
Silver assets | | | 174,342,194 | | | | — | | | | — | | | | 174,342,194 | |
Swiss franc assets | | | 569,824 | | | | 262,340,929 | | | | — | | | | 262,910,753 | |
Real estate and natural resource stocks | | | 600,809,800 | | | | — | | | | — | | | | 600,809,800 | |
Aggressive growth stocks † | | | 633,306,450 | | | | — | | | | — | | | | 633,306,450 | |
Dollar assets: | | | | | | | | | | | | | | | | |
Corporate bonds † | | | — | | | | 868,646,603 | | | | — | | | | 868,646,603 | |
United States Treasury securities | | | — | | | | 61,775,836 | | | | — | | | | 61,775,836 | |
| | | | | | | | | | | | | | | | |
Total Portfolio | | $ | 2,158,907,059 | | | $ | 1,192,763,368 | | | $ | — | | | $ | 3,351,670,427 | |
| | | | | | | | | | | | | | | | |
| | | 64.41% | | | | 35.59% | | | | —% | | | | 100.00% | |
| | | | |
SHORT-TERM TREASURY PORTFOLIO | | | | | | | | | | | | | | | | |
United States Treasury securities | | $ | — | | | $ | 11,345,278 | | | $ | — | | | $ | 11,345,278 | |
| | | | | | | | | | | | | | | | |
Total Portfolio | | $ | — | | | $ | 11,345,278 | | | $ | — | | | $ | 11,345,278 | |
| | | | | | | | | | | | | | | | |
| | | —% | | | | 100.00% | | | | —% | | | | 100.00% | |
| | | | |
VERSATILE BOND PORTFOLIO | | | | | | | | | | | | | | | | |
Corporate bonds † | | $ | 7,148,599 | | | $ | 78,775,071 | | | $ | — | | | $ | 85,923,670 | |
Preferred stocks † | | | 9,315,210 | | | | 417,500 | | | | — | | | | 9,732,710 | |
United States Treasury securities | | | — | | | | 498,982 | | | | | | | | 498,982 | |
| | | | | | | | | | | | | | | | |
Total Portfolio | | $ | 16,463,809 | | | $ | 79,691,553 | | | $ | — | | | $ | 96,155,362 | |
| | | | | | | | | | | | | | | | |
| | | 17.12% | | | | 82.88% | | | | —% | | | | 100.00% | |
| | | | |
AGGRESSIVE GROWTH PORTFOLIO | | | | | | | | | | | | | | | | |
Aggressive growth stocks † | | $ | 40,387,830 | | | $ | — | | | $ | — | | | $ | 40,387,830 | |
United States Treasury securities | | | — | | | | 995,924 | | | | — | | | | 995,924 | |
| | | | | | | | | | | | | | | | |
Total Portfolio | | $ | 40,387,830 | | | $ | 995,924 | | | $ | — | | | $ | 41,383,754 | |
| | | | | | | | | | | | | | | | |
| | | 97.59% | | | | 2.41% | | | | —% | | | | 100.00% | |
| | † | See the Schedules of Investments for Permanent Portfolio and Aggressive Growth Portfolio for each Portfolio’s industry classification of aggressive growth stocks and the Schedules of Investments for Permanent Portfolio and Versatile Bond Portfolio for each Portfolio’s industry classification of corporate bonds and preferred stocks. |
Continued on following page.
36
NOTES TO FINANCIAL STATEMENTS
July 31, 2024 (Unaudited)
Transfers between levels are recognized at the end of a reporting period. There were no transfers into or out of Levels 1 and 2 during the six months ended July 31, 2024. The Fund’s Permanent Portfolio, Short-Term Treasury Portfolio, Versatile Bond Portfolio and Aggressive Growth Portfolio held no Level 3 assets during the six months then ended.
As of July 31, 2024 and during the six months then ended, the Fund did not hold any derivative instruments, nor did it engage in any hedging activities using derivative instruments.
Translation of Foreign Currencies
Amounts denominated in or expected to settle in foreign currencies are translated into U.S. dollars on the following basis: (i) market value of investment securities and other assets and liabilities are translated at the closing rate of exchange; and (ii) purchases and sales of investment securities, income and expenses are translated at the rate of exchange prevailing on the respective dates of such transactions.
The Fund separately reports the portions of the results of operations attributable to the effect of changes in foreign exchange rates on the value of investments. Reported net realized gains or losses on foreign currency transactions arise from sales of foreign currencies, foreign currency gains or losses realized between the trade and settlement dates on securities transactions and the difference between the amounts of dividends, interest and foreign withholding taxes recorded on the Fund’s books versus the U.S. dollar equivalent of the amounts actually received or paid. Net unrealized foreign currency gains or losses arise from changes in the exchange rate applicable to cash, receivables and liabilities denominated in foreign currencies.
Investment Transactions and Investment Income
Investment transactions are accounted for on the date of purchase, sale or maturity. Interest income is accrued daily and includes amortization of any premiums or discounts for financial and tax reporting purposes using the effective yield method. Dividend income is recorded on the ex-dividend date. Distributions received from real estate investment trusts (REITs) may be classified as dividends, capital gains or returns of capital. Realized gains and losses from investment transactions and unrealized appreciation or depreciation of investments are recorded on an identified cost basis for financial and tax reporting purposes.
During the six months ended July 31, 2024, investment income was earned as follows:
| | | | | | | | | | | | | | | | |
| | | Permanent
Portfolio® | | | Short-Term
Treasury
Portfolio | | | Versatile
Bond
Portfolio | | | Aggressive
Growth
Portfolio | |
| | | | | | | | | | | | | | | | |
Interest | | | | | | | | | | | | | | | | |
Corporate bonds | | $ | 16,099,892 | | | $ | — | | | $ | 1,565,553 | | | $ | — | |
Swiss franc assets | | | 171,570 | | | | — | | | | — | | | | — | |
United States Treasury securities | | | 1,275,168 | | | | 197,195 | | | | 29,173 | | | | 146 | |
Other investments | | | 40,454 | | | | 446 | | | | 3,053 | | | | 325 | |
Dividends | | | 12,787,985 | | | | — | | | | 566,340 | | | | 245,183 | |
| | | | | | | | | | | | | | | | |
| | $ | 30,375,069 | | | $ | 197,641 | | | $ | 2,164,119 | | | $ | 245,654 | |
| | | | | | | | | | | | | | | | |
Continued on following page.
37
NOTES TO FINANCIAL STATEMENTS
July 31, 2024 (Unaudited)
Federal Taxes
Each of the Fund’s Portfolios will continue to be treated as a separate regulated investment company and each Portfolio intends to qualify under Subchapter M of the United States Internal Revenue Code of 1986, as amended (“Code”). Accordingly, no provision has been made for United States income taxes, as each Portfolio intends to declare necessary dividend distributions from investment company taxable income and net realized capital gains, if any, to its shareholders prior to October 15, 2024, pursuant to the requirements of the Code.
As of January 31, 2024, the Fund’s Permanent Portfolio and Aggressive Growth Portfolio had no capital loss carryforwards available to offset future realized gains, if any, while the Fund’s Short-Term Treasury Portfolio had $17,228 of short-term capital loss carryforwards and $32,098 of long-term capital loss carryforwards, and the Fund’s Versatile Bond Portfolio had $761,335 of short-term capital loss carryforwards and $1,576,623 of long-term capital loss carryforwards available, respectively, to offset future realized gains, if any. Additionally, net capital losses attributable to investment transactions that occur after October 31 and ordinary losses that occur after December 31 (“Post-October” and “Late-Year Ordinary” losses, respectively), if any, are recognized for federal tax purposes as arising on February 1, the first day of each Portfolio’s next taxable year. The Fund’s Short-Term Treasury Portfolio and Aggressive Growth Portfolio had no Post-October losses or Late-Year Ordinary losses, while its Permanent Portfolio and Versatile Bond Portfolio had $13,435,745 and $735, respectively, of Post-October losses.
During the six months ended July 31, 2024, the Fund’s Permanent Portfolio, Short-Term Treasury Portfolio, Versatile Bond Portfolio and Aggressive Growth Portfolio incurred no federal excise tax.
The Fund’s Portfolios recognize the tax benefits of uncertain tax positions only where the position is “more likely than not” to be sustained assuming examination by tax authorities. The Fund’s Portfolios have analyzed their respective tax positions and have concluded that no liability for unrecognized tax benefits should be recorded related to uncertain tax positions taken on tax returns previously filed for open tax years 2021 through 2023 or expected to be taken on the Fund’s Portfolios’ 2024 tax returns. The Fund’s Portfolios are not aware of any tax positions for which it is reasonably possible that the total amounts of unrecognized tax benefits will change materially in the next twelve months.
Equalization
The Fund follows the accounting practice of equalization, by which a portion of the proceeds from sales and a portion of the costs of redemptions of shares of capital stock are allocated to undistributed net investment income. The effect of this practice is to prevent the calculation of net investment income per share from being affected by sales or redemptions of shares in each Portfolio, and for periods of net issuances of shares, allows undistributed net investment income to exceed distributable investment company taxable income.
Continued on following page.
38
NOTES TO FINANCIAL STATEMENTS
July 31, 2024 (Unaudited)
Indemnifications
The Fund indemnifies its officers and trustees for certain liabilities that might arise from the performance of their duties for the Fund. Additionally, in the normal course of business, the Fund enters into contracts that contain a variety of representations and warranties which may provide general indemnifications. The Fund’s maximum exposure under these arrangements is unknown, as it involves future claims that may be made against the Fund under circumstances that have not occurred.
| 2. | DISTRIBUTIONS TO SHAREHOLDERS |
On December 6, 2023, the Fund paid ordinary income dividends and capital gain distributions to shareholders of record on December 5, 2023. The per share amounts per Portfolio were as follows:
| | | | | | | | | | | | | | | | |
| | | Permanent
Portfolio® | | | Short-Term
Treasury
Portfolio | | | Versatile
Bond
Portfolio | | | Aggressive
Growth
Portfolio | |
| | | | | | | | | | | | | | | | |
| | | | | | | | | | | | | | | | |
Ordinary Income Dividends | | | | | | | | | | | | | | | | |
Class I Shares | | $ | .33194 | | | $ | 1.15095 | | | $ | 1.98222 | | | $ | .10887 | |
Class A shares | | | .22895 | | | | — | | | | 1.80220 | | | | — | |
Class C shares | | | — | | | | — | | | | 1.53393 | | | | — | |
| | | | |
Short-Term Capital Gain Distributions | | | | | | | | | | | | | | | | |
Class I Shares | | | .08198 | | | | — | | | | — | | | | — | |
Class A shares | | | .08198 | | | | — | | | | — | | | | — | |
Class C shares | | | .08198 | | | | — | | | | — | | | | — | |
| | | | |
Long-Term Capital Gain Distributions | | | | | | | | | | | | | | | | |
Class I Shares | | | .29953 | | | | — | | | | — | | | | 1.94328 | |
Class A shares | | | .29953 | | | | — | | | | — | | | | 1.94328 | |
Class C shares | | | .29953 | | | | — | | | | — | | | | 1.94328 | |
The federal income tax character of such dividends and distributions paid was as follows:
| | | | | | | | | | | | | | | | |
| | | Permanent
Portfolio® | | | Short-Term
Treasury
Portfolio | | | Versatile
Bond
Portfolio | | | Aggressive
Growth
Portfolio | |
| | | | | | | | | | | | | | | | |
Ordinary income | | $ | 23,951,324 | | | $ | 201,014 | | | $ | 2,767,826 | | | $ | 53,898 | |
Long-term capital gain † | | | 16,686,625 | | | | — | | | | — | | | | 970,727 | |
| | | | | | | | | | | | | | | | |
| | $ | 40,637,949 | | | $ | 201,014 | | | $ | 2,767,826 | | | $ | 1,024,625 | |
| | | | | | | | | | | | | | | | |
| | † | Capital gain distribution pursuant to Section 852(b)(3) of the Code. |
Continued on following page.
39
NOTES TO FINANCIAL STATEMENTS
July 31, 2024 (Unaudited)
Dividends to shareholders from net investment income and distributions to shareholders from net realized gain on investments, if any, are recorded on the ex-dividend date. The amount of such dividends and distributions are determined in accordance with the Code, which may differ from accounting principles generally accepted in the United States. These differences result primarily from different treatment of net investment income and net realized gains on certain investment securities held by the Fund’s Portfolios. During the year ended January 31, 2024: (i) the Fund’s Permanent Portfolio reclassified $1,717,454 from total distributable earnings to undistributed capital gains and $2,099,810 from total distributable earnings to paid-in capital; (ii) the Fund’s Short-Term Treasury Portfolio reclassified $12,172 from total distributable earnings to paid-in capital; (iii) the Fund’s Versatile Bond Portfolio reclassified $398,357 from total distributable earnings to paid-in capital; and (iv) the Fund’s Aggressive Growth Portfolio reclassified $340 from undistributed capital gains to paid-in capital and $23,502 from total distributable earnings to paid-in capital, to reflect such book and tax basis differences.
As of January 31, 2024, the components of distributable earnings on a tax basis were as follows:
| | | | | | | | | | | | | | | | |
| | | Permanent
Portfolio® | | | Short-Term
Treasury
Portfolio | | | Versatile
Bond
Portfolio | | | Aggressive
Growth
Portfolio | |
| | | | | | | | | | | | | | | | |
Distributable ordinary income | | $ | 2,597,485 | | | $ | 98,045 | | | $ | 315,216 | | | $ | 97,010 | |
Undistributed capital gains (losses) | | | — | | | | (49,326 | ) | | | (2,337,958 | ) | | | 2,448,862 | |
Post-October and Late-Year Ordinary losses | | | (13,435,745 | ) | | | — | | | | (735 | ) | | | — | |
Unrealized appreciation (depreciation) on investments and foreign currencies | | | 922,327,794 | | | | (121,708 | ) | | | (4,017,410 | ) | | | 22,183,777 | |
| | | | | | | | | | | | | | | | |
| | $ | 911,489,534 | | | $ | (72,989 | ) | | $ | (6,040,887 | ) | | $ | 24,729,649 | |
| | | | | | | | | | | | | | | | |
| 3. | INVESTMENT ADVISER AND INVESTMENT ADVISORY CONTRACT |
Pacific Heights Asset Management, LLC (“Pacific Heights”) has served as the Fund’s investment adviser since May 1, 2003. In accordance with the terms of the Investment Advisory Contract, dated January 21, 2016 (“Contract”), Pacific Heights, subject to the oversight of the Fund’s Board of Trustees: (i) furnishes each Portfolio with a continuous investment program, including investment research, advice and management, with respect to all securities, other investments and cash or cash equivalents in each Portfolio; (ii) furnishes the Fund all necessary administrative, accounting, clerical, statistical, correspondence and other services; (iii) furnishes or pays for all supplies, printed material and office space as the Fund may require; and (iv) pays or reimburses such Fund and Portfolio expenses as specified in the Contract. For its services under the Contract, Pacific Heights receives, before any waivers, investment advisory fees which are calculated daily and paid monthly, at the annual rates as a percentage of average daily net assets of each Portfolio of the Fund (“Advisory Fee”) as follows: (i) 1.1875% of the first $200 million of the Portfolio’s average daily net assets; (ii) .8750% of the next $200 million of the Portfolio’s average daily net assets; (iii) .8125% of the next $200 million of the Portfolio’s average daily net assets; and (iv) .7500% of all of the Portfolio’s average daily net assets in excess of $600 million.
All fees and expenses payable by the Fund pursuant to the Contract and attributable only to one Portfolio are borne entirely by that Portfolio; all other fees and expenses are allocated among the Fund’s Portfolios in proportion to their net assets. Except for: (i) the Advisory Fee payable to
Continued on following page.
40
NOTES TO FINANCIAL STATEMENTS
July 31, 2024 (Unaudited)
Pacific Heights; (ii) all fees, costs, expenses and allowances payable to any person, firm or corporation in relation to the Portfolio’s investments, including interest on borrowings; (iii) all taxes of any kind payable by the Portfolio; (iv) all brokerage commissions and other charges in the purchase and sale of the Portfolio’s assets; (v) all fees and expenses of trustees of the Fund, including fees and disbursements to counsel to those trustees who are not interested persons of the Fund or Pacific Heights; (vi) payments pursuant to any plan of distribution adopted pursuant to Rule 12b-1 under the 1940 Act; and (vii) all extraordinary fees, costs and expenses of the Fund or any Portfolio, as defined in the Contract, Pacific Heights pays or reimburses the Fund for substantially all of the Portfolios’ ordinary operating expenses out of its Advisory Fee.
Pursuant to an Advisory Fee Waiver and Expense Assumption Agreement dated December 12, 2023 (“Waiver Agreement”), effective through June 1, 2025, Pacific Heights has agreed to waive portions of its Advisory Fee allocable to: (i) the Short-Term Treasury Portfolio, such that the Advisory Fee paid by the Portfolio does not exceed an annual rate of .6250% of the Portfolio’s average daily net assets; and (ii) the Versatile Bond Portfolio, such that the Advisory Fee paid by the Portfolio also does not exceed an annual rate of .6250% of the Portfolio’s average daily net assets. Pacific Heights is not eligible for reimbursement of any amounts waived under the Waiver Agreement. The Waiver Agreement may be terminated or amended only in writing and only with the approval of the Fund’s Board of Trustees.
Pacific Heights is a California limited liability company. Pacific Heights’ manager and the sole trustee of its sole member is Michael J. Cuggino (who is also its President and Chief Executive Officer). Mr. Cuggino is also the President, Secretary and Chairman of the Board of Trustees of the Fund, and has been the portfolio manager of the Fund’s Portfolios since May 1, 2003. In addition to the benefits that result from being the trustee of the sole member of Pacific Heights, Mr. Cuggino was paid $82,500 by the Fund during the six months ended July 31, 2024 for his service as a trustee of the Fund.
| 4. | DISTRIBUTION AND SERVICE FEES |
The Fund’s Board of Trustees has adopted plans of distribution pursuant to Rule 12b-1 under the 1940 Act (“Rule 12b-1 Plans”) with respect to Class A and Class C shares of the Fund’s Permanent Portfolio, Versatile Bond Portfolio and Aggressive Growth Portfolio. Under the Rule 12b-1 Plans, Class A shares pay service fees at an annual rate of .25% of the average daily net assets of the Portfolio attributable to Class A shares and Class C shares pay distribution and service fees at an aggregate annual rate of 1.00% of the average daily net assets of the Portfolio attributable to Class C shares. Quasar Distributors, LLC (“Distributor”) serves as principal underwriter for shares of the Portfolios, and acts as each Portfolio’s distributor in a continuous public offering of each Portfolio’s shares. The Distributor may pay any or all amounts received under the Rule 12b-1 Plans to other persons, including Pacific Heights, for any distribution or service activity. These distribution and servicing fees are reported in the Fund’s Statements of Operations. The Portfolios do not incur any direct distribution expenses related to Class I shares. However, Pacific Heights may make payments for the sale and distribution of all share classes, including Class I shares, from its own resources.
Continued on following page.
41
NOTES TO FINANCIAL STATEMENTS
July 31, 2024 (Unaudited)
| 5. | PURCHASES AND SALES OF SECURITIES |
The following is a summary of purchases and sales of securities other than short-term securities for the six months ended July 31, 2024:
| | | | | | | | | | | | | | | | |
| | | Permanent
Portfolio® | | | Short-Term
Treasury
Portfolio | | | Versatile
Bond
Portfolio | | | Aggressive
Growth
Portfolio | |
Purchases | | $ | 312,055,305 | | | $ | 2,636,234 | | | $ | 17,847,648 | | | $ | — | |
Sales | | | 288,378,804 | | | | 2,141,563 | | | | 16,076,091 | | | | 586,293 | |
| 6. | NET UNREALIZED APPRECIATION (DEPRECIATION) OF INVESTMENTS |
The following is a summary of net unrealized appreciation (depreciation) of investments as of July 31, 2024 for federal income tax purposes:
| | | | | | | | | | | | | | | | |
| | | Permanent
Portfolio® | | | Short-Term
Treasury
Portfolio | | | Versatile
Bond
Portfolio | | | Aggressive
Growth
Portfolio | |
Aggregate gross unrealized appreciation of investments with excess of value over tax cost: | | | | | | | | | | | | | | | | |
Investments in securities | | $ | 773,552,434 | | | $ | 23,772 | | | $ | 330,183 | | | $ | 30,446,223 | |
Investments other than securities | | | 503,608,377 | | | | — | | | | — | | | | — | |
| | | | | | | | | | | | | | | | |
| | | 1,277,160,811 | | | | 23,772 | | | | 330,183 | | | | 30,446,223 | |
Aggregate gross unrealized depreciation of investments with excess of tax cost over value: | | | | | | | | | | | | | | | | |
Investments in securities | | | (35,613,426 | ) | | | (50,374 | ) | | | (3,314,871 | ) | | | (1,058,978 | ) |
Investments other than securities | | | — | | | | — | | | | — | | | | — | |
| | | | | | | | | | | | | | | | |
| | | (35,613,426 | ) | | | (50,374 | ) | | | (3,314,871 | ) | | | (1,058,978 | ) |
| | | | | | | | | | | | | | | | |
Net unrealized appreciation (depeciation) of investments | | $ | 1,241,547,385 | | | $ | (26,602 | ) | | $ | (2,984,688 | ) | | $ | 29,387,245 | |
| | | | | | | | | | | | | | | | |
The Fund has evaluated the impact of subsequent events on its Portfolios and has determined that there were no subsequent events requiring recognition or disclosure in the Fund’s financial statements. The Fund continues to evaluate the effect on its investments and operations of various evolving matters regarding the economy, financial system and markets arising from monetary and fiscal policies designed to mitigate inflationary or deflationary pressures, geopolitical risks, including the Russian-Ukraine and Israeli-Hamas conflicts, and ongoing disruption of the flow of goods and services, including food, energy and other commodities, potential sanctions, counter-sanctions, and other government mandated restrictions, that may be applied to the Fund’s Portfolios and activities. The Fund’s financial statements do not contain any adjustments relating to these uncertainties, and their ultimate impact on the Fund, its investments and operations are not readily determinable at this time.
42
[THIS PAGE INTENTIONALLY LEFT BLANK]
43
Semi-Annual
Financial Statements and Other Information
Six Months Ended July 31, 2024
INVESTMENT ADVISER
Pacific Heights Asset Management, LLC
600 Montgomery Street
San Francisco, California 94111
CUSTODIAN
State Street Bank and Trust Company
One Congress Street
Boston, Massachusetts 02114
DISTRIBUTOR
Quasar Distributors, LLC
Three Canal Plaza
Portland, Maine 04101
TRANSFER AGENT
U.S. Bank Global Fund Services
P. O. Box 701
Milwaukee, Wisconsin 53201
(for overnight delivery services,
615 East Michigan Street
Milwaukee, Wisconsin 53202)
(800) 341-8900
SHAREHOLDER SERVICES OFFICE
130 South Brune Street
Bartlett, Texas 76511
(254) 527-3102
(800) 531-5142 Nationwide
www.permanentportfoliofunds.com
| | |
| Must be preceded or accompanied by a Prospectus. | | 09/24 |
Permanent Portfolio®, The Permanent Portfolio Family of Funds®, A Fund for All Seasons® and The Permanent Portfolio Family of Funds logo are registered trademarks of Pacific Heights Asset Management, LLC. This Report is Copyright© 2024 Permanent Portfolio Family of Funds. All rights reserved.
| | | | |
| Item 8. Changes In and Disagreements With Accountants For Open-End Management Investment Companies. |
| |
| | Not applicable to the Registrant for the six months ended July 31, 2024. |
|
| Item 9. Proxy Disclosures For Open-End Management Investment Companies. |
| |
| | Not applicable to the Registrant for the six months ended July 31, 2024. |
|
| Item 10. Remuneration Paid to Directors, Officers, and Others of Open-End Management Investment Companies. |
| |
| | Included in Item 7. |
|
| Item 11. Statement Regarding Basis For Approval of Investment Advisory Contract. |
| |
| | Not applicable to the Registrant for the six months ended July 31, 2024. |
|
| Item 12. Disclosure of Proxy Voting Policies and Procedures For Closed-End Management Investment Companies. |
| |
| | Not applicable to the Registrant. |
|
| Item 13. Portfolio Managers of Closed-End Management Investment Companies. |
| |
| | Not applicable to the Registrant. |
|
| Item 14. Purchases of Equity Securities By Closed-End Management Investment Company and Affiliated Purchasers. |
| |
| | Not applicable to the Registrant. |
|
| Item 15. Submission of Matters to a Vote of Security Holders. |
| |
| | Not applicable to the Registrant for the six months ended July 31, 2024. |
|
| Item 16. Controls and Procedures. |
| | |
| | (a) | | Michael J. Cuggino, the Registrant’s President, and James H. Andrews, the Registrant’s Treasurer, each has concluded that, in his judgment, the Registrant’s disclosure controls and procedures (as defined in Rule 30a-3(c) under the Investment Company Act of 1940, as amended (“1940 Act”) (17 CFR 270.30a-3(c))) are effective, as of a date within 90 days of the filing date of the report that includes the disclosure required by this paragraph, based on his evaluation of these controls and procedures required by Rule 30a-3(b) under the 1940 Act (17 CFR 270.30a-3(b)) and Rules 13a-15(b) or 15d-15(b) under the Securities Exchange Act of 1934, as amended (17 CFR 240.13a-15(b) or 240.15d-15(b)). |
| | |
| | (b) | | There was no change in the Registrant’s internal control over financial reporting (as defined in Rule 30a-3(d) under the 1940 Act (17 CFR 270.30a-3(d)) that occurred during the period covered by this report that has materially affected, or is reasonably likely to materially affect, the Registrant’s internal control over financial reporting. |
|
Item 17. Disclosure of Securities Lending Activities For Closed-End Management Investment Companies. |
| |
| | Not applicable to the Registrant. |
|
Item 18. Recovery of Erroneously Awarded Compensation. |
| |
| | Not applicable to the Registrant. |
|
| Item 19. Exhibits. |
| | |
| | (a)(1) | | Not applicable to semi-annual reports. |
| | |
| | (a)(2) | | Certifications pursuant to Rule 30a-2(a) under the 1940 Act (17 CFR 270.30a-2(a)) and Section 302 of the Sarbanes-Oxley Act of 2002 are attached hereto as Exhibit 99.CERT. |
| | |
| | (b) | | Certifications pursuant to Rule 30a-2(b) under the 1940 Act (17 CFR 270.30a-2(b)) and Section 906 of the Sarbanes-Oxley Act of 2002 are attached hereto as Exhibit 99.906CERT. |
The certifications provided pursuant to Rule 30a-2(b) under the 1940 Act (17 CFR 270.30a-2(b)) and Section 906 of the Sarbanes-Oxley Act of 2002 are not deemed “filed” for purposes of Section 18 of the Exchange Act, or otherwise subject to the liability of that section. Such certifications will not be deemed to be incorporated by reference into any filing under the Securities Act of 1933, as amended, or the Exchange Act, except to the extent the Registrant specifically incorporates them by reference.
SIGNATURES
Pursuant to the requirements of the Securities Exchange Act of 1934 and the Investment Company Act of 1940, the Registrant has duly caused this report to be signed on its behalf by the undersigned, thereunto duly authorized.
Permanent Portfolio Family of Funds
/s/ Michael J. Cuggino
By: Michael J. Cuggino, President
Date: October 3, 2024
Pursuant to the requirements of the Securities Exchange Act of 1934 and the Investment Company Act of 1940, this report has been signed below by the following persons on behalf of the Registrant and in the capacities and on the dates indicated.
Permanent Portfolio Family of Funds
/s/ Michael J. Cuggino
By: Michael J. Cuggino, President
Date: October 3, 2024
/s/ James H. Andrews
By: James H. Andrews, Treasurer
Date: October 3, 2024