Welcome to the 2009 Annual Meeting
1
Safety & Soundness Performance Dividend Strategy Stock Performance Executive Compensation Questions and Answers Shareholder Assembly Agenda
2

Safety & Soundness
3
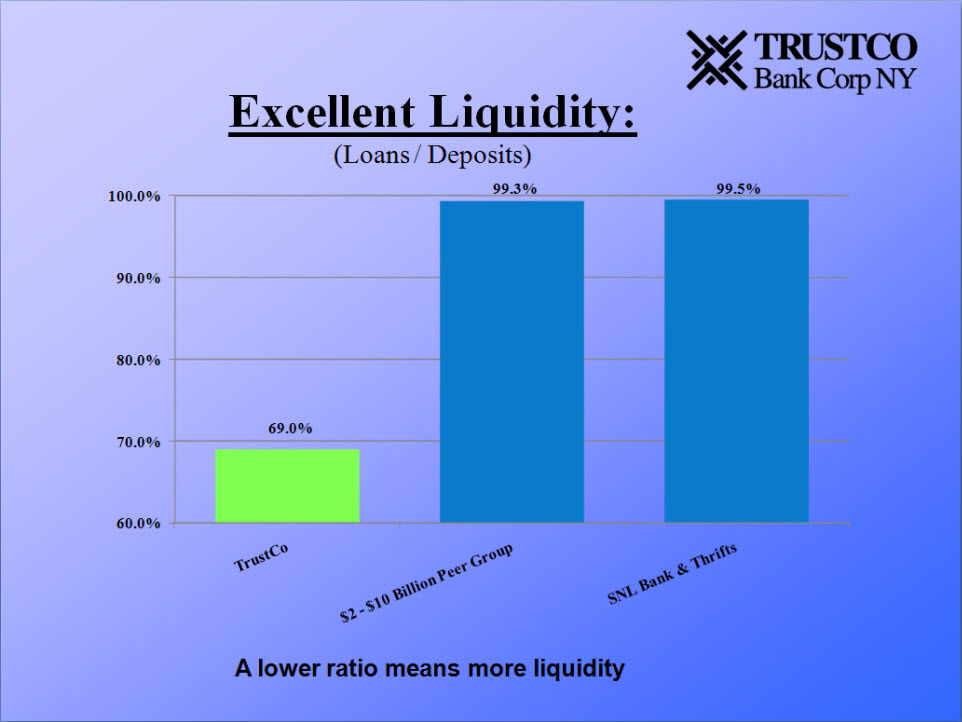
Excellent Liquidity: (Loans / Deposits) A lower ratio means more liquidity
4
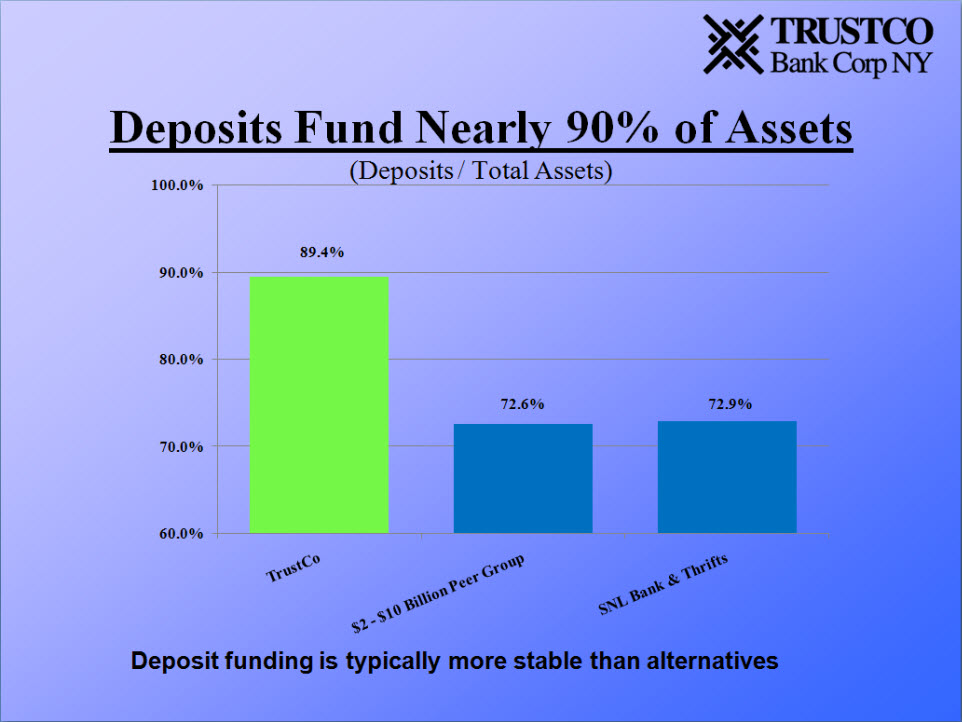
Deposits Fund Nearly 90% of Assets (Deposits / Total Assets) Deposit funding is typically more stable than alternatives
5
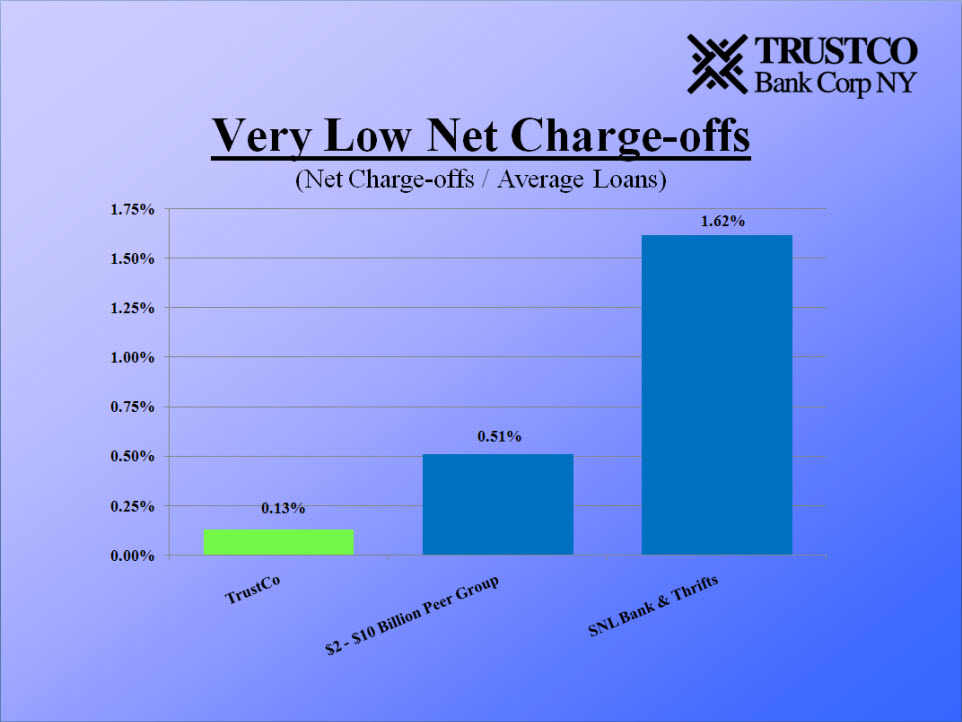
Very Low Net Charge-offs (Net Charge-offs / Average Loans)
6

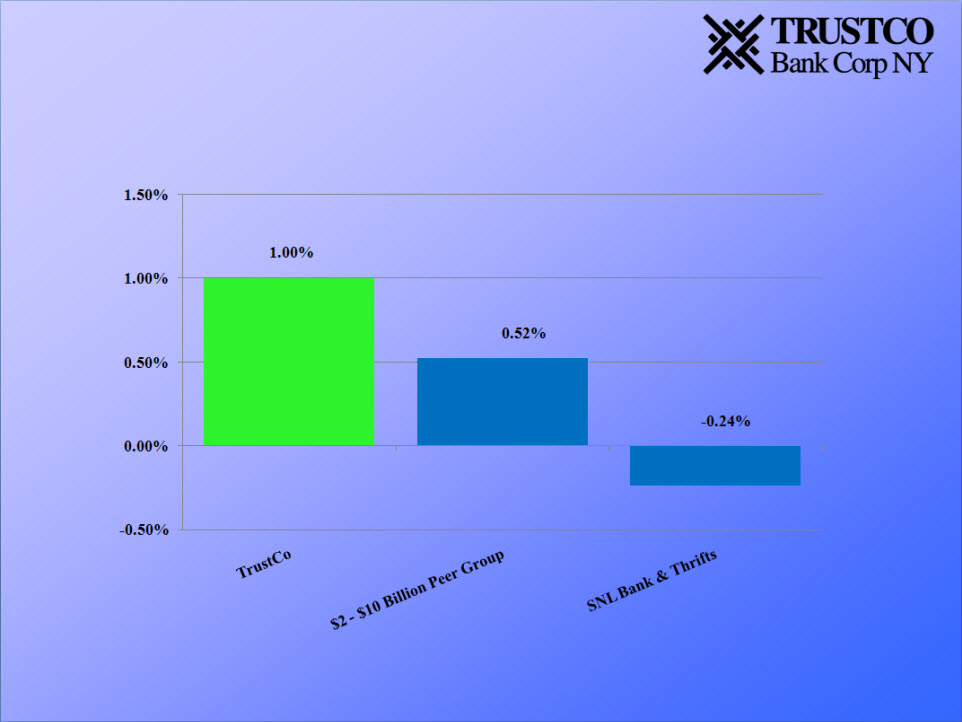
Very Strong Ratio of Reserves to Net Charge-offs Far better reserve coverage of net charge-offs than peers due to high reserves and low net charge-offs
7

Loan Portfolio Focused on Lower Risk Categories (1-4 Family Mortgage / Total Loans)
8

Sub-Prime Loans TrustCo Investment = $ 0.00
9

Government Funds Accepted:
10

Performance
11
Return on Average Assets
TrustCo vs. Peers - 2008
Profitability Remains Above Peers
12

Return on Average Equity TrustCo vs. Peers - 2008 Profitability Remains Above Peers
13
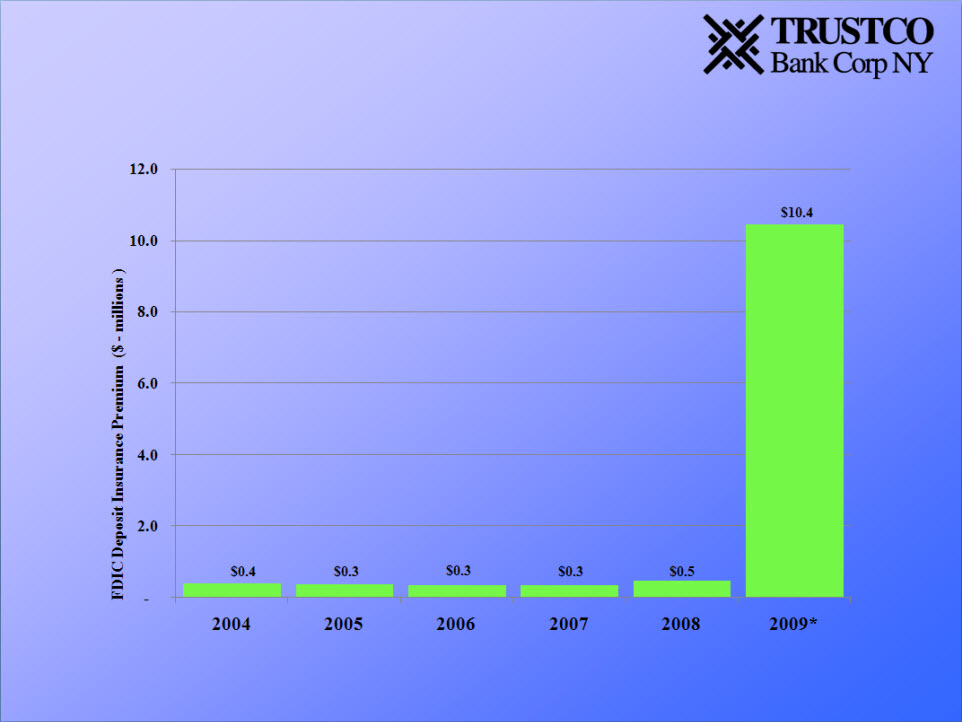
FDIC Insurance Premium
*Estimate, including currently proposed special assessment of 0.20% on deposits
14
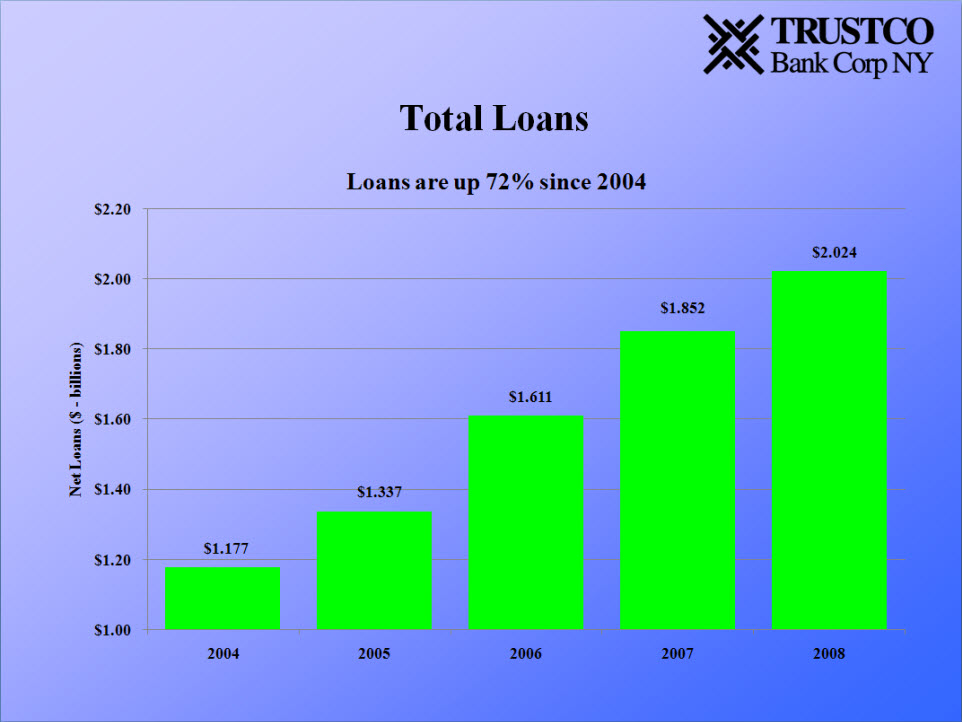
Total Loans Loans are up 72% since 2004
15
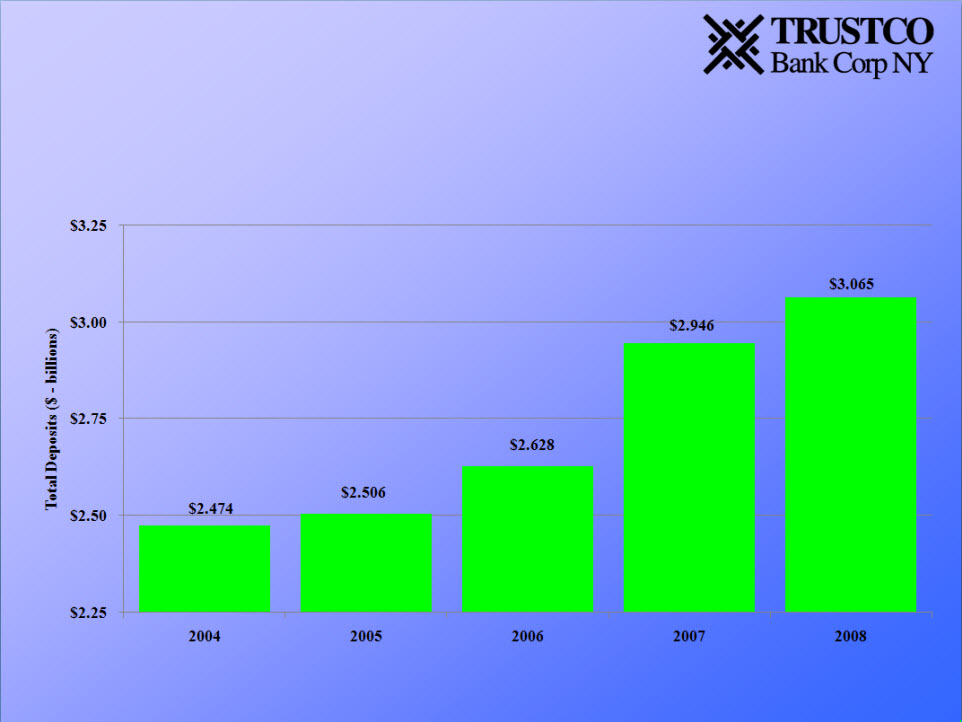
Total Deposits
Deposits are up 24% since 2004
16
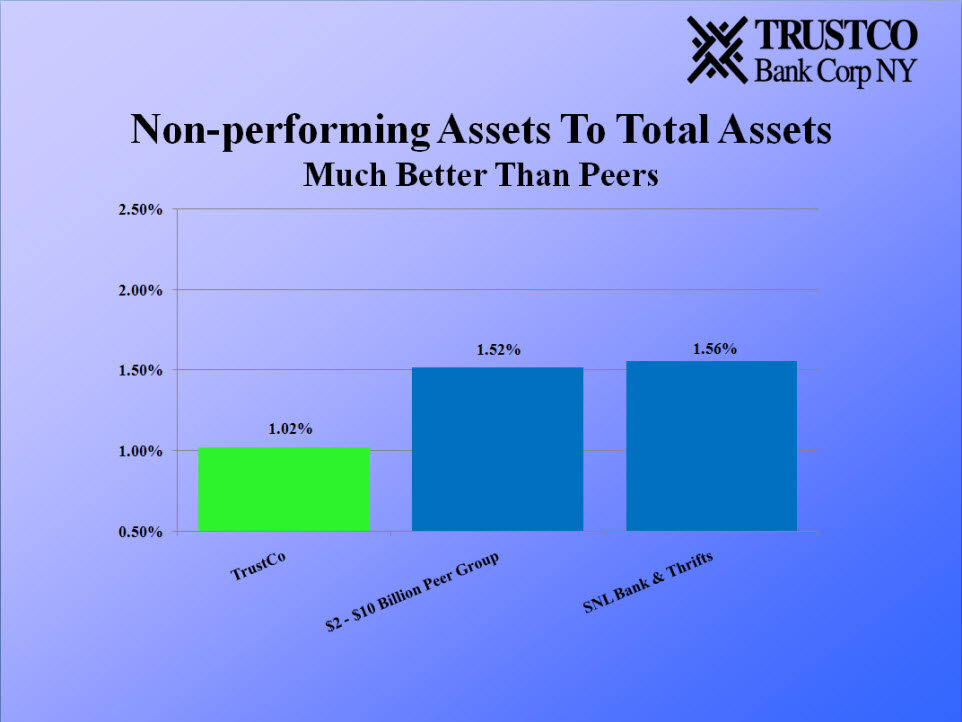
Much Better Than Peers
17

Continuing to Expand Number of Offices
18

Net Change in Number of Offices *Estimate, subject to change
19
Dividend Strategy
20
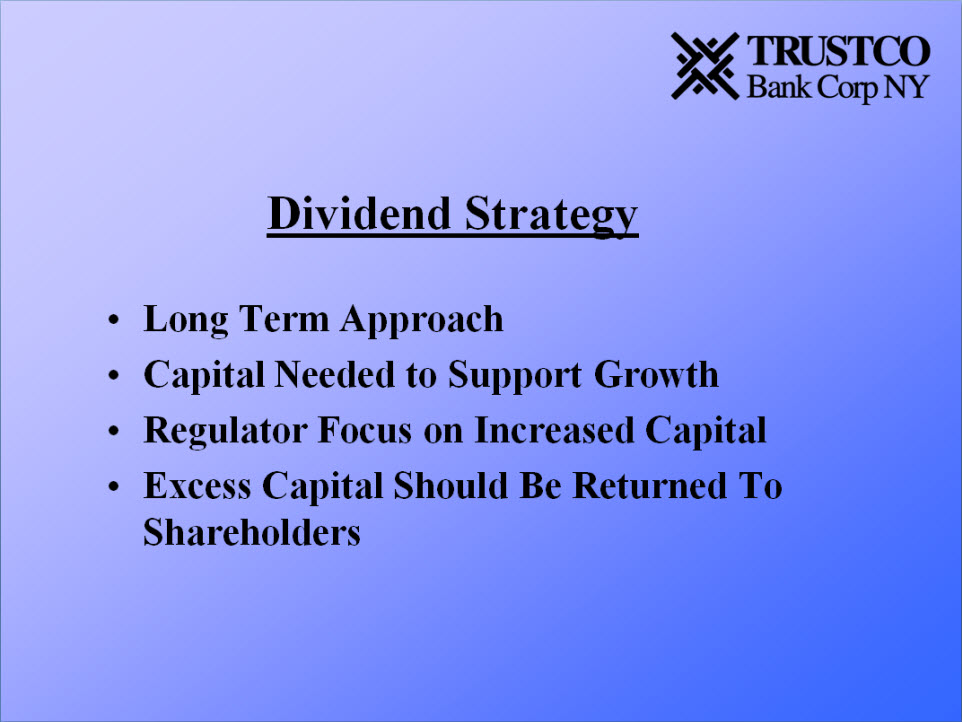
Dividend Strategy Long Term Approach Capital Needed to Support Growth Regulator Focus on Increased Capital Excess Capital Should Be Returned To Shareholders
21

Total Net Income and Dividends Paid 2003 – 2008 Net Income = $287.5 million Dividends Paid = $267.8 Million Cumulative Payout = 93.1%
22

Dividend Payout Ratio
23

TrustCo vs. Peers 2008 Dividend Payout Ratio
24
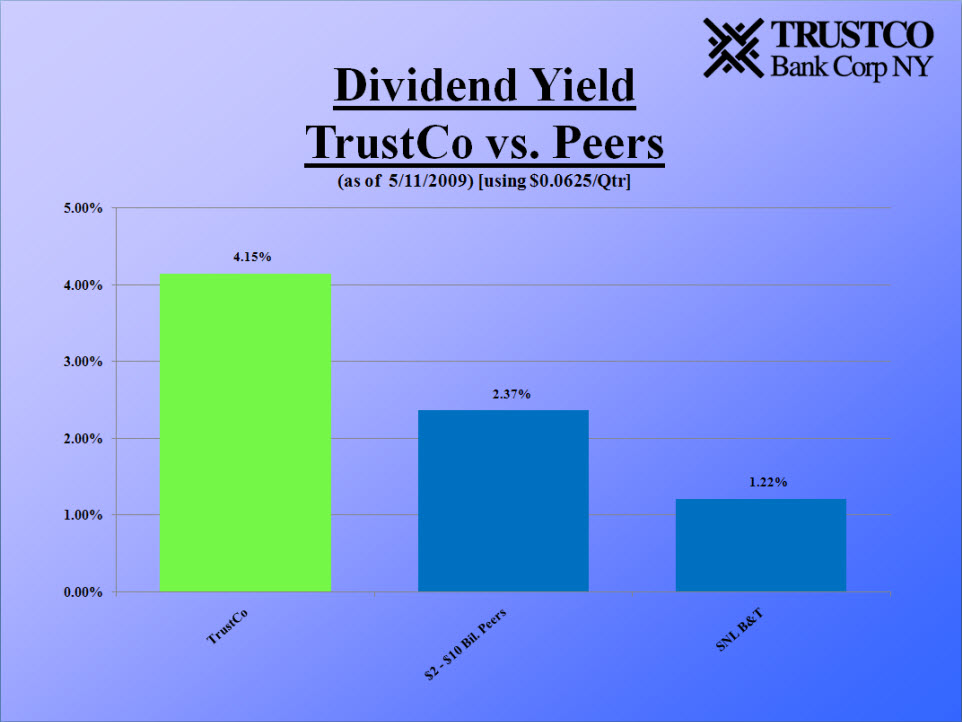
Dividend Yield TrustCo vs. Peers (as of 5/11/2009) [using $0.0625/Qtr]
25

Stock Performance
26
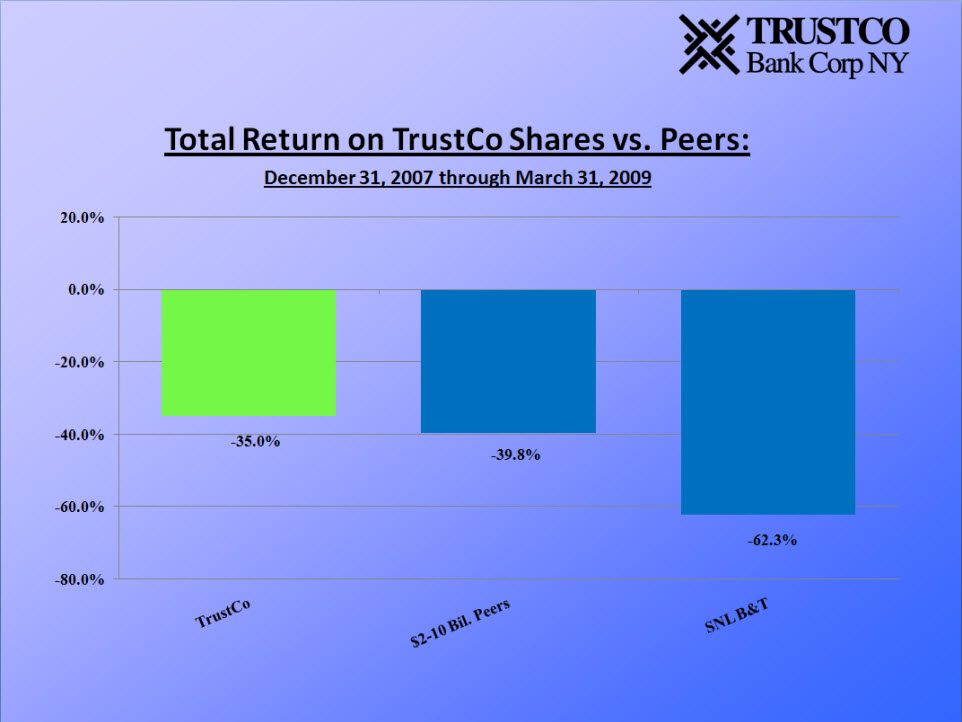
Total Return on TrustCo Shares vs. Peers: December 31, 2007 through March 31, 2009
27
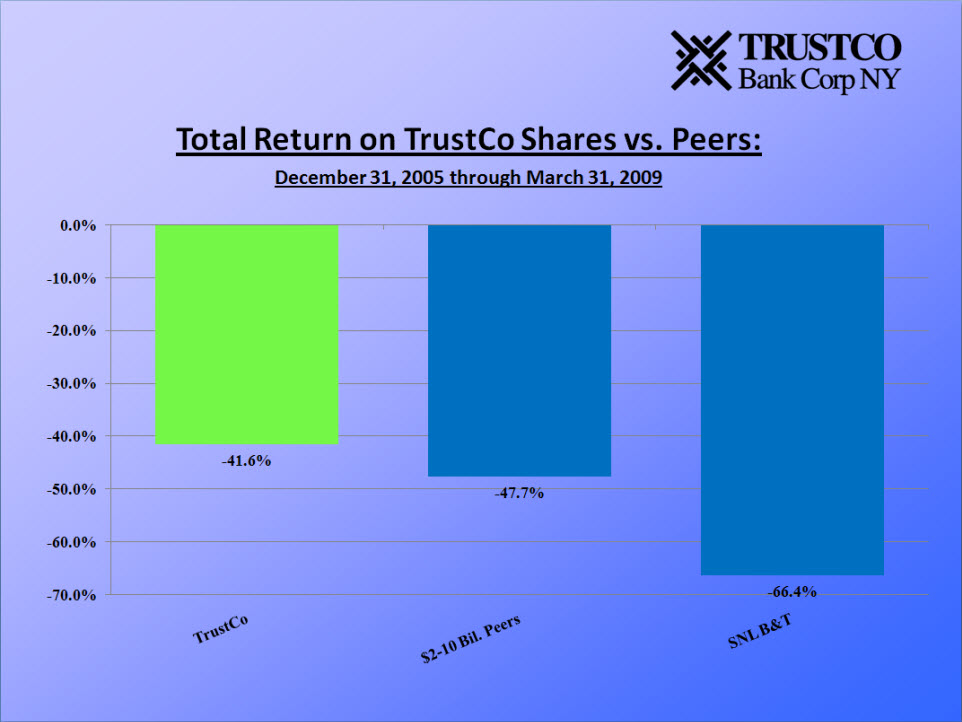
Total Return on TrustCo Shares vs. Peers: December 31, 2005 through March 31, 2009
28
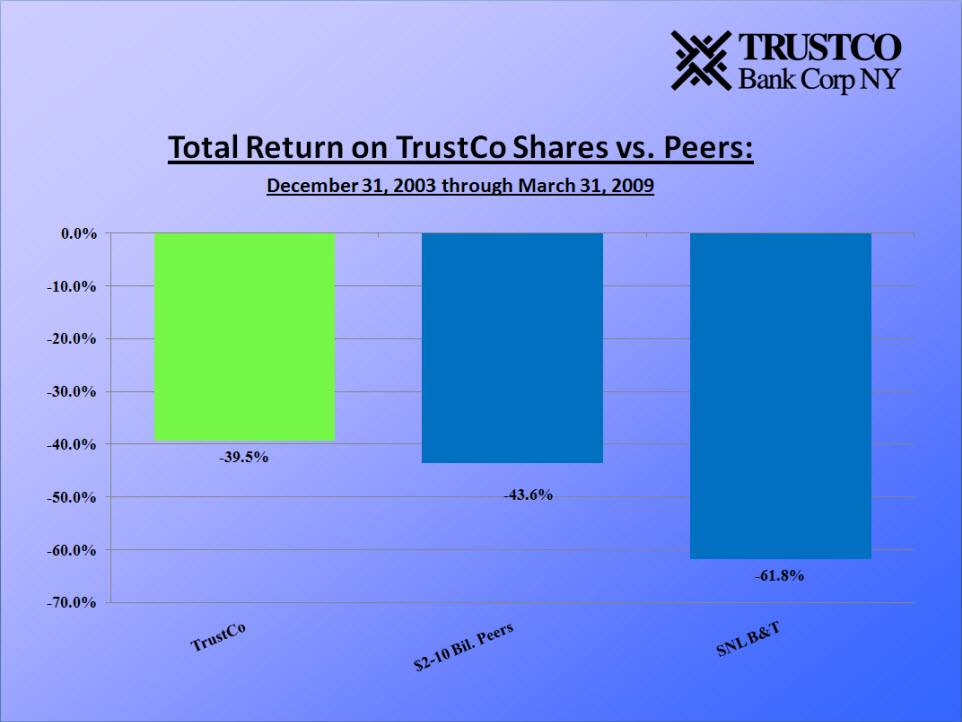
Total Return on TrustCo Shares vs. Peers: December 31, 2003 through March 31, 2009
29
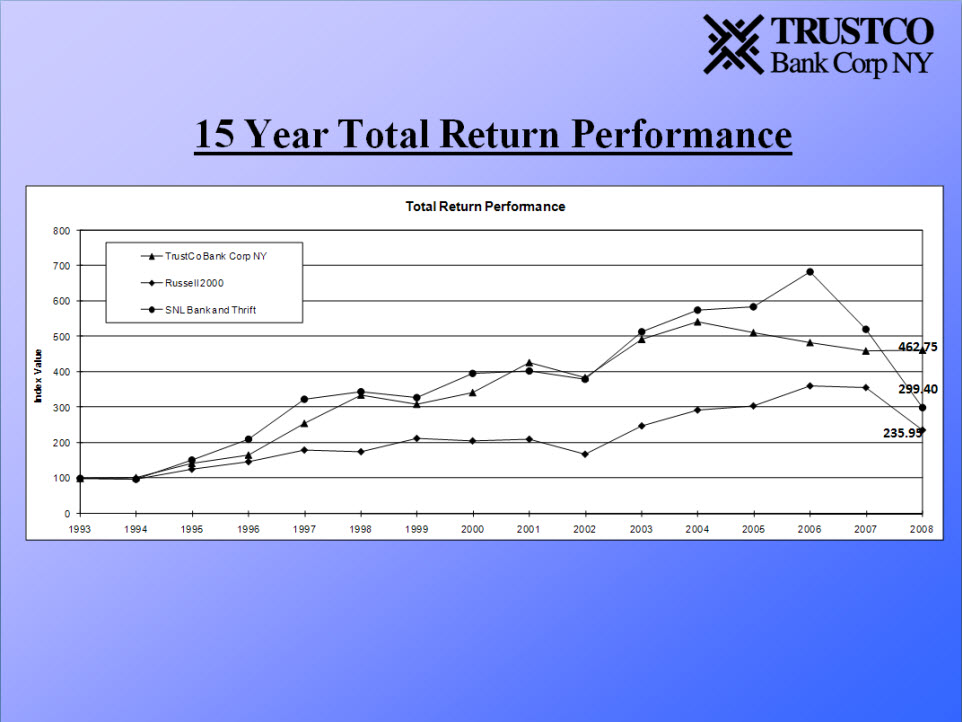
15 Year Total Return Performance
30
Executive Compensation
31
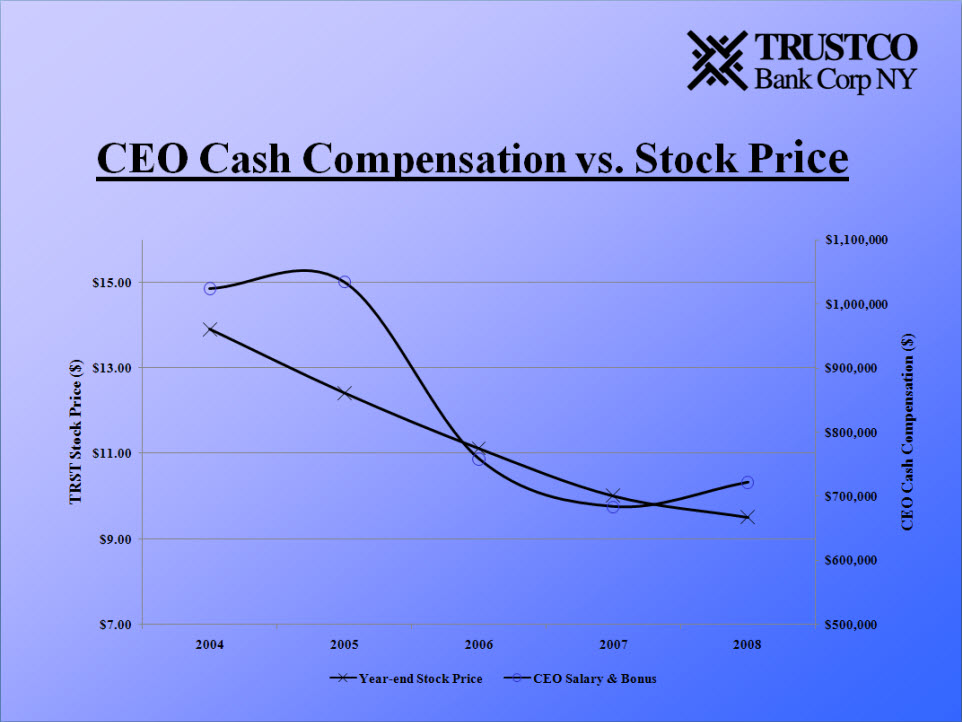
CEO Cash Compensation vs. Stock Price
32
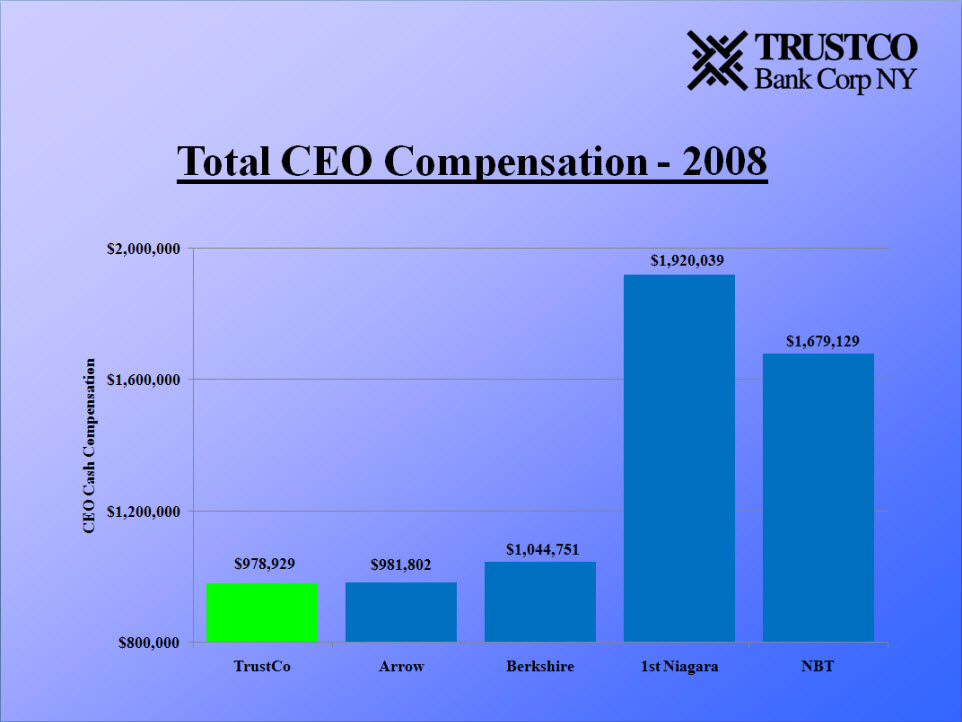
Total CEO Compensation - 2008
33
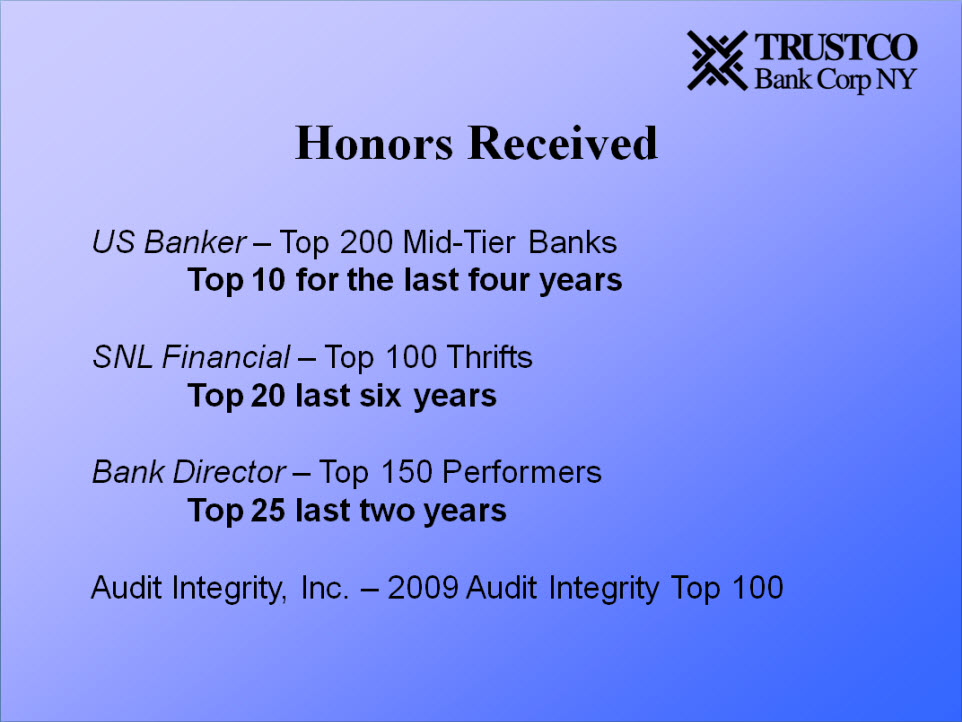
Honors Received US Banker – Top 200 Mid-Tier Banks Top 10 for the last four years SNL Financial – Top 100 Thrifts Top 20 last six years Bank Director – Top 150 Performers Top 25 last two years Audit Integrity, Inc. – 2009 Audit Integrity Top 100
34
Questions and Answers 2009 Annual Meeting
35

Thank You for Attending 2009 Annual Meeting
36