Exhibit 99(a)
Welcome to the 2016 Annual Meeting
Shareholder Assembly Agenda Balance SheetBranch Growth & Future PlansIncome Statement & Ratio AnalysisDividends & Capital GrowthStock PerformanceMarket & Regulatory EnvironmentRobert A. McCormickQuestions and Answers
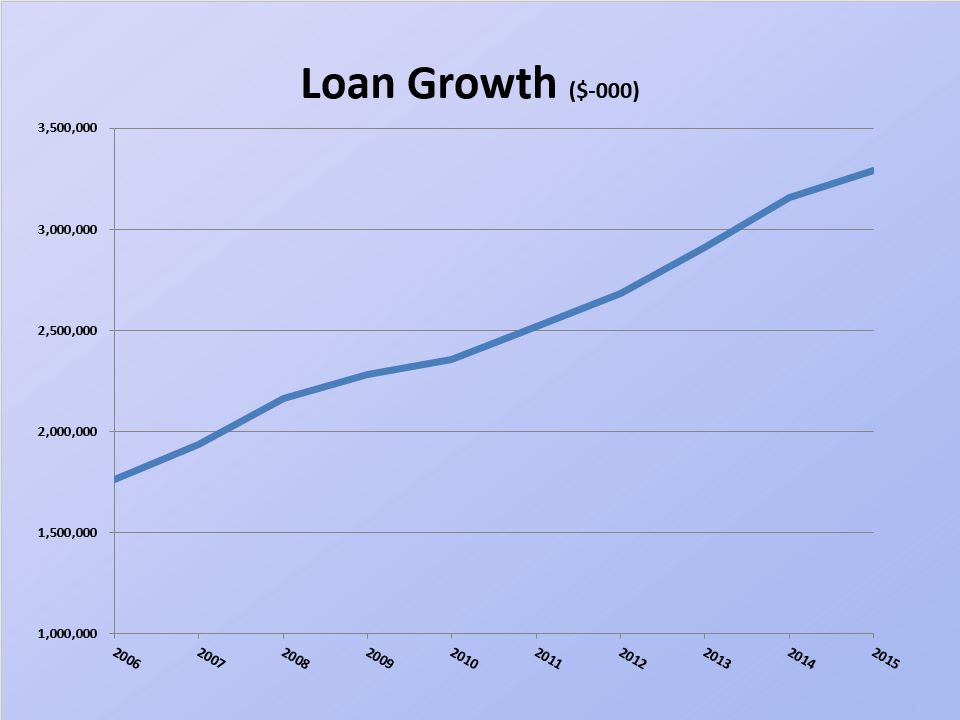
Loan Growth ($-000)
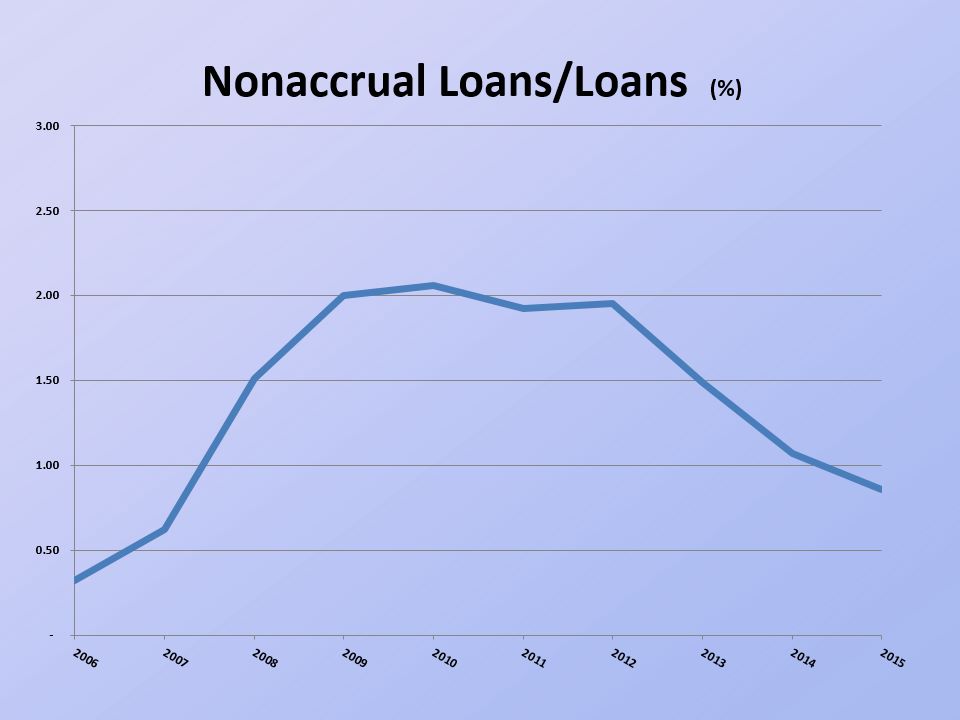
Nonaccrual Loans/Loans (%)
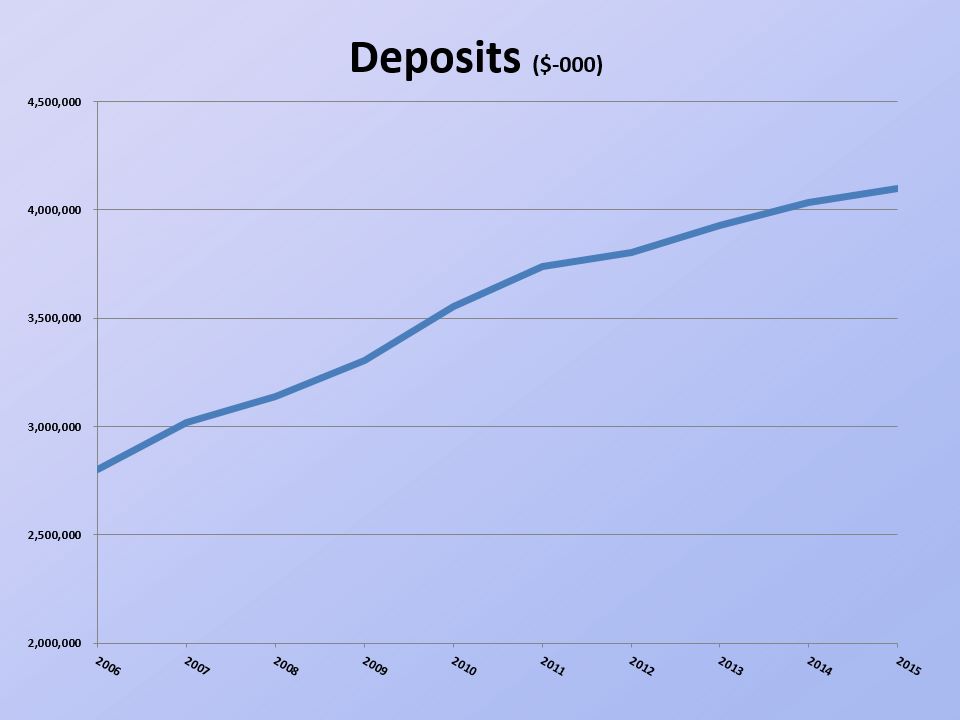
Deposits ($-000)
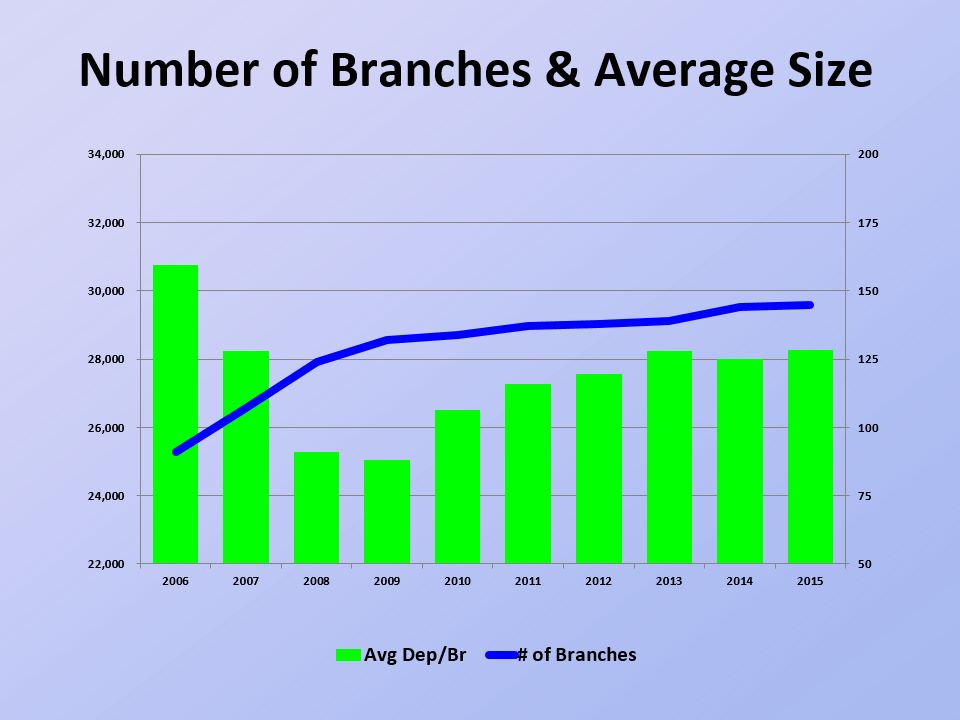
Number of Branches & Average Size

Investments & Cash to Assets (%)
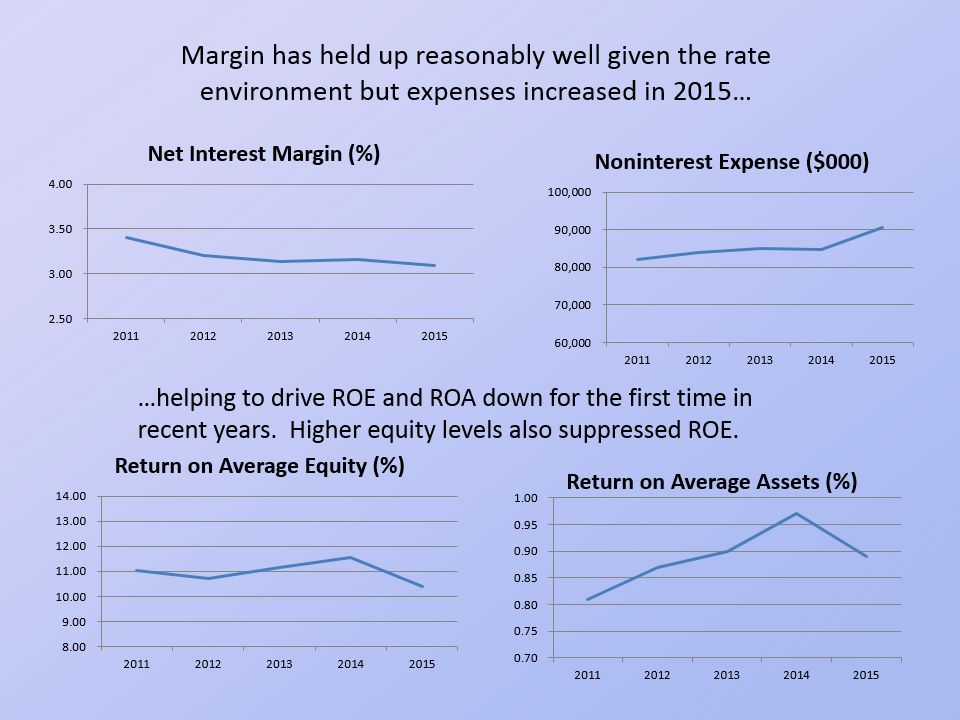
Margin has held up reasonably well given the rate environment but expenses increased in 2015… …helping to drive ROE and ROA down for the first time in recent years. Higher equity levels also suppressed ROE.
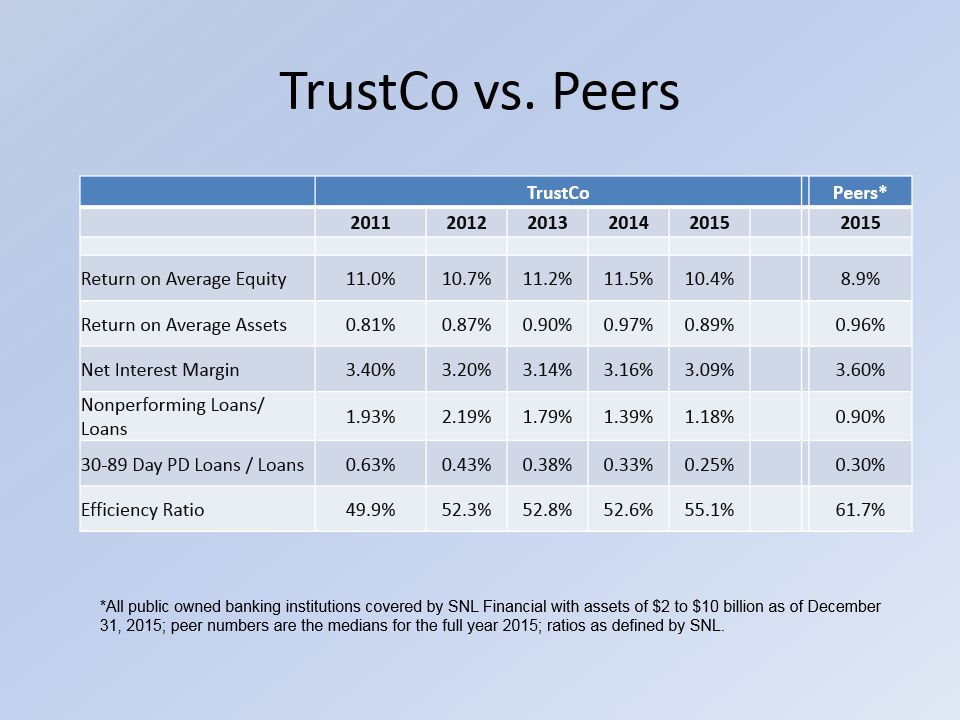
TrustCo vs. Peers *All public owned banking institutions covered by SNL Financial with assets of $2 to $10 billion as of December 31, 2015; peer numbers are the medians for the full year 2015; ratios as defined by SNL. TrustCo Peers* 2011 2012 2013 2014 2015 2015 Return on Average Equity 11.0% 10.7% 11.2% 11.5% 10.4% 8.9% Return on Average Assets 0.81% 0.87% 0.90% 0.97% 0.89% 0.96% Net Interest Margin 3.40% 3.20% 3.14% 3.16% 3.09% 3.60% Nonperforming Loans/ Loans 1.93% 2.19% 1.79% 1.39% 1.18% 0.90% 30-89 Day PD Loans / Loans 0.63% 0.43% 0.38% 0.33% 0.25% 0.30% Efficiency Ratio 49.9% 52.3% 52.8% 52.6% 55.1% 61.7%
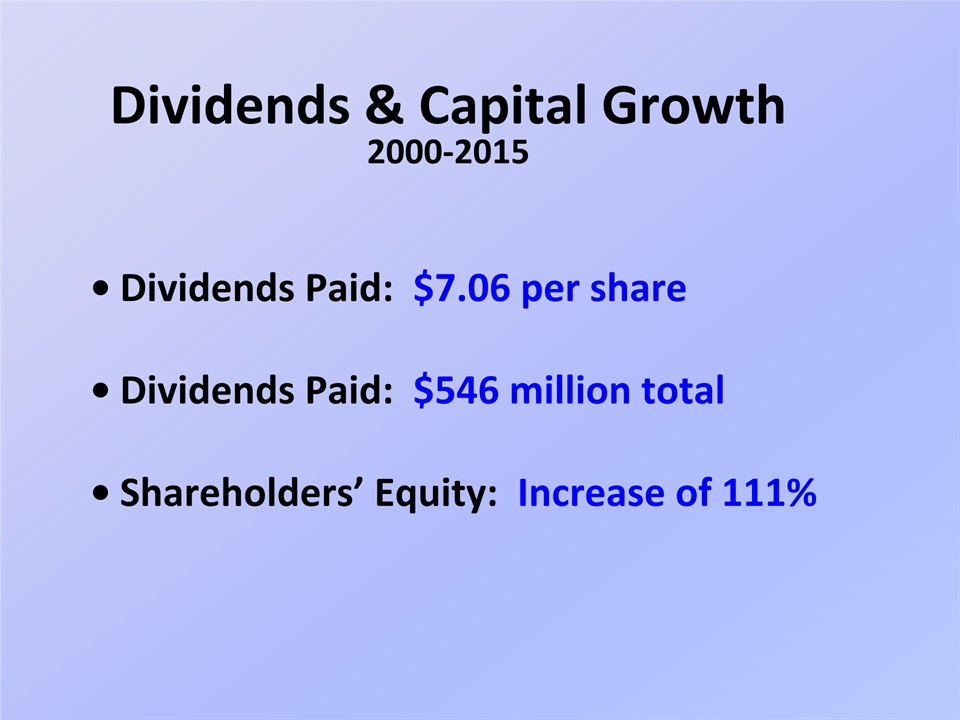
Dividends & Capital Growth2000-2015 Dividends Paid: $7.06 per shareDividends Paid: $546 million totalShareholders’ Equity: Increase of 111%
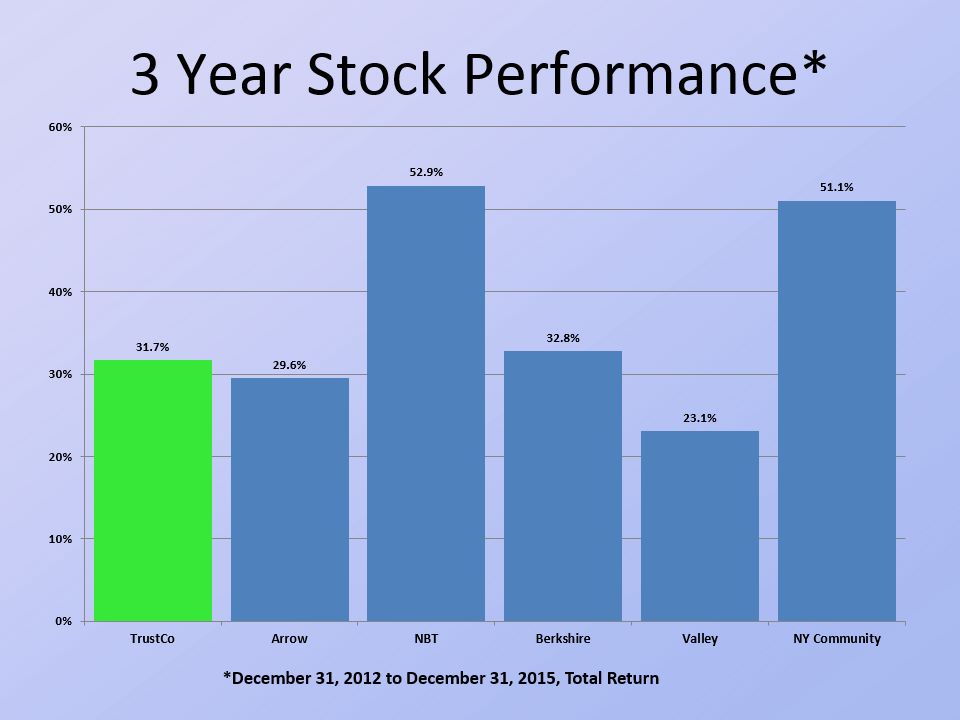
3 Year Stock Performance* *December 31, 2012 to December 31, 2015, Total Return
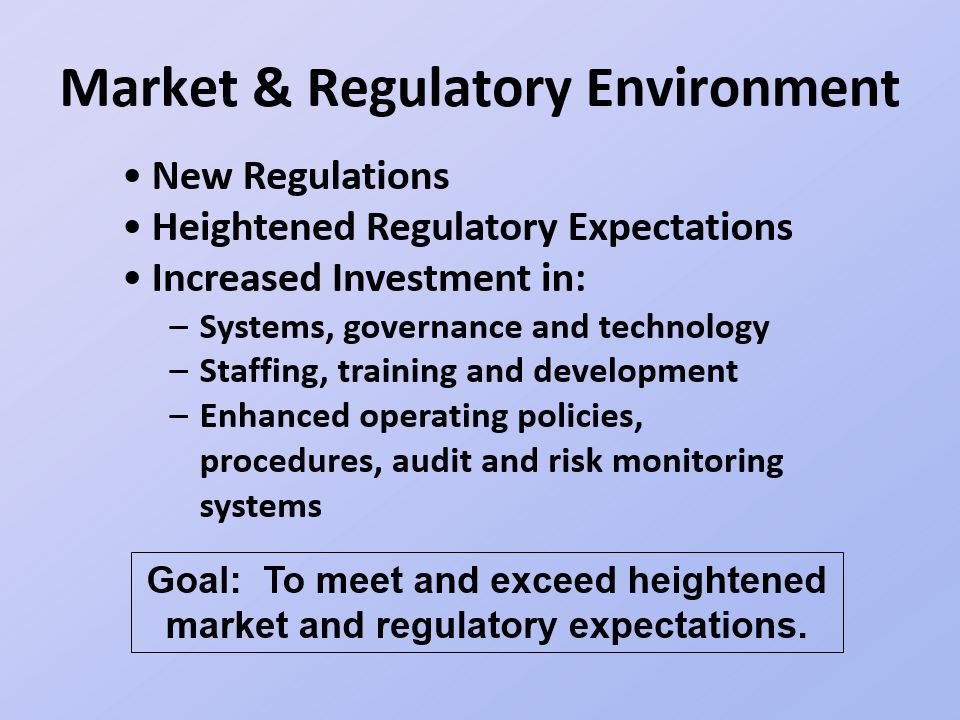
Market & Regulatory Environment New RegulationsHeightened Regulatory ExpectationsIncreased Investment in:Systems, governance and technologyStaffing, training and developmentEnhanced operating policies, procedures, audit and risk monitoring systems Goal: To meet and exceed heightened market and regulatory expectations.
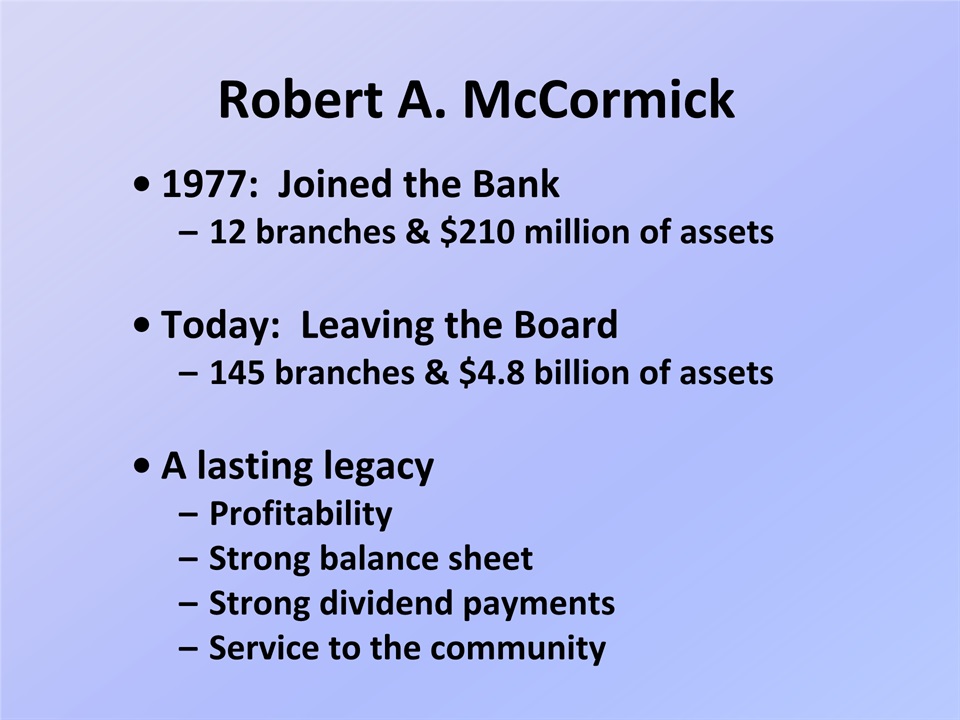
Robert A. McCormick 1977: Joined the Bank12 branches & $210 million of assetsToday: Leaving the Board145 branches & $4.8 billion of assetsA lasting legacyProfitabilityStrong balance sheetStrong dividend paymentsService to the community

Forward Looking Statements Safe Harbor Regarding Forward-Looking StatementsThis presentation may contain forward-looking information about TrustCo Bank Corp NY (“the Company”) that is intended to be covered by the safe harbor for forward-looking statements provided by the Private Securities Litigation Reform Act of 1995. Actual results and trends could differ materially from those set forth in such statements due to various risks, uncertainties and other factors. Such risks, uncertainties and other factors that could cause actual results and experience to differ from those projected include, but are not limited to, the following: credit risk, the effects of and changes in, trade, monetary and fiscal policies and laws, inflation, interest rates, market and monetary fluctuations, competition, the effect of changes in financial services laws and regulations, real estate and collateral values, changes in accounting policies and practices, changes in local market areas and general business and economic trends and the matters described under the heading “Risk Factors” in our most recent annual report on Form 10-K and our other securities filings. The statements are valid only as of the date hereof and the Company disclaims any obligation to update this information except as may be required by applicable law. Note: Data in this presentation was obtained from SNL Financial and from the Company’s SEC filings. Ratios use SNL definitions and may differ from definitions used by the Company in its own SEC filings SNL definitions are available upon request.
2016 Annual Meeting Questions and Answers
2016 Annual Meeting Thank You for Attending