| Contents | |||||
| Shareholder Letter | 1 | Semiannual Report | Financial Statements | 49 | |
| Franklin Federal Tax-Free Income Fund | 4 | Notes to Financial Statements | 52 | ||
| Performance Summary | 8 | Shareholder Information | 60 | ||
| Your Fund’s Expenses | 11 | ||||
| Financial Highlights and | |||||
| Statement of Investments | 13 | ||||
| 1
Semiannual Report
Franklin Federal Tax-Free Income Fund
Your Fund’s Goal and Main Investments: Franklin Federal Tax-Free Income Fund seeks to provide as high a level of income exempt from federal income taxes as is consistent with prudent investment management and preservation of capital by investing at least 80% of its total assets in investment-grade municipal securities that pay interest free from such taxes.1
Performance data represent past performance, which does not guarantee future results. Investment return and principal value will fluctuate, and you may have a gain or loss when you sell your shares. Current performance may differ from figures shown. Please visit franklintempleton.com or call (800) 342-5236 for most recent month-end performance.
We are pleased to bring you Franklin Federal Tax-Free Income Fund’s semi-annual report for the period ended October 31, 2011.
Performance Overview
The Fund’s Class A share price, as measured by net asset value, increased from $11.47 on April 30, 2011, to $12.00 on October 31, 2011. The Fund’s Class A shares paid dividends totaling 26.16 cents per share for the reporting period.2 The Performance Summary beginning on page 8 shows that at the
1. Dividends are generally subject to state and local taxes, if any. For investors subject to alternative minimum tax, a small portion of Fund dividends may be taxable. Distributions of capital gains are generally taxable. To avoid imposition of 28% backup withholding on all Fund distributions and redemption proceeds, U.S. investors must be properly certified on Form W-9 and non-U.S. investors on Form W-8BEN.
2. All Fund distributions will vary depending upon current market conditions, and past distributions are not indicative of future trends.
The dollar value, number of shares or principal amount, and names of all portfolio holdings are listed in the Fund’s Statement of Investments (SOI). The SOI begins on page 17.
4 | Semiannual Report
| Dividend Distributions2 | ||||
| Dividend per Share | ||||
| Month | Class A | Class B | Class C | Advisor Class |
| May | 4.36 cents | 3.83 cents | 3.85 cents | 4.45 cents |
| June | 4.36 cents | 3.82 cents | 3.84 cents | 4.46 cents |
| July | 4.36 cents | 3.82 cents | 3.84 cents | 4.46 cents |
| August | 4.36 cents | 3.82 cents | 3.84 cents | 4.46 cents |
| September | 4.36 cents | 3.76 cents | 3.82 cents | 4.45 cents |
| October | 4.36 cents | 3.76 cents | 3.82 cents | 4.45 cents |
end of this reporting period the Fund’s Class A shares’ distribution rate was 4.18% based on an annualization of October’s 4.36 cent per share dividend and the maximum offering price of $12.53 on October 31, 2011. An investor in the 2011 maximum federal personal income tax bracket of 35.00% would need to earn a distribution rate of 6.43% from a taxable investment to match the Fund’s Class A tax-free distribution rate. For the Fund’s Class B, C and Advisor shares’ performance, please see the Performance Summary.
Municipal Bond Market Overview
For the six months ended October 31, 2011, the municipal bond market posted a gain of 5.56% as measured by the Barclays Capital (BC) Municipal Bond Index, which tracks investment-grade municipal securities.3 During the same period, Treasuries fared well, rising 6.90% according to the BC U.S. Treasury Index, which tracks various U.S. Treasury securities.3
During the reporting period, domestic and global events affected the municipal bond market. Domestically, the economic recovery slowly made gains with real gross domestic product rising modestly in the second and third quarters of 2011. In Europe, several countries struggled with financial challenges. Amid this volatile environment, the municipal bond market delivered strong results. The tax-exempt market enjoyed an extended period of low supply, thus reducing the availability of bonds to meet investor demand. This reduced supply resulted mostly from the expiration of the Build America Bonds (BAB) program. Total municipal bond issuance was $230 billion from January through October 2011, or approximately 33% less than the same period in 2010.4
3. Source: © 2011 Morningstar. All Rights Reserved. The information contained herein: (1) is proprietary to Morningstar and/or its content providers; (2) may not be copied or distributed; and (3) is not warranted to be accurate, complete or timely. Neither Morningstar nor its content providers are responsible for any damages or losses arising from any use of this information.
4. Source: Thomson Reuters, “A Decade of Municipal Bond Finance,” 11/9/11.
Semiannual Report | 5
The Federal Reserve Board’s (Fed’s) commitment to maintain an accommodative monetary policy stance with historically low interest rates further supported the municipal market. Municipal bond after-tax yields generally were more attractive than those of other high-quality, taxable bonds.
On August 2, 2011, the U.S. raised its debt ceiling and avoided defaulting on its debt obligations. Independent credit rating agency Standard & Poor’s (S&P) lowered the country’s long-term rating to AA+ from AAA, citing political risks and a rising debt burden.5 A few days later, S&P similarly lowered the long-term ratings of government-sponsored enterprises (GSEs) such as Fannie Mae and Freddie Mac. In addition, all municipal bonds backed by the U.S. government or GSEs were downgraded along with the country’s rating.
S&P’s downgrade of U.S. Treasury securities led to the review of more than 11,000 municipal credits supported by federal programs and agency escrows. Primarily, prerefunded municipals and housing bonds tied to federal subsidy programs were affected by the downgrade. The rating agency continues to review the universe of credits, stating that state and municipal governments that rely less on the national government for revenue and that manage their budgets well enough to weather declines in such funding may retain AAA ratings.
Moody’s Investors Service, another independent credit rating agency, on July 19, 2011, placed five AAA-rated states on its watch list for potential rating cuts based on their dependency on federal funding. After the debt ceiling was raised, Moody’s reconfirmed the AAA rating to states and public finance issuers previously identified as directly or indirectly linked to the U.S. government.5 The same credits are currently assigned a negative outlook based on the identification of certain shared characteristics. The rating agencies planned to review the group of securities based on individual merit in subsequent weeks.
Raising the debt ceiling was agreed upon only with stipulations. Congress enacted the Budget Control Act of 2011 with the potential to reduce the federal deficit by approximately $2 trillion by 2021. While the plan of action is unknown, one can expect it to impact state and local programs dependent on federal subsidies. State and local officials may need to reevaluate current budget forecasts and the potential effects. One important element to recognize is that most states are constitutionally required to balance their budgets regardless of any monetary changes in aid received from the federal government.
During this reporting period, state and local officials made unpopular and difficult decisions to close budget gaps. Proactive states successfully balanced and passed budgets on time using a variety of measures. For example, they raised tuition and fees at higher education institutions, reduced government expenditures by eliminating and consolidating departments, and lowered aid
5. These do not indicate ratings of the Fund.
6 | Semiannual Report
to various programs. Despite the challenges, many states continued to show mild growth in state revenues.
At period-end, the current climate of low tax-exempt issuance and accommodative Fed policy led us to maintain a positive view of the municipal bond market. Municipal bonds continued to offer attractive yields when compared with Treasury bonds. We intend to follow our solid discipline of investing to maximize income while seeking value in the municipal bond market to offer our shareholders a monthly tax-free distribution.
Investment Strategy
We use a consistent, disciplined strategy in an effort to maximize tax-exempt income for our shareholders by seeking to maintain exposure to higher coupon securities while balancing risk and return within the Fund’s range of allowable investments. We generally employ a buy-and-hold approach and invest in securities we believe should provide the most relative value in the market. As we invest during different interest rate environments, the Fund’s portfolio remains diversified with a broad range of securities. This broad diversification may help mitigate interest rate risk. We do not use leverage or exotic derivatives, nor do we use hedging techniques that could add volatility and contribute to underperformance in adverse markets. We generally stay fully invested to help maximize income distribution.
Manager’s Discussion
Our value-oriented philosophy of investing primarily for income and stability of principal, when combined with a positive-sloping municipal yield curve, favored longer term bonds during the six months under review. Consistent with our strategy, we sought to remain fully invested in bonds ranging from 20 to 30 years in maturity with good call features. Our relative-value, income-oriented philosophy also led the Fund to maintain its positions in higher coupon bonds, which provided income performance during the reporting period. We believe our conservative, buy-and-hold investment strategy can help us achieve high, current, tax-free income for shareholders.
Thank you for your continued participation in Franklin Federal Tax-Free Income Fund. We look forward to serving your future investment needs.
The foregoing information reflects our analysis, opinions and portfolio holdings as of October 31, 2011, the end of the reporting period. The way we implement our main investment strategies and the resulting portfolio holdings may change depending on factors such as market and economic conditions. These opinions may not be relied upon as investment advice or an offer for a particular security. The information is not a complete analysis of every aspect of any market, country, industry, security or the Fund. Statements of fact are from sources considered reliable, but the investment manager makes no representation or warranty as to their completeness or accuracy. Although historical performance is no guarantee of future results, these insights may help you understand our investment management philosophy.
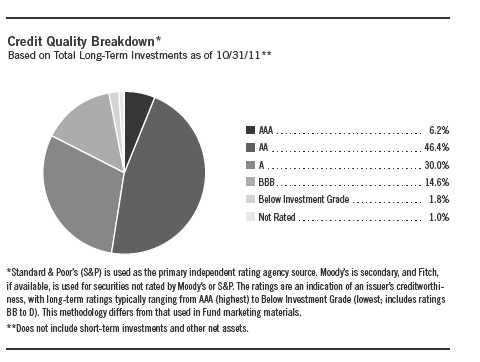
| Portfolio Breakdown |
| 10/31/11 |
| % of Total |
| Long-Term Investments* |
| Utilities | 16.7 | % |
| General Obligation | 16.2 | % |
| Transportation | 15.9 | % |
| Hospital & Health Care | 12.4 | % |
| Subject to Government Appropriations | 11.3 | % |
| Tax-Supported | 6.8 | % |
| Other Revenue | 6.5 | % |
| Refunded | 6.1 | % |
| Higher Education | 5.5 | % |
| Corporate-Backed | 1.3 | % |
| Housing | 1.3 | % |
*Does not include short-term investments and other net assets.
Semiannual Report | 7
Performance Summary as of 10/31/11
Your dividend income will vary depending on dividends or interest paid by securities in the Fund’s portfolio, adjusted for operating expenses of each class. Capital gain distributions are net profits realized from the sale of portfolio securities. The performance table does not reflect any taxes that a shareholder would pay on Fund dividends, capital gain distributions, if any, or any realized gains on the sale of Fund shares. Total return reflects reinvestment of the Fund’s dividends and capital gain distributions, if any, and any unrealized gains or losses.
| Price and Distribution Information | ||||||||
| Class A (Symbol: FKTIX) | Change | 10/31/11 | 4/30/11 | |||||
| Net Asset Value (NAV) | +$ | 0.53 | $ | 12.00 | $ | 11.47 | ||
| Distributions (5/1/11–10/31/11) | ||||||||
| Dividend Income | $ | 0.2616 | ||||||
| Class B (Symbol: FFTBX) | Change | 10/31/11 | 4/30/11 | |||||
| Net Asset Value (NAV) | +$ | 0.53 | $ | 12.00 | $ | 11.47 | ||
| Distributions (5/1/11–10/31/11) | ||||||||
| Dividend Income | $ | 0.2281 | ||||||
| Class C (Symbol: FRFTX) | Change | 10/31/11 | 4/30/11 | |||||
| Net Asset Value (NAV) | +$ | 0.54 | $ | 12.00 | $ | 11.46 | ||
| Distributions (5/1/11–10/31/11) | ||||||||
| Dividend Income | $ | 0.2301 | ||||||
| Advisor Class (Symbol: FAFTX) | Change | 10/31/11 | 4/30/11 | |||||
| Net Asset Value (NAV) | +$ | 0.53 | $ | 12.01 | $ | 11.48 | ||
| Distributions (5/1/11–10/31/11) | ||||||||
| Dividend Income | $ | 0.2673 | ||||||
8 | Semiannual Report
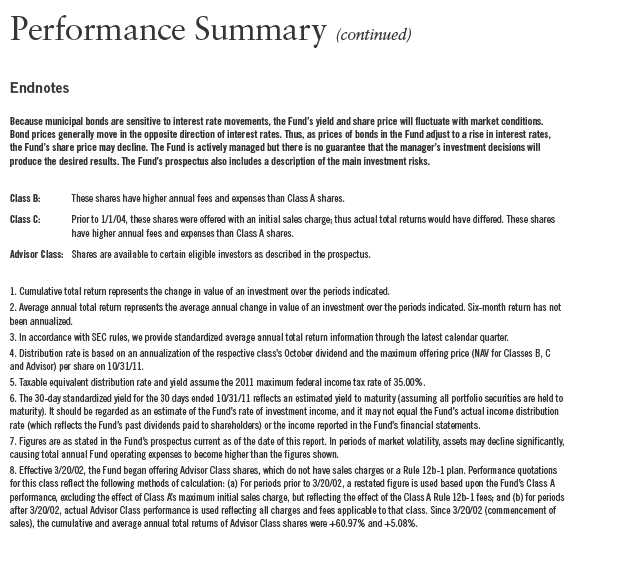
Performance Summary (continued)
Performance
Cumulative total return excludes sales charges. Average annual total returns include maximum sales charges. Class A: 4.25% maximum initial sales charge; Class B: contingent deferred sales charge (CDSC) declining from 4% to 1% over six years, and eliminated thereafter; Class C: 1% CDSC in first year only; Advisor Class: no sales charges.
| Class A | 6-Month | 1-Year | 5-Year | 10-Year | ||||||||||
| Cumulative Total Return1 | + | 6.98 | % | + | 4.14 | % | + | 23.45 | % | + | 58.36 | % | ||
| Average Annual Total Return2 | + | 2.42 | % | -0.25 | % | + | 3.40 | % | + | 4.25 | % | |||
| Avg. Ann. Total Return (9/30/11)3 | -0.31 | % | + | 3.63 | % | + | 4.39 | % | ||||||
| Distribution Rate4 | 4.18 | % | ||||||||||||
| Taxable Equivalent Distribution Rate5 | 6.43 | % | ||||||||||||
| 30-Day Standardized Yield6 | 3.43 | % | ||||||||||||
| Taxable Equivalent Yield5 | 5.28 | % | ||||||||||||
| Total Annual Operating Expenses7 | 0.62 | % | ||||||||||||
| Class B | 6-Month | 1-Year | 5-Year | 10-Year | ||||||||||
| Cumulative Total Return1 | + | 6.67 | % | + | 3.53 | % | + | 20.09 | % | + | 51.44 | % | ||
| Average Annual Total Return2 | + | 2.67 | % | -0.45 | % | + | 3.39 | % | + | 4.24 | % | |||
| Avg. Ann. Total Return (9/30/11)3 | -0.38 | % | + | 3.61 | % | + | 4.38 | % | ||||||
| Distribution Rate4 | 3.76 | % | ||||||||||||
| Taxable Equivalent Distribution Rate5 | 5.78 | % | ||||||||||||
| 30-Day Standardized Yield6 | 3.04 | % | ||||||||||||
| Taxable Equivalent Yield5 | 4.68 | % | ||||||||||||
| Total Annual Operating Expenses7 | 1.17 | % | ||||||||||||
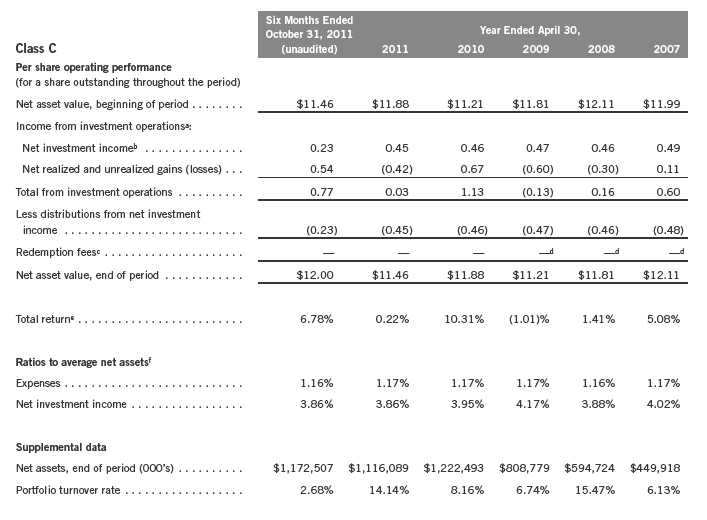
| Class C | 6-Month | 1-Year | 5-Year | 10-Year | ||||||||||
| Cumulative Total Return1 | + | 6.78 | % | + | 3.57 | % | + | 20.20 | % | + | 49.95 | % | ||
| Average Annual Total Return2 | + | 5.78 | % | + | 2.57 | % | + | 3.75 | % | + | 4.13 | % | ||
| Avg. Ann. Total Return (9/30/11)3 | + | 2.65 | % | + | 3.96 | % | + | 4.27 | % | |||||
| Distribution Rate4 | 3.82 | % | ||||||||||||
| Taxable Equivalent Distribution Rate5 | 5.88 | % | ||||||||||||
| 30-Day Standardized Yield6 | 3.03 | % | ||||||||||||
| Taxable Equivalent Yield5 | 4.66 | % | ||||||||||||
| Total Annual Operating Expenses7 | 1.17 | % | ||||||||||||
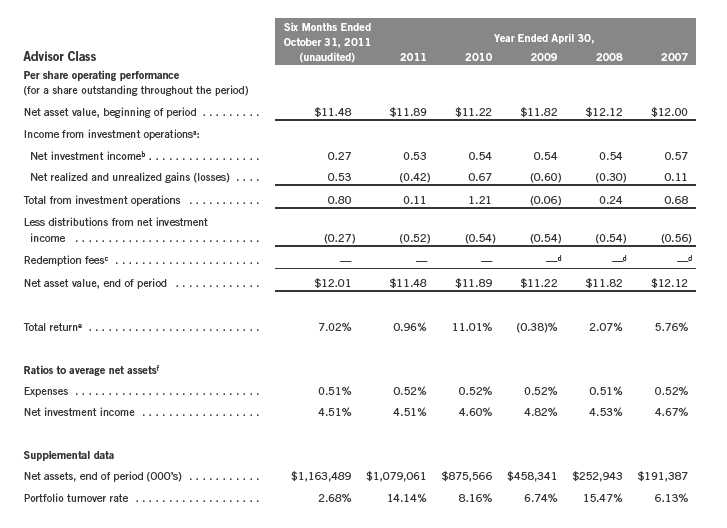
| Advisor Class8 | 6-Month | 1-Year | 5-Year | 10-Year | ||||||||||
| Cumulative Total Return1 | + | 7.02 | % | + | 4.23 | % | + | 24.11 | % | + | 59.83 | % | ||
| Average Annual Total Return2 | + | 7.02 | % | + | 4.23 | % | + | 4.41 | % | + | 4.80 | % | ||
| Avg. Ann. Total Return (9/30/11)3 | + | 4.31 | % | + | 4.63 | % | + | 4.94 | % | |||||
| Distribution Rate4 | 4.45 | % | ||||||||||||
| Taxable Equivalent Distribution Rate5 | 6.85 | % | ||||||||||||
| 30-Day Standardized Yield6 | 3.68 | % | ||||||||||||
| Taxable Equivalent Yield5 | 5.66 | % | ||||||||||||
| Total Annual Operating Expenses7 | 0.52 | % |
Performance data represent past performance, which does not guarantee future results. Investment return and principal value will fluctuate, and you may have a gain or loss when you sell your shares. Current performance may differ from figures shown. For most recent month-end performance, go to franklintempleton.com or call (800) 342-5236.
Semiannual Report | 9

Your Fund’s Expenses
As a Fund shareholder, you can incur two types of costs:
- Transaction costs, including sales charges (loads) on Fund purchases; and
- Ongoing Fund costs, including management fees, distribution and service (12b-1) fees, and other Fund expenses. All mutual funds have ongoing costs, sometimes referred to as operating expenses.
The following table shows ongoing costs of investing in the Fund and can help you understand these costs and compare them with those of other mutual funds. The table assumes a $1,000 investment held for the six months indicated.
Actual Fund Expenses
The first line (Actual) for each share class listed in the table provides actual account values and expenses. The “Ending Account Value” is derived from the Fund’s actual return, which includes the effect of Fund expenses.
You can estimate the expenses you paid during the period by following these steps. Of course, your account value and expenses will differ from those in this illustration:
| 1. | Divide your account value by $1,000. |
| If an account had an $8,600 value, then $8,600 ÷ $1,000 = 8.6. | |
| 2. | Multiply the result by the number under the heading “Expenses Paid During Period.” |
| If Expenses Paid During Period were $7.50, then 8.6 x $7.50 = $64.50. |
In this illustration, the estimated expenses paid this period are $64.50.
Hypothetical Example for Comparison with Other Funds
Information in the second line (Hypothetical) for each class in the table can help you compare ongoing costs of investing in the Fund with those of other mutual funds. This information may not be used to estimate the actual ending account balance or expenses you paid during the period. The hypothetical “Ending Account Value” is based on the actual expense ratio for each class and an assumed 5% annual rate of return before expenses, which does not represent the Fund’s actual return. The figure under the heading “Expenses Paid During Period” shows the hypothetical expenses your account would have incurred under this scenario. You can compare this figure with the 5% hypothetical examples that appear in shareholder reports of other funds.
Semiannual Report | 11
Your Fund’s Expenses (continued)
Please note that expenses shown in the table are meant to highlight ongoing costs and do not reflect any transaction costs, such as sales charges. Therefore, the second line for each class is useful in comparing ongoing costs only, and will not help you compare total costs of owning different funds. In addition, if transaction costs were included, your total costs would have been higher. Please refer to the Fund prospectus for additional information on operating expenses.
| Beginning Account | Ending Account | Expenses Paid During | ||||
| Class A | Value 5/1/11 | Value 10/31/11 | Period* 5/1/11–10/31/11 | |||
| Actual | $ | 1,000 | $ | 1,069.80 | $ | 3.17 |
| Hypothetical (5% return before expenses) | $ | 1,000 | $ | 1,022.07 | $ | 3.10 |
| Class B | ||||||
| Actual | $ | 1,000 | $ | 1,066.70 | $ | 6.03 |
| Hypothetical (5% return before expenses) | $ | 1,000 | $ | 1,019.30 | $ | 5.89 |
| Class C | ||||||
| Actual | $ | 1,000 | $ | 1,067.80 | $ | 6.03 |
| Hypothetical (5% return before expenses) | $ | 1,000 | $ | 1,019.30 | $ | 5.89 |
| Advisor Class | ||||||
| Actual | $ | 1,000 | $ | 1,070.20 | $ | 2.65 |
| Hypothetical (5% return before expenses) | $ | 1,000 | $ | 1,022.57 | $ | 2.59 |
*Expenses are calculated using the most recent six-month expense ratio, annualized for each class (A: 0.61%; B: 1.16%; C: 1.16%; and Advisor: 0.51%), multiplied by the average account value over the period, multiplied by 184/366 to reflect the one-half year period.
12 | Semiannual Report
Franklin Federal Tax-Free Income Fund
Financial Highlights
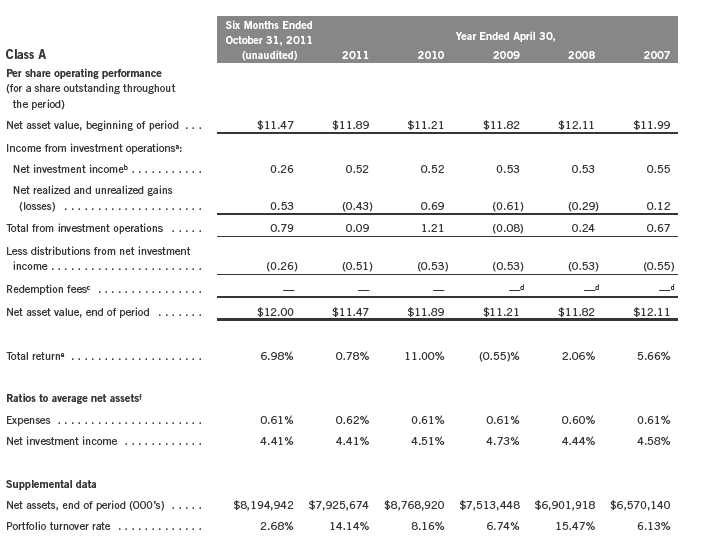
aThe amount shown for a share outstanding throughout the period may not correlate with the Statement of Operations for the period due to the timing of sales and repurchases of
the Fund shares in relation to income earned and/or fluctuating market value of the investments of the Fund.
bBased on average daily shares outstanding.
cEffective September 1, 2008, the redemption fee was eliminated.
dAmount rounds to less than $0.01 per share.
eTotal return does not reflect sales commissions or contingent deferred sales charges, if applicable, and is not annualized for periods less than one year.
fRatios are annualized for periods less than one year.
Semiannual Report | The accompanying notes are an integral part of these financial statements. | 13
Franklin Federal Tax-Free Income Fund
Financial Highlights (continued)
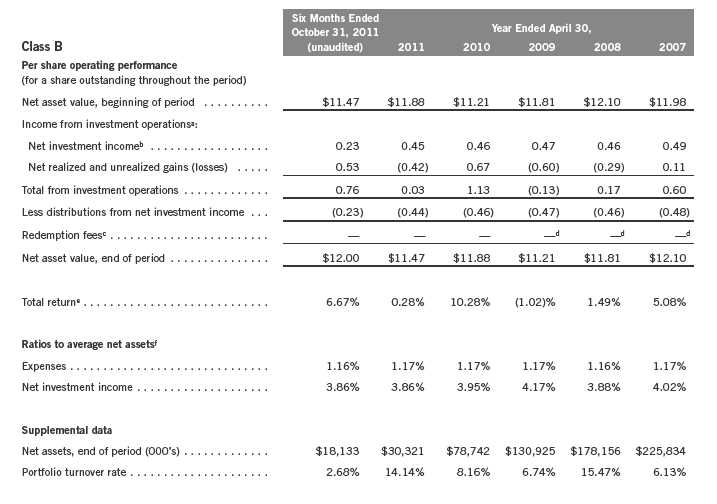
aThe amount shown for a share outstanding throughout the period may not correlate with the Statement of Operations for the period due to the timing of sales and repurchases of
the Fund shares in relation to income earned and/or fluctuating market value of the investments of the Fund.
bBased on average daily shares outstanding.
cEffective September 1, 2008, the redemption fee was eliminated.
dAmount rounds to less than $0.01 per share.
eTotal return does not reflect sales commissions or contingent deferred sales charges, if applicable, and is not annualized for periods less than one year.
fRatios are annualized for periods less than one year.
14 | The accompanying notes are an integral part of these financial statements. | Semiannual Report
Franklin Federal Tax-Free Income Fund
Financial Highlights (continued)
aThe amount shown for a share outstanding throughout the period may not correlate with the Statement of Operations for the period due to the timing of sales and repurchases of
the Fund shares in relation to income earned and/or fluctuating market value of the investments of the Fund.
bBased on average daily shares outstanding.
cEffective September 1, 2008, the redemption fee was eliminated.
dAmount rounds to less than $0.01 per share.
eTotal return does not reflect sales commissions or contingent deferred sales charges, if applicable, and is not annualized for periods less than one year.
fRatios are annualized for periods less than one year.
Semiannual Report | The accompanying notes are an integral part of these financial statements. | 15
Franklin Federal Tax-Free Income Fund
Financial Highlights (continued)
aThe amount shown for a share outstanding throughout the period may not correlate with the Statement of Operations for the period due to the timing of sales and repurchases of
the Fund shares in relation to income earned and/or fluctuating market value of the investments of the Fund.
bBased on average daily shares outstanding.
cEffective September 1, 2008, the redemption fee was eliminated.
dAmount rounds to less than $0.01 per share.
eTotal return is not annualized for periods less than one year.
fRatios are annualized for periods less than one year.
16 | The accompanying notes are an integral part of these financial statements. | Semiannual Report
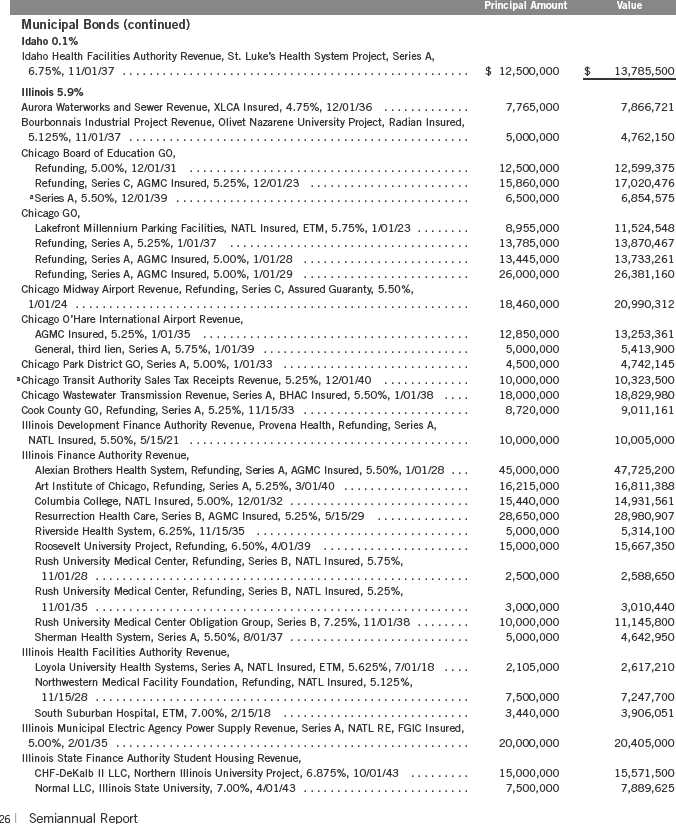
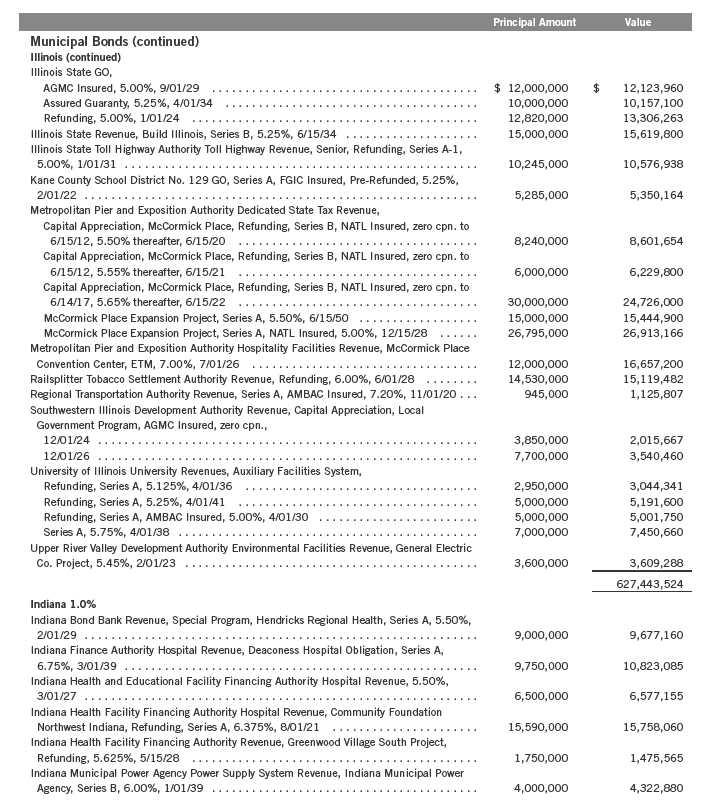
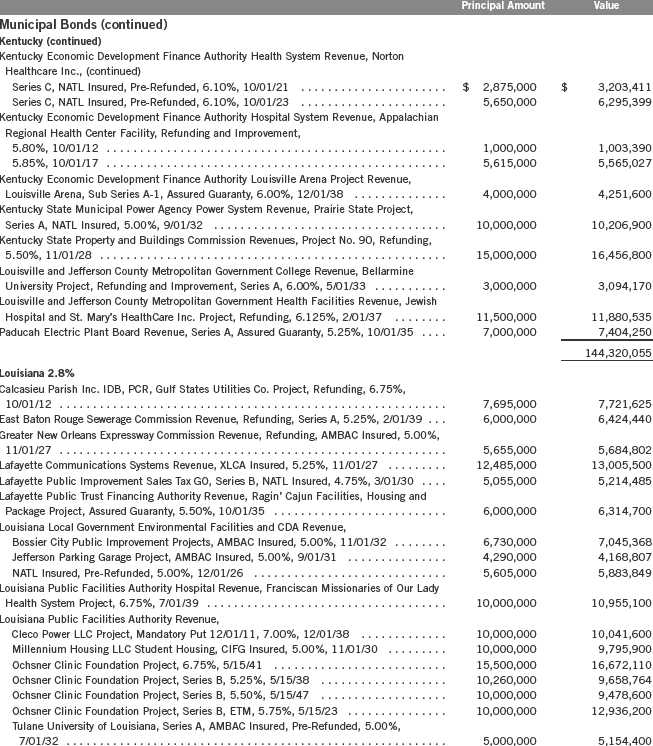
Franklin Federal Tax-Free Income Fund
Statement of Investments, October 31, 2011 (unaudited)
| Principal Amount | Value | |||
| Municipal Bonds 97.6% | ||||
| Alabama 1.1% | ||||
| Alabama State Port Authority Docks Facilities Revenue, Refunding, 6.00%, 10/01/40 | $ | 6,000,000 | $ | 6,400,200 |
| Birmingham Waterworks Board Water Revenue, Series A, Assured Guaranty, 5.125%, | ||||
| 1/01/34 | 5,600,000 | 5,843,264 | ||
| Courtland IDB Solid Waste Disposal Revenue, Champion International Corp. Project, | ||||
| Refunding, 6.00%, 8/01/29 | 12,000,000 | 12,000,600 | ||
| East Alabama Health Care Authority Health Care Facilities Revenue, Mandatory Put 9/01/18, | ||||
| Series B, 5.50%, 9/01/33 | 18,500,000 | 19,575,960 | ||
| Fairfield IDB Environmental Improvement Revenue, USX Corp. Project, Refunding, 5.45%, | ||||
| 9/01/14 | 1,445,000 | 1,447,529 | ||
| Mobile GO, wts., Refunding and Improvement, AMBAC Insured, 5.00%, 2/15/30 | 5,000,000 | 5,208,750 | ||
| Montgomery County PBA Revenue, wts., Facilities Project, NATL Insured, 5.00%, | ||||
| 3/01/31 | 6,250,000 | 6,505,875 | ||
| Tuscaloosa Public Educational Building Authority Student Housing Revenue, Ridgecrest | ||||
| Student Housing LLC University of Alabama Ridgecrest Residential Project, | ||||
| Assured Guaranty, 6.75%, 7/01/38 | 10,000,000 | 11,386,600 | ||
| University of Alabama General Revenue, Series A, | ||||
| NATL Insured, 5.00%, 7/01/29 | 10,000,000 | 10,455,300 | ||
| NATL Insured, 5.00%, 7/01/34 | 10,500,000 | 10,775,310 | ||
| XLCA Insured, 5.00%, 7/01/28 | 5,000,000 | 5,256,000 | ||
| XLCA Insured, 5.00%, 7/01/32 | 5,500,000 | 5,703,060 | ||
| University of South Alabama University Revenue, Tuition, Capital Improvement, Refunding, | ||||
| AMBAC Insured, 5.00%, 12/01/36 | 11,570,000 | 11,882,390 | ||
| 112,440,838 | ||||
| Alaska 0.5% | ||||
| Alaska State HFC Revenue, General Housing, Series A, FGIC Insured, 5.00%, | ||||
| 12/01/29 | 4,000,000 | 4,108,800 | ||
| 12/01/30 | 3,500,000 | 3,588,060 | ||
| Alaska State International Airports Revenues, | ||||
| Series B, NATL Insured, 5.00%, 10/01/28 | 5,100,000 | 5,169,309 | ||
| Series C, 5.00%, 10/01/33 | 12,565,000 | 13,077,652 | ||
| Matanuska-Susitna Borough Lease Revenue, Goose Creek Correctional Center, | ||||
| Assured Guaranty, 6.00%, 9/01/32 | 20,000,000 | 22,578,400 | ||
| 48,522,221 | ||||
| Arizona 3.1% | ||||
| Arizona State COP, Department of Administration, Series A, AGMC Insured, 5.00%, | ||||
| 10/01/27 | 14,440,000 | 15,476,936 | ||
| Arizona State Lottery Revenue, Series A, AGMC Insured, 5.00%, 7/01/27 | 15,000,000 | 16,034,850 | ||
| Downtown Phoenix Hotel Corp. Revenue, Senior Series A, FGIC Insured, 5.00%, | ||||
| 7/01/29 | 14,465,000 | 12,366,996 | ||
| 7/01/36 | 15,000,000 | 11,972,400 | ||
| Glendale Western Loop 101 Public Facilities Corp. Excise Tax Revenue, third lien, Series A, | ||||
| 6.25%, 7/01/38 | 10,000,000 | 10,237,800 | ||
| Maricopa County IDA Hospital Facility Revenue, Mayo Clinic Hospital, 5.25%, 11/15/37 | 19,000,000 | 19,009,500 | ||
| Maricopa County PCC, PCR, El Paso Electric Co. Project, Series A, 7.25%, 2/01/40 | 10,000,000 | 11,051,800 | ||
| Navajo County PCC Revenue, Mandatory Put 6/01/16, Series E, 5.75%, 6/01/34 | 7,200,000 | 8,103,168 |
Semiannual Report | 17
Franklin Federal Tax-Free Income Fund
Statement of Investments, October 31, 2011 (unaudited) (continued)
| Principal Amount | Value | |||
| Municipal Bonds (continued) | ||||
| Arizona (continued) | ||||
| Phoenix Civic Improvement Corp. Airport Revenue, | ||||
| junior lien, Series A, 5.00%, 7/01/40 | $ | 24,000,000 | $ | 24,608,880 |
| senior lien, Series A, 5.00%, 7/01/33 | 28,000,000 | 28,975,520 | ||
| Phoenix Civic Improvement Corp. Distribution Revenue, Capital Appreciation, Civic Plaza, | ||||
| Series B, NATL RE, FGIC Insured, zero cpn. to 7/01/13, 5.50% thereafter, | ||||
| 7/01/32 | 6,000,000 | 6,075,360 | ||
| 7/01/34 | 5,000,000 | 5,010,050 | ||
| 7/01/35 | 9,860,000 | 9,857,042 | ||
| Phoenix Civic Improvement Corp. Water System Revenue, junior lien, Refunding, | ||||
| 5.00%, 7/01/32 | 21,095,000 | 22,531,570 | ||
| Series A, 5.00%, 7/01/34 | 10,000,000 | 10,718,900 | ||
| Pima County IDA Lease Revenue, | ||||
| Clark County Detention Facility Project, 5.00%, 9/01/39 | 20,000,000 | 20,020,000 | ||
| Metro Police Facility, Nevada Project, Series A, 5.25%, 7/01/31 | 8,900,000 | 9,056,551 | ||
| Metro Police Facility, Nevada Project, Series A, 5.50%, 7/01/39 | 22,500,000 | 23,020,200 | ||
| Salt River Project Agricultural Improvement and Power District Electric System Revenue, | ||||
| Salt River Project, Series A, Pre-Refunded, 5.125%, 1/01/27 | 23,095,000 | 23,508,863 | ||
| Salt River Project, Series B, Pre-Refunded, 5.00%, 1/01/25 | 17,500,000 | 18,435,725 | ||
| Series A, 5.00%, 1/01/38 | 10,000,000 | 10,501,800 | ||
| Salt Verde Financial Corp. Senior Gas Revenue, 5.00%, 12/01/37 | 5,000,000 | 4,533,800 | ||
| University Medical Center Corp. Hospital Revenue, 5.00%, 7/01/35 | 7,000,000 | 6,384,140 | ||
| 327,491,851 | ||||
| Arkansas 0.0%† | ||||
| University of Arkansas University Revenues, Various Facility, Fayetteville Campus, NATL RE, | ||||
| FGIC Insured, 5.00%, 12/01/27 | 5,000,000 | 5,106,250 | ||
| California 12.8% | ||||
| Bay Area Toll Authority Toll Bridge Revenue, San Francisco Bay Area, Refunding, | ||||
| Series F, 5.00%, 4/01/31 | 20,000,000 | 20,605,000 | ||
| Series F-1, 5.00%, 4/01/28 | 24,000,000 | 25,446,240 | ||
| Series F-1, 5.00%, 4/01/34 | 20,250,000 | 21,013,223 | ||
| Series F-1, 5.00%, 4/01/34 | 9,530,000 | 9,936,931 | ||
| Series F-1, 5.00%, 4/01/39 | 14,000,000 | 14,543,480 | ||
| Series F-1, 5.50%, 4/01/43 | 30,000,000 | 31,739,100 | ||
| California Educational Facilities Authority Revenue, Carnegie Institute of Washington, | ||||
| Refunding, Series A, 5.00%, 7/01/40 | 24,525,000 | 26,322,682 | ||
| California Health Facilities Financing Authority Revenue, Children’s Hospital of Orange | ||||
| County, Series A, 6.50%, | ||||
| 11/01/24 | 5,000,000 | 5,704,850 | ||
| 11/01/38 | 8,000,000 | 8,613,600 | ||
| California Infrastructure and Economic Development Bank Revenue, Bay Area Toll Bridges, | ||||
| first lien, Series A, AMBAC Insured, Pre-Refunded, 5.00%, 7/01/33 | 24,500,000 | 30,134,755 | ||
| California State Economic Recovery GO, Refunding, Series A, 5.25%, 7/01/21 | 28,580,000 | 32,552,334 | ||
| California State GO, | ||||
| 6.00%, 5/01/18 | 535,000 | 547,701 | ||
| 5.90%, 4/01/23 | 1,200,000 | 1,218,588 | ||
| 5.00%, 10/01/29 | 15,000,000 | 15,687,000 |
18 | Semiannual Report
Franklin Federal Tax-Free Income Fund
Statement of Investments, October 31, 2011 (unaudited) (continued)
| Principal Amount | Value | |||
| Municipal Bonds (continued) | ||||
| California (continued) | ||||
| California State GO, (continued) | ||||
| 5.25%, 11/01/40 | $ | 50,000,000 | $ | 51,078,000 |
| FGIC Insured, 6.00%, 5/01/20 | 850,000 | 868,513 | ||
| Refunding, 5.00%, 2/01/26 | 27,000,000 | 27,133,110 | ||
| Refunding, 5.00%, 2/01/26 | 20,000,000 | 20,636,000 | ||
| Various Purpose, 5.25%, 11/01/25 | 16,260,000 | 17,046,821 | ||
| Various Purpose, 5.50%, 11/01/33 | 2,500,000 | 2,581,375 | ||
| Various Purpose, 6.00%, 4/01/38 | 100,000,000 | 110,420,000 | ||
| Various Purpose, 6.00%, 11/01/39 | 25,000,000 | 27,636,000 | ||
| Various Purpose, Refunding, 5.25%, 3/01/30 | 30,000,000 | 31,355,700 | ||
| Various Purpose, Refunding, 6.00%, 3/01/33 | 12,000,000 | 13,396,680 | ||
| Various Purpose, Refunding, 5.25%, 3/01/38 | 20,000,000 | 20,375,400 | ||
| Various Purpose, Refunding, 5.50%, 3/01/40 | 25,000,000 | 26,345,750 | ||
| California State Public Works Board Lease Revenue, | ||||
| Department of Education, Riverside Campus Project, Series B, 6.125%, 4/01/28 | 2,740,000 | 3,043,345 | ||
| Department of General Services, Buildings 8 and 9, Series A, 6.00%, 4/01/27 | 3,980,000 | 4,437,382 | ||
| Department of General Services, Buildings 8 and 9, Series A, 6.125%, 4/01/29 | 5,000,000 | 5,497,100 | ||
| Various Capital Projects, Series I, 6.125%, 11/01/29 | 29,300,000 | 32,405,214 | ||
| California Statewide CDA, PCR, Refunding, 4.50%, 9/01/29 | 14,830,000 | 14,721,296 | ||
| California Statewide CDA Revenue, | ||||
| Adventist, Series B, Assured Guaranty, 5.00%, 3/01/37 | 10,000,000 | 9,705,800 | ||
| St. Joseph Health System, Series B, FGIC Insured, 5.75%, 7/01/47 | 5,000,000 | 5,164,100 | ||
| St. Joseph Health System, Series E, AGMC Insured, 5.25%, 7/01/47 | 10,000,000 | 10,167,800 | ||
| Colton Joint USD, GO, Election of 2008, Series A, Assured Guaranty, 5.375%, 8/01/34 | 15,000,000 | 15,531,600 | ||
| Corona-Norco USD, GO, Capital Appreciation, Election of 2006, Series C, AGMC Insured, | ||||
| zero cpn., 8/01/39 | 7,500,000 | 1,359,900 | ||
| zero cpn. to 8/01/17, 6.20% thereafter, 8/01/29 | 3,250,000 | 2,690,253 | ||
| zero cpn. to 8/01/17, 6.80% thereafter, 8/01/39 | 8,500,000 | 6,866,470 | ||
| Foothill/Eastern Corridor Agency Toll Road Revenue, | ||||
| Capital Appreciation, Refunding, 5.85%, 1/15/23 | 35,000,000 | 35,216,300 | ||
| Capital Appreciation, Refunding, zero cpn., 1/15/24 | 65,000,000 | 31,080,400 | ||
| Refunding, 5.75%, 1/15/40 | 20,000,000 | 18,237,800 | ||
| Golden State Tobacco Securitization Corp. Tobacco Settlement Revenue, | ||||
| Asset-Backed, Series A-1, Pre-Refunded, 6.25%, 6/01/33 | 16,245,000 | 17,413,503 | ||
| Enhanced, Asset-Backed, Refunding, Series A, AMBAC Insured, 5.00%, 6/01/45 | 13,255,000 | 12,206,397 | ||
| Hartnell Community College District GO, Capital Appreciation, Election of 2002, Series D, | ||||
| zero cpn., 8/01/39 | 45,000,000 | 6,291,000 | ||
| Inland Empire Tobacco Securitization Authority Revenue, Tobacco Settlement Asset-Backed | ||||
| Bonds, Turbo Capital Appreciation, Series C-1, zero cpn., 6/01/36 | 100,000,000 | 9,087,000 | ||
| Jefferson UHSD San Mateo County GO, Capital Appreciation, Election of 2006, Series D, | ||||
| zero cpn., | ||||
| 8/01/35 | 10,500,000 | 1,888,845 | ||
| 8/01/40 | 10,000,000 | 1,182,500 | ||
| 8/01/41 | 13,590,000 | 1,476,418 | ||
| Los Angeles Community College District GO, Election of 2008, Series C, 5.25%, | ||||
| 8/01/39 | 30,000,000 | 32,904,600 |
Semiannual Report | 19
Franklin Federal Tax-Free Income Fund
Statement of Investments, October 31, 2011 (unaudited) (continued)
| Principal Amount | Value | ||||
| Municipal Bonds (continued) | |||||
| California (continued) | |||||
| Los Angeles Department of Airports Airport Revenue, Los Angeles International Airport, | |||||
| Senior, Refunding, Series A, 5.00%, 5/15/40 | $ | 25,485,000 | $ | 26,821,943 | |
| senior bond, Series D, 5.00%, 5/15/40 | 50,000,000 | 52,696,500 | |||
| Los Angeles USD, GO, | |||||
| Election of 2002, Series B, AMBAC Insured, 4.50%, 7/01/31 | 28,745,000 | 28,943,340 | |||
| Election of 2004, Series F, AGMC Insured, 5.00%, 7/01/30 | 52,475,000 | 54,570,327 | |||
| Election of 2004, Series G, AMBAC Insured, 5.00%, 7/01/26 | 10,250,000 | 10,914,610 | |||
| Election of 2004, Series G, AMBAC Insured, 5.00%, 7/01/31 | 10,000,000 | 10,407,900 | |||
| Series KRY, 5.25%, 7/01/34 | 36,625,000 | 39,226,107 | |||
| Los Angeles Wastewater System Revenue, Refunding, NATL Insured, 5.00%, 6/01/25 | 10,000,000 | 10,482,700 | |||
| M | -S-R Energy Authority Gas Revenue, Series B, 6.50%, 11/01/39 | 12,500,000 | 14,216,375 | ||
| Metropolitan Water District of Southern California Waterworks Revenue, Series B-2, NATL RE, | |||||
| FGIC Insured, Pre-Refunded, 5.00%, 10/01/27 | 9,645,000 | 10,488,841 | |||
| New Haven USD, GO, Capital Appreciation, Assured Guaranty, zero cpn., | |||||
| 8/01/31 | 2,055,000 | 629,837 | |||
| 8/01/32 | 7,830,000 | 2,228,653 | |||
| 8/01/33 | 7,660,000 | 2,030,589 | |||
| Placentia-Yorba Linda USD, GO, Election of 2008, Series A, 5.25%, 8/01/32 | 24,490,000 | 25,735,561 | |||
| Pomona USD, GO, Election of 2008, Series A, Assured Guaranty, 5.00%, 8/01/29 | 5,585,000 | 5,802,536 | |||
| Rialto USD, GO, Series A, AGMC Insured, zero cpn., 8/01/36 | 20,000,000 | 4,167,400 | |||
| Sacramento County Airport System Revenue, Senior Series B, AGMC Insured, 5.25%, | |||||
| 7/01/33 | 16,355,000 | 16,269,954 | |||
| San Diego Public Facilities Financing Authority Water Revenue, Series B, 5.375%, | |||||
| 8/01/34 | 15,000,000 | 16,236,450 | |||
| San Francisco City and County COP, Multiple Capital Improvement Project, Series A, 5.25%, | |||||
| 4/01/31 | 10,000,000 | 10,252,300 | |||
| San Joaquin Hills Transportation Corridor Agency Toll Road Revenue, | |||||
| Capital Appreciation, Refunding, Series A, 5.75%, 1/15/21 | 50,000,000 | 45,775,000 | |||
| senior lien, 5.00%, 1/01/33 | 5,000,000 | 3,818,150 | |||
| senior lien, ETM, zero cpn., 1/01/23 | 7,000,000 | 5,048,330 | |||
| San Mateo UHSD, GO, Capital Appreciation, Election of 2010, | |||||
| Refunding, Series A, zero cpn. to 9/01/28, 6.70% thereafter, 9/01/41, | 20,000,000 | 7,217,200 | |||
| zero cpn. to 9/01/28, 6.45% thereafter, 9/01/33 | 5,725,000 | 2,131,246 | |||
| Santa Ana USD, GO, Capital Appreciation, Election of 2008, Series B, Assured Guaranty, | |||||
| zero cpn., | |||||
| 8/01/35 | 10,000,000 | 2,250,900 | |||
| 8/01/36 | 18,865,000 | 3,949,765 | |||
| 8/01/37 | 10,000,000 | 1,960,600 | |||
| Santa Clara County GO, 5.00%, 8/01/34 | 25,000,000 | 26,563,750 | |||
| Upland USD, GO, Election of 2008, Series B, zero cpn., 8/01/39 | 50,075,000 | 8,398,579 | |||
| Washington Township Health Care District Revenue, Series A, 6.25%, 7/01/39 | 3,000,000 | 3,148,410 | |||
| West Contra Costa USD, GO, Election of 2005, Series C-1, Assured Guaranty, zero cpn., | |||||
| 8/01/29 | 10,000,000 | 3,343,700 | |||
| 8/01/30 | 20,845,000 | 6,493,426 | |||
| 8/01/31 | 20,000,000 | 5,765,400 | |||
| 8/01/32 | 10,730,000 | 2,863,730 | |||
| Whittier UHSD, GO, Capital Appreciation Bonds, Refunding, zero cpn., 8/01/34 | 20,000,000 | 4,360,600 | |||
| 1,346,724,565 |
20 | Semiannual Report
Franklin Federal Tax-Free Income Fund
Statement of Investments, October 31, 2011 (unaudited) (continued)
| Principal Amount | Value | ||||
| Municipal Bonds (continued) | |||||
| Colorado 2.0% | |||||
| Aurora Water Improvement Revenue, first lien, Series A, AMBAC Insured, 5.00%, | |||||
| 8/01/32 | $ | 10,000,000 | $ | 10,529,100 | |
| 8/01/36 | 41,235,000 | 43,114,904 | |||
| 8/01/39 | 26,930,000 | 28,115,458 | |||
| Colorado State Board of Governors University Enterprise System Revenue, Series A, | |||||
| AGMC Insured, 5.00%, 3/01/37 | 10,000,000 | 10,372,900 | |||
| NATL RE, FGIC Insured, 5.00%, 3/01/37 | 10,000,000 | 10,372,900 | |||
| Colorado State Health Facilities Authority Revenue, | |||||
| Health Facility Authority, Hospital, Refunding, Series B, AGMC Insured, 5.25%, | |||||
| 3/01/36 | 10,000,000 | 10,254,900 | |||
| Valley View Hospital Assn. Project, Refunding, 5.50%, 5/15/28 | 5,000,000 | 5,082,100 | |||
| Valley View Hospital Assn. Project, Refunding, 5.75%, 5/15/36 | 7,000,000 | 7,052,850 | |||
| Colorado State Higher Education Capital Construction Lease Purchase Financing Program | |||||
| COP, | |||||
| 5.50%, 11/01/27 | 7,335,000 | 7,930,822 | |||
| Pre | -Refunded, 5.50%, 11/01/27 | 2,665,000 | 3,322,216 | ||
| Colorado Water Resources and Power Development Authority Water Resources Revenue, | |||||
| Arapahoe County Water Improvement, Series E, NATL Insured, 5.00%, 12/01/35 | 10,000,000 | 10,025,200 | |||
| Mesa State College Auxiliary Facilities Enterprise Revenue, XLCA Insured, 5.00%, | |||||
| 5/15/35 | 9,950,000 | 9,988,108 | |||
| Park Creek Metropolitan District Revenue, Senior Property Tax Support, Refunding and | |||||
| Improvement, Assured Guaranty, 6.25%, 12/01/30 | 6,000,000 | 6,657,120 | |||
| Public Authority for Colorado Energy Natural Gas Purchase Revenue, 6.50%, 11/15/38 | 20,000,000 | 21,869,600 | |||
| Pueblo County School District No. 060 GO, NATL RE, FGIC Insured, Pre-Refunded, 5.00%, | |||||
| 12/15/22 | 5,500,000 | 5,786,660 | |||
| Thornton Water Enterprise Revenue, NATL Insured, 5.00%, 12/01/34 | 10,000,000 | 10,274,900 | |||
| University of Colorado Enterprise System Revenue, Series A, 5.375%, 6/01/32 | 3,500,000 | 3,833,375 | |||
| University of Colorado Hospital Authority Revenue, Series A, AMBAC Insured, 5.00%, | |||||
| 11/15/29 | 8,500,000 | 8,506,885 | |||
| 213,089,998 | |||||
| Connecticut 0.0%† | |||||
| Meriden Housing Authority MFR, Connecticut Baptist Housing Project, GNMA Secured, | |||||
| 5.80%, 8/20/39 | 2,515,000 | 2,641,127 | |||
| District of Columbia 2.6% | |||||
| District of Columbia Ballpark Revenue, Series B-1, BHAC Insured, 5.00%, | |||||
| 2/01/24 | 12,120,000 | 12,904,528 | |||
| 2/01/25 | 7,000,000 | 7,416,080 | |||
| 2/01/26 | 9,950,000 | 10,501,230 | |||
| District of Columbia GO, Series E, NATL Insured, ETM, 6.00%, 6/01/13 | 15,000 | 15,065 | |||
| District of Columbia Hospital Revenue, Children’s Hospital Obligation, Sub Series 1, | |||||
| AGMC Insured, 5.45%, 7/15/35 | 24,515,000 | 25,353,413 | |||
| District of Columbia Income Tax Secured Revenue, | |||||
| Refunding, Series A, 5.00%, 12/01/31 | 10,000,000 | 10,894,000 | |||
| Series A, 5.25%, 12/01/34 | 11,000,000 | 11,996,270 |
Semiannual Report | 21
Franklin Federal Tax-Free Income Fund
Statement of Investments, October 31, 2011 (unaudited) (continued)
22 | Semiannual Report
Franklin Federal Tax-Free Income Fund
Statement of Investments, October 31, 2011 (unaudited) (continued)
| Principal Amount | Value | |||
| Municipal Bonds (continued) | ||||
| Florida (continued) | ||||
| Florida State Municipal Loan Council Revenue, Series D, AGMC Insured, 5.50%, | ||||
| 10/01/41 | $ | 4,750,000 | $ | 5,087,013 |
| Hernando County School Board COP, NATL Insured, 5.00%, 7/01/30 | 10,000,000 | 10,081,500 | ||
| Hillsborough County Aviation Authority Revenue, Series A, Assured Guaranty, 5.50%, | ||||
| 10/01/38 | 5,000,000 | 5,153,150 | ||
| Hillsborough County IDA, PCR, Tampa Electric Co. Project, Series A, 5.65%, 5/15/18 | 6,500,000 | 7,423,325 | ||
| Hillsborough County IDAR, Refunding, Series A, 5.25%, 10/01/24 | 13,500,000 | 13,658,220 | ||
| Hillsborough County School Board COP, Master Lease Program, Series B, NATL Insured, | ||||
| 5.00%, 7/01/27 | 5,000,000 | 5,121,400 | ||
| Indian River County School Board COP, NATL RE, FGIC Insured, 5.00%, 7/01/27 | 16,485,000 | 17,108,792 | ||
| Jacksonville Capital Improvement Revenue, Series A, AMBAC Insured, 5.00%, 10/01/30 | 20,175,000 | 20,288,383 | ||
| Jacksonville Economic Development Commission Health Care Facilities Revenue, Mayo Clinic, | ||||
| 5.00%, 11/15/36 | 17,950,000 | 18,145,296 | ||
| Jacksonville Excise Taxes Revenue, Series A, AMBAC Insured, 5.00%, 10/01/32 | 6,015,000 | 6,193,224 | ||
| Jacksonville Sales Tax Revenue, AMBAC Insured, 5.00%, 10/01/26 | 20,000,000 | 20,029,000 | ||
| Jacksonville Transportation Revenue, NATL Insured, 5.00%, 10/01/31 | 5,000,000 | 5,008,400 | ||
| Lee County Transportation Facilities Revenue, Sanibel Bridges and Causeway, Series B, | ||||
| CIFG Insured, 5.00%, 10/01/35 | 10,645,000 | 10,738,570 | ||
| Miami-Dade County Aviation Revenue, Miami International Airport, | ||||
| Hub of the Americas, Refunding, Series A, CIFG Insured, 5.00%, 10/01/38 | 15,000,000 | 14,214,000 | ||
| Refunding, Series A, 5.50%, 10/01/36 | 20,000,000 | 20,645,800 | ||
| Refunding, Series A, Assured Guaranty, 5.25%, 10/01/33 | 11,000,000 | 11,088,220 | ||
| Refunding, Series A, Assured Guaranty, 5.25%, 10/01/38 | 13,000,000 | 13,059,150 | ||
| Miami-Dade County Educational Facilities Authority Revenue, University of Miami, Series A, | ||||
| 5.50%, 4/01/38 | 12,500,000 | 12,754,000 | ||
| Miami-Dade County Expressway Authority Toll System Revenue, Series A, 5.00%, | ||||
| 7/01/40 | 30,265,000 | 30,292,541 | ||
| Miami-Dade County GO, Building Better Communities Program, Series B-1, 5.75%, | ||||
| 7/01/33 | 20,000,000 | 21,711,200 | ||
| Miami-Dade County Public Facilities Revenue, Jackson Health System, Series A, | ||||
| NATL Insured, 5.00%, 6/01/30 | 10,630,000 | 10,341,183 | ||
| Miami-Dade County School Board COP, Assured Guaranty, 5.25%, 2/01/27 | 10,000,000 | 10,752,800 | ||
| Miami-Dade County Special Obligation Revenue, | ||||
| Juvenile Courthouse Project, Series A, AMBAC Insured, 5.00%, 4/01/32 | 10,000,000 | 10,041,400 | ||
| sub. bond, Series B, NATL Insured, zero cpn., 10/01/34 | 5,500,000 | 1,217,810 | ||
| Miami-Dade County Transit Sales Surtax Revenue, Refunding, AGMC Insured, 5.00%, | ||||
| 7/01/38 | 18,845,000 | 19,035,146 | ||
| Orange County Health Facilities Authority Revenue, Hospital, Orlando Regional Healthcare | ||||
| System, Refunding, Series B, AGMC Insured, 5.00%, 12/01/32 | 20,000,000 | 20,682,200 | ||
| Orange County School Board COP, Series A, Assured Guaranty, 5.50%, 8/01/34 | 15,000,000 | 16,153,500 | ||
| Orlando Tourist Development Tax Revenue, 6th Cent Contract Payments, | ||||
| second lien sub. bonds, Series B, Assured Guaranty, 5.50%, 11/01/38 | 18,490,000 | 18,133,143 | ||
| third lien sub. bonds, Series C, Assured Guaranty, 5.50%, 11/01/38 | 5,000,000 | 4,842,950 | ||
| Orlando-Orange County Expressway Authority Revenue, | ||||
| Series A, AGMC Insured, 5.00%, 7/01/32 | 12,000,000 | 12,435,720 | ||
| Series B, AMBAC Insured, 5.00%, 7/01/28 | 10,630,000 | 10,793,489 | ||
| Series C, 5.00%, 7/01/40 | 15,000,000 | 15,456,150 |
Semiannual Report | 23
Franklin Federal Tax-Free Income Fund
Statement of Investments, October 31, 2011 (unaudited) (continued)
| Principal Amount | Value | |||
| Municipal Bonds (continued) | ||||
| Florida (continued) | ||||
| Palm Beach County School Board COP, Refunding, Series D, AGMC Insured, 5.00%, | ||||
| 8/01/28 | $ | 25,000,000 | $ | 25,327,250 |
| Palm Beach County Solid Waste Authority Revenue, Improvement, Series B, 5.50%, | ||||
| 10/01/28 | 10,000,000 | 11,024,400 | ||
| Pensacola Airport Revenue, Airport Revenue Bonds, Refunding, 6.25%, 10/01/38 | 16,500,000 | 17,077,995 | ||
| Port St. Lucie GO, NATL Insured, 5.00%, 7/01/32 | 7,000,000 | 7,238,210 | ||
| Port St. Lucie Utility Revenue, System, Refunding, Assured Guaranty, 5.25%, 9/01/35 | 3,000,000 | 3,143,400 | ||
| South Broward Hospital District Revenue, South Broward Hospital District Obligated Group, | ||||
| Refunding, | ||||
| 4.75%, 5/01/28 | 10,000,000 | 10,115,600 | ||
| 5.00%, 5/01/36 | 12,500,000 | 12,707,750 | ||
| South Lake County Hospital District Revenue, South Lake Hospital, Series A, 6.25%, | ||||
| 4/01/39 | 5,735,000 | 5,802,329 | ||
| South Miami Health Facilities Authority Hospital Revenue, Baptist Health South Florida | ||||
| Group, 5.00%, 8/15/32 | 31,070,000 | 31,629,571 | ||
| St. Lucie County Transportation Revenue, AMBAC Insured, 5.00%, 8/01/27 | 5,785,000 | 6,033,697 | ||
| Tallahassee Energy System Revenue, Refunding, NATL Insured, 5.00%, 10/01/37 | 20,000,000 | 20,523,600 | ||
| 748,828,252 | ||||
| Georgia 4.2% | ||||
| Athens-Clarke County Unified Government Water and Sewer Revenue, 5.50%, 1/01/38 | 14,500,000 | 15,682,475 | ||
| Atlanta Airport Passenger Facility Charge Revenue, General, sub. lien, | ||||
| Refunding, Series C, AGMC Insured, 5.00%, 1/01/33 | 19,500,000 | 19,858,215 | ||
| Series J, AGMC Insured, 5.00%, 1/01/29 | 10,000,000 | 10,248,800 | ||
| Atlanta Airport Revenue, General, Refunding, Series C, 6.00%, 1/01/30 | 15,000,000 | 17,256,450 | ||
| Atlanta Development Authority Revenue, | ||||
| Tuff Yamacraw LLC Project, Refunding, Series A, AMBAC Insured, 5.00%, 1/01/24 | 6,385,000 | 6,632,546 | ||
| Tuff Yamacraw LLC Project, Refunding, Series A, AMBAC Insured, 5.00%, 1/01/25 | 6,955,000 | 7,143,828 | ||
| Tuff Yamacraw LLC Project, Refunding, Series A, AMBAC Insured, 5.00%, 1/01/26 | 5,000,000 | 5,096,450 | ||
| Tuff Yamacraw LLC Project, Refunding, Series A, AMBAC Insured, 5.00%, 1/01/27 | 5,000,000 | 5,047,400 | ||
| Yamacraw Design Center Project, Series A, NATL Insured, Pre-Refunded, 5.125%, | ||||
| 1/01/27 | 5,000,000 | 5,039,200 | ||
| Atlanta Development Authority Student Housing Facilities Revenue, Piedmont Ellis LLC, | ||||
| Series A, XLCA Insured, 5.00%, 9/01/30 | 10,000,000 | 10,134,800 | ||
| Atlanta Water and Wastewater Revenue, Refunding, | ||||
| Series A, 6.25%, 11/01/34 | 20,000,000 | 22,471,000 | ||
| Series A, NATL Insured, 5.00%, 11/01/33 | 13,000,000 | 13,048,360 | ||
| Series B, AGMC Insured, 5.25%, 11/01/34 | 30,000,000 | 31,190,400 | ||
| Bleckley-Dodge County Joint Development Authority Student Housing Facilities Revenue, | ||||
| MGC Real Estate Foundation II LLC Project, | ||||
| 5.00%, 7/01/33 | 5,000,000 | 5,078,900 | ||
| 5.25%, 7/01/38 | 10,000,000 | 10,282,000 | ||
| Bulloch County Development Authority Revenue, Assured Guaranty, 5.375%, 7/01/39 | 23,075,000 | 24,305,821 | ||
| Burke County Development Authority PCR, Oglethorpe Power Corp., Vogtle Project, | ||||
| Series B, 5.50%, 1/01/33 | 15,000,000 | 15,553,200 | ||
| Series E, 7.00%, 1/01/23 | 25,000,000 | 29,281,000 | ||
| Clark County Hospital Authority Revenue, Athens Regional Medical Center Project, | ||||
| NATL Insured, 5.00%, 1/01/27 | 5,000,000 | 5,178,900 |
24 | Semiannual Report
Franklin Federal Tax-Free Income Fund
Statement of Investments, October 31, 2011 (unaudited) (continued)

Franklin Federal Tax-Free Income Fund
Statement of Investments, October 31, 2011 (unaudited) (continued)
Franklin Federal Tax-Free Income Fund
Statement of Investments, October 31, 2011 (unaudited) (continued)
Semiannual Report | 27
Franklin Federal Tax-Free Income Fund
Statement of Investments, October 31, 2011 (unaudited) (continued)
| Principal Amount | Value | |||
| Municipal Bonds (continued) | ||||
| Indiana (continued) | ||||
| Indiana State Finance Authority Environmental Revenue, Duke Energy Indiana Inc., | ||||
| Refunding, Series B, 6.00%, 8/01/39 | $ | 10,000,000 | $ | 10,929,900 |
| Indiana State Finance Authority Revenue, Educational Facilities, Marian University Project, | ||||
| 6.375%, 9/15/41 | 12,500,000 | 12,566,875 | ||
| Indiana State Finance Authority Wastewater Utility Revenue, first lien, CWA Authority Inc., | ||||
| Series A, 5.25%, 10/01/38 | 12,000,000 | 12,693,120 | ||
| Indianapolis Local Public Improvement Bond Bank Revenue, Pilot Infrastructure Project, | ||||
| Series F, Assured Guaranty, 5.00%, 1/01/35 | 10,000,000 | 10,554,500 | ||
| Jasper County EDR, Georgia-Pacific Corp. Project, | ||||
| 5.625%, 12/01/27 | 3,500,000 | 3,499,825 | ||
| Refunding, 6.70%, 4/01/29 | 3,000,000 | 3,001,770 | ||
| Jasper County PCR, Northern Indiana Public Service Co., Refunding, Series C, | ||||
| NATL Insured, 5.60%, 11/01/16 | 5,000,000 | 5,586,500 | ||
| Madison County Authority Anderson Hospital Revenue, Refunding, Series A, NATL Insured, | ||||
| 8.00%, 1/01/14 | 45,000 | 45,245 | ||
| University of Southern Indiana Revenue, Student Fee, Series J, Assured Guaranty, 5.75%, | ||||
| 10/01/28 | 2,000,000 | 2,208,160 | ||
| 109,719,800 | ||||
| Kansas 0.6% | ||||
| Burlington PCR, Kansas Gas and Electric Co. Project, Refunding, | ||||
| Series A, NATL Insured, 5.30%, 6/01/31 | 18,000,000 | 18,429,660 | ||
| Series B, NATL Insured, 4.85%, 6/01/31 | 8,000,000 | 8,177,440 | ||
| Kansas State Development Finance Authority Hospital Revenue, | ||||
| Adventist Health, Refunding, 5.75%, 11/15/38 | 6,250,000 | 6,758,563 | ||
| Susan B. Allen Memorial Hospital, Series Z, Radian Insured, 5.25%, 12/15/23 | 2,000,000 | 1,983,960 | ||
| Kansas State Development Finance Authority Revenue, Water Pollution Control, Revolving | ||||
| Fund, Series II, Pre-Refunded, 5.125%, 11/01/18 | 5,000,000 | 5,000,000 | ||
| Overland Park Development Corp. Revenue, second tier, Overland Park Convention Center | ||||
| Hotel, Refunding, Series B, AMBAC Insured, 5.125%, 1/01/32 | 20,000,000 | 16,853,400 | ||
| Wyandotte County Kansas City Unified Government Utility System Revenue, Series A, | ||||
| BHAC Insured, 5.25%, 9/01/34 | 5,000,000 | 5,436,300 | ||
| 62,639,323 | ||||
| Kentucky 1.4% | ||||
| Carroll County Environmental Facilities Revenue, AMBAC Insured, 5.75%, 2/01/26 | 12,500,000 | 13,307,500 | ||
| Jefferson County Capital Projects Corp. Lease Revenue, Refunding, Series A, zero cpn., | ||||
| 8/15/13 | 6,825,000 | 6,631,443 | ||
| 8/15/14 | 6,860,000 | 6,519,058 | ||
| 8/15/16 | 7,005,000 | 6,217,148 | ||
| 8/15/17 | 7,115,000 | 6,082,329 | ||
| Kentucky Economic Development Finance Authority Health System Revenue, Norton | ||||
| Healthcare Inc., | ||||
| Refunding, Series B, NATL Insured, zero cpn., 10/01/18 | 8,585,000 | 6,123,165 | ||
| Refunding, Series C, NATL Insured, 6.05%, 10/01/19 | 7,385,000 | 7,776,553 | ||
| Refunding, Series C, NATL Insured, 6.10%, 10/01/21 | 6,050,000 | 6,364,842 | ||
| Refunding, Series C, NATL Insured, 6.10%, 10/01/23 | 11,295,000 | 11,822,928 | ||
| Series C, NATL Insured, Pre-Refunded, 6.05%, 10/01/19 | 3,695,000 | 4,113,607 |
28 | Semiannual Report
Franklin Federal Tax-Free Income Fund
Statement of Investments, October 31, 2011 (unaudited) (continued)
Semiannual Report | 29
Franklin Federal Tax-Free Income Fund
Statement of Investments, October 31, 2011 (unaudited) (continued)
| Principal Amount | Value | |||
| Municipal Bonds (continued) | ||||
| Louisiana (continued) | ||||
| Louisiana State Gasoline and Fuels Tax Revenue, | ||||
| second lien, Series B, 5.00%, 5/01/45 | $ | 23,690,000 | $ | 24,928,513 |
| Series A, AGMC Insured, 5.00%, 5/01/35 | 31,040,000 | 31,758,266 | ||
| Series A, AMBAC Insured, 5.00%, 6/01/27 | 19,250,000 | 19,454,050 | ||
| New Orleans GO, | ||||
| Public Improvement, NATL Insured, 5.00%, 10/01/33 | 3,545,000 | 3,479,772 | ||
| Radian Insured, 5.00%, 12/01/27 | 5,935,000 | 6,027,942 | ||
| Radian Insured, 5.125%, 12/01/33 | 11,645,000 | 11,621,593 | ||
| Pointe Coupee Parish PCR, Gulf States Utilities Co. Project, Refunding, 6.70%, 3/01/13 | 1,490,000 | 1,495,677 | ||
| St. Charles Parish Consolidated Waterworks and Wastewater District No. 1 Revenue, Series A, | ||||
| AMBAC Insured, 5.00%, 7/01/36 | 6,230,000 | 6,340,146 | ||
| St. John the Baptist Parish Revenue, Marathon Oil Corp. Project, Series A, 5.125%, | ||||
| 6/01/37 | 40,500,000 | 39,678,660 | ||
| 290,940,869 | ||||
| Maine 0.4% | ||||
| Maine Educational Loan Authority Student Loan Revenue, Series A-3, Assured Guaranty, | ||||
| 5.875%, 12/01/39 | 16,600,000 | 17,304,172 | ||
| Maine Health and Higher Educational Facilities Authority Revenue, | ||||
| MaineGeneral Medical Center Issue, 6.75%, 7/01/36 | 4,250,000 | 4,408,143 | ||
| MaineGeneral Medical Center Issue, 7.00%, 7/01/41 | 10,000,000 | 10,477,600 | ||
| Series A, NATL Insured, 5.00%, 7/01/32 | 6,045,000 | 6,121,469 | ||
| 38,311,384 | ||||
| Maryland 0.6% | ||||
| Baltimore Project Revenue, Water Projects, Series C, AMBAC Insured, 5.00%, 7/01/37 | 8,130,000 | 8,592,597 | ||
| Maryland State EDC, PCR, Potomac Electric Project, Refunding, 6.20%, 9/01/22 | 5,000,000 | 5,872,700 | ||
| Maryland State EDC Student Housing Revenue, University of Maryland College Park Projects, | ||||
| Refunding, Assured Guaranty, 5.00%, 6/01/33 | 15,000,000 | 14,960,100 | ||
| Maryland State Health and Higher Educational Facilities Authority Revenue, | ||||
| Anne Arundel Health System, Series A, 6.75%, 7/01/39 | 3,000,000 | 3,381,300 | ||
| LifeBridge Health, Refunding, Assured Guaranty, 5.00%, 7/01/28 | 3,000,000 | 3,111,990 | ||
| Upper Chesapeake Hospitals, Series C, 6.00%, 1/01/38 | 5,000,000 | 5,165,600 | ||
| Western Maryland Health, Series A, NATL Insured, 5.00%, 7/01/34 | 19,345,000 | 19,519,685 | ||
| 60,603,972 | ||||
| Massachusetts 2.6% | ||||
| Massachusetts Bay Transportation Authority Revenue, Assessment, Refunding, Series A, | ||||
| 5.25%, 7/01/34 | 27,630,000 | 29,983,800 | ||
| Massachusetts Bay Transportation Authority Sales Tax Revenue, Refunding, Senior Series A, | ||||
| 5.00%, 7/01/28 | 10,000,000 | 11,728,500 | ||
| Massachusetts Educational Financing Authority Education Loan Revenue, | ||||
| Series H, Assured Guaranty, 6.35%, 1/01/30 | 6,775,000 | 7,014,699 | ||
| Series I, 6.00%, 1/01/28 | 18,300,000 | 19,575,876 | ||
| Massachusetts State Department of Transportation Metropolitan Highway System Revenue, | ||||
| Senior, Refunding, Series B, 5.00%, 1/01/37 | 31,000,000 | 31,961,620 |
30 | Semiannual Report
Franklin Federal Tax-Free Income Fund
Statement of Investments, October 31, 2011 (unaudited) (continued)
| Principal Amount | Value | |||
| Municipal Bonds (continued) | ||||
| Massachusetts (continued) | ||||
| Massachusetts State Development Finance Agency Revenue, | ||||
| Brandeis University, Refunding, Series O-1, 5.00%, 10/01/40 | $ | 19,865,000 | $ | 20,254,155 |
| Massachusetts/Saltonstall Building Redevelopment Corp. Project, 100 Cambridge Street | ||||
| Redevelopment, Series A, NATL Insured, 5.125%, 8/01/28 | 6,735,000 | 6,685,835 | ||
| Worcester Polytechnic Institute, Refunding, NATL Insured, 5.00%, 9/01/37 | 10,000,000 | 10,242,900 | ||
| Massachusetts State GO, | ||||
| Consolidated Loan, Series C, AMBAC Insured, 5.00%, 8/01/37 | 10,000,000 | 10,624,100 | ||
| NATL Insured, Pre-Refunded, 5.00%, 8/01/22 | 4,100,000 | 4,239,400 | ||
| Massachusetts State Health and Educational Facilities Authority Revenue, | ||||
| Berklee College of Music, Refunding, Series A, 5.00%, 10/01/37 | 10,000,000 | 10,158,000 | ||
| Berkshire Health System, Series E, 6.25%, 10/01/31 | 2,250,000 | 2,257,043 | ||
| Berkshire Health System, Series E, Radian Insured, 5.70%, 10/01/25 | 4,500,000 | 4,507,785 | ||
| Emmanuel College, NATL Insured, 5.00%, 7/01/37 | 10,000,000 | 9,316,100 | ||
| Northeastern University, Series A, 5.00%, 10/01/35 | 20,000,000 | 20,623,000 | ||
| Northeastern University, Series R, 5.00%, 10/01/33 | 6,830,000 | 6,965,575 | ||
| Springfield College, 5.50%, 10/15/31 | 1,710,000 | 1,717,592 | ||
| Springfield College, 5.625%, 10/15/40 | 7,000,000 | 6,916,000 | ||
| Massachusetts State HFA Housing Revenue, Series B, 7.00%, 12/01/38 | 10,000,000 | 10,820,400 | ||
| Massachusetts State School Building Authority Dedicated Sales Tax Revenue, Series A, | ||||
| AGMC Insured, 5.00%, 8/15/30 | 15,000,000 | 15,987,300 | ||
| AMBAC Insured, 4.50%, 8/15/35 | 30,000,000 | 30,502,500 | ||
| Massachusetts State Water Pollution Abatement Trust Revenue, MWRA Program, Series A, | ||||
| 5.00%, 8/01/32 | 225,000 | 228,528 | ||
| Pre-Refunded, 5.00%, 8/01/32 | 4,775,000 | 4,944,656 | ||
| Massachusetts State Water Pollution Abatement Trust Water Pollution Abatement Revenue, | ||||
| MWRA Program, Refunding, Sub Series A, 5.75%, 8/01/29 | 450,000 | 451,458 | ||
| 277,706,822 | ||||
| Michigan 3.5% | ||||
| Anchor Bay School District GO, Pre-Refunded, 5.00%, 5/01/29 | 5,000,000 | 5,000,000 | ||
| Chippewa Valley School GO, Pre-Refunded, 5.125%, 5/01/27 | 5,310,000 | 5,439,192 | ||
| Detroit City School District GO, School Building and Site Improvement, | ||||
| Series A, AGMC Insured, Pre-Refunded, 5.125%, 5/01/31 | 14,925,000 | 15,288,125 | ||
| Series A, FGIC Insured, Pre-Refunded, 5.00%, 5/01/23 | 2,000,000 | 2,134,460 | ||
| Series B, FGIC Insured, 5.00%, 5/01/33 | 16,870,000 | 16,500,378 | ||
| Detroit GO, Distribution State Aid, 5.00%, 11/01/30 | 22,500,000 | 23,090,175 | ||
| Detroit Sewage Disposal System Revenue, second lien, Series A, NATL Insured, 5.00%, | ||||
| 7/01/30 | 5,470,000 | 5,430,288 | ||
| Detroit Water Supply System Revenue, | ||||
| second lien, Series B, AGMC Insured, 7.00%, 7/01/36 | 5,000,000 | 5,890,700 | ||
| senior lien, Refunding, Series B, Assured Guaranty, 5.00%, 7/01/21 | 10,000,000 | 10,477,200 | ||
| senior lien, Refunding, Series D, AGMC Insured, 5.00%, 7/01/32 | 32,650,000 | 32,701,587 | ||
| senior lien, Series A, NATL RE, FGIC Insured, 5.00%, 7/01/30 | 17,575,000 | 17,575,176 | ||
| Detroit/Wayne County Stadium Authority Revenue, NATL RE, FGIC Insured, 5.25%, | ||||
| 2/01/27 | 8,625,000 | 8,628,364 | ||
| Grand Rapids Public Schools GO, School Building and Site, AGMC Insured, 4.50%, | ||||
| 5/01/31 | 21,800,000 | 22,032,606 | ||
| Michigan State Building Authority Revenue, | ||||
| Facilities Program, Refunding, Series I, 6.25%, 10/15/38 | 15,000,000 | 16,693,200 | ||
| Facilities Program, Refunding, Series I-A, 5.375%, 10/15/36 | 6,730,000 | 7,203,590 | ||
| Semiannual Report | 31 | ||||
Franklin Federal Tax-Free Income Fund
Statement of Investments, October 31, 2011 (unaudited) (continued)
| Principal Amount | Value | |||
| Municipal Bonds (continued) | ||||
| Michigan (continued) | ||||
| Michigan State Building Authority Revenue, (continued) | ||||
| Facilities Program, Series H, 5.125%, 10/15/33 | $ | 12,500,000 | $ | 13,102,125 |
| Facilities Program, Series H, AGMC Insured, 5.00%, 10/15/26 | 5,000,000 | 5,341,050 | ||
| Refunding, Series IA, NATL RE, FGIC Insured, 5.00%, 10/15/31 | 9,475,000 | 9,746,364 | ||
| Michigan State Finance Authority Revenue, 5.50%, 6/01/21 | 10,000,000 | 10,516,300 | ||
| Michigan State GO, Environmental Program, Refunding, Series A, | ||||
| 6.00%, 11/01/24 | 1,000,000 | 1,167,140 | ||
| 5.50%, 11/01/25 | 1,000,000 | 1,117,570 | ||
| Michigan State HDA, SFMR, Series A, 5.00%, 12/01/19 | 10,000,000 | 10,389,300 | ||
| Michigan State Hospital Finance Authority Revenue, Mid-Michigan Obligation Group, | ||||
| Series A, | ||||
| 6.00%, 6/01/29 | 4,000,000 | 4,236,640 | ||
| 6.125%, 6/01/39 | 5,000,000 | 5,273,550 | ||
| Michigan State Strategic Fund Limited Obligation Revenue, Detroit Education, Refunding, | ||||
| 5.625%, 7/01/20 | 7,000,000 | 8,217,020 | ||
| Michigan State Strategic Fund Resources Recovery Limited Obligation Revenue, Detroit | ||||
| Education Exempt Facilities, Refunding, Series D, XLCA Insured, 5.25%, 12/15/32 | 10,000,000 | 10,041,300 | ||
| Michigan State Trunk Line Revenue, Series A, AGMC Insured, Pre-Refunded, 5.25%, | ||||
| 11/01/30 | 10,000,000 | 10,000,000 | ||
| Michigan Tobacco Settlement Finance Authority Revenue, Tobacco Settlement Asset, | ||||
| Senior Series A, 6.00%, 6/01/34 | 42,680,000 | 32,211,877 | ||
| Royal Oak Hospital Finance Authority Hospital Revenue, William Beaumont Hospital, | ||||
| Refunding, 8.25%, 9/01/39 | 20,000,000 | 23,642,600 | ||
| Refunding, Series W, 6.375%, 8/01/29 | 10,000,000 | 10,819,700 | ||
| Series M, NATL Insured, 5.25%, 11/15/31 | 10,000,000 | 9,999,500 | ||
| Wayne State University Revenues, General, AMBAC Insured, 5.00%, 11/15/36 | 5,000,000 | 5,118,200 | ||
| West Ottawa Public School District GO, Series A, 5.00%, 5/01/27 | 5,000,000 | 5,051,200 | ||
| 370,076,477 | ||||
| Minnesota 0.3% | ||||
| Cloquet PCR, Potlatch Corp. Projects, Refunding, 5.90%, 10/01/26 | 9,100,000 | 9,098,999 | ||
| Golden Valley Revenue, Covenant Retirement Communities, Series A, 5.50%, 12/01/29 | 1,500,000 | 1,481,325 | ||
| Minneapolis Health Care System Revenue, Fairview Health Services, Series A, | ||||
| 6.625%, 11/15/28 | 11,000,000 | 12,304,380 | ||
| 6.75%, 11/15/32 | 6,250,000 | 6,978,000 | ||
| Minnesota Agricultural and Economic Development Board Revenue, Health Care System, | ||||
| Refunding, Series A, NATL Insured, 5.75%, 11/15/26 | 510,000 | 510,362 | ||
| University of Minnesota Revenue, Series A, ETM, 5.75%, 7/01/13 | 1,250,000 | 1,344,313 | ||
| 31,717,379 | ||||
| Mississippi 0.8% | ||||
| Claiborne County PCR, Systems Energy Resources Inc. Project, Refunding, 6.20%, | ||||
| 2/01/26 | 36,500,000 | 36,595,265 | ||
| Mississippi Business Finance Corp. PCR, System Energy Resource Inc. Project, Refunding, | ||||
| 5.875%, 4/01/22 | 40,000,000 | 40,241,600 | ||
| 5.90%, 5/01/22 | 8,250,000 | 8,299,913 | ||
| Mississippi State GO, Refunding, 5.75%, 12/01/12 | 2,000,000 | 2,114,280 | ||
| 87,251,058 |
32 | Semiannual Report
Franklin Federal Tax-Free Income Fund
Statement of Investments, October 31, 2011 (unaudited) (continued)
| Principal Amount | Value | |||
| Municipal Bonds (continued) | ||||
| Missouri 0.7% | ||||
| Jackson County Special Obligation Revenue, NATL Insured, 5.00%, 12/01/22 | $ | 9,095,000 | $ | 9,305,731 |
| Missouri Development Finance Board Cultural Facilities Revenue, Nelson Gallery Foundation, | ||||
| Series A, NATL Insured, 5.00%, 12/01/30 | 11,500,000 | 11,518,975 | ||
| Missouri Joint Municipal Electric Utility Commission Power Project Revenue, | ||||
| Iatan 2 Project, Series A, AMBAC Insured, 5.00%, 1/01/34 | 14,000,000 | 14,368,900 | ||
| Plum Point Project, NATL Insured, 5.00%, 1/01/34 | 13,000,000 | 12,776,920 | ||
| Missouri State Board of Public Buildings Special Obligation Revenue, Series A, 4.75%, | ||||
| 10/15/28 | 8,250,000 | 8,620,343 | ||
| Missouri State Health and Educational Facilities Authority Health Facilities Revenue, | ||||
| St. Luke’s Health System, Series B, AGMC Insured, 5.50%, 11/15/35 | 15,000,000 | 15,757,200 | ||
| Taney County IDA Hospital Revenue, The Skaggs Community Hospital Assn., Refunding, | ||||
| 5.40%, 5/15/28 | 4,000,000 | 3,434,760 | ||
| 75,782,829 | ||||
| Montana 0.2% | ||||
| Forsyth PCR, Puget Sound Energy, Refunding, Series A, AMBAC Insured, 5.00%, | ||||
| 3/01/31 | 20,000,000 | 20,230,600 | ||
| Nebraska 1.4% | ||||
| Adams County School District No. 018 GO, Hastings Public Schools, AGMC Insured, | ||||
| 5.00%, 12/15/31 | 5,795,000 | 6,176,427 | ||
| Lancaster County Correctional Facility Joint Public Agency GO, Building, 5.00%, | ||||
| 12/01/28 | 5,000,000 | 5,650,300 | ||
| Lancaster County School District No. 001 GO, Lincoln Public Schools, 5.00%, 1/15/36 | 24,725,000 | 26,033,200 | ||
| Lincoln Electric System Revenue, 5.00%, 9/01/31 | 8,645,000 | 9,169,060 | ||
| Madison County Hospital Authority No. 001 Hospital Revenue, Faith Regional Health | ||||
| Services Project, Series A-1, 6.00%, 7/01/33 | 12,000,000 | 12,380,400 | ||
| Municipal Energy Agency of Nebraska Power Supply System Revenue, Refunding, Series A, | ||||
| BHAC Insured, 5.375%, 4/01/39 | 5,000,000 | 5,407,350 | ||
| Omaha Convention Hotel Corp. Revenue, Convention Center, first tier, | ||||
| Refunding, AMBAC Insured, 5.00%, 2/01/35 | 30,000,000 | 30,960,300 | ||
| Series A, AMBAC Insured, Pre-Refunded, 5.125%, 4/01/26 | 12,500,000 | 12,750,250 | ||
| Omaha Public Facilities Corp. Lease Revenue, Baseball Stadium Project, 5.00%, | ||||
| 6/01/36 | 9,000,000 | 9,607,320 | ||
| Omaha Public Power District Separate Electric System Revenue, Nebraska City 2, Series A, | ||||
| AMBAC Insured, 5.00%, 2/01/30 | 12,165,000 | 12,824,099 | ||
| University of Nebraska Revenues, | ||||
| Kearney Student Fees and Facilities, 5.00%, 7/01/30 | 5,000,000 | 5,307,750 | ||
| Lincoln Student Fees and Facilities, Series A, 5.25%, 7/01/34 | 5,000,000 | 5,466,950 | ||
| Omaha Student Facilities Project, 5.00%, 5/15/32 | 5,000,000 | 5,322,500 | ||
| University of Nebraska Omaha Health and Recreation Project, 5.00%, 5/15/38 | 5,000,000 | 5,329,300 | ||
| 152,385,206 | ||||
| Nevada 0.5% | ||||
| Clark County Airport Revenue, sub. lien, Series A-2, NATL RE, FGIC Insured, 5.125%, | ||||
| 7/01/27 | 10,000,000 | 10,242,700 | ||
| Clark County School District GO, | ||||
| Refunding, Series A, NATL RE, FGIC Insured, 5.00%, 6/15/24 | 15,000,000 | 16,258,350 | ||
| Series C, AGMC Insured, 5.00%, 6/15/21 | 10,000,000 | 10,752,700 |
Semiannual Report | 33
Franklin Federal Tax-Free Income Fund
Statement of Investments, October 31, 2011 (unaudited) (continued)
| Principal Amount | Value | |||
| Municipal Bonds (continued) | ||||
| Nevada (continued) | ||||
| Nevada State GO, Municipal Bond Bank Project No. 40-41, Series A, ETM, 6.375%, | ||||
| 12/01/17 | $ | 9,105,000 | $ | 9,141,147 |
| Washoe County GO, Reno Sparks Convention, Refunding, Series A, NATL RE, FGIC Insured, | ||||
| 5.00%, 7/01/24 | 5,000,000 | 5,010,250 | ||
| 51,405,147 | ||||
| New Hampshire 0.3% | ||||
| Nashua Housing Authority MFR, Clocktower Project, Refunding, GNMA Secured, 6.25%, | ||||
| 6/20/33 | 5,167,000 | 5,170,875 | ||
| New Hampshire Health and Education Facilities Authority Revenue, | ||||
| Exeter Project, 6.00%, 10/01/24 | 2,000,000 | 2,022,980 | ||
| Exeter Project, 5.75%, 10/01/31 | 1,000,000 | 1,010,680 | ||
| The Memorial Hospital, Refunding, 5.25%, 6/01/26 | 1,000,000 | 923,180 | ||
| The Memorial Hospital, Refunding, 5.25%, 6/01/36 | 1,100,000 | 951,610 | ||
| New Hampshire Higher Educational and Health Facilities Authority Revenue, New Hampshire | ||||
| Catholic Charities, 5.80%, 8/01/22 | 1,050,000 | 1,049,895 | ||
| New Hampshire Municipal Bond Bank Revenue, Series B, 5.00%, 8/15/39 | 11,250,000 | 11,981,250 | ||
| New Hampshire State Business Finance Authority Revenue, Elliot Hospital Obligation Group, | ||||
| Series A, 6.125%, 10/01/39 | 5,000,000 | 4,950,200 | ||
| 28,060,670 | ||||
| New Jersey 3.1% | ||||
| Bayonne GO, General Improvement, Refunding, 5.75%, 7/01/35 | 9,000,000 | 9,899,010 | ||
| Health Care Facilities Financing Authority Revenue, Englewood Hospital, NATL Insured, | ||||
| 5.00%, 8/01/23 | 5,000,000 | 5,059,250 | ||
| New Jersey EDA Lease Revenue, International Center for Public Health Project, University | ||||
| of Medicine and Dentistry, AMBAC Insured, 6.00%, 6/01/32 | 5,000,000 | 5,003,200 | ||
| New Jersey EDA Revenue, | ||||
| Cigarette Tax, 5.75%, 6/15/29 | 20,000,000 | 19,694,000 | ||
| Motor Vehicle Surcharge Revenue, Series A, NATL Insured, 5.00%, 7/01/29 | 10,000,000 | 10,300,500 | ||
| Motor Vehicle Surcharge Revenue, Series A, NATL Insured, 5.00%, 7/01/34 | 5,000,000 | 5,100,700 | ||
| School Facilities Construction, Series C, NATL Insured, 4.75%, 6/15/25 | 7,500,000 | 7,531,800 | ||
| School Facilities Construction, Series O, 5.125%, 3/01/28 | 20,000,000 | 20,883,600 | ||
| School Facilities Construction, Series U, 5.00%, 9/01/37 | 22,000,000 | 22,602,360 | ||
| New Jersey Health Care Facilities Financing Authority State Contract Revenue, Hospital Asset | ||||
| Transformation Program, Series A, 5.25%, 10/01/38 | 10,000,000 | 10,303,100 | ||
| New Jersey State COP, Equipment Lease Purchase, Series A, 5.25%, | ||||
| 6/15/25 | 20,305,000 | 21,832,139 | ||
| 6/15/26 | 8,000,000 | 8,569,280 | ||
| 6/15/27 | 4,000,000 | 4,255,080 | ||
| 6/15/28 | 2,000,000 | 2,118,200 | ||
| New Jersey State Housing and Mortgage Finance Agency Revenue, Series AA, 6.375%, | ||||
| 10/01/28 | 6,995,000 | 7,529,698 | ||
| New Jersey State Transportation Trust Fund Authority Revenue, Transportation System, | ||||
| Series A, 6.00%, 12/15/38 | 39,505,000 | 44,018,051 | ||
| Series A, Pre-Refunded, 6.00%, 12/15/38 | 20,495,000 | 26,283,403 | ||
| Series D, 5.25%, 12/15/23 | 50,000,000 | 56,363,500 |
34 | Semiannual Report
Franklin Federal Tax-Free Income Fund
Statement of Investments, October 31, 2011 (unaudited) (continued)
| Principal Amount | Value | |||
| Municipal Bonds (continued) | ||||
| New Jersey (continued) | ||||
| New Jersey State Turnpike Authority Turnpike Revenue, | ||||
| Growth and Income Securities, Series B, AMBAC Insured, zero cpn. to 1/01/15, | ||||
| 5.15% thereafter, 1/01/35 | $ | 10,000,000 | $ | 8,634,300 |
| Series E, 5.25%, 1/01/40 | 13,925,000 | 14,618,326 | ||
| Tobacco Settlement FICO Revenue, Asset-Backed, Pre-Refunded, 5.75%, 6/01/32 | 12,810,000 | 13,214,924 | ||
| 323,814,421 | ||||
| New Mexico 0.1% | ||||
| New Mexico Finance Authority Revenue, New Mexico Finance Authority, Series B, 5.50%, | ||||
| 6/01/39 | 9,735,000 | 9,735,000 | ||
| New York 6.2% | ||||
| Long Island Power Authority Electric System Revenue, General, Refunding, Series A, 6.00%, | ||||
| 5/01/33 | 12,500,000 | 14,053,500 | ||
| MTA Dedicated Tax Fund Revenue, Series B, | ||||
| 5.25%, 11/15/28 | 6,000,000 | 6,553,920 | ||
| 5.25%, 11/15/29 | 4,000,000 | 4,354,920 | ||
| 5.25%, 11/15/30 | 3,000,000 | 3,251,160 | ||
| 5.00%, 11/15/34 | 15,000,000 | 15,800,400 | ||
| MTA Revenue, | ||||
| Refunding, Series E, 5.25%, 11/15/31 | 10,000,000 | 10,253,900 | ||
| Refunding, Series U, 5.125%, 11/15/31 | 20,720,000 | 21,209,199 | ||
| Series A, 5.00%, 11/15/37 | 25,000,000 | 25,640,250 | ||
| Transportation, Refunding, Series D, 5.25%, 11/15/40 | 15,000,000 | 15,668,700 | ||
| Transportation, Series C, 6.50%, 11/15/28 | 15,000,000 | 17,630,550 | ||
| MTA Transit Facilities Revenue, Service Contract, Series 8, Pre-Refunded, 5.375%, | ||||
| 7/01/21 | 15,000,000 | 16,234,200 | ||
| New York City GO, | ||||
| Refunding, Series C, 5.00%, 8/01/23 | 24,620,000 | 27,871,810 | ||
| Refunding, Series H, 6.125%, 8/01/25 | 5,000 | 5,018 | ||
| Series D, 8.00%, 8/01/16 | 5,000 | 5,086 | ||
| Series D, 5.50%, 6/01/24 | 16,085,000 | 16,433,723 | ||
| Series D, Pre-Refunded, 5.50%, 6/01/24 | 7,855,000 | 8,091,985 | ||
| Series E, 6.50%, 12/01/12 | 20,000 | 20,701 | ||
| Series E, Sub Series E-1, 6.25%, 10/15/28 | 10,000,000 | 11,750,700 | ||
| Series F, 5.25%, 1/15/23 | 10,065,000 | 10,503,331 | ||
| Series F, Pre-Refunded, 5.25%, 1/15/23 | 9,935,000 | 10,519,873 | ||
| New York City Municipal Water Finance Authority Water and Sewer System Revenue, | ||||
| Refunding, Series FF-2, 5.50%, 6/15/40 | 15,000,000 | 16,578,150 | ||
| Second General Resolution, Refunding, Series AA, 5.00%, 6/15/37 | 10,000,000 | 10,391,100 | ||
| Second General Resolution, Refunding, Series EE, 5.25%, 6/15/40 | 64,970,000 | 70,298,190 | ||
| Series A, 5.75%, 6/15/40 | 6,000,000 | 6,794,760 | ||
| New York City Transitional Finance Authority Building Aid Revenue, | ||||
| Fiscal 2009, Series S-2, 6.00%, 7/15/38 | 20,000,000 | 22,454,200 | ||
| Fiscal 2009, Series S-3, 5.25%, 1/15/34 | 10,170,000 | 10,826,880 | ||
| Fiscal 2009, Series S-4, 5.50%, 1/15/34 | 12,890,000 | 14,004,469 | ||
| Series S-2, Sub Series S-2A, 5.00%, 7/15/40 | 35,000,000 | 37,038,050 |
Semiannual Report | 35
Franklin Federal Tax-Free Income Fund
Statement of Investments, October 31, 2011 (unaudited) (continued)
| Principal Amount | Value | |||
| Municipal Bonds (continued) | ||||
| New York (continued) | ||||
| New York City Transitional Finance Authority Revenue, | ||||
| Future Tax Secured, Refunding, Series B, 5.00%, 5/01/30 | $ | 170,000 | $ | 172,349 |
| Future Tax Secured, Series B, Pre-Refunded, 5.00%, 5/01/30 | 7,330,000 | 7,403,300 | ||
| Future Tax Secured, Series D, 5.00%, 2/01/27 | 9,590,000 | 9,893,523 | ||
| Future Tax Secured, Series D, Pre-Refunded, 5.00%, 2/01/27 | 410,000 | 433,493 | ||
| sub. bond, Future Tax Secured, Series C, 5.00%, 11/01/39 | 15,000,000 | 15,972,150 | ||
| New York City Trust for Cultural Resources Revenue, Museum of Modern Art 2001, Series D, | ||||
| AMBAC Insured, 5.125%, 7/01/31 | 8,000,000 | 8,082,240 | ||
| New York Convention Center Development Corp. Revenue, Hotel Unit Fee Secured, | ||||
| AMBAC Insured, 5.00%, 11/15/30 | 10,000,000 | 10,286,400 | ||
| New York Liberty Development Corp. Liberty Revenue, Second Priority, Bank of America | ||||
| Tower at One Bryant Park Project, Class 1, Refunding, 5.625%, 1/15/46 | 25,000,000 | 26,124,000 | ||
| New York Liberty Development Corp. Revenue, | ||||
| 5.50%, 10/01/37 | 24,995,000 | 25,480,653 | ||
| Goldman Sachs Headquarters, 5.25%, 10/01/35 | 14,000,000 | 14,287,560 | ||
| New York State Dormitory Authority Lease Revenue, State University Dormitory Facilities, | ||||
| Series A, 5.00%, 7/01/41 | 10,000,000 | 10,548,100 | ||
| New York State Dormitory Authority Revenues, State Supported Debt, Upstate Community | ||||
| Colleges, | ||||
| 6.00%, 7/01/31 | 23,215,000 | 26,018,443 | ||
| Refunding, Series A, 5.00%, 7/01/28 | 1,535,000 | 1,536,996 | ||
| New York State HFAR, Housing Project Mortgage, Refunding, Series A, AGMC Insured, | ||||
| 6.10%, 11/01/15 | 370,000 | 370,870 | ||
| 6.125%, 11/01/20 | 305,000 | 305,537 | ||
| New York State Urban Development Corp. Revenue, State Personal Income Tax, Series B-1, | ||||
| 5.00%, 3/15/36 | 5,000,000 | 5,283,400 | ||
| Onondaga County GO, 5.875%, 2/15/12 | 300,000 | 304,845 | ||
| Triborough Bridge and Tunnel Authority Revenues, | ||||
| General, Series A-2, 5.25%, 11/15/34 | 7,500,000 | 8,045,925 | ||
| General Purpose, 5.25%, 11/15/38 | 25,000,000 | 26,603,250 | ||
| General Purpose, Series A, Pre-Refunded, 5.00%, 1/01/27 | 5,000,000 | 5,038,650 | ||
| General Purpose, Series A, Pre-Refunded, 5.00%, 1/01/32 | 3,085,000 | 3,108,847 | ||
| General Purpose, Series B, Pre-Refunded, 5.50%, 1/01/30 | 15,000,000 | 19,002,600 | ||
| General Purpose, Series X, ETM, 6.625%, 1/01/12 | 1,055,000 | 1,065,909 | ||
| General Purpose, Series Y, ETM, 6.00%, 1/01/12 | 200,000 | 201,866 | ||
| 649,809,631 | ||||
| North Carolina 2.4% | ||||
| Charlotte Airport Revenue, Series A, NATL Insured, 5.00%, 7/01/34 | 6,000,000 | 6,096,660 | ||
| Charlotte COP, | ||||
| Refunding, Series C, 5.00%, 6/01/34 | 13,000,000 | 13,565,630 | ||
| Transit Projects, Phase II, Series E, 5.00%, 6/01/30 | 15,940,000 | 16,305,823 | ||
| North Carolina Eastern Municipal Power Agency Power System Revenue, | ||||
| Refunding, Series B, 6.00%, 1/01/22 | 1,250,000 | 1,521,187 | ||
| Refunding, Series B, 6.25%, 1/01/23 | 39,030,000 | 48,221,955 | ||
| Refunding, Series D, 5.125%, 1/01/23 | 12,000,000 | 12,218,040 | ||
| Refunding, Series D, 5.125%, 1/01/26 | 3,000,000 | 3,037,410 | ||
| Series A, 5.50%, 1/01/26 | 4,500,000 | 4,913,505 |
36 | Semiannual Report
Franklin Federal Tax-Free Income Fund
Statement of Investments, October 31, 2011 (unaudited) (continued)
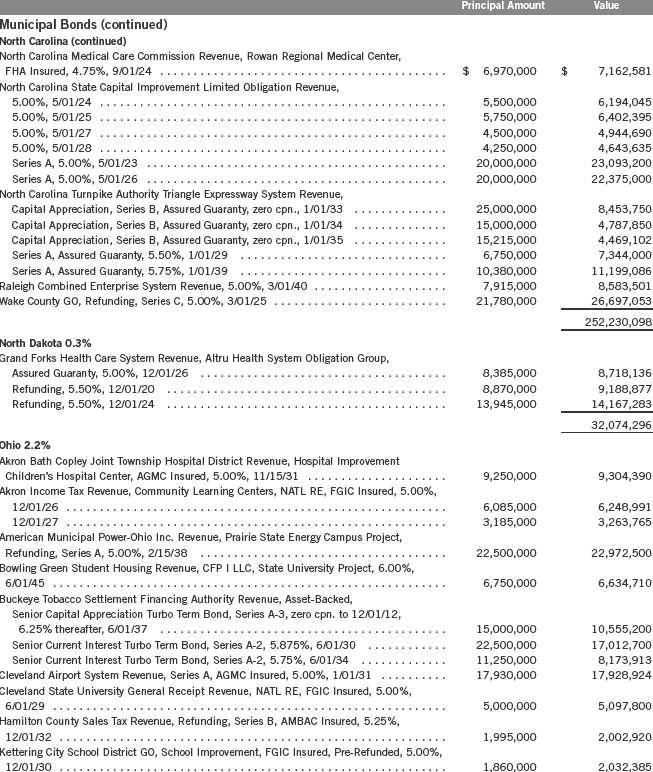
Semiannual Report | 37
Franklin Federal Tax-Free Income Fund
Statement of Investments, October 31, 2011 (unaudited) (continued)
| Principal Amount | Value | |||
| Municipal Bonds (continued) | ||||
| Ohio (continued) | ||||
| Little Miami Local School District GO, School Improvement, AGMC Insured, Pre-Refunded, | ||||
| 5.00%, 12/01/34 | $ | 4,000,000 | $ | 4,716,280 |
| Maple Heights City School District GO, School Facilities Improvement, 5.00%, 1/15/37 | 29,370,000 | 30,566,827 | ||
| Marysville Wastewater Treatment System Revenue, Refunding, XLCA Insured, 5.00%, | ||||
| 12/01/31 | 8,000,000 | 8,150,400 | ||
| 12/01/36 | 13,725,000 | 13,853,054 | ||
| Ohio State Air Quality Development Authority Revenue, | ||||
| Environmental Improvement, Buckeye Power Inc. Project, 6.00%, 12/01/40 | 15,000,000 | 15,825,600 | ||
| Pollution Control, FirstEnergy Solutions Corp., Refunding, Series C, 5.625%, 6/01/18 | 8,500,000 | 9,484,045 | ||
| Ohio State GO, Series A, 5.375%, 9/01/28 | 10,000,000 | 11,031,600 | ||
| Ohio State Water Development Authority Pollution Control Facilities Revenue, FirstEnergy | ||||
| Solutions Corp., Mandatory Put 6/01/16, Refunding, Series A, 5.875%, 6/01/33 | 13,000,000 | 14,569,490 | ||
| Scioto County Hospital Revenue, Southern Ohio Medical Center, Refunding, 5.75%, | ||||
| 2/15/38 | 17,000,000 | 17,375,530 | ||
| 236,801,024 | ||||
| Oregon 1.0% | ||||
| Lane County School District No. 19 Springfield GO, Refunding, NATL RE, FGIC Insured, | ||||
| 6.00%, 10/15/13 | 1,250,000 | 1,367,837 | ||
| Oregon Health and Science University Revenue, Series A, | ||||
| 5.75%, 7/01/39 | 5,000,000 | 5,424,500 | ||
| NATL Insured, 5.00%, 7/01/26 | 10,500,000 | 10,618,650 | ||
| Oregon State Department of Transportation Highway User Tax Revenue, senior lien, Series A, | ||||
| 4.50%, 11/15/32 | 30,000,000 | 30,861,600 | ||
| Oregon State EDR, Georgia-Pacific Corp. Project, | ||||
| Refunding, Series 183, 5.70%, 12/01/25 | 3,500,000 | 3,500,140 | ||
| Series CLVII, 6.35%, 8/01/25 | 5,500,000 | 5,501,045 | ||
| Oregon State GO, State Board of Higher Education, Series A, 5.00%, | ||||
| 8/01/26 | 6,630,000 | 7,281,000 | ||
| 8/01/27 | 6,955,000 | 7,609,048 | ||
| Port of Portland International Airport Revenue, Series Nineteen, 5.50%, 7/01/38 | 25,000,000 | 26,467,750 | ||
| Portland Sewer System Revenue, second lien, Series A, 5.00%, 3/01/35 | 11,540,000 | 12,324,605 | ||
| 110,956,175 | ||||
| Pennsylvania 3.1% | ||||
| Centennial School District Bucks County GO, Series B, AGMC Insured, 5.25%, 12/15/37 | 13,655,000 | 14,816,904 | ||
| Coatesville School District GO, AGMC Insured, 5.00%, 8/01/24 | 6,420,000 | 6,896,107 | ||
| Delaware Valley Regional Finance Authority Local Government Revenue, Series B, | ||||
| AMBAC Insured, 5.60%, 7/01/17 | 5,000,000 | 5,542,850 | ||
| Erie Water Authority Water Revenue, Series A, NATL Insured, Pre-Refunded, 5.20%, | ||||
| 12/01/30 | 18,700,000 | 18,771,995 | ||
| Montgomery County IDA Retirement Community Revenue, ACTS Retirement-Life | ||||
| Communities Inc. Obligated Group, 5.25%, 11/15/28 | 2,500,000 | 2,426,025 | ||
| Northampton County General Purpose Authority Hospital Revenue, St. Luke’s Hospital | ||||
| Project, Series A, 5.375%, 8/15/28 | 5,000,000 | 5,037,700 | ||
| Northampton County General Purpose Authority Revenue, County Agreement, AGMC Insured, | ||||
| 5.25%, 10/01/30 | 12,150,000 | 12,445,488 | ||
| Pennsylvania Economic Development Financing Authority Exempt Facilities Revenue, | ||||
| Allegheny Energy Supply Co. LLC Project, 7.00%, 7/15/39 | 20,000,000 | 21,860,400 |
38 | Semiannual Report
Franklin Federal Tax-Free Income Fund
Statement of Investments, October 31, 2011 (unaudited) (continued)
| Principal Amount | Value | |||
| Municipal Bonds (continued) | ||||
| Pennsylvania (continued) | ||||
| Pennsylvania Economic Development Financing Authority Water Facility Revenue, | ||||
| American Water Co. Project, 6.20%, 4/01/39 | $ | 12,500,000 | $ | 13,934,375 |
| Aqua Inc. Project, Series B, 5.00%, 12/01/43 | 20,000,000 | 20,919,800 | ||
| Pennsylvania State Higher Educational Facilities Authority Revenue, Temple University, | ||||
| Refunding, NATL Insured, 5.00%, 4/01/33 | 13,225,000 | 13,646,481 | ||
| Pennsylvania State Turnpike Commission Turnpike Revenue, | ||||
| 5.00%, 12/01/38 | 20,000,000 | 20,932,200 | ||
| Capital Appreciation, Series C, AGMC Insured, zero cpn. to 6/01/16, 6.25% thereafter, | ||||
| 6/01/33 | 5,000,000 | 4,197,450 | ||
| Refunding, Series C, Sub Series C-1, Assured Guaranty, 6.00%, 6/01/28 | 5,000,000 | 5,650,250 | ||
| Refunding, Series C, Sub Series C-1, Assured Guaranty, 6.25%, 6/01/38 | 15,000,000 | 16,741,650 | ||
| Series B, 5.75%, 6/01/39 | 20,000,000 | 21,298,800 | ||
| Philadelphia Gas Works Revenue, Fifth Series A-1, AGMC Insured, 5.00%, 9/01/29 | 5,000,000 | 5,073,350 | ||
| Philadelphia GO, Refunding, Series A, Assured Guaranty, 5.00%, 8/01/24 | 11,000,000 | 11,494,560 | ||
| Philadelphia Hospitals and Higher Educational Facilities Authority Revenue, Mortgage, | ||||
| North Philadelphia Health Systems, Refunding, Series A, FHA Insured, | ||||
| 5.30%, 1/01/18 | 1,860,000 | 1,865,208 | ||
| 5.35%, 1/01/23 | 5,690,000 | 5,705,932 | ||
| 5.375%, 1/01/28 | 3,700,000 | 3,702,072 | ||
| Philadelphia Municipal Authority Revenue, Lease, 6.375%, 4/01/29 | 4,500,000 | 4,787,370 | ||
| Philadelphia RDAR, Neighborhood Transformation, Series C, NATL RE, FGIC Insured, 5.00%, | ||||
| 4/15/29 | 10,965,000 | 11,082,326 | ||
| 4/15/30 | 12,000,000 | 12,116,880 | ||
| Philadelphia School District GO, Series E, 6.00%, 9/01/38 | 25,000,000 | 27,243,000 | ||
| Philadelphia Water and Wastewater Revenue, Series A, | ||||
| 5.25%, 1/01/25 | 1,000,000 | 1,077,760 | ||
| 5.00%, 1/01/26 | 5,000,000 | 5,279,700 | ||
| 5.00%, 1/01/27 | 1,750,000 | 1,835,715 | ||
| 5.25%, 1/01/32 | 5,000,000 | 5,242,700 | ||
| NATL RE, FGIC Insured, 5.00%, 11/01/31 | 8,995,000 | 9,048,700 | ||
| Pittsburgh and Allegheny County Sports and Exhibition Authority Hotel Room Regional | ||||
| Enterprise Tower Revenue, Refunding, Assured Guaranty, 5.00%, 2/01/35 | 18,000,000 | 18,036,540 | ||
| 328,710,288 | ||||
| Rhode Island 1.2% | ||||
| Narragansett Bay Commission Wastewater System Revenue, Series A, NATL Insured, 5.00%, | ||||
| 8/01/30 | 7,990,000 | 8,250,794 | ||
| Rhode Island Convention Center Authority Revenue, Refunding, Series A, Assured Guaranty, | ||||
| 5.50%, 5/15/27 | 17,300,000 | 19,103,352 | ||
| Rhode Island Housing and Mortgage Finance Corp. Revenue, Homeownership Opportunity, | ||||
| Refunding, Series 15-A, 6.85%, 10/01/24 | 620,000 | 620,911 | ||
| Refunding, Series 25-A, 4.95%, 10/01/16 | 75,000 | 75,091 | ||
| Series 10-A, 6.50%, 10/01/22 | 475,000 | 475,418 | ||
| Series 10-A, 6.50%, 4/01/27 | 265,000 | 265,204 | ||
| Rhode Island State EDC Airport Revenue, Series B, NATL Insured, 5.00%, | ||||
| 7/01/27 | 12,280,000 | 12,418,273 | ||
| 7/01/30 | 14,965,000 | 15,003,610 |
Semiannual Report | 39
Franklin Federal Tax-Free Income Fund
Statement of Investments, October 31, 2011 (unaudited) (continued)
| Principal Amount | Value | |||
| Municipal Bonds (continued) | ||||
| Rhode Island (continued) | ||||
| Rhode Island State Health and Educational Building Corp. Higher Education Facility | ||||
| Revenue, | ||||
| Brown University Rhode Island, Refunding, Series A, 5.00%, 9/01/39 | $ | 9,000,000 | $ | 9,750,240 |
| New England Institute of Technology, Series A, 5.125%, 3/01/40 | 16,435,000 | 16,944,978 | ||
| Rhode Island State Health and Educational Building Corp. Revenue, | ||||
| Higher Education Facility, Board of Governors for Higher Education, University of | ||||
| Rhode Island, Refunding, Series G, AMBAC Insured, 5.00%, 9/15/30 | 10,000,000 | 10,210,700 | ||
| Hospital Financing, Lifespan Obligated Group, 6.375%, 8/15/21 | 500,000 | 513,095 | ||
| Hospital Financing, Lifespan Obligated Group, Pre-Refunded, 6.375%, 8/15/21 | 6,075,000 | 6,328,753 | ||
| Hospital Financing, Lifespan Obligated Group, Refunding, Series A, AGMC Insured, | ||||
| 5.00%, 5/15/26 | 5,000,000 | 5,105,500 | ||
| Hospital Financing, Lifespan Obligated Group, Refunding, Series A, AGMC Insured, | ||||
| 5.00%, 5/15/32 | 14,440,000 | 14,503,680 | ||
| Hospital Financing, Lifespan Obligated Group, Series A, 7.00%, 5/15/39 | 8,200,000 | 9,099,376 | ||
| 128,668,975 | ||||
| South Carolina 2.0% | ||||
| Anderson County School District No. 5 GO, 5.00%, 2/01/36 | 11,415,000 | 12,209,256 | ||
| Charleston Educational Excellence Finance Corp. Revenue, Charleston County School | ||||
| District, 5.25%, 12/01/30 | 8,000,000 | 8,326,720 | ||
| Dorchester County Waterworks and Sewer System Revenue, Refunding and Improvement, | ||||
| NATL Insured, 5.00%, 10/01/28 | 8,000,000 | 8,082,400 | ||
| Greenville County School District Installment Purchase Revenue, Building Equity Sooner for | ||||
| Tomorrow, Refunding, 5.00%, 12/01/28 | 7,500,000 | 7,933,125 | ||
| Greenwood Fifty School Facilities Inc. Installment Purchase Revenue, Greenwood School | ||||
| District 50, Refunding, Assured Guaranty, 4.50%, 12/01/32 | 7,030,000 | 7,033,445 | ||
| Lancaster Educational Assistance Program Inc. Revenue, School District of Lancaster County | ||||
| Project, 5.00%, 12/01/26 | 12,300,000 | 12,523,983 | ||
| Medical University of South Carolina Hospital Authority Hospital Facilities Revenue, | ||||
| Mortgage, Refunding, Series A, NATL Insured, 5.00%, 8/15/31 | 12,720,000 | 12,787,925 | ||
| Newberry Investing in Children’s Education Installment Revenue, Newberry County School | ||||
| District Project, 5.00%, 12/01/30 | 4,000,000 | 4,057,240 | ||
| Piedmont Municipal Power Agency Electric Revenue, Series A-2, 5.00%, 1/01/24 | 10,000,000 | 10,721,300 | ||
| Scago Educational Facilities Corp. for Beaufort School District Revenue, Beaufort School | ||||
| District, AGMC Insured, 5.00%, 12/01/31 | 5,340,000 | 5,643,312 | ||
| Scago Educational Facilities Corp. for Chesterfield School District Revenue, School Project, | ||||
| Assured Guaranty, 5.00%, 12/01/29 | 7,500,000 | 7,806,375 | ||
| Scago Educational Facilities Corp. for Colleton School District Revenue, School Project, | ||||
| Assured Guaranty, 5.00%, | ||||
| 12/01/25 | 3,340,000 | 3,474,869 | ||
| 12/01/26 | 4,000,000 | 4,143,000 | ||
| Scago Educational Facilities Corp. for Pickens School District Revenue, Pickens County | ||||
| Project, AGMC Insured, 5.00%, | ||||
| 12/01/25 | 18,900,000 | 20,009,430 | ||
| 12/01/31 | 10,000,000 | 10,339,000 | ||
| South Carolina Jobs EDA Hospital Facilities Revenue, Palmetto Health, Refunding, Series A, | ||||
| AGMC Insured, 5.00%, 8/01/35 | 20,000,000 | 19,617,000 |
40 | Semiannual Report
Franklin Federal Tax-Free Income Fund
Statement of Investments, October 31, 2011 (unaudited) (continued)
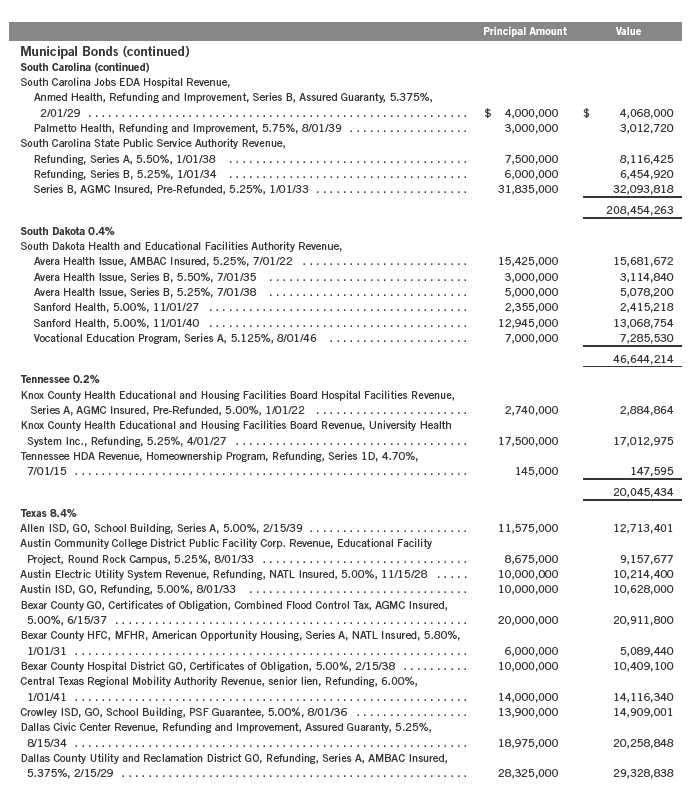
Semiannual Report | 41
Franklin Federal Tax-Free Income Fund
Statement of Investments, October 31, 2011 (unaudited) (continued)
42 | Semiannual Report
Franklin Federal Tax-Free Income Fund
Statement of Investments, October 31, 2011 (unaudited) (continued)
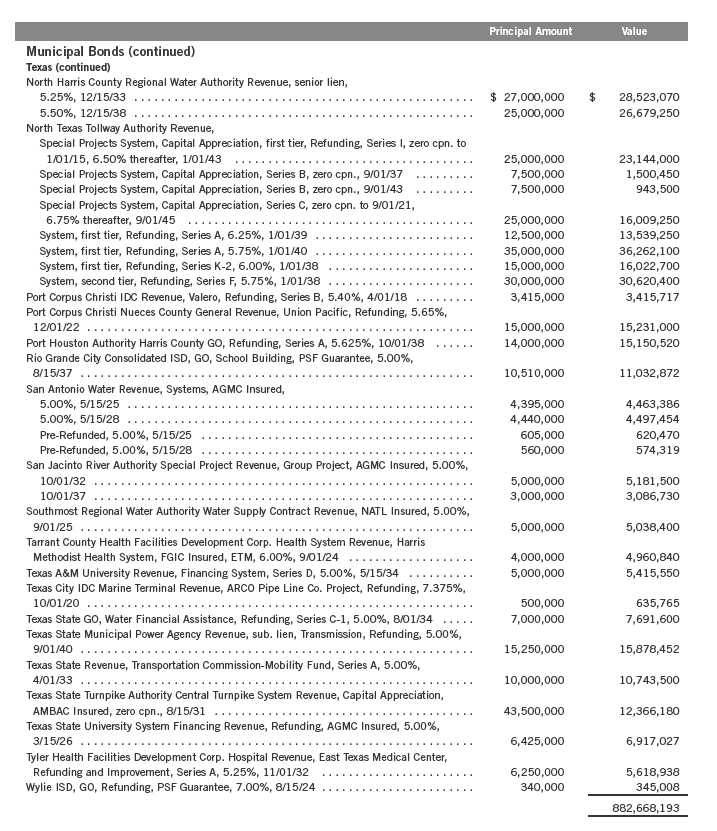
Semiannual Report | 43
Franklin Federal Tax-Free Income Fund
Statement of Investments, October 31, 2011 (unaudited) (continued)
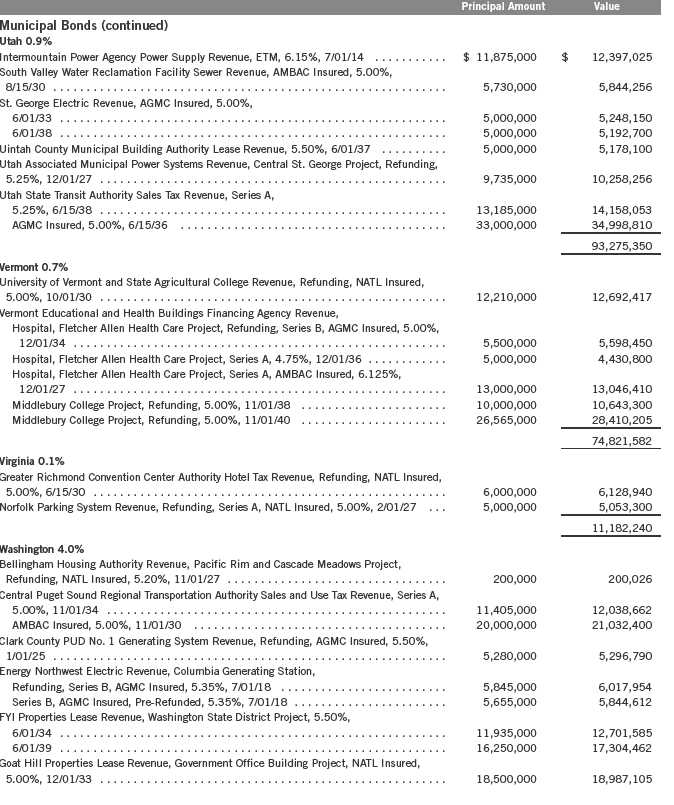
44 | Semiannual Report
Franklin Federal Tax-Free Income Fund
Statement of Investments, October 31, 2011 (unaudited) (continued)
| Principal Amount | Value | |||
| Municipal Bonds (continued) | ||||
| Washington (continued) | ||||
| Grant County PUD No. 2 Wanapum Hydro Electric Revenue, Refunding, Series D, | ||||
| AGMC Insured, 5.20%, 1/01/23 | $ | 6,000,000 | $ | 6,022,920 |
| King County GO, Limited Tax, Sewer, 5.125%, 1/01/33 | 10,000,000 | 10,961,300 | ||
| King County Public Hospital District No. 1 GO, Series B, 5.25%, 12/01/37 | 5,000,000 | 5,251,950 | ||
| King County Sewer Revenue, Refunding, 5.00%, 1/01/32 | 7,085,000 | 7,620,413 | ||
| NJB Properties Lease Revenue, King County Washington Project, Series A, 5.00%, | ||||
| 12/01/36 | 10,000,000 | 10,343,600 | ||
| Pierce County School District No. 403 Bethel GO, NATL RE, FGIC Insured, Pre-Refunded, | ||||
| 5.25%, 12/01/22 | 5,000,000 | 5,265,000 | ||
| Port of Seattle Revenue, Refunding, Series A, | ||||
| NATL Insured, 5.00%, 7/01/33 | 10,000,000 | 10,104,100 | ||
| NATL RE, FGIC Insured, 5.00%, 4/01/31 | 21,680,000 | 21,692,574 | ||
| Snohomish County Housing Authority Revenue, Pooled, 6.30%, 4/01/16 | 110,000 | 110,977 | ||
| Snohomish County USD No. 6 GO, 6.50%, 12/01/11 | 2,550,000 | 2,562,572 | ||
| Twenty-Fifth Avenue Properties Washington Student Housing Revenue, NATL Insured, | ||||
| 5.125%, 6/01/22 | 2,925,000 | 2,944,188 | ||
| 5.25%, 6/01/33 | 9,770,000 | 9,789,931 | ||
| Washington State GO, | ||||
| 5.00%, 6/01/33 | 5,000,000 | 5,402,700 | ||
| Motor Vehicle Fuel Tax, Series B, NATL RE, FGIC Insured, 5.00%, 7/01/27 | 10,000,000 | 10,427,300 | ||
| Series A, NATL RE, FGIC Insured, 5.00%, 7/01/27 | 10,000,000 | 10,427,300 | ||
| Various Purpose, Series A, 5.00%, 7/01/33 | 44,300,000 | 48,078,790 | ||
| Washington State Health Care Facilities Authority Revenue, | ||||
| Central Washington Health Services, 6.75%, 7/01/29 | 5,000,000 | 5,217,750 | ||
| Fred Hutchinson Cancer Center, Refunding, Series A, 6.00%, 1/01/33 | 7,500,000 | 7,864,875 | ||
| MultiCare Health System, Series B, AGMC Insured, 5.00%, 8/15/34 | 17,550,000 | 17,861,688 | ||
| MultiCare Health System, Series B, AGMC Insured, 5.00%, 8/15/41 | 9,170,000 | 9,248,037 | ||
| MultiCare Health System, Series B, Assured Guaranty, 6.00%, 8/15/39 | 1,500,000 | 1,612,605 | ||
| Providence Health and Services, Refunding, Series A, NATL RE, FGIC Insured, 5.00%, | ||||
| 10/01/36 | 9,750,000 | 9,838,237 | ||
| Providence Health and Services, Refunding, Series C, AGMC Insured, 5.25%, | ||||
| 10/01/33 | 10,000,000 | 10,480,800 | ||
| Providence Health and Services, Series A, FGIC Insured, Pre-Refunded, 5.00%, | ||||
| 10/01/36 | 250,000 | 291,663 | ||
| Series C, Radian Insured, 5.50%, 8/15/36 | 16,000,000 | 15,130,720 | ||
| Virginia Mason Medical, Series B, ACA Insured, 6.00%, 8/15/37 | 30,000,000 | 30,098,400 | ||
| Washington State Higher Education Facilities Authority Revenue, Whitworth University | ||||
| Project, Refunding, | ||||
| 5.375%, 10/01/29 | 3,000,000 | 2,994,720 | ||
| 5.875%, 10/01/34 | 6,000,000 | 6,130,860 | ||
| Washington State Public Power Supply System Revenue, | ||||
| Nuclear Project No. 2, Refunding, Series A, 6.30%, 7/01/12 | 7,700,000 | 8,003,303 | ||
| Nuclear Project No. 3, Capital Appreciation, Refunding, Series B, zero cpn., 7/01/14 | 12,450,000 | 12,021,595 | ||
| Nuclear Project No. 3, Capital Appreciation, Series B, ETM, zero cpn., 7/01/14 | 2,550,000 | 2,488,469 | ||
| Nuclear Project No. 3, Refunding, Series B, zero cpn., 7/01/12 | 6,400,000 | 6,357,120 | ||
| Nuclear Project No. 3, Refunding, Series B, zero cpn., 7/01/13 | 11,000,000 | 10,792,430 | ||
| 422,862,483 |
Semiannual Report | 45
Franklin Federal Tax-Free Income Fund
Statement of Investments, October 31, 2011 (unaudited) (continued)
| Principal Amount | Value | |||
| Municipal Bonds (continued) | ||||
| West Virginia 0.6% | ||||
| County Commission of Harrison County Solid Waste Disposal Revenue, Allegheny Energy | ||||
| Supply Co. LLC, Refunding, Series D, 5.50%, 10/15/37 | $ | 9,000,000 | $ | 8,639,730 |
| Pleasants County PCR, County Commission, Series F, 5.25%, 10/15/37 | 14,000,000 | 13,960,240 | ||
| West Virginia EDA Lottery Revenue, Series A, 5.00%, 6/15/35 | 9,415,000 | 9,843,571 | ||
| West Virginia State GO, Series A, NATL RE, FGIC Insured, 5.20%, 11/01/26 | 10,000,000 | 11,343,900 | ||
| West Virginia State Water Development Water Revenue, Loan Program 2, Refunding, | ||||
| Series B, AMBAC Insured, 5.00%, 11/01/29 | 7,500,000 | 7,743,750 | ||
| West Virginia University Revenues, Improvement, West Virginia University Projects, Series C, | ||||
| NATL RE, FGIC Insured, 5.00%, 10/01/34 | 10,000,000 | 10,305,200 | ||
| 61,836,391 | ||||
| Wisconsin 0.8% | ||||
| Janesville IDR, Simmons Manufacturing Co., 7.00%, 10/15/17 | 2,200,000 | 2,208,690 | ||
| Monroe RDAR, 6.00%, 2/15/39 | 11,790,000 | 12,117,408 | ||
| Wisconsin State General Fund Annual Appropriation Revenue, Series A, 6.00%, 5/01/33 | 25,290,000 | 28,502,589 | ||
| Wisconsin State Health and Educational Facilities Authority Revenue, | ||||
| Marquette University, 5.00%, 10/01/30 | 2,150,000 | 2,253,823 | ||
| Marquette University, Refunding, 5.00%, 10/01/30 | 6,865,000 | 7,196,511 | ||
| Marquette University, Refunding, 5.00%, 10/01/33 | 1,500,000 | 1,551,585 | ||
| Marquette University, Refunding, Series B2, 5.00%, 10/01/30 | 3,470,000 | 3,637,566 | ||
| Marquette University, Series B3, 5.00%, 10/01/33 | 1,750,000 | 1,810,183 | ||
| Ministry Health, AGMC Insured, 5.00%, 8/01/31 | 1,500,000 | 1,529,040 | ||
| Ministry Health, AGMC Insured, 5.00%, 8/01/34 | 8,000,000 | 8,083,600 | ||
| Thedacare Inc., AMBAC Insured, 5.00%, 12/15/30 | 10,000,000 | 9,794,500 | ||
| Thedacare Inc., Series A, 5.50%, 12/15/38 | 5,000,000 | 5,121,250 | ||
| 83,806,745 | ||||
| Wyoming 0.1% | ||||
| Campbell County Solid Waste Facilities Revenue, Basin Electric Power Cooperative, Series A, | ||||
| 5.75%, 7/15/39 | 5,500,000 | 5,931,695 | ||
| U.S. Territories 2.9% | ||||
| Puerto Rico 2.8% | ||||
| Children’s Trust Fund Puerto Rico Tobacco Settlement Revenue, Asset-Backed Bonds, | ||||
| Refunding, 5.375%, 5/15/33 | 18,570,000 | 17,454,129 | ||
| Puerto Rico Commonwealth Highway and Transportation Authority Highway Revenue, | ||||
| Series Y, Pre-Refunded, | ||||
| 5.00%, 7/01/36 | 62,000,000 | 72,586,500 | ||
| 5.50%, 7/01/36 | 7,000,000 | 8,353,380 | ||
| Puerto Rico Commonwealth Highway and Transportation Authority Transportation Revenue, | ||||
| Refunding, Series K, 5.00%, 7/01/30 | 19,190,000 | 19,027,844 | ||
| Puerto Rico Electric Power Authority Power Revenue, Series XX, 5.25%, 7/01/40 | 15,000,000 | 15,133,950 | ||
| Puerto Rico Industrial Tourist Educational Medical and Environmental Control Facilities | ||||
| Financing Authority Industrial Revenue, Guaynabo Warehouse, Series A, 5.15%, | ||||
| 7/01/19 | 720,000 | 735,926 | ||
| Puerto Rico PBA Guaranteed Revenue, Government Facilities, | ||||
| Refunding, Series D, 5.25%, 7/01/27 | 3,265,000 | 3,272,967 | ||
| Refunding, Series N, 5.00%, 7/01/37 | 20,000,000 | 19,027,800 | ||
| Series D, Pre-Refunded, 5.25%, 7/01/27 | 8,735,000 | 9,010,240 |
46 | Semiannual Report
Franklin Federal Tax-Free Income Fund
Statement of Investments, October 31, 2011 (unaudited) (continued)
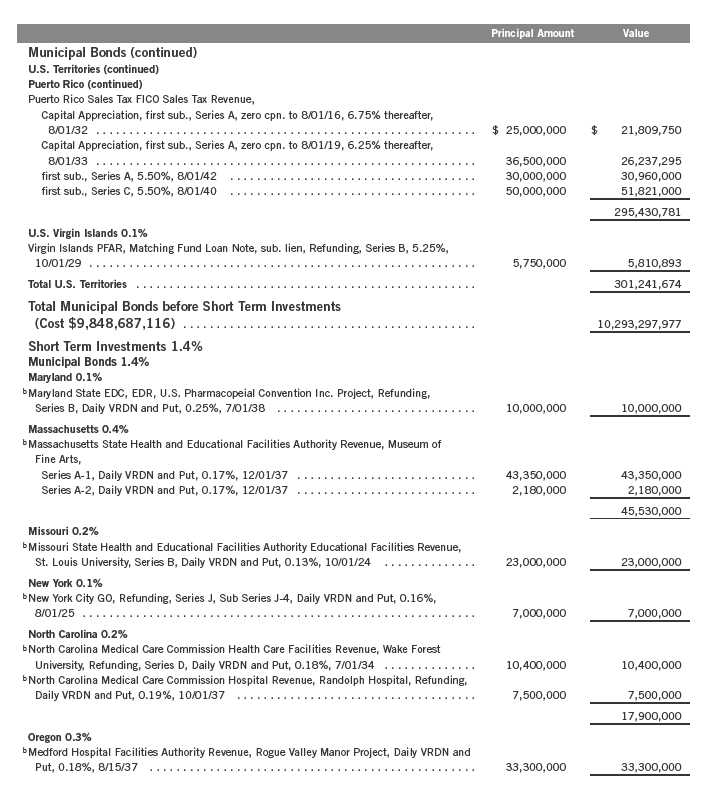
Semiannual Report | 47
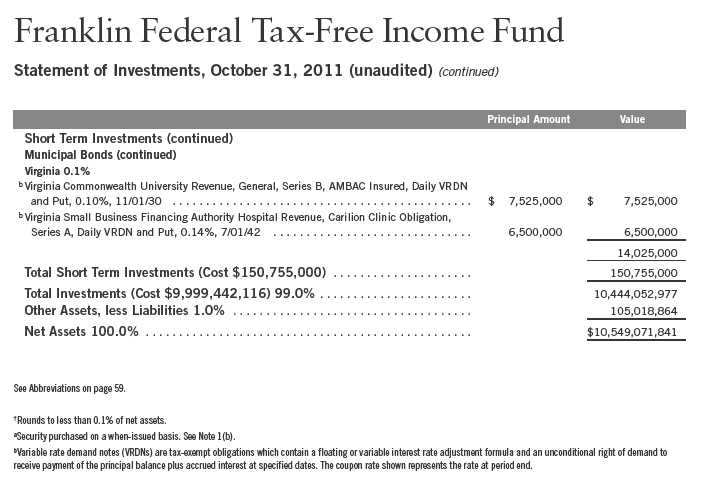
48 | The accompanying notes are an integral part of these financial statements. | Semiannual Report
Franklin Federal Tax-Free Income Fund
Financial Statements
Statement of Assets and Liabilities
October 31, 2011 (unaudited)
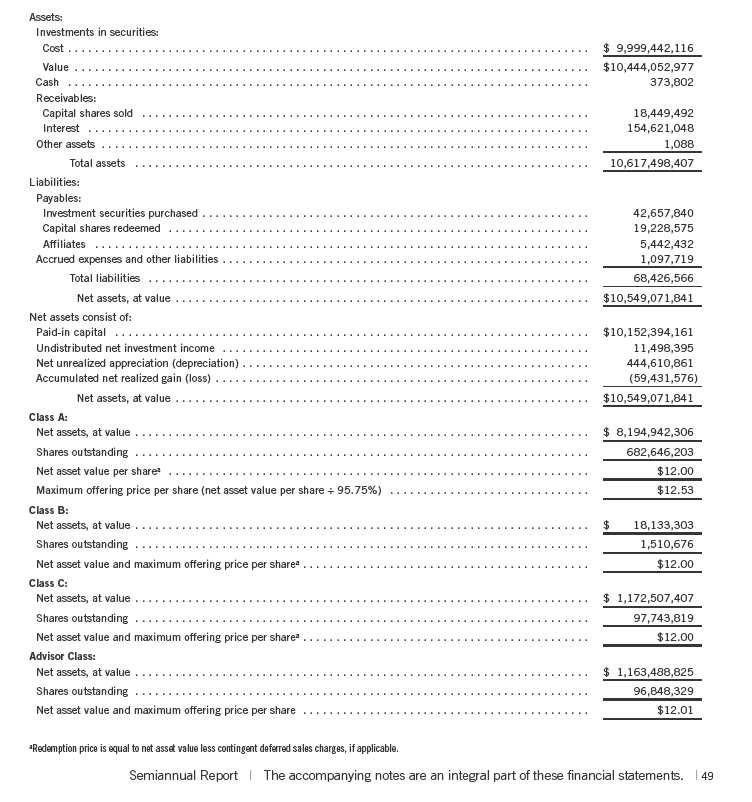
Franklin Federal Tax-Free Income Fund
Financial Statements (continued)
Statement of Operations
for the six months ended October 31, 2011 (unaudited)
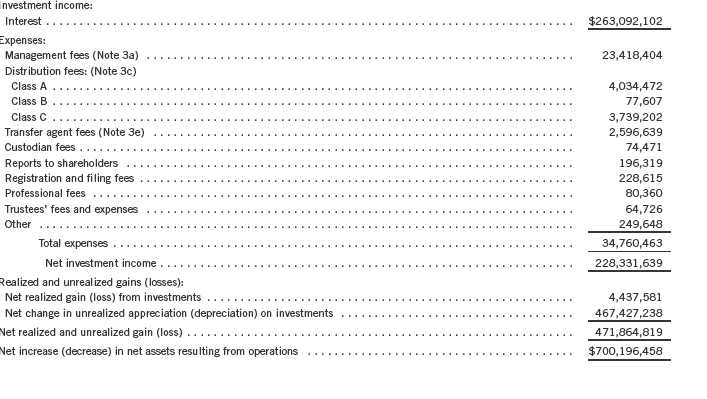
50 | The accompanying notes are an integral part of these financial statements. | Semiannual Report
Franklin Federal Tax-Free Income Fund
Financial Statements (continued)
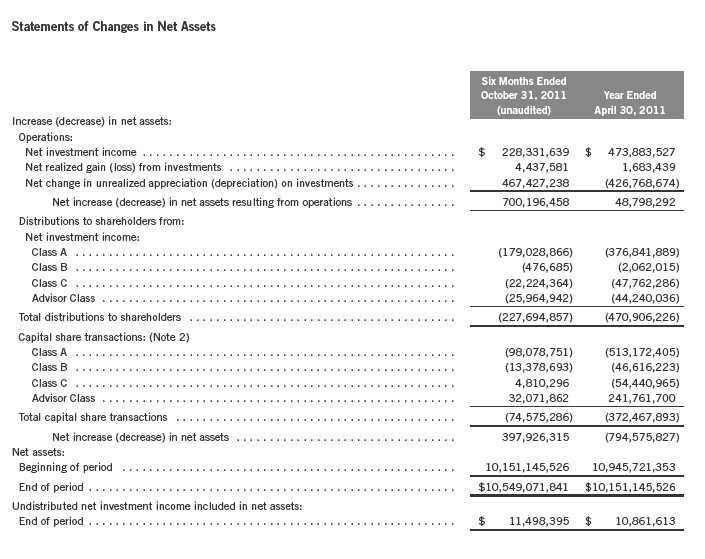
Semiannual Report | The accompanying notes are an integral part of these financial statements. | 51
Franklin Federal Tax-Free Income Fund
Notes to Financial Statements (unaudited)
1. ORGANIZATION AND SIGNIFICANT ACCOUNT POLICIES
Franklin Federal Tax-Free Income Fund (Fund) is registered under the Investment Company Act of 1940, as amended, (1940 Act) as an open-end investment company. The Fund offers four classes of shares: Class A, Class B, Class C, and Advisor Class. Each class of shares differs by its initial sales load, contingent deferred sales charges, distribution fees, voting rights on matters affecting a single class and its exchange privilege.
The following summarizes the Fund’s significant accounting policies.
a. Financial Instrument Valuation
The Fund’s investments in securities and other financial instruments are carried at fair value daily. Fair value is the price that would be received to sell an asset or paid to transfer a liability in an orderly transaction between market participants on the measurement date. Under procedures approved by the Fund’s Board of Trustees, the Fund may utilize independent pricing services, quotations from securities and financial instrument dealers, and other market sources to determine fair value.
Debt securities generally trade in the over-the-counter market rather than on a securities exchange. The Fund’s pricing services use multiple valuation techniques to determine fair value. In instances where sufficient market activity exists, the pricing services may utilize a market-based approach through which quotes from market makers are used to determine fair value. In instances where sufficient market activity may not exist or is limited, the pricing services also utilize proprietary valuation models which may consider market characteristics such as benchmark yield curves, option-adjusted spreads, credit spreads, estimated default rates, coupon rates, anticipated timing of principal repayments, underlying collateral, and other unique security features in order to estimate the relevant cash flows, which are then discounted to calculate the fair value.
The Fund has procedures to determine the fair value of securities and other financial instruments for which market prices are not readily available or which may not be reliably priced. Under these procedures, the Fund primarily employs a market-based approach which may use related or comparable assets or liabilities, recent transactions, market multiples, book values, and other relevant information for the investment to determine the fair value of the investment. The Fund may also use an income-based valuation approach in which the anticipated future cash flows of the investment are discounted to calculate fair value. Discounts may also be applied due to the nature or duration of any restrictions on the disposition of the investments. Due to the inherent uncertainty of valuations of such investments, the fair values may differ significantly from the values that would have been used had an active market existed.
b. Securities Purchased on a When-Issued Basis
The Fund purchases securities on a when-issued basis, with payment and delivery scheduled for a future date. These transactions are subject to market fluctuations and are subject to the risk that the value at delivery may be more or less than the trade date purchase price. Although the Fund
52 | Semiannual Report
Franklin Federal Tax-Free Income Fund
Notes to Financial Statements (unaudited) (continued)
| 1. | ORGANIZATION AND SIGNIFICANT ACCOUNT POLICIES (continued) |
| b. | Securities Purchased on a When-Issued Basis (continued) |
will generally purchase these securities with the intention of holding the securities, it may sell the securities before the settlement date. Sufficient assets have been segregated for these securities.
c. Income Taxes
It is the Fund’s policy to qualify as a regulated investment company under the Internal Revenue Code. The Fund intends to distribute to shareholders substantially all of its income and net realized gains to relieve it from federal income and excise taxes. As a result, no provision for U.S. federal income taxes is required. The Fund files U.S. income tax returns as well as tax returns in certain other jurisdictions. The Fund records a provision for taxes in its financial statements including penalties and interest, if any, for a tax position taken on a tax return (or expected to be taken) when it fails to meet the more likely than not (a greater than 50% probability) threshold and based on the technical merits, the tax position may not be sustained upon examination by the tax authorities. As of October 31, 2011, and for all open tax years, the Fund has determined that no provision for income tax is required in the Fund’s financial statements. Open tax years are those that remain subject to examination and are based on each tax jurisdiction statute of limitation.
d. Security Transactions, Investment Income, Expenses and Distributions
Security transactions are accounted for on trade date. Realized gains and losses on security transactions are determined on a specific identification basis. Interest income and estimated expenses are accrued daily. Amortization of premium and accretion of discount on debt securities are included in interest income. Distributions to shareholders are recorded on the ex-dividend date and are determined according to income tax regulations (tax basis). Distributable earnings determined on a tax basis may differ from earnings recorded in accordance with accounting principles generally accepted in the United States of America. These differences may be permanent or temporary. Permanent differences are reclassified among capital accounts to reflect their tax character. These reclassifications have no impact on net assets or the results of operations. Temporary differences are not reclassified, as they may reverse in subsequent periods.
Realized and unrealized gains and losses and net investment income, not including class specific expenses, are allocated daily to each class of shares based upon the relative proportion of net assets of each class. Differences in per share distributions, by class, are generally due to differences in class specific expenses.
e. Insurance
The scheduled payments of interest and principal for each insured municipal security in the Fund are insured by either a new issue insurance policy or a secondary insurance policy. Some municipal securities in the Fund are secured by collateral guaranteed by an agency of the U.S. government. Depending on the type of coverage, premiums for insurance are either added to the cost basis of the security or paid by a third party.
Semiannual Report | 53
Franklin Federal Tax-Free Income Fund
Notes to Financial Statements (unaudited) (continued)
1. ORGANIZATION AND SIGNIFICANT ACCOUNT POLICIES (continued) e. Insurance (continued)
Insurance companies typically insure municipal bonds that tend to be of very high quality, with the majority of underlying municipal bonds rated A or better. However, an event involving an insurer could have an adverse effect on the value of the securities insured by that insurance company. There is no guarantee the insurer will be able to fulfill its obligations under the terms of the policy.
f. Accounting Estimates
The preparation of financial statements in accordance with accounting principles generally accepted in the United States of America requires management to make estimates and assumptions that affect the reported amounts of assets and liabilities at the date of the financial statements and the amounts of income and expenses during the reporting period. Actual results could differ from those estimates.
g. Guarantees and Indemnifications
Under the Fund’s organizational documents, its officers and trustees are indemnified by the Fund against certain liabilities arising out of the performance of their duties to the Fund. Additionally, in the normal course of business, the Fund enters into contracts with service providers that contain general indemnification clauses. The Fund’s maximum exposure under these arrangements is unknown as this would involve future claims that may be made against the Fund that have not yet occurred. Currently, the Fund expects the risk of loss to be remote.
2. SHARES OF BENEFICIAL INTEREST
At October 31, 2011, there were an unlimited number of shares authorized (without par value).
Transactions in the Fund’s shares were as follows:
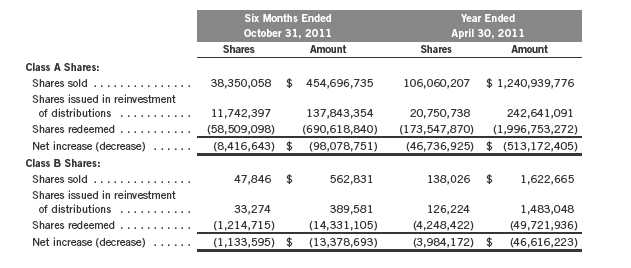
54 | Semiannual Report
Franklin Federal Tax-Free Income Fund
Notes to Financial Statements (unaudited) (continued)
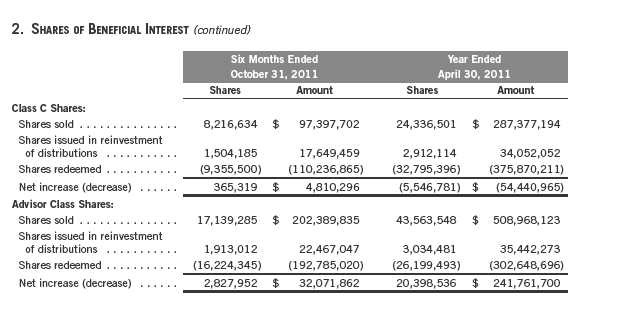
3. TRANSACTIONS WITH AFFILIATES
Franklin Resources, Inc. is the holding company for various subsidiaries that together are referred to as Franklin Templeton Investments. Certain officers and trustees of the Fund are also officers and/or directors of the following subsidiaries:
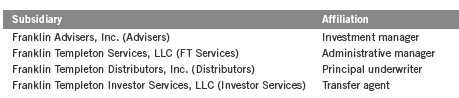
a. Management Fees
The Fund pays an investment management fee to Advisers based on the month-end net assets of the Fund as follows:
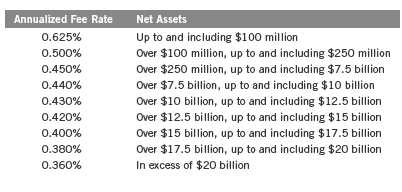
Semiannual Report | 55
Franklin Federal Tax-Free Income Fund
Notes to Financial Statements (unaudited) (continued)
| 3. | TRANSACTIONS WITH AFFILIATES (continued) |
| b. | Administrative Fees |
Under an agreement with Advisers, FT Services provides administrative services to the Fund. The fee is paid by Advisers based on average daily net assets, and is not an additional expense of the Fund.
c. Distribution Fees
The Fund’s Board of Trustees has adopted distribution plans for each share class, with the exception of Advisor Class shares, pursuant to Rule 12b-1 under the 1940 Act. Under the Fund’s Class A reimbursement distribution plan, the Fund reimburses Distributors for costs incurred in connection with the servicing, sale and distribution of the Fund’s shares up to the maximum annual plan rate. Under the Class A reimbursement distribution plan, costs exceeding the maximum for the current plan year cannot be reimbursed in subsequent periods.
In addition, under the Fund’s Class B and C compensation distribution plans, the Fund pays Distributors for costs incurred in connection with the servicing, sale and distribution of the Fund’s shares up to the maximum annual plan rate for each class.
The maximum annual plan rates, based on the average daily net assets, for each class, are as follows:

d. Sales Charges/Underwriting Agreements
Front-end sales charges and contingent deferred sales charges (CDSC) do not represent expenses of the Fund. These charges are deducted from the proceeds of sales of Fund shares prior to investment or from redemption proceeds prior to remittance, as applicable. Distributors has advised the Fund of the following commission transactions related to the sales and redemptions of the Fund’s shares for the period:
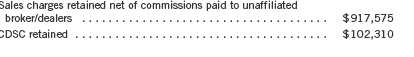
e. Transfer Agent Fees
For the period ended October 31, 2011, the Fund paid transfer agent fees of $2,596,639, of which $1,150,843 was retained by Investor Services.
56 | Semiannual Report
Franklin Federal Tax-Free Income Fund
Notes to Financial Statements (unaudited) (continued)
4. INCOME TAXES
For tax purposes, capital losses may be carried over to offset future capital gains, if any. At April 30, 2011, the capital loss carryforwards were as follows:
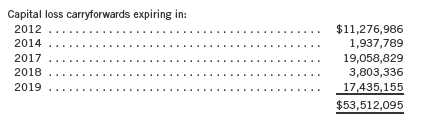
Under the Regulated Investment Company Modernization Act of 2010, the Fund will be permitted to carry forward capital losses incurred in taxable years beginning after December 22, 2010 for an unlimited period. Post-enactment capital loss carryforwards will retain their character as either short-term or long-term capital losses rather than being considered short-term as under previous law. Any post-enactment capital losses generated will be required to be utilized prior to the losses incurred in pre-enactment tax years.
For tax purposes, realized capital losses occurring subsequent to October 31 may be deferred and treated as occurring on the first day of the following fiscal year. At April 30, 2011, the Fund deferred realized capital losses of $8,896,004.
At October 31, 2011, the cost of investments and net unrealized appreciation (depreciation) for income tax purposes were as follows:
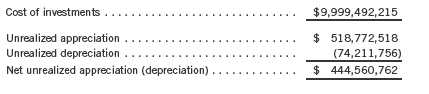
Differences between income and/or capital gains as determined on a book basis and a tax basis are primarily due to differing treatments of bond discounts, non-deductible expenses, regulatory settlements and wash sales.
5. INVESTMENT TRANSACTIONS
Purchases and sales of investments (excluding short term securities) for the period ended October 31, 2011, aggregated $273,538,240 and $448,161,191, respectively.
6. CREDIT FACILITY
The Fund, together with other U.S. registered and foreign investment funds (collectively, Borrowers), managed by Franklin Templeton Investments, are borrowers in a joint syndicated senior unsecured credit facility totaling $750 million (Global Credit Facility) which matures on
Semiannual Report | 57
Franklin Federal Tax-Free Income Fund
Notes to Financial Statements (unaudited) (continued)
6. CREDIT FACILITY (continued)
January 20, 2012. This Global Credit Facility provides a source of funds to the Borrowers for temporary and emergency purposes, including the ability to meet future unanticipated or unusually large redemption requests.
Under the terms of the Global Credit Facility, the Fund shall, in addition to interest charged on any borrowings made by the Fund and other costs incurred by the Fund, pay its share of fees and expenses incurred in connection with the implementation and maintenance of the Global Credit Facility, based upon its relative share of the aggregate net assets of all of the Borrowers, including an annual commitment fee of 0.08% based upon the unused portion of the Global Credit Facility, which is reflected in other expenses on the Statement of Operations. During the period ended October 31, 2011, the Fund did not use the Global Credit Facility.
7. FAIR VALUE MEASUREMENTS
The Fund follows a fair value hierarchy that distinguishes between market data obtained from independent sources (observable inputs) and the Fund’s own market assumptions (unobservable inputs). These inputs are used in determining the value of the Fund’s investments and are summarized in the following fair value hierarchy:
- Level 1 – quoted prices in active markets for identical securities
- Level 2 – other significant observable inputs (including quoted prices for similar securities, interest rates, prepayment speed, credit risk, etc.)
- Level 3 – significant unobservable inputs (including the Fund’s own assumptions in determining the fair value of investments)
The inputs or methodology used for valuing securities are not an indication of the risk associated with investing in those securities.
For movements between the levels within the fair value hierarchy, the Fund has adopted a policy of recognizing the transfers as of the date of the underlying event which caused the movement.
At October 31, 2011, all of the Fund’s investments in securities carried at fair value were valued using Level 2 inputs.
8. NEW ACCOUNTING PRONOUNCEMENTS
In May 2011, the Financial Accounting Standards Board (FASB) issued Accounting Standards Update (ASU) No. 2011-04, Fair Value Measurement (Topic 820): Amendments to Achieve Common Fair Value Measurement and Disclosure Requirements in U.S. GAAP and IFRSs. The amendments in the ASU will improve the comparability of fair value measurements presented and disclosed in financial statements prepared in accordance with U.S. GAAP (Generally Accepted
58 | Semiannual Report
Franklin Federal Tax-Free Income Fund
Notes to Financial Statements (unaudited) (continued)
8. NEW ACCOUNTING PRONOUNCEMENTS (continued)
Accounting Principles) and IFRS (International Financial Reporting Standards) and include new guidance for certain fair value measurement principles and disclosure requirements. The ASU is effective for interim and annual periods beginning after December 15, 2011. The Fund is currently reviewing the requirements and believes the adoption of this ASU will not have a material impact on the financial statements.
9. SUBSEQUENT EVENTS
The Fund has evaluated subsequent events through the issuance of the financial statements and determined that no events have occurred that require disclosure.
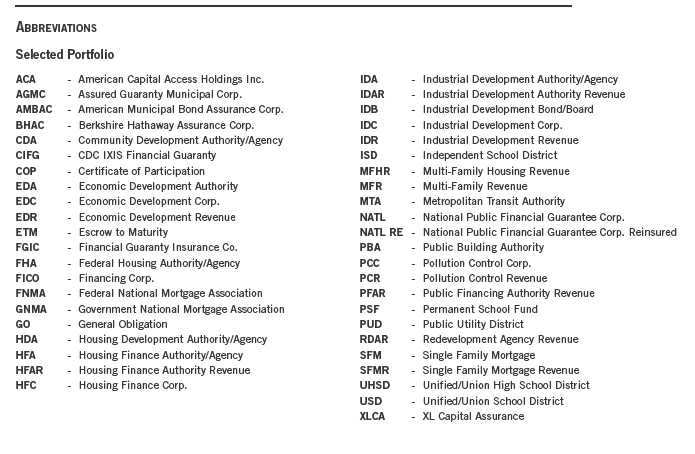
Semiannual Report | 59
Franklin Federal Tax-Free Income Fund
Shareholder Information
Proxy Voting Policies and Procedures
The Fund’s investment manager has established Proxy Voting Policies and Procedures (Policies) that the Fund uses to determine how to vote proxies relating to portfolio securities. Shareholders may view the Fund’s complete Policies online at franklintempleton.com. Alternatively, shareholders may request copies of the Policies free of charge by calling the Proxy Group collect at (954) 527-7678 or by sending a written request to: Franklin Templeton Companies, LLC, 300 S.E. 2nd Street, Fort Lauderdale, FL 33301, Attention: Proxy Group. Copies of the Fund’s proxy voting records are also made available online at franklintempleton.com and posted on the U.S. Securities and Exchange Commission’s website at sec.gov and reflect the most recent 12-month period ended June 30.
Quarterly Statement of Investments
The Fund files a complete statement of investments with the U.S. Securities and Exchange Commission for the first and third quarters for each fiscal year on Form N-Q. Shareholders may view the filed Form N-Q by visiting the Commission’s website at sec.gov. The filed form may also be viewed and copied at the Commission’s Public Reference Room in Washington, DC. Information regarding the operations of the Public Reference Room may be obtained by calling (800) SEC-0330.
60 | Semiannual Report
Item 2. Code of Ethics.
(a) The Registrant has adopted a code of ethics that applies to its principal executive officers and principal financial and accounting officer.
| (c) | N/A |
| (d) | N/A |
| (f) | Pursuant to Item 12(a)(1), the Registrant is attaching as an exhibit a copy of its code of ethics that applies to its principal executive officers and principal financial and accounting officer. |
Item 3. Audit Committee Financial Expert.
(a)(1) The Registrant has an audit committee financial expert serving on its audit committee.
(2) The audit committee financial expert is John B. Wilson and he is "independent" as defined under the relevant Securities and Exchange Commission Rules and Releases.
Item 4. Principal Accountant Fees and Services. N/A
Item 5. Audit Committee of Listed Registrants. N/A
Item 6. Schedule of Investments. N/A
Item 7. Disclosure of Proxy Voting Policies and Procedures for Closed-End Management Investment Companies. N/A
Item 8. Portfolio Managers of Closed-End Management Investment Companies. N/A
Item 9. Purchases of Equity Securities by Closed-End Management Investment Company and Affiliated Purchasers. N/A
Item 10. Submission of Matters to a Vote of Security Holders.
There have been no changes to the procedures by which shareholders may recommend nominees to the Registrant's Board of Trustees that would require disclosure herein.
Item 11. Controls and Procedures.
(a) Evaluation of Disclosure Controls and Procedures. The Registrant maintains disclosure controls and procedures that are designed to ensure that information required to be disclosed in the Registrant’s filings under the Securities Exchange Act of 1934 and the Investment Company Act of 1940 is recorded, processed, summarized and reported within the periods specified in the rules and forms of the Securities and Exchange Commission. Such information is accumulated and communicated to the Registrant’s management, including its principal executive officer and principal financial officer, as appropriate, to allow timely decisions regarding required disclosure. The Registrant’s management, including the principal executive officer and the principal financial officer, recognizes that any set of controls and procedures, no matter how well designed and operated, can provide only reasonable assurance of achieving the desired control objectives.
Within 90 days prior to the filing date of this Shareholder Report on Form N-CSR, the Registrant had carried out an evaluation, under the supervision and with the participation of the Registrant’s management, including the Registrant’s principal executive officer and the Registrant’s principal financial officer, of the effectiveness of the design and operation of the Registrant’s disclosure controls and procedures. Based on such evaluation, the Registrant’s principal executive officer and principal financial officer concluded that the Registrant’s disclosure controls and procedures are effective.
(b) Changes in Internal Controls. There have been no significant changes in the Registrant’s internal controls or in other factors that could significantly affect the internal controls subsequent to the date of their evaluation in connection with the preparation of this Shareholder Report on Form N-CSR.
Item 12. Exhibits.
| (a) | (1) Code of Ethics |
| (a) | (2) Certifications pursuant to Section 302 of the Sarbanes-Oxley Act of 2002 of Laura F. FergersonChief Executive Officer - Finance and Administration, and Gaston Gardey, Chief Financial Officer and Chief Accounting Officer |
(b) Certifications pursuant to Section 906 of the Sarbanes-Oxley Act of 2002 of Laura F. FergersonChief Executive Officer - Finance and Administration, and Gaston Gardey, Chief Financial Officer and Chief Accounting Officer
SIGNATURES
Pursuant to the requirements of the Securities Exchange Act of 1934 and the Investment Company Act of 1940, the registrant has duly caused this report to be signed on its behalf by the undersigned, thereunto duly authorized.
FRANKLIN FEDERAL TAX-FREE INCOME FUND
By /s/LAURA F. FERGERSON
Laura F. Fergerson
Chief Executive Officer –
Finance and Administration
Date December 28, 2011
Pursuant to the requirements of the Securities Exchange Act of 1934 and the Investment Company Act of 1940, this report has been signed below by the following persons on behalf of the registrant and in the capacities and on the dates indicated.
By /s/LAURA F. FERGERSON
Laura F. Fergerson
Chief Executive Officer –
Finance and Administration
Date December 28, 2011
By /s/GASTON GARDEY
Gaston Gardey
Chief Financial Officer and
Chief Accounting Officer
Date December 28, 2011