Exhibit 99.2

| Forward Looking Statement The numbers, as of and for the nine months ended September 30, 2007, contained within this presentation are unaudited as well as amounts related to the Company's stock trading volume. Certain statements contained herein may be considered "forward-looking statements" as defined in the Private Securities Litigation Reform Act of 1995. These statements are based upon the belief of the Company's management, as well as assumptions made beyond information currently available to the Company's management, and may be, but not necessarily are, identified by such words as "expect", "plan", "anticipate", "target", "forecast" and "goal". Because such "forward- looking statements" are subject to risks and uncertainties, actual results may differ materially from those expressed or implied by such forward-looking statements. Factors that could cause actual results to differ materially from the Company's expectations include competition from other financial institutions and financial holding companies; the effects of and changes in trade, monetary and fiscal policies and laws, including interest rate policies of the Federal Reserve Board; changes in the demand for loans; fluctuations in value of collateral and loan reserves; inflation, interest rate, market and monetary fluctuations; changes in consumer spending, borrowing and savings habits; and acquisitions and integration of acquired businesses, and similar variables. Other key risks are described in the Company's reports filed with the Securities and Exchange Commission, which may be obtained under "Investor Relations-Documents/Filings" on the Company's web site or by writing or calling the Company at 325.627.7155. The Company does not undertake any obligation to update publicly or revise any forward-looking statements herein because of new information, future events or otherwise. |

| Who We Are $2.9 billion financial holding company headquartered in Abilene, Texas Group of 10 separately chartered banks 117 year history Growth markets include 50 mile radius of the DFW metroplex |

| What Makes Us Different One Bank, Ten Charters Concept One Bank Consolidation of backroom operations (lower efficiency ratio) Agency agreements (customers may use any of our 45 locations) Ten Community Bank Charters Bank Presidents run their banks Local Boards Keep our banks locally focused Make sure we meet the needs of the community Help us make better loan decisions Help us market the bank Up to $1.0 million of FDIC insurance available |
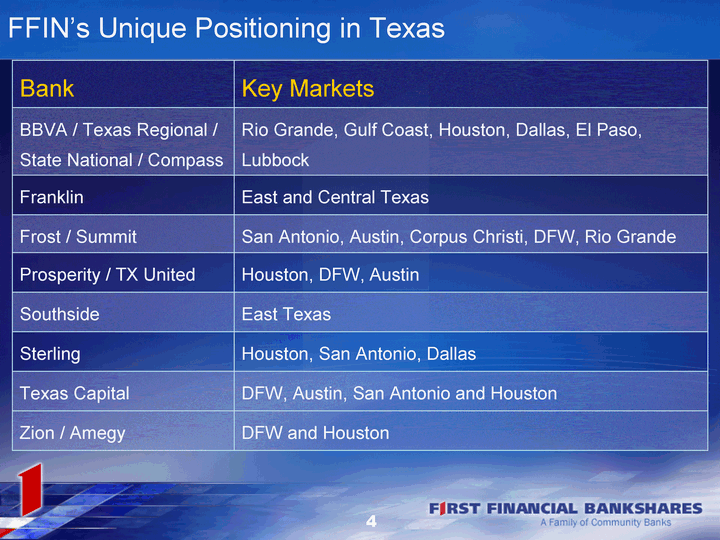
| FFIN's Unique Positioning in Texas Bank Key Markets BBVA / Texas Regional / State National / Compass Rio Grande, Gulf Coast, Houston, Dallas, El Paso, Lubbock Franklin East and Central Texas Frost / Summit San Antonio, Austin, Corpus Christi, DFW, Rio Grande Prosperity / TX United Houston, DFW, Austin Southside East Texas Sterling Houston, San Antonio, Dallas Texas Capital DFW, Austin, San Antonio and Houston Zion / Amegy DFW and Houston |

| (Under Construction) (Under Construction) 5 |

| Core Markets: West Central Texas Markets served benefiting from well-established, long- time customers BANK ASSET SIZE* LOCATIONS DEPOSIT MARKET SHARE** MARKET SHARE RANK** First Financial Bank (Abilene, Clyde, Moran, Albany) $911 M 13 41% 1 Hereford State Bank $111 M 1 45% 1 First Financial Bank (Eastland, Ranger, Rising Star) $133 M 3 46% 1 First National Bank, Sweetwater (Roby, Trent) $124 M 3 39% 1 San Angelo National Bank $319 M 2 21% 2 TOTALS $1,598M 22 * Data as of 09-30-07 ** Data as of 06-30-07 |
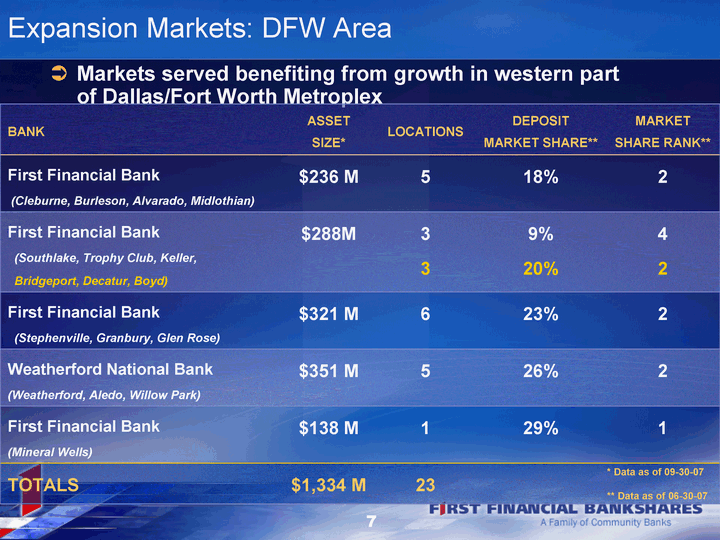
| Expansion Markets: DFW Area Markets served benefiting from growth in western part of Dallas/Fort Worth Metroplex BANK ASSET SIZE* LOCATIONS DEPOSIT MARKET SHARE** MARKET SHARE RANK** First Financial Bank (Cleburne, Burleson, Alvarado, Midlothian) $236 M 5 18% 2 First Financial Bank (Southlake, Trophy Club, Keller, Bridgeport, Decatur, Boyd) $288M 3 3 9% 20% 4 2 First Financial Bank (Stephenville, Granbury, Glen Rose) $321 M 6 23% 2 Weatherford National Bank (Weatherford, Aledo, Willow Park) $351 M 5 26% 2 First Financial Bank (Mineral Wells) $138 M 1 29% 1 TOTALS $1,334 M 23 * Data as of 09-30-07 ** Data as of 06-30-07 |

| Strategy in Growth Markets Target growing communities with good infrastructure and amenities on the outskirts of the DFW metroplex Bank of choice Aim for #1 market share Be the community leader Have board made up of movers and shakers Benefit from more rational competitive environment |

| Target Banks for Acquisitions Strategic: Asset size of $100 - $300 million Non-metropolitan areas Within 50 miles of DFW, I-35 corridor, east Texas and Texas Hill Country Utilize correspondent bank relationships Actively calling on banks that fit our profile |
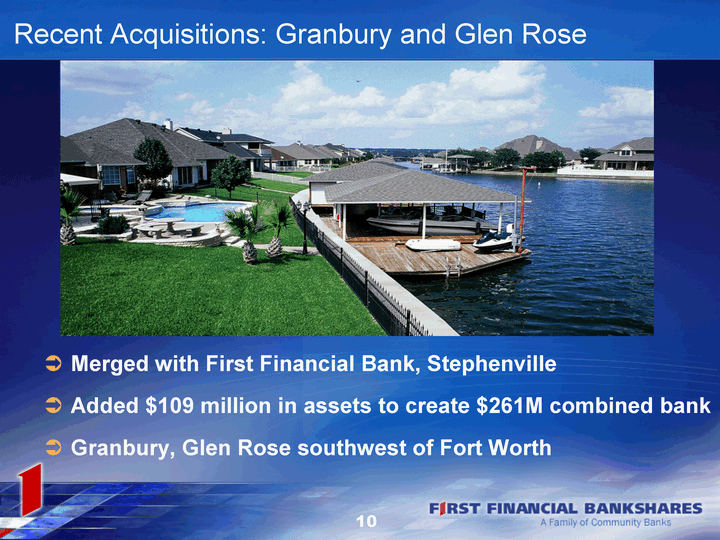
| Recent Acquisitions: Granbury and Glen Rose Merged with First Financial Bank, Stephenville Added $109 million in assets to create $261M combined bank Granbury, Glen Rose southwest of Fort Worth |
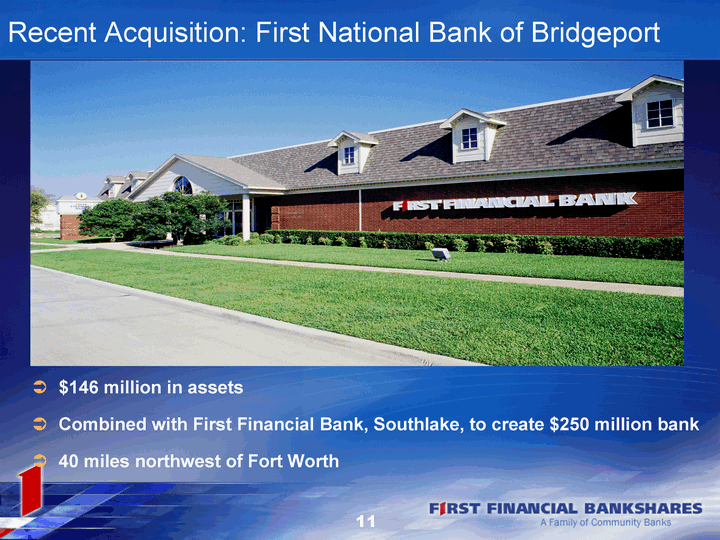
| Recent Acquisition: First National Bank of Bridgeport $146 million in assets Combined with First Financial Bank, Southlake, to create $250 million bank 40 miles northwest of Fort Worth |

| Texas: Large and Growing Five most populous states:* Growth (2000 - 2005) Five most populous states:* Growth (2000 - 2005) Five most populous states:* Growth (2000 - 2005) Five most populous states:* Growth (2000 - 2005) Five most populous states:* Growth (2000 - 2005) Five most populous states:* Growth (2000 - 2005) California 36.1 million 6.7% 6.7% Texas 22.9 million 9.6% 9.6% New York 19.3 million 1.5% Florida 17.8 million 11.3% Illinois 12.8 million 2.8% * U.S. Census Bureau |

| Target Markets - Population Growth Population growth (2000-2005) in FFIN expansion markets:* Population growth (2000-2005) in FFIN expansion markets:* Population growth (2000-2005) in FFIN expansion markets:* Population growth (2000-2005) in FFIN expansion markets:* Population growth (2000-2005) in FFIN expansion markets:* Texas 9.6% Bridgeport & Wise County 16.2% Fort Worth / Tarrant County 12.1% Cleburne, Midlothian & Johnson County 15.4% Weatherford, Willow Park, Aledo 16.2% Granbury & Hood County 16.6% Stephenville & Erath County 3.3% * U.S. Census Bureau |

| Abilene: Diversified, Growing Economy Home to 3 universities, 2 colleges and Dyess AFB Regional center for healthcare, retail, retirement living, culture and tourism Texas Tech School of Pharmacy opened fall 2007 Retail sales up 3.5%* Average home-sale price up 4.7%* * Abilene Economic Index Year-to-date, as of Oct. 2007 |

| Experienced Management Team Years with Company Years in Industry Kenneth T. Murphy Chairman of the Board 36 44 Scott Dueser President & Chief Executive Officer 31 36 J. Bruce Hildebrand, CPA Executive Vice President Chief Financial Officer 5 28 Gary L. Webb Executive Vice President Operations 5 21 Gary S. Gragg Executive Vice President Credit Administration 16 28 Kirk Thaxton, CTFA Executive Vice President Trust & Asset Management 21 24 Michele Stevens Senior Vice President Marketing 10 25 Senior Management at First Financial |

| Experienced Bank Presidents Years with Company Years with Company Years in Industry Ron Butler, FFB Abilene Ron Butler, FFB Abilene 14 24 24 Mike Mauldin, Hereford SB Mike Mauldin, Hereford SB 5 30 30 J.V. Martin, FNB Sweetwater J.V. Martin, FNB Sweetwater 18 37 37 Tommy Barrow, FFB Eastland Tommy Barrow, FFB Eastland 17 36 36 Mike Boyd, San Angelo NB Mike Boyd, San Angelo NB 12 31 31 Matt Reynolds, FFB Cleburne Matt Reynolds, FFB Cleburne 3 26 26 Ron Mullins, FFB Stephenville Ron Mullins, FFB Stephenville 1 29 29 Doyle Lee, Weatherford NB Doyle Lee, Weatherford NB 11 35 35 Mark Jones, FFB Southlake Mark Jones, FFB Southlake 6 28 28 Ken Williamson, FFB Mineral Wells Ken Williamson, FFB Mineral Wells 6 35 35 Member Bank Presidents |

| 2002 2003 2004 2005 2006 2007 1993 2093 2315 2734 2850 2894 Growth in Total Assets Asset Performance 45% Growth (in millions) (thru Sept. 30th) |

| 2002 2003 2004 2005 2006 2007 Non Interest Bearing 426 472 512 623 685 658 Interest Bearing 1286 1324 1482 1743 1699 1725 Deposit Growth Growth in FFIN Total Deposits (in millions) (thru Sept 30th) $1,712 $1,796 $1,994 $2,366 $2,384 $2,383 |
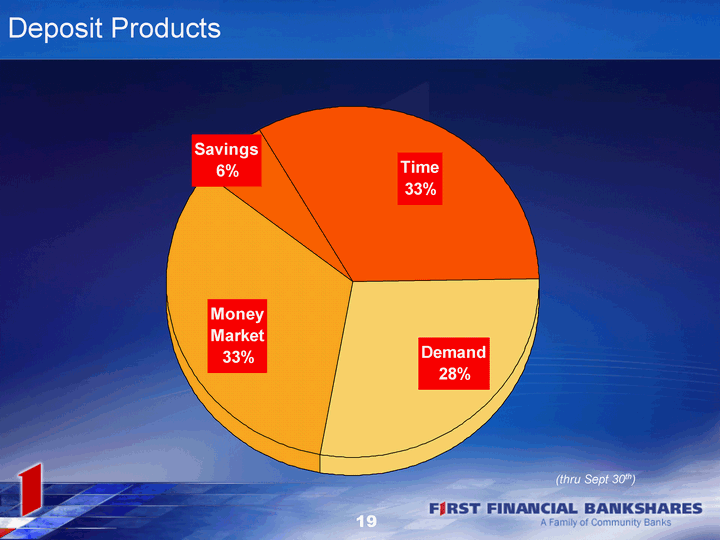
| Deposit Products Time Demand Money Market Savings East 33 28 33 6 (thru Sept 30th) |

| 2002 2003 2004 2005 2006 2007 Agricultural 63 69 80 85 73 78 Consumer 154 134 144 160 165 175 Student 74 54 32 37 31 31 Commercial 247 261 298 330 344 359 Real Estate 426 470 610 677 760 814 Loan Performance Growth in FFIN Total Loans (in millions) (thru Sept 30th) $964 $1,164 $1,289 $1,373 $1,457 $988 |

| Major Products and Services Commercial Banking Small business, real estate, agriculture Significant relationships with medical profession Consumer Banking Personal banking services and mortgage originations Student Loans 9th largest lender in Texas (dollars) |
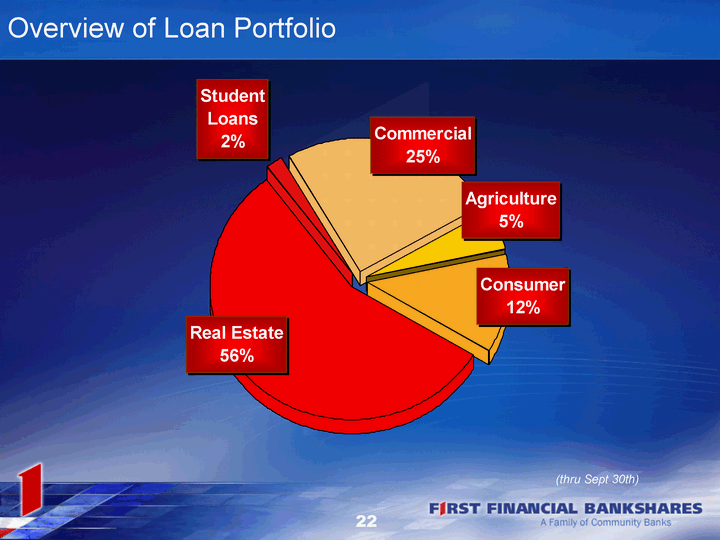
| Overview of Loan Portfolio Commercial Agriculture Consumer Real Estate Student Loans East 25 5 12 56 2 (thru Sept 30th) |

| Breakdown of R/E Loan Portfolio Residential Development & Construction 1-4 Family Commercial Development and Construction Commercial R/E Other R/E 130479491 221564676 89425769 234324696 148480037 (thru Sept 30th) |

| Less than 1 year 1 to 3 years 3 to 5 years 5 to 10 years 10 to 15 years Over 15 years $610,935 $207,300 $225,531 $226,914 $77,585 $42,829 $26,964 43.1% 14.6% 15.9% 16.0% 5.5% 3.0% 1.9% Variable and Fixed Rate Loans *Excludes Student Loans and Credit Cards Loans Loan Portfolio Interest Rate Risk Analysis* (in millions) Variable Rate Fixed Rate |
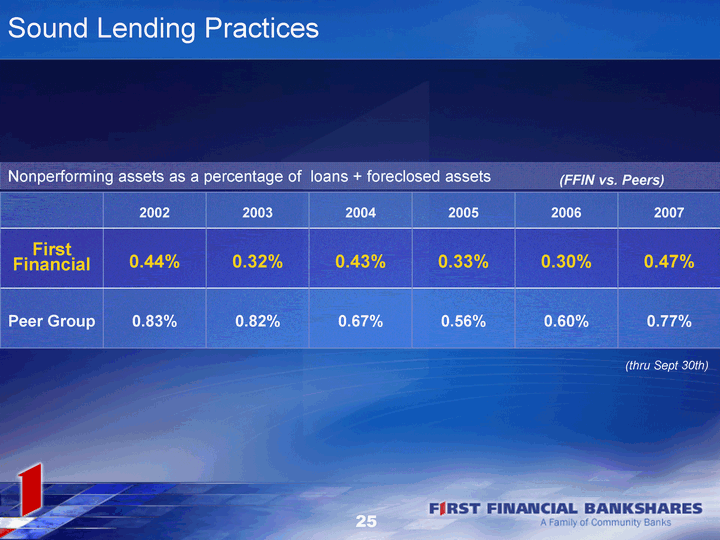
| 2002 2003 2004 2005 2006 2007 First Financial 0.44% 0.32% 0.43% 0.33% 0.30% 0.47% Peer Group 0.83% 0.82% 0.67% 0.56% 0.60% 0.77% Sound Lending Practices Nonperforming assets as a percentage of loans + foreclosed assets (FFIN vs. Peers) (thru Sept 30th) |

| 2002 2003 2004 2005 2006 2007 986 992 1068 1150 1300 1381 Growth in Trust Assets 40% Growth Total Trust Assets (in millions) (thru Sept 30th) |

| 2002 2003 2004 2005 2006 2007 5836 6018 6374 7068 7665 6706 Total Trust Fees 30% Growth Growth in FFTAM Fees (in thousands) (thru Sept 30th) |

| 2002 2003 2004 2005 2006 2007 34 35.3 39.17 44.02 46 36.98 20th Consecutive Year of Increased Earnings FFIN Earnings (in millions) 35% Growth $2.5 thru Sept 30th |

| 2002 2003 2004 2005 2006 2007 1.65 1.71 1.9 2.13 2.22 1.78 Strong Shareholder Earnings Basic Earnings Per Share $0.13 35% Growth thru Sept 30th |

| 2002 2003 2004 2005 2006 2007 0.81 0.91 1 1.1 1.18 0.94 Dividends Per Share Annual Dividends Per Share 46% Growth thru Sept 30th |
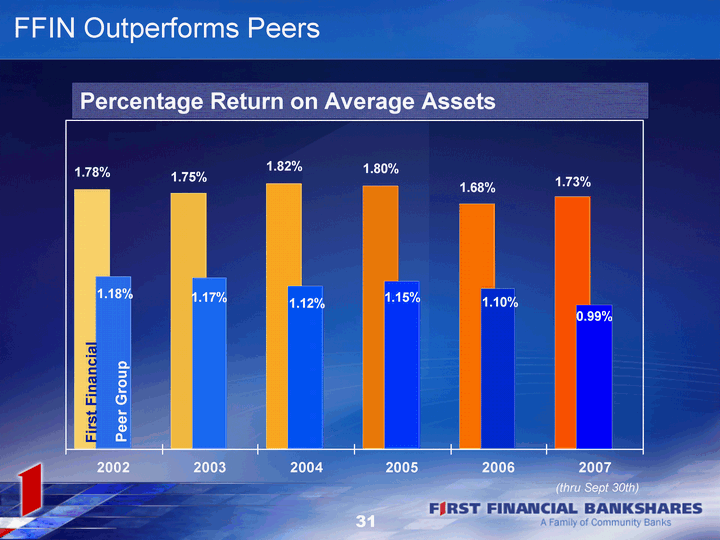
| 2002 2003 2004 2005 2006 2007 0.0178 0.0175 0.0182 0.018 0.0168 0.0173 Peers 0.0118 0.0117 0.0112 0.0115 0.011 0.0099 FFIN Outperforms Peers Percentage Return on Average Assets Peer Group First Financial (thru Sept 30th) |
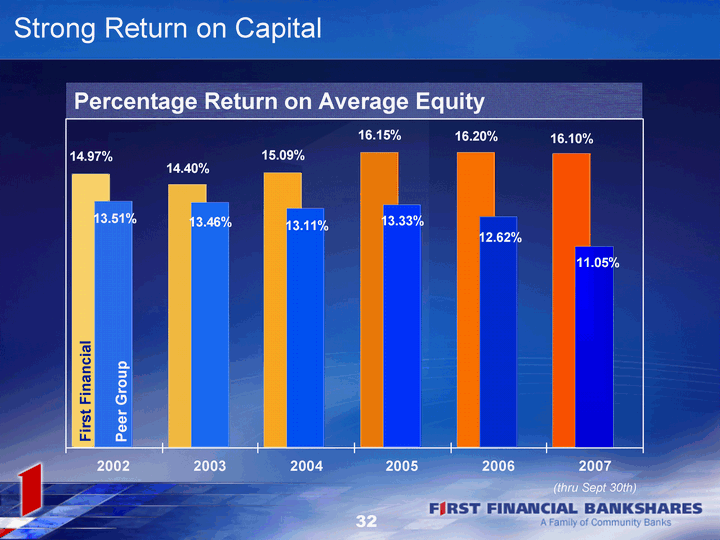
| 2002 2003 2004 2005 2006 2007 0.1497 0.144 0.1509 0.1615 0.162 0.161 Peers 0.1351 0.1346 0.1311 0.1333 0.1262 0.1105 Strong Return on Capital Percentage Return on Average Equity Peer Group First Financial (thru Sept 30th) |
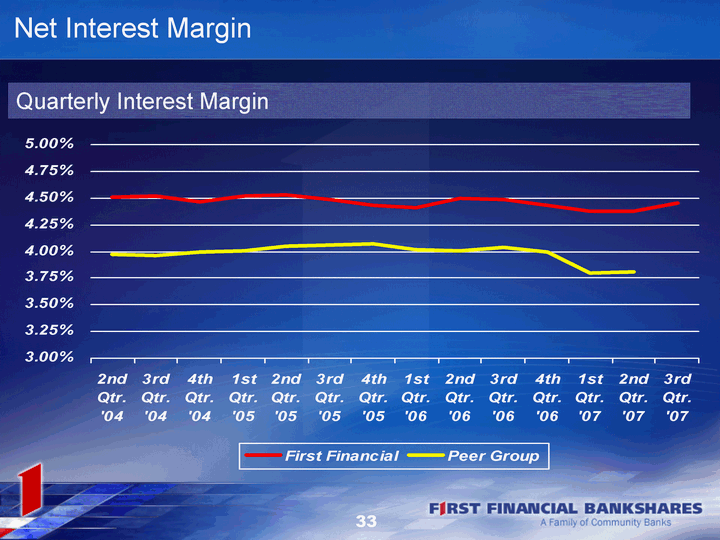
| 2nd Qtr. '04 3rd Qtr. '04 4th Qtr. '04 1st Qtr. '05 2nd Qtr. '05 3rd Qtr. '05 4th Qtr. '05 1st Qtr. '06 2nd Qtr. '06 3rd Qtr. '06 4th Qtr. '06 1st Qtr. '07 2nd Qtr. '07 3rd Qtr. '07 First Financial 0.0451 0.0452 0.0446 0.0452 0.0453 0.0449 0.0443 0.0441 0.045 0.0449 0.0443 0.0438 0.0438 0.0445 Peer Group 0.0397 0.0396 0.0399 0.0401 0.0405 0.0406 0.0407 0.0402 0.0401 0.0404 0.0399 0.038 0.0381 Net Interest Margin Quarterly Interest Margin |
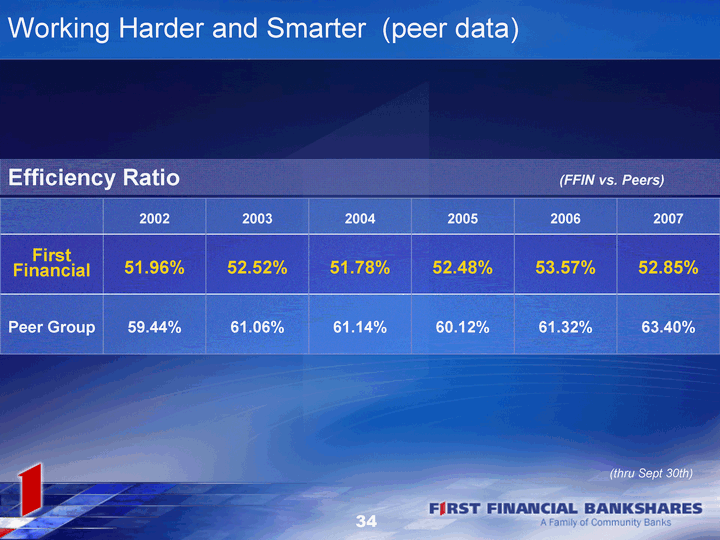
| 2002 2003 2004 2005 2006 2007 First Financial 51.96% 52.52% 51.78% 52.48% 53.57% 52.85% Peer Group 59.44% 61.06% 61.14% 60.12% 61.32% 63.40% Working Harder and Smarter (peer data) Efficiency Ratio (FFIN vs. Peers) (thru Sept 30th) |

| Stock cost in January 2006 $35,060 Dividend received ($1.18 x 1,000 shares) $ 1,180 Increase in stock price during 2006 ($35.06 to $41.86 X 1,000 shares) $10,720 2006 return on investment 22.76% 2005 return on investment 7.58% 2004 return on investment 12.22% 2003 return on investment 39.24% 2002 return on investment 30.73% 5 year compound return 21.01% Total Return on Investment $6,800 Assume you owned 1,000 shares of FFIN stock on January 1, 2006... |

| Shares Traded 2001 2002 2003 2004 2005 2006 2007 3267 4909 5306 5052 6450 6967 9351 Increasing Stock Liquidity (in millions) 113% Growth (thru Sept 30th) |

| A Decade of Growth Year End Total Assets (billions) Net Income (millions) Basic EPS Cash Dividends Year-End Market Value 2006 $2.85 $46.0 $2.22 $1.18 $41.86 2005 $2.73 $44.0 $2.13 $1.10 $35.06 2004 $2.32 $39.2 $1.90 $1.00 $33.61 2003 $2.09 $35.3 $1.71 $0.91 $30.84 2002 $1.99 $34.0 $1.65 $0.81 $22.80 2001 $1.93 $29.4 $1.43 $0.70 $18.06 2000 $1.75 $28.3 $1.37 $0.62 $15.09 1999 $1.72 $25.7 $1.24 $0.54 $14.76 1998 $1.69 $23.3 $1.13 $0.48 $16.80 1997 $1.57 $20.1 $1.02 $0.42 $18.71 10 Year CGR 8.49% 9.77% 8. 86% 12.00% 11.60% As originally reported at the close of each year and prior to restatements for pooling-of-interests. |

| Goals Look for additional acquisition and expansion opportunities Grow loan to deposit ratio while maintaining strong credit standards Improve our efficiency ratio Leverage our strengths in treasury management, mortgage loans, trust operations and student loans Continue to enhance the Customer Service First initiative Expand our multicultural initiative |
