|
EXHIBIT 99.1 
|
2015 Annual Shareholder Meeting
Thank you for 125 years of allowing us to put You First.
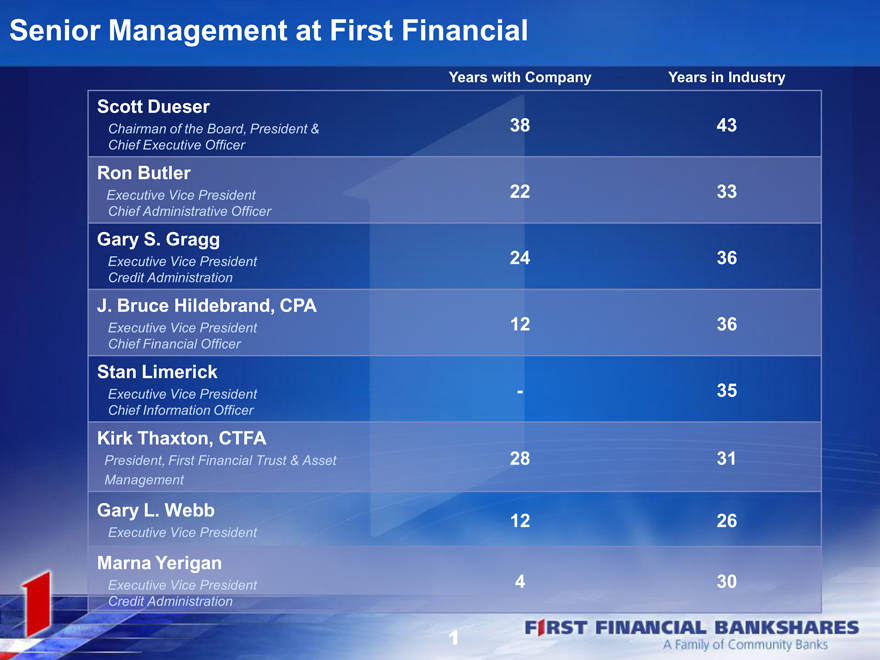
Years with Company Years in Industry
Scott Dueser
Chairman of the Board, President & 38 43
Chief Executive Officer
Ron Butler
Executive Vice President 22 33
Chief Administrative Officer
Gary S. Gragg
Executive Vice President 24 36
Credit Administration
J. Bruce Hildebrand, CPA
Executive Vice President 12 36
Chief Financial Officer
Stan Limerick
Executive Vice President — 35
Chief Information Officer
Kirk Thaxton, CTFA
President, First Financial Trust & Asset 28 31
Management
Gary L. Webb 12 26
Executive Vice President
Marna Yerigan
Executive Vice President 4 30
Credit Administration
1
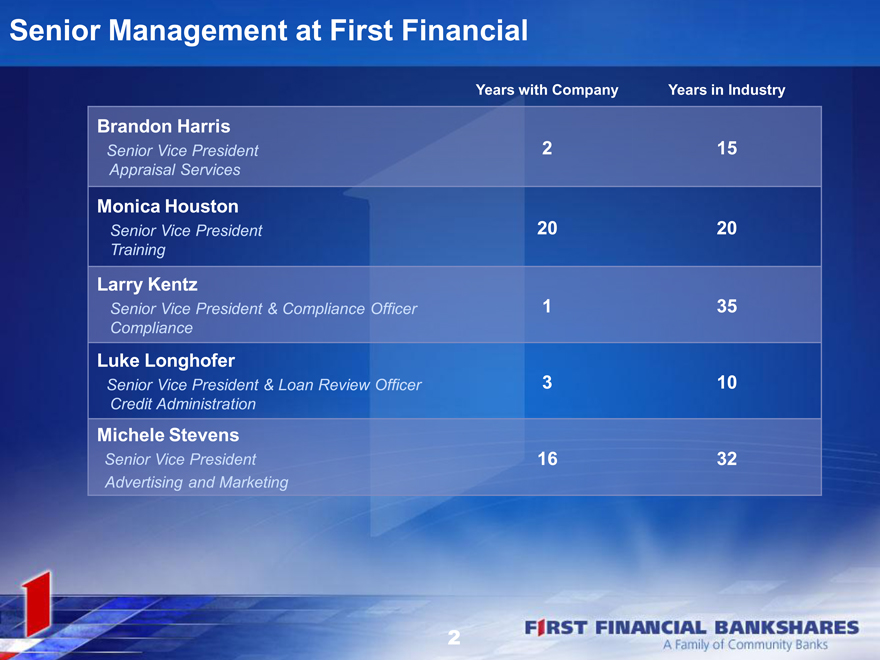
Senior Management at First Financial
Years with Company Years in Industry
Brandon Harris
Senior Vice President 2 15
Appraisal Services
Monica Houston
Senior Vice President 20 20
Training
Larry Kentz
Senior Vice President & Compliance Officer 1 35
Compliance
Luke Longhofer
Senior Vice President & Loan Review Officer 3 10
Credit Administration
Michele Stevens
Senior Vice President 16 32
Advertising and Marketing
2
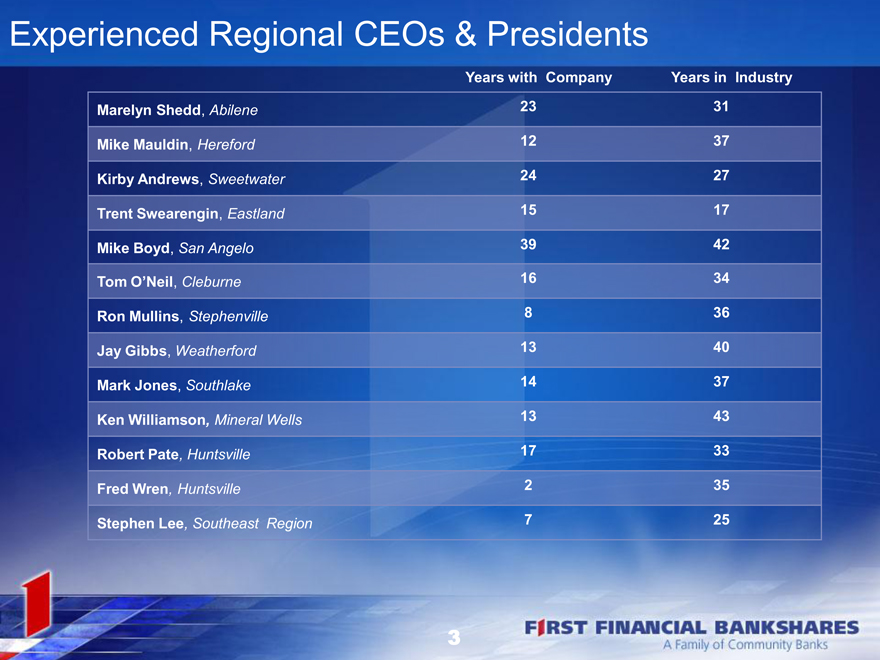
Experienced Regional CEOs & Presidents
Years with Company Years in Industry
Marelyn Shedd, Abilene 23 31
Mike Mauldin, Hereford 12 37
Kirby Andrews, Sweetwater 24 27
Trent Swearengin, Eastland 15 17
Mike Boyd, San Angelo 39 42
Tom O’Neil, Cleburne 16 34
Ron Mullins, Stephenville 8 36
Jay Gibbs, Weatherford 13 40
Mark Jones, Southlake 14 37
Ken Williamson, Mineral Wells 13 43
Robert Pate, Huntsville 17 33
Fred Wren, Huntsville 2 35
Stephen Lee, Southeast Region 7 25
3
Thank you for 125 years of allowing us to put You First.
Independent Public Auditors
Building a better working world
5
FIRST FINANCIAL BANKSHARES, INC. TM
A Family of community BanksTM
FIRST FINANCIAL BANKSHARES, INC.
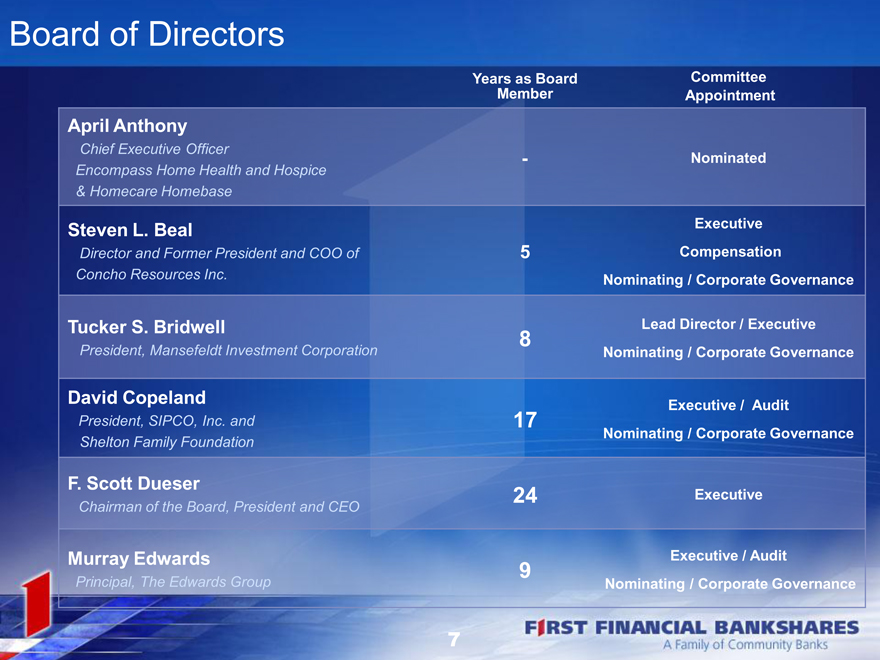
Board of Directors
Years as Board Committee
Member Appointment
April Anthony
Chief Executive Officer — Nominated
Encompass Home Health and Hospice
& Homecare Homebase
Steven L. Beal Executive
Director and Former President and COO of 5 Compensation
Concho Resources Inc. Nominating / Corporate Governance
Tucker S. Bridwell Lead Director / Executive
8
President, Mansefeldt Investment Corporation Nominating / Corporate Governance
David Copeland Executive / Audit
President, SIPCO, Inc. and 17
Shelton Family Foundation Nominating / Corporate Governance
F. Scott Dueser 24 Executive
Chairman of the Board, President and CEO
Murray Edwards Executive / Audit
9
Principal, The Edwards Group Nominating / Corporate Governance
7
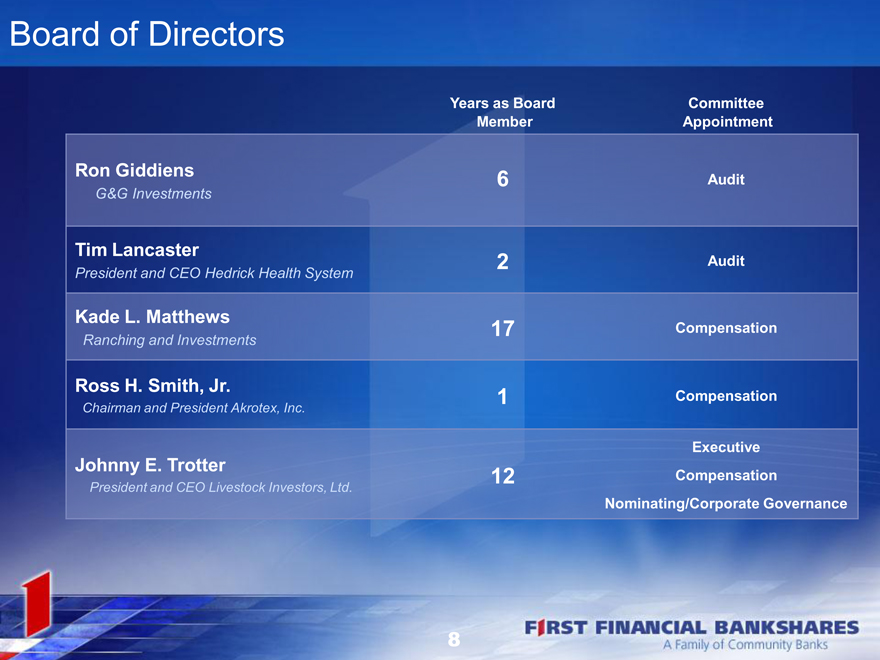
Board of Directors
Years as Board Committee
Member Appointment
Ron Giddiens 6 Audit
G&G Investments
Tim Lancaster 2 Audit
President and CEO Hedrick Health System
Kade L. Matthews 17 Compensation
Ranching and Investments
Ross H. Smith, Jr. 1 Compensation
Chairman and President Akrotex, Inc.
Executive
Johnny E. Trotter 12 Compensation
President and CEO Livestock Investors, Ltd.
Nominating/Corporate Governance
8
FIRST FINANCIAL BANKSHARES, INC. TM
A Family of community BanksTM
FIRST FINANCIAL BANKSHARES, INC.
Ms. April Anthony
10
Thank you for 125 years of allowing us to put You First.
Forward Looking Statement
The numbers, as of and for the three months ended March 31, 2015, contained within this presentation are unaudited. Certain statements contained herein may be considered “forward-looking statements” as defined in the Private Securities Litigation Reform Act of 1995. These statements are based upon the belief of the Company’s management, as well as assumptions made beyond information currently available to the Company’s management and, may be, but not necessarily are identified by such words as “expect”, “plan”, “anticipate”, “target”, “forecast” and “goal”. Because such “forward-looking statements” are subject to risks and uncertainties, actual results may differ materially from those expressed or implied by such forward-looking statements. Factors that could cause actual results to differ materially from the Company’s expectations include competition from other financial institutions and financial holding companies; the effects of and changes in trade, monetary and fiscal policies and laws, including interest rate policies of the Federal Reserve Board; changes in the demand for loans; fluctuations in value of collateral and loan reserves; inflation, interest rate, market and monetary fluctuations; changes in consumer spending, borrowing and savings habits; and acquisitions and integration of acquired businesses, and similar variables. Other key risks are described in the Company’s reports filed with the Securities and Exchange Commission, which may be obtained under “Investor Relations-Documents/Filings” on the Company’s web site or by writing or calling the Company at 325.627.7155. The Company does not undertake any obligation to update publicly or revise any forward-looking statements herein because of new information, future events or otherwise.
|
|
2014 Financial Review
Earnings
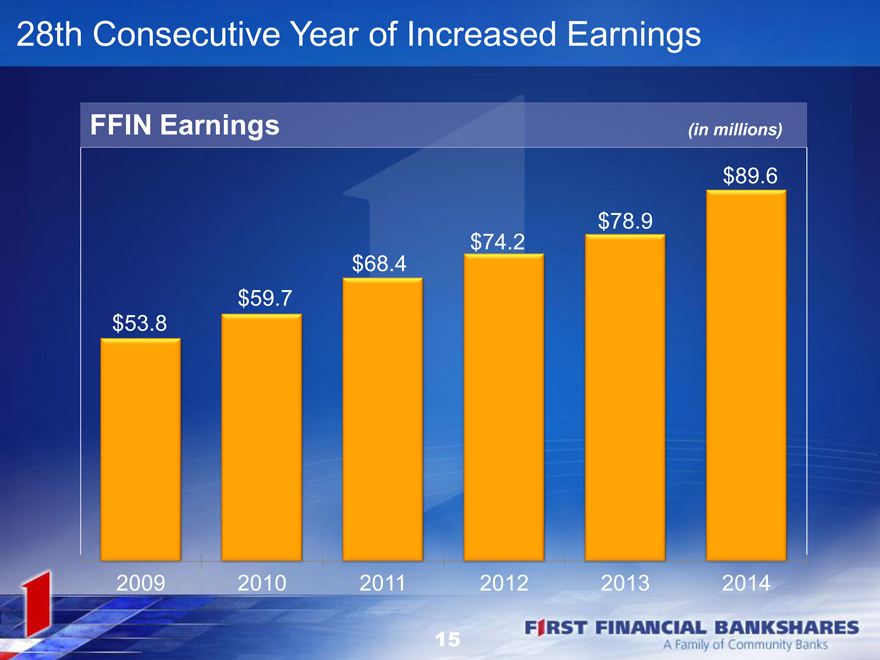
28th Consecutive Year of Increased Earnings
FFIN Earnings (in millions)
$89.6
$78.9
$74.2
$68.4
$59.7
$53.8
2009 2010 2011 2012 2013 2014
15
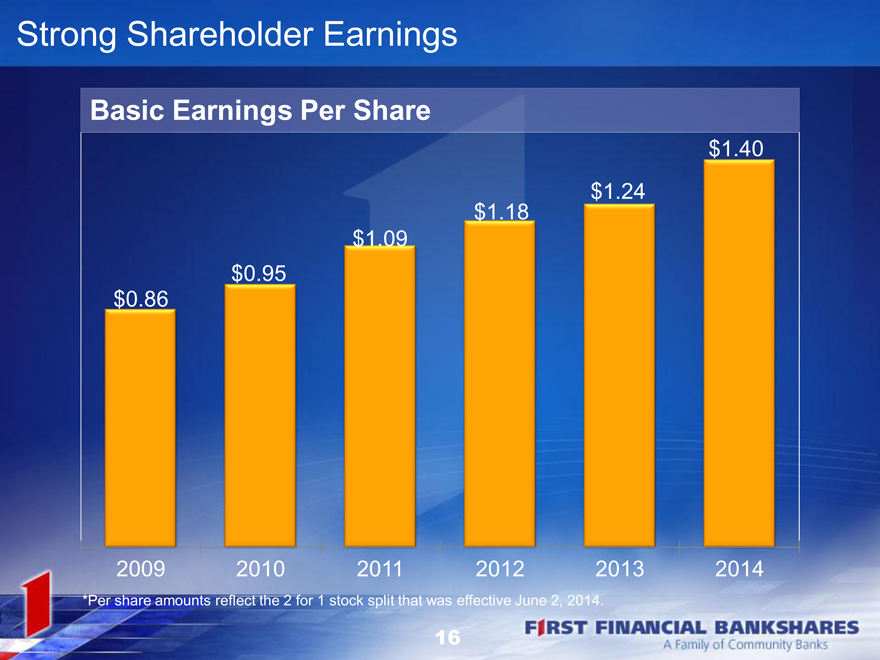
Strong Shareholder Earnings
Basic Earnings Per Share
$1.40
$1.24
$1.18
$1.09
$0.95
$0.86
2009 2010 2011 2012 2013 2014
*Per share amounts reflect the 2 for 1 stock split that was effective June 2, 2014.
16
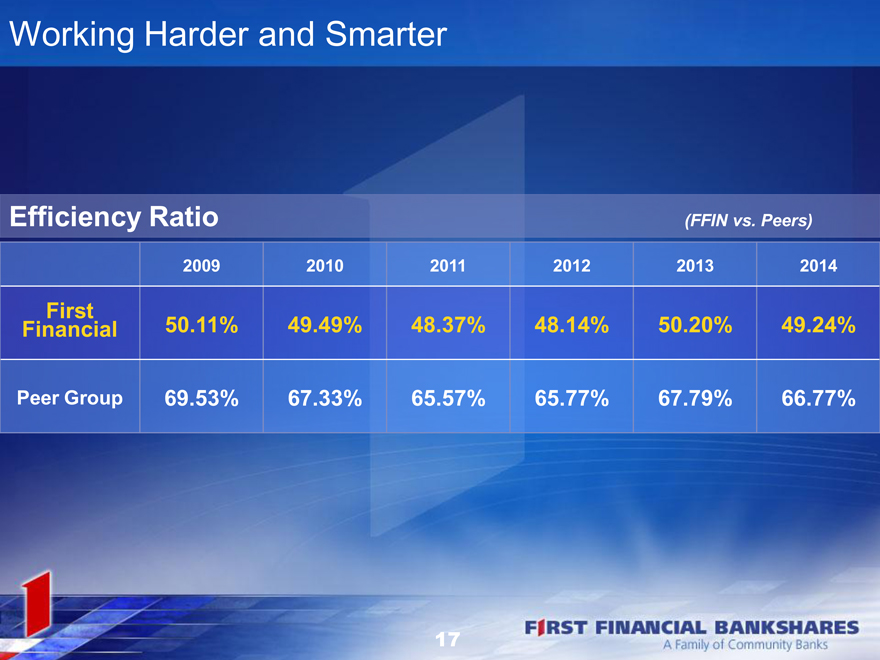
Working Harder and Smarter
Efficiency Ratio (FFIN vs. Peers)
2009 2010 2011 2012 2013 2014
First
Financial 50.11% 49.49% 48.37% 48.14% 50.20% 49.24%
Peer Group 69.53% 67.33% 65.57% 65.77% 67.79% 66.77%
17
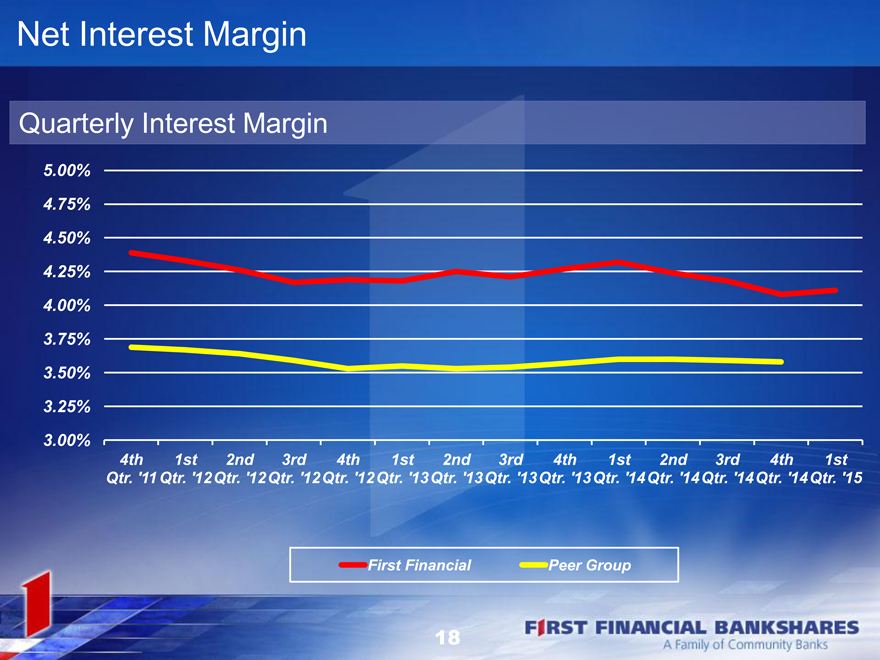
Net Interest Margin
Quarterly Interest Margin
5.00%
4.75%
4.50%
4.25%
4.00%
3.75%
3.50%
3.25%
3.00%
4th 1st 2nd 3rd 4th 1st 2nd 3rd 4th 1st 2nd 3rd 4th 1st
Qtr. ‘11 Qtr. ‘12 Qtr. ‘12 Qtr. ‘12 Qtr. ‘12 Qtr. ‘13 Qtr. ‘13 Qtr. ‘13 Qtr. ‘13 Qtr. ‘14 Qtr. ‘14 Qtr. ‘14 Qtr. ‘14 Qtr. ‘15
First Financial Peer Group
18
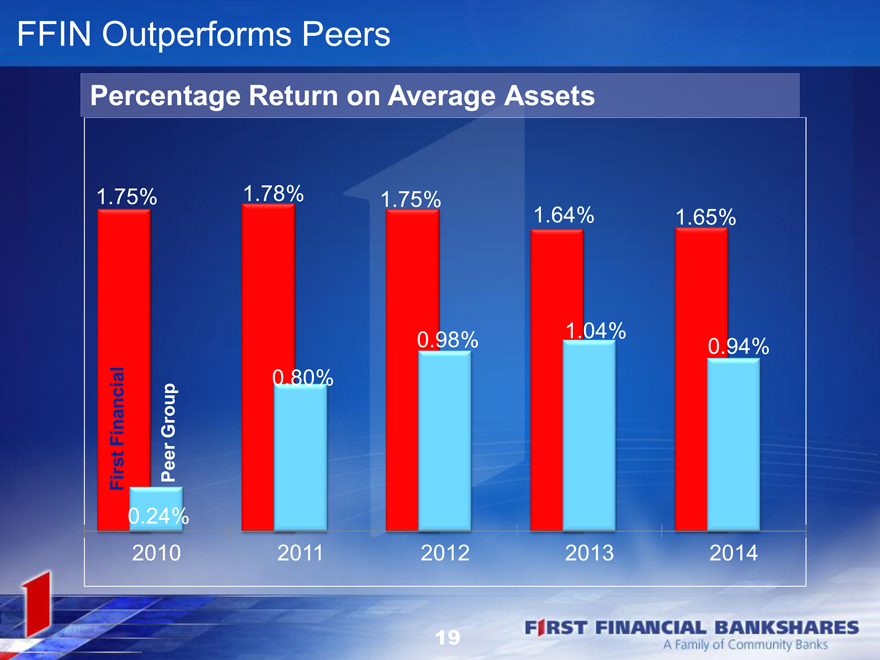
FFIN Outperforms Peers
Percentage Return on Average Assets
1.75% 1.78% 1.75%
1.64% 1.65%
0.98% 1.04% 0.94%
0.80%
Financial Group
First Peer
0.24%
2010 2011 2012 2013 2014
19
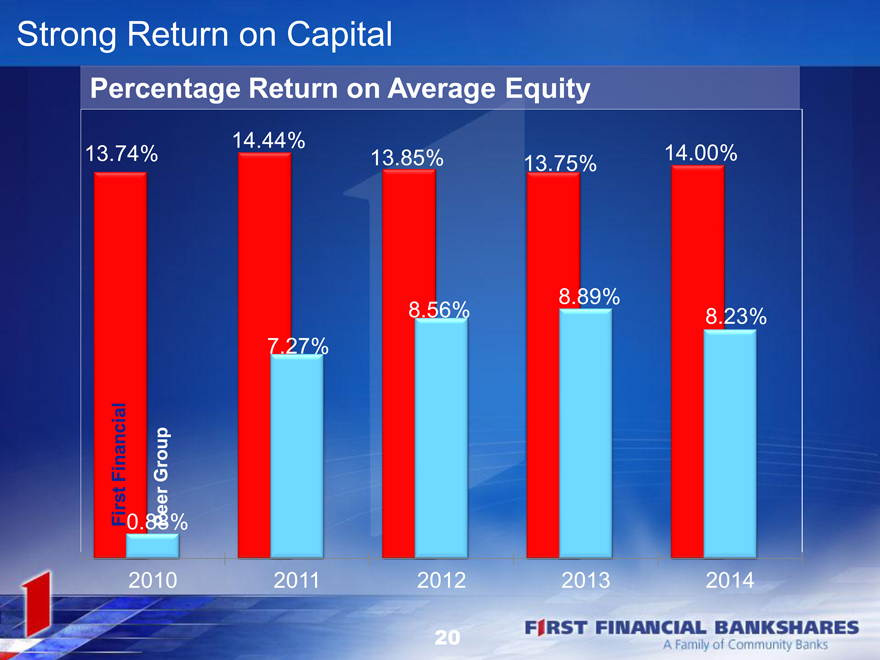
Strong Return on Capital
Percentage Return on Average Equity
14.44%
13.74% 13.85% 13.75% 14.00%
8.89%
8.56% 8.23%
7.27%
Financial Group
First 0.88%Peer
2010 2011 2012 2013 2014
20
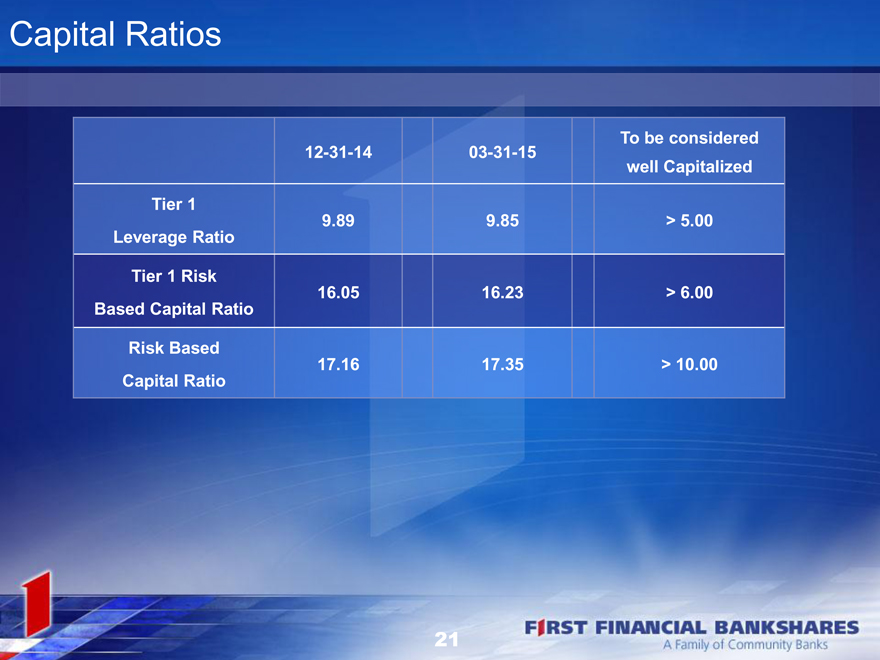
Capital Ratios
To be considered
12-31-14 03-31-15
well Capitalized
Tier 1
9.89 9.85 > 5.00
Leverage Ratio
Tier 1 Risk
16.05 16.23 > 6.00
Based Capital Ratio
Risk Based
17.16 17.35 > 10.00
Capital Ratio
21
Asset Performance
Growth in Total Assets (in millions)
$5,848
$5,222
$4,502
$4,121
$3,776
$3,279
2009 2010 2011 2012 2013 2014
22
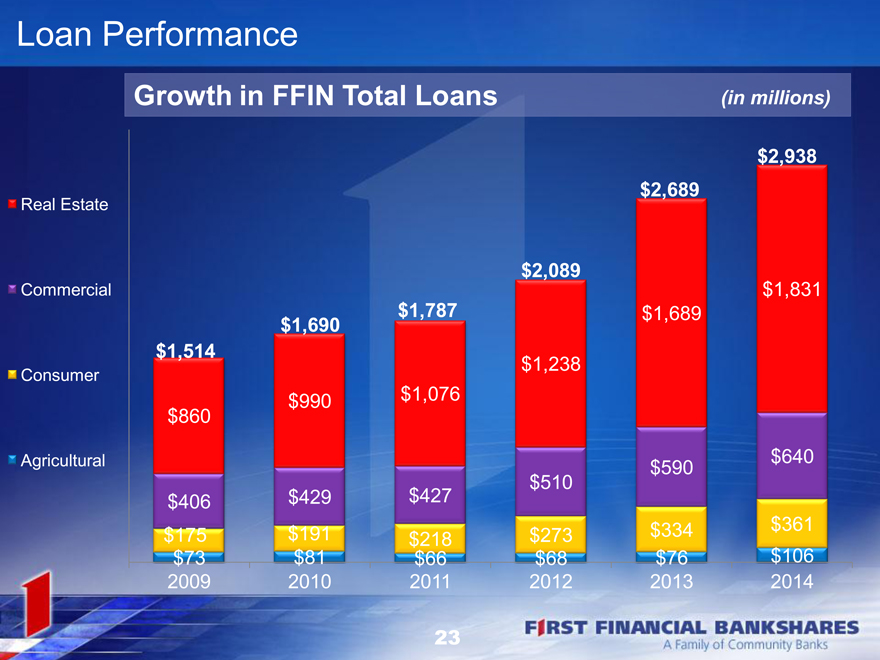
Loan Performance
Growth in FFIN Total Loans (in millions)
$2,938
$2,689
Real Estate
$2,089
Commercial $1,831
$1,690 $1,787 $1,689
$1,514
Consumer $1,238
$990 $1,076
$860
Agricultural $590 $640
$510
$406 $429 $427
$175 $191 $218 $273 $334 $361
$73 $81 $66 $68 $76 $106
2009 2010 2011 2012 2013 2014
23
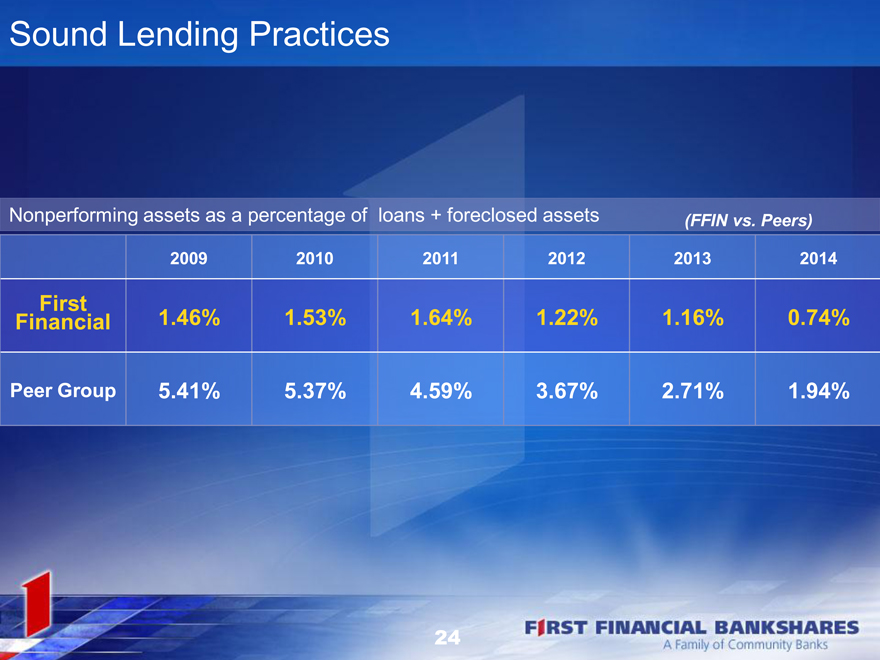
Sound Lending Practices
Nonperforming assets as a percentage of loans + foreclosed assets (FFIN vs. Peers)
2009 2010 2011 2012 2013 2014
First
Financial 1.46% 1.53% 1.64% 1.22% 1.16% 0.74%
Peer Group 5.41% 5.37% 4.59% 3.67% 2.71% 1.94%
24
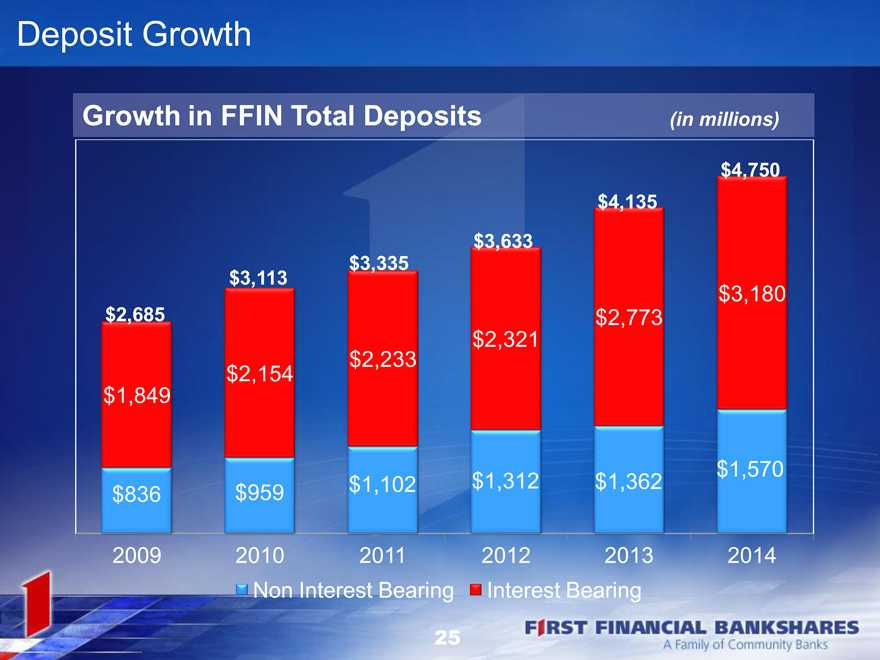
Deposit Growth
Growth in FFIN Total Deposits (in millions)
$4,750
$4,135
$3,633
$3,335
$3,113
$3,180
$2,685 $2,773
$2,321
$2,233
$2,154
$1,849
$1,570
$836 $959 $1,102 $ 1,312 $1,362
2009 2010 2011 2012 2013 2014
Non Interest Bearing Interest Bearing
25
1st Quarter 2015 Summary
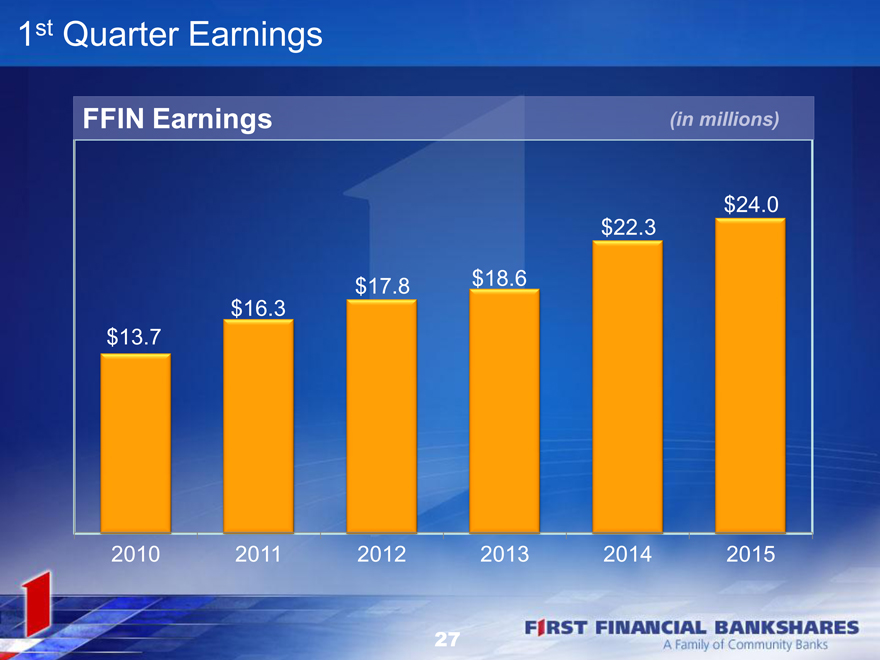
1st Quarter Earnings
FFIN Earnings
$24.0
$22.3
$17.8 $18.6
$16.3
$13.7
2010 2011 2012 2013 2014 2015
27
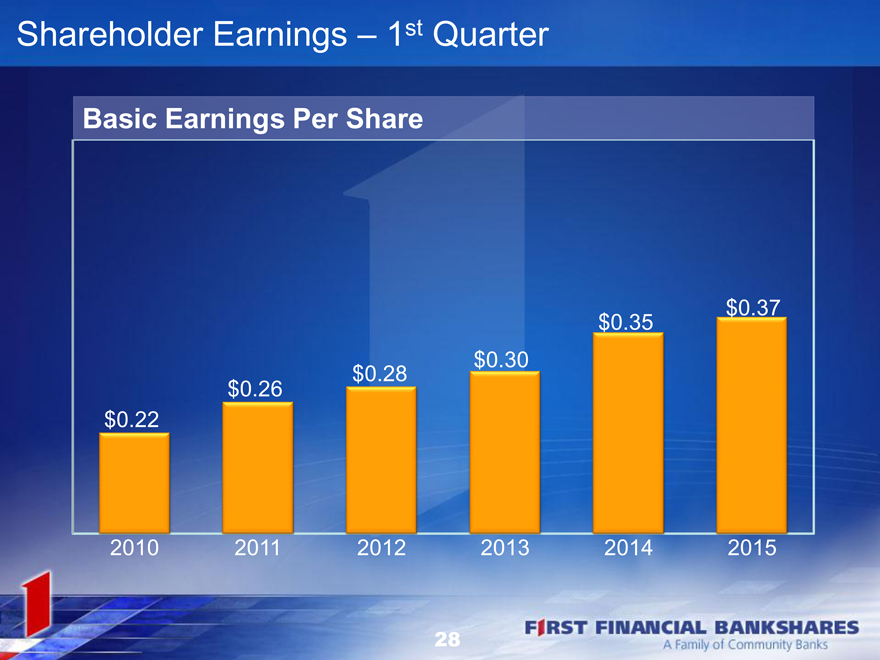
Shareholder Earnings – 1st Quarter
Basic Earnings Per Share
$0.37
$0.35
$0.28 $0.30
$0.26
$0.22
2010 2011 2012 2013 2014 2015
28
FIRST FINANCIAL TRUST & ASSET MANAGEMENT COMPANY NA
A Family of Community Banks
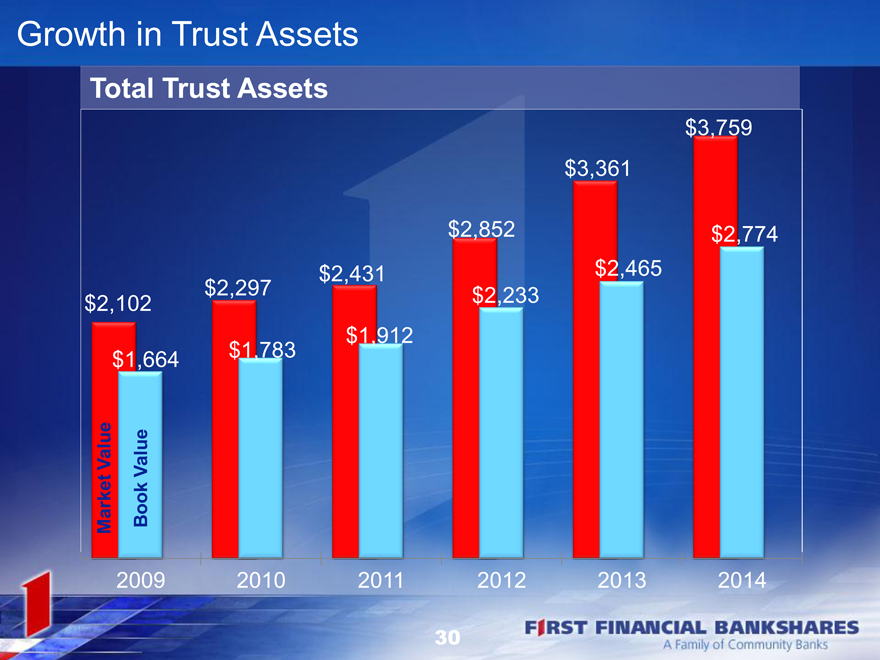
Growth in Trust Assets
Total Trust Assets
$3,759
$3,361
$2,852 $2,774
$2,431 $2,465
$2,102 $2,297 $2,233
$1,912
$1,664 $1,783
Value Value
ket Mar Book
2009 2010 2011 2012 2013 2014
30
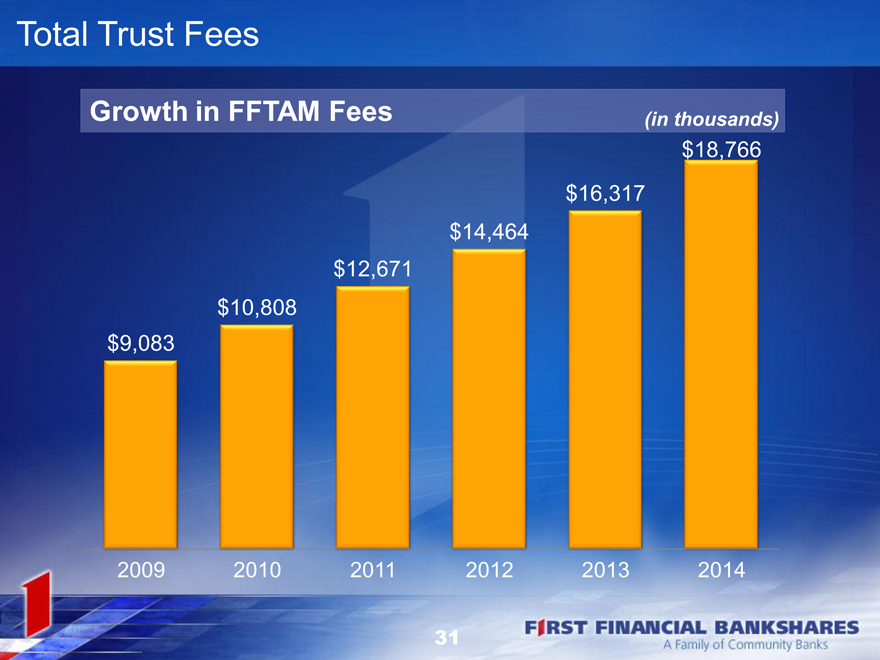
Total Trust Fees
Growth in FFTAM Fees (in thousands)
$18,766
$16,317
$14,464
$12,671
$10,808
$9,083
2009 2010 2011 2012 2013 2014
31
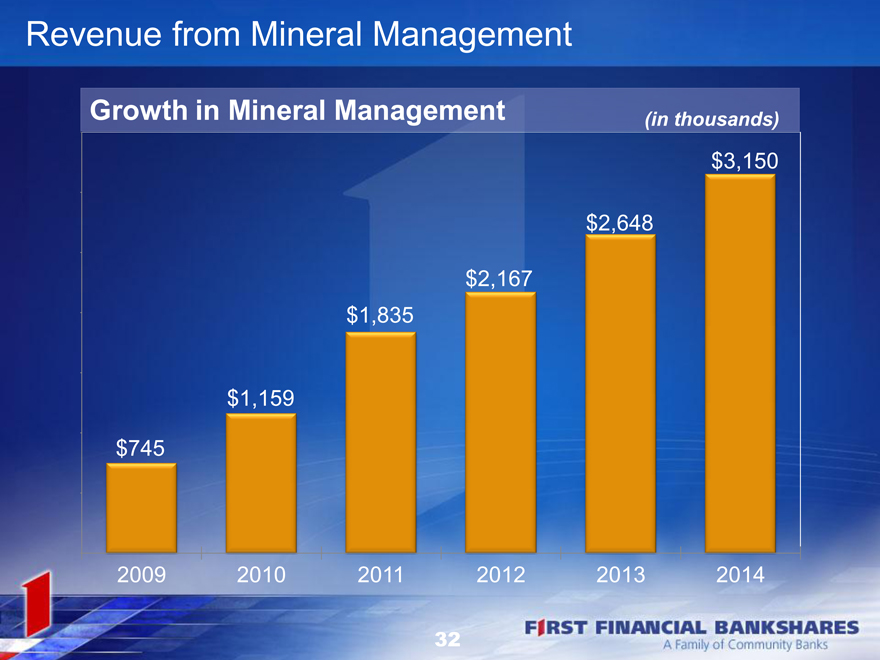
Revenue from Mineral Management
Growth in Mineral Management (in thousands)
$3,150
$2,648
$2,167
$1,835
$1,159
$745
2009 2010 2011 2012 2013 2014
32
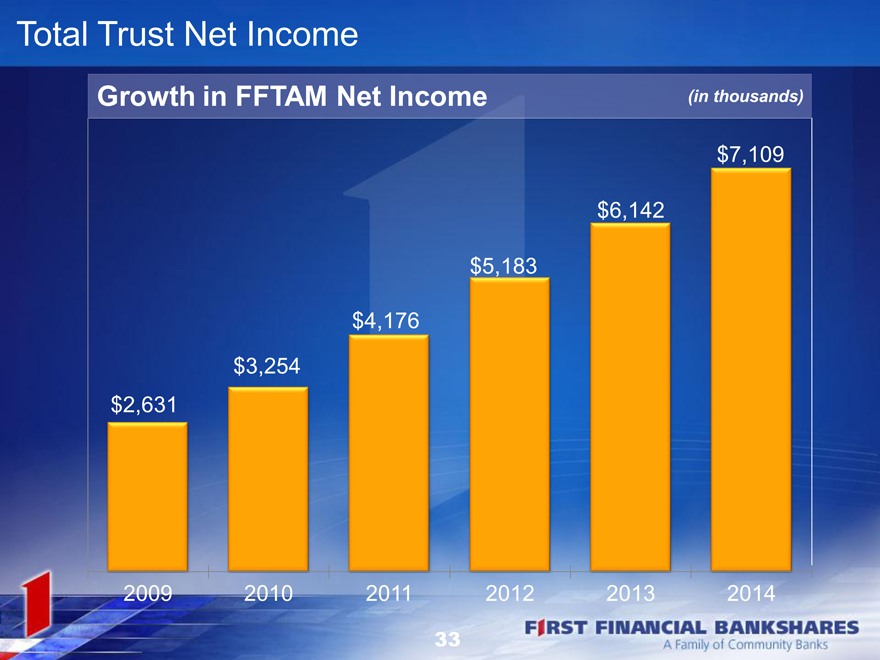
Total Trust Net Income
Growth in FFTAM Net Income (in thousands)
$7,109
$6,142
$5,183
$4,176
$3,254
$2,631
2009 2010 2011 2012 2013 2014
33
Managed Equity Styles
Equity Income
Core Domestic
Core Diversified
Core World
Strategic Growth
34
Trust Office—Lubbock
35
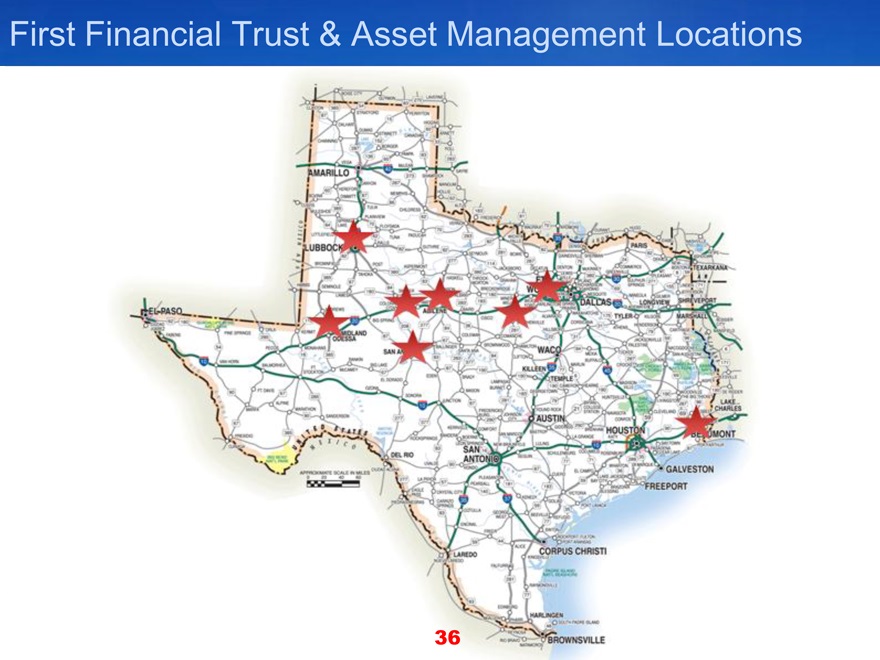
First Financial Trust & Asset Management Locations
36
FIRST FINANCIAL TRUST & ASSET MANAGEMENT COMPANY NA
A Family of Community Banks
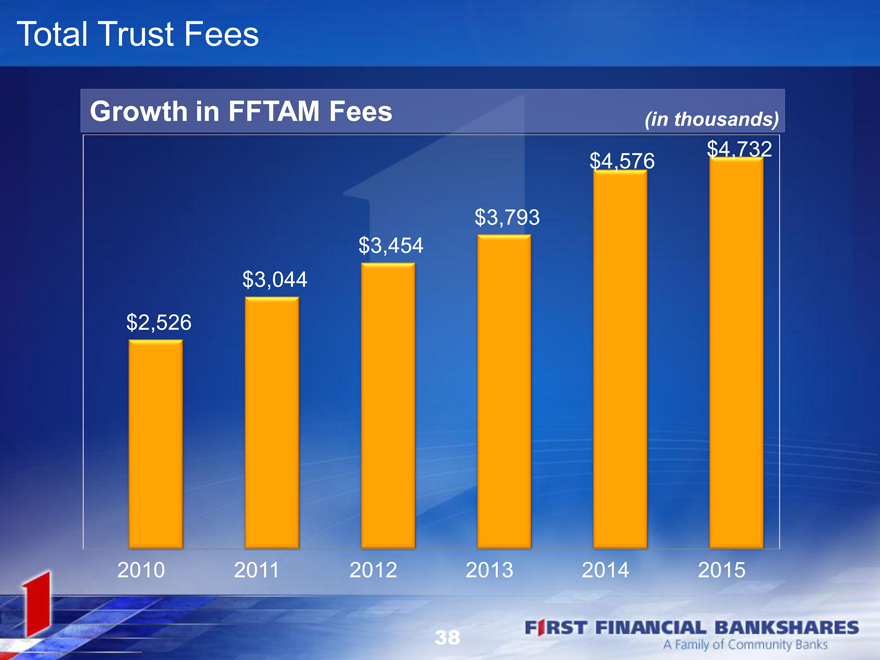
Total Trust Fees
Growth in FFTAM Fees (in thousands)
$4,576 $4,732
$3,793
$3,454
$3,044
$2,526
2010 2011 2012 2013 2014 2015
38
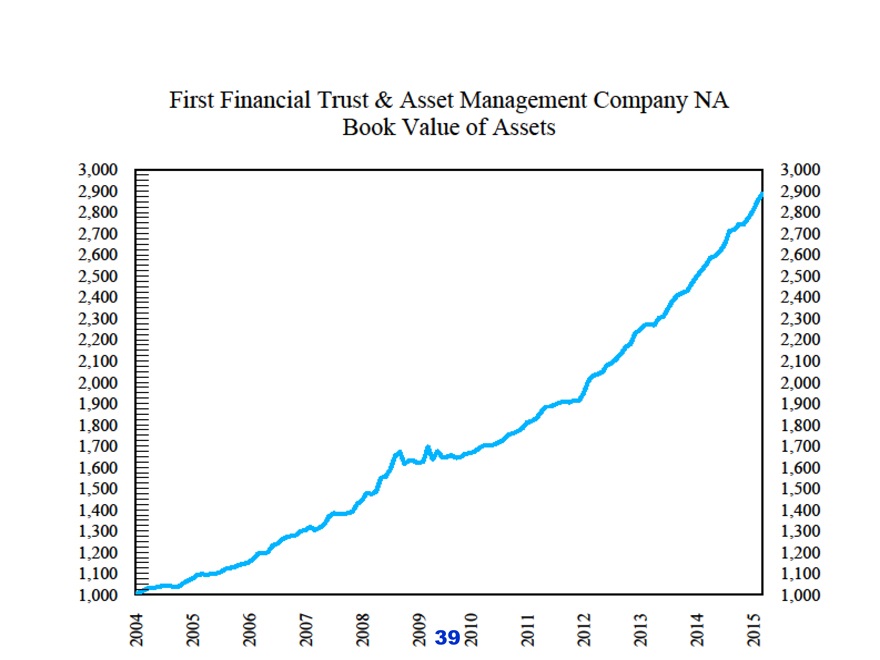
First financial Trust & Asset Management Company NA
Book Value of Assets
3,000
2,900
2,800
2,700
2,600
2,500
2,400
2,300
2,200
2,100
2,000
1,900
1,800
1,700
1,600
1,500
1,400
1,300
3,000
2,900
2,800
2,700
2,600
2,500
2,400
2,300
2,200
2,100
2,000
1,900
1,800
1,700
1,600
1,500
1,400
1,300
2004
2005
2006
2007
2008
2009
2010
2011
2012
2013
2014
2015
39
FIRST FINANCIAL TRUST & ASSET MANAGEMENT COMPANY NA
A Family of Community Banks
Thank you for 125 years of allowing us to put You First.
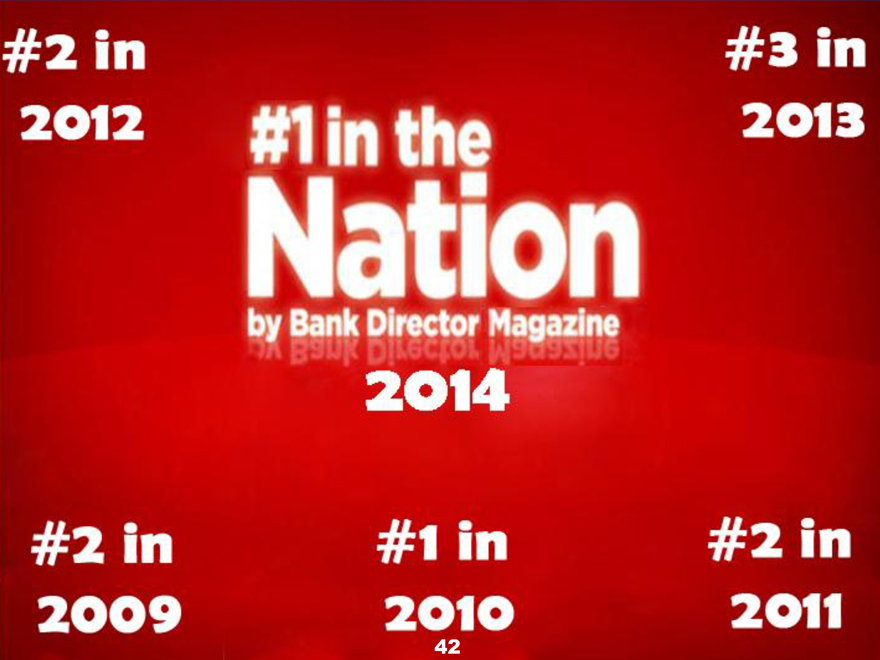
# 2 in 2012
# 2 in 2013
#1 in the Nation by Bank Director Magazine
2014
# 2 in 2009
# 2 in 2010
# 2 in 2011
42
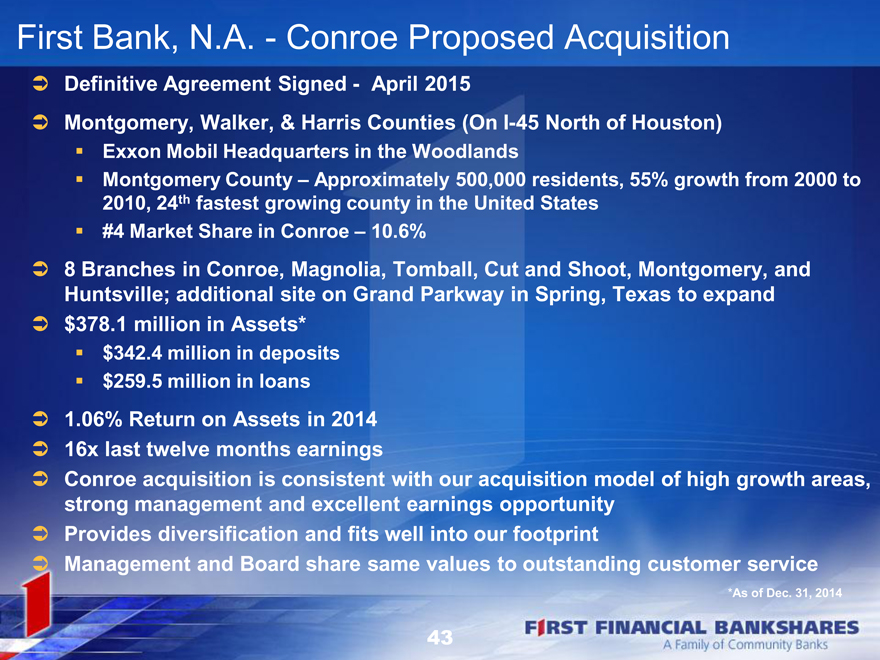
First Bank, N.A.—Conroe Proposed Acquisition
Definitive Agreement Signed— April 2015
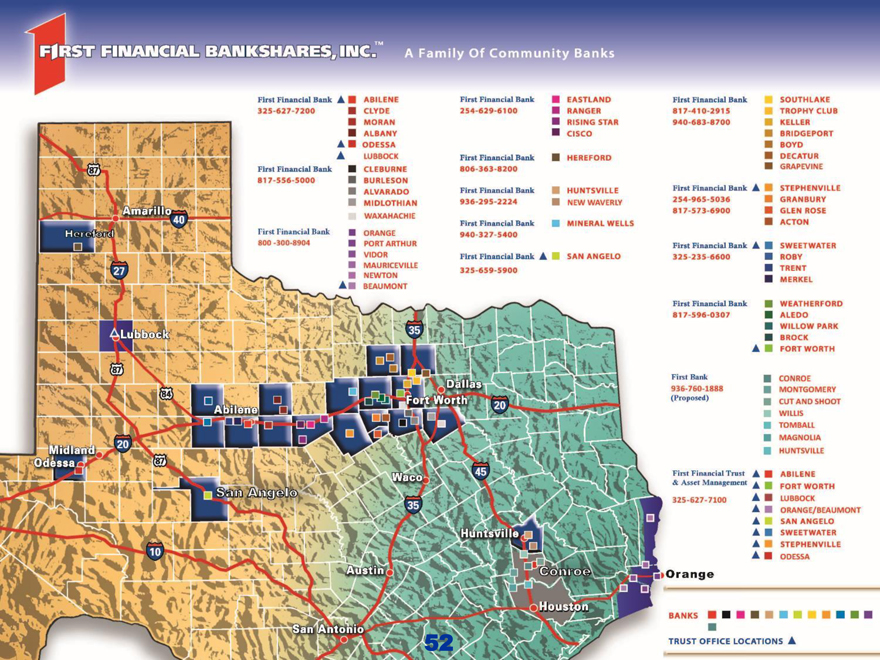
Montgomery, Walker, & Harris Counties (On I-45 North of Houston)
Exxon Mobil Headquarters in the Woodlands
Montgomery County – Approximately 500,000 residents, 55% growth from 2000 to 2010, 24th fastest growing county in the United States ? #4 Market Share in Conroe – 10.6%
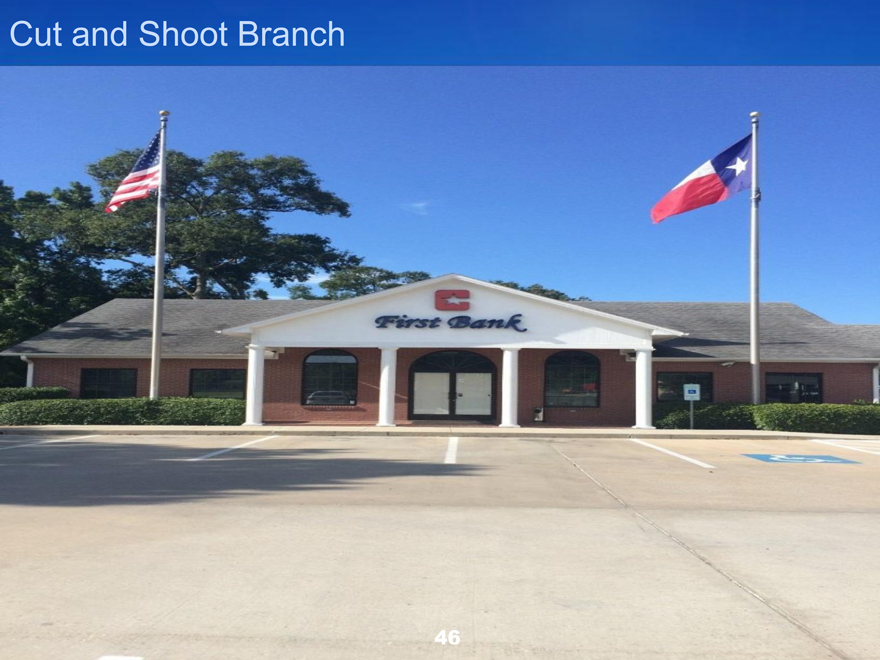
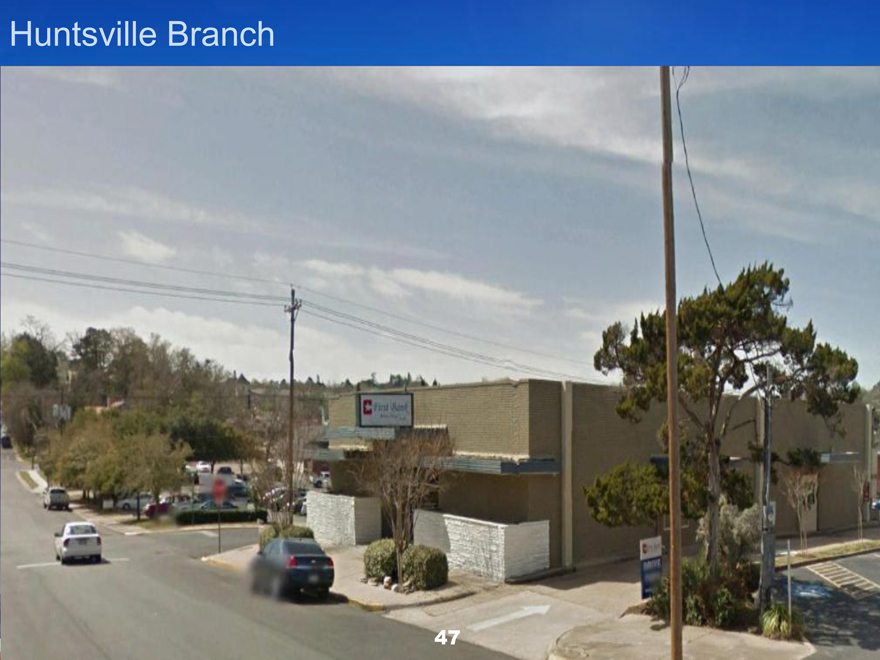
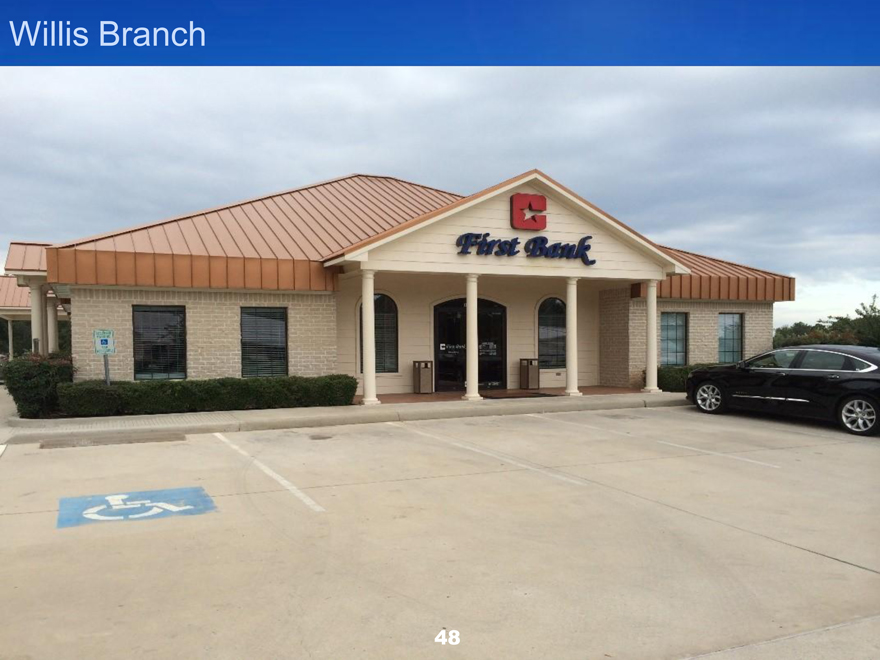
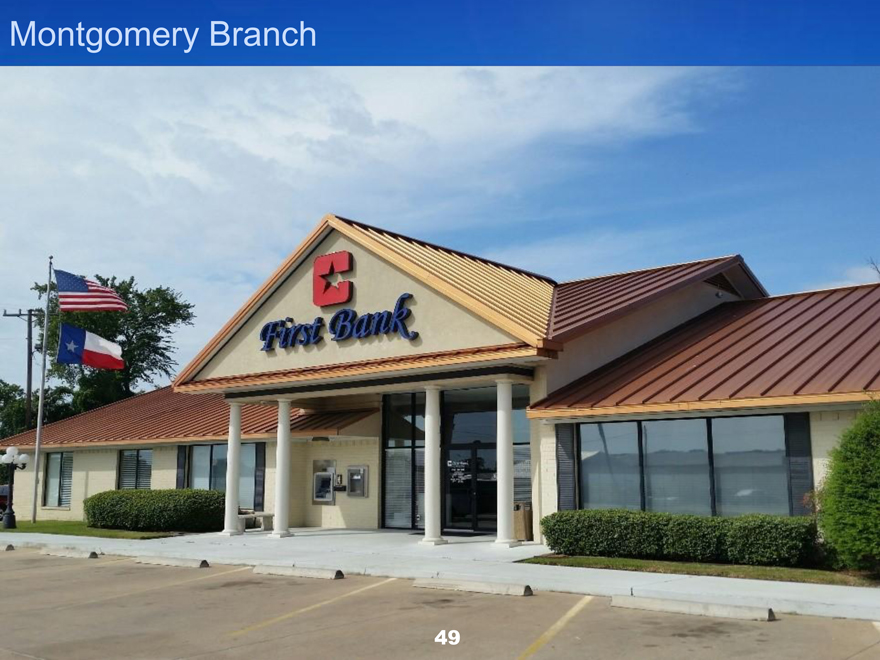
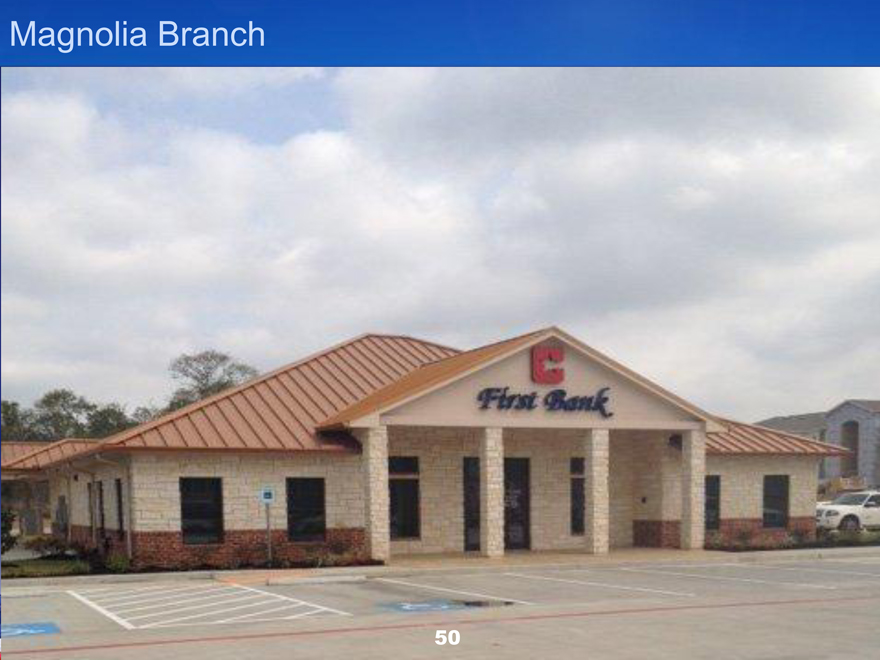
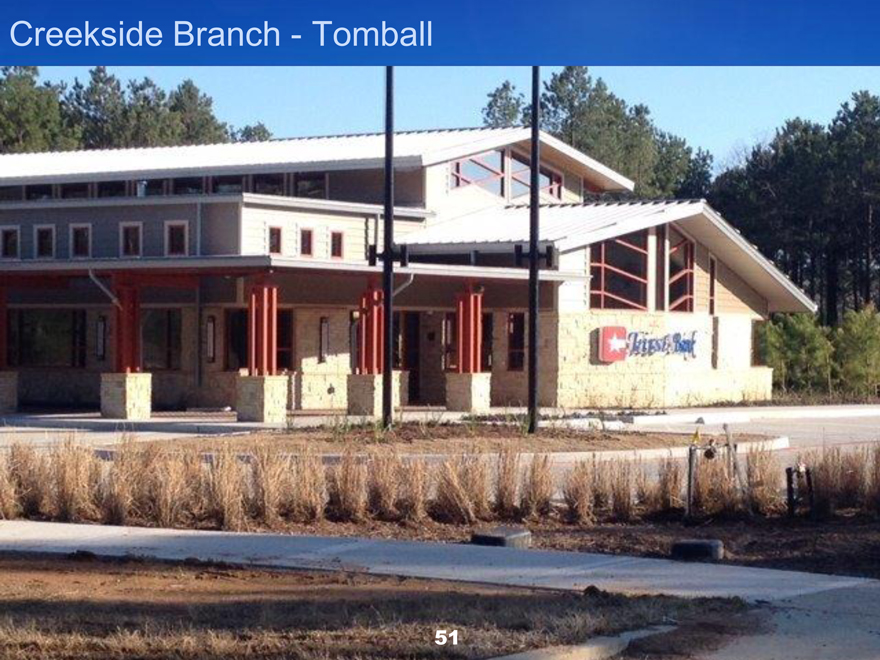
8 Branches in Conroe, Magnolia, Tomball, Cut and Shoot, Montgomery, and Huntsville; additional site on Grand Parkway in Spring, Texas to expand $378.1 million in Assets*
$342.4 million in deposits ? $259.5 million in loans
1.06% Return on Assets in 2014 16x last twelve months earnings
Conroe acquisition is consistent with our acquisition model of high growth areas, strong management and excellent earnings opportunity Provides diversification and fits well into our footprint Management and Board share same values to outstanding customer service
*As of Dec. 31, 2014
43
Conroe – Main Facility
44
Conroe— Westview Branch
45
Cut and Shoot Branch
46
Huntsville Branch
47
Willis Branch
48
Montgomery Branch
49
Magnolia Branch
50
Creekside Branch—Tomball
51
FIRST FINANCIAL BANKSHARES, INC. TM
A Family of community Banks
52
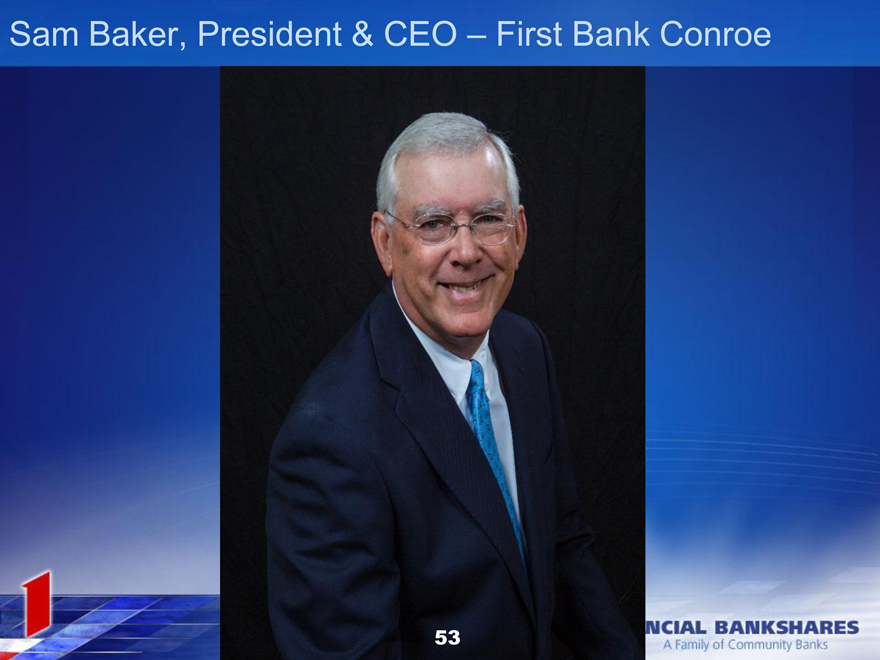
Sam Baker, President & CEO – First Bank Conroe
53
First Bank, Conroe
Jay Shands, Chairman of the Board Trey Denman, Director Sam Baker, President & CEO Bart Griffith, EVP & Chief Lending Officer Jed Crow, EVP Lending Lee Warren, SVP & Chief Operations Officer
54
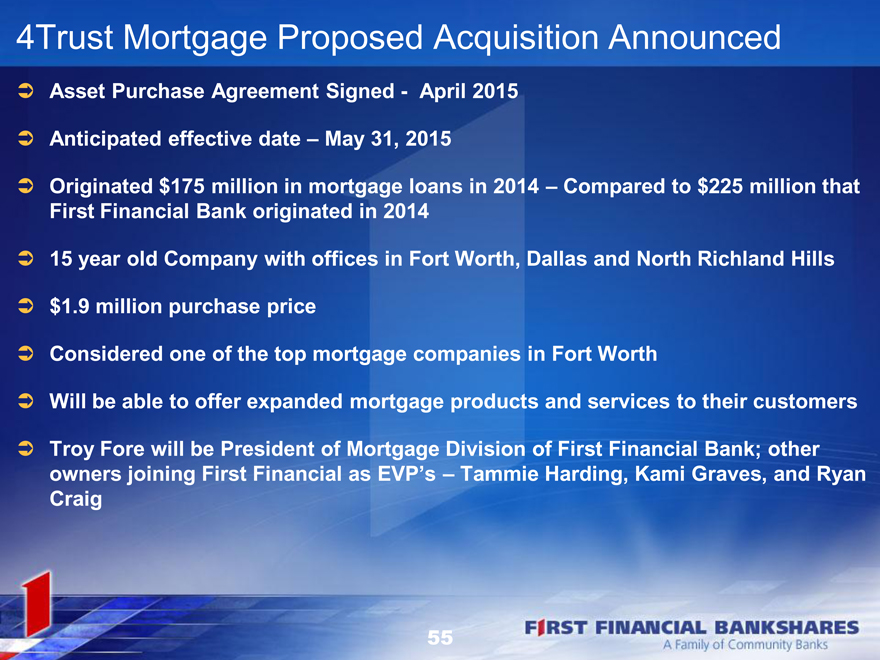
4Trust Mortgage Proposed Acquisition Announced
Asset Purchase Agreement Signed— April 2015
Anticipated effective date – May 31, 2015
Originated $175 million in mortgage loans in 2014 – Compared to $225 million that First Financial Bank originated in 2014
15 year old Company with offices in Fort Worth, Dallas and North Richland Hills $1.9 million purchase price Considered one of the top mortgage companies in Fort Worth Will be able to offer expanded mortgage products and services to their customers
Troy Fore will be President of Mortgage Division of First Financial Bank; other owners joining First Financial as EVP’s – Tammie Harding, Kami Graves, and Ryan
Craig
55
4Trust Management – Kami, Ryan, Troy & Tammie
56
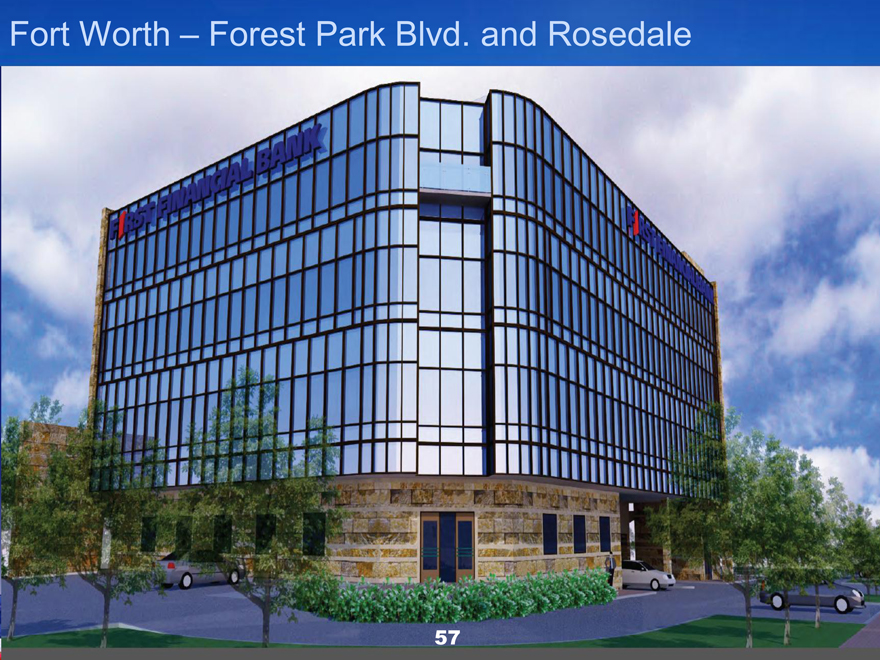
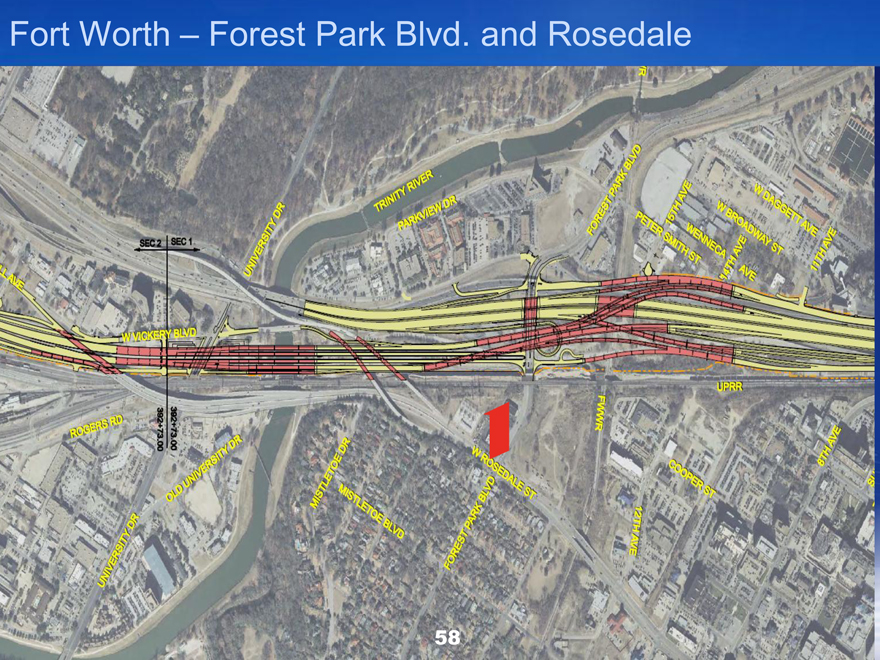
Fort Worth – Forest Park Blvd. and Rosedale
57
Fort Worth – Forest Park Blvd. and Rosedale
58
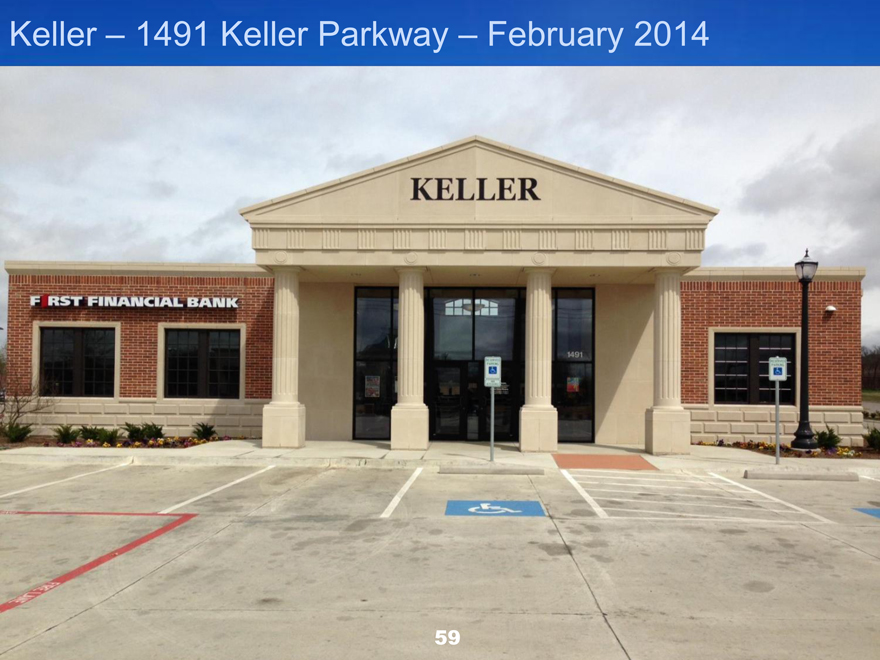
Keller – 1491 Keller Parkway – February 2014
59
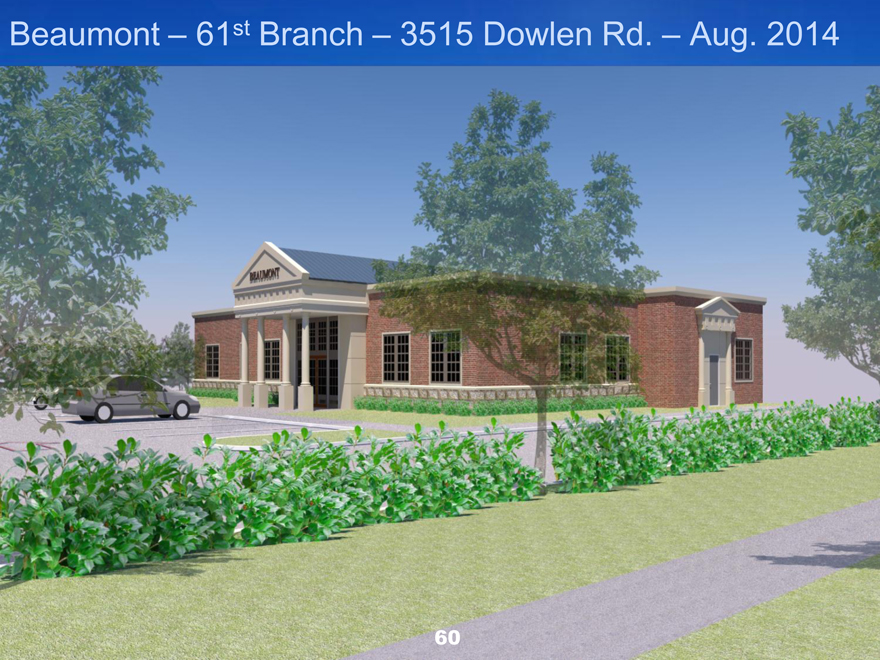
Beaumont – 61st Branch – 3515 Dowlen Rd. – Aug. 2014
60
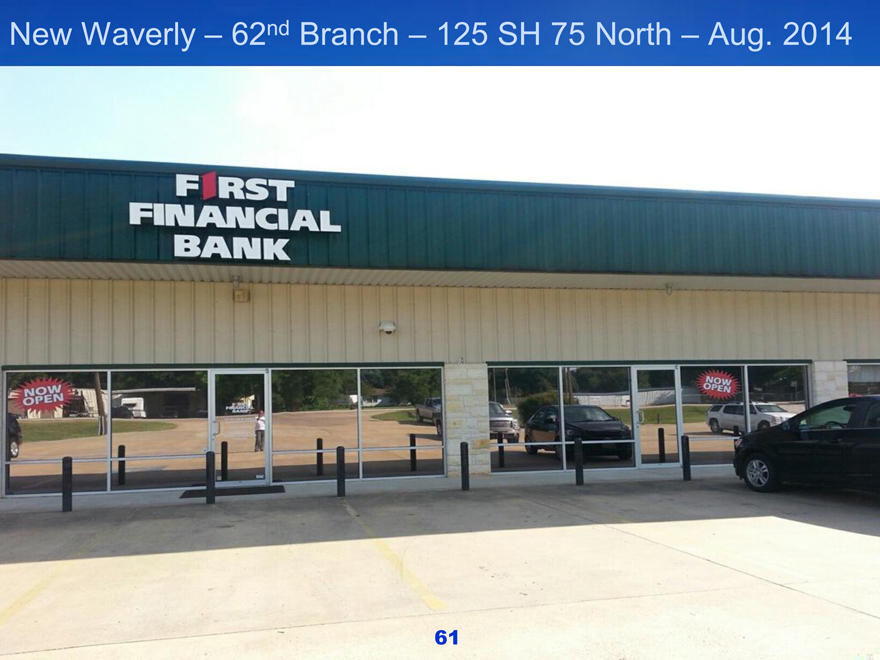
New Waverly – 62nd Branch – 125 SH 75 North – Aug. 2014
61
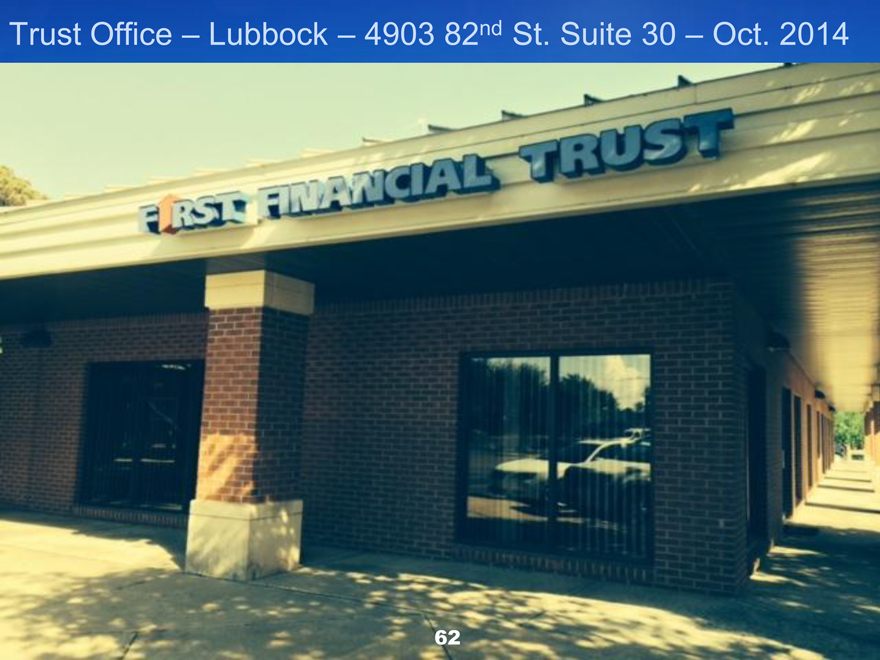
Trust Office – Lubbock – 4903 82nd St. Suite 30 – Oct. 2014
62
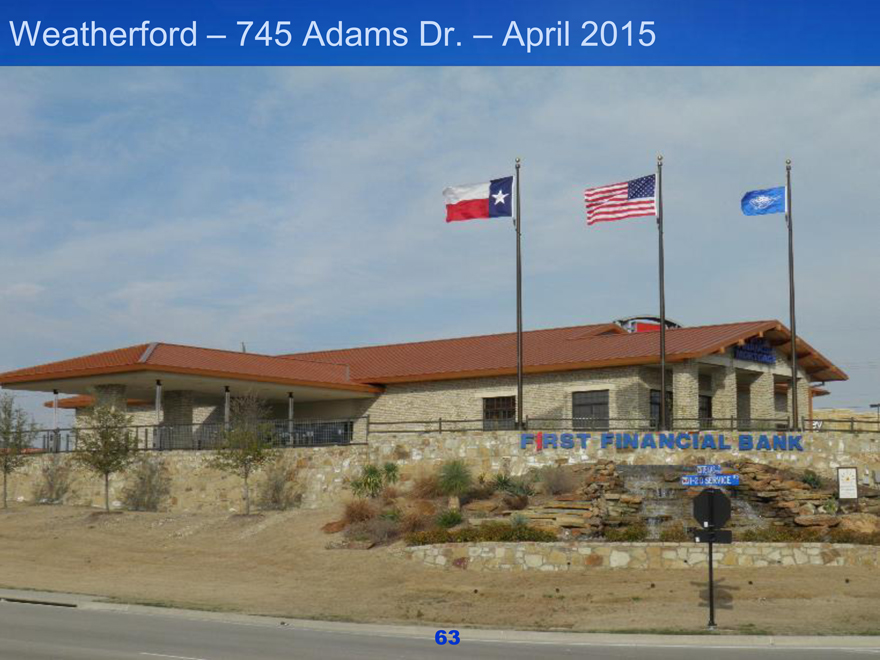
Weatherford – 745 Adams Dr. – April 2015
63
Odessa – Billy Hext Road & Eastridge
64
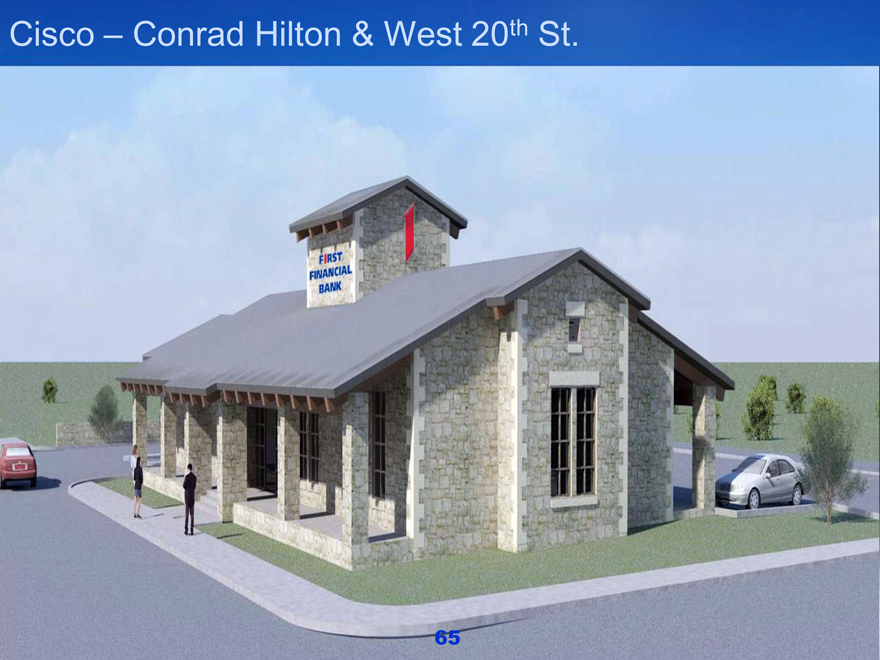
Cisco – Conrad Hilton & West 20th St.
65
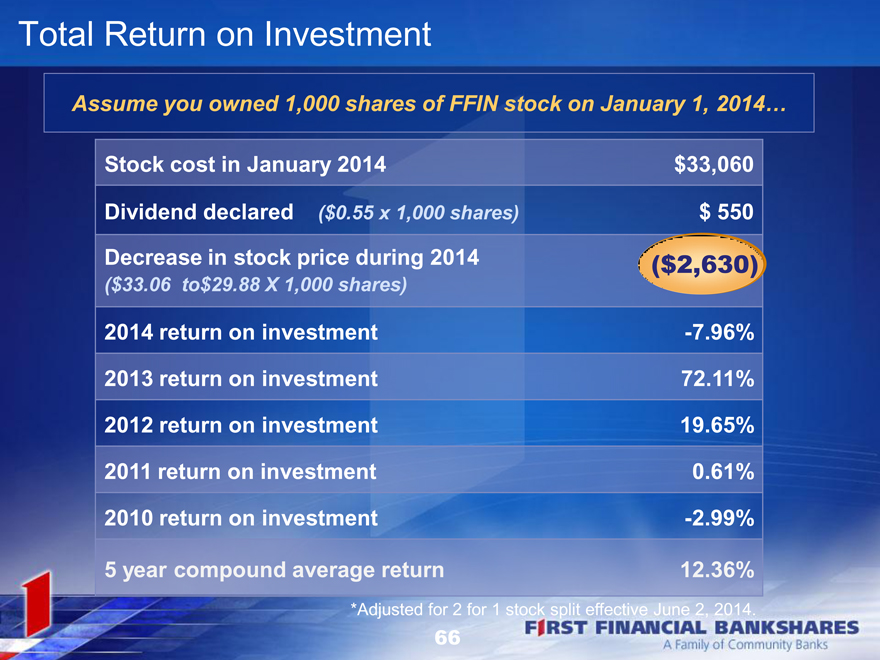
Total Return on Investment
Assume you owned 1,000 shares of FFIN stock on January 1, 2014…
Stock cost in January 2014 $33,060
Dividend declared ($0.55 x 1,000 shares) $ 550
Decrease in stock price during 2014 $ ($ 2210,720 2,630)
($33.06 to$29.88 X 1,000 shares)
2014 return on investment -7.96%
2013 return on investment 72.11%
2012 return on investment 19.65%
2011 return on investment 0.61%
2010 return on investment -2.99%
5 year compound average return 12.36%
*Adjusted for 2 for 1 stock split effective June 2, 2014.
66
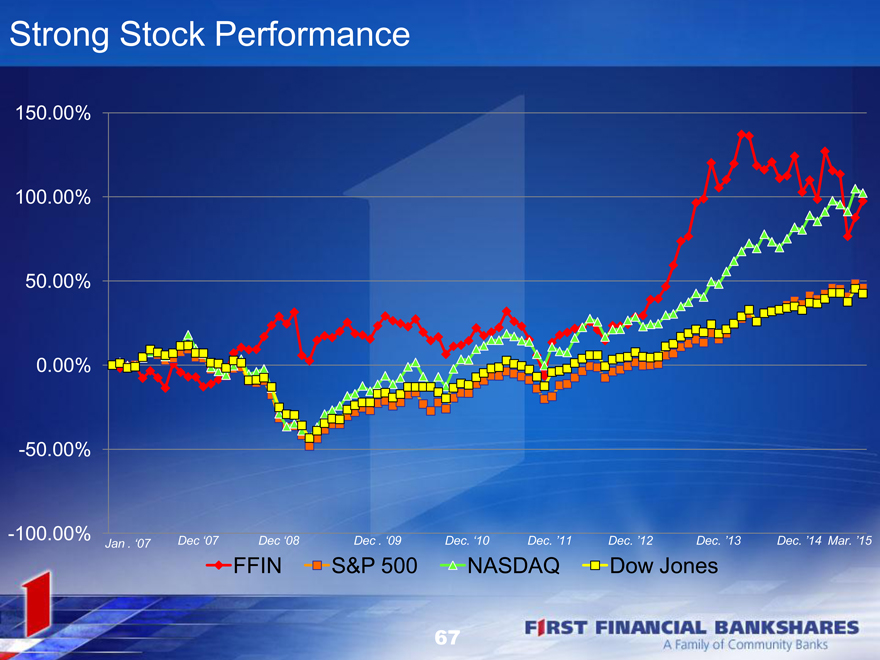
Strong Stock Performance
150.00%
100.00%
50.00%
0.00%
-50.00%
-100.00% Jan . ‘07 Dec ‘07 Dec ‘08 Dec . ‘09 Dec. ‘10 Dec. ’11 Dec. ’12 Dec. ’13 Dec. ’14 Mar. ’15
FFIN S&P 500 NASDAQ Dow Jones
67
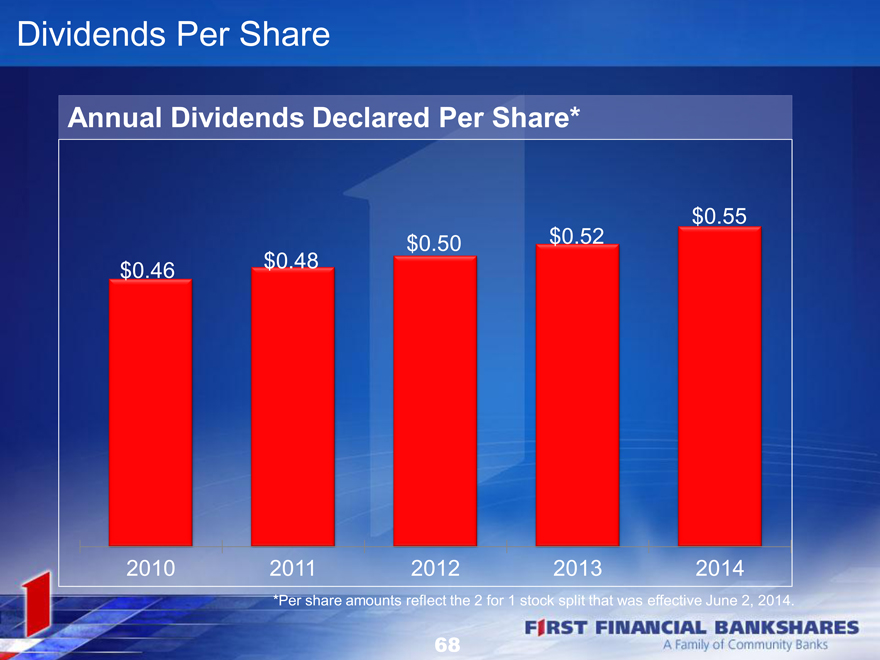
Dividends Per Share
Annual Dividends Declared Per Share*
$0.55
$0.50 $0.52
$0.46 $0.48
2010 2011 2012 2013 2014
*Per share amounts reflect the 2 for 1 stock split that was effective June 2, 2014.
68
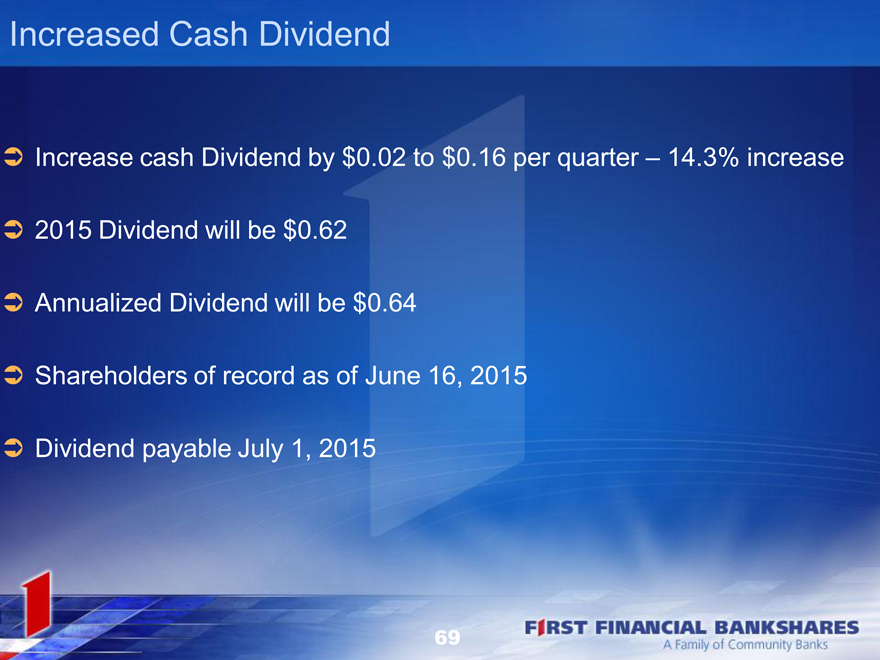
Increased Cash Dividend
Increase cash Dividend by $0.02 to $0.16 per quarter – 14.3% increase 2015 Dividend will be $0.62 Annualized Dividend will be $0.64 Shareholders of record as of June 16, 2015 Dividend payable July 1, 2015
69
Thank you for 125 years of allowing us to put You First.