Exhibit 99.1

2016 Annual Shareholder Meeting
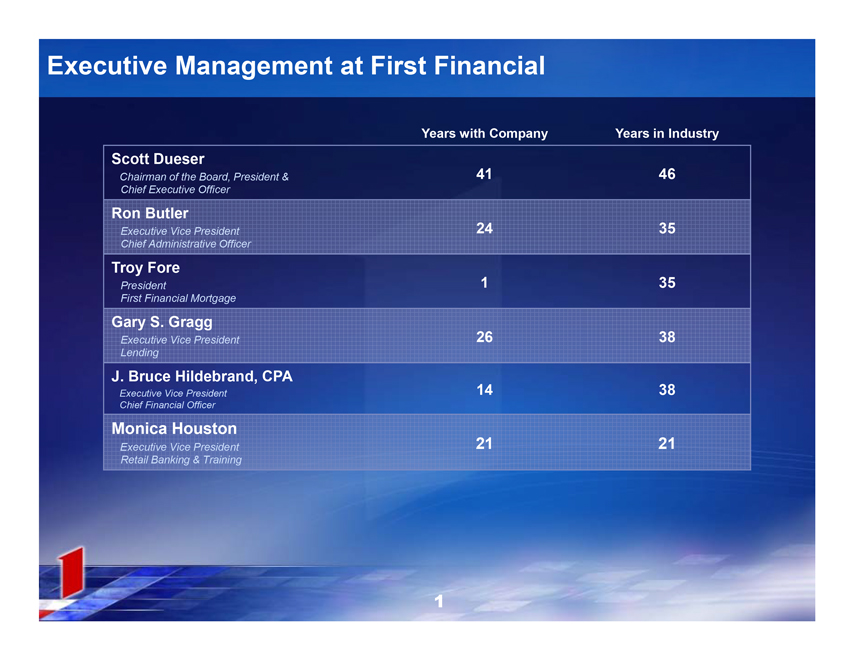
Executive Management at First Financial
Years with Company Years in Industry
Scott Dueser
Chairman of the Board, President & 41 46
Chief Executive Officer
Ron Butler
Executive Vice President 24 35
Chief Administrative Officer
Troy Fore
President 1 35
First Financial Mortgage
Gary S. Gragg
Executive Vice President 26 38
Lending
J. Bruce Hildebrand, CPA
Executive Vice President 14 38
Chief Financial Officer
Monica Houston
Executive Vice President 21 21
Retail Banking & Training
1
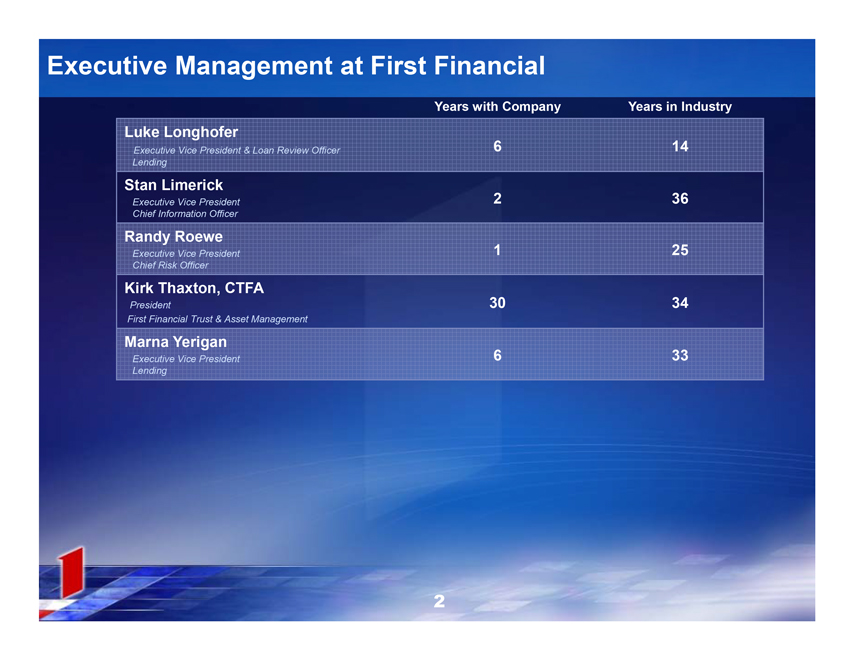
Executive Management at First Financial
Years with Company Years in Industry
Luke Longhofer
Executive Vice President & Loan Review Officer Lending 6 14
Stan Limerick
Executive Vice President 2 36
Chief Information Officer
Randy Roewe
Executive Vice President 1 25
Chief Risk Officer
Kirk Thaxton, CTFA
President 30 34
First Financial Trust & Asset Management
Marna Yerigan
Executive Vice President 6 33
Lending
2
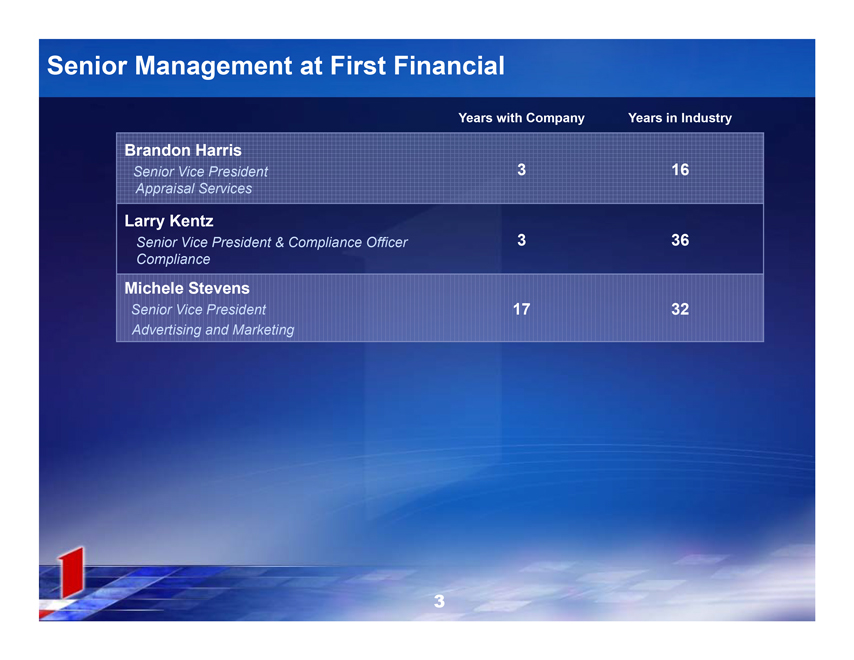
Senior Management at First Financial
Years with Company Years in Industry
Brandon Harris
Senior Vice President 3 16
Appraisal Services
Larry Kentz
Senior Vice President & Compliance Officer 3 36
Compliance
Michele Stevens
Senior Vice President 17 32
Advertising and Marketing
3
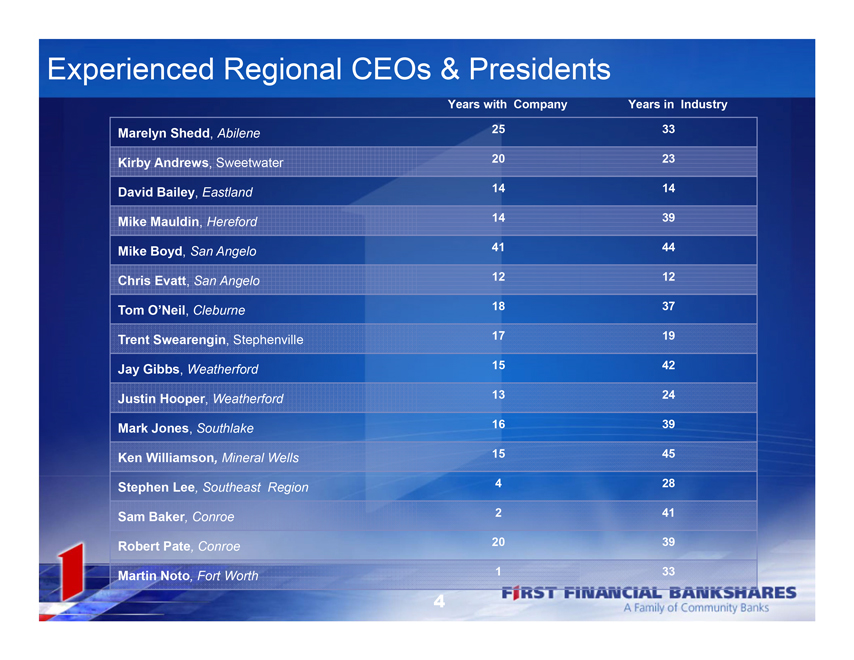
Experienced Regional CEOs & Presidents
Years with Company Years in Industry
Marelyn Shedd, Abilene 25 33
Kirby Andrews, Sweetwater 20 23
David Bailey, Eastland 14 14
Mike Mauldin, Hereford 14 39
Mike Boyd, San Angelo 41 44
Chris Evatt, San Angelo 12 12
Tom O’Neil, Cleburne 18 37
Trent Swearengin, Stephenville 17 19
Jay Gibbs, Weatherford 15 42
Justin Hooper, Weatherford 13 24
Mark Jones, Southlake 16 39
Ken Williamson, Mineral Wells 15 45
Stephen Lee, Southeast Region 4 28
Sam Baker, Conroe 2 41
Robert Pate, Conroe 20 39
Martin Noto, Fort Worth 1 33
FIRST FINANCIAL BANKSHARES
A Family of Community Banks
4

FIRST FINANCIAL BANKSHARES INC. TM
Independent Public Auditors
EY Building a better working world
6

FIRST FINANCIAL BANKSHARES INC. TM
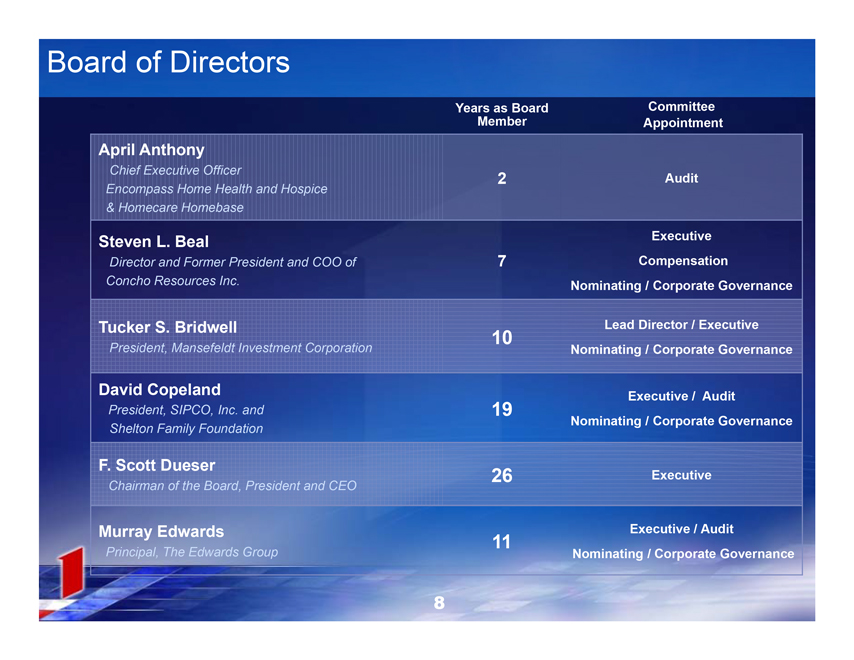
Board of Directors
Years as Board Member
Committee Appointment
April Anthony
Chief Executive Officer
2
Audit
Encompass Home Health and Hospice & Homecare Homebase
Steven L. Beal Director and Former President and COO of Concho Resources Inc.
7
Executive Compensation Nominating / Corporate Governance
Tucker S. Bridwell
10
Lead Director / Executive
President, Mansefeldt Investment Corporation
Nominating / Corporate Governance
David Copeland
Executive / Audit
President, SIPCO, Inc. and Shelton Family Foundation
19
Nominating / Corporate Governance
F. Scott Dueser
26
Executive
Chairman of the Board, President and CEO Murray Edwards
11
Executive / Audit
Principal, The Edwards Group
Nominating / Corporate Governance
8
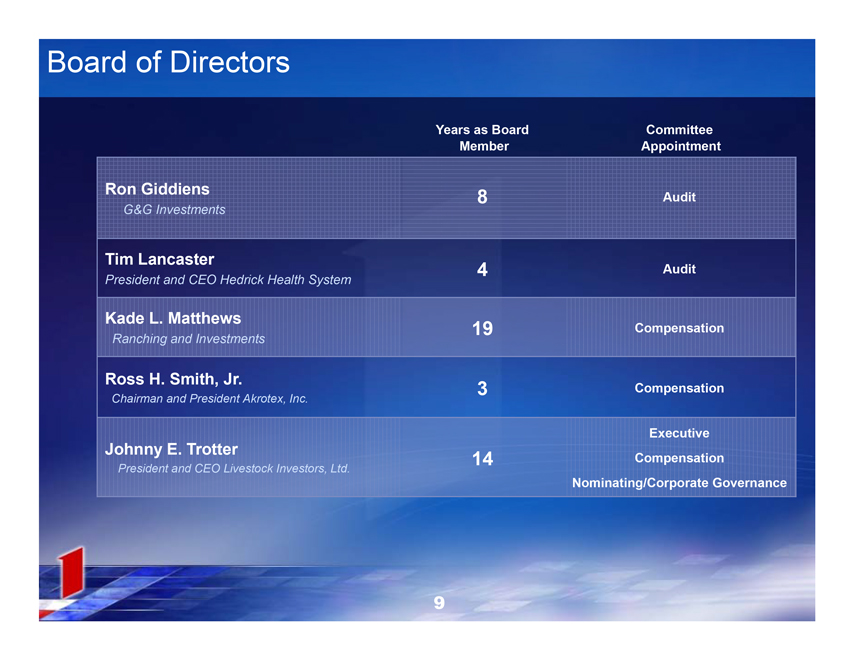
Board of Directors
Years as Board Member
Committee Appointment
Ron Giddiens
8
Audit
G&G Investments
Tim Lancaster
4
Audit
President and CEO Hedrick Health System
Kade L. Matthews
19
Compensation
Ranching and Investments
Ross H. Smith, Jr.
3
Compensation
Chairman and President Akrotex, Inc.
Executive
Johnny E. Trotter
14
Compensation
President and CEO Livestock Investors, Ltd.
Nominating/Corporate Governance
9

FIRST FINANCIAL BANKSHARES, INC. TM
FIRST FINANCIAL BANKSHARES, INC. TM
Forward Looking Statement
The numbers, as of and for the three months ended March 31, 2017, contained within this presentation are unaudited. Certain statements contained herein may be considered “forward-looking statements” as defined in the Private Securities Litigation Reform Act of 1995. These statements are based upon the belief of the Company’s management, as well as assumptions made beyond information currently available to the Company’s management and, may be, but not necessarily are identified by such words as “expect”, “plan”, “anticipate”, “target”, “forecast” and “goal”. Because such “forward-looking statements” are subject to risks and uncertainties, actual results may differ materially from those expressed or implied by such forward-looking statements. Factors that could cause actual results to differ materially from the Company’s expectations include competition from other financial institutions and financial holding companies; the effects of and changes in trade, monetary and fiscal policies and laws, including interest rate policies of the Federal Reserve Board; changes in the demand for loans; fluctuations in value of collateral and loan reserves; inflation, interest rate, market and monetary fluctuations; changes in consumer spending, borrowing and savings habits; and acquisitions and integration of acquired businesses, and similar variables. Other key risks are described in the Company’s reports filed with the Securities and Exchange Commission, which may be obtained under “Investor Relations-Documents/Filings” on the Company’s web site or by writing or calling the Company at 325.627.7155. The Company does not undertake any obligation to update publicly or revise any forward-looking statements herein because of new information, future events or otherwise.
2016 Financial Review

Earnings

30th Consecutive Year of Increased Earnings
FFIN Earnings (in millions)
$68.4 $74.2 $78.9 $89.6 $100.4 $104.8
2011 2012 2013 2014 2015 2016
14
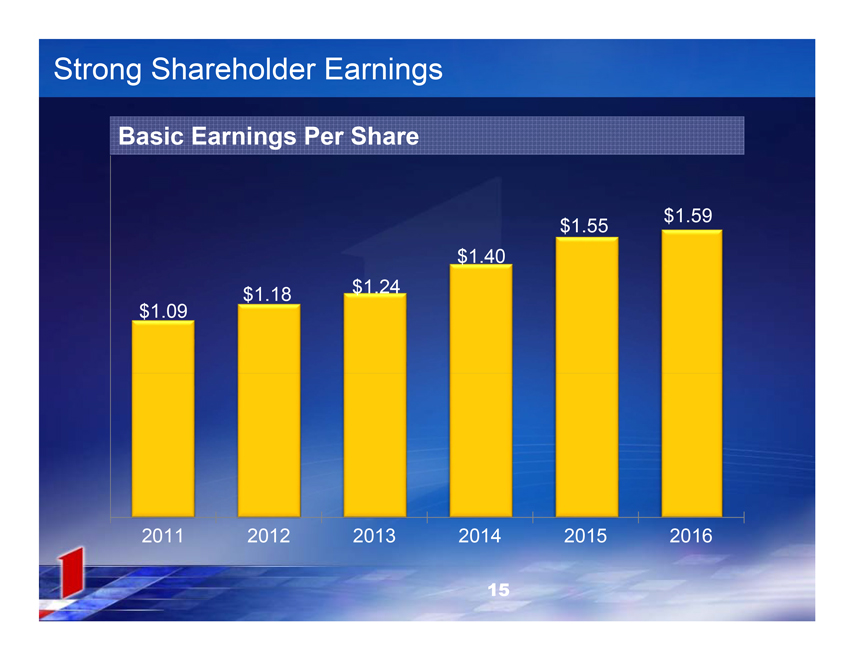
Strong Shareholder Earnings
Basic Earnings Per Share
$1.09 $1.18 $1.24 $1.40 $1.55 $1.59
2011 2012 2013 2014 2015 2016
15

Working Harder and Smarter
Efficiency Ratio (FFIN vs. Peers)
2011 2012 2013 2014 2015 2016
First Financial 48.37% 48.14% 50.20% 49.24% 47.61% 49.22%
Peer Group 65.57% 65.77% 67.80% 66.94% 63.92% 62.83%
16
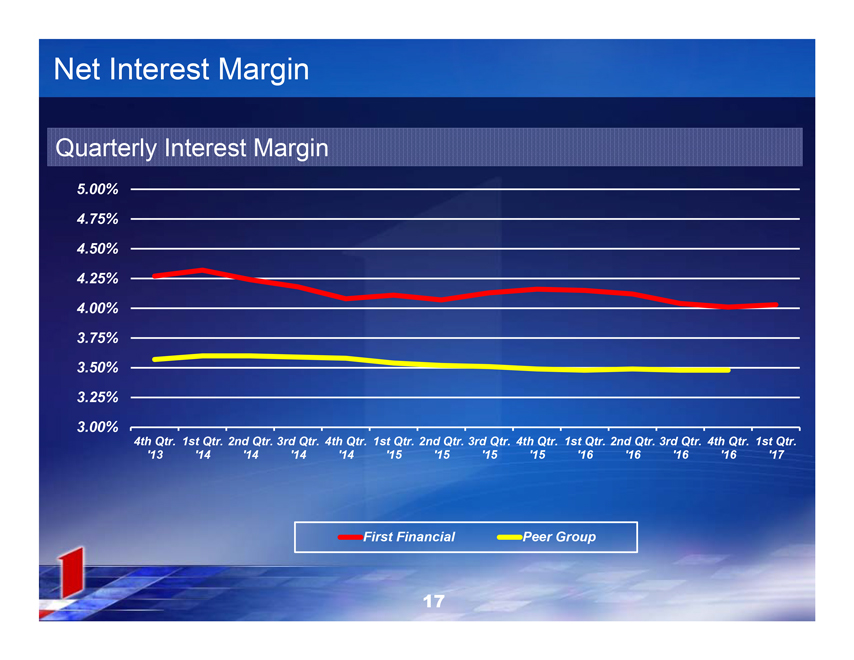
Net Interest Margin
Quarterly Interest Margin
5.00%
4.75%
4.50%
4.25%
4.00%
3.75%
3.50%
3.25%
3.00%
4th Qtr. 1st Qtr. 2nd Qtr. 3rd Qtr. 4th Qtr. 1st Qtr. 2nd Qtr. 3rd Qtr. 4th Qtr. 1st Qtr. 2nd Qtr. 3rd Qtr. 4th Qtr. 1st Qtr.
‘13 ’14 ‘14’14’14’15’15’15’15’16’16’16’16’17
First Financial Peer Group
17
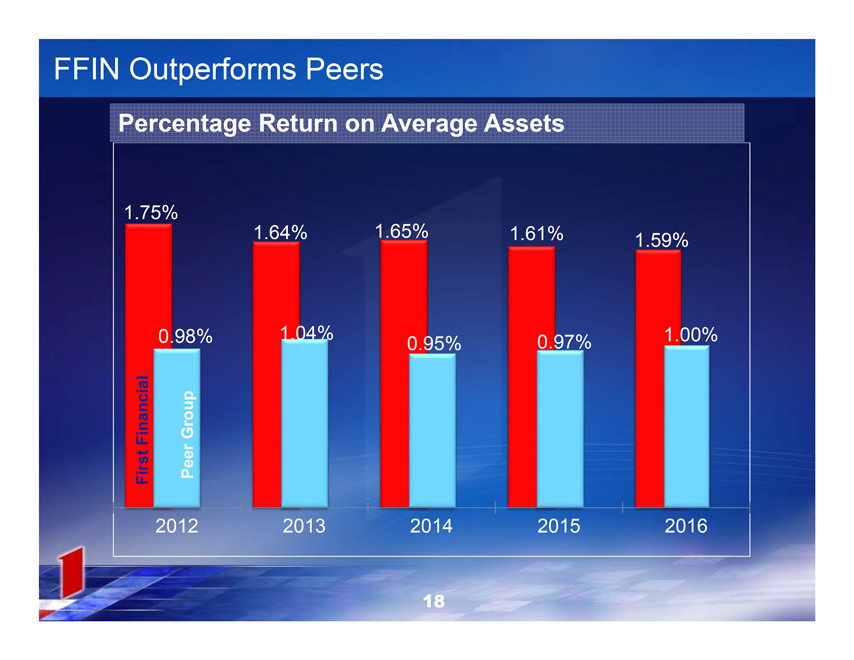
FFIN Outperforms Peers
Percentage Return on Average Assets
1.75% 1.64% 1.65% 1.61% 1.59%
0.98% 1.04% 0.95% 0.97% 1.00%
First Financial Peer Group
2012 2013 2014 2015 2016
18
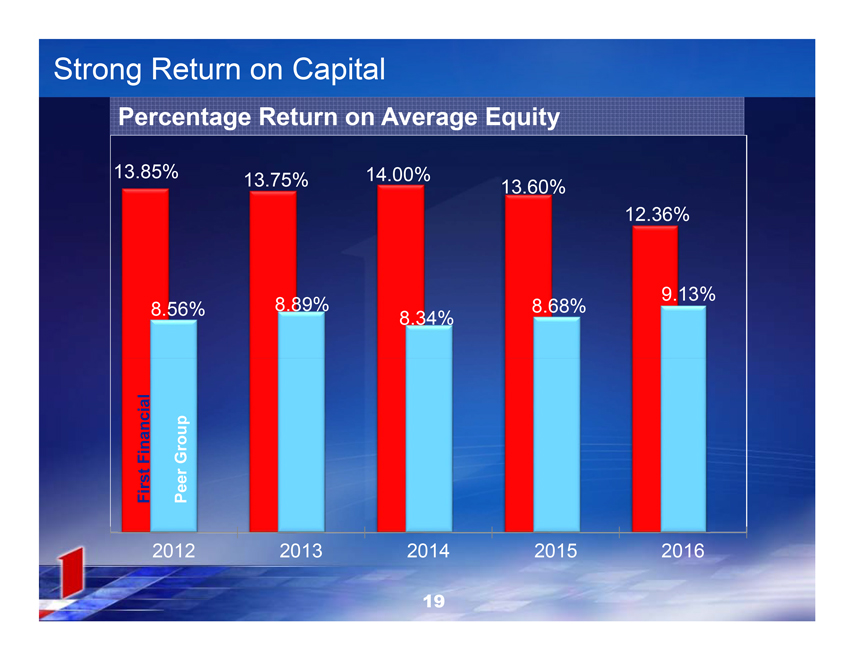
Strong Return on Capital
Percentage Return on Average Equity
13.85%
13.75%
14.00%
13.60%
12.36%
8.56%
8.89%
8.68%
9.13%
8.34%
First Financial
Peer Group
2012
2013
2014
2015
2016
19
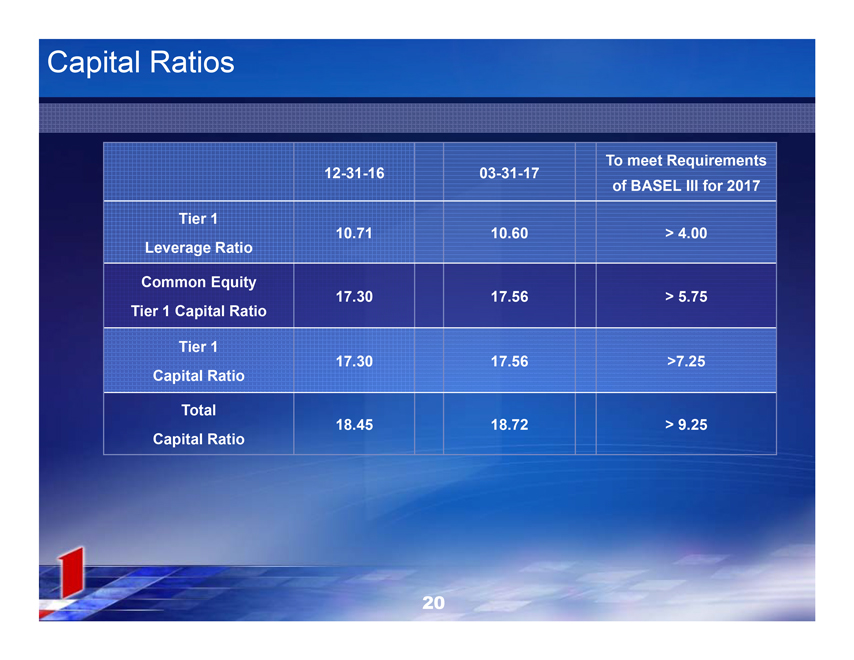
Capital Ratios
To meet Requirements
12-31-16
03-31-17
of BASEL III for 2017
Tier 1
10.71
10.60
> 4.00
Leverage Ratio
Common Equity
17.30
17.56
> 5.75
Tier 1 Capital Ratio
Tier 1
17.30
17.56
>7.25
Capital Ratio
Total
18.45
18.72
> 9.25
Capital Ratio
20
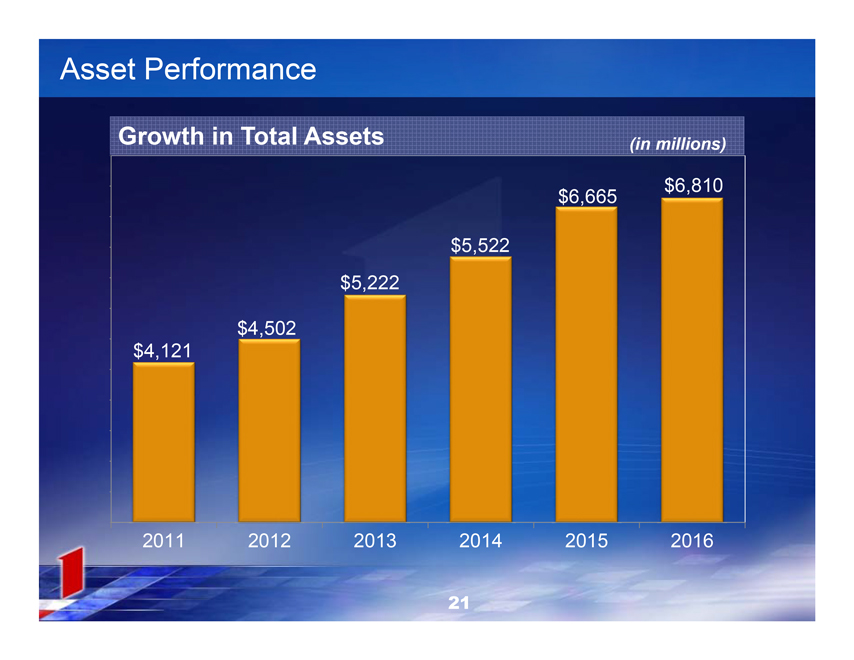
Asset Performance
Growth in Total Assets
(in millions)
$4,121
2011
$4,502
2012
$5,222
2013
$5,522
2014
$6,665
2015
$6,810
2016
21
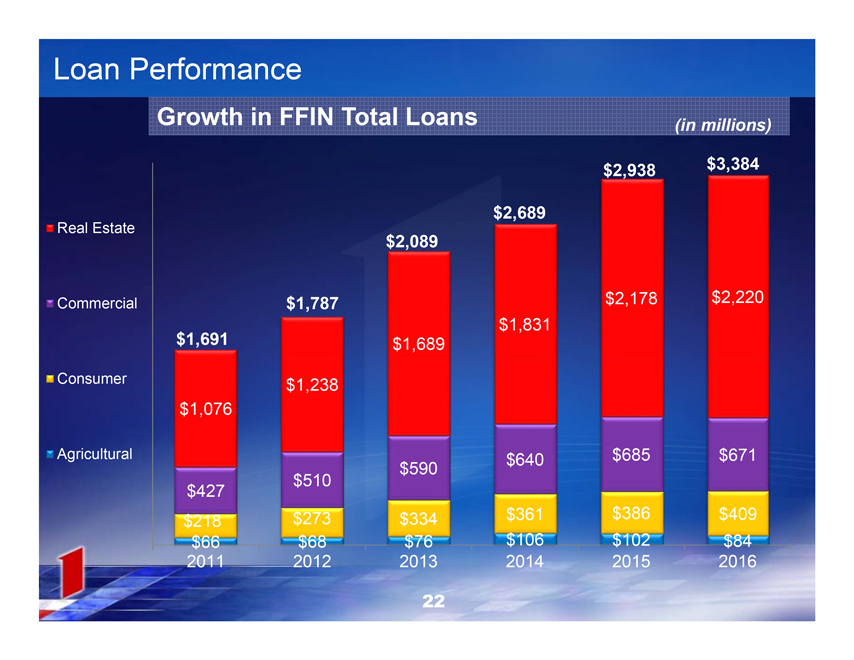
Loan Performance
Growth in FFIN Total Loans
(in millions)
Real Estate Commercial Consumer Agricultural
$1,691
$1,076
$427 $218 $66 2011
$1,787
$1,238
$510
$273 $68 2012
$2,089
$1,689
$590
$334 $76 2013
$2,689
$1,831
$640
$361 $106 2014
$2,938
$2,178
$685
$386 $102 2015
$3,384
$2,220
$671
$409 $84 2016
22
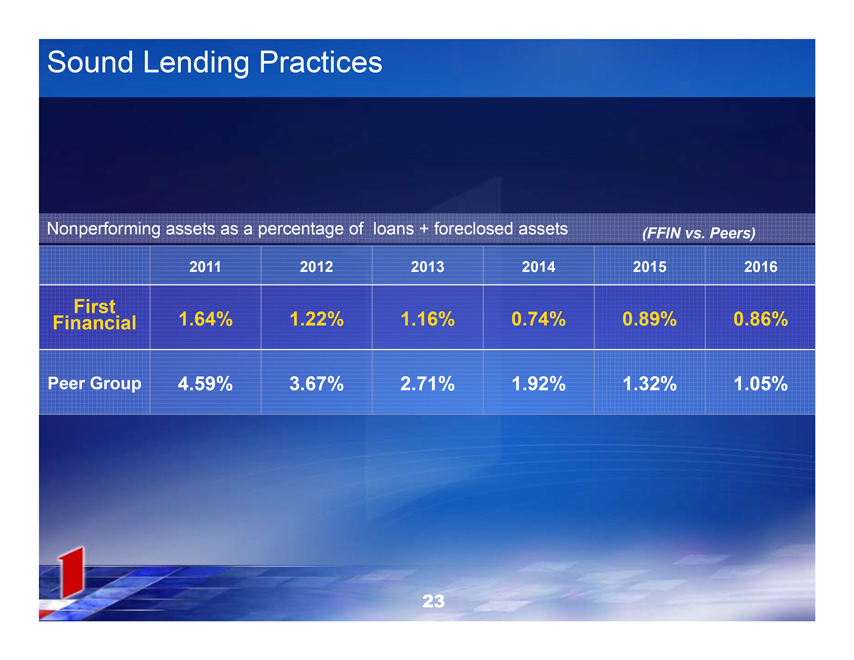
Sound Lending Practices
Nonperforming assets as a percentage of
loans + foreclosed assets
(FFIN vs. Peers)
2011
2012
2013
2014
2015
2016
First
Financial
1.64%
1.22%
1.16%
0.74%
0.89%
0.86%
Peer Group
4.59%
3.67%
2.71%
1.92%
1.32%
1.05%
23
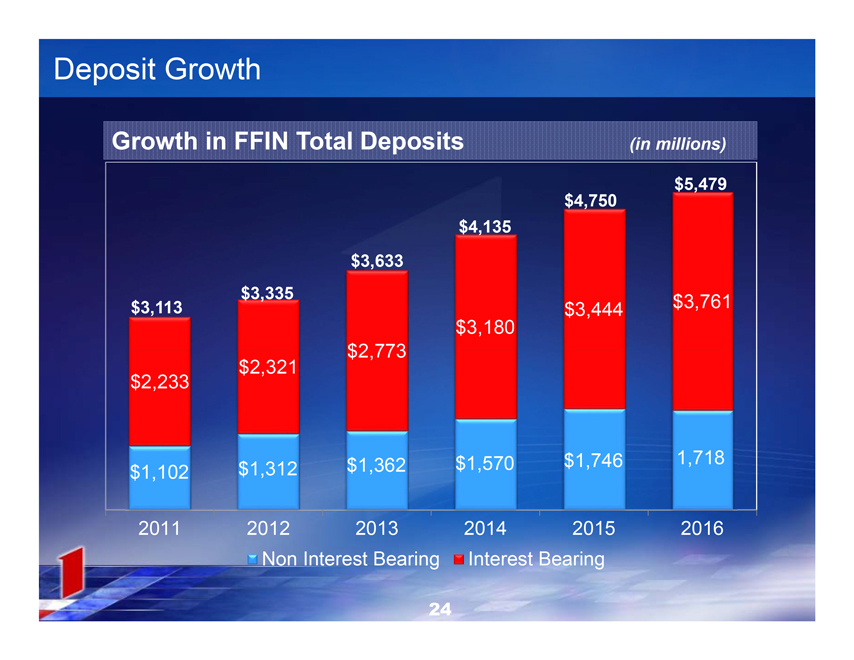
Deposit Growth
Growth in FFIN Total Deposits
(in millions)
$3,113
$2,233
$1,102
2011
$3,335
$2,321
$1,312
2012
$3,633
$2,773
$1,362
2013
$4,135
$3,180
$1,570
2014
$4,750
$3,444
$1,746
2015
$5,479
$3,761
1,718
2016
Non Interest Bearing Interest Bearing
24
1st Quarter 2017 Summary
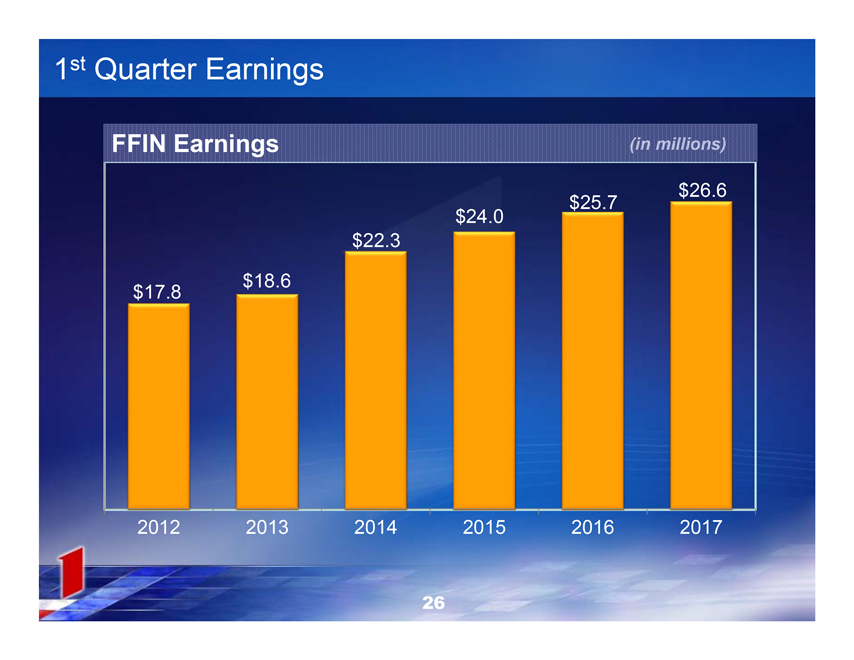
1st Quarter Earnings
FFIN Earnings
(in millions)
$17.8
2012
$18.6
2013
$22.3
2014
$24.0
2015
$25.7
2016
$26.6
2017
26
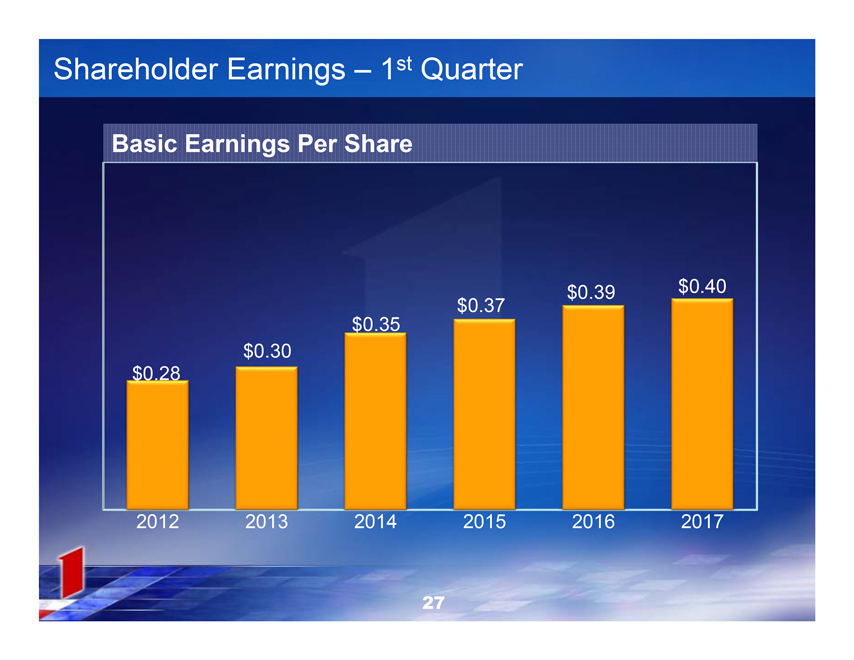
Shareholder Earnings – 1st Quarter
Basic Earnings Per Share
$0.28
2012
$0.30
2013
$0.35
2014
$0.37
2015
$0.39
2016
$0.40
2017
27

FIRST FINANCIAL TRUST&ASSET MANAGEMENT COMPANY NA
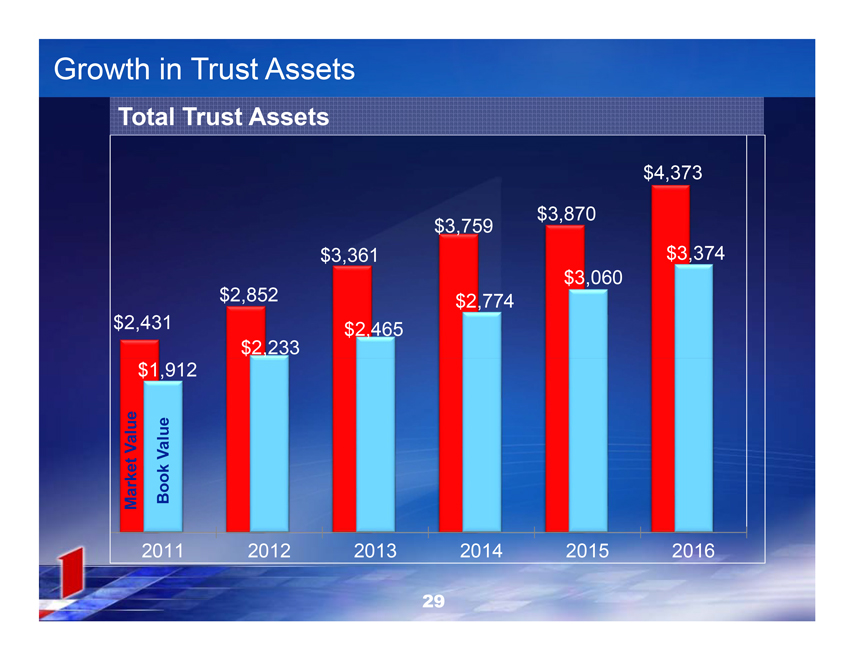
Growth in Trust Assets
Total Trust Assets
Market Value
2011 Book Value $1,912 $2,431
$2,852
$2,233
2012
$3,361
$2,465
2013
$3,759
$2,774
2014
$3,870
$3,060
2015
$4,373 $3,374 2016
29
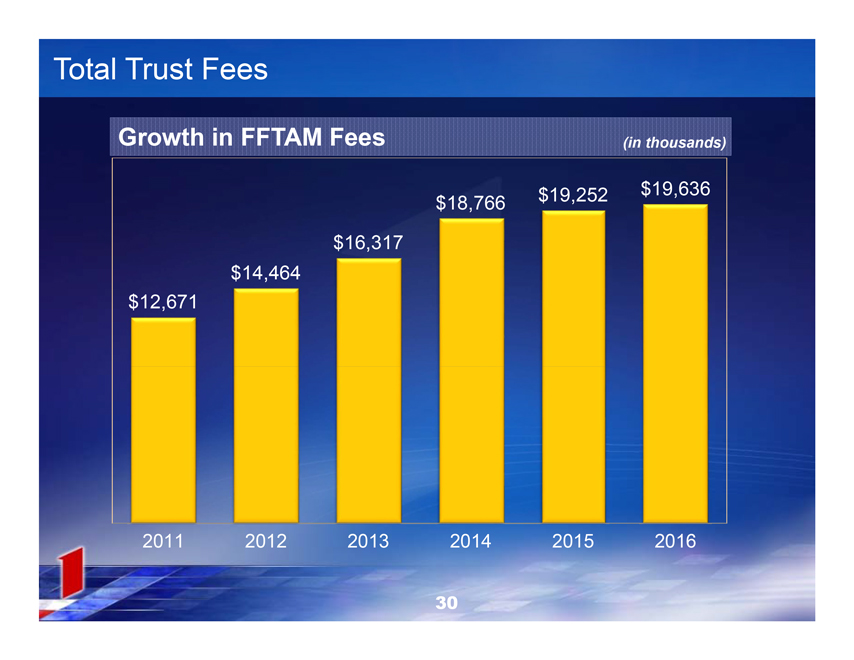
Total Trust Fees
Growth in FFTAM Fees
(in thousands)
$12,671
2011
$14,464
2012
$16,317
2013
$18,766
2014
$19,252
2015
$19,636
2016
30
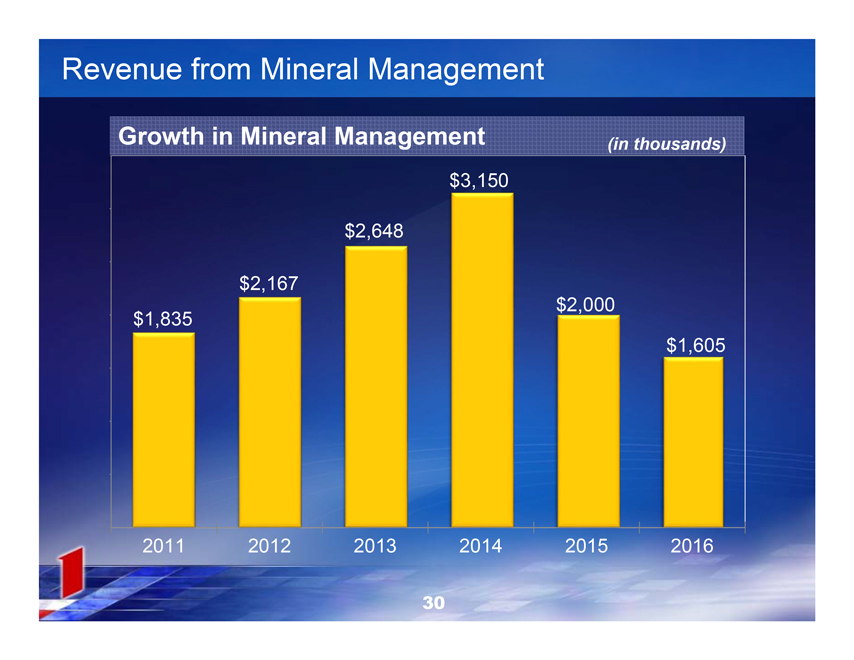
Revenue from Mineral Management
Growth in Mineral Management
(in thousands)
$1,835
2011
$2,167
2012
$2,648
2013
$3,150
2014
$2,000
2015
$1,605
2016
30
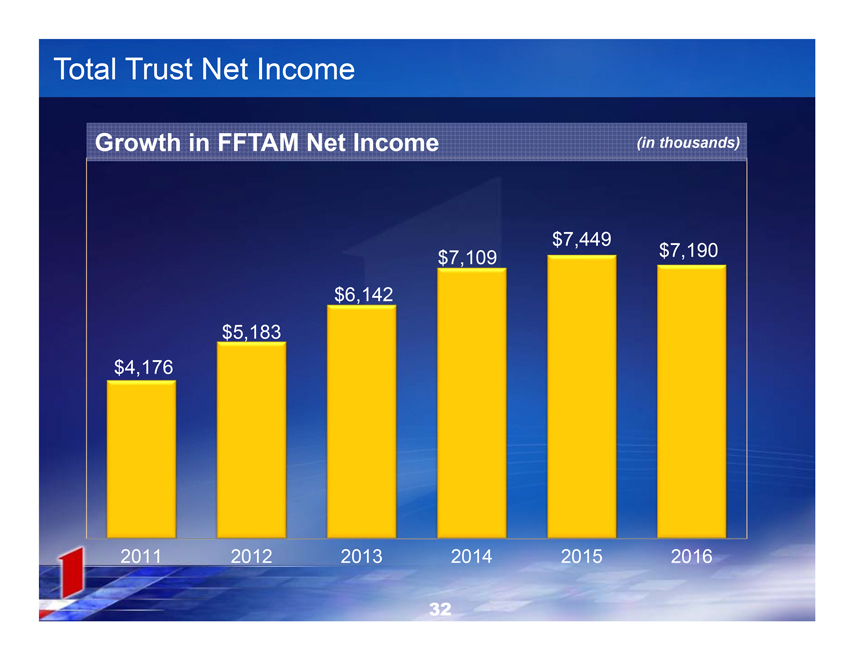
Total Trust Net Income
Growth in FFTAM Net Income
(in thousands)
$4,176
2011
$5,183
2012
$6,142
2013
$7,109
2014
$7,449
2015
$7,190
2016
32
Managed Equity Styles
Equity Income
Core Domestic
Core Diversified
Core World
Strategic Growth
33

FIRST FINANCIAL TRUST&ASSET MANAGEMENT COMPANYNA
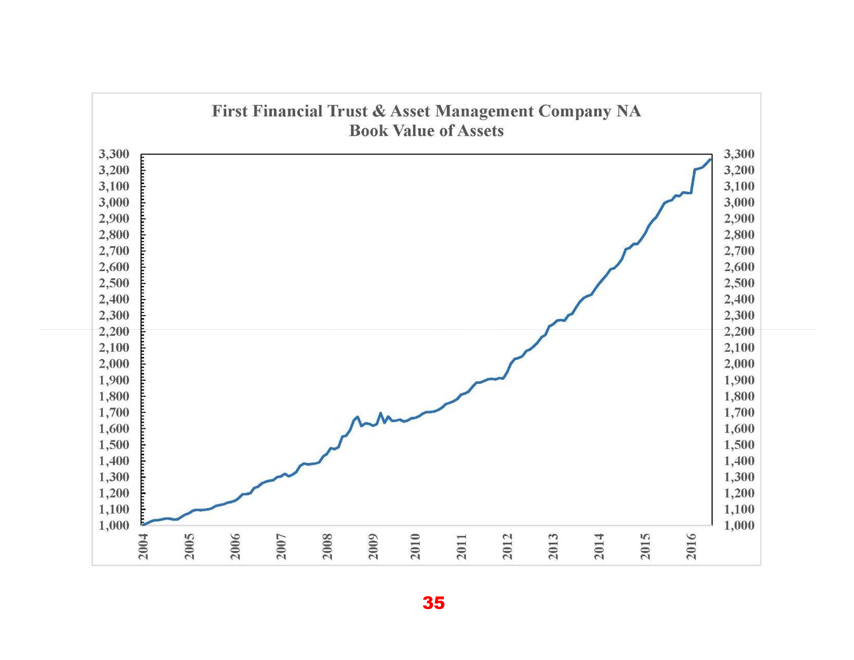
First Financial Trust&Asset Management Company NA
Book Value of Assets
3,300
3,200
3,100
3,000
2,900
2,800
2,700
2,600
2,500
2,400
2,300
2,200
2,100
2,000
1,900
1,800
1,700
1,600
1,500
1,400
1,300
1,200
1,100
1,000
2004
2005
2006
2007
2008
2009
2010
2011
2012
2013
2014
2015
2016
3,300
3,200
3,100
3,000
2,900
2,800
2,700
2,600
2,500
2,400
2,300
2,200
2,100
2,000
1,900
1,800
1,700
1,600
1,500
1,400
1,300
1,200
1,100
1,000
35

FIRST FINANCIAL TRUST&ASSET MANAGEMENT COMPANYNA

FIRST FINANCIAL BANKSHARES,INC.TM
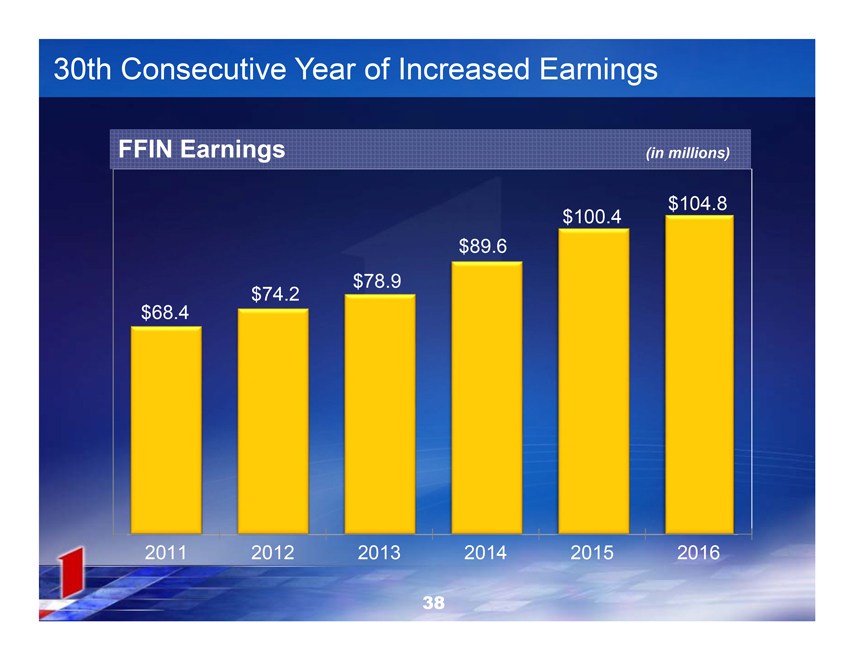
30th Consecutive Year of Increased Earnings
FFIN Earnings
(in millions)
$68.4
2011
$74.2
2012
$78.9
2013
$89.6
2014
$100.4
2015
$104.8
2016
38
Improvements for 2017
Grow Loans and Deposits
Grow Mortgage and Trust
Improve our interest rate margin
Increase our fee income
Control expenses
Improve credit quality
Make an acquisition
39
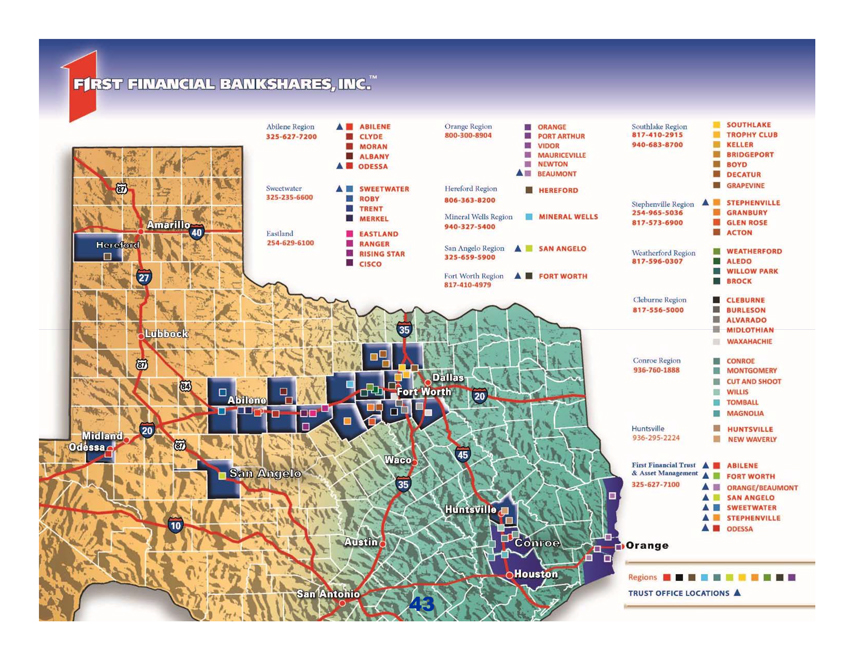
FIRST FINANCIAL BANKSHARES, INC. TM
Abilene Region 325-627-7200 ABILENE CLYDE MORAN ALBANY ODESSA
Sweetwater 325-235-6600 SWEETWATER ROBY TRENT MERKEL
Eastland 254-629-6100 EASTLAND RANGER RISING STAR CISCO
Orange Region 800-300-8904 ORANGE PORT ARTHUR VIDOR MAURICEVILLE NEWTON BEAUMONT
Hereford Region 806-363-8200 HEREFORD
Mineral Wells Region 940-327-5400 MINERAL WELLS
San Angelo Region 325-659-5900 SAN ANGELO
Fort Worth Region 817-410-4979 FORTH WORTH
Southlake Region 817-410-2915 940-683-8700 SOUTHLAKE TROPHY CLUB KELLER BRIDGEPORT BOYD DECATUR GRAPEVINE
Stephenville Region 254-965-5036 817-573-6900 STEPHENVILLE GRANBURY GLEN ROSE ACTON
Weatherford Region 817-596-0307 WEATHERFORD ALEDO WILLOW PARK BROCK
Cleburne Region 817-556-5000 CLEBURNE BURLESON ALVARADO MIDLOTHIAN WAXAHACHIE
Conroe Region 936-760-1888 CONROE MONTGOMERY CUT AND SHOOT WILLIS TOMBALL MAGNOLIA
Huntsville 936-295-2224 HUNTSVILLE NEW WAVERLY
First Financial Trust & Asset Management 325-627-7100 ABILENE FORT WORTH ORANGE/BEAUMONT SAN ANGELO SWEETWATER STEPHENVILLE ODESSA
Regions TRUST OFFICE LOCATIONS
43
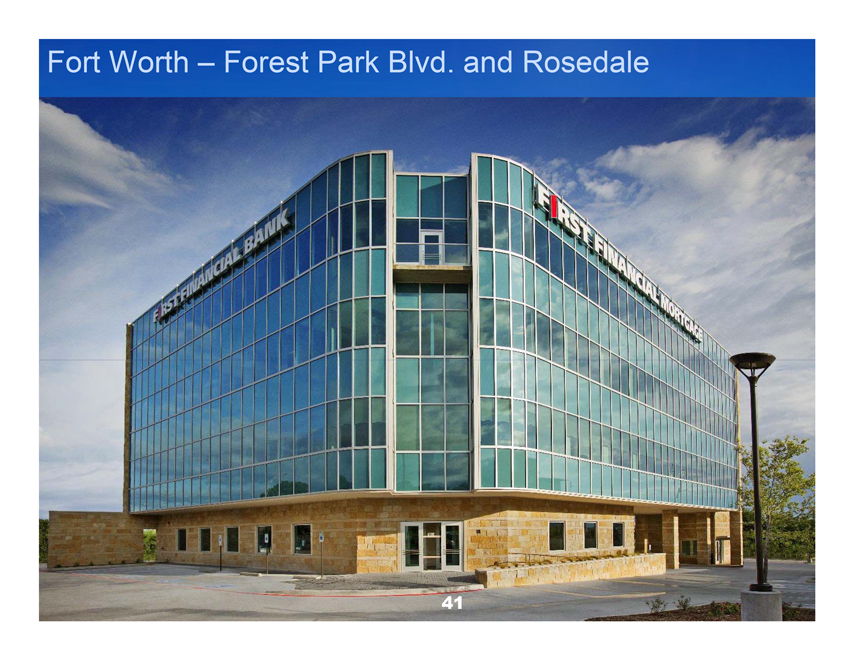
Forth Worth – Forest Park Blvd. and Rosedale
41
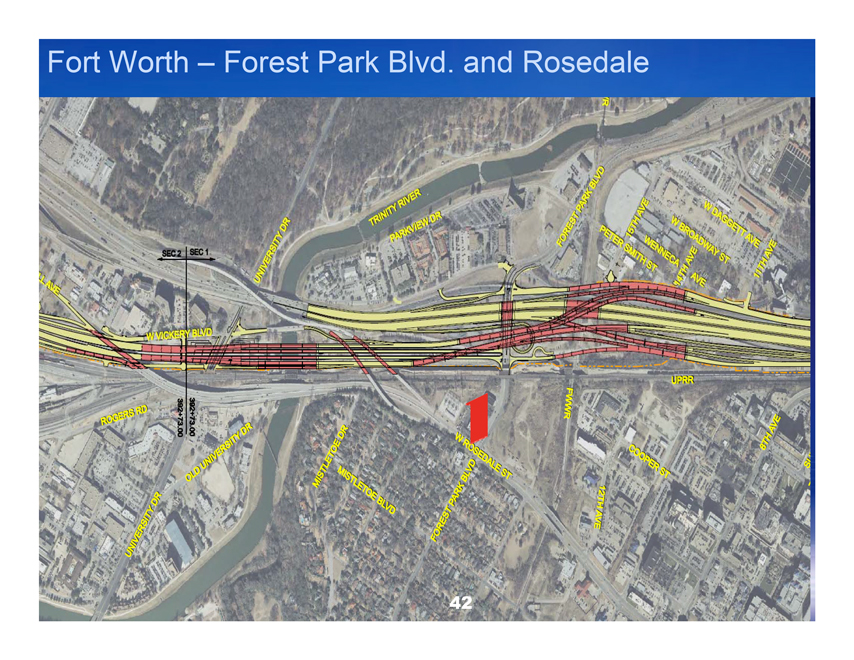
Fort Worth – Forest Park Blvd. and Rosedale
42
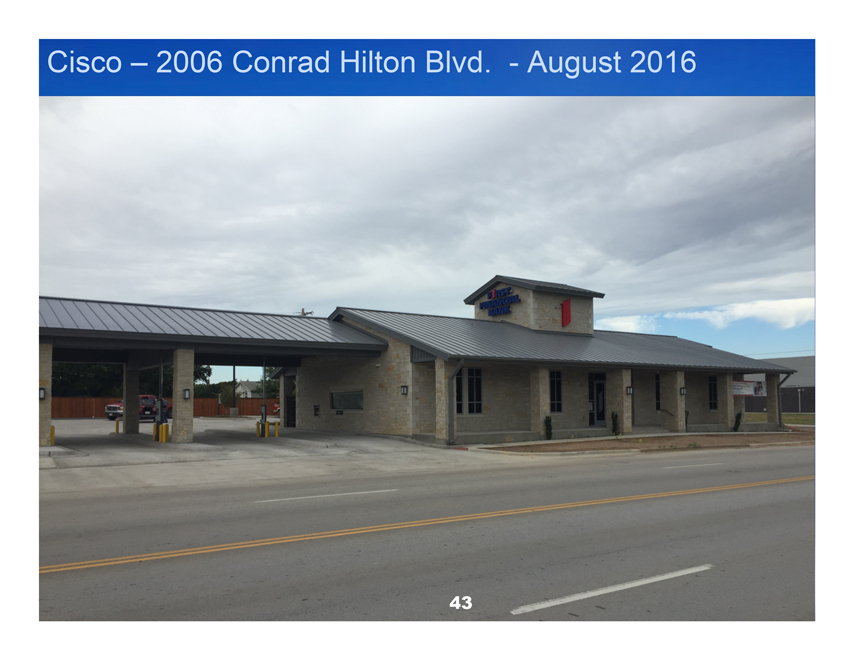
Cisco – 2006 Conrad Hilton Blvd. - August 2016
43
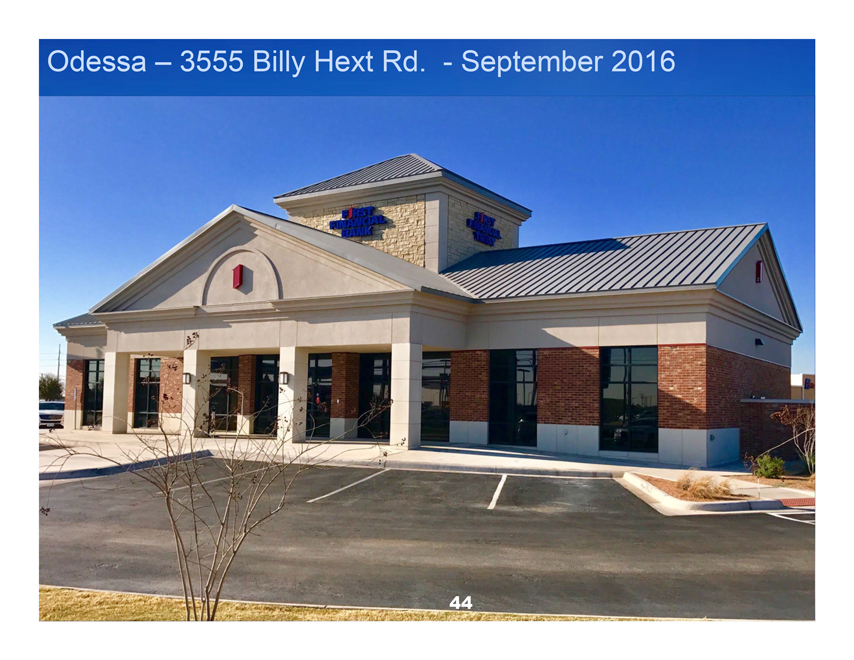
Odessa – 3555 Billy Hext Rd. - September 2016
44
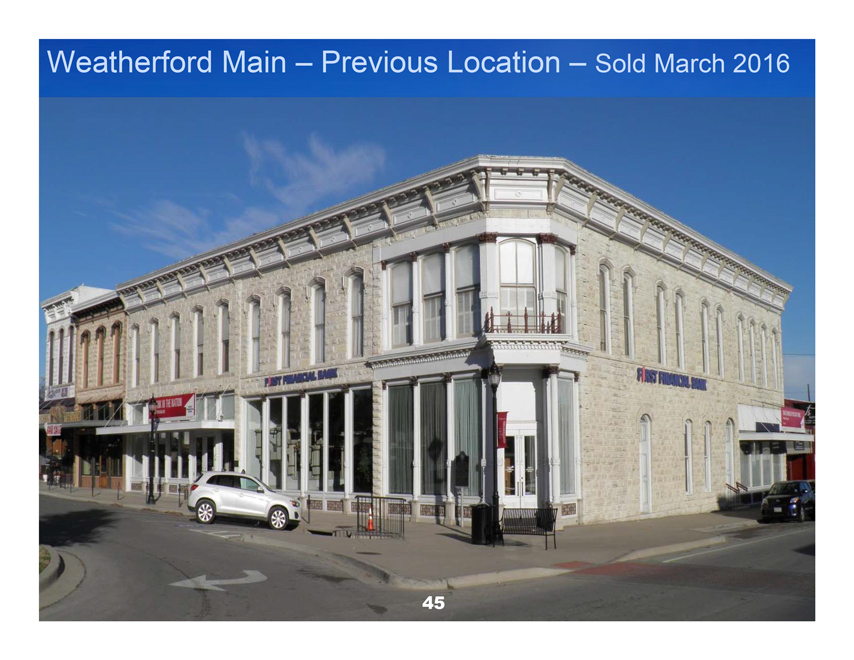
Weatherford Main – Previous Location – Sold March 2016
45
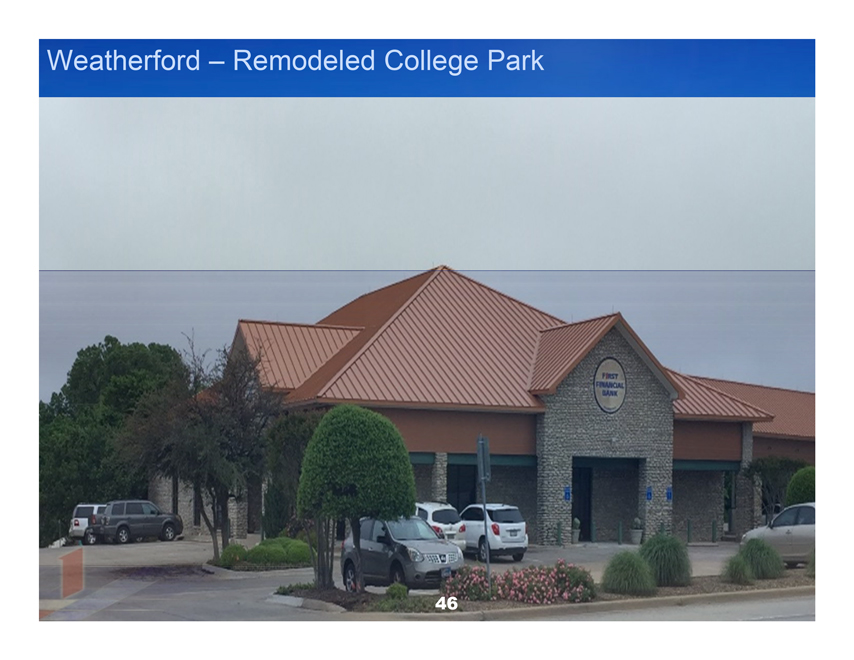
Weatherford – Remodeled College Park
46

San Angelo Main – Current Downtown Location
47
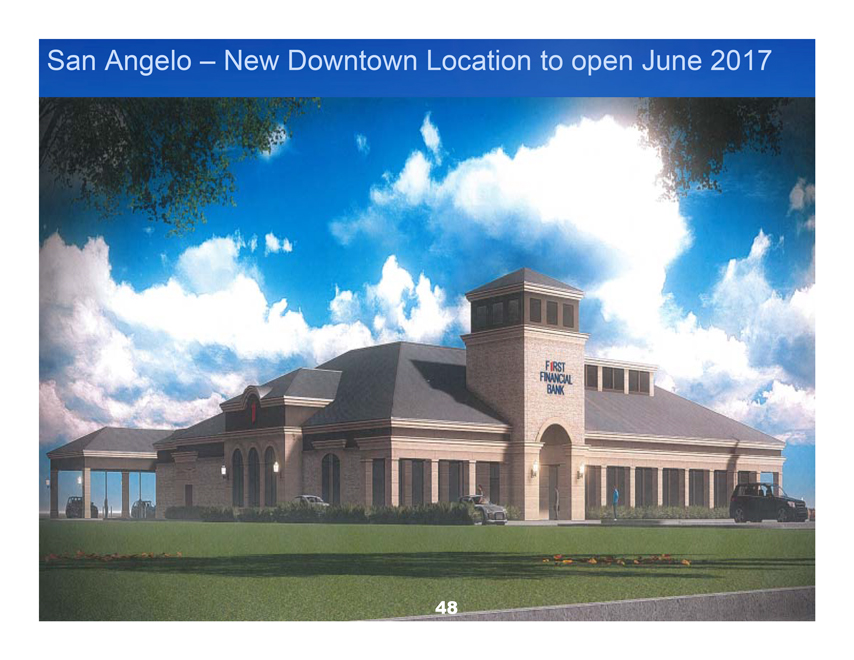
San Angelo – New Downtown Location to open June 2017
48
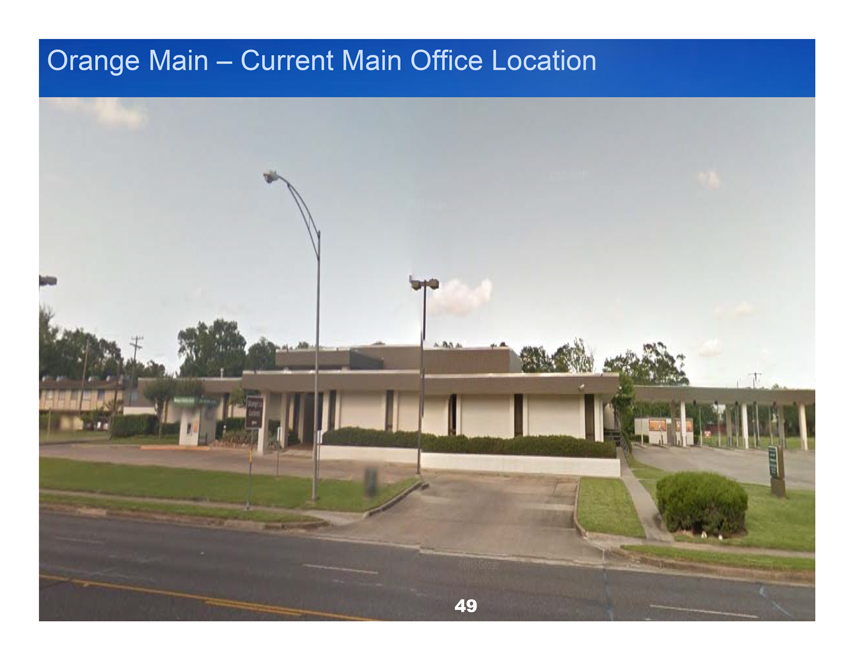
Orange Main – Current Main Office Location
49
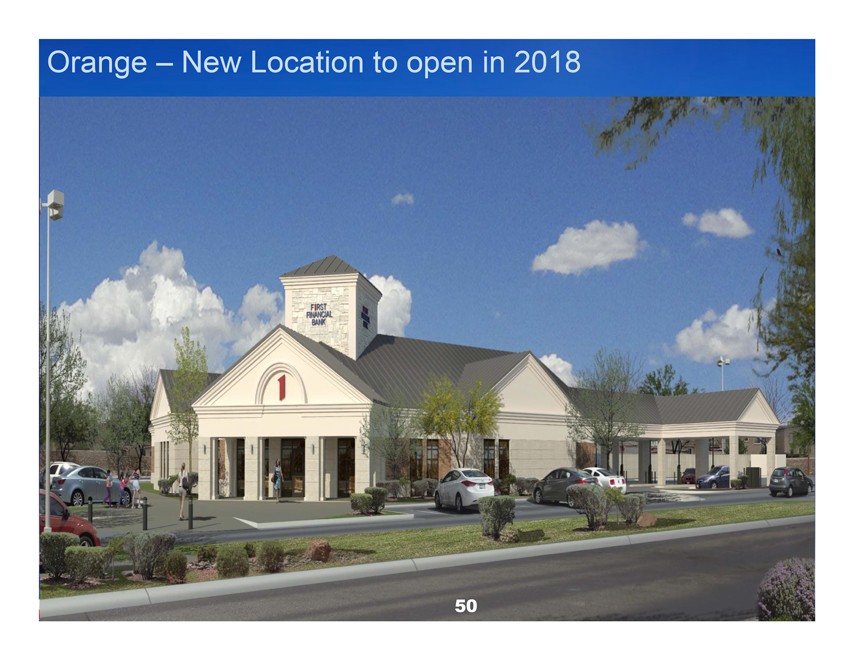
Orange – New Location to open in 2018
50
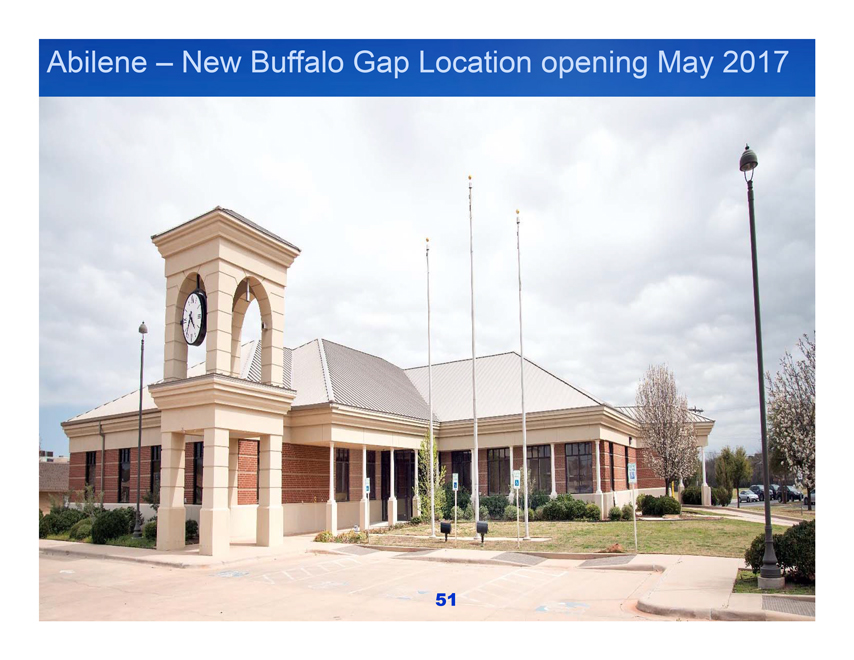
Abilene – New Buffalo Gap Location opening May 2017
51
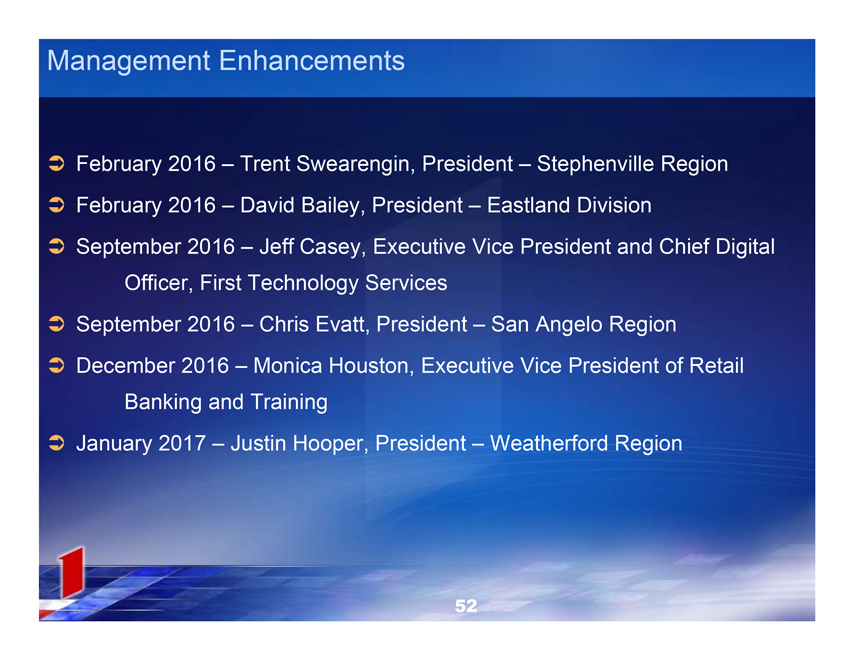
Management Enhancements
February 2016 – Trent Swearengin, President – Stephenville Region
February 2016 – David Bailey, President – Eastland Division
September 2016 – Jeff Casey, Executive Vice President and Chief Digital Officer, First Technology Services
September 2016 – Chris Evatt, President – San Angelo Region
December 2016 – Monica Houston, Executive Vice President of Retail Banking and Training
January 2017 – Justin Hooper, President – Weatherford Region
52
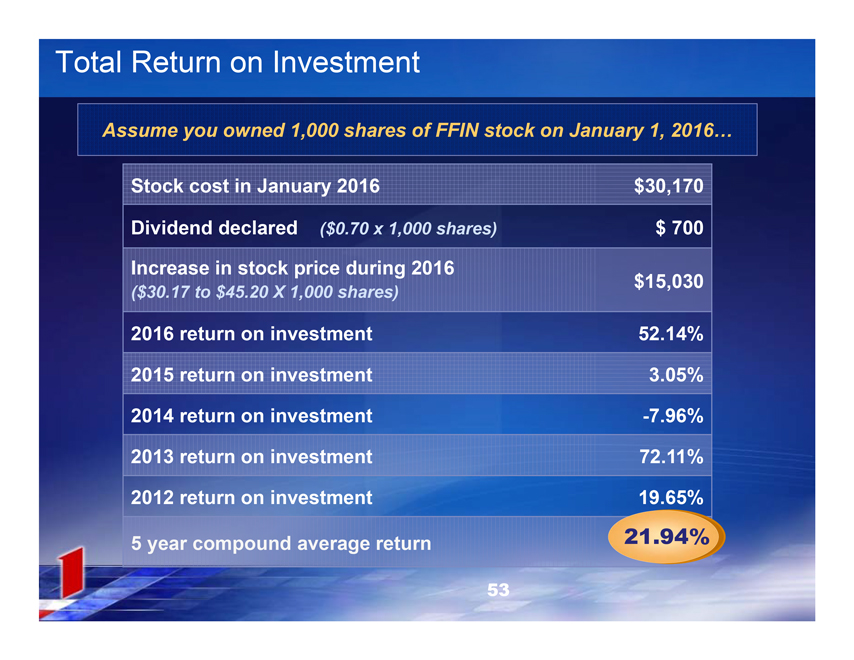
Total Return on Investment
Assume you owned 1,000 shares of FFIN stock on January 1, 2016…
Stock cost in January 2016 $30,170
Dividend declared ($0.70 x 1,000 shares) $700
Increase in stock price during 2016
($30.17 to $45.20 X 1,000 shares) $15,030
2016 return on investment 52.14%
2015 return on investment 3.05%
2014 return on investment -7.96%
2013 return on investment 72.11%
2012 return on investment 19.65%
5 year compound average return 21.94%
53
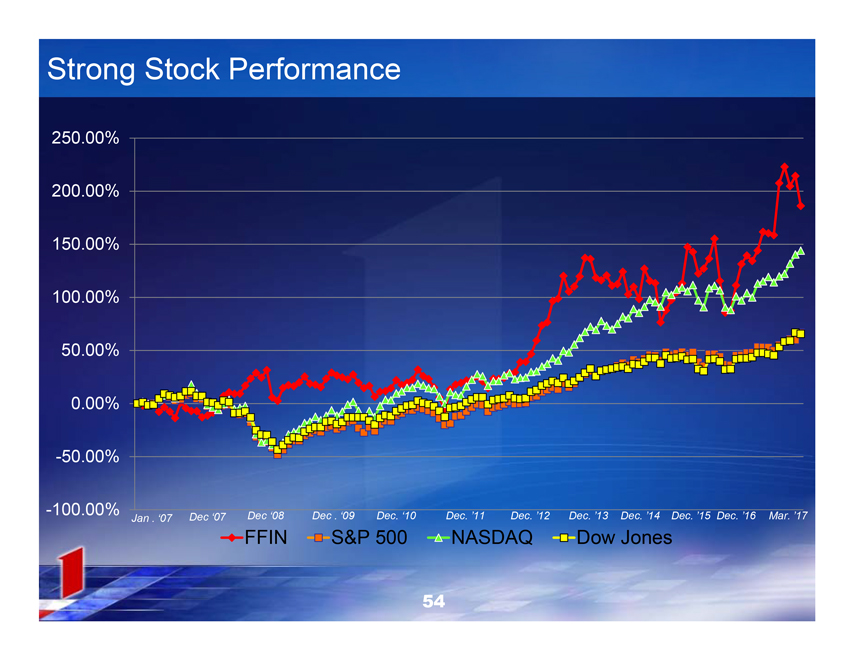
Strong Stock Performance
250.00% 200.00% 150.00% 100.00%
50.00% 0.00%-50.00%-100.00%
Jan . ‘07 Dec ‘07 Dec ‘08 Dec . ‘09 Dec. ‘10 Dec. ’11 Dec. ’12 Dec. ’13 Dec. ’14 Dec. ’15 Dec. ’16 Mar. ’17
FFIN S&P 500 NASDAQ Dow Jones
54
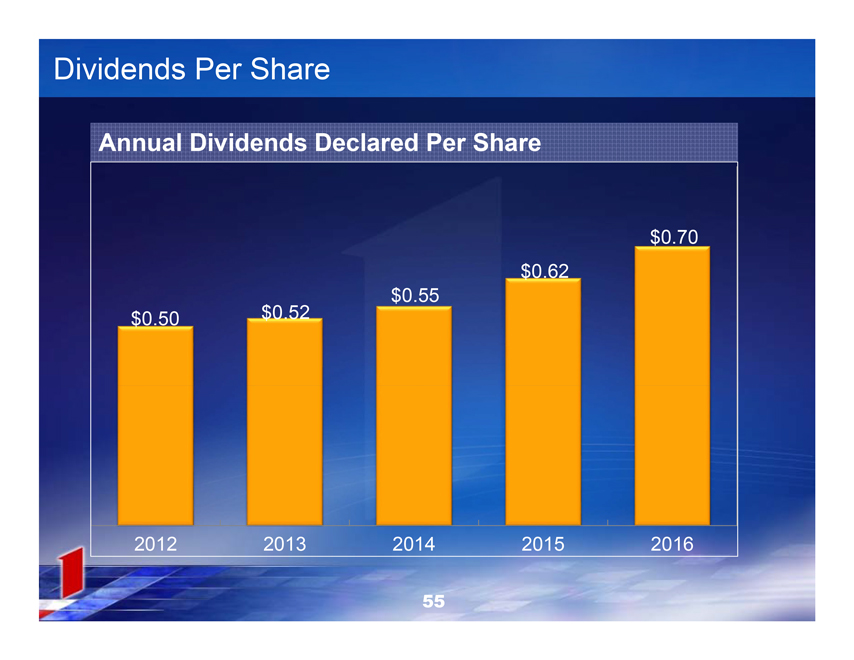
Dividends Per Share
Annual Dividends Declared Per Share
$0.50
2012
$0.52
2013
$0.55
2014
$0.62
2015
$0.70
2016
55
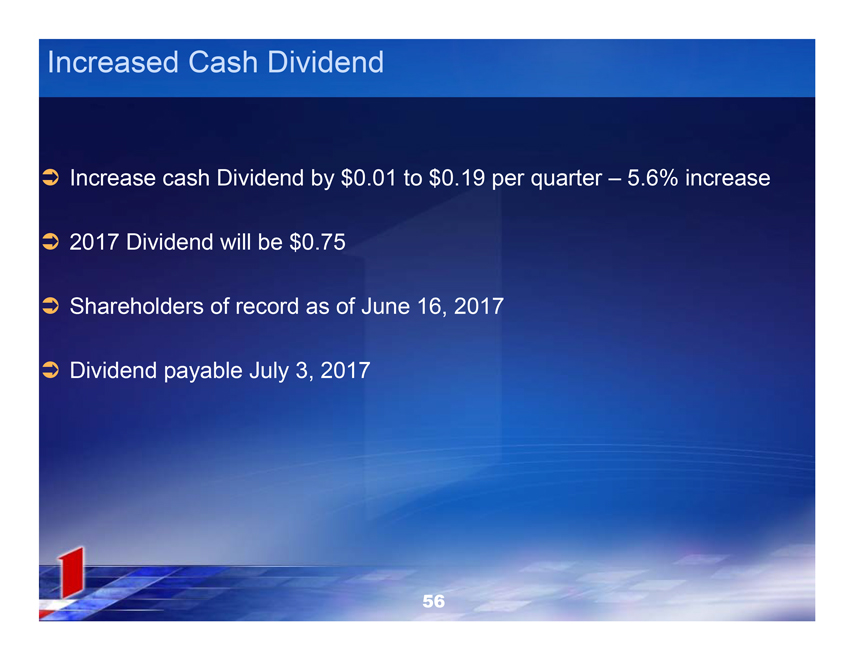
Increased Cash Dividend
Increase cash Dividend by $0.01 to $0.19 per quarter – 5.6% increase
2017 Dividend will be $0.75
Shareholders of record as of June 16, 2017
Dividend payable July 3, 2017
56
FIRST FINANCIAL BANKSHARES INC.TM