
U.S. Bank | Confidential 1 U.S. Bancorp 4Q24 Earnings Conference Call January 16, 2025
U.S. Bancorp 2 Forward-looking Statements and Additional Information The following information appears in accordance with the Private Securities Litigation Reform Act of 1995: This presentation contains forward-looking statements about U.S. Bancorp. Statements that are not historical or current facts, including statements about beliefs and expectations, are forward-looking statements and are based on the information available to, and assumptions and estimates made by, management as of the date hereof. These forward-looking statements cover, among other things, future economic conditions and the anticipated future revenue, expenses, financial condition, asset quality, capital and liquidity levels, plans, prospects and operations of U.S. Bancorp. Forward-looking statements often use words such as “anticipates,” “targets,” “expects,” “hopes,” “estimates,” “projects,” “forecasts,” “intends,” “plans,” “goals,” “believes,” “continue” and other similar expressions or future or conditional verbs such as “will,” “may,” “might,” “should,” “would” and “could.” Forward-looking statements involve inherent risks and uncertainties that could cause actual results to differ materially from those set forth in forward-looking statements, including the following risks and uncertainties: deterioration in general business and economic conditions or turbulence in domestic or global financial markets, which could adversely affect U.S. Bancorp’s revenues and the values of its assets and liabilities, reduce the availability of funding to certain financial institutions, lead to a tightening of credit, and increase stock price volatility; turmoil and volatility in the financial services industry, including failures or rumors of failures of other depository institutions, which could affect the ability of depository institutions, including U.S. Bank National Association, to attract and retain depositors, and could affect the ability of financial services providers, including U.S. Bancorp, to borrow or raise capital; increases in Federal Deposit Insurance Corporation (FDIC) assessments due to bank failures; actions taken by governmental agencies to stabilize the financial system and the effectiveness of such actions; uncertainty regarding the content, timing, and impact of changes to regulatory capital, liquidity and resolution-related requirements applicable to large banking organizations in response to adverse developments affecting the banking sector; changes to statutes, regulations, or regulatory policies or practices, including capital and liquidity requirements, and the enforcement and interpretation of such laws and regulations, and U.S. Bancorp’s ability to address or satisfy those requirements and other requirements or conditions imposed by regulatory entities; changes in interest rates; increases in unemployment rates; deterioration in the credit quality of U.S. Bancorp’s loan portfolios or in the value of the collateral securing those loans; changes in commercial real estate occupancy rates; risks related to originating and selling mortgages, including repurchase and indemnity demands, and related to U.S. Bancorp’s role as a loan servicer; impacts of current, pending or future litigation and governmental proceedings; increased competition from both banks and non-banks; effects of climate change and related physical and transition risks; changes in customer behavior and preferences and the ability to implement technological changes to respond to customer needs and meet competitive demands; breaches in data security; failures or disruptions in or breaches of U.S. Bancorp’s operational, technology or security systems or infrastructure, or those of third parties, including as a result of cybersecurity incidents; failures to safeguard personal information; impacts of pandemics, natural disasters, terrorist activities, civil unrest, international hostilities and geopolitical events; impacts of supply chain disruptions, rising inflation, slower growth or a recession; failure to execute on strategic or operational plans; effects of mergers and acquisitions and related integration; effects of critical accounting policies and judgments; effects of changes in or interpretations of tax laws and regulations; management’s ability to effectively manage credit risk, market risk, operational risk, compliance risk, strategic risk, interest rate risk, liquidity risk and reputation risk; and the risks and uncertainties more fully discussed in the section entitled “Risk Factors” of U.S. Bancorp’s Form 10-K for the year ended December 31, 2023, and subsequent filings with the Securities and Exchange Commission. In addition, factors other than these risks also could adversely affect U.S. Bancorp’s results, and the reader should not consider these risks to be a complete set of all potential risks or uncertainties. Readers are cautioned not to place undue reliance on any forward-looking statements. Forward-looking statements speak only as of the date hereof, and U.S. Bancorp undertakes no obligation to update them in light of new information or future events. This presentation includes non-GAAP financial measures to describe U.S. Bancorp’s performance. The calculations of these measures are provided in the Appendix. These disclosures should not be viewed as a substitute for operating results determined in accordance with GAAP, nor are they necessarily comparable to non-GAAP performance measures that may be presented by other companies.
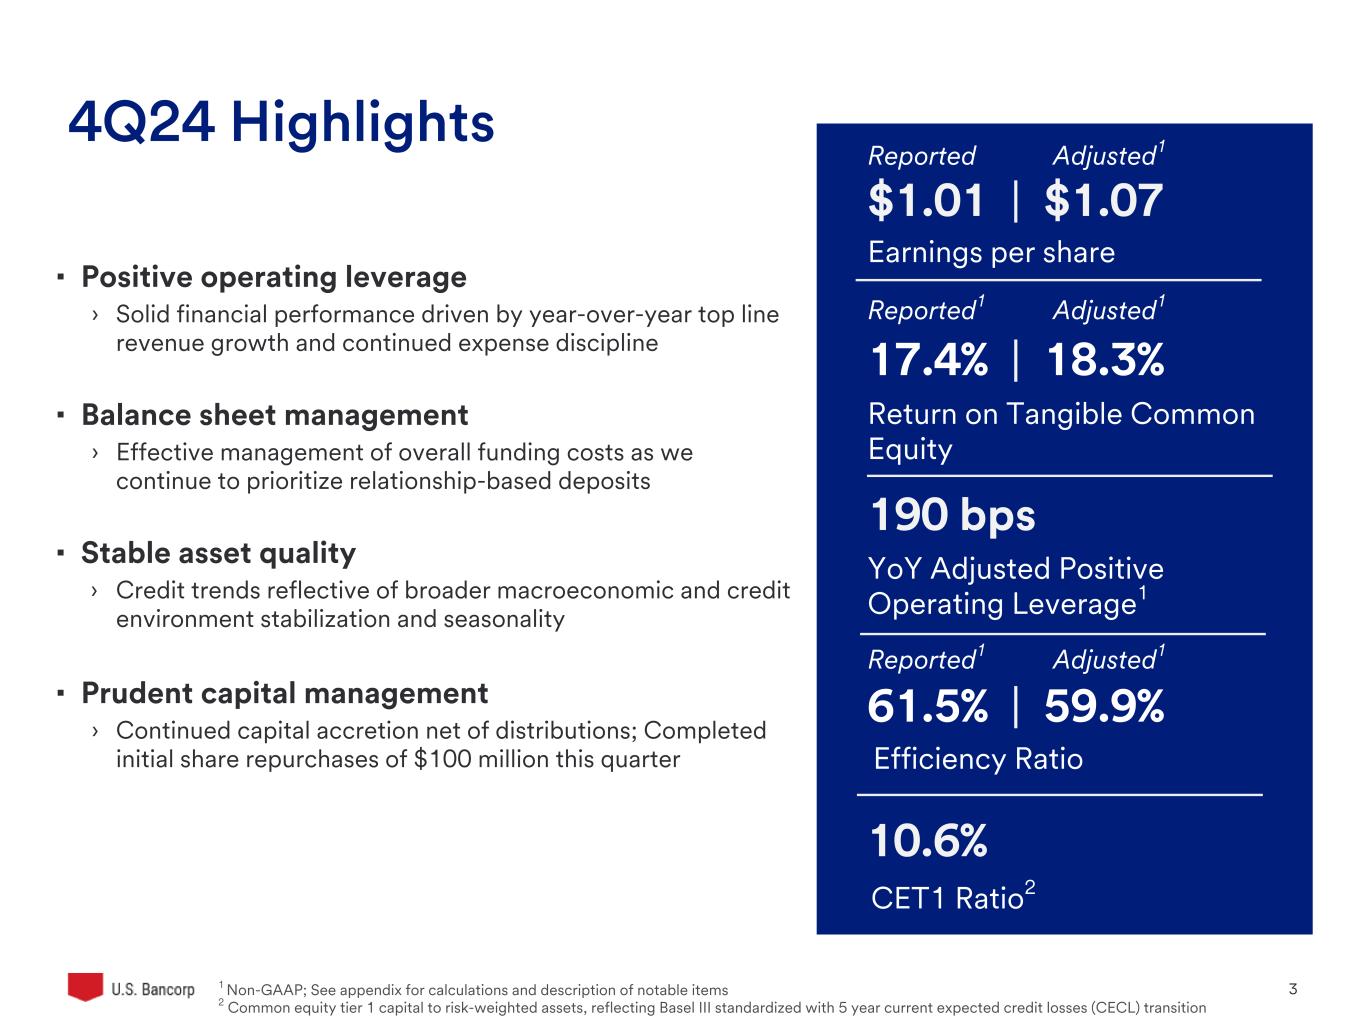
U.S. Bancorp 3 4Q24 Highlights ▪ Positive operating leverage › Solid financial performance driven by year-over-year top line revenue growth and continued expense discipline ▪ Balance sheet management › Effective management of overall funding costs as we continue to prioritize relationship-based deposits ▪ Stable asset quality › Credit trends reflective of broader macroeconomic and credit environment stabilization and seasonality ▪ Prudent capital management › Continued capital accretion net of distributions; Completed initial share repurchases of $100 million this quarter $1.01 | $1.07 10.6% Earnings per share CET1 Ratio2 YoY Adjusted Positive Operating Leverage1 Return on Tangible Common Equity 1 Non-GAAP; See appendix for calculations and description of notable items 2 Common equity tier 1 capital to risk-weighted assets, reflecting Basel III standardized with 5 year current expected credit losses (CECL) transition 190 bps 17.4% | 18.3% Efficiency Ratio Reported Adjusted1 Reported1 Adjusted1 61.5% | 59.9% Reported1 Adjusted1
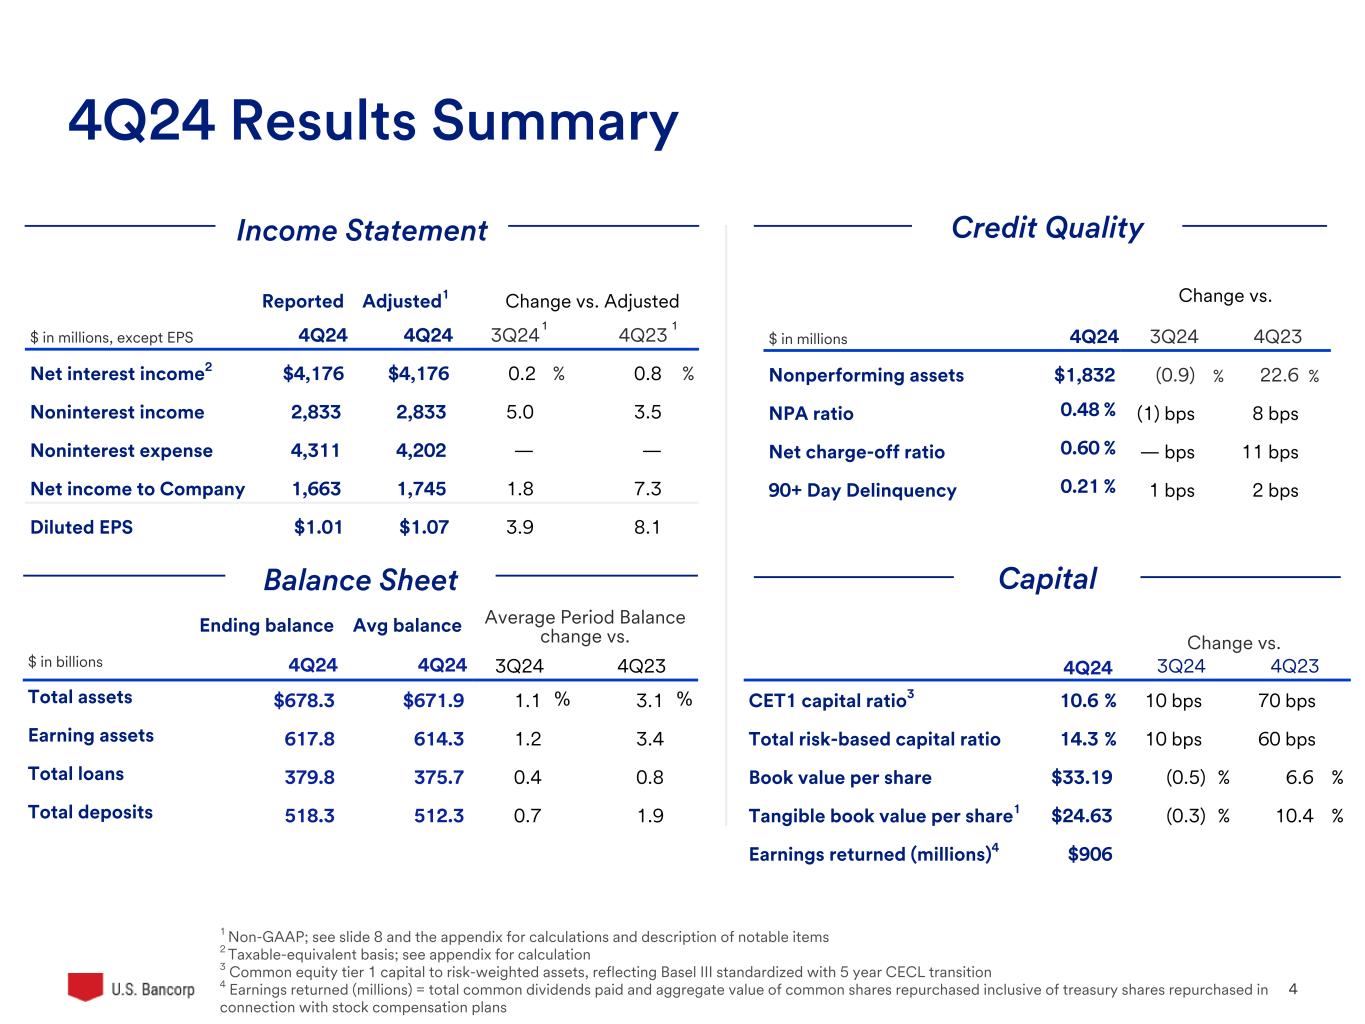
U.S. Bancorp 4 4Q24 Results Summary Income Statement Balance Sheet Capital 1 Non-GAAP; see slide 8 and the appendix for calculations and description of notable items 2 Taxable-equivalent basis; see appendix for calculation 3 Common equity tier 1 capital to risk-weighted assets, reflecting Basel III standardized with 5 year CECL transition 4 Earnings returned (millions) = total common dividends paid and aggregate value of common shares repurchased inclusive of treasury shares repurchased in connection with stock compensation plans Reported Adjusted1 Change vs. Adjusted $ in millions, except EPS 4Q24 4Q24 3Q24 4Q23 Net interest income2 $4,176 $4,176 0.2 % 0.8 % Noninterest income 2,833 2,833 5.0 3.5 Noninterest expense 4,311 4,202 — — Net income to Company 1,663 1,745 1.8 7.3 Diluted EPS $1.01 $1.07 3.9 8.1 Change vs. $ in millions 4Q24 3Q24 4Q23 Nonperforming assets $1,832 (0.9) % 22.6 % NPA ratio 0.48 % (1) bps 8 bps Net charge-off ratio 0.60 % — bps 11 bps 90+ Day Delinquency 0.21 % 1 bps 2 bps Ending balance Avg balance Average Period Balance change vs. $ in billions 4Q24 4Q24 3Q24 4Q23 Total assets $678.3 $671.9 1.1 % 3.1 % Earning assets 617.8 614.3 1.2 3.4 Total loans 379.8 375.7 0.4 0.8 Total deposits 518.3 512.3 0.7 1.9 Change vs. 4Q24 3Q24 4Q23 CET1 capital ratio3 10.6 % 10 bps 70 bps Total risk-based capital ratio 14.3 % 10 bps 60 bps Book value per share $33.19 (0.5) % 6.6 % Tangible book value per share1 $24.63 (0.3) % 10.4 % Earnings returned (millions)4 $906 1 1 Credit Quality
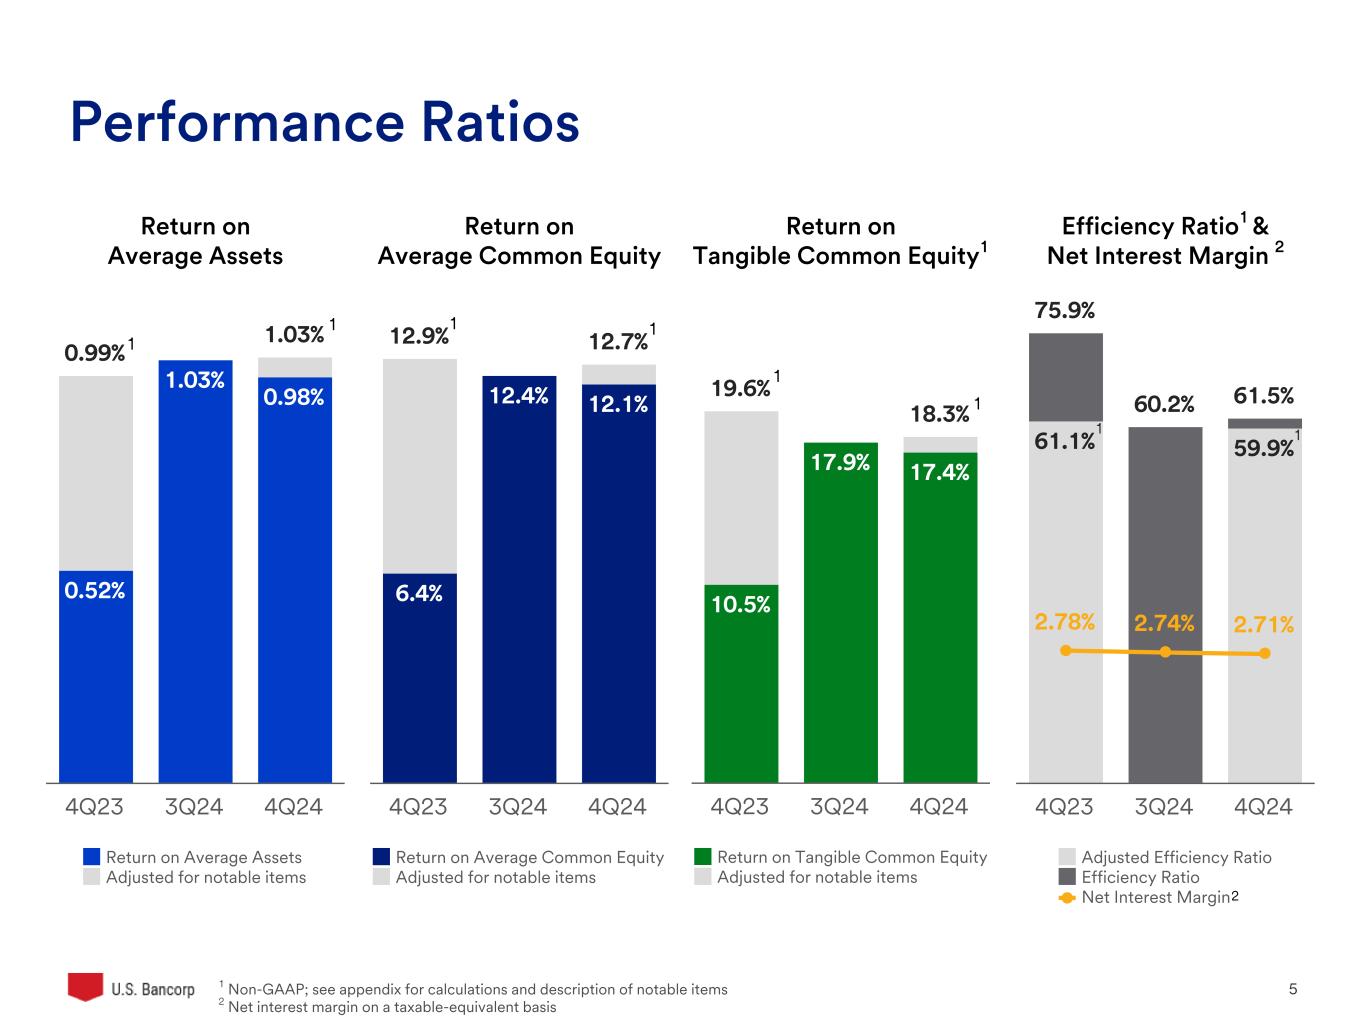
U.S. Bancorp 5 Performance Ratios 1 Non-GAAP; see appendix for calculations and description of notable items 2 Net interest margin on a taxable-equivalent basis 0.99% 1.03% 0.52% 1.03% 0.98% Return on Average Assets Adjusted for notable items 4Q23 3Q24 4Q24 12.9% 12.7% 6.4% 12.4% 12.1% Return on Average Common Equity Adjusted for notable items 4Q23 3Q24 4Q24 19.6% 18.3% 10.5% 17.9% 17.4% Return on Tangible Common Equity Adjusted for notable items 4Q23 3Q24 4Q24 75.9% 60.2% 61.5% 61.1% 59.9% 2.78% 2.74% 2.71% Adjusted Efficiency Ratio Efficiency Ratio Net Interest Margin 4Q23 3Q24 4Q24 Return on Average Assets Return on Average Common Equity Return on Tangible Common Equity1 Efficiency Ratio1 & Net Interest Margin 2 1 1 1 1 2 1 1 1 1
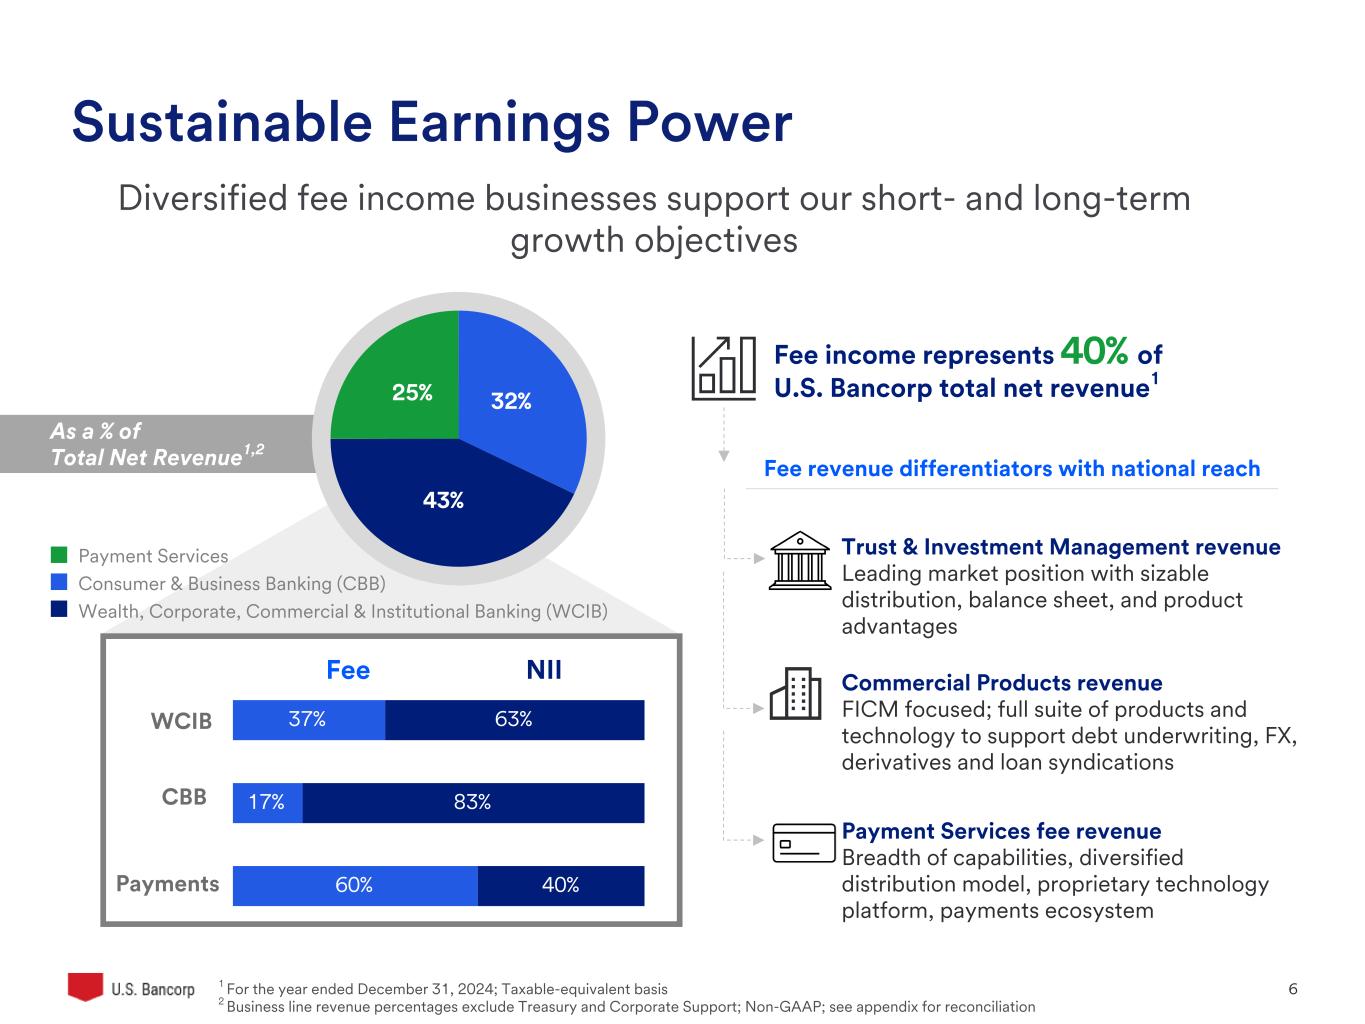
U.S. Bancorp 6 Sustainable Earnings Power Diversified fee income businesses support our short- and long-term growth objectives Fee income represents 40% of U.S. Bancorp total net revenue1 1 For the year ended December 31, 2024; Taxable-equivalent basis 2 Business line revenue percentages exclude Treasury and Corporate Support; Non-GAAP; see appendix for reconciliation As a % of Total Net Revenue1,2 Fee NII Payment Services fee revenue Breadth of capabilities, diversified distribution model, proprietary technology platform, payments ecosystem Trust & Investment Management revenue Leading market position with sizable distribution, balance sheet, and product advantages Fee revenue differentiators with national reach 32% 43% 25% 37% 17% 60% 63% 83% 40% WCIB CBB Payments Payment Services Consumer & Business Banking (CBB) Wealth, Corporate, Commercial & Institutional Banking (WCIB) Commercial Products revenue FICM focused; full suite of products and technology to support debt underwriting, FX, derivatives and loan syndications
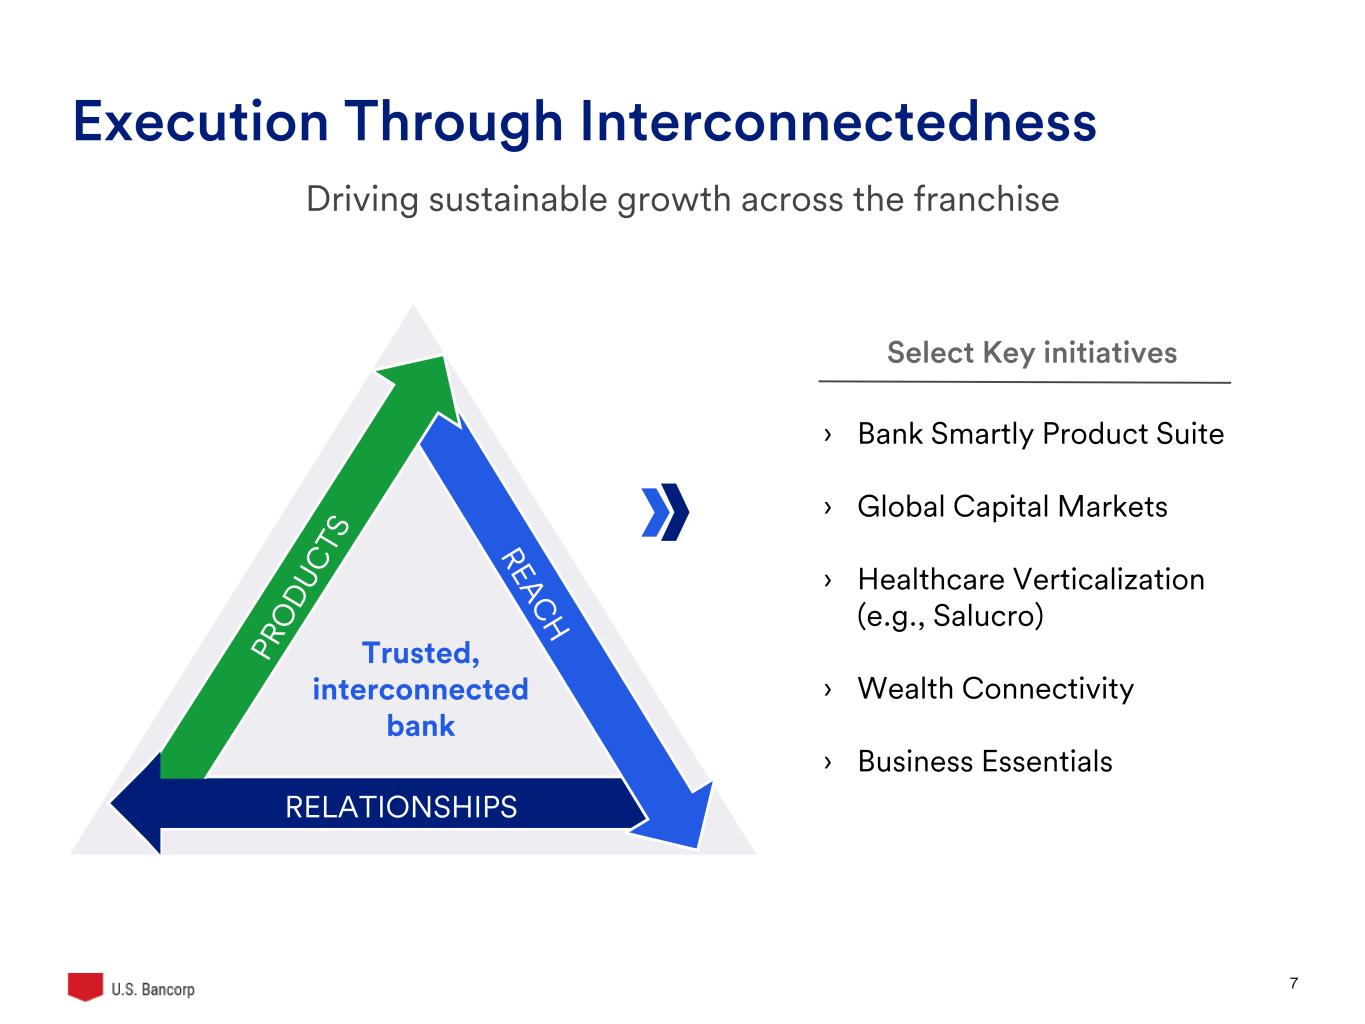
©U.S. Bank | Confidential 7 Execution Through Interconnectedness Trusted, interconnected bank PR O DUC TS REAC H RELATIONSHIPS Select Key initiatives › Bank Smartly Product Suite › Global Capital Markets › Healthcare Verticalization (e.g., Salucro) › Wealth Connectivity › Business Essentials Driving sustainable growth across the franchise

U.S. Bancorp 8 Excluding Notable Items2 Reported % Change Notable Items2 % Change $ in millions, except EPS 4Q24 3Q24 4Q23 vs 3Q24 vs 4Q23 4Q24 3Q24 4Q23 vs 3Q24 vs 4Q23 Net Interest Income $4,146 $4,135 $4,111 0.3 % 0.9 % $— $— $— 0.3 % 0.9 % Taxable-equivalent Adjustment 30 31 31 (3.2) (3.2) — — — (3.2) (3.2) Net Interest Income (taxable-equivalent basis) 4,176 4,166 4,142 0.2 0.8 — — — 0.2 0.8 Noninterest Income 2,833 2,698 2,620 5.0 8.1 — — (118) 5.0 3.5 Net Revenue 7,009 6,864 6,762 2.1 3.7 — — (118) 2.1 1.9 Noninterest Expense 4,311 4,204 5,219 2.5 (17.4) 109 — 1,015 — — Operating Income 2,698 2,660 1,543 1.4 74.9 (109) — (1,133) 5.5 4.9 Provision for credit losses 560 557 512 0.5 9.4 — — — 0.5 9.4 Income Before Taxes 2,138 2,103 1,031 1.7 nm (109) — (1,133) 6.8 3.8 Applicable Income Taxes 468 381 170 22.8 nm (27) — (353) 29.9 (5.4) Net Income 1,670 1,722 861 (3.0) 94.0 (82) — (780) 1.7 6.8 Noncontrolling Interests (7) (8) (14) 12.5 50.0 — — — 12.5 50.0 Net Income to Company 1,663 1,714 847 (3.0) 96.3 (82) — (780) 1.8 7.3 Preferred Dividends/Other 82 113 81 (27.4) 1.2 (1) — (5) (26.5) (3.5) Net Income to Common $1,581 $1,601 $766 (1.2) % nm % ($81) $— ($775) 3.8 % 7.9 % Net Interest Margin1 2.71% 2.74% 2.78% (3) bps (7) bps —% —% —% (3) bps (7) bps Efficiency Ratio2 61.5% 60.2% 75.9% 130 bps (1,440) bps 1.6% —% 14.8% (30) bps (120) bps Diluted EPS $1.01 $1.03 $.49 (1.9) % nm % $(.06) $— $(.50) 3.9 % 8.1 % 1 Taxable-equivalent basis 2 Non-GAAP; see appendix for calculations and description of notable items Income Statement Detail
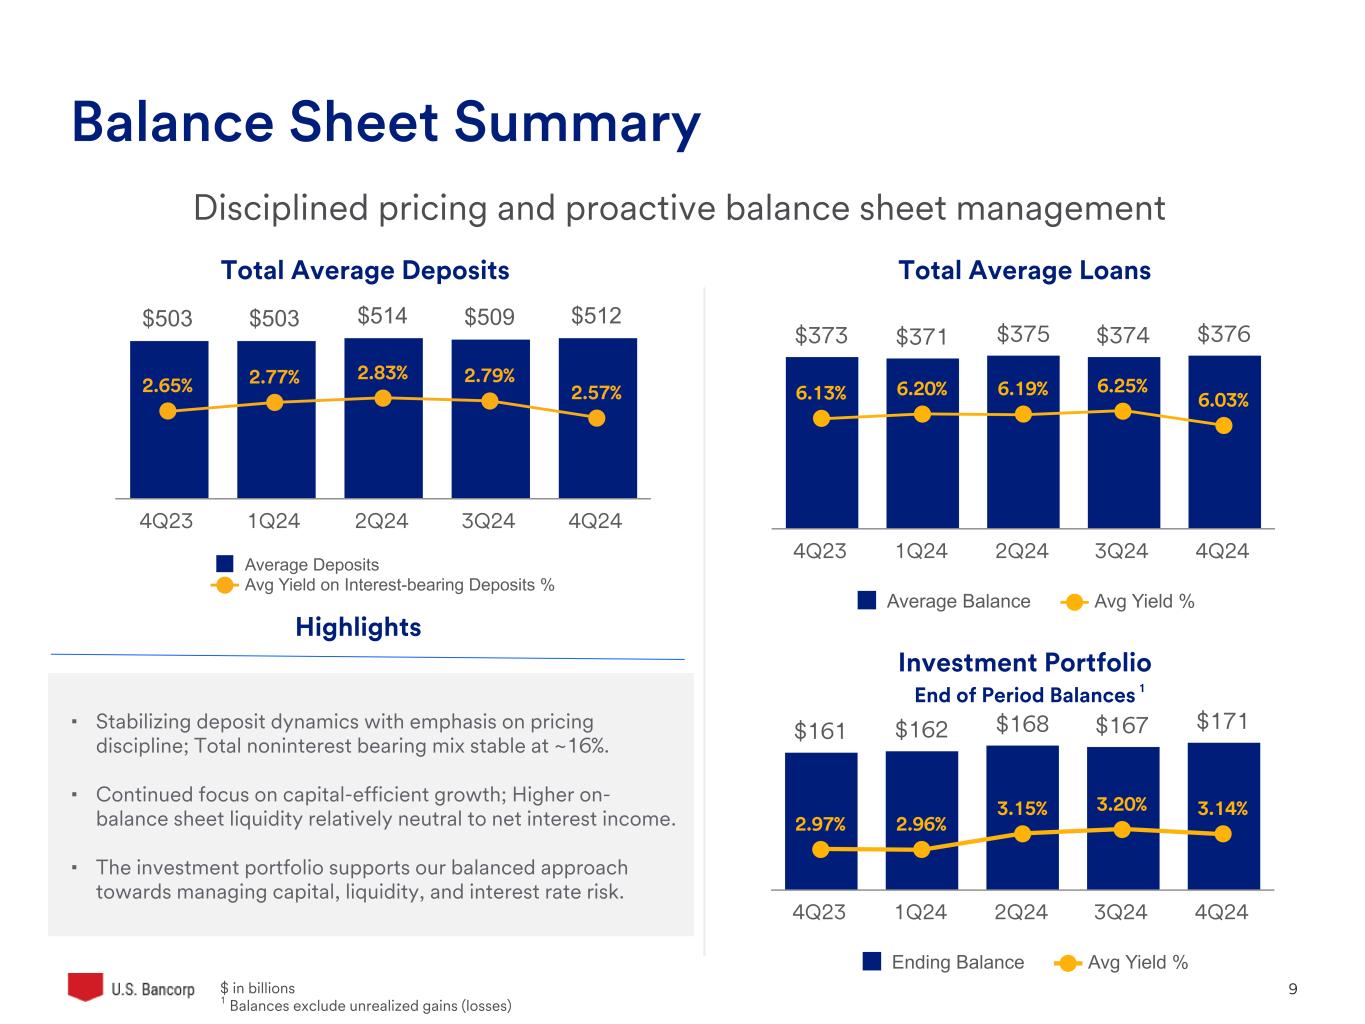
U.S. Bancorp 9 $503 $503 $514 $509 $512 2.65% 2.77% 2.83% 2.79% 2.57% Average Deposits Avg Yield on Interest-bearing Deposits % 4Q23 1Q24 2Q24 3Q24 4Q24 Balance Sheet Summary Disciplined pricing and proactive balance sheet management Total Average Deposits Highlights Total Average Loans $373 $371 $375 $374 $376 6.13% 6.20% 6.19% 6.25% 6.03% Average Balance Avg Yield % 4Q23 1Q24 2Q24 3Q24 4Q24 Investment Portfolio End of Period Balances $ in billions 1 Balances exclude unrealized gains (losses) ▪ Stabilizing deposit dynamics with emphasis on pricing discipline; Total noninterest bearing mix stable at ~16%. ▪ Continued focus on capital-efficient growth; Higher on- balance sheet liquidity relatively neutral to net interest income. ▪ The investment portfolio supports our balanced approach towards managing capital, liquidity, and interest rate risk. $161 $162 $168 $167 $171 2.97% 2.96% 3.15% 3.20% 3.14% Ending Balance Avg Yield % 4Q23 1Q24 2Q24 3Q24 4Q24 1
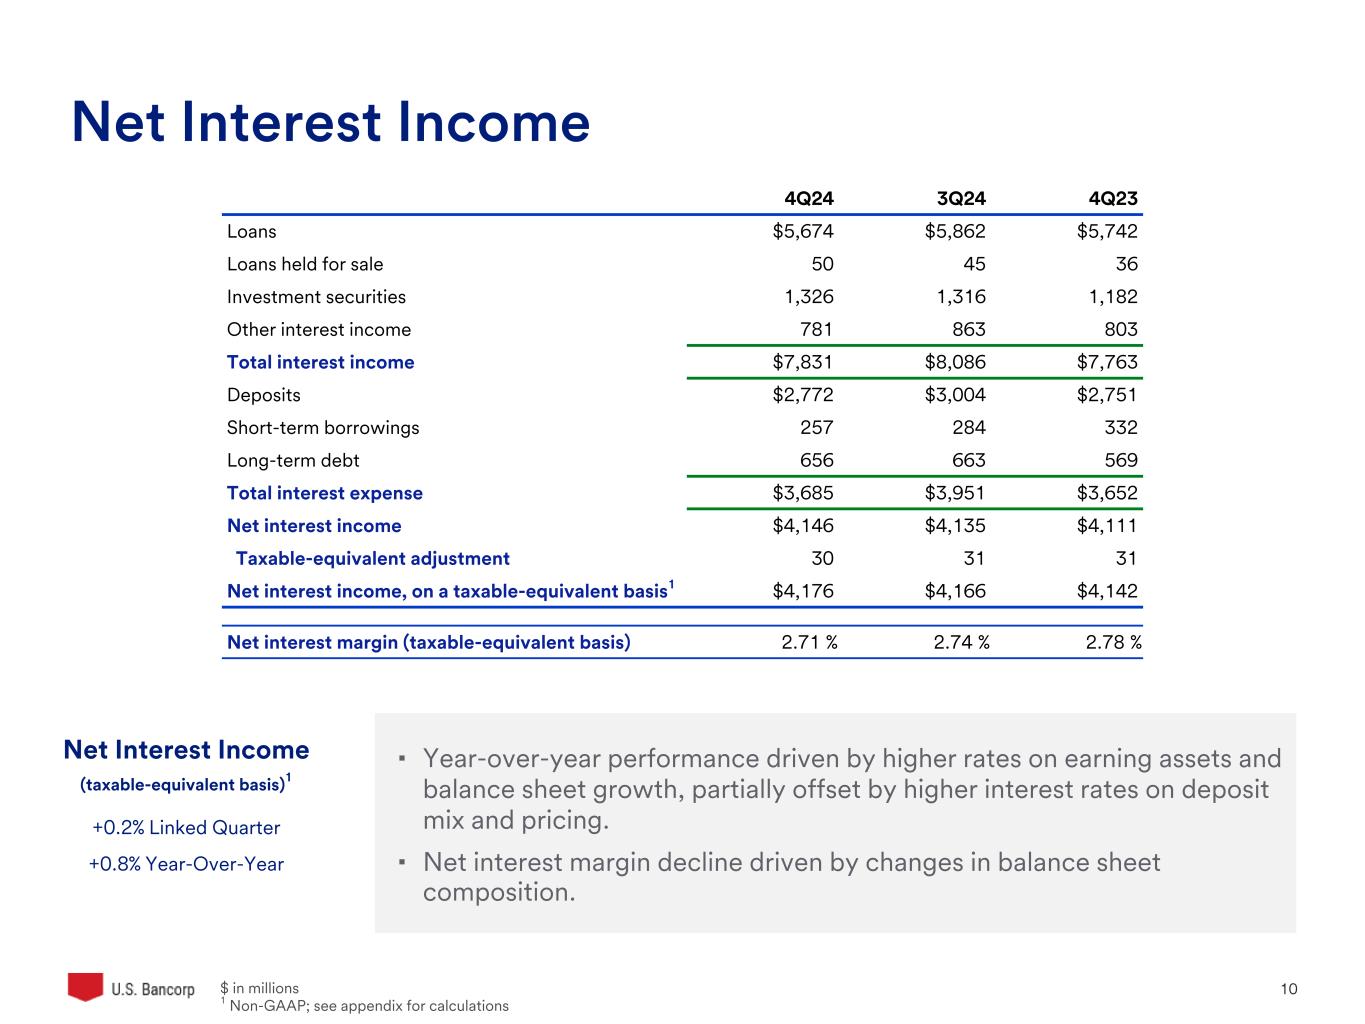
U.S. Bancorp 10 ▪ Year-over-year performance driven by higher rates on earning assets and balance sheet growth, partially offset by higher interest rates on deposit mix and pricing. ▪ Net interest margin decline driven by changes in balance sheet composition. $ in millions 1 Non-GAAP; see appendix for calculations 4Q24 3Q24 4Q23 Loans $5,674 $5,862 $5,742 Loans held for sale 50 45 36 Investment securities 1,326 1,316 1,182 Other interest income 781 863 803 Total interest income $7,831 $8,086 $7,763 Deposits $2,772 $3,004 $2,751 Short-term borrowings 257 284 332 Long-term debt 656 663 569 Total interest expense $3,685 $3,951 $3,652 Net interest income $4,146 $4,135 $4,111 Taxable-equivalent adjustment 30 31 31 Net interest income, on a taxable-equivalent basis1 $4,176 $4,166 $4,142 Net interest margin (taxable-equivalent basis) 2.71 % 2.74 % 2.78 % Net Interest Income (taxable-equivalent basis)1 +0.2% Linked Quarter +0.8% Year-Over-Year Net Interest Income
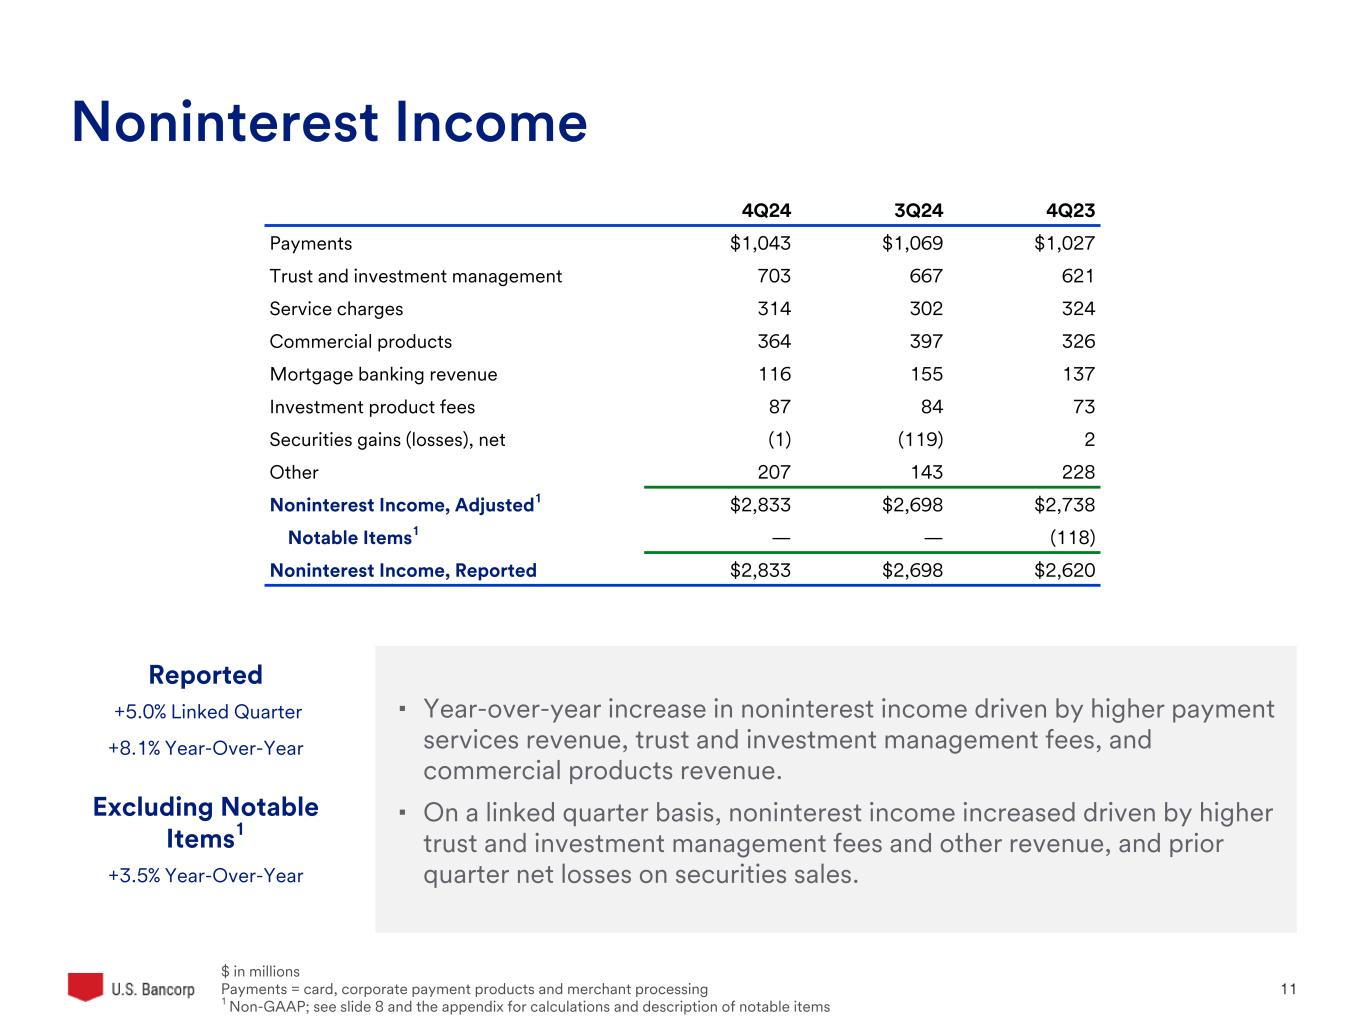
U.S. Bancorp 11 ▪ Year-over-year increase in noninterest income driven by higher payment services revenue, trust and investment management fees, and commercial products revenue. ▪ On a linked quarter basis, noninterest income increased driven by higher trust and investment management fees and other revenue, and prior quarter net losses on securities sales. $ in millions Payments = card, corporate payment products and merchant processing 1 Non-GAAP; see slide 8 and the appendix for calculations and description of notable items 4Q24 3Q24 4Q23 Payments $1,043 $1,069 $1,027 Trust and investment management 703 667 621 Service charges 314 302 324 Commercial products 364 397 326 Mortgage banking revenue 116 155 137 Investment product fees 87 84 73 Securities gains (losses), net (1) (119) 2 Other 207 143 228 Noninterest Income, Adjusted1 $2,833 $2,698 $2,738 Notable Items1 — — (118) Noninterest Income, Reported $2,833 $2,698 $2,620 Noninterest Income Reported +5.0% Linked Quarter +8.1% Year-Over-Year Excluding Notable Items1 +3.5% Year-Over-Year
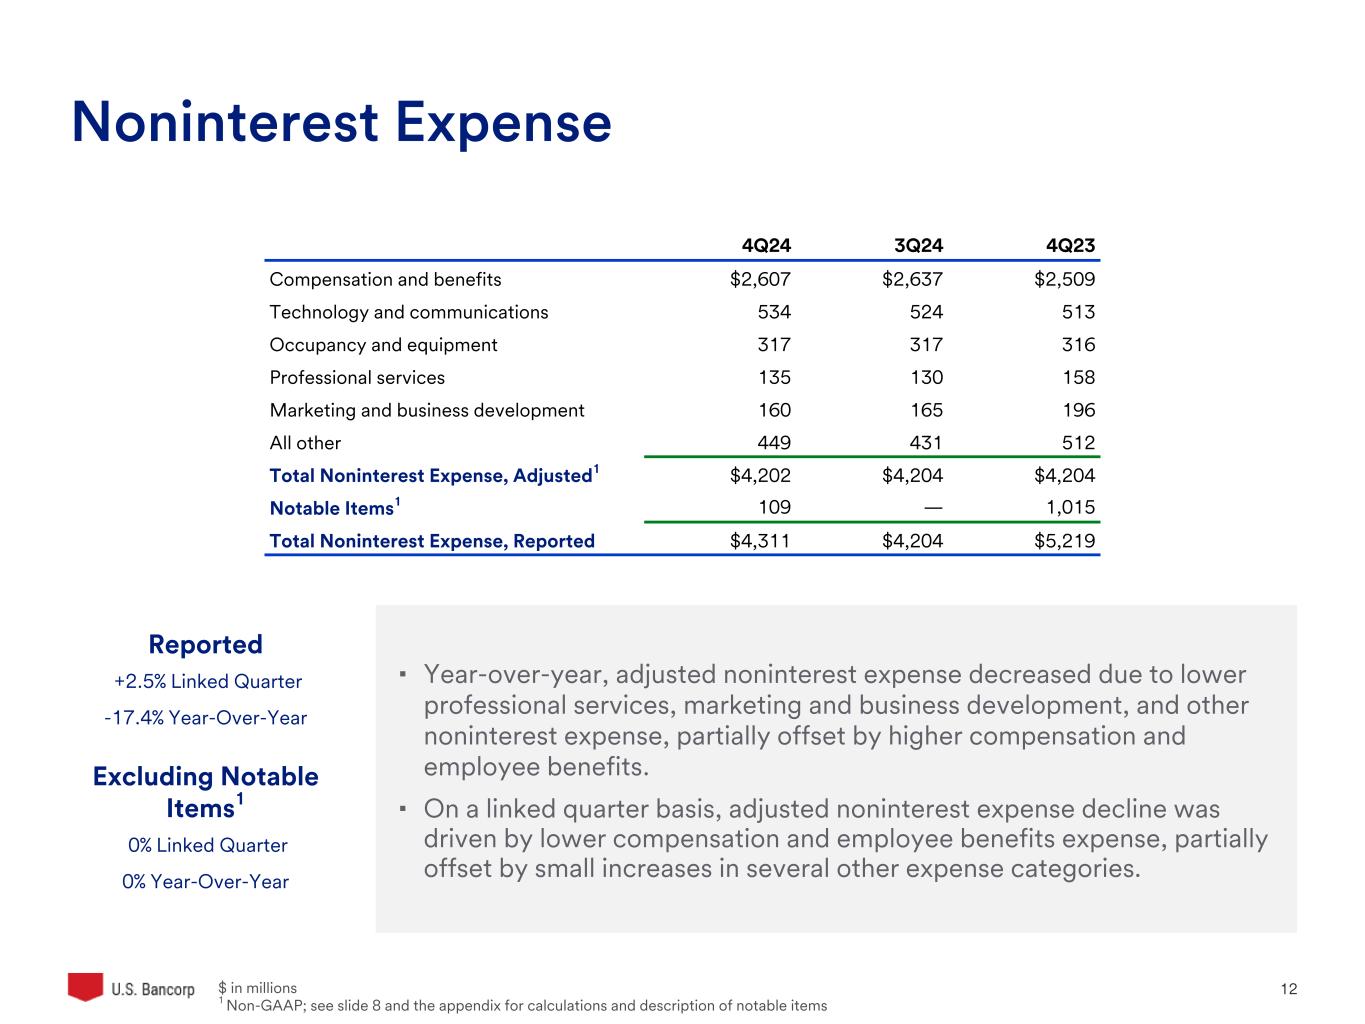
U.S. Bancorp 12 ▪ Year-over-year, adjusted noninterest expense decreased due to lower professional services, marketing and business development, and other noninterest expense, partially offset by higher compensation and employee benefits. ▪ On a linked quarter basis, adjusted noninterest expense decline was driven by lower compensation and employee benefits expense, partially offset by small increases in several other expense categories. $ in millions 1 Non-GAAP; see slide 8 and the appendix for calculations and description of notable items 4Q24 3Q24 4Q23 Compensation and benefits $2,607 $2,637 $2,509 Technology and communications 534 524 513 Occupancy and equipment 317 317 316 Professional services 135 130 158 Marketing and business development 160 165 196 All other 449 431 512 Total Noninterest Expense, Adjusted1 $4,202 $4,204 $4,204 Notable Items1 109 — 1,015 Total Noninterest Expense, Reported $4,311 $4,204 $5,219 Noninterest Expense Reported +2.5% Linked Quarter -17.4% Year-Over-Year Excluding Notable Items1 0% Linked Quarter 0% Year-Over-Year
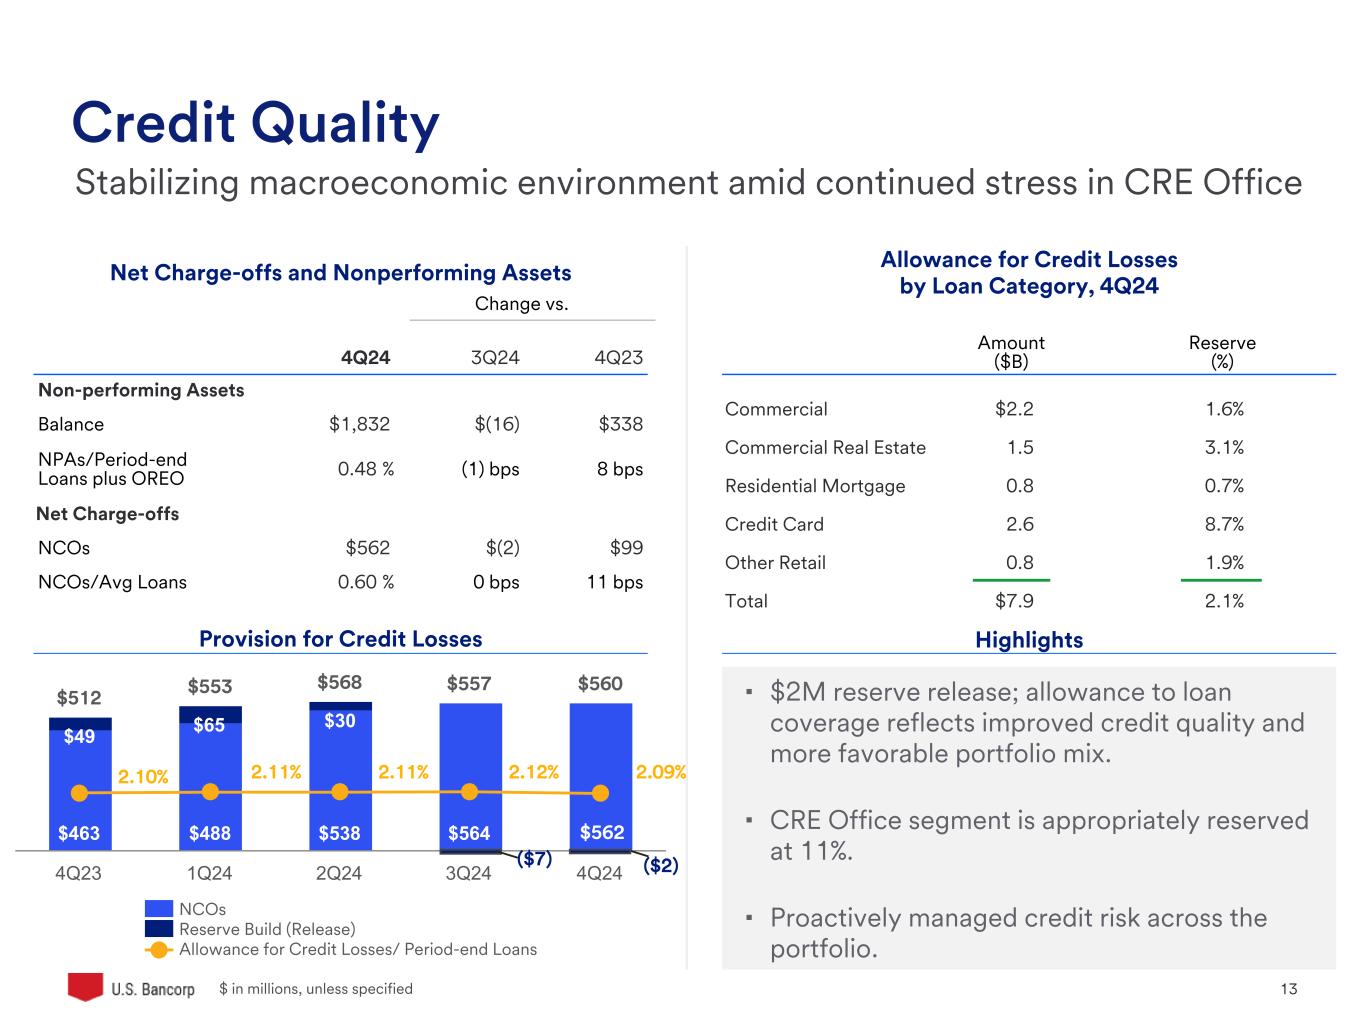
U.S. Bancorp 13 Amount ($B) Reserve (%) Commercial $2.2 1.6% Commercial Real Estate 1.5 3.1% Residential Mortgage 0.8 0.7% Credit Card 2.6 8.7% Other Retail 0.8 1.9% Total $7.9 2.1% Change vs. 4Q24 3Q24 4Q23 Non-performing Assets Balance $1,832 $(16) $338 NPAs/Period-end Loans plus OREO 0.48 % (1) bps 8 bps Net Charge-offs NCOs $562 $(2) $99 NCOs/Avg Loans 0.60 % 0 bps 11 bps Provision for Credit Losses $ in millions, unless specified Credit Quality Stabilizing macroeconomic environment amid continued stress in CRE Office Net Charge-offs and Nonperforming Assets Highlights Allowance for Credit Losses by Loan Category, 4Q24 ▪ $2M reserve release; allowance to loan coverage reflects improved credit quality and more favorable portfolio mix. ▪ CRE Office segment is appropriately reserved at 11%. ▪ Proactively managed credit risk across the portfolio. $512 $553 $568 $557 $560 $463 $488 $538 $564 $49 $65 $30 NCOs Reserve Build (Release) Allowance for Credit Losses/ Period-end Loans 4Q23 1Q24 2Q24 3Q24 4Q24 2.10% 2.11% 2.11% 2.12% 2.09% ($7) $562 ($2)
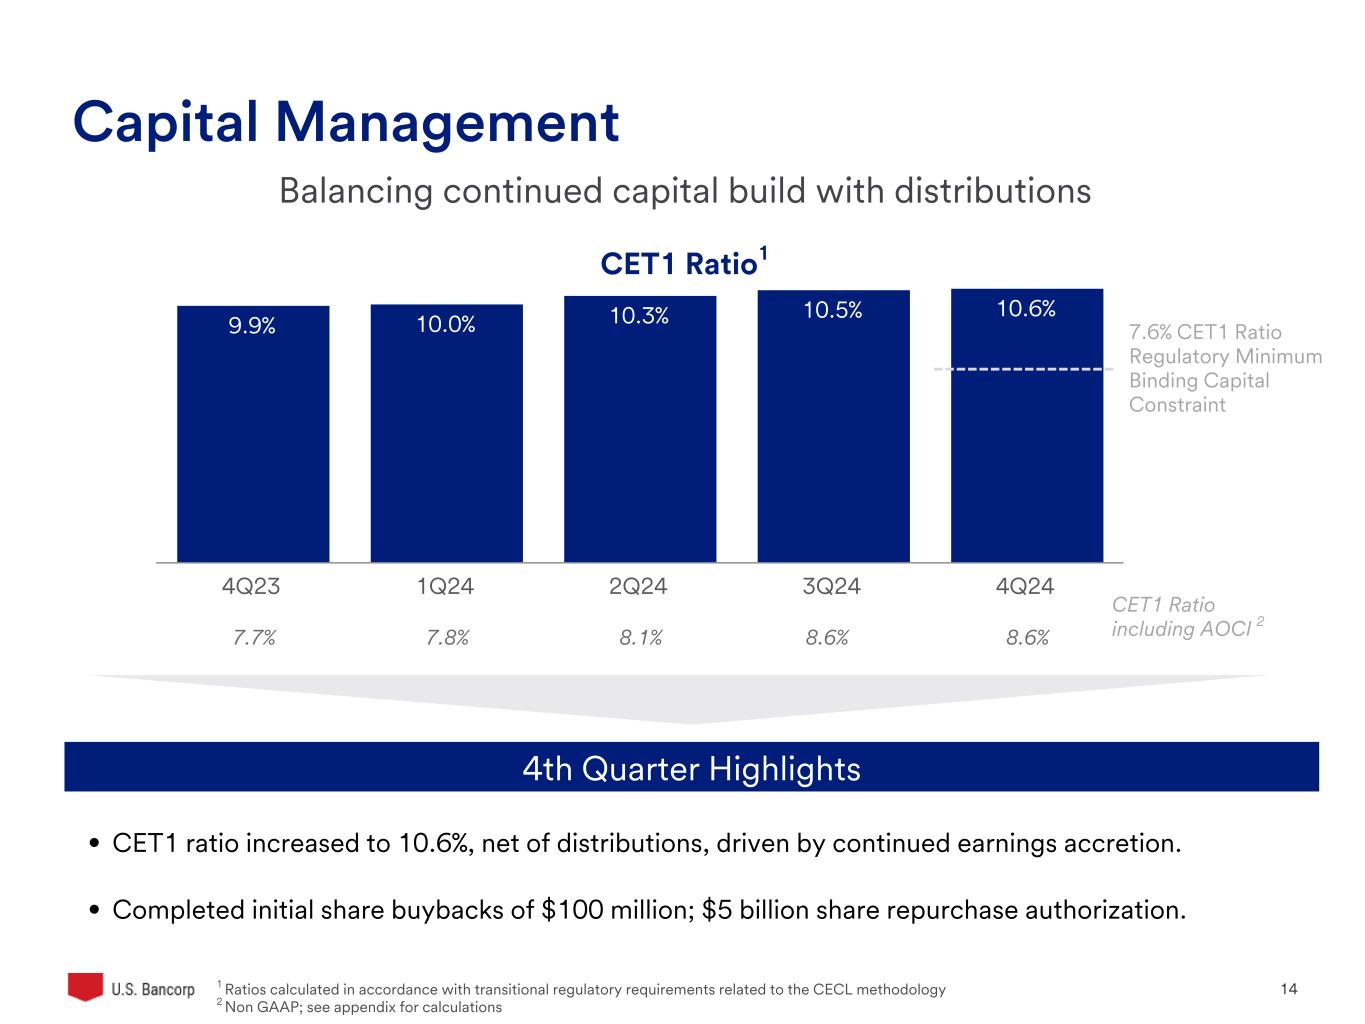
U.S. Bancorp 14 Capital Management 9.9% 10.0% 10.3% 10.5% 10.6% 4Q23 1Q24 2Q24 3Q24 4Q24 1 Ratios calculated in accordance with transitional regulatory requirements related to the CECL methodology 2 Non GAAP; see appendix for calculations 4th Quarter Highlights • CET1 ratio increased to 10.6%, net of distributions, driven by continued earnings accretion. • Completed initial share buybacks of $100 million; $5 billion share repurchase authorization. 7.6% CET1 Ratio Regulatory Minimum Binding Capital Constraint Balancing continued capital build with distributions CET1 Ratio1 CET1 Ratio including AOCI 28.6%8.6%8.1%7.8%7.7%
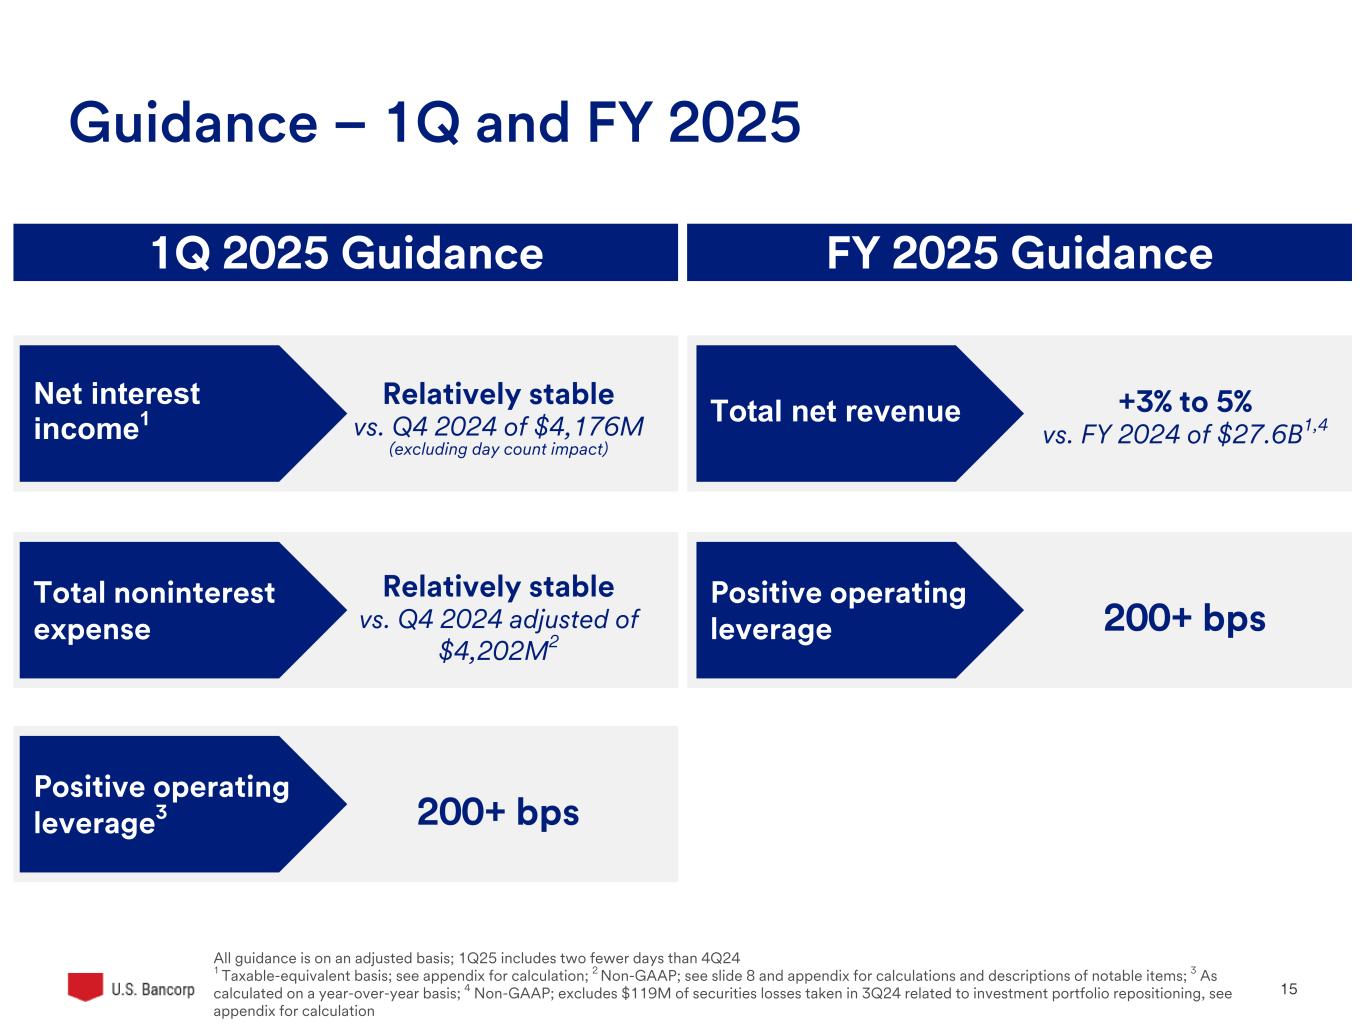
U.S. Bancorp 15 Guidance – 1Q and FY 2025 +3% to 5% vs. FY 2024 of $27.6B1,4 Relatively stable vs. Q4 2024 of $4,176M (excluding day count impact) 200+ bps 1Q 2025 Guidance FY 2025 Guidance Relatively stable vs. Q4 2024 adjusted of $4,202M2 200+ bps Total noninterest expense Positive operating leverage3 Net interest income1 Total net revenue Positive operating leverage All guidance is on an adjusted basis; 1Q25 includes two fewer days than 4Q24 1 Taxable-equivalent basis; see appendix for calculation; 2 Non-GAAP; see slide 8 and appendix for calculations and descriptions of notable items; 3 As calculated on a year-over-year basis; 4 Non-GAAP; excludes $119M of securities losses taken in 3Q24 related to investment portfolio repositioning, see appendix for calculation

U.S. Bancorp 16 Appendix
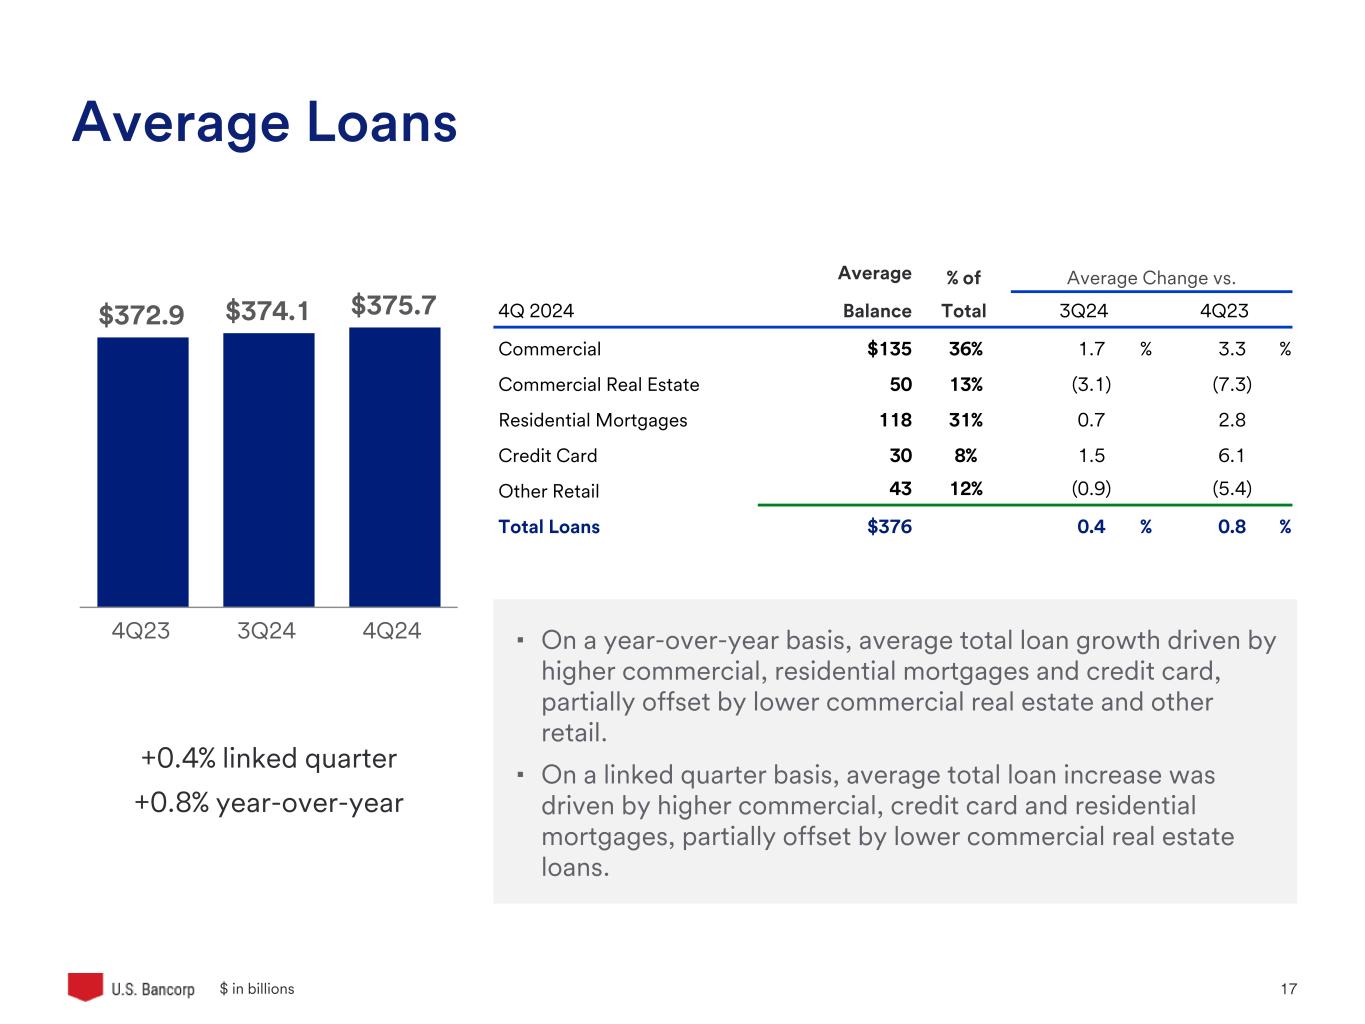
U.S. Bancorp 17 $372.9 $374.1 $375.7 4Q23 3Q24 4Q24 Average Loans +0.4% linked quarter +0.8% year-over-year $ in billions ▪ On a year-over-year basis, average total loan growth driven by higher commercial, residential mortgages and credit card, partially offset by lower commercial real estate and other retail. ▪ On a linked quarter basis, average total loan increase was driven by higher commercial, credit card and residential mortgages, partially offset by lower commercial real estate loans. Average % of Average Change vs. 4Q 2024 Balance Total 3Q24 4Q23 Commercial $135 36% 1.7 % 3.3 % Commercial Real Estate 50 13% (3.1) (7.3) Residential Mortgages 118 31% 0.7 2.8 Credit Card 30 8% 1.5 6.1 Other Retail 43 12% (0.9) (5.4) Total Loans $376 0.4 % 0.8 %
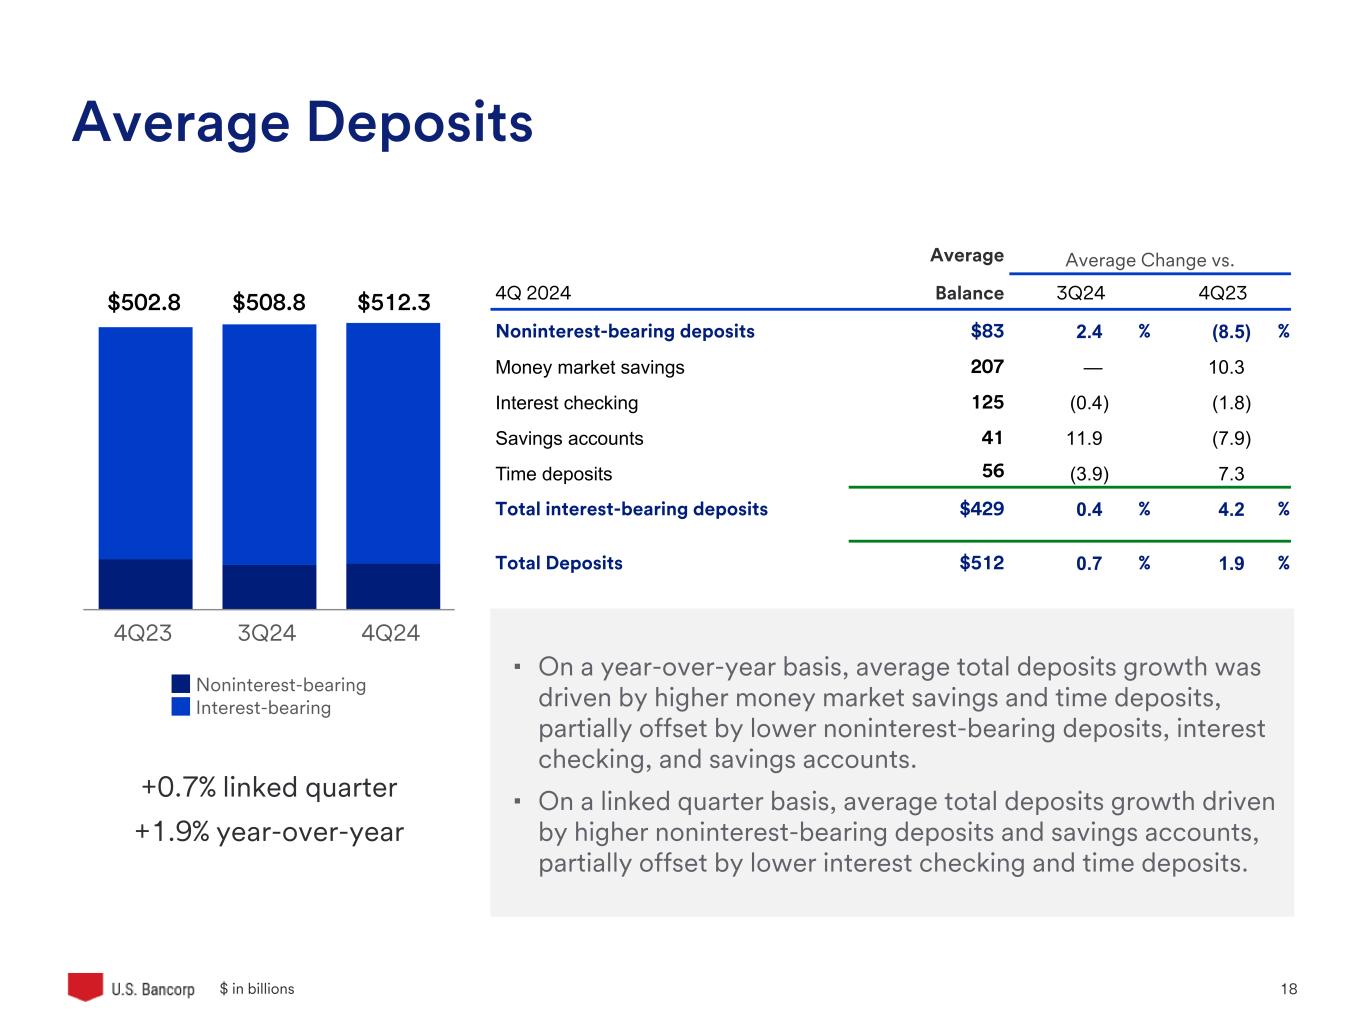
U.S. Bancorp 18 ▪ On a year-over-year basis, average total deposits growth was driven by higher money market savings and time deposits, partially offset by lower noninterest-bearing deposits, interest checking, and savings accounts. ▪ On a linked quarter basis, average total deposits growth driven by higher noninterest-bearing deposits and savings accounts, partially offset by lower interest checking and time deposits. Average Deposits +0.7% linked quarter +1.9% year-over-year $ in billions Noninterest-bearing Interest-bearing 4Q23 3Q24 4Q24 Average Average Change vs. 4Q 2024 Balance 3Q24 4Q23 Noninterest-bearing deposits $83 2.4 % (8.5) % Money market savings 207 — 10.3 Interest checking 125 (0.4) (1.8) Savings accounts 41 11.9 (7.9) Time deposits 56 (3.9) 7.3 Total interest-bearing deposits $429 0.4 % 4.2 % Total Deposits $512 0.7 % 1.9 % $512.3$508.8$502.8
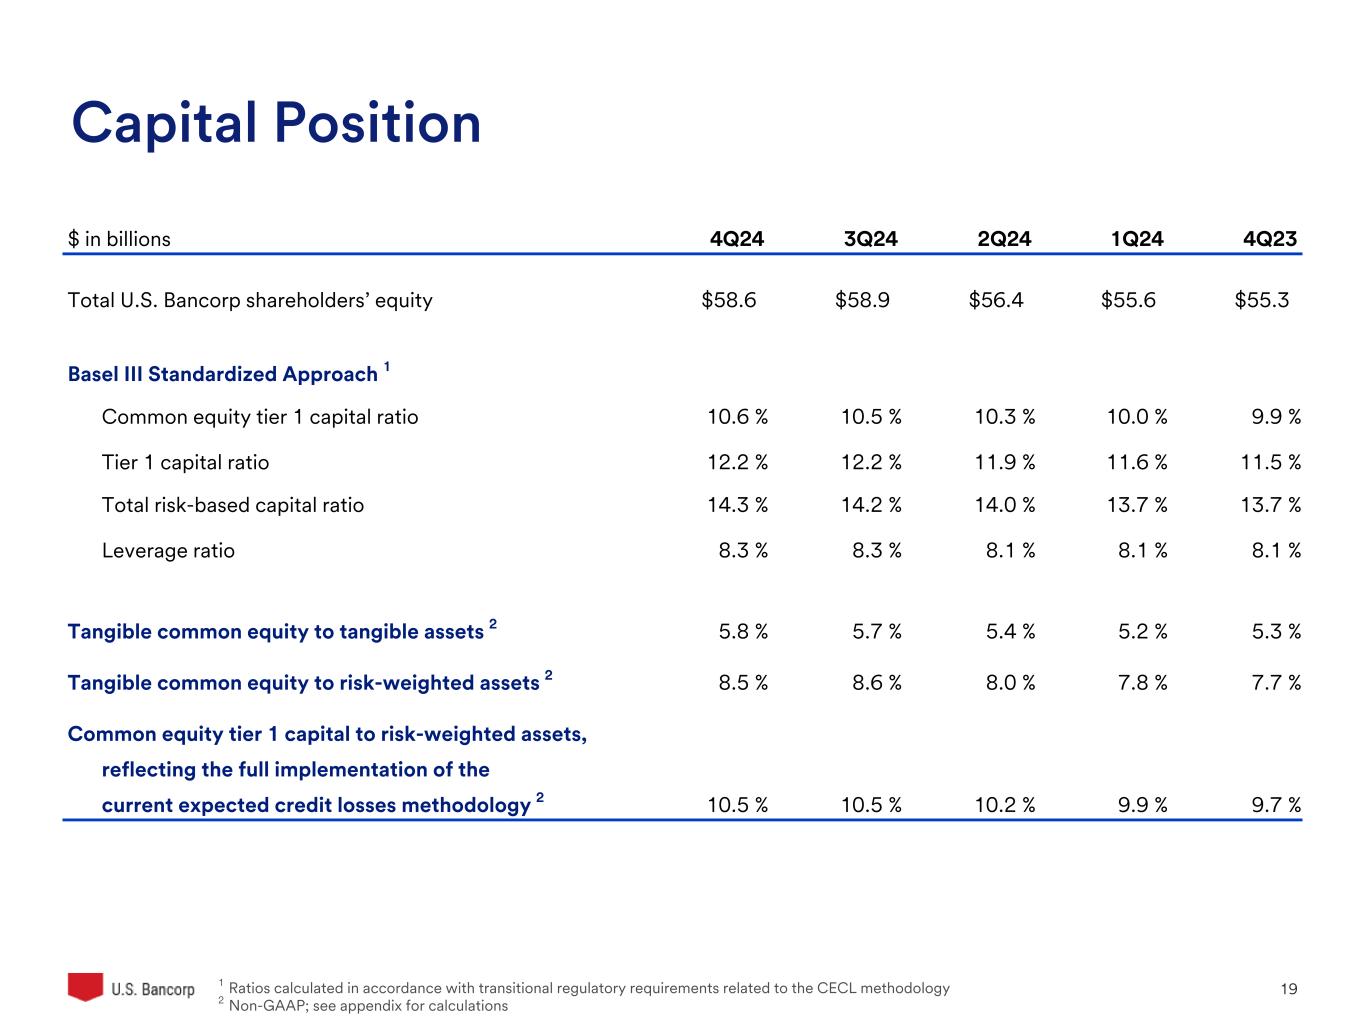
U.S. Bancorp 19 $ in billions 4Q24 3Q24 2Q24 1Q24 4Q23 Total U.S. Bancorp shareholders’ equity $58.6 $58.9 $56.4 $55.6 $55.3 Basel III Standardized Approach 1 Common equity tier 1 capital ratio 10.6 % 10.5 % 10.3 % 10.0 % 9.9 % Tier 1 capital ratio 12.2 % 12.2 % 11.9 % 11.6 % 11.5 % Total risk-based capital ratio 14.3 % 14.2 % 14.0 % 13.7 % 13.7 % Leverage ratio 8.3 % 8.3 % 8.1 % 8.1 % 8.1 % Tangible common equity to tangible assets 2 5.8 % 5.7 % 5.4 % 5.2 % 5.3 % Tangible common equity to risk-weighted assets 2 8.5 % 8.6 % 8.0 % 7.8 % 7.7 % Common equity tier 1 capital to risk-weighted assets, reflecting the full implementation of the current expected credit losses methodology 2 10.5 % 10.5 % 10.2 % 9.9 % 9.7 % 1 Ratios calculated in accordance with transitional regulatory requirements related to the CECL methodology 2 Non-GAAP; see appendix for calculations Capital Position
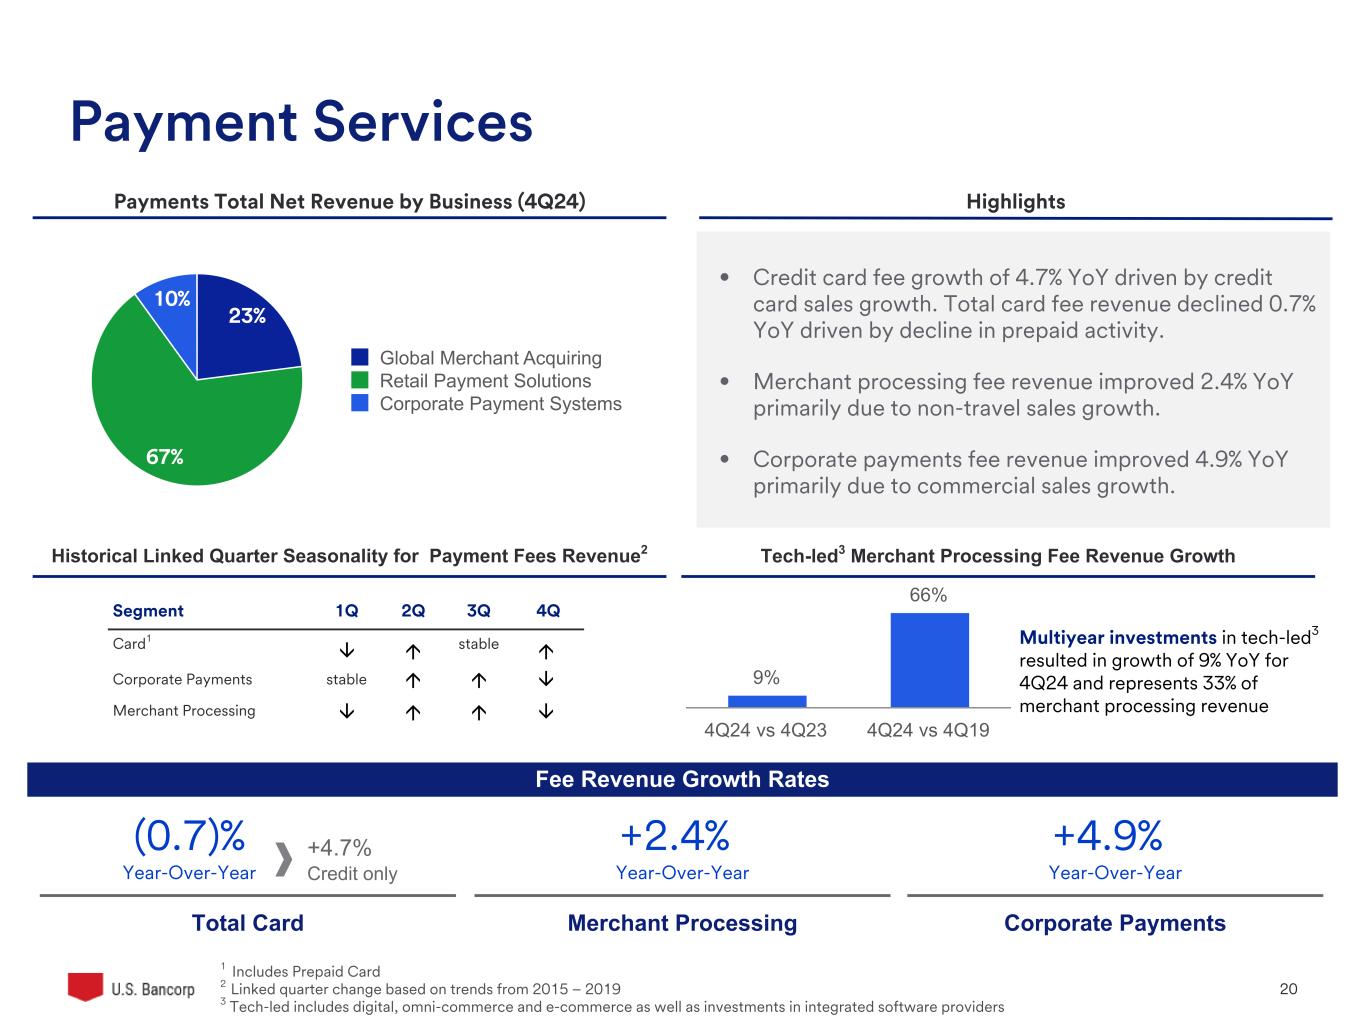
U.S. Bancorp 20 • Credit card fee growth of 4.7% YoY driven by credit card sales growth. Total card fee revenue declined 0.7% YoY driven by decline in prepaid activity. • Merchant processing fee revenue improved 2.4% YoY primarily due to non-travel sales growth. • Corporate payments fee revenue improved 4.9% YoY primarily due to commercial sales growth. Segment 1Q 2Q 3Q 4Q Card1 stable Corporate Payments stable Merchant Processing Merchant Processing Corporate PaymentsTotal Card Payments Total Net Revenue by Business (4Q24) Highlights Historical Linked Quarter Seasonality for Payment Fees Revenue2 â â â á á á á á á â (0.7)% Year-Over-Year +2.4% Year-Over-Year +4.9% Year-Over-Year 1 Includes Prepaid Card 2 Linked quarter change based on trends from 2015 – 2019 3 Tech-led includes digital, omni-commerce and e-commerce as well as investments in integrated software providers Payment Services +4.7% Credit only Fee Revenue Growth Rates Multiyear investments in tech-led3 resulted in growth of 9% YoY for 4Q24 and represents 33% of merchant processing revenue 23% 67% 10% Global Merchant Acquiring Retail Payment Solutions Corporate Payment Systems 9% 66% 4Q24 vs 4Q23 4Q24 vs 4Q19 Tech-led3 Merchant Processing Fee Revenue Growth
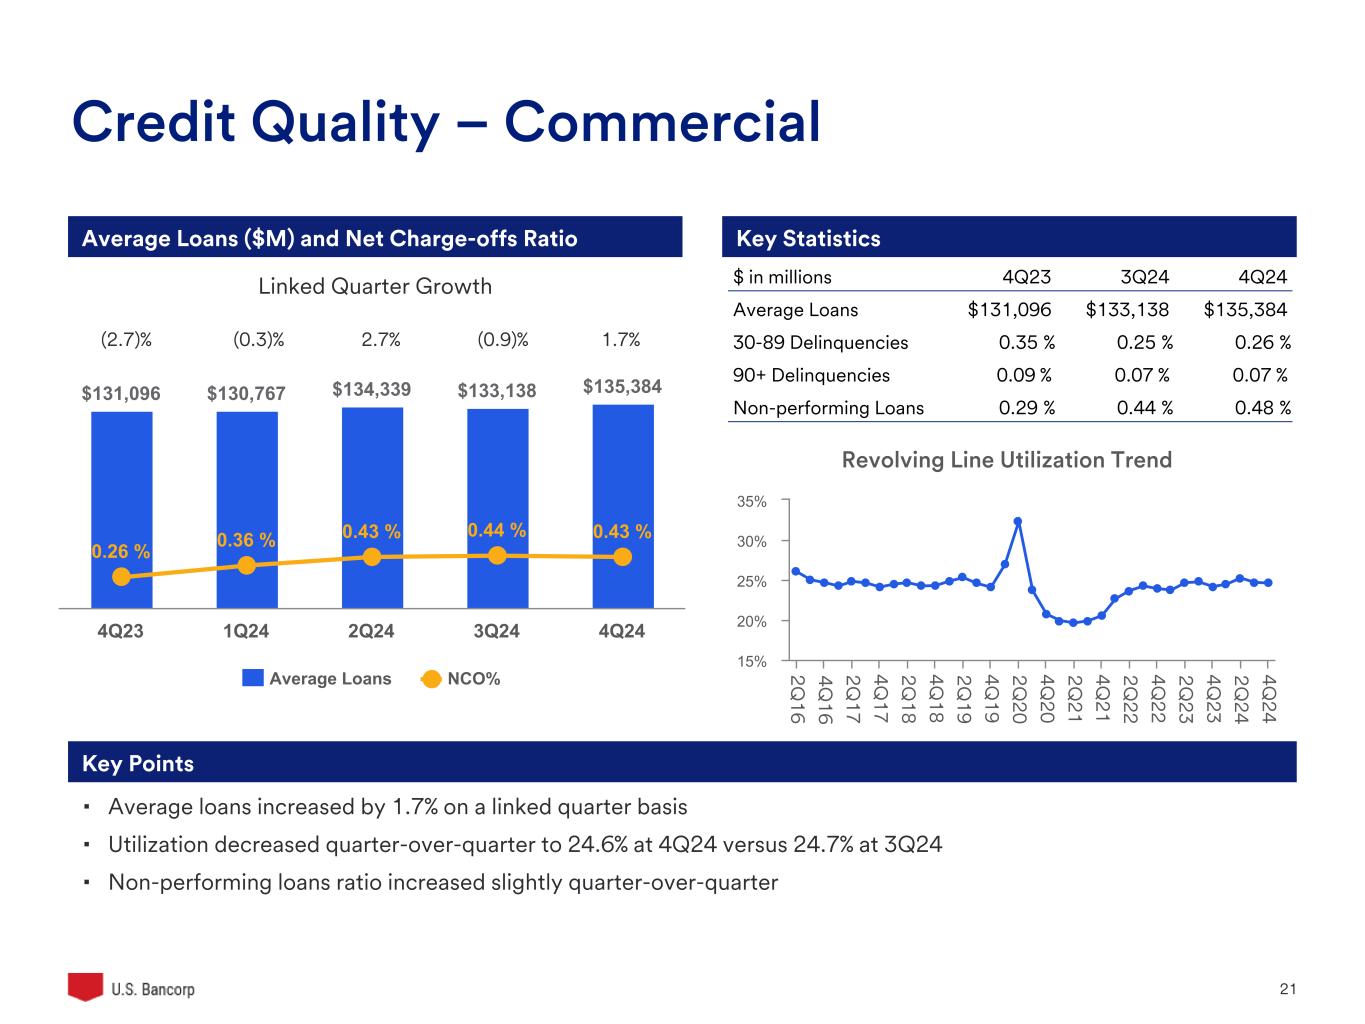
U.S. Bancorp 21 $131,096 $130,767 $134,339 $133,138 $135,384 0.26 % 0.36 % 0.43 % 0.44 % 0.43 % Average Loans NCO% 4Q23 1Q24 2Q24 3Q24 4Q24 Credit Quality – Commercial Key StatisticsAverage Loans ($M) and Net Charge-offs Ratio (2.7)% (0.3)% 2.7% (0.9)% 1.7% Linked Quarter Growth Key Points ▪ Average loans increased by 1.7% on a linked quarter basis ▪ Utilization decreased quarter-over-quarter to 24.6% at 4Q24 versus 24.7% at 3Q24 ▪ Non-performing loans ratio increased slightly quarter-over-quarter $ in millions 4Q23 3Q24 4Q24 Average Loans $131,096 $133,138 $135,384 30-89 Delinquencies 0.35 % 0.25 % 0.26 % 90+ Delinquencies 0.09 % 0.07 % 0.07 % Non-performing Loans 0.29 % 0.44 % 0.48 % Revolving Line Utilization Trend 2Q 16 4Q 16 2Q 17 4Q 17 2Q 18 4Q 18 2Q 19 4Q 19 2Q 20 4Q 20 2Q 21 4Q 21 2Q 22 4Q 22 2Q 23 4Q 23 2Q 24 4Q 24 15% 20% 25% 30% 35%
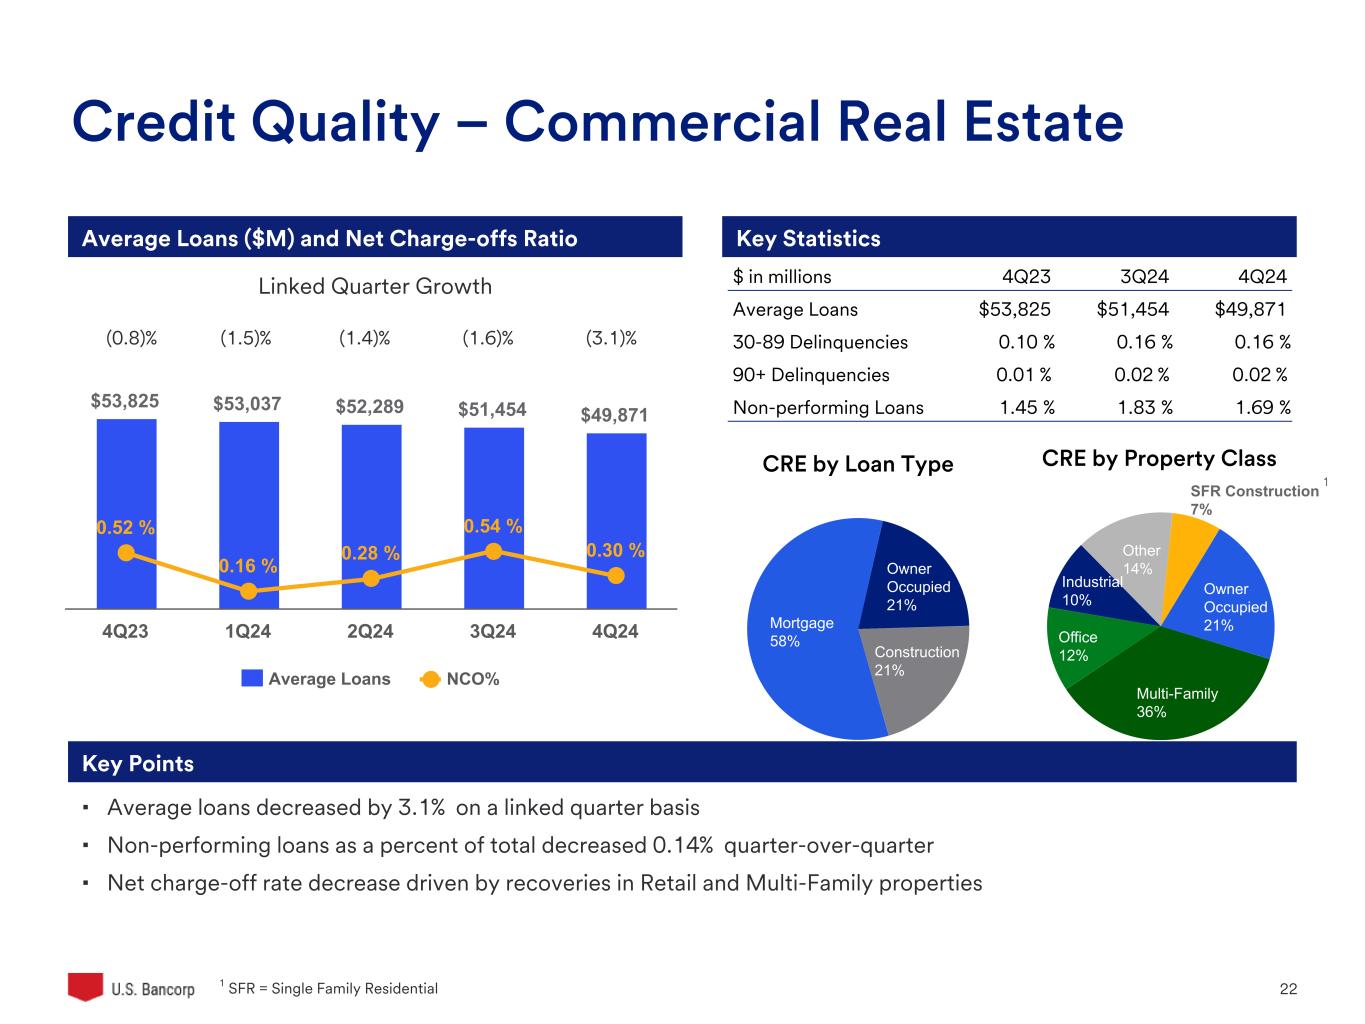
U.S. Bancorp 22 Credit Quality – Commercial Real Estate Key Points Average Loans ($M) and Net Charge-offs Ratio Key Statistics Linked Quarter Growth (0.8)% (1.5)% (1.4)% (1.6)% (3.1)% ▪ Average loans decreased by 3.1% on a linked quarter basis ▪ Non-performing loans as a percent of total decreased 0.14% quarter-over-quarter ▪ Net charge-off rate decrease driven by recoveries in Retail and Multi-Family properties 1 SFR = Single Family Residential $53,825 $53,037 $52,289 $51,454 $49,871 0.52 % 0.16 % 0.28 % 0.54 % 0.30 % Average Loans NCO% 4Q23 1Q24 2Q24 3Q24 4Q24 CRE by Loan Type Mortgage 58% Owner Occupied 21% Construction 21% CRE by Property Class SFR Construction 7% Owner Occupied 21% Multi-Family 36% Office 12% Industrial 10% Other 14% $ in millions 4Q23 3Q24 4Q24 Average Loans $53,825 $51,454 $49,871 30-89 Delinquencies 0.10 % 0.16 % 0.16 % 90+ Delinquencies 0.01 % 0.02 % 0.02 % Non-performing Loans 1.45 % 1.83 % 1.69 % 1
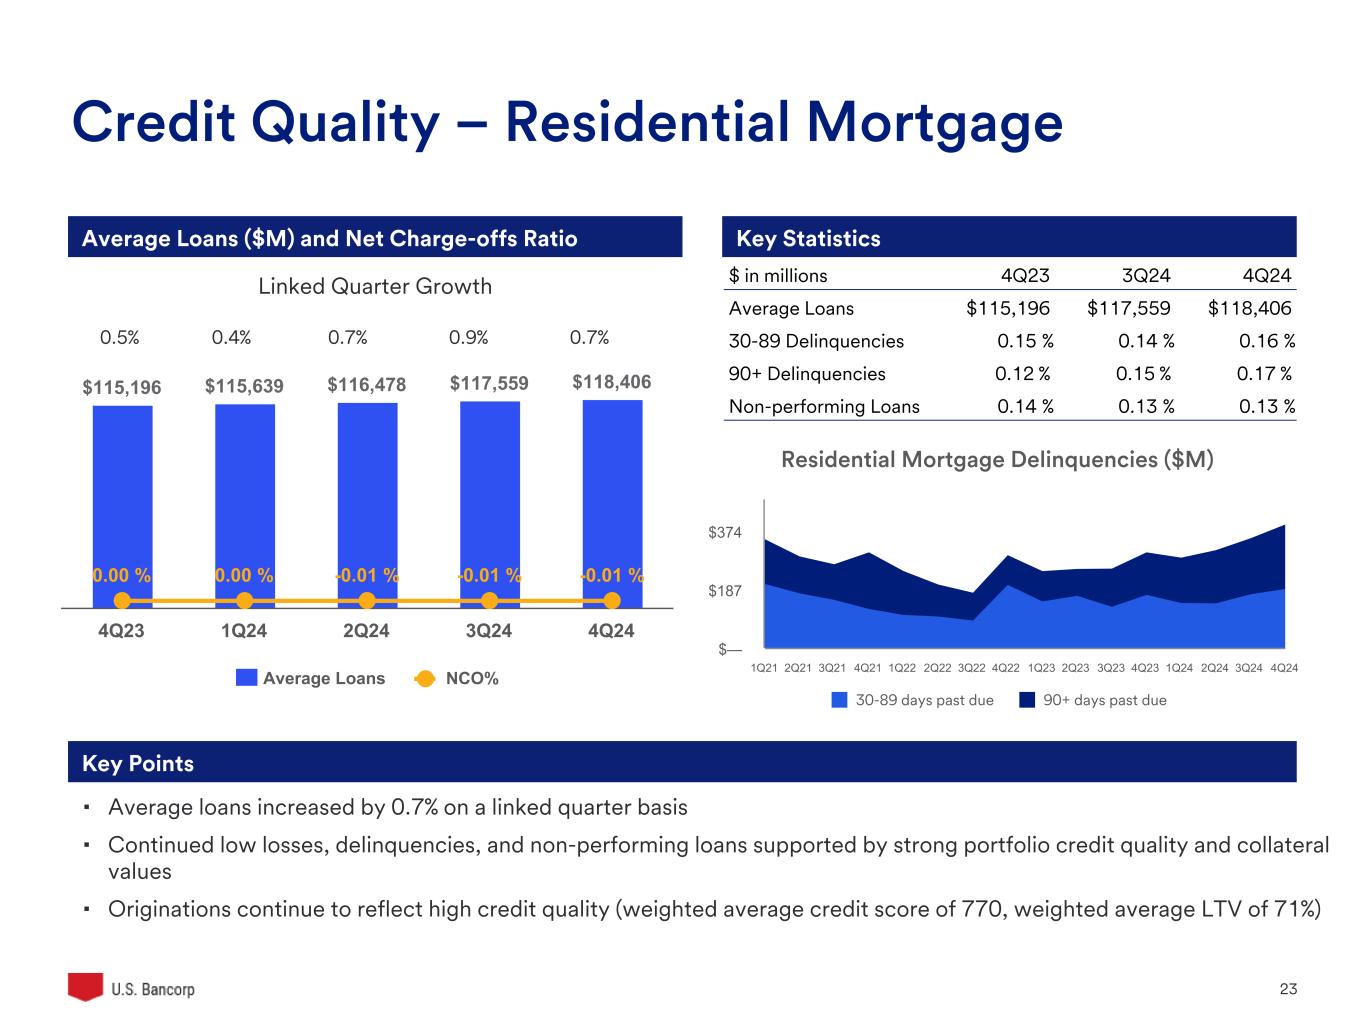
U.S. Bancorp 23 $115,196 $115,639 $116,478 $117,559 $118,406 0.00 % 0.00 % -0.01 % -0.01 % -0.01 % Average Loans NCO% 4Q23 1Q24 2Q24 3Q24 4Q24 Credit Quality – Residential Mortgage Key Points ▪ Average loans increased by 0.7% on a linked quarter basis ▪ Continued low losses, delinquencies, and non-performing loans supported by strong portfolio credit quality and collateral values ▪ Originations continue to reflect high credit quality (weighted average credit score of 770, weighted average LTV of 71%) Linked Quarter Growth Average Loans ($M) and Net Charge-offs Ratio Key Statistics $ in millions 4Q23 3Q24 4Q24 Average Loans $115,196 $117,559 $118,406 30-89 Delinquencies 0.15 % 0.14 % 0.16 % 90+ Delinquencies 0.12 % 0.15 % 0.17 % Non-performing Loans 0.14 % 0.13 % 0.13 % 0.5% 0.4% 0.7% 0.9% 0.7% Residential Mortgage Delinquencies ($M) 30-89 days past due 90+ days past due 1Q21 2Q21 3Q21 4Q21 1Q22 2Q22 3Q22 4Q22 1Q23 2Q23 3Q23 4Q23 1Q24 2Q24 3Q24 4Q24 $— $187 $374
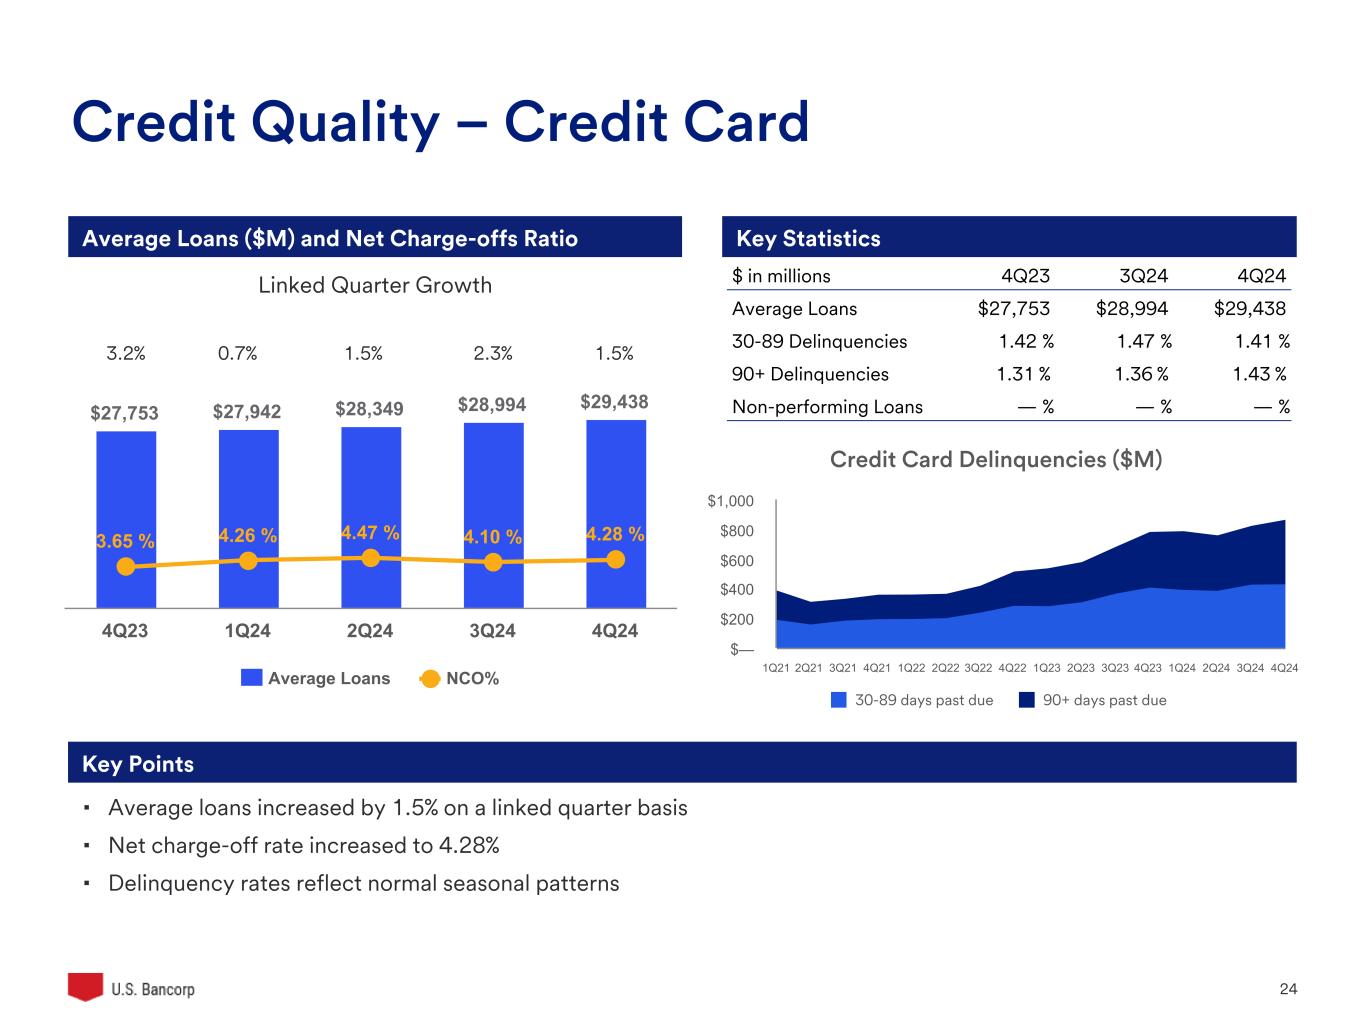
U.S. Bancorp 24 $27,753 $27,942 $28,349 $28,994 $29,438 3.65 % 4.26 % 4.47 % 4.10 % 4.28 % Average Loans NCO% 4Q23 1Q24 2Q24 3Q24 4Q24 Credit Quality – Credit Card Key Points ▪ Average loans increased by 1.5% on a linked quarter basis ▪ Net charge-off rate increased to 4.28% ▪ Delinquency rates reflect normal seasonal patterns Average Loans ($M) and Net Charge-offs Ratio Key Statistics 3.2% 0.7% 1.5% 2.3% 1.5% Linked Quarter Growth $ in millions 4Q23 3Q24 4Q24 Average Loans $27,753 $28,994 $29,438 30-89 Delinquencies 1.42 % 1.47 % 1.41 % 90+ Delinquencies 1.31 % 1.36 % 1.43 % Non-performing Loans — % — % — % Credit Card Delinquencies ($M) 30-89 days past due 90+ days past due 1Q21 2Q21 3Q21 4Q21 1Q22 2Q22 3Q22 4Q22 1Q23 2Q23 3Q23 4Q23 1Q24 2Q24 3Q24 4Q24 $— $200 $400 $600 $800 $1,000

U.S. Bancorp 25 Credit Quality – Other Retail Key Points ▪ Average loans decreased by 0.9% on a linked quarter basis ▪ Non-performing loans ratio remained relatively flat quarter-over-quarter ▪ Net charge-offs increase driven by seasonality Average Loans ($M) and Net Charge-offs Ratio Key Statistics Linked Quarter Growth (3.0)% (2.9)% (1.0)% (0.7)% (0.9)% $44,986 $43,685 $43,230 $42,925 $42,556 0.47 % 0.51 % 0.45 % 0.47 % 0.59 % Average Loans NCO% 4Q23 1Q24 2Q24 3Q24 4Q24 Auto Loans 16% Installment 34% Home Equity 32% Retail Leasing 9% Revolving Credit 9% $ in millions 4Q23 3Q24 4Q24 Average Loans $44,986 $42,925 $42,556 30-89 Delinquencies 0.63 % 0.52 % 0.54 % 90+ Delinquencies 0.15 % 0.14 % 0.15 % Non-performing Loans 0.31 % 0.34 % 0.35 %
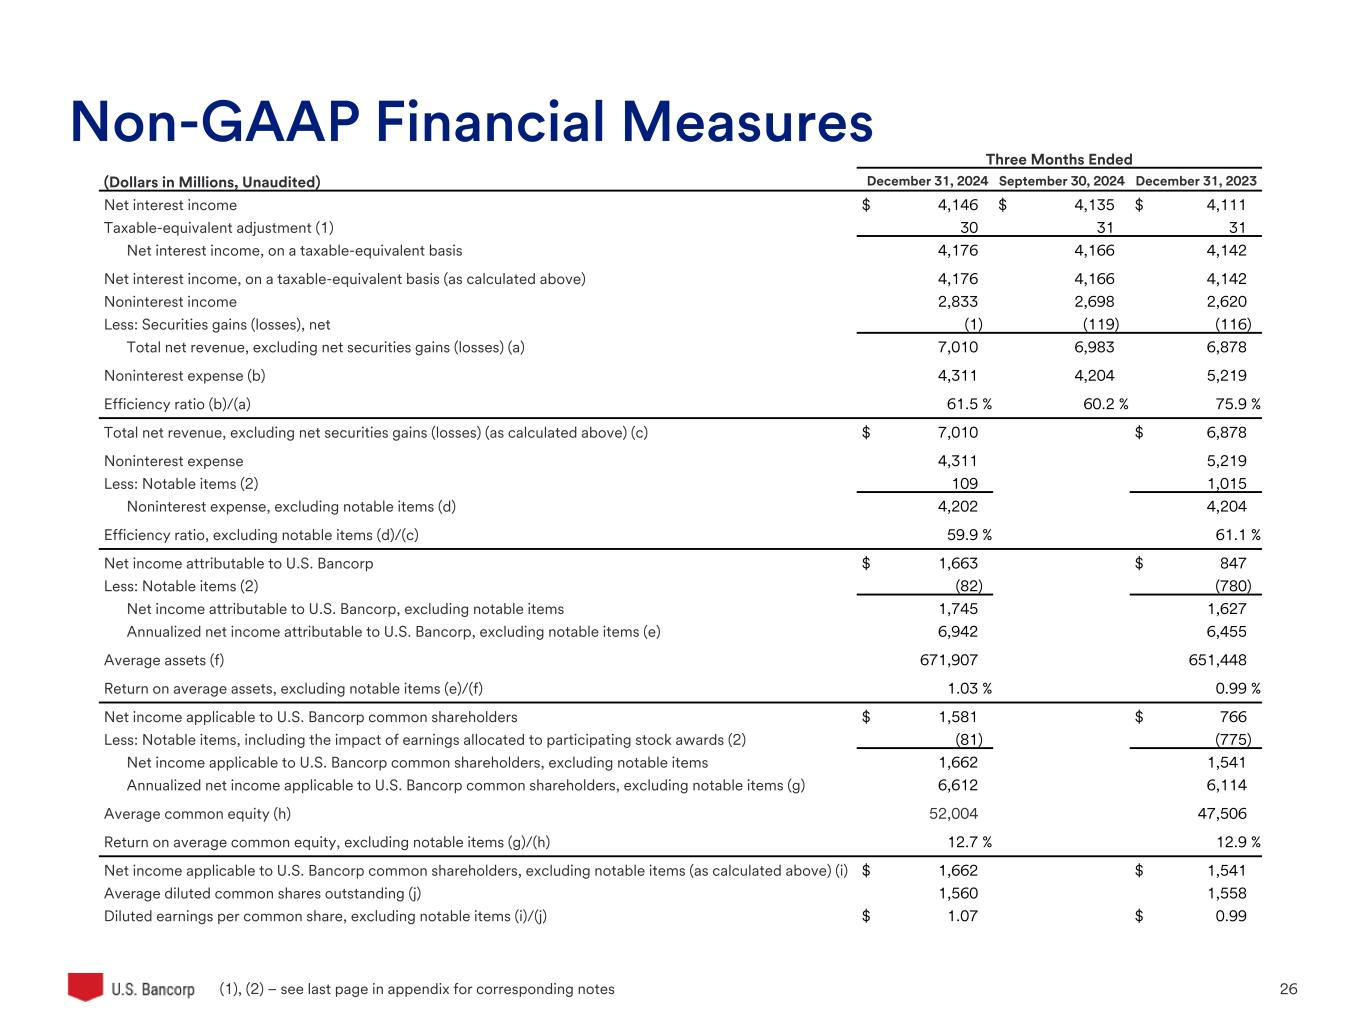
U.S. Bancorp 26 Non-GAAP Financial Measures (1), (2) – see last page in appendix for corresponding notes Three Months Ended (Dollars in Millions, Unaudited) December 31, 2024 September 30, 2024 December 31, 2023 Net interest income $ 4,146 $ 4,135 $ 4,111 Taxable-equivalent adjustment (1) 30 31 31 Net interest income, on a taxable-equivalent basis 4,176 4,166 4,142 Net interest income, on a taxable-equivalent basis (as calculated above) 4,176 4,166 4,142 Noninterest income 2,833 2,698 2,620 Less: Securities gains (losses), net (1) (119) (116) Total net revenue, excluding net securities gains (losses) (a) 7,010 6,983 6,878 Noninterest expense (b) 4,311 4,204 5,219 Efficiency ratio (b)/(a) 61.5 % 60.2 % 75.9 % Total net revenue, excluding net securities gains (losses) (as calculated above) (c) $ 7,010 $ 6,878 Noninterest expense 4,311 5,219 Less: Notable items (2) 109 1,015 Noninterest expense, excluding notable items (d) 4,202 4,204 Efficiency ratio, excluding notable items (d)/(c) 59.9 % 61.1 % Net income attributable to U.S. Bancorp $ 1,663 $ 847 Less: Notable items (2) (82) (780) Net income attributable to U.S. Bancorp, excluding notable items 1,745 1,627 Annualized net income attributable to U.S. Bancorp, excluding notable items (e) 6,942 6,455 Average assets (f) 671,907 651,448 Return on average assets, excluding notable items (e)/(f) 1.03 % 0.99 % Net income applicable to U.S. Bancorp common shareholders $ 1,581 $ 766 Less: Notable items, including the impact of earnings allocated to participating stock awards (2) (81) (775) Net income applicable to U.S. Bancorp common shareholders, excluding notable items 1,662 1,541 Annualized net income applicable to U.S. Bancorp common shareholders, excluding notable items (g) 6,612 6,114 Average common equity (h) 52,004 47,506 Return on average common equity, excluding notable items (g)/(h) 12.7 % 12.9 % Net income applicable to U.S. Bancorp common shareholders, excluding notable items (as calculated above) (i) $ 1,662 $ 1,541 Average diluted common shares outstanding (j) 1,560 1,558 Diluted earnings per common share, excluding notable items (i)/(j) $ 1.07 $ 0.99
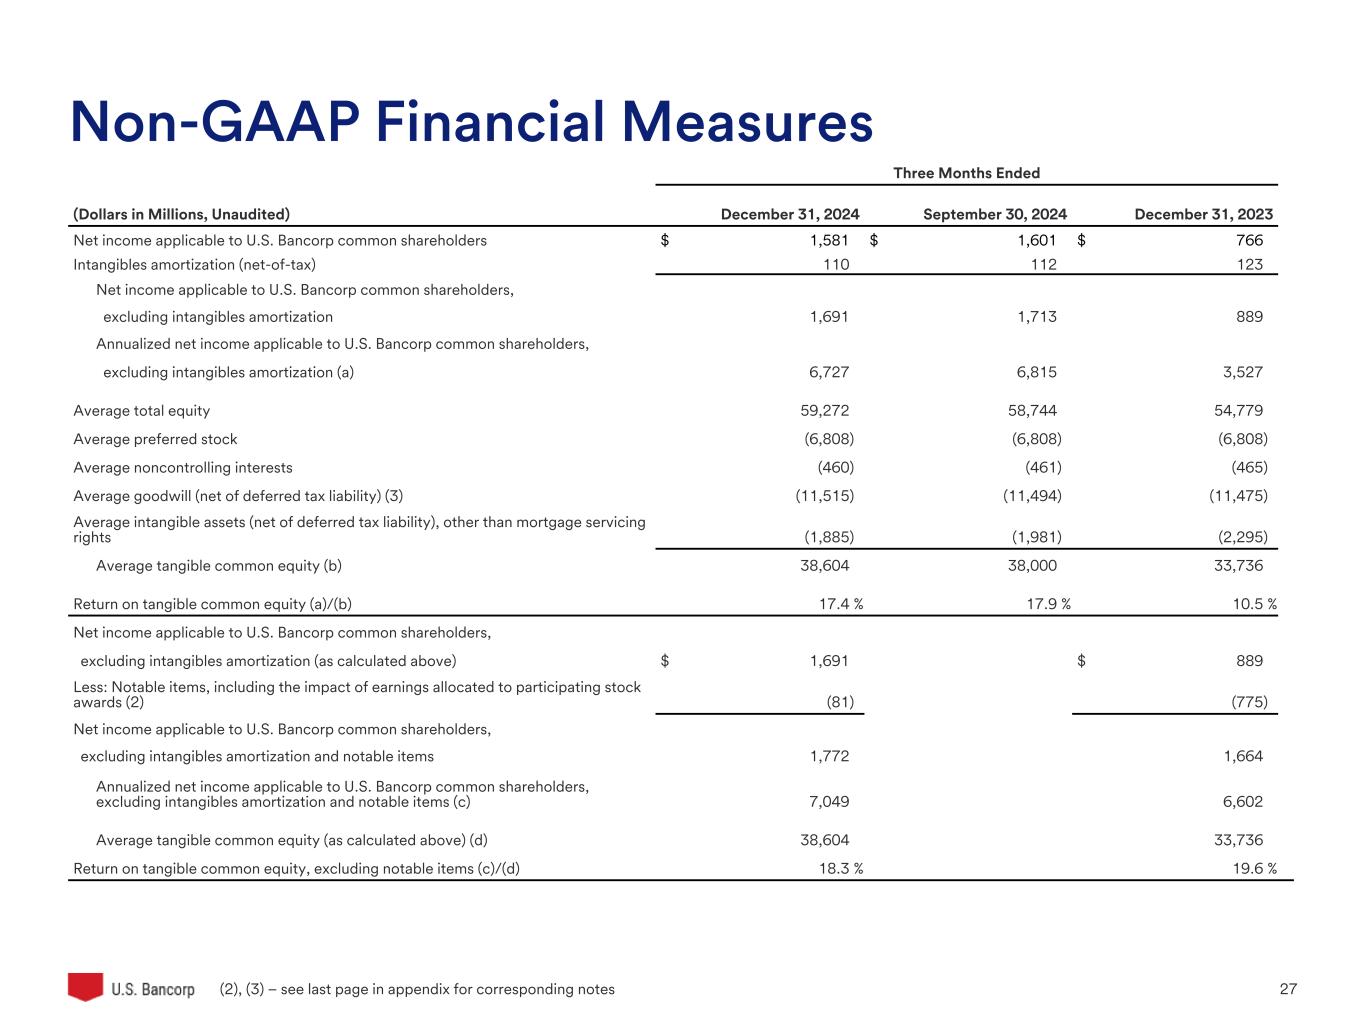
U.S. Bancorp 27 Three Months Ended (Dollars in Millions, Unaudited) December 31, 2024 September 30, 2024 December 31, 2023 Net income applicable to U.S. Bancorp common shareholders $ 1,581 $ 1,601 $ 766 Intangibles amortization (net-of-tax) 110 112 123 Net income applicable to U.S. Bancorp common shareholders, excluding intangibles amortization 1,691 1,713 889 Annualized net income applicable to U.S. Bancorp common shareholders, excluding intangibles amortization (a) 6,727 6,815 3,527 Average total equity 59,272 58,744 54,779 Average preferred stock (6,808) (6,808) (6,808) Average noncontrolling interests (460) (461) (465) Average goodwill (net of deferred tax liability) (3) (11,515) (11,494) (11,475) Average intangible assets (net of deferred tax liability), other than mortgage servicing rights (1,885) (1,981) (2,295) Average tangible common equity (b) 38,604 38,000 33,736 Return on tangible common equity (a)/(b) 17.4 % 17.9 % 10.5 % Net income applicable to U.S. Bancorp common shareholders, excluding intangibles amortization (as calculated above) $ 1,691 $ 889 Less: Notable items, including the impact of earnings allocated to participating stock awards (2) (81) (775) Net income applicable to U.S. Bancorp common shareholders, excluding intangibles amortization and notable items 1,772 1,664 Annualized net income applicable to U.S. Bancorp common shareholders, excluding intangibles amortization and notable items (c) 7,049 6,602 Average tangible common equity (as calculated above) (d) 38,604 33,736 Return on tangible common equity, excluding notable items (c)/(d) 18.3 % 19.6 % (2), (3) – see last page in appendix for corresponding notes Non-GAAP Financial Measures
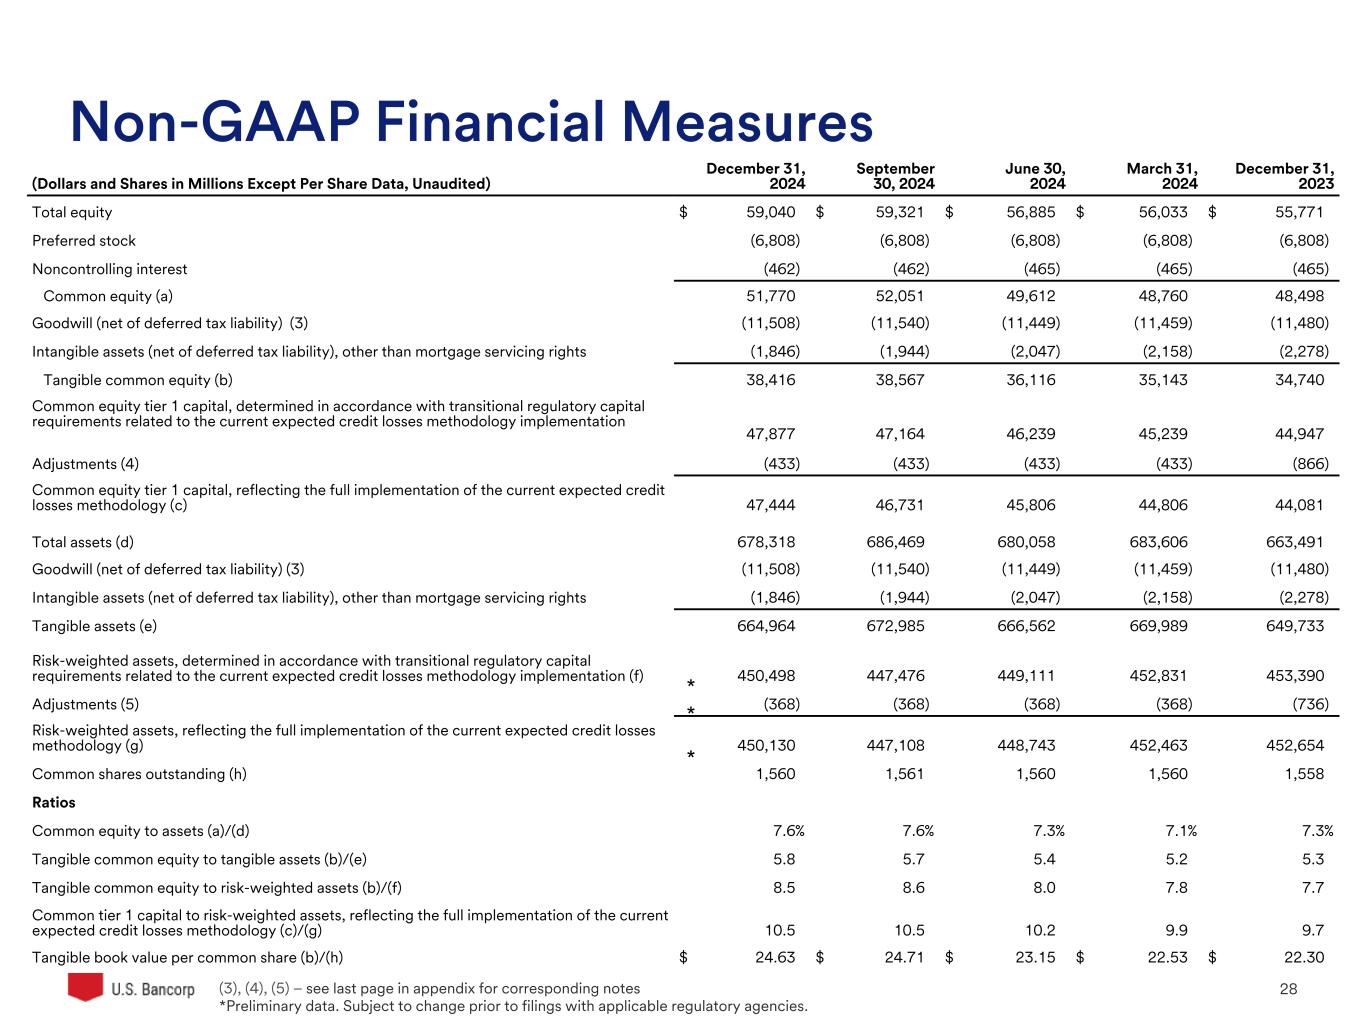
U.S. Bancorp 28 Non-GAAP Financial Measures (Dollars and Shares in Millions Except Per Share Data, Unaudited) December 31, 2024 September 30, 2024 June 30, 2024 March 31, 2024 December 31, 2023 Total equity $ 59,040 $ 59,321 $ 56,885 $ 56,033 $ 55,771 Preferred stock (6,808) (6,808) (6,808) (6,808) (6,808) Noncontrolling interest (462) (462) (465) (465) (465) Common equity (a) 51,770 52,051 49,612 48,760 48,498 Goodwill (net of deferred tax liability) (3) (11,508) (11,540) (11,449) (11,459) (11,480) Intangible assets (net of deferred tax liability), other than mortgage servicing rights (1,846) (1,944) (2,047) (2,158) (2,278) Tangible common equity (b) 38,416 38,567 36,116 35,143 34,740 Common equity tier 1 capital, determined in accordance with transitional regulatory capital requirements related to the current expected credit losses methodology implementation 47,877 47,164 46,239 45,239 44,947 Adjustments (4) (433) (433) (433) (433) (866) Common equity tier 1 capital, reflecting the full implementation of the current expected credit losses methodology (c) 47,444 46,731 45,806 44,806 44,081 Total assets (d) 678,318 686,469 680,058 683,606 663,491 Goodwill (net of deferred tax liability) (3) (11,508) (11,540) (11,449) (11,459) (11,480) Intangible assets (net of deferred tax liability), other than mortgage servicing rights (1,846) (1,944) (2,047) (2,158) (2,278) Tangible assets (e) 664,964 672,985 666,562 669,989 649,733 Risk-weighted assets, determined in accordance with transitional regulatory capital requirements related to the current expected credit losses methodology implementation (f) 450,498 447,476 449,111 452,831 453,390 Adjustments (5) (368) (368) (368) (368) (736) Risk-weighted assets, reflecting the full implementation of the current expected credit losses methodology (g) 450,130 447,108 448,743 452,463 452,654 Common shares outstanding (h) 1,560 1,561 1,560 1,560 1,558 Ratios Common equity to assets (a)/(d) 7.6% 7.6% 7.3% 7.1% 7.3% Tangible common equity to tangible assets (b)/(e) 5.8 5.7 5.4 5.2 5.3 Tangible common equity to risk-weighted assets (b)/(f) 8.5 8.6 8.0 7.8 7.7 Common tier 1 capital to risk-weighted assets, reflecting the full implementation of the current expected credit losses methodology (c)/(g) 10.5 10.5 10.2 9.9 9.7 Tangible book value per common share (b)/(h) $ 24.63 $ 24.71 $ 23.15 $ 22.53 $ 22.30 (3), (4), (5) – see last page in appendix for corresponding notes *Preliminary data. Subject to change prior to filings with applicable regulatory agencies. * * *
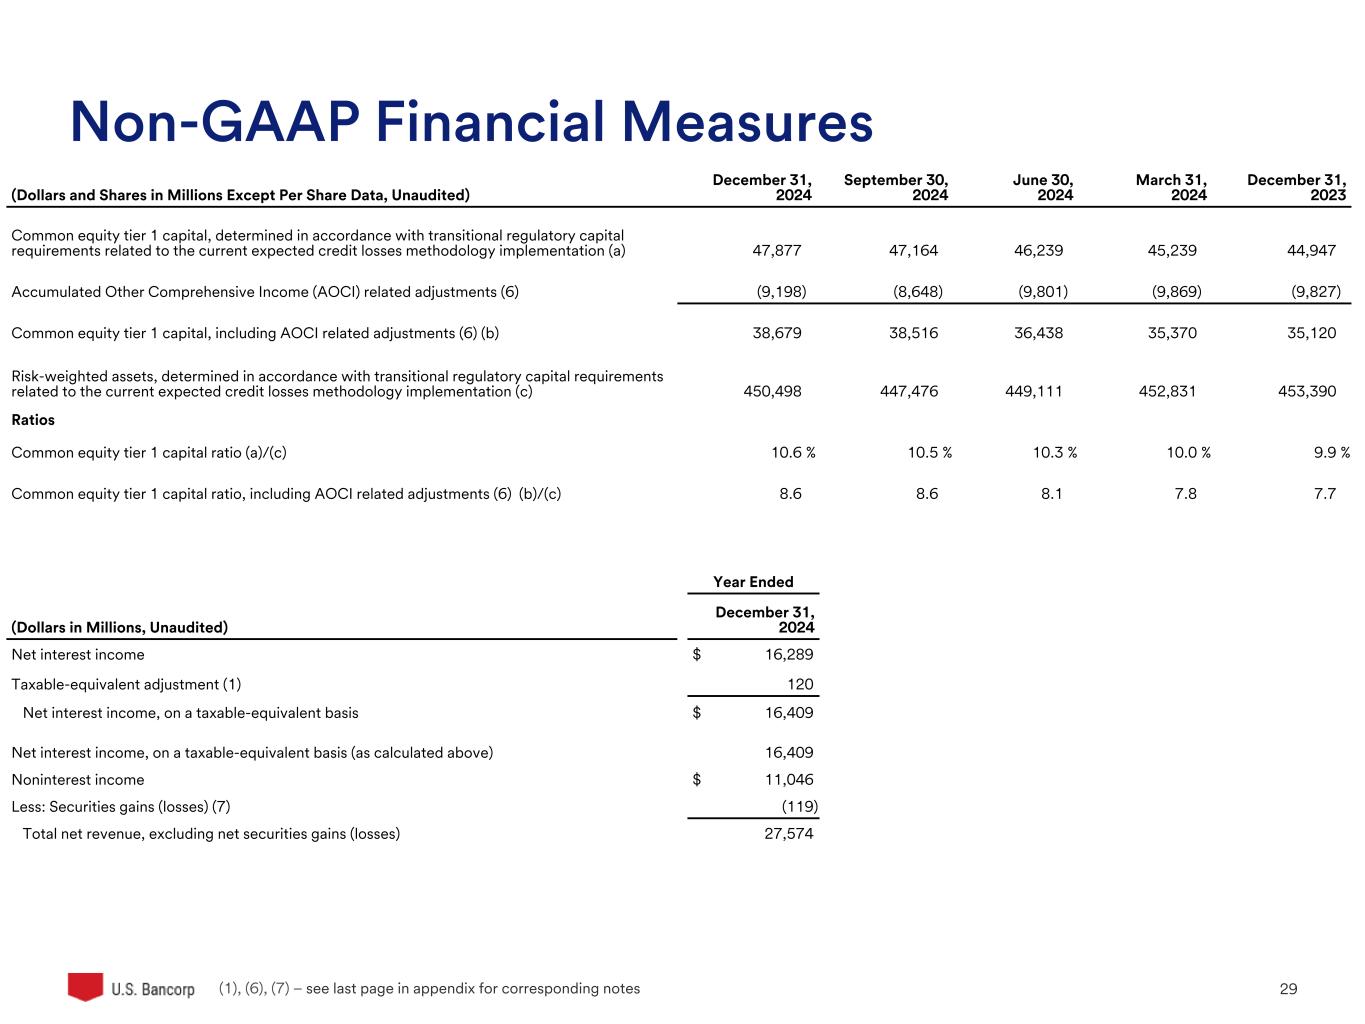
U.S. Bancorp 29 Non-GAAP Financial Measures (Dollars and Shares in Millions Except Per Share Data, Unaudited) December 31, 2024 September 30, 2024 June 30, 2024 March 31, 2024 December 31, 2023 Common equity tier 1 capital, determined in accordance with transitional regulatory capital requirements related to the current expected credit losses methodology implementation (a) 47,877 47,164 46,239 45,239 44,947 Accumulated Other Comprehensive Income (AOCI) related adjustments (6) (9,198) (8,648) (9,801) (9,869) (9,827) Common equity tier 1 capital, including AOCI related adjustments (6) (b) 38,679 38,516 36,438 35,370 35,120 Risk-weighted assets, determined in accordance with transitional regulatory capital requirements related to the current expected credit losses methodology implementation (c) 450,498 447,476 449,111 452,831 453,390 Ratios Common equity tier 1 capital ratio (a)/(c) 10.6 % 10.5 % 10.3 % 10.0 % 9.9 % Common equity tier 1 capital ratio, including AOCI related adjustments (6) (b)/(c) 8.6 8.6 8.1 7.8 7.7 (1), (6), (7) – see last page in appendix for corresponding notes Year Ended (Dollars in Millions, Unaudited) December 31, 2024 Net interest income $ 16,289 Taxable-equivalent adjustment (1) 120 Net interest income, on a taxable-equivalent basis $ 16,409 Net interest income, on a taxable-equivalent basis (as calculated above) 16,409 Noninterest income $ 11,046 Less: Securities gains (losses) (7) (119) Total net revenue, excluding net securities gains (losses) 27,574
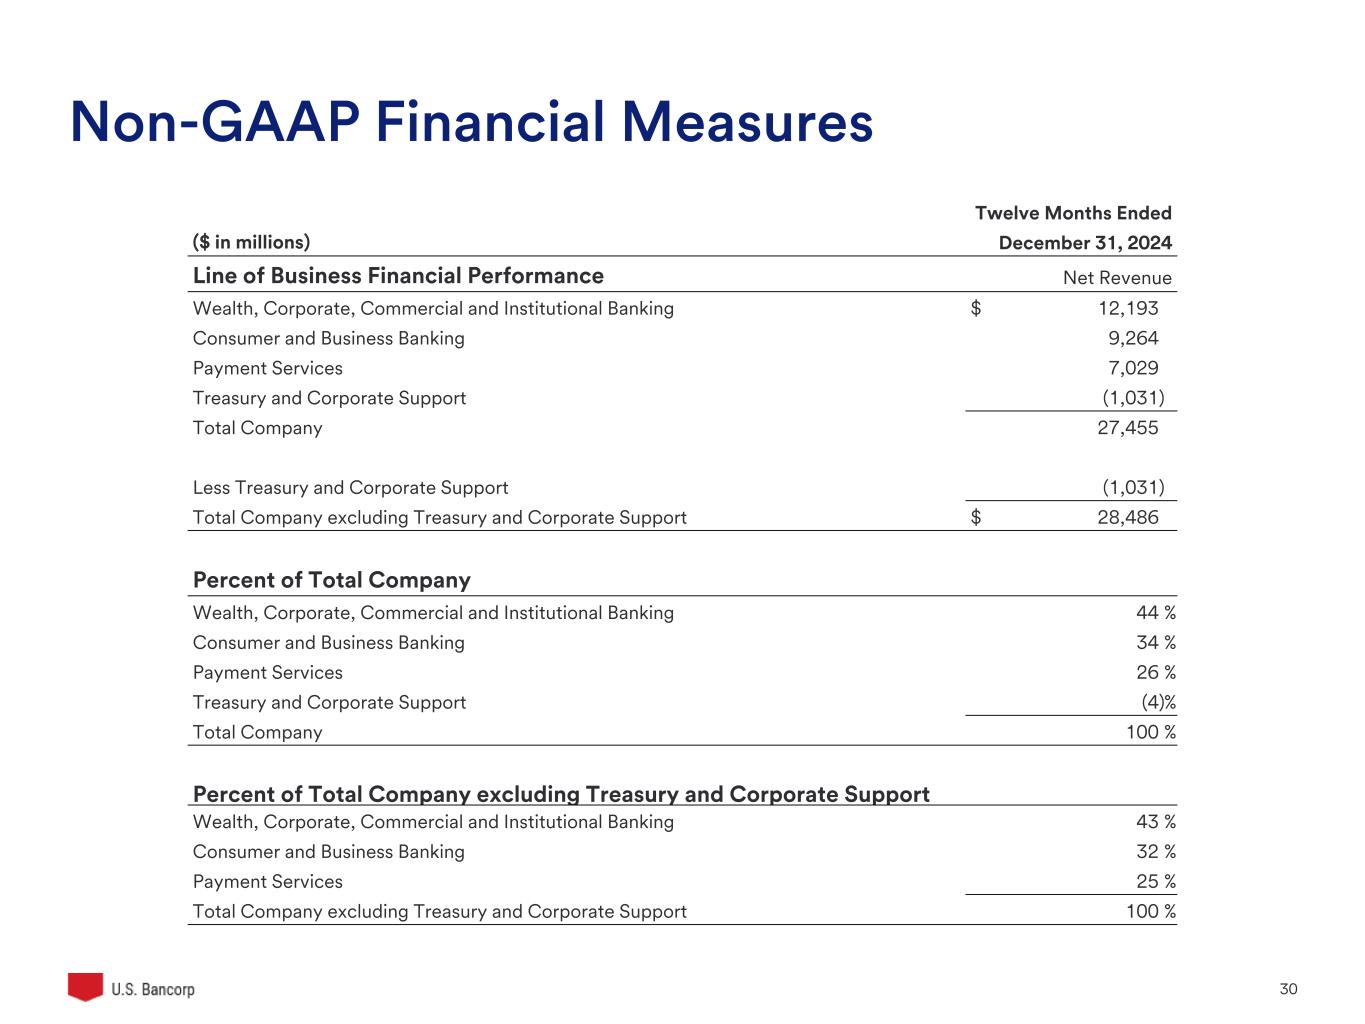
U.S. Bancorp 30 Non-GAAP Financial Measures ($ in millions) Twelve Months Ended December 31, 2024 Line of Business Financial Performance Net Revenue Wealth, Corporate, Commercial and Institutional Banking $ 12,193 Consumer and Business Banking 9,264 Payment Services 7,029 Treasury and Corporate Support (1,031) Total Company 27,455 Less Treasury and Corporate Support (1,031) Total Company excluding Treasury and Corporate Support $ 28,486 Percent of Total Company Wealth, Corporate, Commercial and Institutional Banking 44 % Consumer and Business Banking 34 % Payment Services 26 % Treasury and Corporate Support (4) % Total Company 100 % Percent of Total Company excluding Treasury and Corporate Support Wealth, Corporate, Commercial and Institutional Banking 43 % Consumer and Business Banking 32 % Payment Services 25 % Total Company excluding Treasury and Corporate Support 100 %
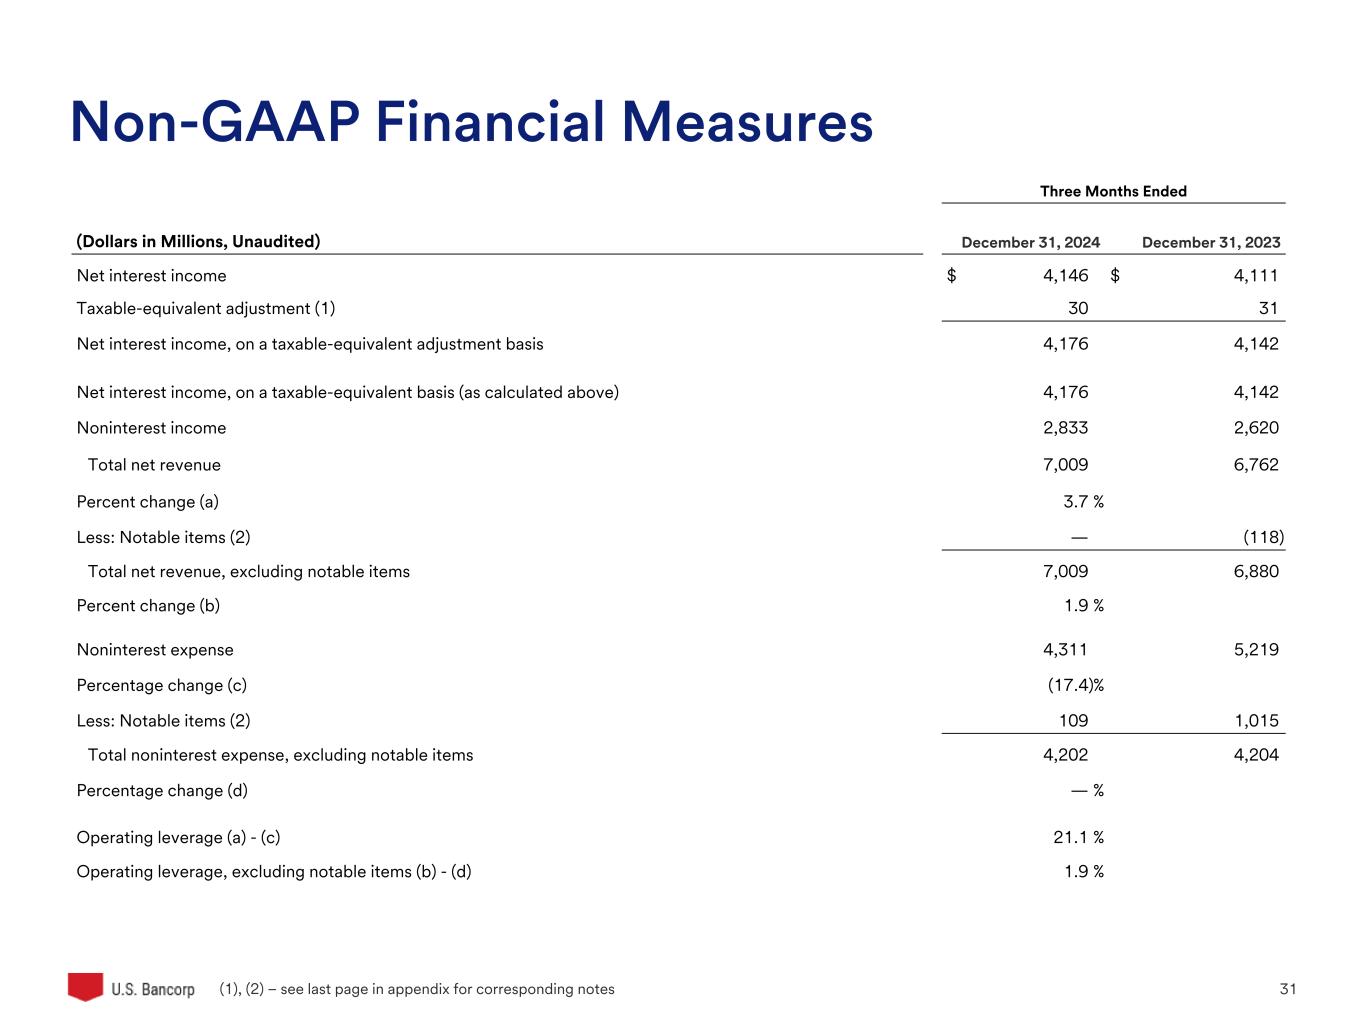
U.S. Bancorp 31 Three Months Ended (Dollars in Millions, Unaudited) December 31, 2024 December 31, 2023 Net interest income $ 4,146 $ 4,111 Taxable-equivalent adjustment (1) 30 31 Net interest income, on a taxable-equivalent adjustment basis 4,176 4,142 Net interest income, on a taxable-equivalent basis (as calculated above) 4,176 4,142 Noninterest income 2,833 2,620 Total net revenue 7,009 6,762 Percent change (a) 3.7 % Less: Notable items (2) — (118) Total net revenue, excluding notable items 7,009 6,880 Percent change (b) 1.9 % Noninterest expense 4,311 5,219 Percentage change (c) (17.4) % Less: Notable items (2) 109 1,015 Total noninterest expense, excluding notable items 4,202 4,204 Percentage change (d) — % Operating leverage (a) - (c) 21.1 % Operating leverage, excluding notable items (b) - (d) 1.9 % Non-GAAP Financial Measures (1), (2) – see last page in appendix for corresponding notes

U.S. Bancorp 32 Notes 1. Based on a federal income tax rate of 21 percent for those assets and liabilities whose income or expense is not included for federal income tax purposes. 2. Notable items for the three months ended December 31, 2024 of $109 million ($82 million net-of-tax) included lease impairments and operational efficiency actions. Notable items for the three months ended December 31, 2023 of $1.1 billion ($780 million net-of-tax, including a $70 million discrete tax benefit) included $(118) million of noninterest income related to investment securities balance sheet repositioning and capital management actions, $171 million of merger and integration-related charges, $734 million of FDIC special assessment charges and a $110 million charitable contribution. 3. Includes goodwill related to certain investments in unconsolidated financial institutions per prescribed regulatory requirements. 4. Includes the estimated increase in the allowance for credit losses related to the adoption of the current expected credit losses methodology net of deferred taxes. 5. Includes the impact of the estimated increase in the allowance for credit losses related to the adoption of the current expected credit losses methodology. 6. Includes Accumulated Other Comprehensive Income (AOCI) related to available for sale securities, pension plans, and available for sale to held to maturity transfers. 7. Securities gains (losses) for the third quarter of 2024 related to investment portfolio repositioning.

U.S. Bancorp 33


