Exhibit 99.1
| Morgan Stanley Financials Conference 2012 Richard K. Davis Chairman, President and CEO June 12, 2012 |
| The following information appears in accordance with the Private Securities Litigation Reform Act of 1995: This presentation contains forward-looking statements about U.S. Bancorp. Statements that are not historical or current facts, including statements about beliefs and expectations, are forward-looking statements and are based on the information available to, and assumptions and estimates made by, management as of the date made. These forward-looking statements cover, among other things, anticipated future revenue and expenses and the future plans and prospects of U.S. Bancorp. Forward-looking statements involve inherent risks and uncertainties, and important factors could cause actual results to differ materially from those anticipated. Global and domestic economies could fail to recover from the recent economic downturn or could experience another severe contraction, which could adversely affect U.S. Bancorp's revenues and the values of its assets and liabilities. Global financial markets could experience a recurrence of significant turbulence, which could reduce the availability of funding to certain financial institutions and lead to a tightening of credit, a reduction of business activity, and increased market volatility. Continued stress in the commercial real estate markets, as well as a delay or failure of recovery in the residential real estate markets, could cause additional credit losses and deterioration in asset values. In addition, U.S. Bancorp's business and financial performance is likely to be negatively impacted by effects of recently enacted and future legislation and regulation. U.S. Bancorp's results could also be adversely affected by continued deterioration in general business and economic conditions; changes in interest rates; deterioration in the credit quality of its loan portfolios or in the value of the collateral securing those loans; deterioration in the value of securities held in its investment securities portfolio; legal and regulatory developments; increased competition from both banks and non-banks; changes in customer behavior and preferences; effects of mergers and acquisitions and related integration; effects of critical accounting policies and judgments; and management's ability to effectively manage credit risk, residual value risk, market risk, operational risk, interest rate risk and liquidity risk. For discussion of these and other risks that may cause actual results to differ from expectations, refer to U.S. Bancorp's Annual Report on Form 10-K for the year ended December 31, 2011, on file with the Securities and Exchange Commission, including the sections entitled "Risk Factors" and "Corporate Risk Profile" contained in Exhibit 13, and all subsequent filings with the Securities and Exchange Commission under Sections 13(a), 13(c), 14 or 15(d) of the Securities Exchange Act of 1934. Forward-looking statements speak only as of the date they are made, and U.S. Bancorp undertakes no obligation to update them in light of new information or future events. This presentation includes non-GAAP financial measures to describe U.S. Bancorp's performance. The reconciliations of those measures to GAAP measures are provided within or in the appendix of the presentation. These disclosures should not be viewed as a substitute for operating results determined in accordance with GAAP, nor are they necessarily comparable to non-GAAP performance measures that may be presented by other companies. Forward-looking Statements and Additional Information |

| U.S. Bancorp Overview Capital Management Investing for Growth |
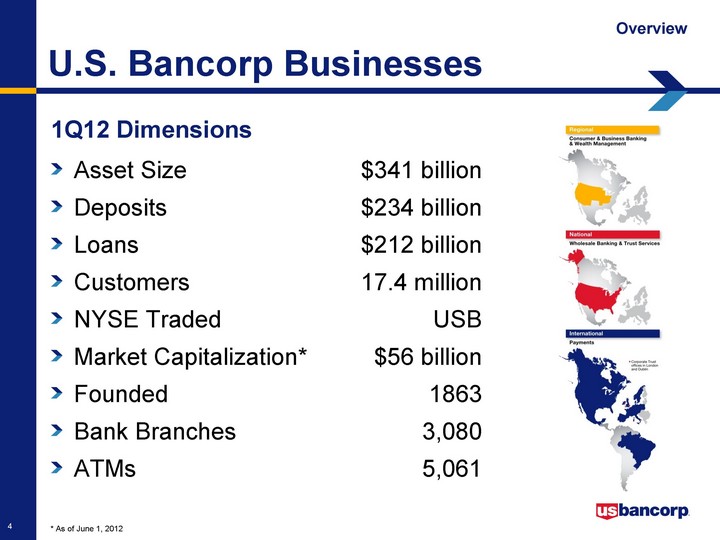
| 1Q12 Dimensions * As of June 1, 2012 Overview U.S. Bancorp Businesses Asset Size $341 billion Deposits $234 billion Loans $212 billion Customers 17.4 million NYSE Traded USB Market Capitalization* $56 billion Founded 1863 Bank Branches 3,080 ATMs 5,061 |
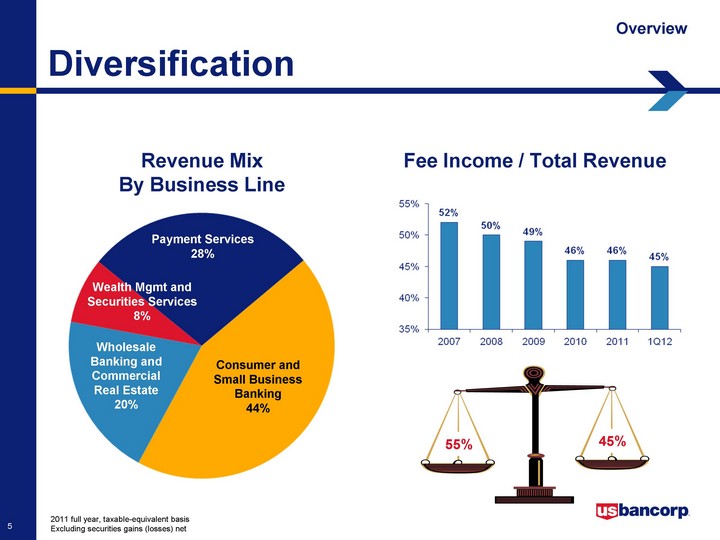
| 2011 full year, taxable-equivalent basis Excluding securities gains (losses) net Revenue Mix By Business Line Fee Income / Total Revenue Diversification Consumer and Small Business Banking 44% Payment Services 28% Wealth Mgmt and Securities Services 8% Wholesale Banking and Commercial Real Estate 20% Overview 55% 45% |
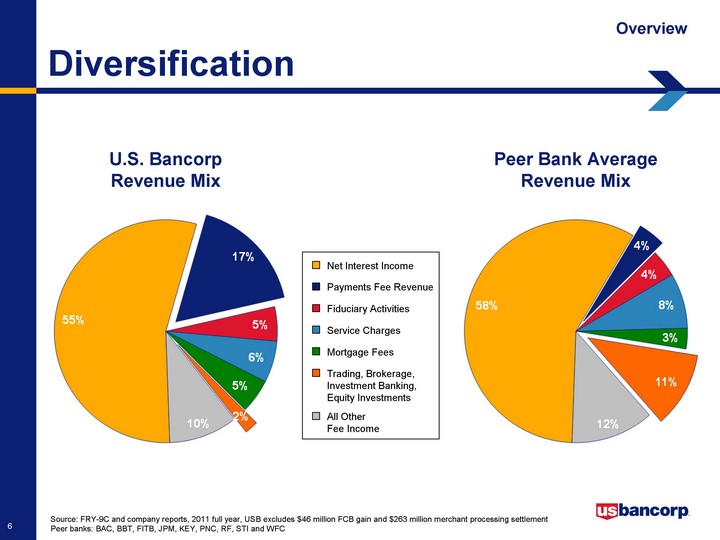
| Source: FRY-9C and company reports, 2011 full year, USB excludes $46 million FCB gain and $263 million merchant processing settlement Peer banks: BAC, BBT, FITB, JPM, KEY, PNC, RF, STI and WFC U.S. Bancorp Revenue Mix Diversification Overview Peer Bank Average Revenue Mix Net Interest Income Payments Fee Revenue Fiduciary Activities Service Charges Mortgage Fees Trading, Brokerage, Investment Banking, Equity Investments All Other Fee Income |
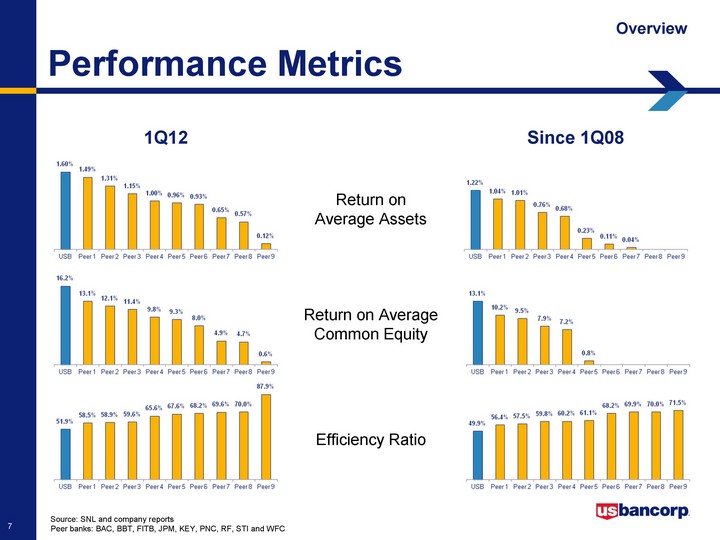
| Source: SNL and company reports Peer banks: BAC, BBT, FITB, JPM, KEY, PNC, RF, STI and WFC Return on Average Assets Return on Average Common Equity Efficiency Ratio Since 1Q08 1Q12 Performance Metrics Overview |
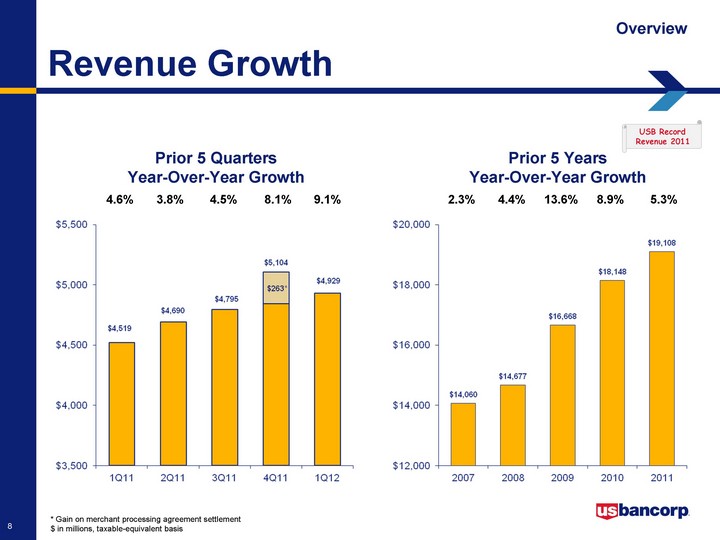
| * Gain on merchant processing agreement settlement $ in millions, taxable-equivalent basis Prior 5 Quarters Year-Over-Year Growth 4.6% 3.8% 4.5% 8.1% 9.1% Prior 5 Years Year-Over-Year Growth 2.3% 4.4% 13.6% 8.9% 5.3% Revenue Growth USB Record Revenue 2011 Overview |
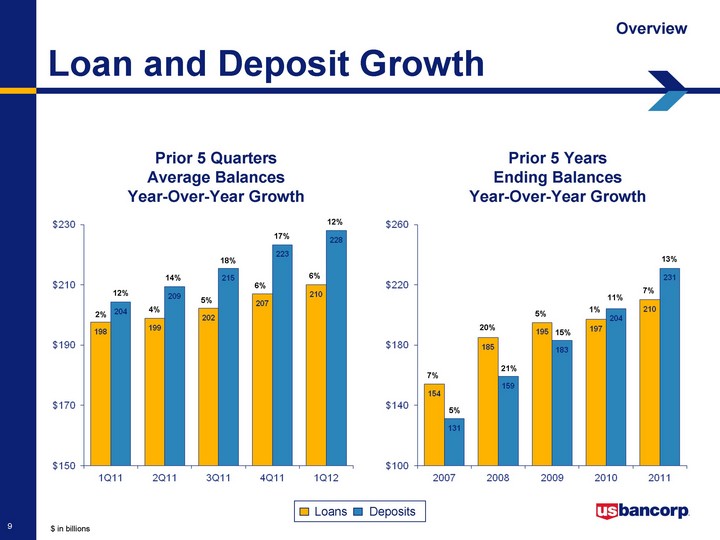
| $ in billions 6% 12% 2% 4% 5% 17% 6% 12% 14% 18% 1% 7% 7% 20% 5% 11% 13% 5% 21% 15% Loans Deposits Prior 5 Quarters Average Balances Year-Over-Year Growth Prior 5 Years Ending Balances Year-Over-Year Growth Loan and Deposit Growth Overview |
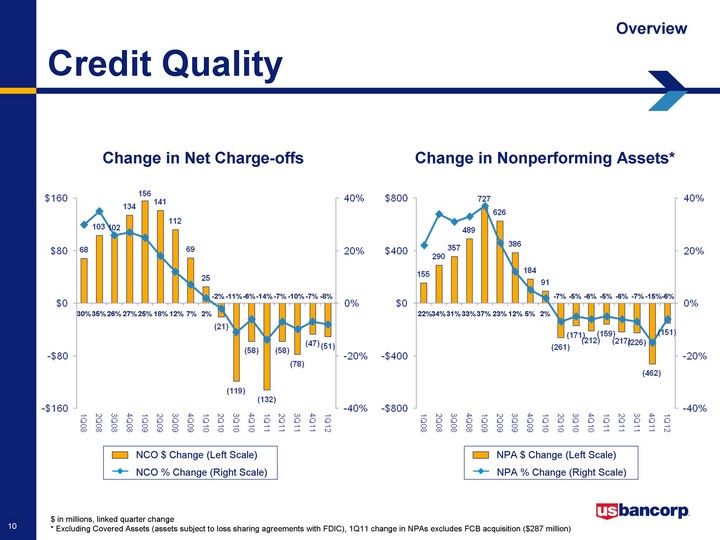
| Change in Net Charge-offs Change in Nonperforming Assets* NCO $ Change (Left Scale) NCO % Change (Right Scale) NPA $ Change (Left Scale) NPA % Change (Right Scale) -11% -2% -14% -6% -10% -7% -8% -7% 35% 30% 27% 26% 18% 25% 7% 12% 2% -5% -7% -5% -6% -7% -6% -6% -15% 34% 22% 33% 31% 23% 37% 5% 12% 2% Credit Quality $ in millions, linked quarter change * Excluding Covered Assets (assets subject to loss sharing agreements with FDIC), 1Q11 change in NPAs excludes FCB acquisition ($287 million) Overview |
| U.S. Bancorp Overview Capital Management Investing for Growth |
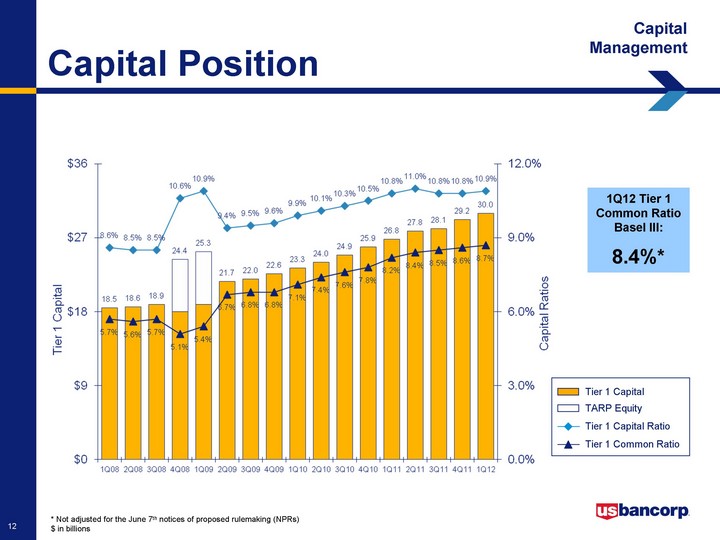
| * Not adjusted for the June 7th notices of proposed rulemaking (NPRs) $ in billions TARP Equity Tier 1 Capital Tier 1 Capital Ratio Tier 1 Common Ratio 1Q12 Tier 1 Common Ratio Basel III: 8.4%* Capital Position Capital Management |
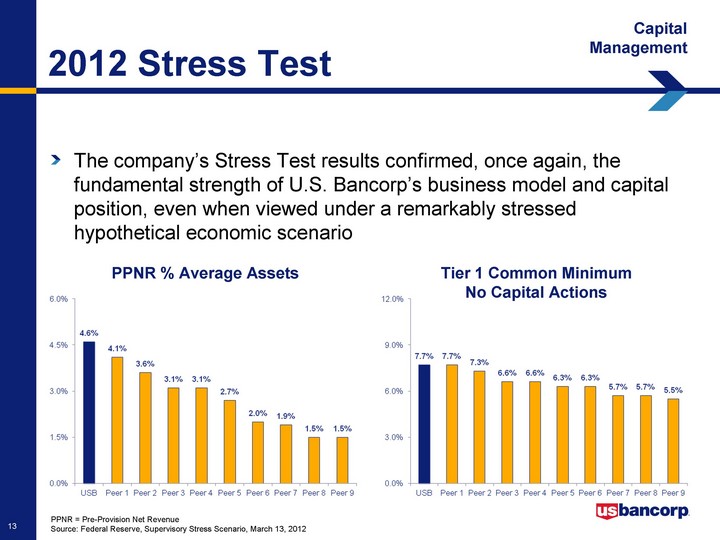
| 2012 Stress Test PPNR = Pre-Provision Net Revenue Source: Federal Reserve, Supervisory Stress Scenario, March 13, 2012 The company's Stress Test results confirmed, once again, the fundamental strength of U.S. Bancorp's business model and capital position, even when viewed under a remarkably stressed hypothetical economic scenario PPNR % Average Assets Tier 1 Common Minimum No Capital Actions Capital Management |
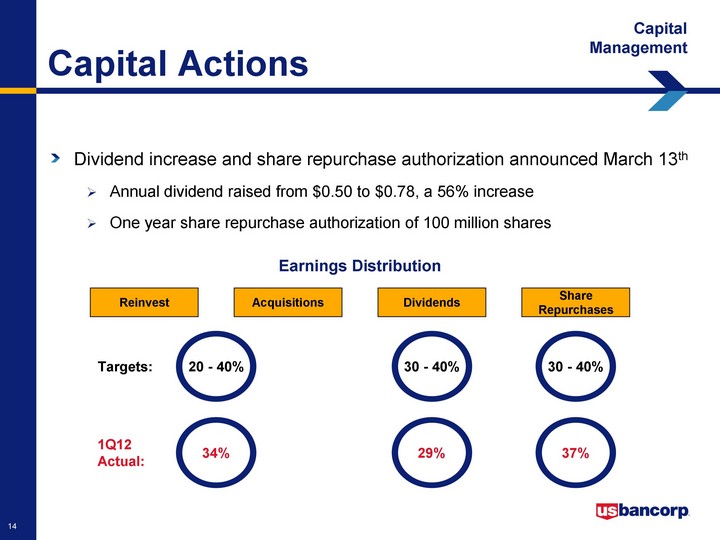
| Capital Actions Dividend increase and share repurchase authorization announced March 13th Annual dividend raised from $0.50 to $0.78, a 56% increase One year share repurchase authorization of 100 million shares Dividends Share Repurchases 20 - 40% Targets: 30 - 40% 30 - 40% 34% 1Q12 Actual: 37% 29% Earnings Distribution Capital Management |
| U.S. Bancorp Overview Capital Management Investing for Growth |
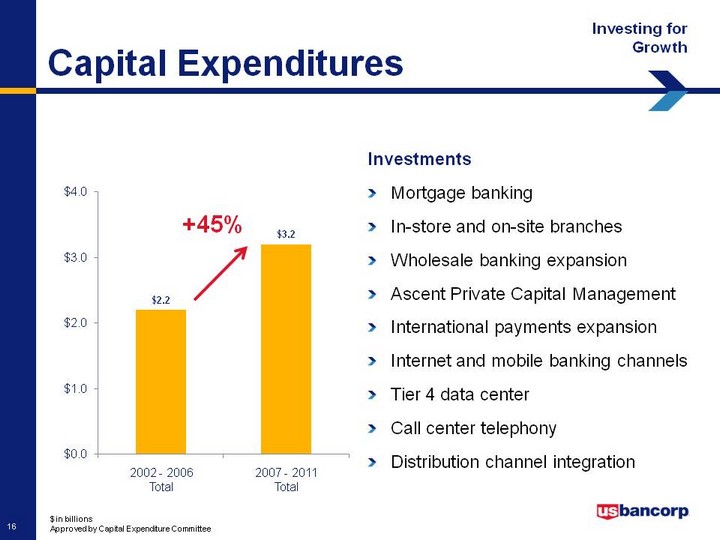
| Capital Expenditures Investments Mortgage banking In-store and on-site branches Wholesale banking expansion Ascent Private Capital Management International payments expansion Internet and mobile banking channels Tier 4 data center Call center telephony Distribution channel integration 2002 - 2006 Total 2007 - 2011 Total +45% Investing for Growth $ in billions Approved by Capital Expenditure Committee |
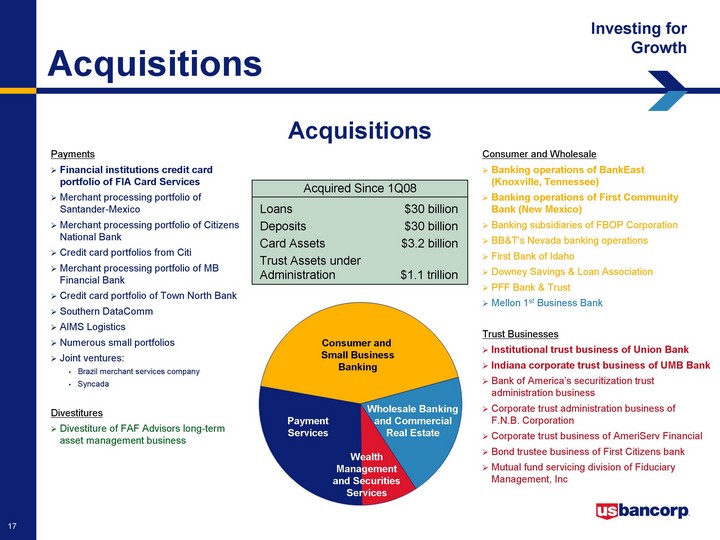
| Payments Financial institutions credit card portfolio of FIA Card Services Merchant processing portfolio of Santander-Mexico Merchant processing portfolio of Citizens National Bank Credit card portfolios from Citi Merchant processing portfolio of MB Financial Bank Credit card portfolio of Town North Bank Southern DataComm AIMS Logistics Numerous small portfolios Joint ventures: Brazil merchant services company Syncada Consumer and Wholesale Banking operations of BankEast (Knoxville, Tennessee) Banking operations of First Community Bank (New Mexico) Banking subsidiaries of FBOP Corporation BB&T's Nevada banking operations First Bank of Idaho Downey Savings & Loan Association PFF Bank & Trust Mellon 1st Business Bank Trust Businesses Institutional trust business of Union Bank Indiana corporate trust business of UMB Bank Bank of America's securitization trust administration business Corporate trust administration business of F.N.B. Corporation Corporate trust business of AmeriServ Financial Bond trustee business of First Citizens bank Mutual fund servicing division of Fiduciary Management, Inc Divestitures Divestiture of FAF Advisors long-term asset management business Acquisitions Consumer and Small Business Banking Payment Services Wealth Management and Securities Services Wholesale Banking and Commercial Real Estate Loans $30 billion Deposits $30 billion Card Assets $3.2 billion Trust Assets under Administration $1.1 trillion Acquired Since 1Q08 Acquisitions Investing for Growth |

| Middle Market Loan 19th 7th Bookrunner Investment Grade Loan 11th 6th Bookrunner Investment Grade Bond NA 10th Lead / Co-lead Source: Thomson Reuters based on number of issues 2011 2007 USB Market Rank Market Share Change Core Deposits 2.0% 2.7% Consumer Loans 1.8% 3.0% Mortgage Origination 0.7% 4.4% C&I Loans 3.2% 3.6% CRE Loans 1.6% 2.4% Source: SNL and National Mortgage News Mortgage Origination as of 4Q11 (latest information available) 1Q12 1Q07 USB Market Share Market Share Change 2011 2007 USB Market Share Market Share Change Credit Card (total volume) 4% 6% Fund Services (# of funds) 18% 22% Wealth Management (AUM) 1% 1% Source: Nilson (card), Visa and MasterCard issuers; Investment Co Institute (fund services); Barron's (wealth management) Municipal Trust 27% 29% Corporate Trust 8% 24% Structured Trust 12% 17% Source: Securities Data Corp, # of issues 1Q12 2007 USB Market Share Market Share Change Growing Market Share Investing for Growth |
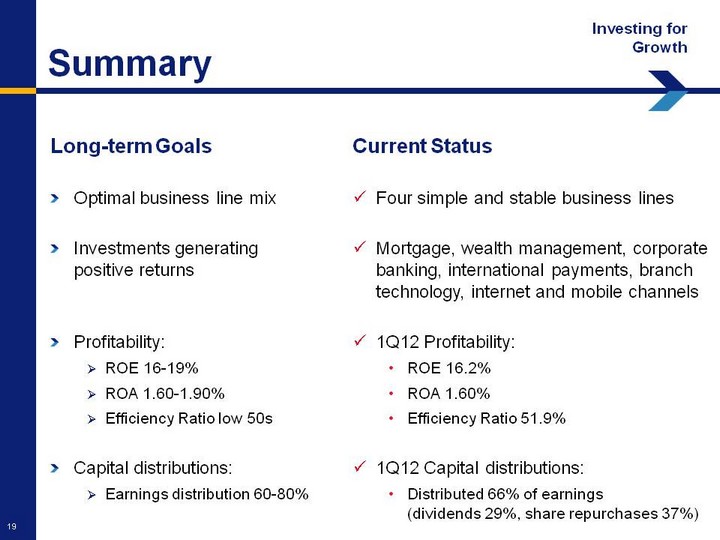
| Long-term Goals Optimal business line mix Investments generating positive returns Profitability: ROE 16-19% ROA 1.60-1.90% Efficiency Ratio low 50s Capital distributions: Earnings distribution 60-80% Summary Current Status Four simple and stable business lines Mortgage, wealth management, corporate banking, international payments, branch technology, internet and mobile channels 1Q12 Profitability: ROE 16.2% ROA 1.60% Efficiency Ratio 51.9% 1Q12 Capital distributions: Distributed 66% of earnings (dividends 29%, share repurchases 37%) Investing for Growth |
| continues Momentum |
| Appendix |
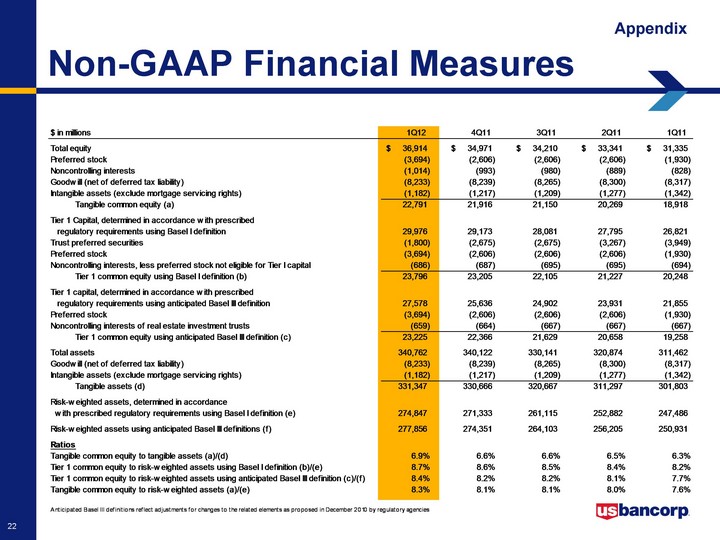
| Non-GAAP Financial Measures Appendix |
| Morgan Stanley Financials Conference 2012 |