 U.S. Bancorp 2Q12 Earnings Conference Call U.S. Bancorp 2Q12 Earnings Conference Call July 18, 2012 Richard K. Davis Chairman, President and CEO Andy Cecere Vice Chairman and CFO Exhibit 99.2 |
 2 Forward-looking Statements and Additional Information The following information appears in accordance with the Private Securities Litigation Reform Act of 1995: This presentation contains forward-looking statements about U.S. Bancorp. Statements that are not historical or current facts, including statements about beliefs and expectations, are forward-looking statements and are based on the information available to, and assumptions and estimates made by, management as of the date made. These forward-looking statements cover, among other things, anticipated future revenue and expenses and the future plans and prospects of U.S. Bancorp. Forward-looking statements involve inherent risks and uncertainties, and important factors could cause actual results to differ materially from those anticipated. Global and domestic economies could fail to recover from the recent economic downturn or could experience another severe contraction, which could adversely affect U.S. Bancorp’s revenues and the values of its assets and liabilities. Global financial markets could experience a recurrence of significant turbulence, which could reduce the availability of funding to certain financial institutions and lead to a tightening of credit, a reduction of business activity, and increased market volatility. Continued stress in the commercial real estate markets, as well as a delay or failure of recovery in the residential real estate markets, could cause additional credit losses and deterioration in asset values. In addition, U.S. Bancorp’s business and financial performance is likely to be negatively impacted by effects of recently enacted and future legislation and regulation. U.S. Bancorp’s results could also be adversely affected by continued deterioration in general business and economic conditions; changes in interest rates; deterioration in the credit quality of its loan portfolios or in the value of the collateral securing those loans; deterioration in the value of securities held in its investment securities portfolio; legal and regulatory developments; increased competition from both banks and non-banks; changes in customer behavior and preferences; effects of mergers and acquisitions and related integration; effects of critical accounting policies and judgments; and management’s ability to effectively manage credit risk, residual value risk, market risk, operational risk, interest rate risk and liquidity risk. For discussion of these and other risks that may cause actual results to differ from expectations, refer to U.S. Bancorp’s Annual Report on Form 10-K for the year ended December 31, 2011, on file with the Securities and Exchange Commission, including the sections entitled “Risk Factors” and “Corporate Risk Profile” contained in Exhibit 13, and all subsequent filings with the Securities and Exchange Commission under Sections 13(a), 13(c), 14 or 15(d) of the Securities Exchange Act of 1934. Forward-looking statements speak only as of the date they are made, and U.S. Bancorp undertakes no obligation to update them in light of new information or future events. This presentation includes non-GAAP financial measures to describe U.S. Bancorp’s performance. The reconciliations of those measures to GAAP measures are provided within or in the appendix of the presentation. These disclosures should not be viewed as a substitute for operating results determined in accordance with GAAP, nor are they necessarily comparable to non-GAAP performance measures that may be presented by other companies. |
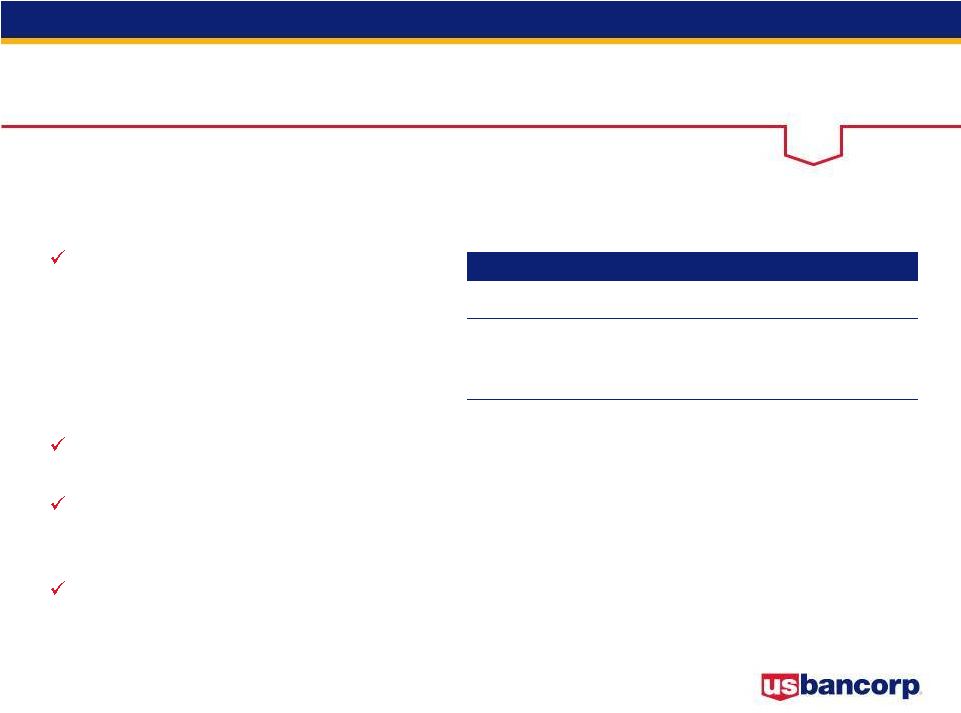
 2Q12 Highlights Record net income of $1.4 billion; $0.71 per diluted common share Total net revenue of $5.1 billion, up 8.1% vs. 2Q11 • Net interest income growth of 6.6% vs. 2Q11 • Noninterest income growth of 9.7% vs. 2Q11 Positive operating leverage on both a year-over-year and a linked quarter basis Average loan growth of 7.7% vs. 2Q11 and average loan growth of 1.9% vs. 1Q12 Strong average deposit growth of 10.5% vs. 2Q11 and average deposit growth of 1.3% vs. 1Q12 Net charge-offs declined 8.9% vs. 1Q12 Nonperforming assets declined 6.9% vs. 1Q12 (12.3% including covered assets) Capital generation continues to fortify capital position • Tier 1 common equity ratio of 8.8% • Tier 1 capital ratio of 10.7% • Repurchased 13 million shares of common stock during 2Q12 2Q12 Earnings Conference Call 3 |
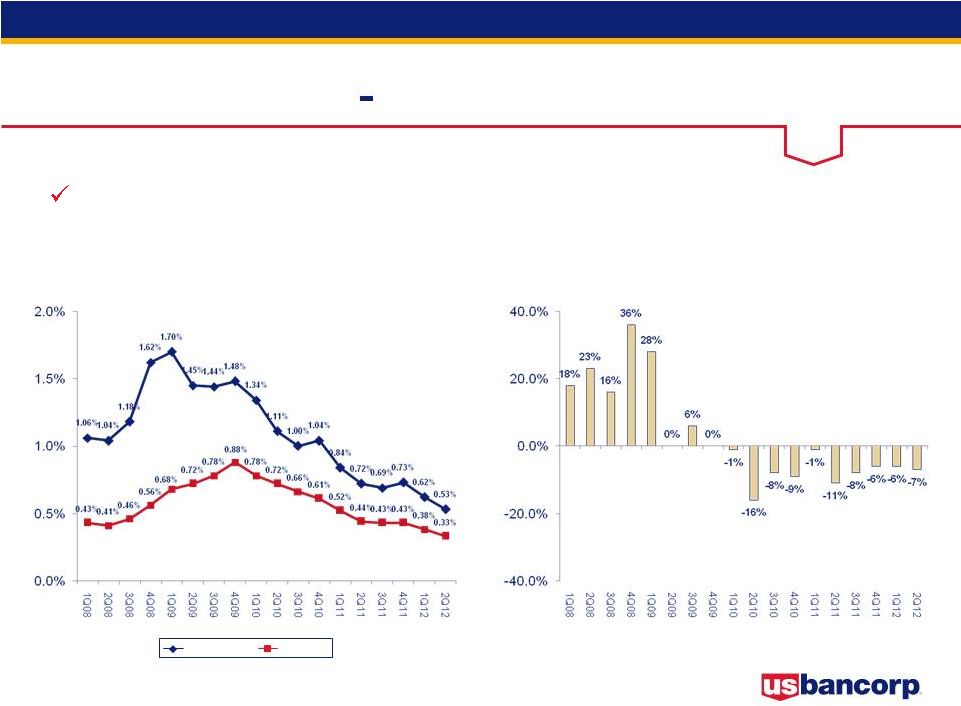
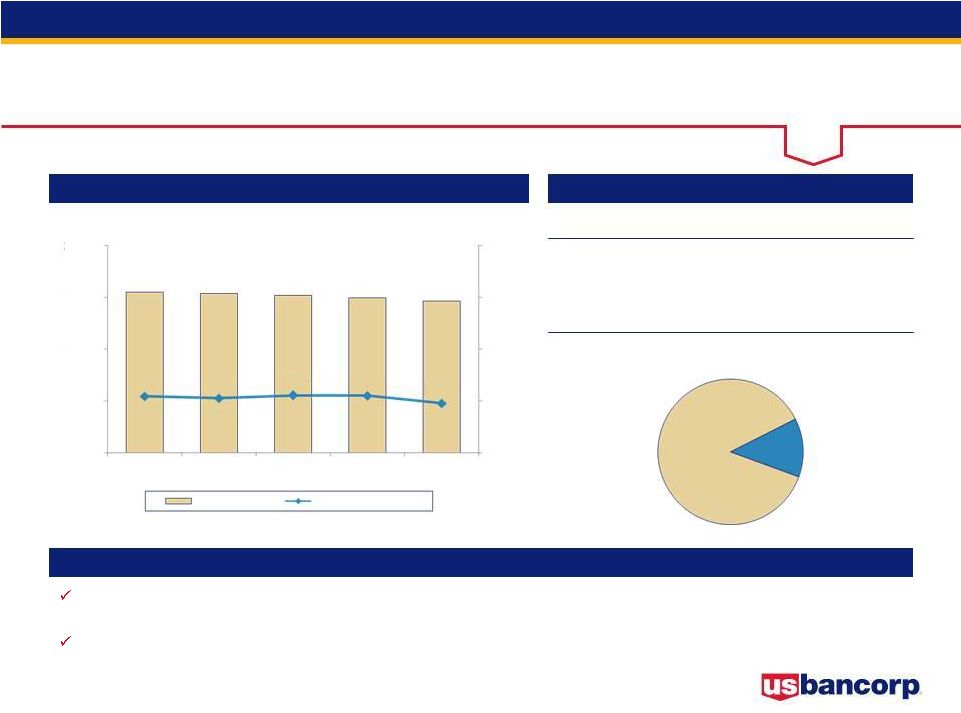
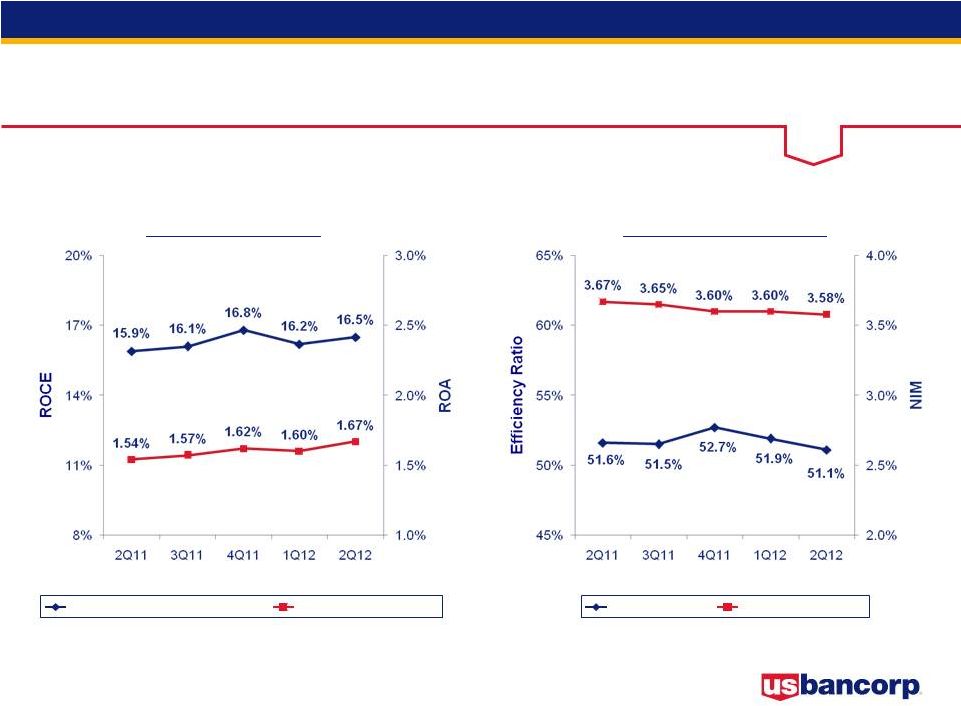 Performance Ratios ROCE and ROA Efficiency Ratio and Net Interest Margin Efficiency ratio computed as noninterest expense divided by the sum of net interest income on a taxable-equivalent basis and noninterest income excluding securities gains (losses) net Return on Avg Common Equity Return on Avg Assets Efficiency Ratio Net Interest Margin 4 2Q12 Earnings Conference Call |
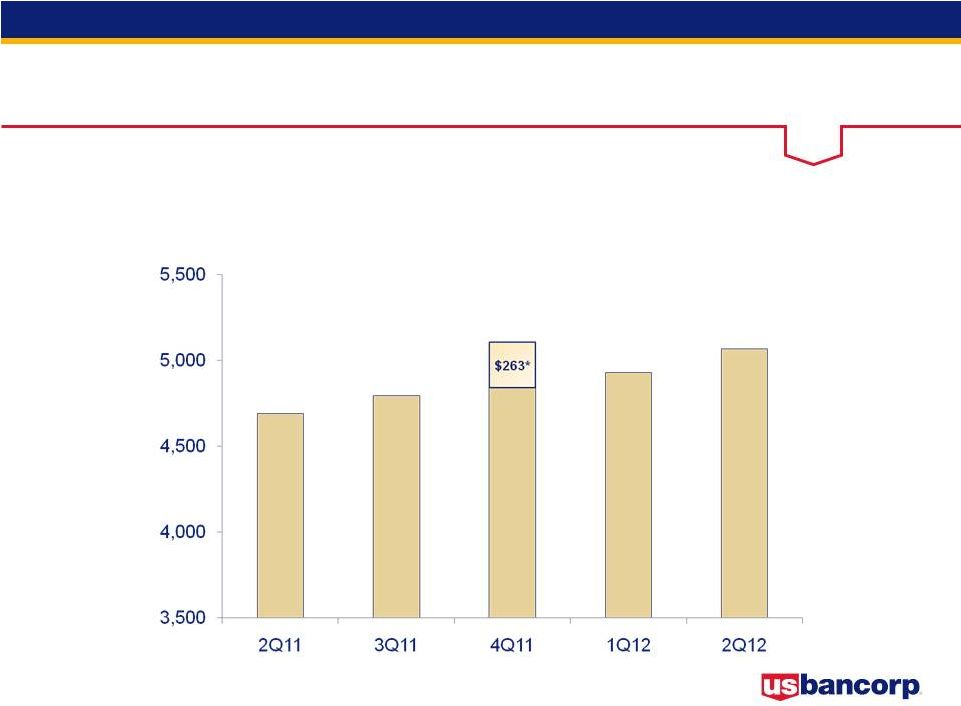 * Gain on merchant processing agreement settlement Taxable-equivalent basis Revenue Growth Year-Over-Year Growth 3.8% 4.5% 8.1% 9.1% 8.1% $ in millions $5,068 $5,104 $4,795 $4,690 $4,929 5 2Q12 Earnings Conference Call |
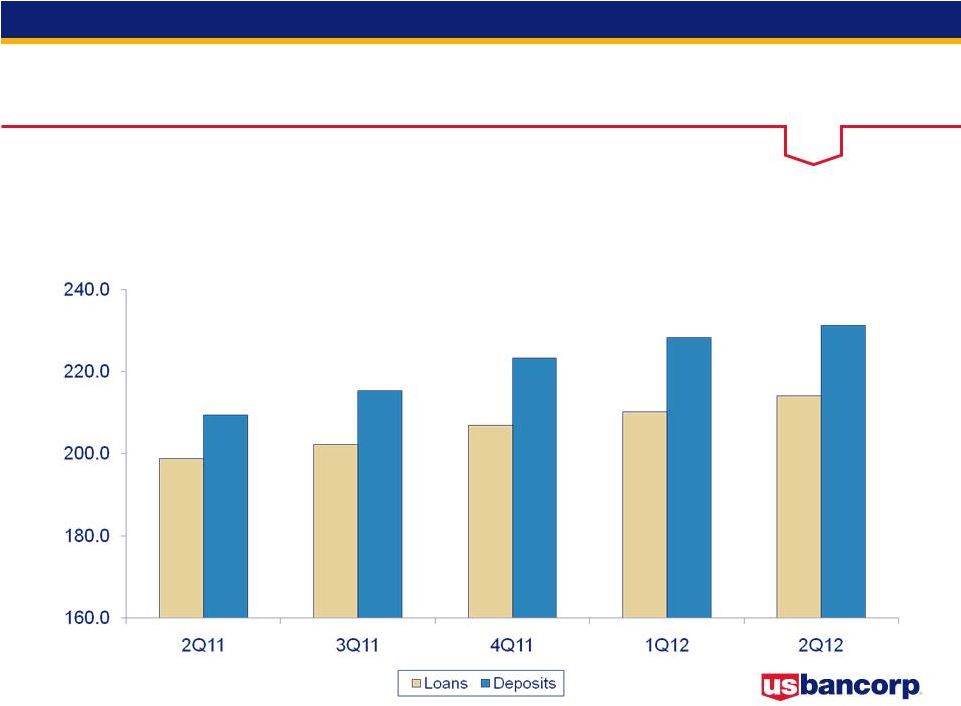 Loan and Deposit Growth Average Balances Year-Over-Year Growth $ in billions 7.7% $214.1 4.0% $198.8 5.0% $202.2 5.9% $207.0 6.4% $210.2 10.5% $231.3 14.2% $209.4 17.9% $215.4 17.3% $223.3 11.7% $228.3 2Q12 Earnings Conference Call 6 |
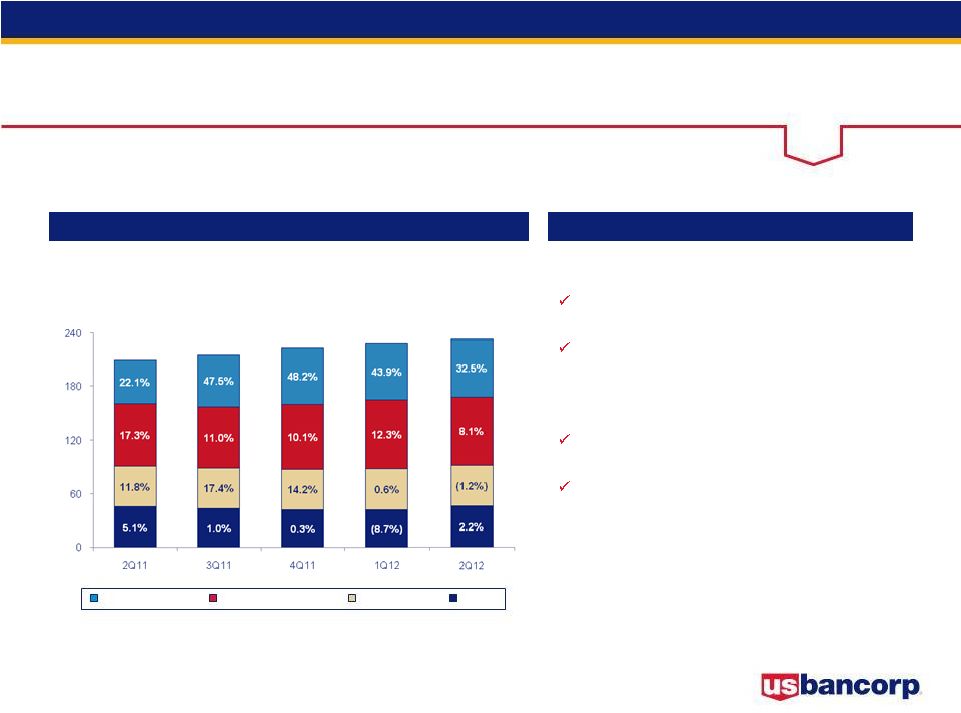
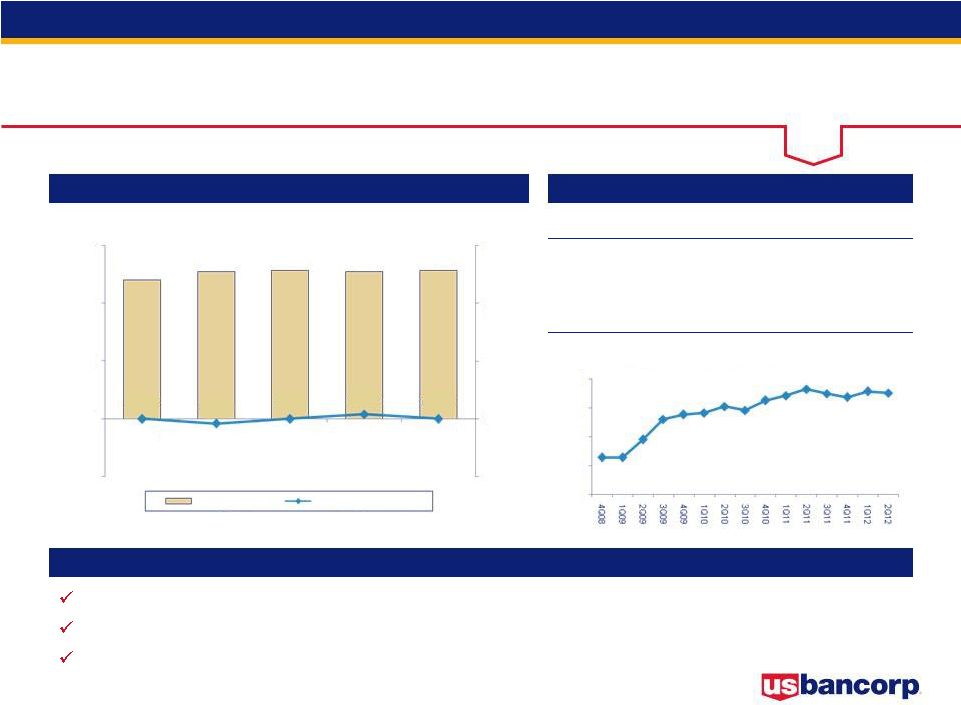
 Credit Quality * Excluding Covered Assets (assets subject to loss sharing agreements with FDIC), 1Q11 change in NPAs excludes FCB acquisition ($287 million) Linked quarter change Change in Net Charge-offs Change in Nonperforming Assets* NCO $ Change (Left Scale) NCO % Change (Right Scale) NPA $ Change (Left Scale) NPA % Change (Right Scale) -11% -2% -14% -6% -10% -7% -8% -7% 35% 30% 27% 26% 18% 25% 7% 12% 2% -5% -7% -5% -6% -7% -6% -6% -15% 34% 22% 33% 31% 23% 37% 5% 12% 2% $ in millions -9% -7% 2Q12 Earnings Conference Call 7 |
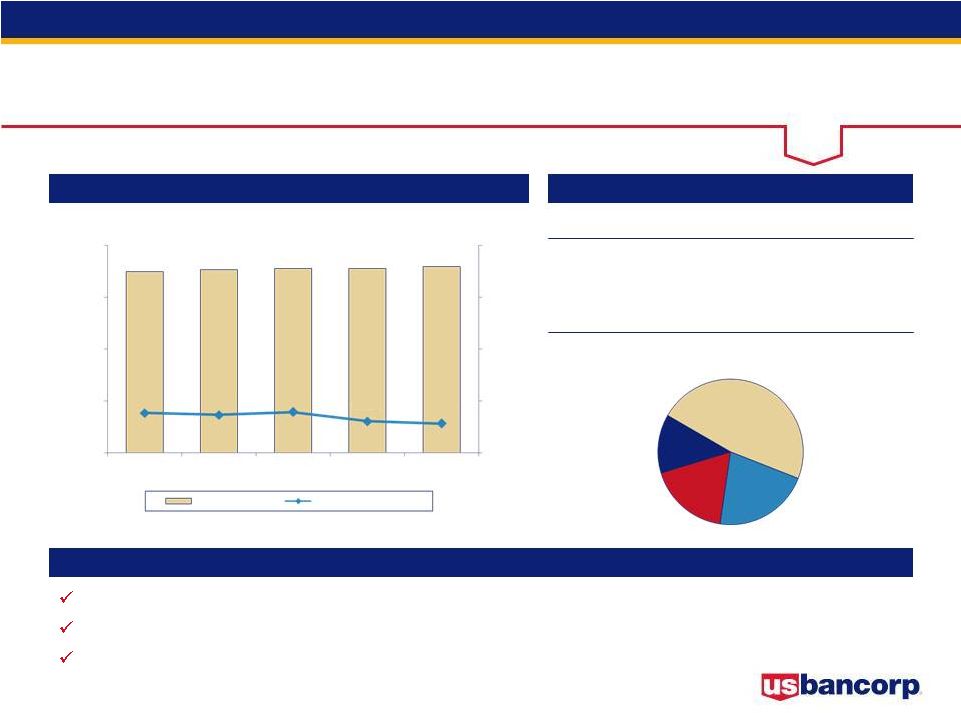
 Credit Quality Outlook The Company expects the level of Net Charge-offs and Nonperforming Assets to trend modestly lower during 3Q12 Delinquencies* Changes in Criticized Assets* * Excluding Covered Assets (assets subject to loss sharing agreements with FDIC) 1Q11 change in criticized assets excludes FCB acquisition 30 to 89 days 90+ days 8 2Q12 Earnings Conference Call |
 YTD YTD 2Q12 1Q12 2Q11 vs 1Q12 vs 2Q11 2Q12 2Q11 % B/(W) Net Interest Income 2,713 $ 2,690 $ 2,544 $ 0.9 6.6 5,403 $ 5,051 $ 7.0 Noninterest Income 2,355 2,239 2,146 5.2 9.7 4,594 4,158 10.5 Total Revenue 5,068 4,929 4,690 2.8 8.1 9,997 9,209 8.6 Noninterest Expense 2,601 2,560 2,425 (1.6) (7.3) 5,161 4,739 (8.9) Operating Income 2,467 2,369 2,265 4.1 8.9 4,836 4,470 8.2 Net Charge-offs 520 571 747 8.9 30.4 1,091 1,552 29.7 Excess Provision (50) (90) (175) -- -- (140) (225) -- Income before Taxes 1,997 1,888 1,693 5.8 18.0 3,885 3,143 23.6 Applicable Income Taxes 619 583 514 (6.2) (20.4) 1,202 935 (28.6) Noncontrolling Interests 37 33 24 12.1 54.2 70 41 70.7 Net Income 1,415 1,338 1,203 5.8 17.6 2,753 2,249 22.4 Preferred Dividends/Other 70 53 36 (32.1) (94.4) 123 79 (55.7) NI to Common 1,345 $ 1,285 $ 1,167 $ 4.7 15.3 2,630 $ 2,170 $ 21.2 Diluted EPS 0.71 $ 0.67 $ 0.60 $ 6.0 18.3 1.38 $ 1.12 $ 23.2 Average Diluted Shares 1,898 1,910 1,929 0.6 1.6 1,904 1,929 1.3 % B/(W) Earnings Summary $ in millions, except per-share data Taxable-equivalent basis 9 2Q12 Earnings Conference Call |
 2Q12 Results - Key Drivers vs. 2Q11 Net Revenue growth of 8.1% • Net interest income growth of 6.6%; net interest margin of 3.58% vs. 3.67% • Noninterest income growth of 9.7% Noninterest expense growth of 7.3% Provision for credit losses lower by $102 million • Net charge-offs lower by $227 million • Provision lower than NCOs by $50 million vs. $175 million in 2Q11 vs. 1Q12 Net Revenue growth of 2.8% • Net interest income growth of 0.9%; net interest margin of 3.58% vs. 3.60% • Noninterest income growth of 5.2% Noninterest expense growth of 1.6% Provision for credit losses lower by $11 million • Net charge-offs lower by $51 million • Provision lower than NCOs by $50 million vs. $90 million in 1Q12 10 2Q12 Earnings Conference Call |
 Capital Position $ in billions RWA = risk-weighted assets 11 2Q12 Earnings Conference Call 2Q12 1Q12 4Q11 3Q11 2Q11 Shareholders' equity 37.8 $ 35.9 $ 34.0 $ 33.2 $ 32.5 $ Tier 1 capital 30.0 30.0 29.2 28.1 27.8 Total risk-based capital 36.4 36.4 36.1 35.4 35.1 Tier 1 common equity ratio 8.8% 8.7% 8.6% 8.5% 8.4% Tier 1 capital ratio 10.7% 10.9% 10.8% 10.8% 11.0% Total risk-based capital ratio 13.0% 13.3% 13.3% 13.5% 13.9% Leverage ratio 9.1% 9.2% 9.1% 9.0% 9.2% Tangible common equity ratio 6.9% 6.9% 6.6% 6.6% 6.5% Tangible common equity % of RWA 8.5% 8.3% 8.1% 8.1% 8.0% Basel III Tier 1 common equity ratio using Basel III proposals published prior to June 2012 - 8.4% 8.2% 8.2% 8.1% Tier 1 common equity ratio approximated using proposed rules for the Basel III standardized approach released June 2012 7.9% - - - - |
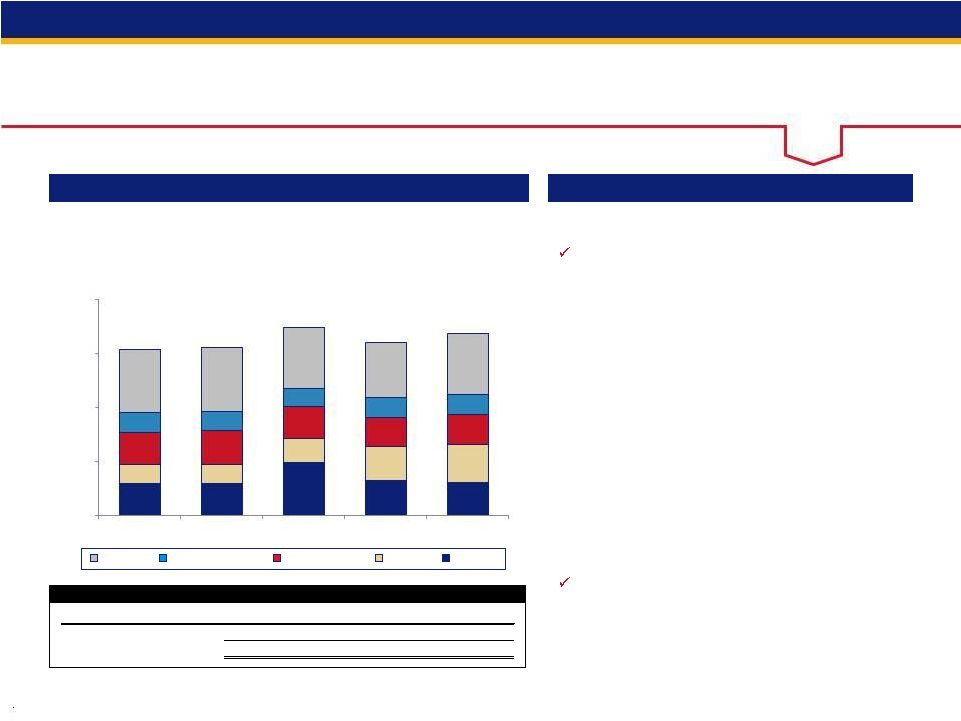
 Mortgage Repurchase Mortgages Repurchased and Make-whole Payments Mortgage Representation and Warranties Reserve $ in millions 2Q12 1Q12 4Q11 3Q11 2Q11 Beginning Reserve $202 $160 $162 $173 $181 Net Realized Losses (31) (25) (31) (31) (43) Additions to Reserve 45 67 29 20 35 Ending Reserve $216 $202 $160 $162 $173 Mortgages repurchased and make-whole payments $58 $55 $61 $57 $72 Repurchase activity lower than peers due to: • Conservative credit and underwriting culture • Disciplined origination process - primarily conforming loans (˜ 95% sold to GSEs) Do not participate in private placement securitization market Outstanding repurchase and make-whole requests balance = $164 million Repurchase requests expected to remain relatively stable over next few quarters 2Q12 Earnings Conference Call 12 ~ ~ |
 Momentum Momentum continues continues |
 Appendix 2Q12 Earnings Conference Call 14 |
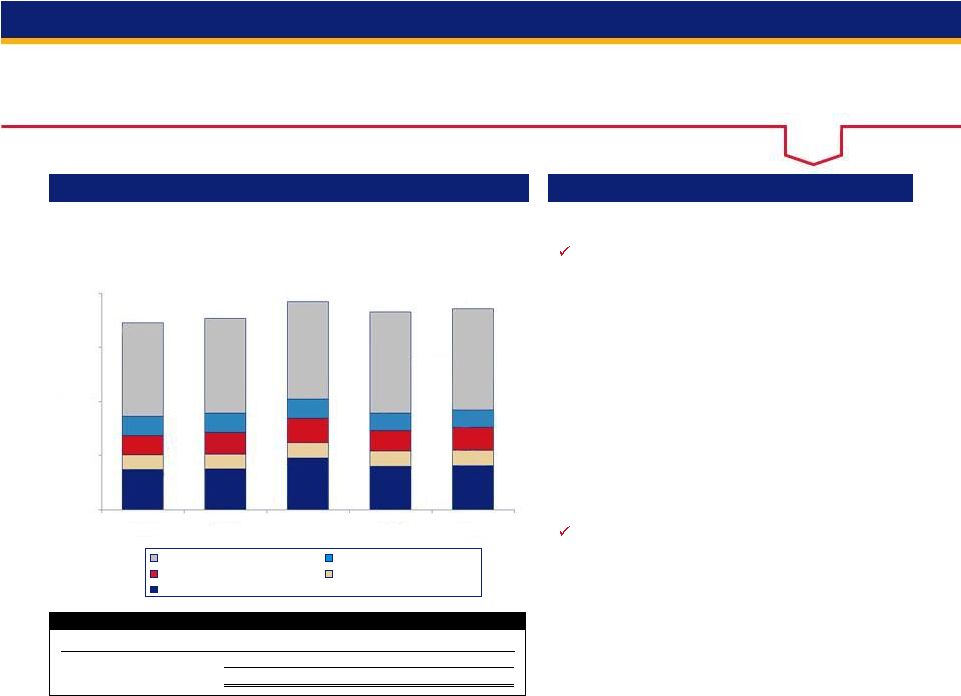
 Average Loans Average Loans Key Points $ in billions vs. 2Q11 Average total loans grew by $15.3 billion, or 7.7% Average total loans, excluding covered loans, were higher by 10.0% Average total commercial loans increased $10.0 billion, or 19.9% vs. 1Q12 Average total loans grew by $3.9 billion, or 1.9% Average total loans, excluding covered loans, were higher by 2.4% Average total commercial loans increased $2.9 billion, or 5.1% Year-Over-Year Growth 4.0% 5.0% 5.9% 6.4% 7.7% Covered Commercial CRE Res Mtg Retail Credit Card 2Q12 Earnings Conference Call 15 Commercial CRE Res Mtg Credit Card Retail $214.1 Covered $198.8 $202.2 $207.0 $210.2 |
 Average Deposits Average Deposits Key Points $ in billions vs. 2Q11 Average total deposits increased by $21.9 billion, or 10.5% Average low cost deposits (NIB, interest checking, money market and savings) increased by $20.9 billion, or 12.8% vs. 1Q12 Average total deposits increased by $3.0 billion, or 1.3% Average low cost deposits decreased by $1.3 billion, or 0.7% Year-Over-Year Growth 14.2% 17.9% 17.3% 11.7% 10.5% Time Money Market Checking and Savings Noninterest-bearing Noninterest -bearing 2Q12 Earnings Conference Call 16 $231.3 Checking & Savings Money Market Time $209.4 $215.4 $223.3 $228.3 |
 Net Interest Income Net Interest Income Key Points $ in millions Taxable-equivalent basis Year-Over-Year Growth 5.6% 5.9% 7.0% 7.3% 6.6% 2Q12 Earnings Conference Call 3,000 2,500 2,000 1,500 1,000 $2,544 $2,624 $2,673 $2,690 $2,713 Net Interest Income Net Interest Margin 3.67% 3.65% 3.60% 3.60% 3.58% 6.0% 5.0% 4.0% 3.0% 2.0% 2Q11 3Q11 4Q11 1Q12 2Q12 17 vs. 2Q11 Average earning assets grew by $26.2 billion, or 9.4% Net interest margin lower by 9 bp (3.58% vs. 3.67%) driven by: • Higher balances in lower yielding investment securities and a decline in loan yields • Partially offset by lower deposit rates, a reduction in the average cash position at the Federal Reserve, and the classification change of credit card balance transfer fees from noninterest income to interest income beginning 1Q12 vs. 1Q12 Average earning assets grew by $3.7 billion, or 1.2% Net interest margin lower by 2 bp (3.58% vs. 3.60%) driven by: • Continued growth in lower yielding investment securities and lower loan yields • Partially offset by lower rates on long-term debt and a reduction in the average cash position at the Federal Reserve |
 2Q12 Earnings Conference Call 2Q11 3Q11 4Q11 1Q12 2Q12 Non-operating gains - $ - $ 263 $ - $ - $ Total - $ - $ 263 $ - $ - $ Notable Noninterest Income Items Noninterest Income Noninterest Income Key Points $ in millions Payments = credit and debit card revenue, corporate payment products revenue and merchant processing services; Service charges = deposit service charges, treasury management fees and ATM processing services vs. 2Q11 Noninterest income grew by $209 million, or 9.7%, driven by: • Mortgage banking revenue increase of $251 million • Merchant processing (6.2% growth) • Lower credit and debit card revenue (17.8% decline) due to the impact of legislative changes to debit interchange fees and the classification change of credit card balance transfer fees from noninterest income to interest income beginning 1Q12, partially offset by higher transaction volumes and a credit related to the final expiration of debit card customer rewards • Lower ATM processing services revenue (21.9% decline) due to classifying surcharge revenue passed through to others as a reduction of revenue beginning 1Q12 rather than occupancy expense as in previous periods vs. 1Q12 Noninterest income grew by $116 million, or 5.2%, driven by: • Mortgage banking revenue increase of $38 million • Higher payments revenue (9.8% increase) primarily due to higher volumes Year-Over-Year Growth 1.7% 2.9% 9.4% 11.3% 9.7% $2,171 $2,431 $2,239 $2,355 $2,146 Trust and Inv Mgmt Service Charges All Other Mortgage Payments All Other Mortgage Service Charges Trust and Inv Mgmt Payments 2Q12 1Q12 4Q11 3Q11 2Q11 2,800 2,100 1,400 700 0 18 (3.1%) 1.6% (7.9%) 105% 2.9% 2Q12 Earnings Conference Call |
 19 2Q12 Earnings Conference Call 2Q11 3Q11 4Q11 1Q12 2Q12 Mortgage servicing matters - $ - $ 130 $ - $ - $ Total - $ - $ 130 $ - $ - $ Notable Noninterest Expense Items Noninterest Expense Noninterest Expense Key Points $ in millions vs. 2Q11 Noninterest expense was higher by $176 million, or 7.3%, driven by: • Increased compensation (7.2%) and employee benefits (9.0%) • Increase in professional services (65.9%) principally due to mortgage servicing review-related project • Increase in other expense driven by accrual related to indemnification obligations associated with Visa Inc. • Lower net occupancy and equipment (7.6%) principally reflecting the change in classification of ATM surcharge revenue passed through to others • Lower marketing (11.1%) due to the timing of advertising campaigns vs. 1Q12 Noninterest expense was higher by $41 million, or 1.6%, driven by: • Higher professional services (61.9%) due to mortgage servicing review-related project • Higher other expense primarily due to Visa accrual and costs related to investments in affordable housing and other tax-advantaged projects, partially offset by lower regulatory and insurance-related costs • Lower marketing (26.6%) due to the timing of charitable contributions and payments-related initiatives Year-Over-Year Growth 2.0% 3.8% 8.5% 10.6% 7.3% $2,476 $2,696 $2,560 $2,601 $2,425 Occupancy and Equipment Prof Services, Marketing and PPS All Other Tech and Comm Compensation and Benefits All Other Tech and Communications Prof Svcs, Marketing and PPS Occupancy and Equipment Compensation and Benefits 2,800 2,100 1,400 700 0 2Q11 3Q11 4Q11 1Q12 2Q12 2Q12 Earnings Conference Call 7.5% (7.6%) 18.1% 6.3% 9.0% |
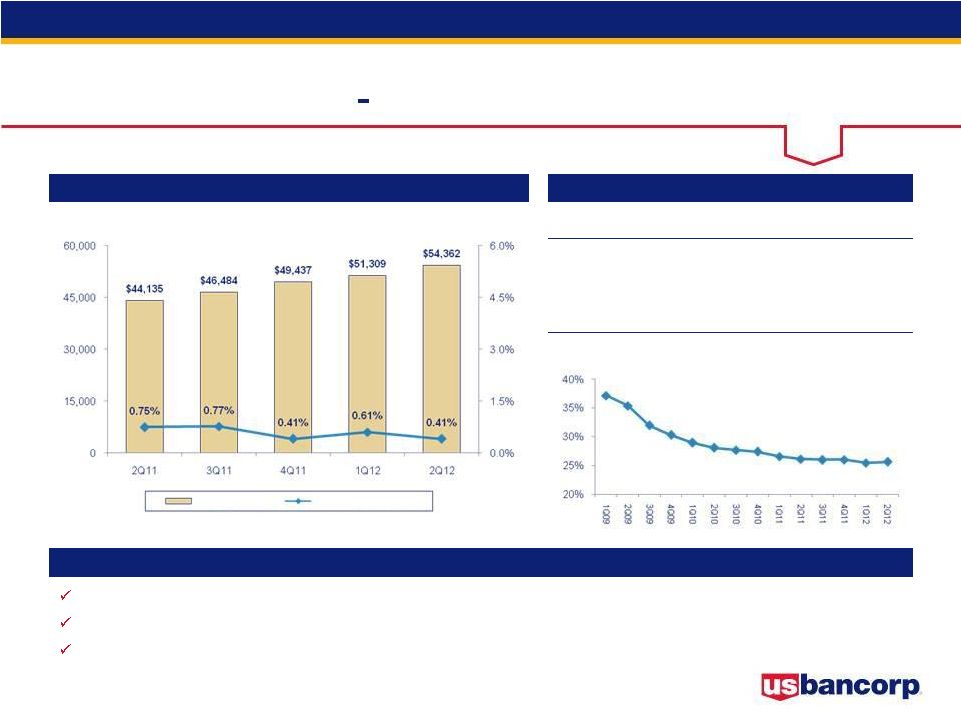 Credit Quality Commercial Loans Average Loans and Net Charge-offs Ratios Key Statistics Comments Nonperforming loans and delinquencies continued to improve year-over-year and on a linked quarter basis Net charge-offs improved on a linked quarter and year-over-year basis Strong new lending activity of both loans and commitments resulted in 6% linked quarter average loan growth; utilization rates remained historically low 2Q11 1Q12 2Q12 Average Loans $44,135 $51,309 $54,362 30-89 Delinquencies 0.46% 0.30% 0.26% 90+ Delinquencies 0.09% 0.08% 0.07% Nonperforming Loans 0.78% 0.53% 0.31% $ in millions Revolving Line Utilization Trend 2Q12 Earnings Conference Call 20 Average Loans Net Charge-offs Ratio |
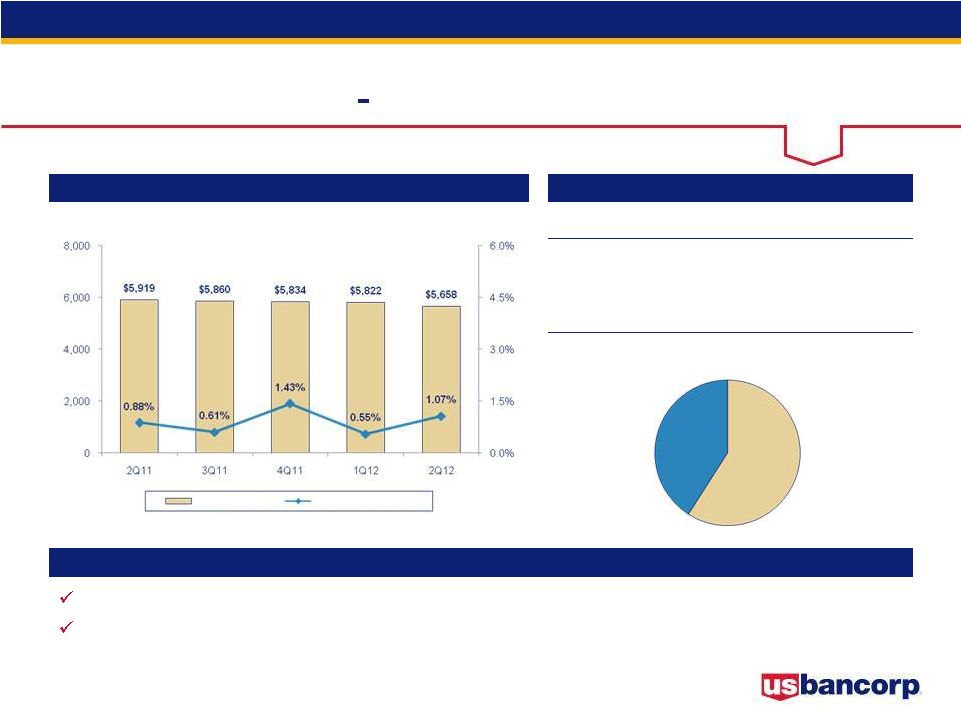 Average Loans and Net Charge-offs Ratios Key Statistics Comments Net charge-offs increased this quarter primarily due to a single transaction Overall credit quality continued to improve as nonperforming loans and delinquencies declined on a linked quarter and year-over-year basis $ in millions 2Q12 Earnings Conference Call Commercial Leases 2Q11 1Q12 2Q12 Average Loans $5,919 $5,822 $5,658 30-89 Delinquencies 1.00% 0.89% 0.83% 90+ Delinquencies 0.02% 0.00% 0.00% Nonperforming Loans 0.73% 0.54% 0.40% Credit Quality Commercial Leases 21 Average Loans Net Charge-offs Ratio Small Ticket $3,341 Equipment Finance $2,317 |
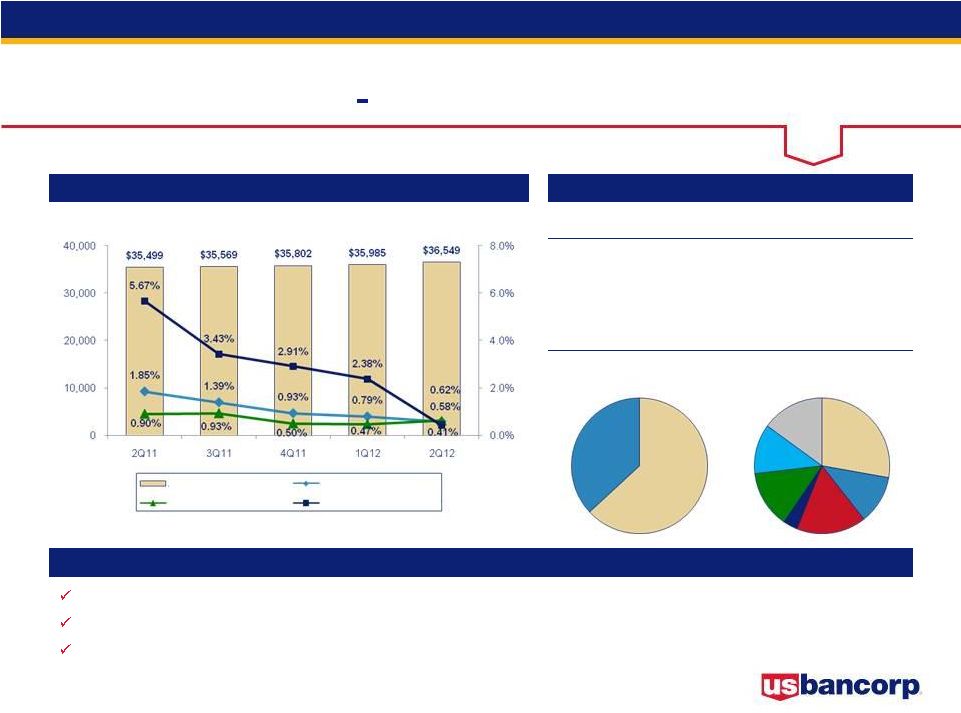 Credit Quality Commercial Real Estate Average Loans and Net Charge-offs Ratios Key Statistics Comments Nonperforming loans continue to decline as the Company continues to resolve and reduce exposures in this portfolio Net charge-offs continue to trend lower primarily driven by improvement in the credit quality of the construction portfolio Delinquencies improved significantly on a linked quarter basis 2Q11 1Q12 2Q12 Average Loans $35,499 $35,985 $36,549 30-89 Delinquencies 0.45% 0.45% 0.24% 90+ Delinquencies 0.01% 0.04% 0.03% Nonperforming Loans 3.84% 2.10% 1.89% Performing TDRs* 225 630 596 $ in millions * TDR = troubled debt restructuring, new accounting guidance adopted 3Q11 (FASB Accounting Standards Update No. 2011-02) 2Q12 Earnings Conference Call 22 Owner Occupied $11,294 Investor $19,330 Other $888 Office $701 A&D Construction $808 Condo Construction $206 Residential Construction $988 Retail $687 Multi-family $1,647 Average Loans NCO Ratio - Comm Mtg Net Charge-offs Ratio NCO Ratio - Construction CRE Mortgage CRE Construction |
 Credit Quality - Residential Mortgage Average Loans and Net Charge-offs Ratios Key Statistics Comments Strong growth in high quality originations (weighted average FICO 761, weighted average LTV 68%) as average loans increased 3.5% over 1Q12, driven by demand for refinancing Continued to help home owners by successfully modifying 2,874 loans (owned and serviced) in 2Q12, representing $495 million in balances Delinquencies, nonperforming loans, and net charge-offs improved on a year-over-year basis 2Q11 1Q12 2Q12 Average Loans $32,734 $37,831 $39,166 30-89 Delinquencies 1.11% 0.95% 0.86% 90+ Delinquencies 1.13% 0.79% 0.80% Nonperforming Loans 2.03% 1.78% 1.65% $ in millions * Excludes GNMA loans, whose repayments are insured by the FHA or guaranteed by the Department of VA ($1,352 million 2Q12) $32,734 $34,026 $36,256 $37,831 $39,166 6.0% 4.5% 3.0% 1.5% 0.0% Average Loans Net Charge-offs Ratio 40,000 30,000 20,000 10,000 0 1.46% 1.42% 1.30% 1.19% 1.12% 2Q11 3Q11 4Q11 1Q12 2Q12 Residential Mortgage Performing TDRs* 4,000 3,000 2,000 1,000 $1,939 $1,938 $2,002 $2,017 $2,011 2Q11 3Q11 4Q11 1Q12 2Q12 23 0 2Q12 Earnings Conference Call |
 Credit Quality - Credit Card $ in millions * Excluding portfolio purchases where the acquired loans were recorded at fair value at the purchase date Average Loans and Net Charge-offs Ratios Key Statistics 20,000 15,000 10,000 5,000 0 $15,884 $16,057 $16,271 $16,778 $16,696 5.62% 5.45% 4.54% 4.40% 4.88% 4.71% 4.21% 4.05% 4.25% 4.10% Average Loans 30-89 Delinquencies 90+ Delinquencies Nonperforming Loans 2Q11 $15,884 1.34% 1.32% 1.59% 1Q12 $16,778 1.26% 1.33% 1.25% 2Q12 $16,696 1.20% 1.17% 1.12% Credit Card Core Portfolio $16,093 Portfolios Acquired at Fair Value $603 12.0% 9.0% 6.0% 3.0% 0.0% Average Loans Net Charge-offs Ratio Excluding Acquired Portfolios* Comments Net charge-offs continue to remain low Overall delinquencies and nonperforming loans declined on a linked quarter and year-over-year basis 2Q11 3Q11 4Q11 1Q12 2Q12 Net Charge-offs Ratio 2Q12 Earnings Conference Call 24 |
 Credit Quality - Home Equity Average Loans and Net Charge-offs Ratios Key Statistics Comments High-quality originations (weighted average FICO 772, weighted average CLTV 69%) originated primarily through the retail branch network to existing bank customers on their primary residence Nonperforming loans increased in the quarter as the Company included junior lien loans and lines greater than 120 days past due, as well as junior lien loans and lines behind a first lien greater than 180 days past due or in nonaccrual status, as nonperforming loans 2Q11 1Q12 2Q12 Average Loans $18,634 $17,933 $17,598 30-89 Delinquencies 0.78% 0.82% 0.71% 90+ Delinquencies 0.65% 0.68% 0.30% Nonperforming Loans 0.22% 0.23% 0.91% Consumer Finance: 13% Wtd Avg LTV*: 82% NCO: 3.66% $ in millions Traditional: 87% Wtd Avg LTV*: 71% NCO: 1.10% * LTV at origination 2Q12 Earnings Conference Call 25 24,000 18,000 12,000 6,000 0 $18,634 $18,510 $18,281 $17,933 $17,598 1.64% 1.59% 1.67% 1.66% 1.44% 2Q11 3Q11 4Q11 1Q12 2Q12 Average Loans Net Charge-offs Ratio 6.0% 4.5% 3.0% 1.5% 0.0% Home Equity |
 Credit Quality - Retail Leasing Average Loans and Net Charge-offs Ratios Key Statistics Comments High-quality originations (weighted average FICO 772) Retail leasing delinquencies have stabilized at very low levels Strong used auto values continued to contribute to historically low net charge-offs 2Q11 1Q12 2Q12 Average Loans $4,808 $5,095 $5,151 30-89 Delinquencies 0.20% 0.12% 0.13% 90+ Delinquencies 0.02% 0.02% 0.00% Nonperforming Loans --% --% --% $ in millions * Manheim Used Vehicle Value Index source: www.manheimconsulting.com, January 1995 = 100, quarter value = average monthly ending value 26 6,000 4,000 2,000 0 0 $4,808 $5,097 $5,150 $5,095 $5,151 3.0% 2.0% 1.0% 0.0% -1.0% Manheim Used Vehicle Index* 130 120 110 100 90 2Q11 3Q11 4Q11 1Q12 2Q12 2Q12 Earnings Conference Call 0.00% -0.08% 0.00% 0.08% 0.00% Average Loans Net Charge-offs Ratio |
 Credit Quality - Other Retail Average Loans and Net Charge-offs Ratios Key Statistics Comments Average balances grew modestly during the quarter as auto loan demand remained strong Delinquencies and nonperforming loans remained stable Net charge-offs continued to improve 2Q11 1Q12 2Q12 Average Loans $24,498 $24,902 $25,151 30-89 Delinquencies 0.62% 0.51% 0.51% 90+ Delinquencies 0.20% 0.17% 0.16% Nonperforming Loans 0.13% 0.10% 0.09% Installment $5,381 Auto Loans $11,974 Revolving Credit $3,274 Student Lending $4,522 $ in millions 27 2Q12 Earnings Conference Call 28,000 21,000 14,000 7,000 0 $24,498 $24,773 $24,901 $24,902 $25,151 1.16% 1.11% 1.19% 0.92% 0.86% 2Q11 3Q11 4Q11 1Q12 2Q12 6.0% 4.5% 0.0% 3.0% 1.5% Other Retail Average Loans Net Charge-offs Ratio |
 Non-GAAP Financial Measures 2Q12 Earnings Conference Call 28 |
 U.S. Bancorp 2Q12 Earnings Conference Call U.S. Bancorp 2Q12 Earnings Conference Call July 18, 2012 |