 U.S. Bancorp 3Q12 Earnings Conference Call U.S. Bancorp 3Q12 Earnings Conference Call October 17, 2012 Richard K. Davis Chairman, President and CEO Andy Cecere Vice Chairman and CFO Exhibit 99.2 |
 2 Forward-looking Statements and Additional Information The following information appears in accordance with the Private Securities Litigation Reform Act of 1995: This presentation contains forward-looking statements about U.S. Bancorp. Statements that are not historical or current facts, including statements about beliefs and expectations, are forward-looking statements and are based on the information available to, and assumptions and estimates made by, management as of the date made. These forward-looking statements cover, among other things, anticipated future revenue and expenses and the future plans and prospects of U.S. Bancorp. Forward-looking statements involve inherent risks and uncertainties, and important factors could cause actual results to differ materially from those anticipated. Global and domestic economies could fail to recover from the recent economic downturn or could experience another severe contraction, which could adversely affect U.S. Bancorp’s revenues and the values of its assets and liabilities. Global financial markets could experience a recurrence of significant turbulence, which could reduce the availability of funding to certain financial institutions and lead to a tightening of credit, a reduction of business activity, and increased market volatility. Continued stress in the commercial real estate markets, as well as a delay or failure of recovery in the residential real estate markets, could cause additional credit losses and deterioration in asset values. In addition, U.S. Bancorp’s business and financial performance is likely to be negatively impacted by effects of recently enacted and future legislation and regulation. U.S. Bancorp’s results could also be adversely affected by continued deterioration in general business and economic conditions; changes in interest rates; deterioration in the credit quality of its loan portfolios or in the value of the collateral securing those loans; deterioration in the value of securities held in its investment securities portfolio; legal and regulatory developments; increased competition from both banks and non-banks; changes in customer behavior and preferences; effects of mergers and acquisitions and related integration; effects of critical accounting policies and judgments; and management’s ability to effectively manage credit risk, residual value risk, market risk, operational risk, interest rate risk and liquidity risk. For discussion of these and other risks that may cause actual results to differ from expectations, refer to U.S. Bancorp’s Annual Report on Form 10-K for the year ended December 31, 2011, on file with the Securities and Exchange Commission, including the sections entitled “Risk Factors” and “Corporate Risk Profile” contained in Exhibit 13, and all subsequent filings with the Securities and Exchange Commission under Sections 13(a), 13(c), 14 or 15(d) of the Securities Exchange Act of 1934. Forward-looking statements speak only as of the date they are made, and U.S. Bancorp undertakes no obligation to update them in light of new information or future events. This presentation includes non-GAAP financial measures to describe U.S. Bancorp’s performance. The reconciliations of those measures to GAAP measures are provided within or in the appendix of the presentation. These disclosures should not be viewed as a substitute for operating results determined in accordance with GAAP, nor are they necessarily comparable to non-GAAP performance measures that may be presented by other companies. |
 3 3Q12 Earnings Conference Call 3Q12 Highlights Record net income of $1.5 billion; $0.74 per diluted common share Record total net revenue of $5.2 billion, up 8.0% vs. 3Q11 • Net interest income growth of 6.1% vs. 3Q11; noninterest income growth of 10.4% vs. 3Q11 Positive operating leverage on both a year-over-year and a linked quarter basis Average loan growth of 7.3% vs. 3Q11 and average loan growth of 1.3% vs. 2Q12 (1.6% excluding the impact of a credit card portfolio sale) Strong average deposit growth of 11.1% vs. 3Q11 and 3.5% vs. 2Q12 Net charge-offs increased 3.5% vs. 2Q12 (decreased 6.9% excluding $54 million of incremental charge-offs due to a regulatory clarification) Nonperforming assets (excluding covered assets) declined 3.0% vs. 2Q12 (7.8% excluding $109 million of incremental nonperforming assets due to a regulatory clarification) Capital generation continues to fortify capital position • Tier 1 common equity ratio of approximately 8.2% using proposed rules for Basel III standardized approach released June 2012 • Tier 1 common equity ratio of 9.0%; Tier 1 capital ratio of 10.9% • Repurchased 17 million shares of common stock during 3Q12 • Returned 67% of our earnings in 3Q12 to shareholders |
 4 3Q12 Earnings Conference Call Performance Ratios ROCE and ROA Efficiency Ratio and Net Interest Margin Return on Avg Common Equity Return on Avg Assets Efficiency Ratio Net Interest Margin Efficiency ratio computed as noninterest expense divided by the sum of net interest income on a taxable-equivalent basis and noninterest income excluding securities gains (losses) net |
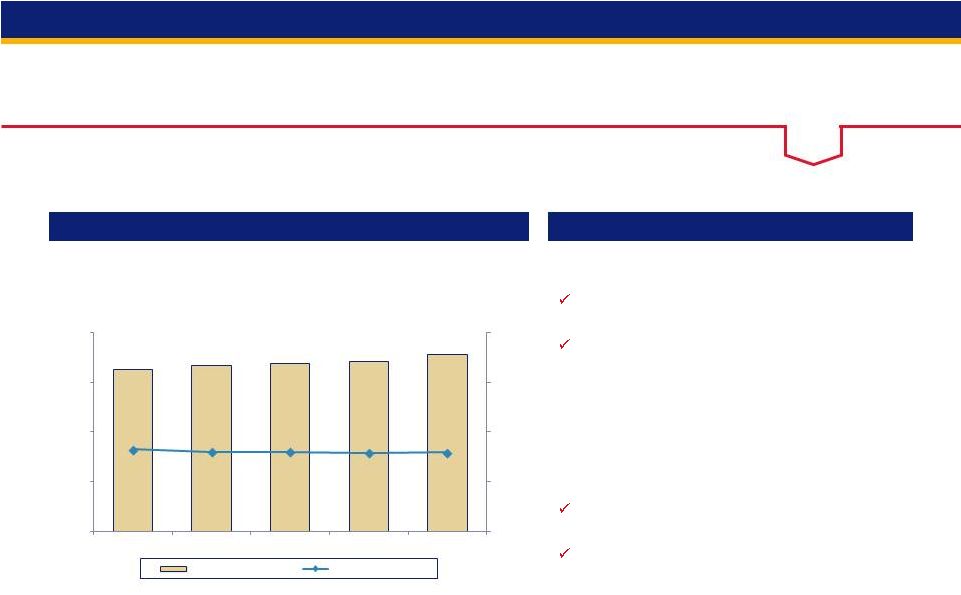
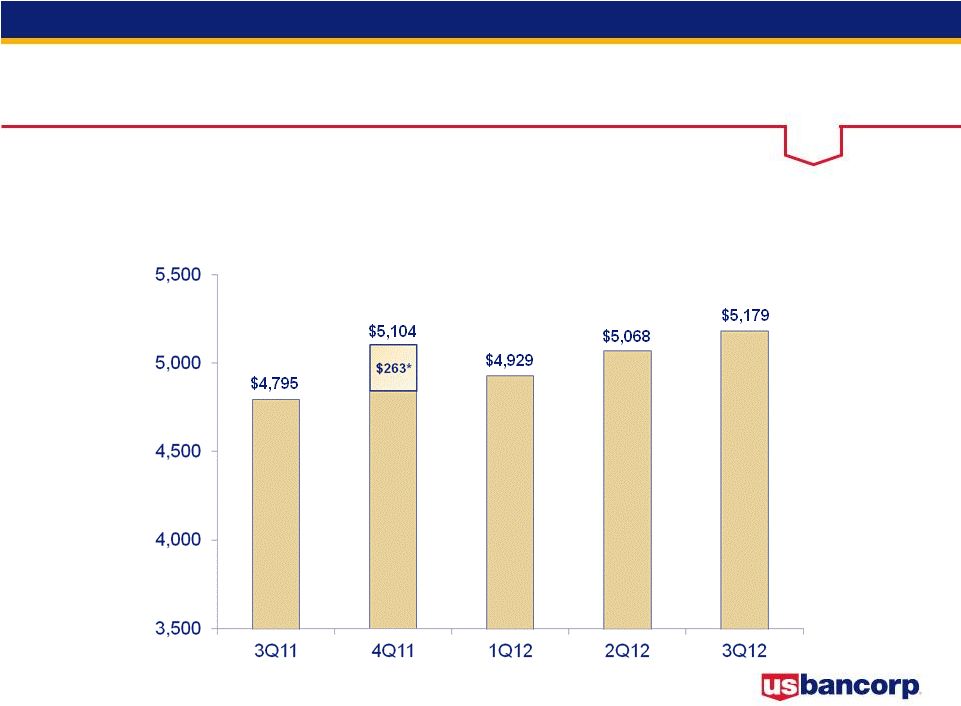 5 3Q12 Earnings Conference Call * Gain on merchant processing agreement settlement Taxable-equivalent basis Revenue Growth Year-Over-Year Growth 4.5% 8.1% 9.1% 8.1% 8.0% $ in millions |
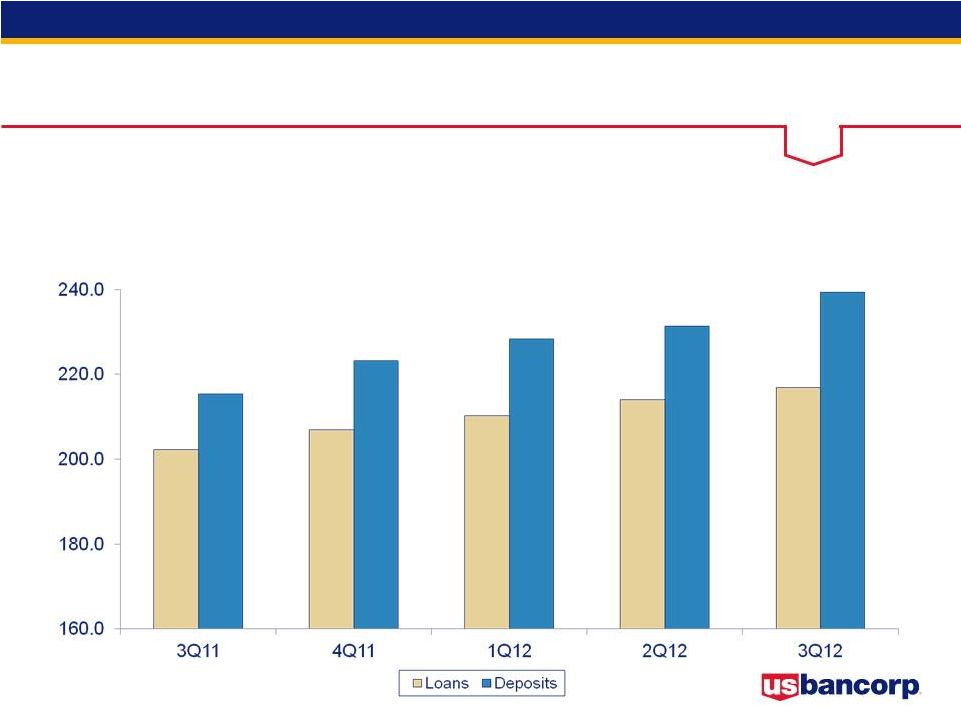 6 3Q12 Earnings Conference Call Loan and Deposit Growth Average Balances Year-Over-Year Growth $ in billions 7.7% $214.1 7.3% $216.9 5.0% $202.2 5.9% $207.0 6.4% $210.2 10.5% $231.3 11.1% $239.3 17.9% $215.4 17.3% $223.3 11.7% $228.3 |
 7 3Q12 Earnings Conference Call Credit Quality * Excluding Covered Assets (assets subject to loss sharing agreements with FDIC) ** Related to a regulatory clarification in the treatment of residential mortgage and other consumer loans to borrowers who have exited bankruptcy but continue to make payments on their loans *** Excluding $54 million of incremental charge-offs Net Charge-offs Nonperforming Assets* $ in millions Net Charge-offs (Left Scale) NCOs to Avg Loans (Right Scale) Nonperforming Assets (Left Scale) NPAs to Loans plus ORE (Right Scale) |
 8 3Q12 Earnings Conference Call YTD YTD 3Q12 2Q12 3Q11 vs 2Q12 vs 3Q11 3Q12 3Q11 % B/(W) Net Interest Income 2,783 $ 2,713 $ 2,624 $ 2.6 6.1 8,186 $ 7,675 $ 6.7 Noninterest Income 2,396 2,355 2,171 1.7 10.4 6,990 6,329 10.4 Total Revenue 5,179 5,068 4,795 2.2 8.0 15,176 14,004 8.4 Noninterest Expense 2,609 2,601 2,476 (0.3) (5.4) 7,770 7,215 (7.7) Operating Income 2,570 2,467 2,319 4.2 10.8 7,406 6,789 9.1 Net Charge-offs 538 520 669 (3.5) 19.6 1,629 2,221 26.7 Excess Provision (50) (50) (150) -- -- (190) (375) -- Income before Taxes 2,082 1,997 1,800 4.3 15.7 5,967 4,943 20.7 Applicable Income Taxes 650 619 548 (5.0) (18.6) 1,852 1,483 (24.9) Noncontrolling Interests 42 37 21 13.5 100.0 112 62 80.6 Net Income 1,474 1,415 1,273 4.2 15.8 4,227 3,522 20.0 Preferred Dividends/Other 70 70 36 - (94.4) 193 115 (67.8) NI to Common 1,404 $ 1,345 $ 1,237 $ 4.4 13.5 4,034 $ 3,407 $ 18.4 Diluted EPS 0.74 $ 0.71 $ 0.64 $ 4.2 15.6 2.12 $ 1.77 $ 19.8 Average Diluted Shares 1,897 1,898 1,922 0.1 1.3 1,901 1,926 1.3 % B/(W) Earnings Summary $ in millions, except per-share data Taxable-equivalent basis |
 9 3Q12 Earnings Conference Call 3Q12 Results - Key Drivers vs. 3Q11 Net Revenue growth of 8.0% • Net interest income growth of 6.1%; net interest margin of 3.59% vs. 3.65% • Noninterest income growth of 10.4% Noninterest expense growth of 5.4% Provision for credit losses lower by $31 million • Net charge-offs lower by $131 million • Provision lower than NCOs by $50 million vs. $150 million in 3Q11 vs. 2Q12 Net Revenue growth of 2.2% • Net interest income growth of 2.6%; net interest margin of 3.59% vs. 3.58% • Noninterest income growth of 1.7% Noninterest expense growth of 0.3% Provision for credit losses higher by $18 million • Net charge-offs higher by $18 million • Provision lower than NCOs by $50 million vs. $50 million in 2Q12 |
 10 3Q12 Earnings Conference Call Capital Position $ in billions RWA = risk-weighted assets 3Q12 2Q12 1Q12 4Q11 3Q11 Shareholders' equity 38.7 $ 37.8 $ 35.9 $ 34.0 $ 33.2 $ Tier 1 capital 30.8 30.0 30.0 29.2 28.1 Total risk-based capital 37.6 36.4 36.4 36.1 35.4 Tier 1 common equity ratio 9.0% 8.8% 8.7% 8.6% 8.5% Tier 1 capital ratio 10.9% 10.7% 10.9% 10.8% 10.8% Total risk-based capital ratio 13.3% 13.0% 13.3% 13.3% 13.5% Leverage ratio 9.2% 9.1% 9.2% 9.1% 9.0% Tangible common equity ratio 7.2% 6.9% 6.9% 6.6% 6.6% Tangible common equity as a % of RWA 8.8% 8.5% 8.3% 8.1% 8.1% Basel III Tier 1 common equity ratio using Basel III proposals published prior to June 2012 - - 8.4% 8.2% 8.2% Tier 1 common equity ratio approximated using proposed rules for the Basel III standardized approach released June 2012 8.2% 7.9% - - - |
 11 3Q12 Earnings Conference Call Mortgage Repurchase Mortgages Repurchased and Make-whole Payments Mortgage Representation and Warranties Reserve $ in millions 3Q12 2Q12 1Q12 4Q11 3Q11 Beginning Reserve $216 $202 $160 $162 $173 Net Realized Losses (32) (31) (25) (31) (31) Additions to Reserve 36 45 67 29 20 Ending Reserve $220 $216 $202 $160 $162 Mortgages repurchased and make-whole payments $58 $58 $55 $61 $57 Repurchase activity lower than peers due to: • Conservative credit and underwriting culture • Disciplined origination process - primarily conforming loans ( 95% sold to GSEs) Do not participate in private placement securitization market Outstanding repurchase and make-whole requests balance = $118 million Repurchase requests expected to remain relatively stable over next few quarters |
 continues continues Momentum Momentum |
 13 3Q12 Earnings Conference Call Appendix |
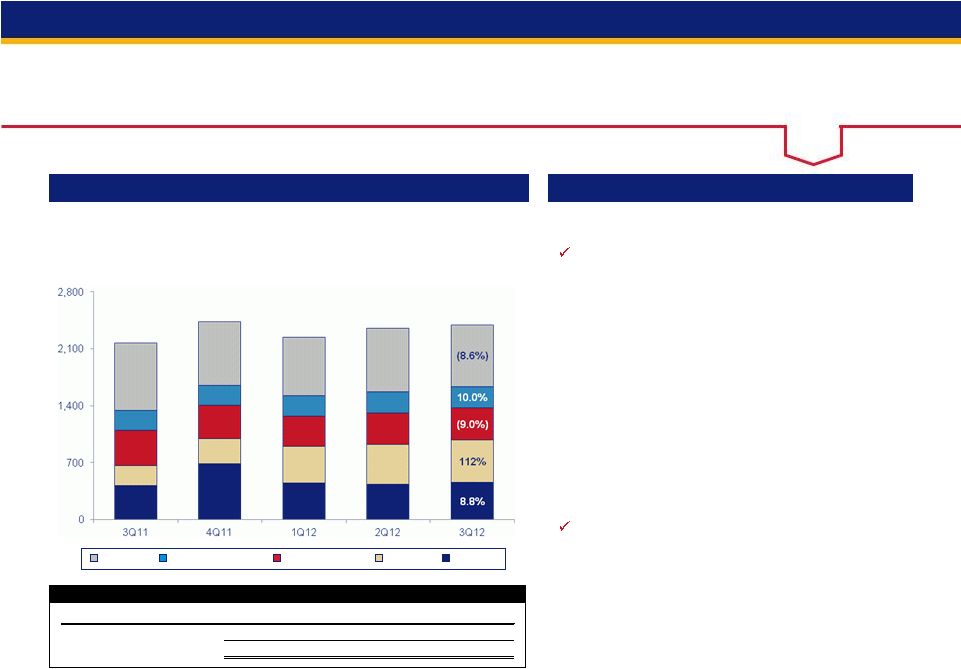
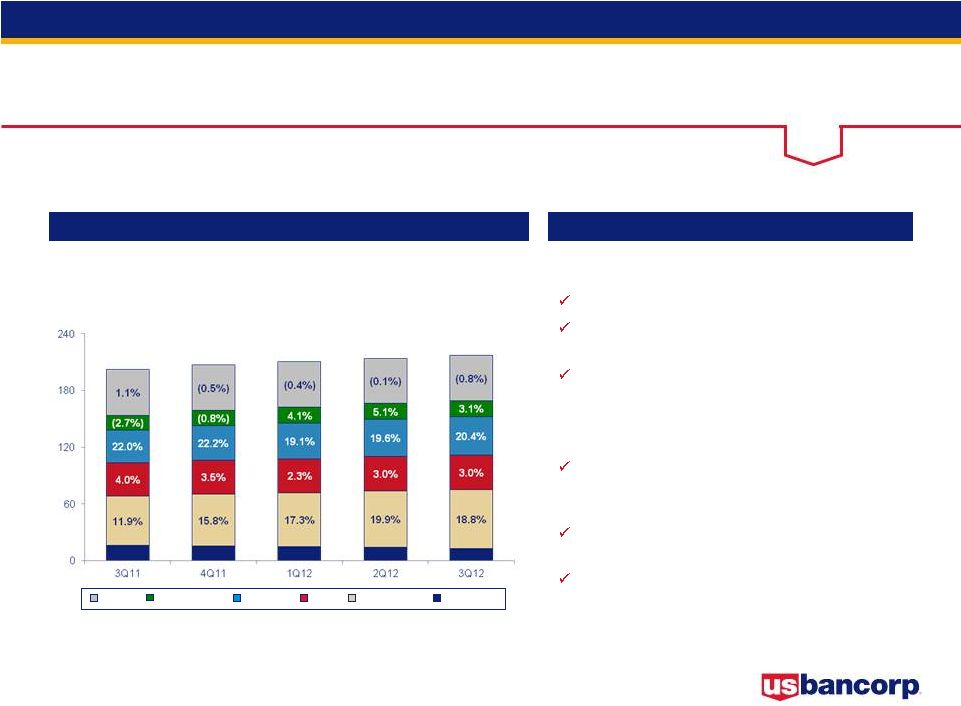 14 3Q12 Earnings Conference Call Commercial CRE Res Mtg Credit Card Retail Average Loans Average Loans Key Points $ in billions vs. 3Q11 Average total loans grew by $14.7 billion, or 7.3% Average total loans, excluding covered loans, were higher by 9.6% Average total commercial loans increased $9.8 billion, or 18.8%; average residential mortgage loans increased $6.9 billion, or 20.4% vs. 2Q12 Average total loans grew by $2.8 billion, or 1.3% (1.6% excluding the impact of a credit card portfolio sale) Average total loans, excluding covered loans, were higher by 2.0% Average total commercial loans increased $2.2 billion, or 3.6%; average residential mortgage loans increased $1.8 billion, or 4.6% Year-Over-Year Growth 5.0% 5.9% 6.4% 7.7% 7.3% Covered Commercial CRE Res Mtg Retail Credit Card $202.2 $207.0 $210.2 $214.1 $216.9 Covered |
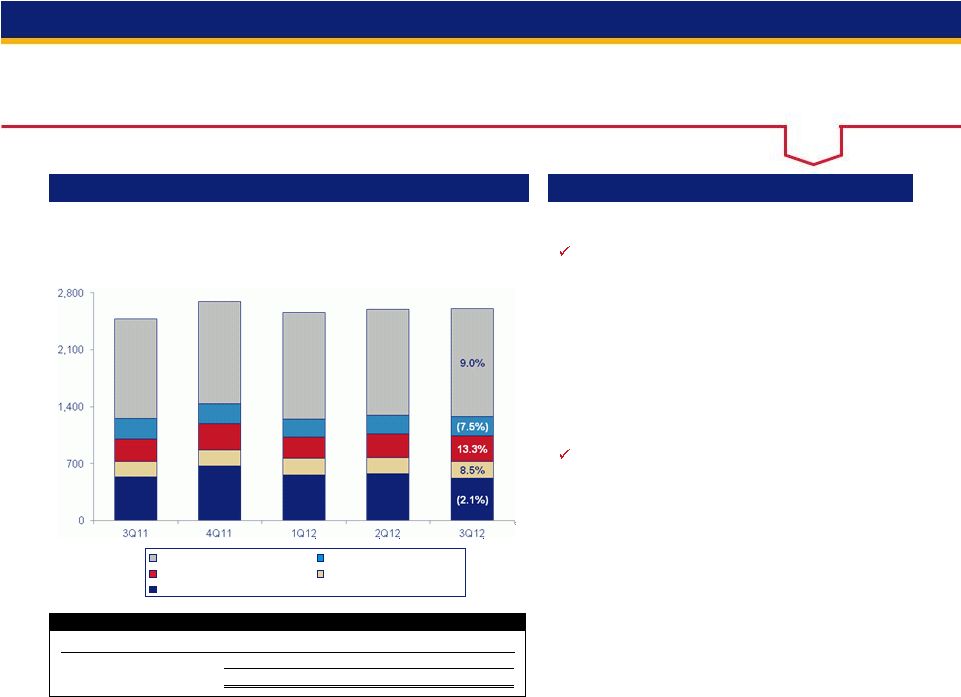
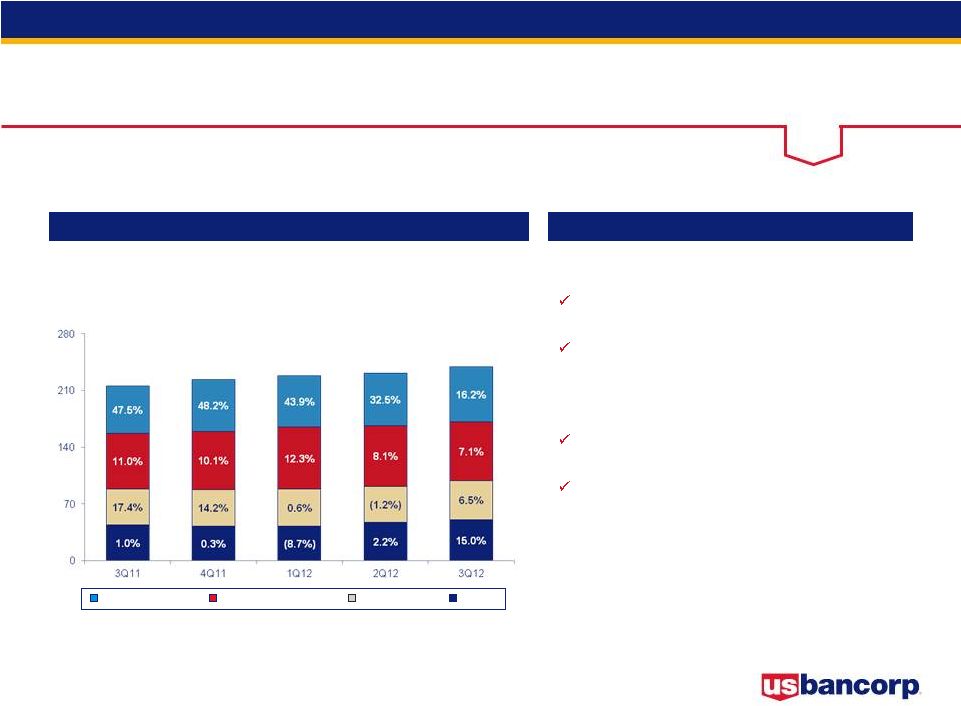 15 3Q12 Earnings Conference Call Time Money Market Checking & Savings Noninterest -bearing Average Deposits Average Deposits Key Points $ in billions vs. 3Q11 Average total deposits increased by $23.9 billion, or 11.1% Average low cost deposits (NIB, interest checking, money market and savings) increased by $17.3 billion, or 10.1% vs. 2Q12 Average total deposits increased by $8.0 billion, or 3.5% Average low cost deposits increased by $4.1 billion, or 2.2% Year-Over-Year Growth 17.9% 17.3% 11.7% 10.5% 11.1% Time Money Market Checking and Savings Noninterest-bearing $215.4 $223.3 $228.3 $231.3 $239.3 |
 16 3Q12 Earnings Conference Call Net Interest Income Net Interest Income Key Points $ in millions Taxable-equivalent basis vs. 3Q11 Average earning assets grew by $22.7 billion, or 7.9% Net interest margin lower by 6 bp (3.59% vs. 3.65%) driven by: • Higher balances in lower yielding investment securities • Partially offset by lower rates on deposits and long- term debt and the classification change of credit card balance transfer fees from noninterest income to interest income beginning 1Q12 vs. 2Q12 Average earning assets grew by $5.2 billion, or 1.7% Net interest margin higher by 1 bp (3.59% vs. 3.58%) driven by: • Favorable funding costs, primarily lower rates on wholesale funds • Partially offset by a reduction in the yield on the investment securities portfolio Year-Over-Year Growth 5.9% 7.0% 7.3% 6.6% 6.1% $2,624 $2,673 $2,690 $2,713 $2,783 3.65% 3.60% 3.60% 3.58% 3.59% 2.0% 3.0% 4.0% 5.0% 6.0% 1,000 1,500 2,000 2,500 3,000 3Q11 4Q11 1Q12 2Q12 3Q12 Net Interest Income Net Interest Margin |
 17 3Q12 Earnings Conference Call Noninterest Income Noninterest Income Key Points $ in millions Payments = credit and debit card revenue, corporate payment products revenue and merchant processing; Service charges = deposit service charges, treasury management fees and ATM processing services vs. 3Q11 Noninterest income grew by $225 million, or 10.4%, driven by: • Mortgage banking revenue increase of $274 million • Trust and investment management fees (10.0% growth) • Increase in other income (3.8% growth) due to a credit card portfolio sale gain, partially offset by an equity-method investment charge and lower retail lease residual revenue • Lower credit and debit card revenue (26.3% decline) due to the impact of legislative changes and a 1Q12 classification change, partially offset by higher transaction volumes • Lower ATM processing services revenue (24.3% decline) due to a 1Q12 classification change vs. 2Q12 Noninterest income grew by $41 million, or 1.7%, driven by: • Mortgage banking revenue increase of $29 million • Higher deposit service charges (11.5% increase) and corporate payment products revenue (5.8% increase) due to seasonally higher sales volume • Partially offset by lower credit and debit card revenue (9.4% decline) primarily due to a benefit from the final expiration of debit card customer rewards recognized in 2Q12 and merchant processing (3.9% decline) due to lower volumes Year-Over-Year Growth 2.9% 9.4% 11.3% 9.7% 10.4% All Other Mortgage Service Charges Trust and Inv Mgmt Payments 3Q11 4Q11 1Q12 2Q12 3Q12 Non-operating gains - $ 263 $ - $ - $ - $ Total - $ 263 $ - $ - $ - $ Notable Noninterest Income Items $2,171 $2,431 $2,239 $2,355 $2,396 Trust and Inv Mgmt Service Charges All Other Mortgage Payments |
 18 3Q12 Earnings Conference Call Noninterest Expense Noninterest Expense Key Points $ in millions vs. 3Q11 Noninterest expense was higher by $133 million, or 5.4%, driven by: • Increase in professional services (44.0%) principally due to mortgage servicing review-related projects • Increased compensation (8.6%) and employee benefits (10.8%) • Lower net occupancy and equipment (7.5%) principally reflecting the change in classification of ATM surcharge revenue passed through to others vs. 2Q12 Noninterest expense was higher by $8 million, or 0.3%, driven by: • Higher compensation expense (3.1%) and professional services (5.9%) • Higher marketing (20.0%) due to the timing of marketing campaigns • Partially offset by a decrease in other expense (9.4%) primarily due to the 2Q12 accrual related to indemnification obligations associated with Visa and lower FDIC insurance costs, partially offset by higher costs related to investments in affordable housing and other tax-advantaged projects All Other Tech and Communications Prof Svcs, Marketing and PPS Occupancy and Equipment Compensation and Benefits 3Q11 4Q11 1Q12 2Q12 3Q12 Mortgage servicing matters - $ 130 $ - $ - $ - $ Total - $ 130 $ - $ - $ - $ Notable Noninterest Expense Items Year-Over-Year Growth 3.8% 8.5% 10.6% 7.3% 5.4% $2,476 $2,696 $2,560 $2,601 $2,609 Occupancy and Equipment Prof Services, Marketing and PPS Tech and Comm Compensation and Benefits All Other |
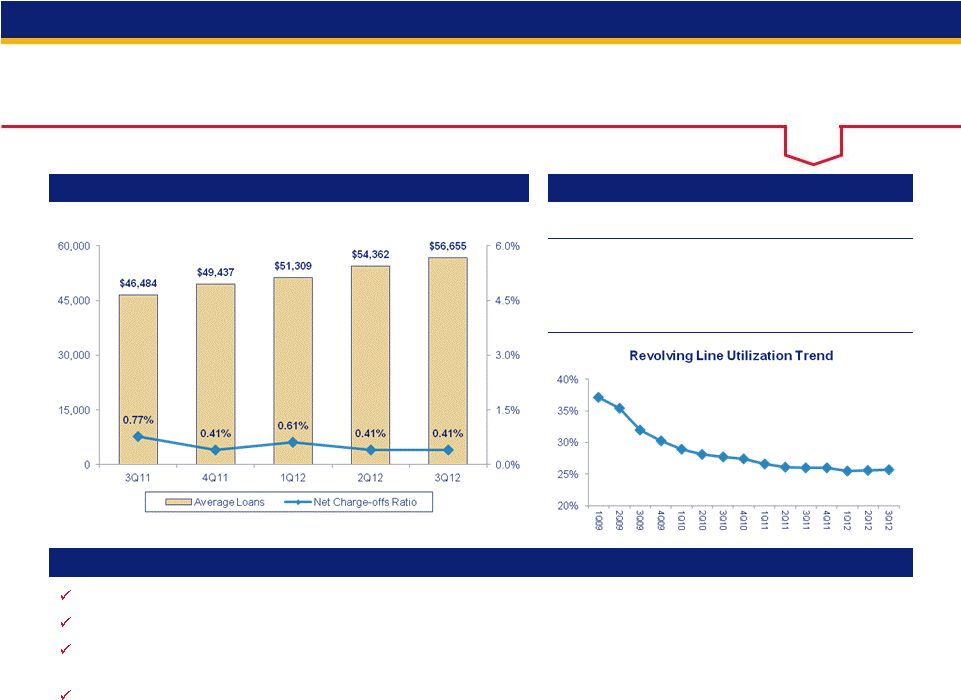 19 3Q12 Earnings Conference Call Credit Quality - Commercial Loans Average Loans and Net Charge-offs Ratios Key Statistics Comments Nonperforming loans continue to improve year-over-year and on a linked quarter basis Net charge-offs and delinquencies were relatively stable and remain at levels below last year Strong new lending activity of both loans and commitments resulted in 4% linked quarter loan growth and 22% growth year-over-year Utilization rates remain historically low 3Q11 2Q12 3Q12 Average Loans $46,484 $54,362 $56,655 30-89 Delinquencies 0.34% 0.26% 0.29% 90+ Delinquencies 0.09% 0.07% 0.07% Nonperforming Loans 0.71% 0.31% 0.23% $ in millions |
 20 3Q12 Earnings Conference Call Credit Quality - Commercial Leases Average Loans and Net Charge-offs Ratios Key Statistics Comments Net charge-offs improved linked quarter and year-over-year Nonperforming loans declined on a linked quarter and year-over-year basis 3Q11 2Q12 3Q12 Average Loans $5,860 $5,658 $5,537 30-89 Delinquencies 0.93% 0.83% 0.93% 90+ Delinquencies 0.02% 0.00% 0.02% Nonperforming Loans 0.68% 0.40% 0.35% $ in millions $5,860 $5,834 $5,822 $5,658 $5,537 0.61% 1.43% 0.55% 1.07% 0.50% 0.0% 1.5% 3.0% 4.5% 6.0% 0 2,000 4,000 6,000 8,000 3Q11 4Q11 1Q12 2Q12 3Q12 Average Loans Net Charge - offs Ratio Small Ticket $3,260 Equipment Finance $2,277 Commercial Leases |
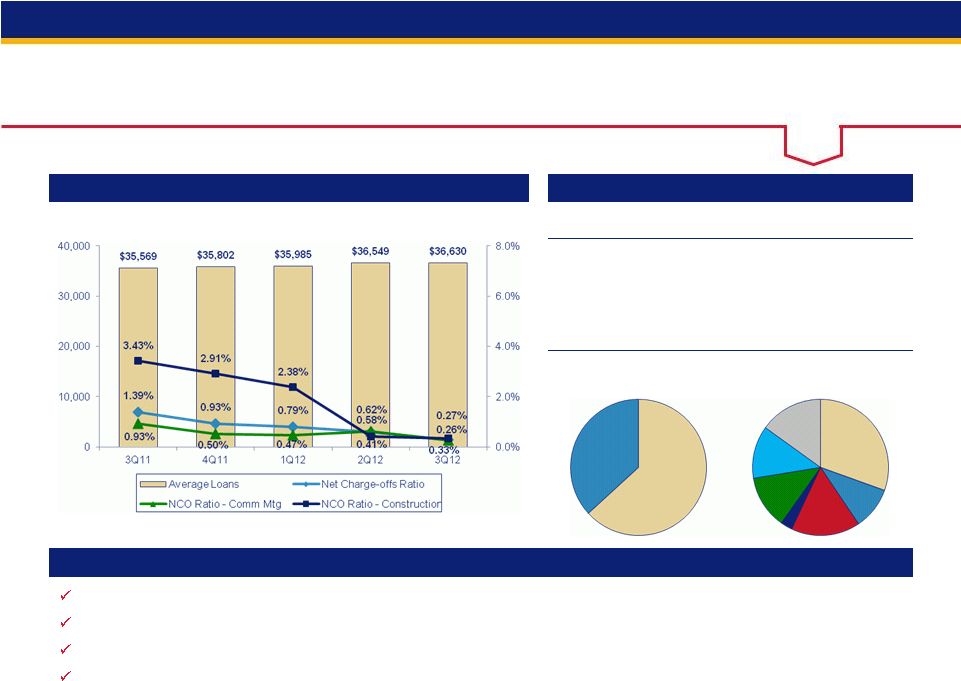 21 3Q12 Earnings Conference Call Credit Quality - Commercial Real Estate Average Loans and Net Charge-offs Ratios Key Statistics Comments Average loans increased $1.1B, or 3.0%, on a year-over-year basis Net charge-off ratio of 0.27%, down from 0.58% on a linked quarter basis and from the 2Q10 peak of 2.67% The linked quarter decline was driven by a 57% reduction in net charge-offs in the mortgage portfolio Delinquencies continue to decline on a linked quarter and year-over-year basis 3Q11 2Q12 3Q12 Average Loans $35,569 $36,549 $36,630 30-89 Delinquencies 0.44% 0.24% 0.18% 90+ Delinquencies 0.08% 0.03% 0.03% Nonperforming Loans 3.43% 1.89% 1.71% Performing TDRs* 459 596 583 $ in millions * TDR = troubled debt restructuring, new accounting guidance adopted 3Q11 (FASB Accounting Standards Update No. 2011-02) Investor $19,400 Owner Occupied $11,286 Multi-family $1,812 Retail $599 Residential Construction $976 Condo Construction $168 A&D Construction $751 Office $742 Other $896 CRE Mortgage CRE Construction |
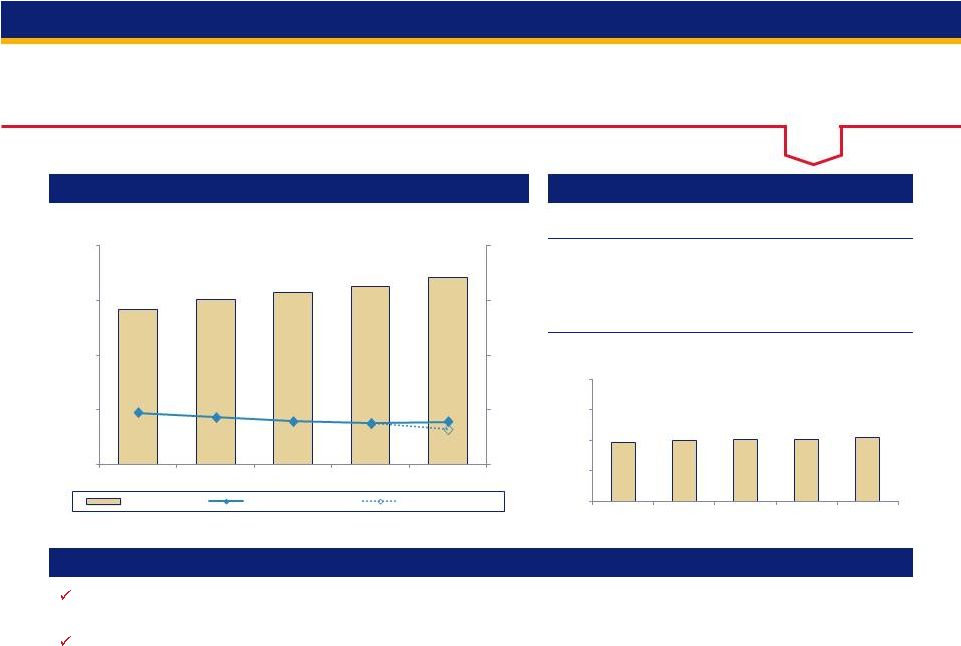 22 3Q12 Earnings Conference Call Credit Quality - Residential Mortgage Average Loans and Net Charge-offs Ratios Key Statistics Comments Strong growth in high quality originations (weighted average FICO 763, weighted average LTV 67%) as average loans increased 4.6% over 2Q12, driven by demand for refinancing Increase in net charge-offs ($22 million), nonperforming loans ($85 million) and performing TDRs ($129 million) primarily due to a regulatory clarification in the treatment of loans to borrowers who have exited bankruptcy but continue to make payments on their loans 3Q11 2Q12 3Q12 Average Loans $34,026 $39,166 $40,969 30-89 Delinquencies 1.09% 0.86% 0.93% 90+ Delinquencies 1.03% 0.80% 0.72% Nonperforming Loans 1.85% 1.65% 1.81% $ in millions ** Excludes GNMA loans, whose repayments are insured by the FHA or guaranteed by the Department of VA ($1,631 million 3Q12) $34,026 $36,256 $37,831 $39,166 $40,969 1.42% 1.30% 1.19% 1.12% 1.17% %* 0.0% 1.5% 3.0% 4.5% 6.0% 0 12,000 24,000 36,000 48,000 3Q11 4Q11 1Q12 2Q12 3Q12 Average Loans Adjusted NCO Ratio 0.96 $1,938 $2,002 $2,017 $2,011 $2,076 0 1,000 2,000 3,000 4,000 3Q11 4Q11 1Q12 2Q12 3Q12 Residential Mortgage Performing TDRs** Net Charge-offs Ratio * Excluding $22 million related to a regulatory clarification in the treatment of loans to borrowers who have exited bankruptcy but continue to make payments on their loans |
 23 3Q12 Earnings Conference Call 3Q11 2Q12 3Q12 Average Loans $16,057 $16,696 $16,551 30-89 Delinquencies 1.38% 1.20% 1.41% 90+ Delinquencies 1.28% 1.17% 1.18% Nonperforming Loans 1.53% 1.12% 0.99% Credit Quality - Credit Card Average Loans and Net Charge-offs Ratios Key Statistics Comments Net charge-offs continue to remain low Average loans are down slightly, however during 3Q12, the Company sold a branded consumer and business credit card portfolio Early stage delinquencies increased primarily due to seasonal patterns $ in millions * Excluding portfolio purchases where the acquired loans were recorded at fair value at the purchase date Average Loans Net Charge-offs Ratio Net Charge-offs Ratio Excluding Acquired Portfolios* $16,057 $16,271 $16,778 $16,696 $16,551 4.40% 4.71% 4.05% 4.10% 4.01% 4.54% 4.88% 4.21% 4.25% 4.17% 0.0% 3.0% 6.0% 9.0% 12.0% 0 5,000 10,000 15,000 20,000 3Q11 4Q11 1Q12 2Q12 3Q12 Core Portfolio $15,936 Portfolios Acquired at Fair Value $615 Credit Card |
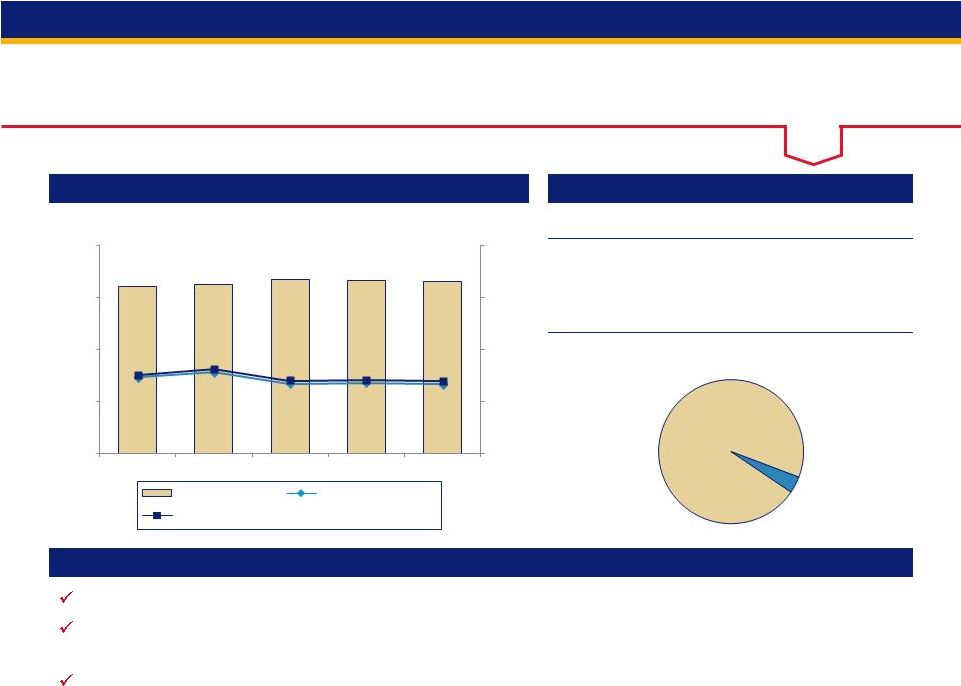
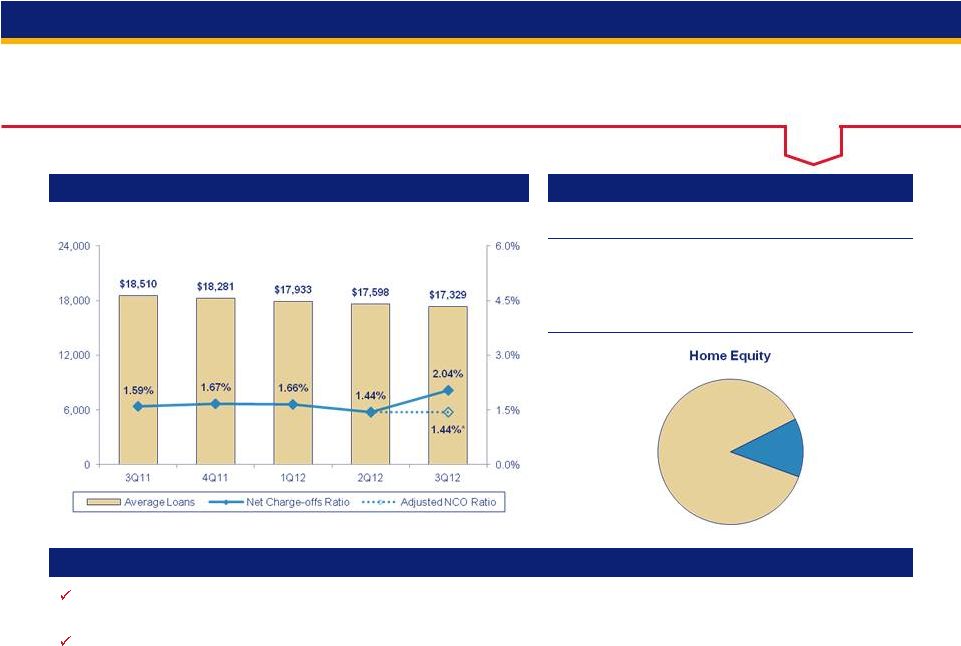 24 3Q12 Earnings Conference Call Credit Quality - Home Equity Average Loans and Net Charge-offs Ratios Key Statistics Comments High-quality originations (weighted average FICO 771, weighted average CLTV 70%) originated primarily through the retail branch network to existing bank customers on their primary residence Increase in net charge-offs ($26 million) and nonperforming loans ($13 million) primarily due to a regulatory clarification in the treatment of loans to borrowers who have exited bankruptcy but continue to make payments on their loans 3Q11 2Q12 3Q12 Average Loans $18,510 $17,598 $17,329 30-89 Delinquencies 0.83% 0.71% 0.81% 90+ Delinquencies 0.67% 0.30% 0.32% Nonperforming Loans 0.19% 0.91% 1.05% Consumer Finance: 13% Wtd Avg LTV**: 82% NCO: 5.48% $ in millions Traditional: 87% Wtd Avg LTV**: 71% NCO: 1.53% ** LTV at origination * Excluding $26 million related to a regulatory clarification in the treatment of loans to borrowers who have exited bankruptcy but continue to make payments on their loans |
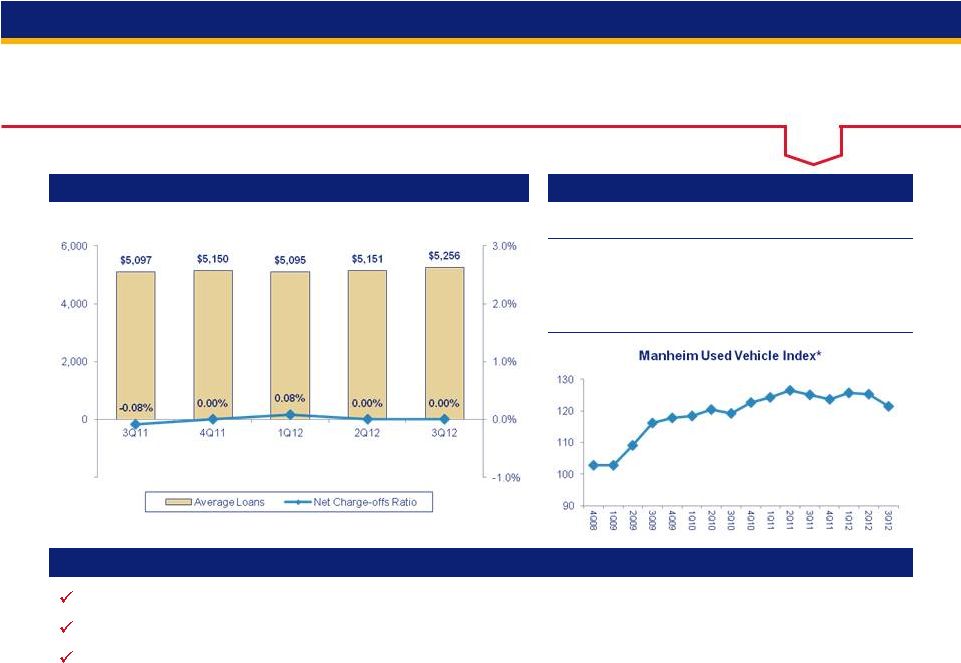 25 3Q12 Earnings Conference Call Credit Quality - Retail Leasing Average Loans and Net Charge-offs Ratios Key Statistics Comments High-quality originations (weighted average FICO 772) Retail leasing delinquencies have stabilized at very low levels Strong used auto values continued to contribute to historically low net charge-offs 3Q11 2Q12 3Q12 Average Loans $5,097 $5,151 $5,256 30-89 Delinquencies 0.19% 0.13% 0.17% 90+ Delinquencies 0.02% 0.00% 0.02% Nonperforming Loans 0.00% 0.00% 0.02% $ in millions * Manheim Used Vehicle Value Index source: www.manheimconsulting.com, January 1995 = 100, quarter value = average monthly ending value |
 26 3Q12 Earnings Conference Call Credit Quality - Other Retail Average Loans and Net Charge-offs Ratios Key Statistics Comments Average balances grew modestly during the quarter as auto loan demand remained strong Increase in net charge-offs ($5 million) and nonperforming loans ($10 million) primarily due to a regulatory clarification in the treatment of loans to borrowers who have exited bankruptcy but continue to make payments on their loans 3Q11 2Q12 3Q12 Average Loans $24,773 $25,151 $25,406 30-89 Delinquencies 0.67% 0.51% 0.59% 90+ Delinquencies 0.20% 0.16% 0.16% Nonperforming Loans 0.12% 0.09% 0.12% Installment $5,480 Auto Loans $12,211 Revolving Credit $3,322 Student Lending $4,393 $ in millions * Excluding $5 million related to a regulatory clarification in the treatment of loans to borrowers who have exited bankruptcy but continue to make payments on their loans $24,773 $24,901 $24,902 $25,151 $25,406 1.11% 1.19% 0.92% 0.86% 1.06% 0.98 0.0% 1.5% 3.0% 4.5% 6.0% 0 7,000 14,000 21,000 28,000 3Q11 4Q11 1Q12 2Q12 3Q12 Average Loans Net Charge-offs Ratio Adjusted NCO Ratio Other Retail |
 27 3Q12 Earnings Conference Call Non-GAAP Financial Measures $ in millions 3Q12 2Q12 1Q12 4Q11 3Q11 Total equity 39,825 $ 38,874 $ 36,914 $ 34,971 $ 34,210 $ Preferred stock (4,769) (4,769) (3,694) (2,606) (2,606) Noncontrolling interests (1,164) (1,082) (1,014) (993) (980) Goodwill (net of deferred tax liability) (8,194) (8,205) (8,233) (8,239) (8,265) Intangible assets (exclude mortgage servicing rights) (980) (1,118) (1,182) (1,217) (1,209) Tangible common equity (a) 24,718 23,700 22,791 21,916 21,150 Tier 1 Capital, determined in accordance with prescribed regulatory requirements using Basel I definition 30,766 30,044 29,976 29,173 28,081 Trust preferred securities - - (1,800) (2,675) (2,675) Preferred stock (4,769) (4,769) (3,694) (2,606) (2,606) Noncontrolling interests, less preferred stock not eligible for Tier I capital (685) (685) (686) (687) (695) Tier 1 common equity using Basel I definition (b) 25,312 24,590 23,796 23,205 22,105 Tier 1 capital, determined in accordance with prescribed regulatory requirements using Basel III proposals published prior to June 2012 27,578 25,636 24,902 Preferred stock (3,694) (2,606) (2,606) Noncontrolling interests of real estate investment trusts (659) (664) (667) Tier 1 common equity using Basel III proposals published prior to June 2012 (c) 23,225 22,366 21,629 Tier 1 capital, determined in accordance with prescribed regulatory requirements approximated using proposed rules for the Basel III standardized approach released June 2012 29,644 28,622 Preferred Stock (4,769) (4,769) Tier 1 common equity approximated using proposed rules for the Basel III standardized approach released June 2012 (d) 24,875 23,853 Total assets 352,253 353,136 340,762 340,122 330,141 Goodwill (net of deferred tax liability) (8,194) (8,205) (8,233) (8,239) (8,265) Intangible assets (exclude mortgage servicing rights) (980) (1,118) (1,182) (1,217) (1,209) Tangible assets (e) 343,079 343,813 331,347 330,666 320,667 Risk-weighted assets, determined in accordance with prescribed regulatory requirements using Basel I definition (f) 282,033 279,972 274,847 271,333 261,115 Risk-weighted assets using Basel III proposals published prior to June 2012 (g) 277,856 274,351 264,103 Risk-weighted assets approximated using proposed rules for the Basel III standarized approach released June 2012 (h) 304,200 303,212 Tangible common equity to tangible assets (a)/(e) 7.2% 6.9% 6.9% 6.6% 6.6% Tangible common equity to risk-weighted assets using Basel I definition (a)/(f) 8.8% 8.5% 8.3% 8.1% 8.1% Tier 1 common equity to risk-weighted assets using Basel I definition (b)/(f) 9.0% 8.8% 8.7% 8.6% 8.5% Tier 1 common equity to risk-weighted assets using Basel III proposals published prior to June 2012 (c)/(g) - - 8.4% 8.2% 8.2% Tier 1 common equity to risk-weighted assets approximated using proposed rules for the Basel III standardized approach released June 2012 (d)/(h) 8.2% 7.9% - - - 3Q12 risk-weighted assets are preliminary data, subject to change prior to filings with applicable regulatory agencies Ratios |
 U.S. Bancorp 3Q12 Earnings Conference Call U.S. Bancorp 3Q12 Earnings Conference Call October 17, 2012 |