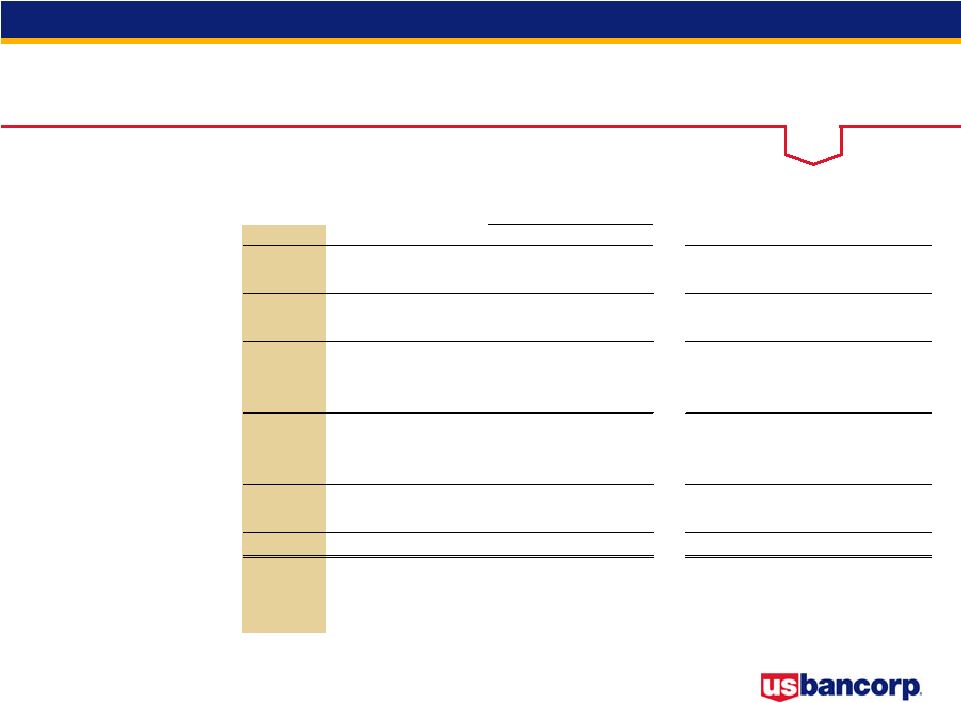
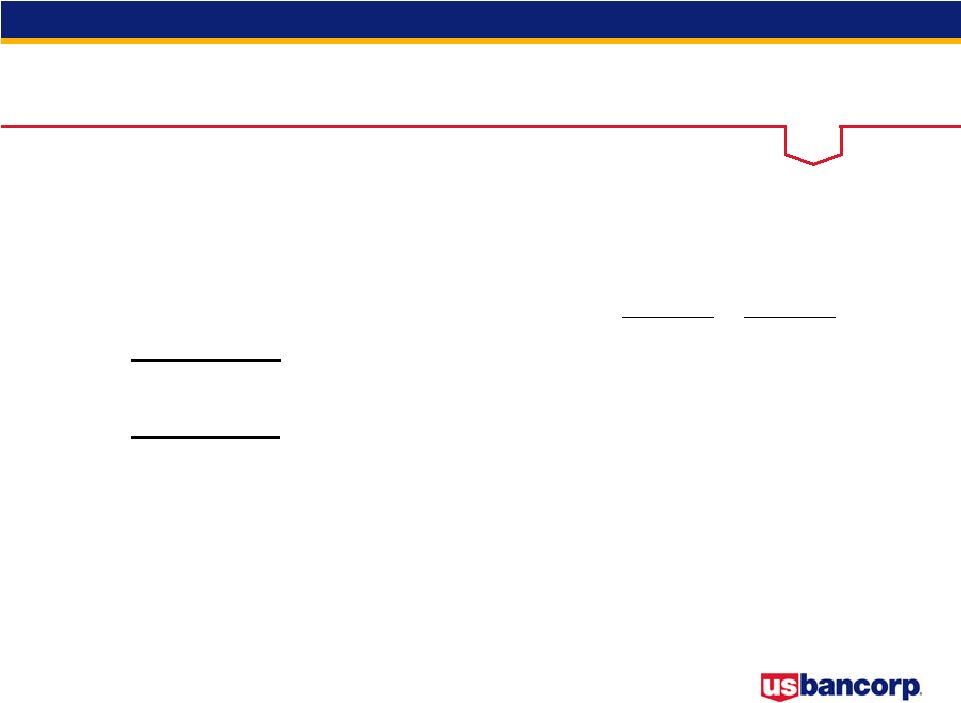
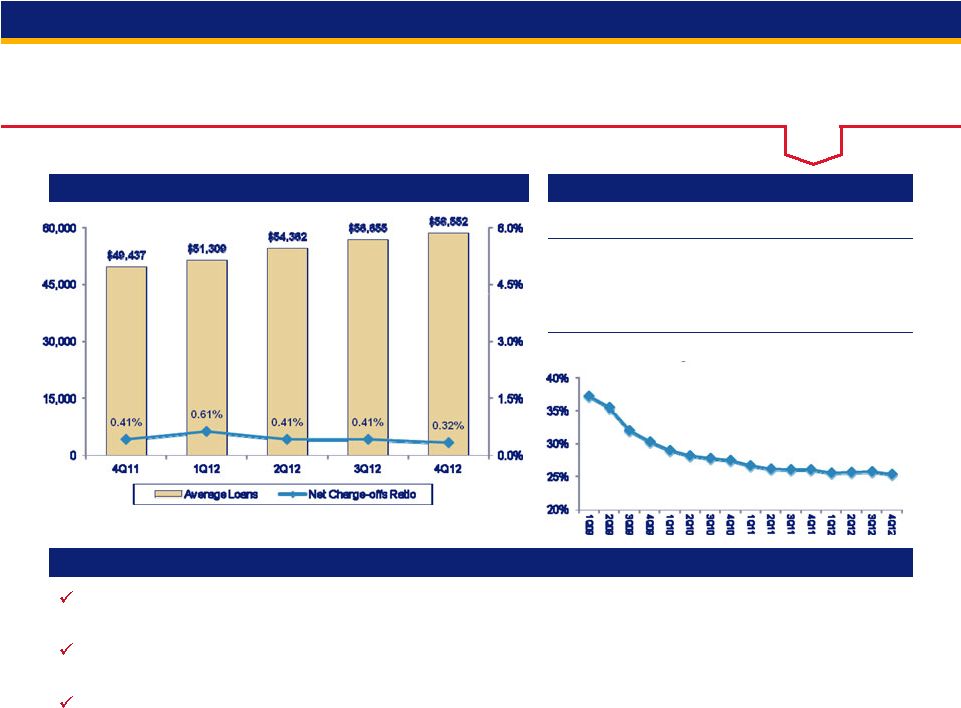
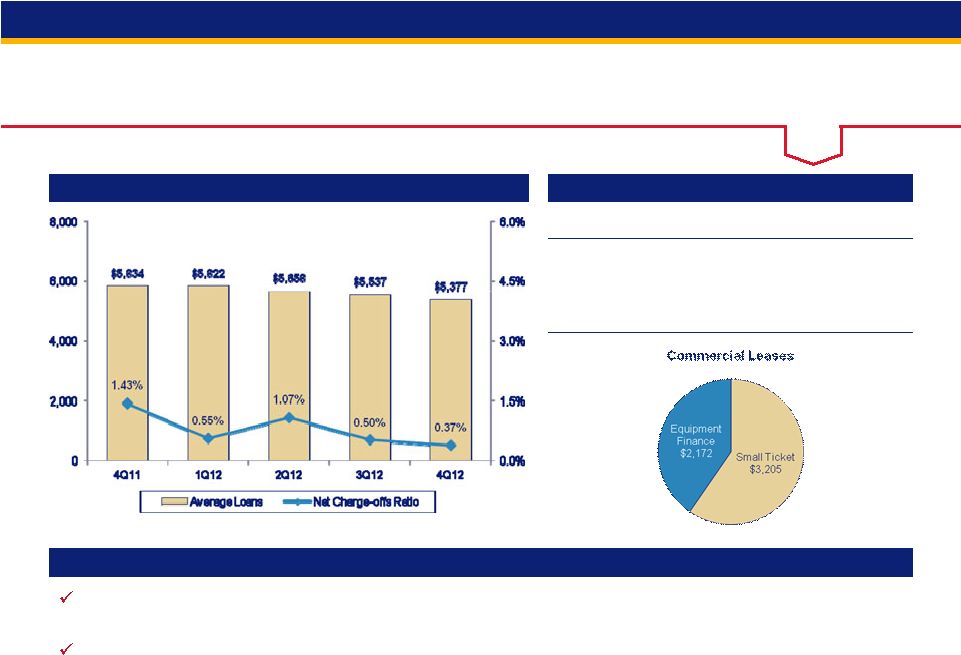
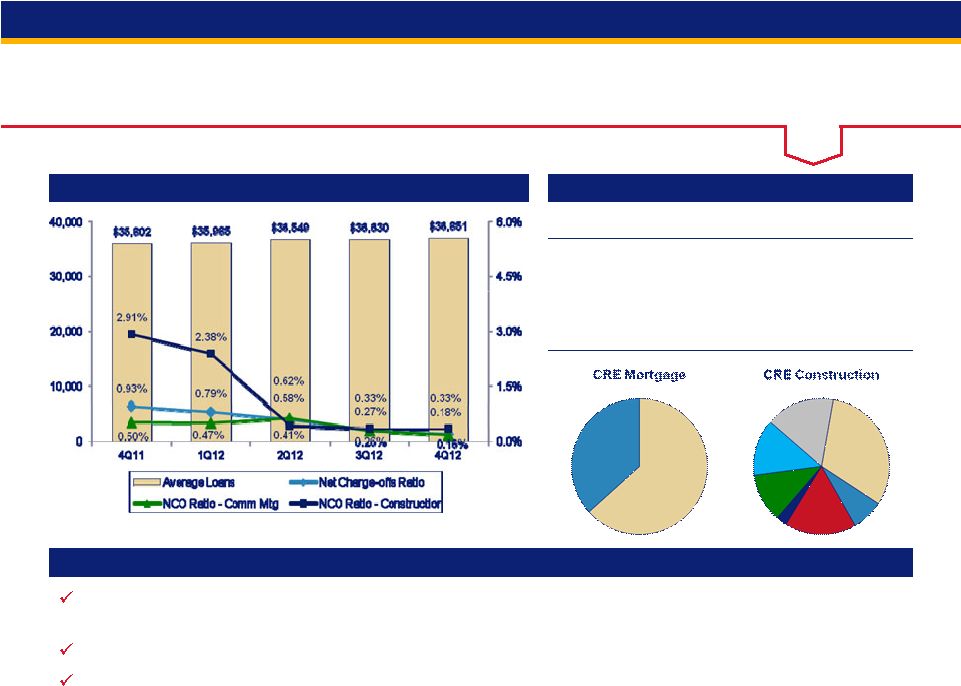
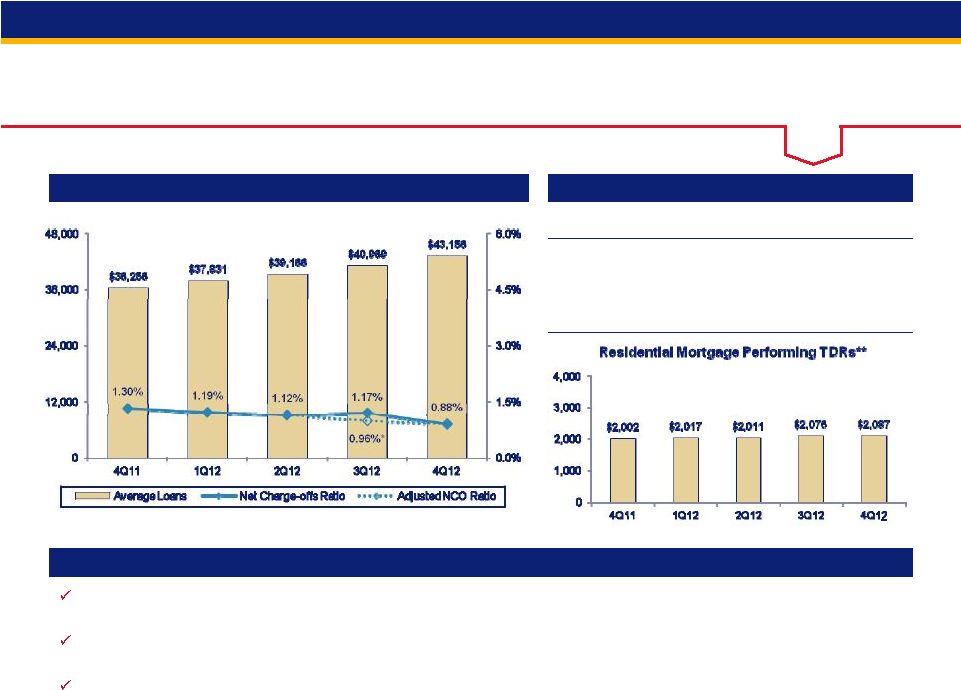
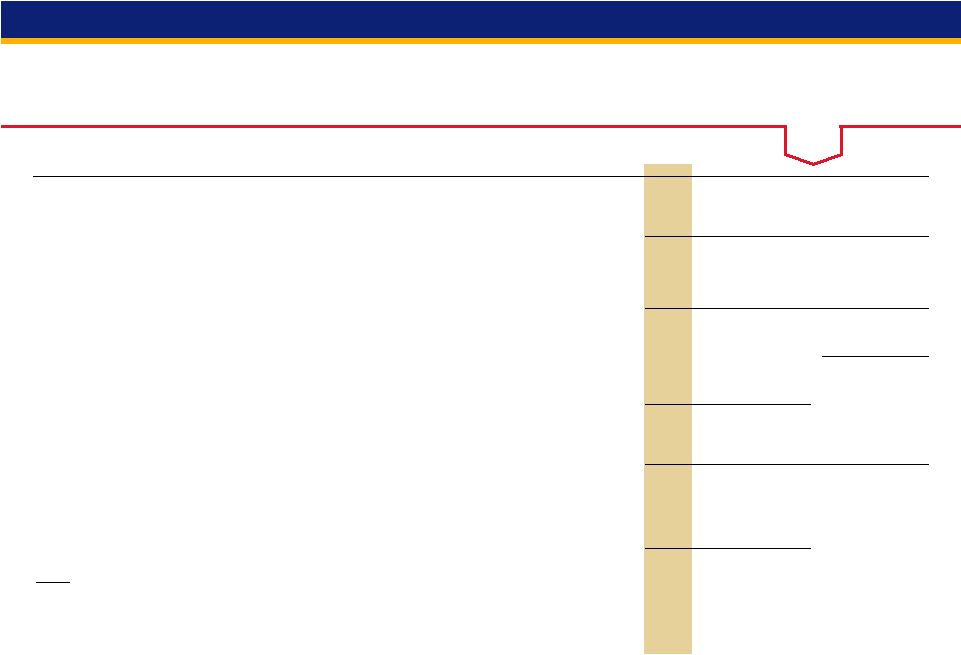
29 4Q12 Earnings Conference Call Non-GAAP Financial Measures $ in millions 4Q12 3Q12 2Q12 1Q12 4Q11 Total equity 40,267 $ 39,825 $ 38,874 $ 36,914 $ 34,971 $ Preferred stock (4,769) (4,769) (4,769) (3,694) (2,606) Noncontrolling interests (1,269) (1,164) (1,082) (1,014) (993) Goodwill (net of deferred tax liability) (8,351) (8,194) (8,205) (8,233) (8,239) Intangible assets (exclude mortgage servicing rights) (1,006) (980) (1,118) (1,182) (1,217) Tangible common equity (a) 24,872 24,718 23,700 22,791 21,916 Tier 1 capital, determined in accordance with prescribed regulatory requirements using Basel I definition 31,203 30,766 30,044 29,976 29,173 Trust preferred securities - - - (1,800) (2,675) Preferred stock (4,769) (4,769) (4,769) (3,694) (2,606) Noncontrolling interests, less preferred stock not eligible for Tier I capital (685) (685) (685) (686) (687) Tier 1 common equity using Basel I definition (b) 25,749 25,312 24,590 23,796 23,205 Tangible common equity (as calculated above) 22,791 21,916 Adjustments 1 434 450 Tier 1 common equity using Basel III proposals published prior to June 2012 (c) 23,225 22,366 Tangible common equity (as calculated above) 24,872 24,718 23,700 Adjustments 2 126 157 153 Tier 1 common equity approximated using proposed rules for the Basel III standardized approach released June 2012 (d) 24,998 24,875 23,853 Total assets 353,855 352,253 353,136 340,762 340,122 Goodwill (net of deferred tax liability) (8,351) (8,194) (8,205) (8,233) (8,239) Intangible assets (exclude mortgage servicing rights) (1,006) (980) (1,118) (1,182) (1,217) Tangible assets (e) 344,498 343,079 343,813 331,347 330,666 Risk-weighted assets, determined in accordance with prescribed regulatory requirements using Basel I definition (f) 287,611 282,033 279,972 274,847 271,333 Risk-weighted assets using Basel III proposals published prior to June 2012 (g) - - - 277,856 274,351 Risk-weighted assets, determined in accordance with prescribed regulatory requirements using Basel I definition 287,611 282,033 279,972 Adjustments3 21,233 22,167 23,240 Risk-weighted assets approximated using proposed rules for the Basel III standardized approach released June 2012 (h) 308,844 304,200 303,212 Ratios Tangible common equity to tangible assets (a)/(e) 7.2% 7.2% 6.9% 6.9% 6.6% Tangible common equity to risk-weighted assets using Basel I definition (a)/(f) 8.6% 8.8% 8.5% 8.3% 8.1% Tier 1 common equity to risk-weighted assets using Basel I definition (b)/(f) 9.0% 9.0% 8.8% 8.7% 8.6% Tier 1 common equity to risk-weighted assets using Basel III proposals published prior to June 2012 (c)/(g) - - - 8.4% 8.2% Tier 1 common equity to risk-weighted assets approximated using proposed rules for the Basel III standardized approach released June 2012 (d)/(h) 8.1% 8.2% 7.9% - - 4Q12 risk-weighted assets are preliminary data, subject to change prior to filings with applicable regulatory agencies 1 Principally net losses on cash flow hedges included in accumulated other comprehensive income 2 Includes net losses on cash flow hedges included in accumulated other comprehensive income, unrealized losses on securities transferred from available-for-sale to held-to-maturity included in accumulated other comprehensive income and disallowed mortgage servicing rights 3 Includes higher risk-weighting for residential mortgages, unfunded loan commitments, investment securities and purchased mortgage servicing rights, and other adjustments |


