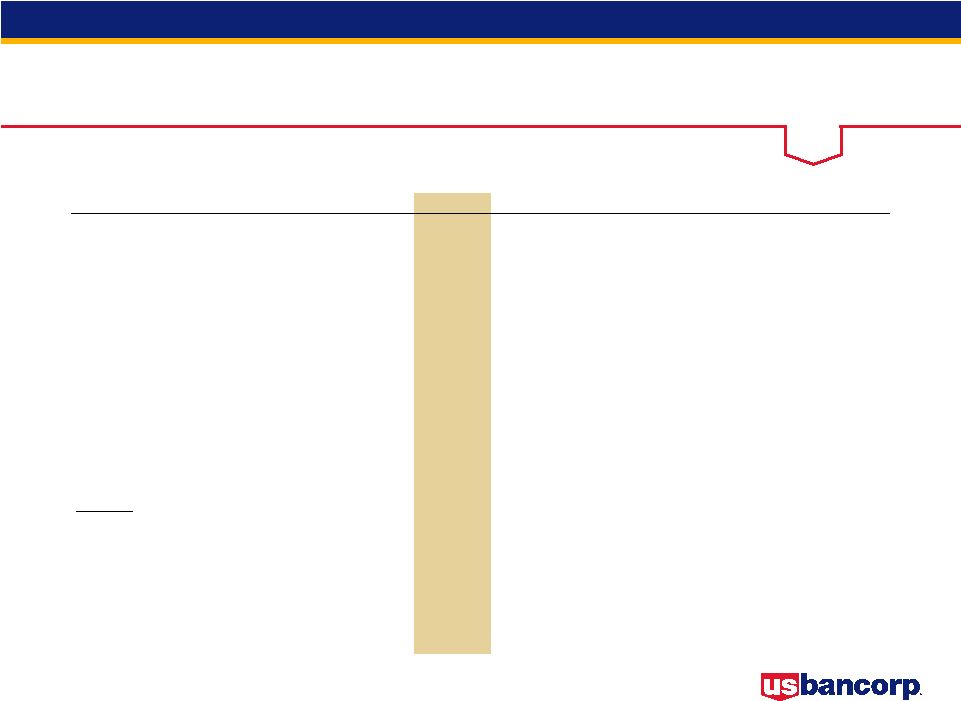
29 2Q13 Earnings Conference Call Non-GAAP Financial Measures $ in millions 2Q13 1Q13 4Q12 3Q12 2Q12 Total equity 41,050 $ 40,847 $ 40,267 $ 39,825 $ 38,874 $ Preferred stock (4,756) (4,769) (4,769) (4,769) (4,769) Noncontrolling interests (1,367) (1,316) (1,269) (1,164) (1,082) Goodwill (net of deferred tax liability) (8,317) (8,333) (8,351) (8,194) (8,205) Intangible assets (exclude mortgage servicing rights) (910) (963) (1,006) (980) (1,118) Tangible common equity (a) 25,700 25,466 24,872 24,718 23,700 Tier 1 capital, determined in accordance with prescribed regulatory requirements using Basel I definition 32,219 31,774 31,203 30,766 30,044 Preferred stock (4,756) (4,769) (4,769) (4,769) (4,769) Noncontrolling interests, less preferred stock not eligible for Tier I capital (685) (684) (685) (685) (685) Tier 1 common equity using Basel I definition (b) 26,778 26,321 25,749 25,312 24,590 Tangible common equity (as calculated above) 25,700 25,466 24,872 24,718 23,700 Adjustments 1 (43) 81 126 157 153 Tier 1 common equity approximated using proposed rules for the Basel III standardized approach released June 2012 (c) 25,657 25,547 24,998 24,875 23,853 Tangible common equity (as calculated above) 25,700 Adjustments 2 195 Tier 1 common equity estimated using final rules for the Basel III standardized approach released July 2013 (d) 25,895 1 Includes net losses on cash flow hedges included in accumulated other comprehensive income, unrealized losses on securities transferred from available-for-sale to held-to-maturity included in accumulated other comprehensive income and disallowed mortgage servicing rights 2 Includes net losses on cash flow hedges included in accumulated other comprehensive income and unrealized losses on securities transferred from available-for-sale to held-to-maturity included in accumulated other comprehensive income |


