U.S. Bancorp 4Q15 Earnings Conference Call Richard K. Davis Chairman, President and CEO January 15, 2016 Kathy Rogers Vice Chairman and CFO Exhibit 99.2 |
2 U.S. BANCORP | Forward-looking Statements and Additional Information The following information appears in accordance with the Private Securities Litigation Reform Act of 1995: This presentation contains forward-looking statements about U.S. Bancorp. Statements that are not historical or current facts, including statements about beliefs and expectations, are forward-looking statements and are based on the information available to, and assumptions and estimates made by, management as of the date made. These forward-looking statements cover, among other things, anticipated future revenue and expenses and the future plans and prospects of U.S. Bancorp. Forward-looking statements involve inherent risks and uncertainties, and important factors could cause actual results to differ materially from those anticipated. A reversal or slowing of the current economic recovery or another severe contraction could adversely affect U.S. Bancorp’s revenues and the values of its assets and liabilities. Global financial markets could experience a recurrence of significant turbulence, which could reduce the availability of funding to certain financial institutions and lead to a tightening of credit, a reduction of business activity, and increased market volatility. Stress in the commercial real estate markets, as well as a downturn in the residential real estate markets, could cause credit losses and deterioration in asset values. In addition, U.S. Bancorp’s business and financial performance is likely to be negatively impacted by recently enacted and future legislation and regulation. U.S. Bancorp’s results could also be adversely affected by deterioration in general business and economic conditions; changes in interest rates; deterioration in the credit quality of its loan portfolios or in the value of the collateral securing those loans; deterioration in the value of securities held in its investment securities portfolio; legal and regulatory developments; litigation; increased competition from both banks and non-banks; changes in customer behavior and preferences; breaches in data security; effects of mergers and acquisitions and related integration; effects of critical accounting policies and judgments; and management’s ability to effectively manage credit risk, market risk, operational risk, compliance risk, strategic risk, interest rate risk, liquidity risk and reputational risk. For discussion of these and other risks that may cause actual results to differ from expectations, refer to U.S. Bancorp’s Annual Report on Form 10-K for the year ended December 31, 2014, on file with the Securities and Exchange Commission, including the sections entitled “Risk Factors” and “Corporate Risk Profile” contained in Exhibit 13, and all subsequent filings with the Securities and Exchange Commission under Sections 13(a), 13(c), 14 or 15(d) of the Securities Exchange Act of 1934. Forward-looking statements speak only as of the date they are made, and U.S. Bancorp undertakes no obligation to update them in light of new information or future events. This presentation includes non-GAAP financial measures to describe U.S. Bancorp’s performance. The calculations of these measures are provided within or in the appendix of the presentation. These disclosures should not be viewed as a substitute for operating results determined in accordance with GAAP, nor are they necessarily comparable to non-GAAP performance measures that may be presented by other companies. |
3 U.S. BANCORP | Full Year 2015 Highlights • Record net income of $5.9 billion; $3.16 per diluted common share • Industry-leading profitability measures, including ROA of 1.44%, ROCE of 14.0% and efficiency ratio of 53.8% • Average loan growth of 4.1%* vs. 2014 and average deposit growth of 7.7% vs. 2014 • Net charge-offs declined 12.1% vs. 2014 • Nonperforming assets declined 15.8% vs. 2014 • Capital generation continues to reinforce capital position – End of period common equity tier 1 capital ratio of 9.1% estimated for the Basel III fully implemented standardized approach – Repurchased 52 million shares of common stock during 2015 • Returned $4.0 billion, or 72%, of earnings to shareholders in 2015 * Loan growth excludes student loans, which were transferred from held for sale at the end of 1Q15 and returned to held for investment during 3Q15 |
4 U.S. BANCORP | 4Q15 Highlights • Record revenue of $5.2 billion • Net income of $1.5 billion; $0.80 per diluted common share • Average loan growth of 1.7%* vs. 3Q15 and 4.2% vs. 4Q14 • Average deposit growth of 1.7% vs. 3Q15 and 6.9% vs. 4Q14 • Continued momentum in payment-related fee revenue led by a year-over-year increase in credit and debit card revenue of 8.1% • Net charge-offs declined 1.0% vs. 4Q14 and increased 4.5% vs. 3Q15 • Nonperforming assets declined 15.8% vs. 4Q14 and 2.8% vs. 3Q15 • Capital generation continues to reinforce capital position – End of period common equity tier 1 capital ratio of 9.1% estimated for the Basel III fully implemented standardized approach – Returned 61% of earnings to shareholders in 4Q15 * Loan growth excludes student loans, which were transferred from held for sale at the end of 1Q15 and returned to held for investment during 3Q15 |
5 U.S. BANCORP | Performance Ratios Return on Average Common Equity and Return on Average Assets Efficiency Ratio and Net Interest Margin Efficiency ratio computed as noninterest expense divided by the sum of net interest income on a taxable-equivalent basis and noninterest income excluding net securities gains (losses) 14.4% 14.1% 14.3% 14.1% 13.7% 1.50% 1.44% 1.46% 1.44% 1.41% 1.0% 1.5% 2.0% 2.5% 3.0% 8% 11% 14% 17% 20% 4Q14 1Q15 2Q15 3Q15 4Q15 Return on Avg Common Equity Return on Avg Assets Efficiency Ratio Net Interest Margin 54.3% 54.3% 53.2% 53.9% 53.9% 3.14% 3.08% 3.03% 3.04% 3.06% 1.6% 2.2% 2.8% 3.4% 4.0% 48% 52% 56% 60% 64% 4Q14 1Q15 2Q15 3Q15 4Q15 |
6 U.S. BANCORP | Revenue Growth Notable items: 2Q14 Visa gain $214 million; 4Q14 Nuveen gain $124 million; 3Q15 Visa gain $135 million, student loan market value adjustment ($58) million Taxable-equivalent basis Year-Over-Year Change 5.7% 1.9% (2.8%) 3.1% 0.8% $ in millions $5,169 $4,906 $5,042 $5,147 $5,211 3,500 4,000 4,500 5,000 5,500 4Q14 1Q15 2Q15 3Q15 4Q15 |
7 U.S. BANCORP | Loan and Deposit Growth Year-Over-Year Growth Average Balances 200 225 250 275 300 4Q14 1Q15 2Q15 3Q15 4Q15 Loans Deposits 2.5% $246.6 2.7% $250.5 4.2% $256.7 5.9% $246.4 5.1% $248.0 8.9% $285.7 6.9% $289.7 6.9% $294.5 7.2% $275.5 8.1% $278.5 $ in billions 3.8% adjusted* 4.0% adjusted* * Loan growth excludes student loans, which were transferred from held for sale at the end of 1Q15 and returned to held for investment during 3Q15 |
8 U.S. BANCORP | Credit Quality Net Charge-offs Nonperforming Assets $ in millions $308 $279 $296 $292 $305 0.50% 0.46% 0.48% 0.46% 0.47% 0.00% 0.75% 1.50% 2.25% 3.00% 0 130 260 390 520 4Q14 1Q15 2Q15 3Q15 4Q15 $1,808 $1,696 $1,577 $1,567 $1,523 0.73% 0.69% 0.63% 0.61% 0.58% 0.00% 0.75% 1.50% 2.25% 3.00% 0 700 2,100 2,800 4Q14 1Q15 2Q15 3Q15 4Q15 Net Charge-offs (Left Scale) NCOs to Avg Loans (Right Scale) Nonperforming Assets (Left Scale) NPAs to Loans plus ORE (Right Scale) |
9 U.S. BANCORP | Earnings Summary Taxable-equivalent basis $ and shares in millions, except per-share data FY FY 4Q15 3Q15 4Q14 vs 3Q15 vs 4Q14 2015 2014 %B/(W) Net Interest Income 2,871 $ 2,821 $ 2,799 $ 1.8 2.6 11,214 $ 10,997 $ 2.0 Noninterest Income 2,340 2,326 2,370 0.6 (1.3) 9,092 9,164 (0.8) Net Revenue 5,211 5,147 5,169 1.2 0.8 20,306 20,161 0.7 Noninterest Expense 2,809 2,775 2,804 (1.2) (0.2) 10,931 10,715 (2.0) Operating Income 2,402 2,372 2,365 1.3 1.6 9,375 9,446 (0.8) Net Charge-offs 305 292 308 (4.5) 1.0 1,172 1,334 12.1 Excess Provision - (10) (20) - - (40) (105) (61.9) Income before Taxes 2,097 2,090 2,077 0.3 1.0 8,243 8,217 0.3 Applicable Income Taxes 608 587 576 (3.6) (5.6) 2,310 2,309 - Noncontrolling Interests (13) (14) (13) 7.1 - (54) (57) 5.3 Net Income 1,476 1,489 1,488 (0.9) (0.8) 5,879 5,851 0.5 Preferred Dividends/Other 72 67 68 (7.5) (5.9) 271 268 (1.1) NI to Common 1,404 $ 1,422 $ 1,420 $ (1.3) (1.1) 5,608 $ 5,583 $ 0.4 Diluted EPS $0.80 0.81 $ 0.79 $ (1.2) 1.3 3.16 $ 3.08 $ 2.6 Average Diluted Shares 1,754 1,766 1,796 0.7 2.3 1,772 1,813 2.3 % B/(W) |
10 U.S. BANCORP | Net Interest Income Net Interest Income Key Points vs. 4Q14 • Average earning assets grew $18.1 billion, or 5.1% • Net interest margin lower 8 bps (3.06% vs. 3.14%) – Change in loan portfolio mix, as well as growth in the investment portfolio at lower average rates and lower reinvestment rates on investment securities vs. 3Q15 • Average earning assets grew $3.8 billion, or 1.0% • Net interest margin higher 2 bps (3.06% vs. 3.04%) – Principally due to loan growth which also resulted in lower cash balances Year-Over-Year Change 2.4% 1.7% 0.9% 2.7% 2.6% $ in millions Taxable-equivalent basis $2,799 $2,752 $2,770 $2,821 $2,871 3.14% 3.08% 3.03% 3.04% 3.06% 0.0% 2.0% 4.0% 6.0% 8.0% 0 1,000 2,000 3,000 4,000 4Q14 1Q15 2Q15 3Q15 4Q15 Net Interest Income Net Interest Margin |
11 U.S. BANCORP | Noninterest Income $587 $446 $472 $505 $536 $235 $240 $231 $224 $211 $396 $376 $396 $409 $400 $322 $322 $334 $329 $336 $830 $770 $839 $859 $857 0 700 1,400 2,100 2,800 4Q14 1Q15 2Q15 3Q15 4Q15 Noninterest Income Key Points vs. 4Q14 • Noninterest income decreased $30 million, or 1.3% – Higher credit and debit card revenue (8.1% increase) due to higher transaction volumes and higher merchant processing services revenues (2.3% increase) due to higher transaction volumes, account growth and equipment sales to merchants – Higher trust and investment management fees (4.3% increase) – Lower mortgage banking revenue primarily due to an unfavorable change in the valuation of MSRs, net of hedging activities – Lower other income due to the impact of the 4Q14 Nuveen gain, partially offset by the HSA deposit sale vs. 3Q15 • Noninterest income increased $14 million, or 0.6% – Higher credit and debit card revenue (9.3% increase) primarily due to seasonally higher sales volumes – Lower mortgage banking revenue primarily due to lower origination revenue – Lower corporate payment products revenue (10.5% decrease) reflecting the impact of seasonally higher 3Q15 government- related transaction volumes – Higher other income reflecting the net impact of prior quarter notable items including the Visa Inc. Class B common stock sales and the student loan market adjustment, offset by the HSA deposit sale and other equity investment income Year-Over-Year Change 9.9% 2.2% (7.0%) 3.7% (1.3%) $2,340 $2,370 $2,154 $2,272 $2,326 All Other Mortgage Service Charges Trust and Inv Mgmt Payments Notable items: 4Q14 Nuveen gain $124 million; 3Q15 Visa gain $135 million, student loan market value adjustment ($58) million Payments = credit and debit card, corporate payment products and merchant processing Service charges = deposit service charges, treasury management and ATM processing $ in millions |
12 U.S. BANCORP | Noninterest Expense $594 $479 $459 $501 $554 $219 $214 $221 $222 $230 $347 $229 $266 $291 $295 $248 $247 $247 $251 $246 $1,396 $1,496 $1,489 $1,510 $1,484 0 800 1,600 2,400 3,200 4Q14 1Q15 2Q15 3Q15 4Q15 Noninterest Expense Key Points vs. 4Q14 • Noninterest expense increased $5 million, or 0.2% – Higher compensation (5.3% increase) reflecting the impact of merit increases and higher staffing for risk and compliance activities – Higher employee benefits expense (11.0% increase) mainly due to higher pension costs – Lower marketing and business development expense (25.6% decrease) primarily due to charitable contributions in 4Q14 – Lower other noninterest expense reflecting the impact of prior year legal accruals partially offset by higher compliance-related expenses vs. 3Q15 • Noninterest expense increased $34 million, or 1.2% – Lower compensation expense (1.1% decrease) reflecting the impact of expense management initiatives and decreases in variable compensation – Lower employee benefits expense (4.6% decrease) driven by lower payroll tax expense and healthcare costs – Higher other noninterest expense due to seasonally higher costs related to investments in tax-advantaged projects and accruals related to legal and compliance matters, partially offset by the favorable impact of reduced mortgage-related compliance and talent upgrade costs which were elevated in 3Q15 Year-Over-Year Change 4.5% 4.8% (2.6%) 6.2% 0.2% $2,809 $2,804 $2,665 $2,682 $2,775 All Other Tech and Communications Prof Svcs, Marketing and PPS Occupancy and Equipment Compensation and Benefits Notable items: 4Q14 charitable contributions and accruals for legal matters $88 million; 3Q15 elevated expenses related to mortgage-related compliance and the company-wide talent upgrade costs $60 million $ in millions |
13 U.S. BANCORP | Capital Position * RWA = risk-weighted assets $ in billions 4Q15 3Q15 2Q15 1Q15 4Q14 Total U.S. Bancorp shareholders' equity 46.1 $ 45.1 $ 44.5 $ 44.3 $ 43.5 $ Standardized Approach Basel III transitional standardized approach Common equity tier 1 capital ratio 9.6% 9.6% 9.5% 9.6% 9.7% Tier 1 capital ratio 11.3% 11.1% 11.0% 11.1% 11.3% Total risk-based capital ratio 13.3% 13.1% 13.1% 13.3% 13.6% Leverage ratio 9.5% 9.3% 9.2% 9.3% 9.3% Common equity tier 1 capital to RWA* estimated for the Basel III fully implemented standardized approach 9.1% 9.2% 9.2% 9.2% 9.0% Advanced Approaches Common equity tier 1 capital to RWA for the Basel III transitional advanced approaches 12.5% 13.0% 12.9% 12.3% 12.4% Common equity tier 1 capital to RWA estimated for the Basel III fully implemented advanced approaches 11.9% 12.4% 12.4% 11.8% 11.8% Tangible common equity ratio 7.6% 7.7% 7.5% 7.6% 7.5% Tangible common equity as a % of RWA 9.2% 9.3% 9.2% 9.3% 9.3% |
14 U.S. BANCORP | Appendix |
15 U.S. BANCORP | Average Loans 15.5% 15.1% 11.0% 9.5% 9.0% 4.2% 6.5% 4.8% 3.6% 3.1% 2.2% (0.3%) (1.4%) (0.3%) 2.1% 3.6% 2.4% 1.3% 1.1% 4.7% 3.6% 3.5% 0.3% 5.6%* (1.8%) 5.7%* 4.0% 0 70 140 210 280 4Q14 1Q15 2Q15 3Q15 4Q15 Average Loans Key Points vs. 4Q14 • Average total loans increased by $10.3 billion, or 4.2% • Average total commercial loans increased $7.2 billion, or 9.0% • Average retail loans increased 4.0% which includes an increase in average auto loans of 13.0% vs. 3Q15 • Average total loans increased by $6.2 billion, or 2.5% (1.7% excluding student loans, which were transferred to held for sale at the end of first quarter of 2015 and returned to held for investment during 3Q15) • Average total commercial loans increased $2.1 billion, or 2.5% Year-Over-Year Growth 5.9% 5.1% 2.5% 2.7% 4.2% Covered Commercial CRE Res Mtg Retail Credit Card $256.7 $246.4 $248.0 $246.6 $250.5 4.0%* $ in billions 3.8%* * Loan growth excludes student loans, which were transferred from held for sale at the end of 1Q15 and returned to held for investment during 3Q15 |
16 U.S. BANCORP | Average Deposits (4.9%) (8.2%) (14.1) (18.1%) (19.2%) 19.7% 24.7% 30.2% 21.3% 20.2% 8.3% 7.3% 6.1% 5.9% 6.7% 3.3% 5.2% 7.7% 9.2% 9.0% 0 80 160 240 320 4Q14 1Q15 2Q15 3Q15 4Q15 Average Deposits Key Points vs. 4Q14 • Average total deposits increased by $19.0 billion, or 6.9% • Average low-cost deposits (NIB, interest checking, money market and savings) increased by $26.8 billion, or 11.4% vs. 3Q15 • Average total deposits increased by $4.8 billion, or 1.7% • Average low-cost deposits increased by $6.2 billion, or 2.4% Year-Over-Year Growth 7.2% 8.1% 8.9% 6.9% 6.9% Time Money Market Checking and Savings Noninterest-bearing $275.5 $278.5 $285.7 $289.7 $294.5 $ in billions |
17 U.S. BANCORP | Credit Quality – Commercial Loans Average Loans and Net Charge-offs Ratios Key Statistics Key Points • Average linked quarter loan growth of 2.5% and year-over-year loan growth of 9.0% demonstrates continued momentum with customers • Net charge-offs increased slightly from 4Q14 but declined on a linked quarter basis • Nonperforming loans remained stable on a linked quarter basis • Line utilization remained relatively stable 4Q14 3Q15 4Q15 Average Loans $79,625 $84,704 $86,803 30-89 Delinquencies 0.31% 0.24% 0.36% 90+ Delinquencies 0.05% 0.05% 0.05% Nonperforming Loans 0.14% 0.20% 0.20% $ in millions $79,625 $81,508 $83,253 $84,704 $86,803 0.23% 0.21% 0.20% 0.33% 0.29% 0.0% 0.5% 1.0% 1.5% 2.0% 0 25,000 50,000 75,000 100,000 4Q14 1Q15 2Q15 3Q15 4Q15 20% 24% 28% 32% 36% Revolving Line Utilization Trend Average Loans Net Charge-offs Ratio |
18 U.S. BANCORP | A&D Construction $702 Credit Quality – Commercial Real Estate Average Loans and Net Charge-offs Ratios Key Statistics Key Points • Year-over-year average loans increased 3.1% • Historically low nonperforming loan levels improved on a quarter-over-quarter and year-over-year basis • Recovery performance within the CRE portfolio continues to largely offset minimal loan charge-offs 4Q14 3Q15 4Q15 Average Loans $40,966 $42,316 $42,231 30-89 Delinquencies 0.26% 0.15% 0.21% 90+ Delinquencies 0.05% 0.05% 0.03% Nonperforming Loans 0.61% 0.34% 0.30% Performing TDRs* $365 $218 $209 $ in millions Investor $20,624 Owner Occupied $11,206 Multi-family $3,297 Retail $893 Residential Construction $2,327 Office $976 Other $2,206 * TDR = troubled debt restructuring CRE Construction $40,966 $42,446 $42,316 $42,231 -0.10% -0.17% 0.01% -0.10% 0.00% -0.5% 0.0% 0.5% 1.0% 1.5% 0 20,000 40,000 60,000 4Q14 1Q15 2Q15 3Q15 4Q15 Average Loans Net Charge-offs Ratio CRE Mortgage $42,671 |
19 U.S. BANCORP | Credit Quality – Residential Mortgage Average Loans and Net Charge-offs Ratios Key Statistics Key Points • Originations are of high credit quality (weighted average FICO 755, weighted average LTV 69%) • 85% of the balances have been originated since the beginning of 2009; the origination quality metrics and performance to date have significantly outperformed prior vintages with similar seasoning • Net charge-offs continue to decline $ in millions 4Q14 3Q15 4Q15 Average Loans $51,872 $51,831 $52,970 30-89 Delinquencies 0.43% 0.35% 0.32% 90+ Delinquencies 0.40% 0.33% 0.33% Nonperforming Loans 1.67% 1.40% 1.33% $1,866 $1,851 $1,931 $1,903 $1,863 0 1,000 2,000 3,000 4,000 4Q14 1Q15 2Q15 3Q15 4Q15 Residential Mortgage Performing TDRs* *Excludes GNMA loans, whose repayments are insured by the FHA or guaranteed by the Department of VA ($1,913 million in 4Q15) $51,872 $51,426 $51,114 $51,831 $52,970 0.30% 0.28% 0.26% 0.19% 0.12% 0.0% 0.5% 1.0% 1.5% 2.0% 0 15,000 30,000 45,000 60,000 4Q14 1Q15 2Q15 3Q15 4Q15 Average Loans Net Charge-offs Ratio |
20 U.S. BANCORP | Credit Quality – Credit Card Average Loans and Net Charge-offs Ratios Key Statistics Key Points • Originations remained strong and of high credit quality with a commitment weighted average FICO of 757 • Charge-offs and delinquencies remain low while nonperforming loans continued to decline $ in millions 4Q14 3Q15 4Q15 Average Loans $17,990 $17,944 $18,838 30-89 Delinquencies 1.24% 1.27% 1.15% 90+ Delinquencies 1.13% 1.10% 1.09% Nonperforming Loans 0.16% 0.06% 0.04% $17,990 $17,823 $17,613 $17,944 $18,838 3.53% 3.71% 3.85% 3.38% 3.50% 0.0% 3.0% 6.0% 9.0% 12.0% 0 6,000 12,000 18,000 24,000 4Q14 1Q15 2Q15 3Q15 4Q15 Average Loans Net Charge-offs Ratio $30 $22 $16 $12 $9 0.16% 0.13% 0.09% 0.06% 0.04% 0.0% 0.5% 1.0% 1.5% 2.0% 0 9 18 27 36 4Q14 1Q15 2Q15 3Q15 4Q15 Credit Card Nonperforming Loans |
21 U.S. BANCORP | Credit Quality – Home Equity Average Loans and Net Charge-offs Ratios Key Statistics Key Points • High-quality originations (weighted average FICO on commitments was 761, weighted average CLTV 71%) originated primarily through the retail branch network to existing bank customers on their primary residences • Net charge-offs ratio continued to decline on a linked quarter and year-over-year basis $ in millions 4Q14 3Q15 4Q15 Average Loans $15,853 $16,083 $16,241 30-89 Delinquencies 0.54% 0.36% 0.36% 90+ Delinquencies 0.26% 0.25% 0.25% Nonperforming Loans 1.07% 0.91% 0.83% Subprime: 1% Wtd Avg LTV*: 89% NCO: 2.00% Prime: 96% Wtd Avg LTV*: 72% NCO: 0.10% Other: 3% Wtd Avg LTV*: 71% NCO: 0.95% *LTV at origination $15,853 $15,897 $15,958 $16,083 $16,241 0.43% 0.36% 0.28% 0.17% 0.15% 0.0% 1.0% 2.0% 3.0% 4.0% 0 5,000 10,000 15,000 20,000 4Q14 1Q15 2Q15 3Q15 4Q15 Average Loans Net Charge -offs Ratio Home Equity |
22 U.S. BANCORP | Credit Quality – Retail Leasing Average Loans and Net Charge-offs Ratios Key Statistics Key Points • Continued high-quality originations (weighted average FICO 787) support the portfolio’s stable credit profile • Delinquencies remained at very low levels • Strong used auto values continued to contribute to historically low net charge-offs $ in millions 4Q14 3Q15 4Q15 Average Loans $5,939 $5,480 $5,265 30-89 Delinquencies 0.18% 0.18% 0.21% 90+ Delinquencies 0.02% 0.02% 0.02% Nonperforming Loans 0.02% 0.04% 0.06% * $5,939 $5,819 $5,696 $5,480 $5,265 0.07% 0.07% 0.07% 0.14% 0.08% 0.0% 0.2% 0.4% 0.6% 0.8% 0 2,000 4,000 6,000 8,000 4Q14 1Q15 2Q15 3Q15 4Q15 Average Loans Net Charge-offs Ratio 100 110 120 130 140 Manheim Used Vehicle Index* Manheim Used Vehicle Value Index source: www.manheimconsulting.com, January 1995 = 100, quarter value = average monthly ending values |
23 U.S. BANCORP | Credit Quality – Other Retail Average Loans and Net Charge-offs Ratios Key Statistics Key Points • Overall growth continues to be driven by auto loans and installment, which were up 13.0% and 12.5% year-over-year, respectively • Delinquency rates and net charge-off rates experienced slight seasonal increases; however, they remain low $ in millions 4Q14 3Q15 4Q15 Average Loans $27,317 $27,286 $29,556 30-89 Delinquencies 0.51% 0.46% 0.52% 90+ Delinquencies 0.12% 0.10% 0.11% Nonperforming Loans 0.06% 0.07% 0.08% Auto Loans $16,551 Installment $7,002 Revolving Credit $3,340 Student Loans $2,663 Other Retail $27,317 $27,604 $25,415 $27,286 $29,556 0.76% 0.60% 0.62% 0.65% 0.71% 0.0% 0.5% 1.0% 1.5% 2.0% 0 10,000 20,000 30,000 40,000 4Q14 1Q15 2Q15 3Q15 4Q15 Average Loans Net Charge-offs Ratio |
24 U.S. BANCORP | Credit Quality – Auto Loans Average Loans and Net Charge-offs Ratios Key Statistics Key Points • Continued growth in auto loans driven by high-quality originations in the indirect channel (weighted average FICO 771) • Net charge-offs were up seasonally on a linked quarter basis, but remained relatively stable year-over-year $ in millions 4Q14 3Q15 4Q15 Average Loans $14,644 $16,220 $16,551 30-89 Delinquencies 0.45% 0.40% 0.51% 90+ Delinquencies 0.03% 0.02% 0.04% Nonperforming Loans 0.03% 0.05% 0.07% Direct: 6% Wtd Avg FICO: 748 NCO: 0.15% Indirect: 94% Wtd Avg FICO: 765 NCO: 0.37% Auto loans are included in Other Retail category $14,644 $15,013 $15,609 $16,220 $16,551 0.33% 0.19% 0.15% 0.22% 0.36% 0.0% 0.5% 1.0% 1.5% 2.0% 0 5,000 10,000 15,000 20,000 4Q14 1Q15 2Q15 3Q15 4Q15 Average Loans Net Charge-offs Ratio Indirect and Direct Channel |
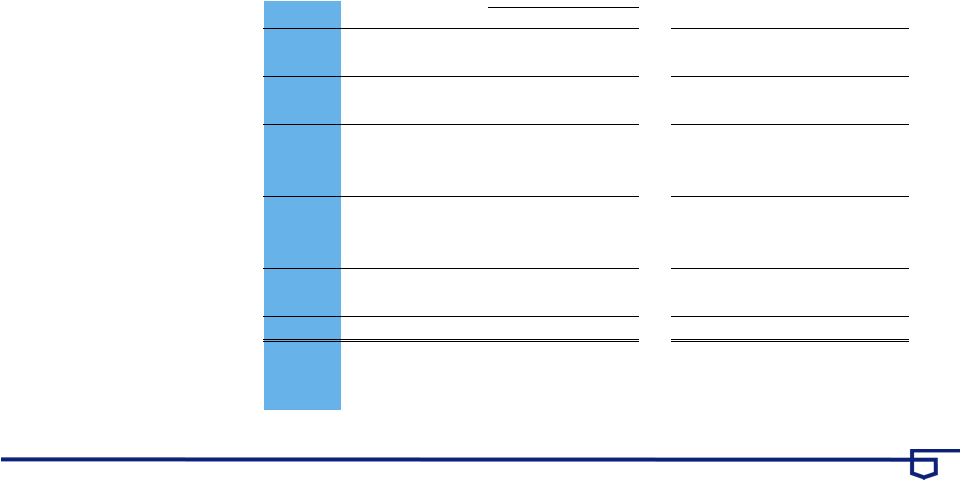
25 U.S. BANCORP | Non-GAAP Financial Measures * Preliminary data. Subject to change prior to filings with applicable regulatory agencies. (1) Includes goodwill related to certain investments in unconsolidated financial institutions per prescribed regulatory requirements. (2) Includes net losses on cash flow hedges included in accumulated other comprehensive income (loss) and other adjustments. (3) Includes higher risk-weighting for unfunded loan commitments, investment securities, residential mortgages, mortgage servicing rights and other adjustments. (4) Primarily reflects higher risk-weighting for mortgage servicing rights. December 31, September 30, June 30, March 31, December 31, (Dollars in Millions, Unaudited) 2015 2015 2015 2015 2014 Total equity $46,817 $45,767 $45,231 $44,965 $44,168 Preferred stock (5,501) (4,756) (4,756) (4,756) (4,756) Noncontrolling interests (686) (692) (694) (688) (689) Goodwill (net of deferred tax liability) (1) (8,295) (8,324) (8,350) (8,360) (8,403) Intangible assets, other than mortgage servicing rights (838) (779) (744) (783) (824) Tangible common equity (a) 31,497 31,216 30,687 30,378 29,496 Tangible common equity (as calculated above) 31,497 31,216 30,687 30,378 29,496 Adjustments (2) 67 118 125 158 172 Common equity tier 1 capital estimated for the Basel III fully implemented standardized and advanced approaches (b) 31,564 31,334 30,812 30,536 29,668 Total assets 421,853 415,943 419,075 410,233 402,529 Goodwill (net of deferred tax liability) (1) (8,295) (8,324) (8,350) (8,360) (8,403) Intangible assets, other than mortgage servicing rights (838) (779) (744) (783) (824) Tangible assets (c) 412,720 406,840 409,981 401,090 393,302 Risk-weighted assets, determined in accordance with prescribed transitional standardized approach regulatory requirements (d) 341,360 * 336,227 333,177 327,709 317,398 Adjustments (3) 3,892 * 3,532 3,532 3,153 11,110 Risk-weighted assets estimated for the Basel III fully implemented standardized approach (e) 345,252 * 339,759 336,709 330,862 328,508 Risk-weighted assets, determined in accordance with prescribed transitional advanced approaches regulatory requirements 261,668 * 248,048 245,038 254,892 248,596 Adjustments (4) 4,099 * 3,723 3,721 3,321 3,270 Risk-weighted assets estimated for the Basel III fully implemented advanced approaches (f) 265,767 * 251,771 248,759 258,213 251,866 Ratios * Tangible common equity to tangible assets (a)/(c) 7.6 % 7.7 % 7.5 % 7.6 % 7.5 % Tangible common equity to risk-weighted assets (a)/(d) 9.2 9.3 9.2 9.3 9.3 Common equity tier 1 capital to risk-weighted assets estimated for the Basel III fully implemented standardized approach (b)/(e) 9.1 9.2 9.2 9.2 9.0 Common equity tier 1 capital to risk-weighted assets estimated for the Basel III fully implemented advanced approaches (b)/(f) 11.9 12.4 12.4 11.8 11.8 |
U.S. Bancorp 4Q15 Earnings Conference Call January 15, 2016 |