 Exhibit 99.2 U.S. Bancorp 1Q16 Earnings Conference Call Richard K. Davis Chairman and CEO April 20, 2016 Kathy Rogers Vice Chairman and CFO |
2 U.S. BANCORP | Forward-looking Statements and Additional Information The following information appears in accordance with the Private Securities Litigation Reform Act of 1995: This presentation contains forward-looking statements about U.S. Bancorp. Statements that are not historical or current facts, including statements about beliefs and expectations, are forward-looking statements and are based on the information available to, and assumptions and estimates made by, management as of the date hereof. These forward-looking statements cover, among other things, anticipated future revenue and expenses and the future plans and prospects of U.S. Bancorp. Forward-looking statements involve inherent risks and uncertainties, and important factors could cause actual results to differ materially from those anticipated. A reversal or slowing of the current economic recovery or another severe contraction could adversely affect U.S. Bancorp’s revenues and the values of its assets and liabilities. Global financial markets could experience a recurrence of significant turbulence, which could reduce the availability of funding to certain financial institutions and lead to a tightening of credit, a reduction of business activity, and increased market volatility. Stress in the commercial real estate markets, as well as a downturn in the residential real estate markets, could cause credit losses and deterioration in asset values. In addition, U.S. Bancorp’s business and financial performance is likely to be negatively impacted by recently enacted and future legislation and regulation. U.S. Bancorp’s results could also be adversely affected by deterioration in general business and economic conditions; changes in interest rates; deterioration in the credit quality of its loan portfolios or in the value of the collateral securing those loans; deterioration in the value of securities held in its investment securities portfolio; legal and regulatory developments; litigation; increased competition from both banks and non-banks; changes in customer behavior and preferences; breaches in data security; effects of mergers and acquisitions and related integration; effects of critical accounting policies and judgments; and management’s ability to effectively manage credit risk, market risk, operational risk, compliance risk, strategic risk, interest rate risk, liquidity risk and reputational risk. For discussion of these and other risks that may cause actual results to differ from expectations, refer to U.S. Bancorp’s Annual Report on Form 10-K for the year ended December 31, 2015, on file with the Securities and Exchange Commission, including the sections entitled “Risk Factors” and “Corporate Risk Profile” contained in Exhibit 13, and all subsequent filings with the Securities and Exchange Commission under Sections 13(a), 13(c), 14 or 15(d) of the Securities Exchange Act of 1934. However, factors other than these also could adversely affect U.S. Bancorp’s results, and the reader should not consider these factors to be a complete set of all potential risks or uncertainties. Forward-looking statements speak only as of the date hereof, and U.S. Bancorp undertakes no obligation to update them in light of new information or future events. This presentation includes non-GAAP financial measures to describe U.S. Bancorp’s performance. The calculations of these measures are provided within or in the appendix of the presentation. These disclosures should not be viewed as a substitute for operating results determined in accordance with GAAP, nor are they necessarily comparable to non-GAAP performance measures that may be presented by other companies. |
3 U.S. BANCORP | 1Q16 Highlights • Net income of $1.4 billion; $0.76 per diluted common share. • Average loans grew 2.2% vs. 4Q15 (1.6% excluding the Fidelity card portfolio acquisition) and 5.8% vs 1Q15 (5.2% excluding the Fidelity card portfolio acquisition). • Average deposits grew 0.5% vs. 4Q15 and 6.3% vs. 1Q15. • Continued strength in payment-related fee revenue led by a year-over-year increase in credit and debit card revenue of 10.4% • Nonperforming assets increased 12.9% linked quarter, primarily driven by deterioration in the energy portfolio. Excluding the energy portfolio, credit quality was stable. • Linked quarter NCOs were up 3% or $10 million to $315 million. The NCO ratio was up 1bp to 0.48% • Returned 80% of earnings to shareholders through dividends and share buybacks |
 4 U.S. BANCORP | Performance Ratios Return on Average Common Equity and Return on Average Assets Efficiency Ratio and Net Interest Margin Return on Avg Common Equity Return on Avg Assets Efficiency Ratio Net Interest Margin Efficiency ratio computed as noninterest expense divided by the sum of net interest income on a taxable-equivalent basis and noninterest income excluding net securities gains (losses) 14.1% 14.3% 14.1% 13.7% 13.0% 1.44% 1.46% 1.44% 1.41% 1.32% 1.0% 1.5% 2.0% 2.5% 3.0% 8% 11% 14% 17% 20% 1Q15 2Q15 3Q15 4Q15 1Q16 54.3% 53.2% 53.9% 53.9% 54.6% 3.08% 3.03% 3.04% 3.06% 3.06% 1.6% 2.2% 2.8% 3.4% 4.0% 48% 52% 56% 60% 64% 1Q15 2Q15 3Q15 4Q15 1Q16 |
 5 U.S. BANCORP | Revenue Growth Notable items: 3Q15 Visa gain $135 million, student loan market value adjustment ($58) million Taxable-equivalent basis Year-Over-Year Change 1.9% (2.8%) 3.1% 0.8% 2.7% $ in millions $4,906 $5,042 $5,147 $5,211 $5,037 3,500 4,000 4,500 5,000 5,500 1Q15 2Q15 3Q15 4Q15 1Q16 |
 6 U.S. BANCORP | Loan and Deposit Growth Year-Over-Year Growth Average Balances 200 230 260 290 320 1Q15 2Q15 3Q15 4Q15 1Q16 Loans Deposits 2.7% $250.5 4.2% $256.7 5.8% $262.3 5.1% $248.0 2.5% $246.6 6.9% $289.7 6.9% $294.5 6.3% $295.9 8.1% $278.5 8.9% $285.7 $ in billions 3.8% adjusted* 4.0% adjusted* * Adjusted loan growth excludes student loans, which were transferred from held for sale at the end of 1Q15 and returned to held for investment during 3Q15 and the acquisition of the Fidelity credit card portfolio at the end of 4Q15 5.2% adjusted* |
 7 U.S. BANCORP | Credit Quality Net Charge-offs Nonperforming Assets Net Charge-offs (Left Scale) NCOs to Avg Loans (Right Scale) Nonperforming Assets (Left Scale) NPAs to Loans plus ORE (Right Scale) $ in millions $279 $296 $292 $305 $315 0.46% 0.48% 0.46% 0.47% 0.48% 0.00% 0.75% 1.50% 2.25% 3.00% 0 130 260 390 520 1Q15 2Q15 3Q15 4Q15 1Q16 $1,696 $1,577 $1,567 $1,523 $1,719 0.69% 0.63% 0.61% 0.58% 0.65% 0.00% 0.75% 1.50% 2.25% 3.00% 0 700 1,400 2,100 2,800 1Q15 2Q15 3Q15 4Q15 1Q16 |
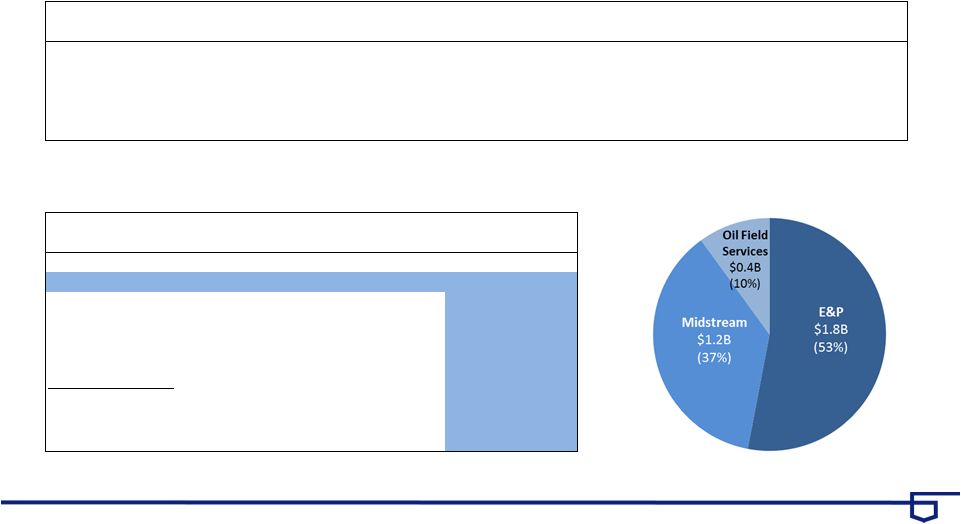    8 U.S. BANCORP | Energy Credit Loans by Segment $ in millions, ending balances Energy % Change % Change All Other % Change % Change 1Q16 4Q15 1Q15 vs. 4Q15 vs. 1Q15 1Q16 4Q15 1Q15 vs. 4Q15 vs. 1Q15 Loans $3,417 $3,183 $3,345 7% 2% $261,105 $257,666 $241,956 1% 8% Commitments 11,931 12,118 12,564 -2% -5% 544,426 536,286 496,328 2% 10% Nonperforming Assets $276 $19 $1 NM NM $1,443 $1,504 $1,695 -4% -15% NPAs/Loans + OREO % 8.08% 0.60% 0.03% 0.55% 0.58% 0.70% Energy 1Q16 4Q15 1Q15 Q-Q Y-Y Reserves $310 $172 $87 80% 256% Reserves to Loans % 9.1% 5.4% 2.6% Criticized Commitments 4,167 1,886 1,564 121% 166% Total Criticized/Commitments 35% 16% 12% Investment Grade % Total Loans 17% Total Commitments 43% Unfunded Commitments 54% |
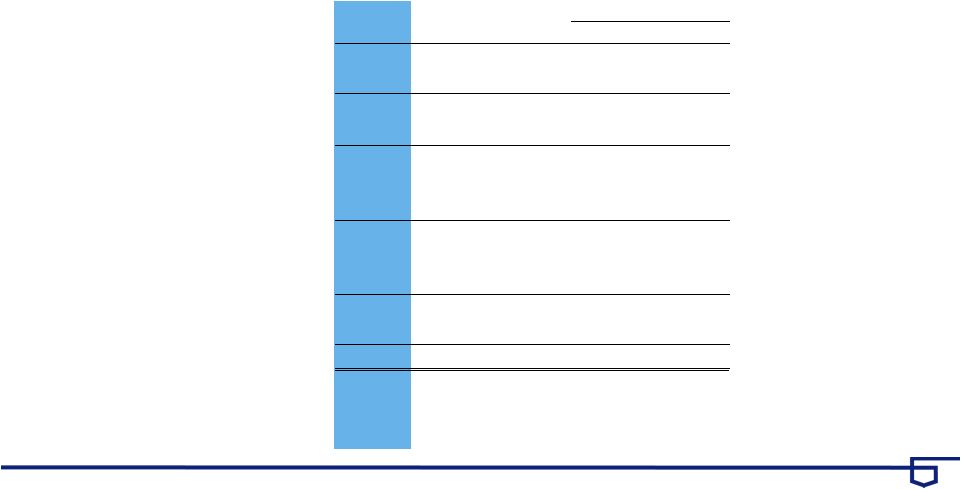 9 U.S. BANCORP | Earnings Summary Taxable-equivalent basis $ and shares in millions, except per-share data 1Q16 4Q15 1Q15 vs 4Q15 vs 1Q15 Net Interest Income 2,888 $ 2,871 $ 2,752 $ 0.6 4.9 Noninterest Income 2,149 2,340 2,154 (8.2) (0.2) Net Revenue 5,037 5,211 4,906 (3.3) 2.7 Noninterest Expense 2,749 2,809 2,665 2.1 (3.2) Operating Income 2,288 2,402 2,241 (4.7) 2.1 Net Charge-offs 315 305 279 (3.3) (12.9) Excess Provision 15 - (15) - - Income before Taxes 1,958 2,097 1,977 (6.6) (1.0) Applicable Income Taxes 557 608 533 8.4 (4.5) Noncontrolling Interests (15) (13) (13) (15.4) (15.4) Net Income 1,386 1,476 1,431 (6.1) (3.1) Preferred Dividends/Other 57 72 66 20.8 13.6 NI to Common 1,329 $ 1,404 $ 1,365 $ (5.3) (2.6) Diluted EPS $0.76 0.80 $ 0.76 $ (5.0) - Average Diluted Shares 1,743 1,754 1,789 0.6 2.6 % B/(W) |
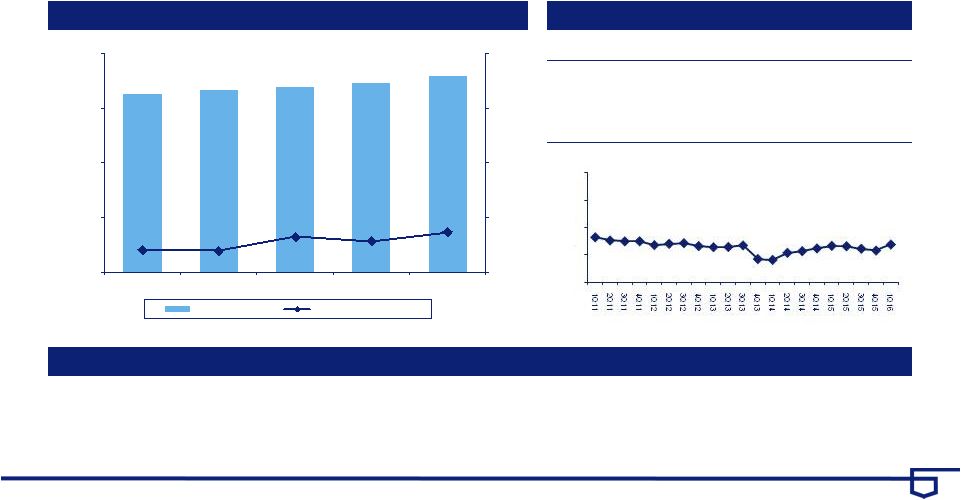
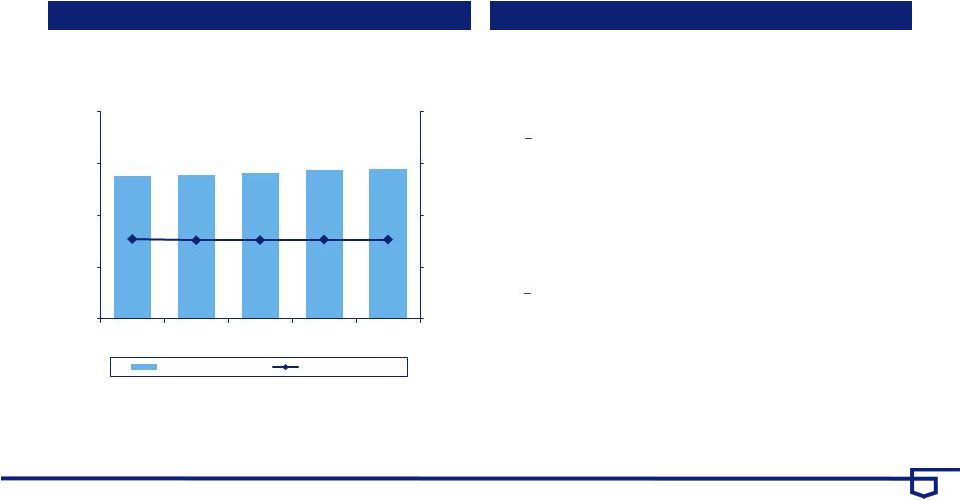 10 U.S. BANCORP | Net Interest Income Net Interest Income Key Points vs. 1Q15 • Average earning assets grew $17.4 billion, or 4.8% • Net interest margin lower 2 bps (3.06% vs. 3.08%) Higher rates offset by a continued shift in loan portfolio mix, as well as lower average rates on new securities purchases and lower reinvestment rates on maturing securities vs. 4Q15 • Average earning assets grew $5.1 billion, or 1.4% • Net interest margin flat (3.06% vs. 3.06%) Principally due to the impact of higher rates, partially offset by the continued change in loan portfolio mix Year-Over-Year Change 1.7% 0.9% 2.7% 2.6% 4.9% $ in millions Taxable-equivalent basis $2,752 $2,770 $2,821 $2,871 $2,888 3.08% 3.03% 3.04% 3.06% 3.06% 0.0% 2.0% 4.0% 6.0% 8.0% 0 1,000 2,000 3,000 4,000 1Q15 2Q15 3Q15 4Q15 1Q16 Net Interest Income Net Interest Margin |
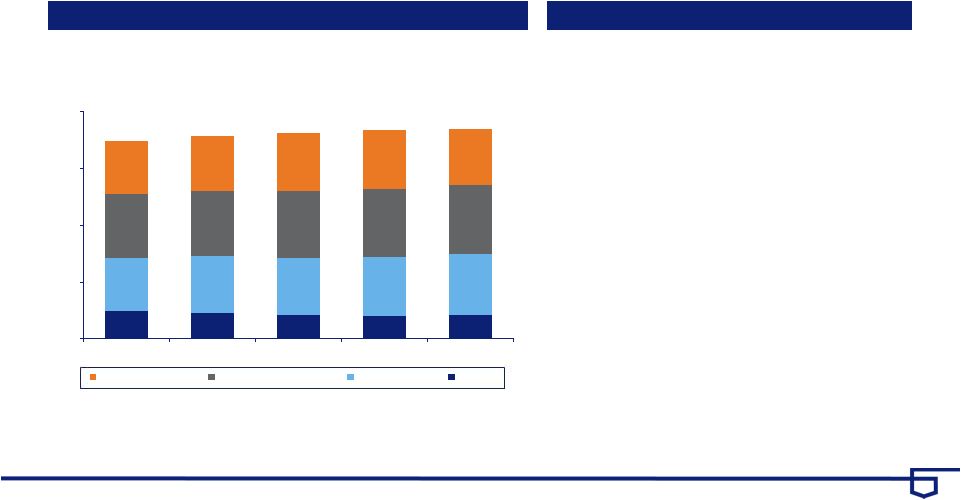
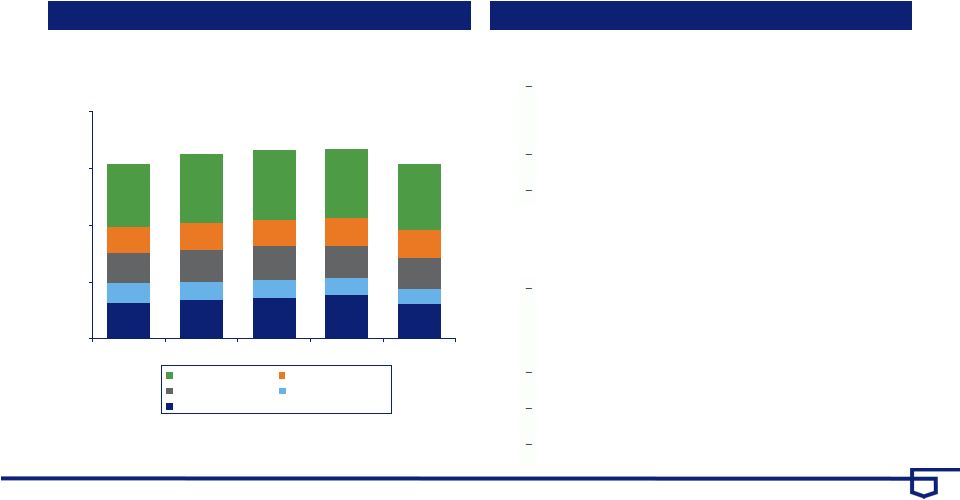 11 U.S. BANCORP | Noninterest Income $446 $472 $505 $536 $424 $240 $231 $224 $211 $187 $376 $396 $409 $400 $390 $322 $334 $329 $336 $339 $770 $839 $859 $857 $809 0 700 1,400 2,100 2,800 1Q15 2Q15 3Q15 4Q15 1Q16 Noninterest Income Key Points vs. 1Q15 • Noninterest income decreased $5 million, or 0.2% Higher credit and debit card revenue (10.4% increase) due to higher transaction volumes including acquired portfolios and higher merchant processing services revenue (3.9% increase) due to higher transaction volumes and equipment sales to merchants Higher trust and investment management fees (5.3% increase) reflecting lower fee waivers Lower mortgage banking revenue (22.1% decrease) primarily due to lower origination and sales revenue driven by lower volume and lower pricing as a result of market competition vs. 4Q15 • Noninterest income decreased $191 million, or 8.2% Lower credit and debit card revenue (9.5% decrease) primarily due to seasonally lower sales volumes partially offset by recent portfolio acquisitions, and lower merchant processing revenues (5.1% decrease) due to seasonally lower product fees and lower equipment sales to merchants Lower mortgage banking revenue (11.4% decrease) primarily due to an unfavorable change in the value of mortgage servicing rights Lower commercial products revenue (11.3% decrease) due to lower commercial leasing revenue and lower syndication fees Lower other income (31.6% decrease) due to the HSA deposit sale in 4Q15, lower sales of tax credits and lower retail leasing revenue Year-Over-Year Change 2.2% (7.0%) 3.7% (1.3%) (0.2%) $2,149 $2,154 $2,272 $2,326 $2,340 All Other Mortgage Service Charges Trust and Inv Mgmt Payments Notable items: 3Q15 Visa gain $135 million, student loan market value adjustment ($58) million Payments = credit and debit card, corporate payment products and merchant processing Service charges = deposit service charges, treasury management and ATM processing $ in millions |
 12 U.S. BANCORP | Noninterest Expense $479 $459 $501 $554 $465 $214 $221 $222 $230 $233 $229 $266 $291 $295 $254 $247 $247 $251 $246 $248 $1,496 $1,489 $1,510 $1,484 $1,549 0 800 1,600 2,400 3,200 1Q15 2Q15 3Q15 4Q15 1Q16 Noninterest Expense Key Points vs. 1Q15 • Noninterest expense increased $84 million, or 3.2% Higher compensation (5.9% increase) reflecting the impact of merit increases and one additional day in the quarter Higher professional services expense (27.3% increase) primarily due to compliance-related matters Higher technology expense (8.9% increase) reflecting acquisition conversion costs Lower employee benefits expense (5.4% decrease) mainly due to lower pension costs Lower other noninterest expense (3.7% decrease) reflecting the impact of lower mortgage servicing expenses and proceeds from an insurance recovery vs. 4Q15 • Noninterest expense decreased $60 million, or 2.1% Higher compensation expense (3.1% increase) reflecting the seasonal impact of variable compensation including stock-based compensation grants Lower professional services expense (21.6% decrease) due to lower costs related to legal and compliance-related matters Lower other noninterest expense (17.3% decrease) reflecting seasonally lower costs related to investments in tax-advantaged projects Year-Over-Year Change 4.8% (2.6%) 6.2% 0.2% 3.2% $2,749 $2,665 $2,682 $2,775 $2,809 All Other Tech and Communications Prof Svcs, Marketing and PPS Occupancy and Equipment Compensation and Benefits Notable items: 3Q15 elevated expenses related to mortgage-related compliance and the company-wide talent upgrade costs $60 million $ in millions |
 13 U.S. BANCORP | Capital Position * RWA = risk-weighted assets $ in billions 1Q16 4Q15 3Q15 2Q15 1Q15 Total U.S. Bancorp shareholders' equity 46.7 46.1 $ 45.1 $ 44.5 $ 44.3 $ Standardized Approach Basel III transitional standardized approach Common equity tier 1 capital ratio 9.5% 9.6% 9.6% 9.5% 9.6% Tier 1 capital ratio 11.1% 11.3% 11.1% 11.0% 11.1% Total risk-based capital ratio 13.1% 13.3% 13.1% 13.1% 13.3% Leverage ratio 9.3% 9.5% 9.3% 9.2% 9.3% Common equity tier 1 capital to RWA* estimated for the Basel III fully implemented standardized approach 9.2% 9.1% 9.2% 9.2% 9.2% Advanced Approaches Common equity tier 1 capital to RWA for the Basel III transitional advanced approaches 12.3% 12.5% 13.0% 12.9% 12.3% Common equity tier 1 capital to RWA estimated for the Basel III fully implemented advanced approaches 11.9% 11.9% 12.4% 12.4% 11.8% Tangible common equity ratio 7.7% 7.6% 7.7% 7.5% 7.6% Tangible common equity as a % of RWA 9.3% 9.2% 9.3% 9.2% 9.3% |
 14 U.S. BANCORP | Appendix |
 15 U.S. BANCORP | Average Loans 15.1% 11.0% 9.5% 9.0% 10.2% 6.5% 4.8% 3.6% 3.1% (0.6%) (0.3%) (1.4%) (0.3%) 2.1% 5.4% 2.4% 1.3% 1.1% 4.7% 5.2%* 3.5% 4.0% 0.3% 5.6%* (1.8%) 5.7%* 3.6% 0 70 140 210 280 1Q15 2Q15 3Q15 4Q15 1Q16 Average Loans Key Points vs. 1Q15 • Average total loans increased by $14.3 billion, or 5.8% (5.2% growth excluding the Fidelity portfolio acquisition at end of 4Q15) • Average total commercial loans increased $8.3 billion, or 10.2% • Average retail loans increased 3.6% driven by growth in auto loans vs. 4Q15 • Average total loans increased by $5.6 billion, or 2.2% (1.6% growth excluding the Fidelity portfolio acquisition at end of 4Q15) • Average total commercial loans increased $3.0 billion, or 3.5% Year-Over-Year Growth 5.1% 2.5% 2.7% 4.2% 5.8% Covered Commercial CRE Res Mtg Retail Credit Card $262.3 $248.0 $246.6 $250.5 $256.7 4.0%* $ in billions 3.8%* * Excluding student loans, which were transferred from held for sale at the end of 1Q15 and returned to held for investment during 3Q15 and the acquisition of the Fidelity credit card portfolio at the end of 4Q15 5.2%* |
 16 U.S. BANCORP | Average Deposits (8.2%) (14.1%) (18.1) (19.2%) (14.4%) 24.7% 30.2% 21.3% 20.2% 17.0% 7.3% 6.1% 5.9% 6.7% 7.1% 5.2% 7.7% 9.2% 9.0% 5.4% 0 80 160 240 320 1Q15 2Q15 3Q15 4Q15 1Q16 Average Deposits Key Points vs. 1Q15 • Average total deposits increased by $17.4 billion, or 6.3% • Average low-cost deposits (NIB, interest checking, money market and savings) increased by $23.1 billion, or 9.7% vs. 4Q15 • Average total deposits increased by $1.4 billion, or 0.5% • Average low-cost deposits increased by $0.4 billion, or 0.1% Year-Over-Year Growth 8.1% 8.9% 6.9% 6.9% 6.3% Time Money Market Checking and Savings Noninterest-bearing $278.5 $285.7 $289.7 $294.5 $295.9 $ in billions |
 17 U.S. BANCORP | Credit Quality – Commercial Loans Average Loans and Net Charge-offs Ratios Key Statistics Key Points • Average linked quarter loan growth of 3.5% and year-over-year loan growth of 10.2% demonstrates continued momentum with customers • Net charge-offs increased on a linked quarter basis but remained at historically low levels • Nonperforming loans increased primarily due to weakness in energy • Line utilization remained relatively stable 1Q15 4Q15 1Q16 Average Loans $81,508 $86,803 $89,820 30-89 Delinquencies 0.23% 0.36% 0.21% 90+ Delinquencies 0.05% 0.05% 0.05% Nonperforming Loans 0.11% 0.20% 0.52% $81,508 $83,253 $84,704 $86,803 $89,820 0.21% 0.20% 0.33% 0.29% 0.37% 0.0% 0.5% 1.0% 1.5% 2.0% 0 25,000 50,000 75,000 100,000 1Q15 2Q15 3Q15 4Q15 1Q16 Average Loans Net Charge-offs Ratio $ in millions 20% 24% 28% 32% 36% Revolving Line Utilization Trend |
 18 U.S. BANCORP | A&D Construction $821 Credit Quality – Commercial Real Estate Average Loans and Net Charge-offs Ratios Key Statistics Key Points • Year-over-year average loans decreased 0.6% due to disciplined underwriting • Nonperforming loans remained at historically low levels • Recoveries within the CRE portfolio continued to largely offset loan charge-offs 1Q15 4Q15 1Q16 Average Loans $42,671 $42,231 $42,401 30-89 Delinquencies 0.24% 0.21% 0.19% 90+ Delinquencies 0.07% 0.03% 0.04% Nonperforming Loans 0.51% 0.30% 0.24% Performing TDRs* $259 $209 $212 $ in millions Investor $20,750 Owner Occupied $11,086 Multi-family $3,536 Retail $914 Residential Construction $2,152 Office $909 Other $2,233 * TDR = troubled debt restructuring $42,671 $42,446 $42,316 $42,231 $42,401 -0.17% 0.01% -0.10% 0.00% -0.05% -0.5% 0.0% 0.5% 1.0% 1.5% 0 20,000 40,000 60,000 1Q15 2Q15 3Q15 4Q15 1Q16 Average Loans Net Charge-offs Ratio CRE Construction CRE Mortgage |
 19 U.S. BANCORP | Credit Quality – Residential Mortgage Average Loans and Net Charge-offs Ratios Key Statistics Key Points • Originations continued to be high credit quality (weighted average FICO 757, weighted average LTV 69%) • 86% of the balances have been originated since the beginning of 2009; the origination quality metrics and performance to date have significantly outperformed prior vintages with similar seasoning $ in millions 1Q15 4Q15 1Q16 Average Loans $51,426 $52,970 $54,208 30-89 Delinquencies 0.38% 0.32% 0.24% 90+ Delinquencies 0.33% 0.33% 0.31% Nonperforming Loans 1.61% 1.33% 1.23% *Excludes GNMA loans, whose repayments are insured by the FHA or guaranteed by the Department of VA ($1,820 million in 1Q16) $51,426 $51,114 $51,831 $52,970 $54,208 0.28% 0.26% 0.19% 0.12% 0.14% 0.0% 0.5% 1.0% 1.5% 2.0% 0 15,000 30,000 45,000 60,000 1Q15 2Q15 3Q15 4Q15 1Q16 $1,851 $1,931 $1,903 $1,863 $1,827 0 1,000 2,000 3,000 4,000 1Q15 2Q15 3Q15 4Q15 1Q16 Residential Mortgage Performing TDRs* Average Loans Net Charge-offs Ratio |
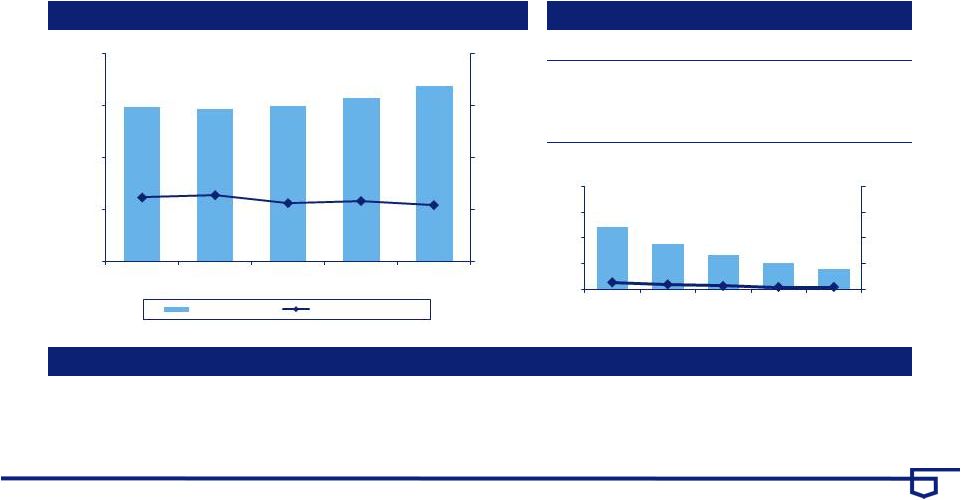 20 U.S. BANCORP | Credit Quality – Credit Card Average Loans and Net Charge-offs Ratios Key Statistics Key Points • Year-over-year growth in average loans of 13.6% driven, in part, by Fidelity portfolio acquisition at the end of 4Q15 • Origination strength was driven by high credit quality accounts with a commitment weighted average FICO of 758 $ in millions 1Q15 4Q15 1Q16 Average Loans $17,823 $18,838 $20,244 30-89 Delinquencies 1.16% 1.15% 1.09% 90+ Delinquencies 1.19% 1.09% 1.10% Nonperforming Loans 0.13% 0.04% 0.04% $22 $16 $12 $9 $7 0.13% 0.09% 0.06% 0.04% 0.04% 0.0% 0.5% 1.0% 1.5% 2.0% 0 9 18 27 36 1Q15 2Q15 3Q15 4Q15 1Q16 $17,823 $17,613 $17,944 $18,838 $20,244 3.71% 3.85% 3.38% 3.50% 3.26% 0.0% 3.0% 6.0% 9.0% 12.0% 0 6,000 12,000 18,000 24,000 1Q15 2Q15 3Q15 4Q15 1Q16 Average Loans Net Charge-offs Ratio Credit Card Nonperforming Loans |
 21 U.S. BANCORP | Credit Quality – Home Equity Average Loans and Net Charge-offs Ratios Key Statistics Key Points • High-quality originations (weighted average FICO on commitments was 763, weighted average CLTV 71%) originated primarily through the retail branch network to existing bank customers on their primary residences • Net charge-offs ratio continued to decline on a linked quarter and year-over-year basis $ in millions 1Q15 4Q15 1Q16 Average Loans $15,897 $16,241 $16,368 30-89 Delinquencies 0.41% 0.36% 0.39% 90+ Delinquencies 0.25% 0.25% 0.26% Nonperforming Loans 1.07% 0.83% 0.80% Home Equity Subprime: 1% Wtd Avg LTV*: 89% NCO: 0.00% Prime: 97% Wtd Avg LTV*: 72% NCO: 0.05% Other: 2% Wtd Avg LTV*: 71% NCO: 0.00% *LTV at origination $15,897 $15,958 $16,083 $16,241 $16,368 0.36% 0.28% 0.17% 0.15% 0.05% 0.0% 1.0% 2.0% 3.0% 4.0% 0 5,000 10,000 15,000 20,000 1Q15 2Q15 3Q15 4Q15 1Q16 Average Loans Net Charge-offs Ratio |
 22 U.S. BANCORP | Credit Quality – Retail Leasing Average Loans and Net Charge-offs Ratios Key Statistics Key Points • Continued high-quality originations (weighted average FICO 788) support the portfolio’s stable credit profile • Delinquencies, nonperforming loans, and net charge-offs remained at very low levels $ in millions 1Q15 4Q15 1Q16 Average Loans $5,819 $5,265 $5,179 30-89 Delinquencies 0.12% 0.21% 0.17% 90+ Delinquencies 0.00% 0.02% 0.02% Nonperforming Loans 0.02% 0.06% 0.04% * Manheim Used Vehicle Value Index source: www.manheimconsulting.com, January 1995 = 100, quarter value = average monthly ending values 0 2,000 4,000 6,000 8,000 1Q15 2Q15 3Q15 4Q15 1Q16 0.0% 0.2% 0.4% 0.6% 0.8% $5,819 $5,696 $5,480 $5,265 $5,179 0.07% 0.07% 0.14% 0.08% 0.08% Average Loans Net Charge -offs Ratio 100 110 120 130 140 Manheim Used Vehicle Index* |
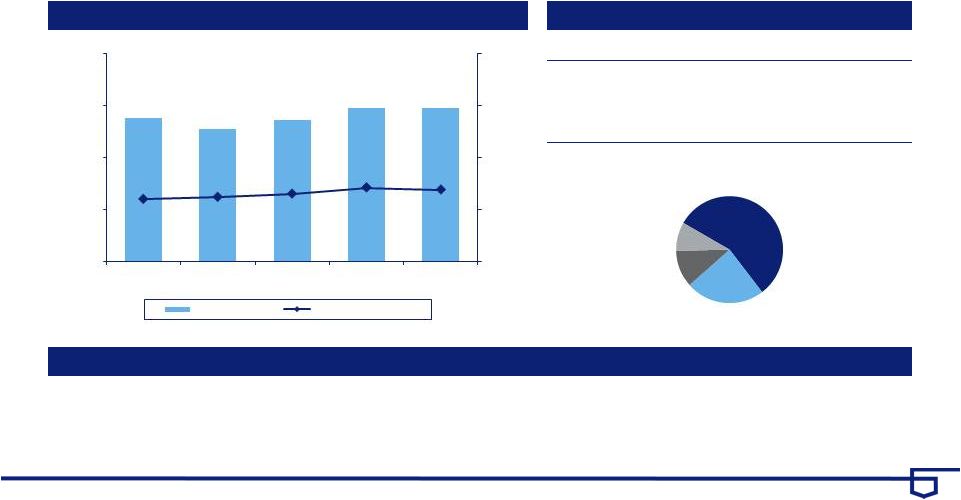 23 U.S. BANCORP | Credit Quality – Other Retail Average Loans and Net Charge-offs Ratios Key Statistics Key Points • Overall growth continued to be driven by auto loans and installment, which were up 10.7% and 12.5% year-over-year, respectively • Delinquency rates, nonperforming loans, and net charge-offs remained stable $ in millions 1Q15 4Q15 1Q16 Average Loans $27,604 $29,556 $29,550 30-89 Delinquencies 0.44% 0.52% 0.42% 90+ Delinquencies 0.11% 0.11% 0.10% Nonperforming Loans 0.06% 0.08% 0.08% $27,604 $25,415 $27,286 $29,556 $29,550 0.60% 0.62% 0.65% 0.71% 0.69% 0.0% 0.5% 1.0% 1.5% 2.0% 0 10,000 20,000 30,000 40,000 1Q15 2Q15 3Q15 4Q15 1Q16 Average Loans Net Charge-offs Ratio Auto Loans $16,623 Installment $7,059 Revolving Credit $3,297 Student Loans $2,571 Other Retail |
 24 U.S. BANCORP | Credit Quality – Auto Loans Average Loans and Net Charge-offs Ratios Key Statistics Key Points • Continued growth in auto loans driven by high-quality originations in the indirect channel (weighted average FICO 770) • Net charge-offs were up slightly year-over-year, driven by maturation of growth initiatives $ in millions 1Q15 4Q15 1Q16 Average Loans $15,013 $16,551 $16,623 30-89 Delinquencies 0.30% 0.51% 0.39% 90+ Delinquencies 0.01% 0.04% 0.02% Nonperforming Loans 0.03% 0.07% 0.07% Indirect and Direct Channel Direct: 6% Wtd Avg FICO: 748 NCO: 0.12% Indirect: 94% Wtd Avg FICO: 765 NCO: 0.43% Auto loans are included in Other Retail category $15,013 $15,609 $16,220 $16,551 $16,623 0.19% 0.15% 0.22% 0.36% 0.41% 0.0% 0.5% 1.0% 1.5% 2.0% 0 5,000 10,000 15,000 20,000 1Q15 2Q15 3Q15 4Q15 1Q16 Average Loans Net Charge-offs Ratio |
 25 U.S. BANCORP | Non-GAAP Financial Measures * Preliminary data. Subject to change prior to filings with applicable regulatory agencies. (1) Includes goodwill related to certain investments in unconsolidated financial institutions per prescribed regulatory requirements. (2) Includes net losses on cash flow hedges included in accumulated other comprehensive income (loss) and other adjustments. (3) Includes higher risk-weighting for unfunded loan commitments, investment securities, residential mortgages, mortgage servicing rights and other adjustments. (4) Primarily reflects higher risk-weighting for mortgage servicing rights. March 31, December 31, September 30, June 30, March 31, (Dollars in Millions, Unaudited) 2016 2015 2015 2015 2015 Total equity $47,393 $46,817 $45,767 $45,231 $44,965 Preferred stock (5,501) (5,501) (4,756) (4,756) (4,756) Noncontrolling interests (638) (686) (692) (694) (688) Goodwill (net of deferred tax liability) (1) (8,270) (8,295) (8,324) (8,350) (8,360) Intangible assets, other than mortgage servicing rights (820) (838) (779) (744) (783) Tangible common equity (a) 32,164 31,497 31,216 30,687 30,378 Tangible common equity (as calculated above) 32,164 31,497 31,216 30,687 30,378 Adjustments (2) 99 67 118 125 158 Common equity tier 1 capital estimated for the Basel III fully implemented standardized and advanced approaches (b) 32,263 31,564 31,334 30,812 30,536 Total assets 428,638 421,853 415,943 419,075 410,233 Goodwill (net of deferred tax liability) (1) (8,270) (8,295) (8,324) (8,350) (8,360) Intangible assets, other than mortgage servicing rights (820) (838) (779) (744) (783) Tangible assets (c) 419,548 412,720 406,840 409,981 401,090 Risk-weighted assets, determined in accordance with prescribed transitional standardized approach regulatory requirements (d) 346,227 * 341,360 336,227 333,177 327,709 Adjustments (3) 3,485 * 3,892 3,532 3,532 3,153 Risk-weighted assets estimated for the Basel III fully implemented standardized approach (e) 349,712 * 345,252 339,759 336,709 330,862 Risk-weighted assets, determined in accordance with prescribed transitional advanced approaches regulatory requirements 267,309 * 261,668 248,048 245,038 254,892 Adjustments (4) 3,707 * 4,099 3,723 3,721 3,321 Risk-weighted assets estimated for the Basel III fully implemented advanced approaches (f) 271,016 * 265,767 251,771 248,759 258,213 Ratios* Tangible common equity to tangible assets (a)/(c) 7.7 % 7.6 % 7.7 % 7.5 % 7.6 % Tangible common equity to risk-weighted assets (a)/(d) 9.3 9.2 9.3 9.2 9.3 Common equity tier 1 capital to risk-weighted assets estimated for the Basel III fully implemented standardized approach (b)/(e) 9.2 9.1 9.2 9.2 9.2 Common equity tier 1 capital to risk-weighted assets estimated for the Basel III fully implemented advanced approaches (b)/(f) 11.9 11.9 12.4 12.4 11.8 |
 U.S. Bancorp 1Q16 Earnings Conference Call April 20, 2016 |