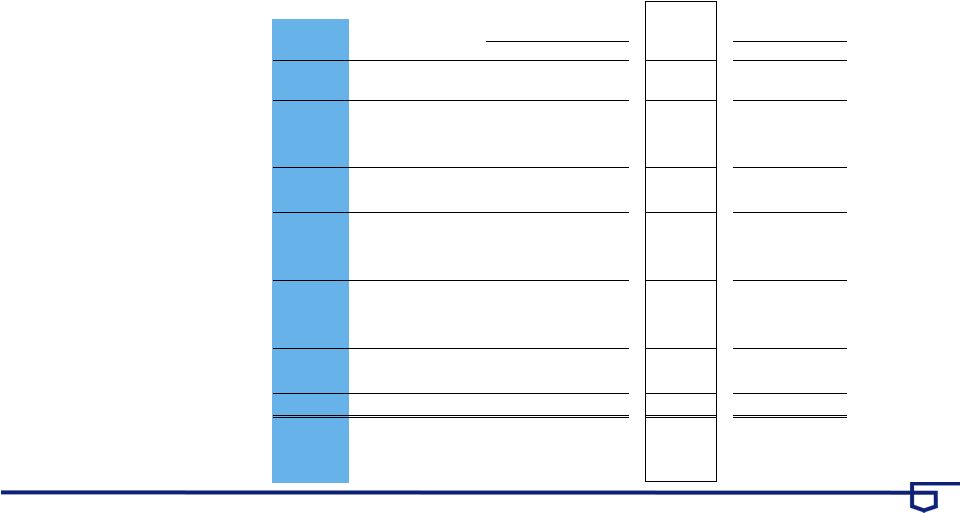
Non-GAAP Financial Measures * Preliminary data. Subject to change prior to filings with applicable regulatory agencies. (1) Includes goodwill related to certain investments in unconsolidated financial institutions per prescribed regulatory requirements. (2) Includes net losses on cash flow hedges included in accumulated other comprehensive income (loss) and other adjustments. (3) Includes higher risk-weighting for unfunded loan commitments, investment securities, residential mortgages, mortgage servicing rights and other adjustments. (4) Primarily reflects higher risk-weighting for mortgage servicing rights. (5) Utilizes a tax rate of 35 percent for those assets and liabilities whose income or expense is not included for federal income tax purposes. September 30, June 30, March 31, December 31, September 30, (Dollars in Millions, Unaudited) 2016 2016 2016 2015 2015 Total equity $48,399 $48,029 $47,393 $46,817 $45,767 Preferred stock (5,501) (5,501) (5,501) (5,501) (4,756) Noncontrolling interests (640) (639) (638) (686) (692) Goodwill (net of deferred tax liability) (1) (8,239) (8,246) (8,270) (8,295) (8,324) Intangible assets, other than mortgage servicing rights (756) (796) (820) (838) (779) Tangible common equity (a) 33,263 32,847 32,164 31,497 31,216 Tangible common equity (as calculated above) 33,263 32,847 32,164 31,497 31,216 Adjustments (2) 97 133 99 67 118 Common equity tier 1 capital estimated for the Basel III fully 33,360 implemented standardized and advanced approaches (b) 32,980 32,263 31,564 31,334 Total assets 454,134 438,463 428,638 421,853 415,943 Goodwill (net of deferred tax liability) (1) (8,239) (8,246) (8,270) (8,295) (8,324) Intangible assets, other than mortgage servicing rights (756) (796) (820) (838) (779) Tangible assets (c) 445,139 429,421 419,548 412,720 406,840 Risk-weighted assets, determined in accordance with prescribed transitional standardized approach regulatory requirements (d) 356,733 * 351,462 346,227 341,360 336,227 Adjustments (3) 3,165 * 3,079 3,485 3,892 3,532 Risk-weighted assets estimated for the Basel III fully implemented standardized approach (e) 359,898 * 354,541 349,712 345,252 339,759 Risk-weighted assets, determined in accordance with prescribed transitional advanced approaches regulatory requirements 272,832 * 271,495 267,309 261,668 248,048 Adjustments (4) 3,372 * 3,283 3,707 4,099 3,723 Risk-weighted assets estimated for the Basel III fully implemented advanced approaches (f) 276,204 * 274,778 271,016 265,767 251,771 Ratios* Tangible common equity to tangible assets (a)/(c) 7.5 % 7.6 % 7.7 % 7.6 % 7.7 % Tangible common equity to risk-weighted assets (a)/(d) 9.3 9.3 9.3 9.2 9.3 Common equity tier 1 capital to risk-weighted assets estimated for the Basel III fully implemented standardized approach (b)/(e) 9.3 9.3 9.2 9.1 9.2 Common equity tier 1 capital to risk-weighted assets estimated for the Basel III fully implemented advanced approaches (b)/(f) 12.1 12.0 11.9 11.9 12.4 U.S. BANCORP | 24 September 30, June 30, September 30, September 30, September 30, 2016 2016 2015 2016 2015 Net interest income $2,893 $2,845 $2,768 $8,573 $8,182 Taxable-equivalent adjustment (5) 50 51 53 154 161 Net interest income, on a taxable-equivalent basis $2,943 $2,896 $2,821 $8,727 $8,343 Three Months Ended Nine Months Ended |


