U.S. Bancorp 2Q22 Earnings Conference Call July 15, 2022 Exhibit 99.2
The following information appears in accordance with the Private Securities Litigation Reform Act of 1995: This presentation contains forward-looking statements about U.S. Bancorp. Statements that are not historical or current facts, including statements about beliefs and expectations, are forward-looking statements and are based on the information available to, and assumptions and estimates made by, management as of the date hereof. These forward-looking statements cover, among other things, anticipated future revenue and expenses and the future plans and prospects of U.S. Bancorp. Forward-looking statements often use words such as “anticipates,” “targets,” “expects,” “hopes,” “estimates,” “projects,” “forecasts,” “intends,” “plans,” “goals,” “believes,” “continue” and other similar expressions or future or conditional verbs such as “will,” “may,” “might,” “should,” “would” and “could.” Forward-looking statements involve inherent risks and uncertainties, including the following risks and uncertainties and the risks and uncertainties more fully discussed in the section entitled “Risk Factors” of Exhibit 13 to U.S. Bancorp’s Annual Report on Form 10-K for the year ended December 31, 2021, which could cause actual results to differ materially from those anticipated. Continued deterioration in general business and economic conditions or turbulence in domestic or global financial markets could adversely affect U.S. Bancorp’s revenues and the values of its assets and liabilities, reduce the availability of funding to certain financial institutions, lead to a tightening of credit, and increase stock price volatility. In addition, changes to statutes, regulations, or regulatory policies or practices could affect U.S. Bancorp in substantial and unpredictable ways. U.S. Bancorp’s results could also be adversely affected by changes in interest rates; the impacts of the COVID-19 pandemic on its business, financial position, results of operations, liquidity and prospects; increases in unemployment rates; deterioration in the credit quality of its loan portfolios or in the value of the collateral securing those loans; deterioration in the value of its investment securities; legal and regulatory developments; litigation; increased competition from both banks and non-banks; civil unrest; the effects of climate change; changes in customer behavior and preferences; breaches in data security, including as a result of work-from-home arrangements; failures to safeguard personal information; the impacts of international hostilities or geopolitical events; impacts of supply chain disruptions and rising inflation; effects of mergers and acquisitions and related integration; effects of critical accounting policies and judgments; and management’s ability to effectively manage credit risk, market risk, operational risk, compliance risk, strategic risk, interest rate risk, liquidity risk and reputation risk. In addition, U.S. Bancorp’s proposed acquisition of MUFG Union Bank presents risks and uncertainties, including, among others: the risk that the cost savings, any revenue synergies and other anticipated benefits of the proposed acquisition may not be realized or may take longer than anticipated to be realized; the risk that U.S. Bancorp’s business could be disrupted as a result of the announcement and pendency of the proposed acquisition and diversion of management’s attention from ongoing business operations and opportunities; the possibility that the proposed acquisition, including the integration of MUFG Union Bank, may be more costly or difficult to complete than anticipated; delays in closing the proposed acquisition; and the failure of required governmental approvals to be obtained or any other closing conditions in the definitive purchase agreement to be satisfied. For discussion of these and other risks that may cause actual results to differ from those described in forward-looking statements, refer to U.S. Bancorp’s Annual Report on Form 10-K for the year ended December 31, 2021, on file with the Securities and Exchange Commission, including the sections entitled “Corporate Risk Profile” and “Risk Factors” contained in Exhibit 13, and all subsequent filings with the Securities and Exchange Commission under Sections 13(a), 13(c), 14 or 15(d) of the Securities Exchange Act of 1934. In addition, factors other than these risks also could adversely affect U.S. Bancorp’s results, and the reader should not consider these risks to be a complete set of all potential risks or uncertainties. Readers are cautioned not to place undue reliance on any forward-looking statements. Forward-looking statements speak only as of the date hereof, and U.S. Bancorp undertakes no obligation to update them in light of new information or future events. This presentation includes non-GAAP financial measures to describe U.S. Bancorp’s performance. The calculations of these measures are provided in the Appendix. These disclosures should not be viewed as a substitute for operating results determined in accordance with GAAP, nor are they necessarily comparable to non-GAAP performance measures that may be presented by other companies. Forward-looking Statements and Additional Information
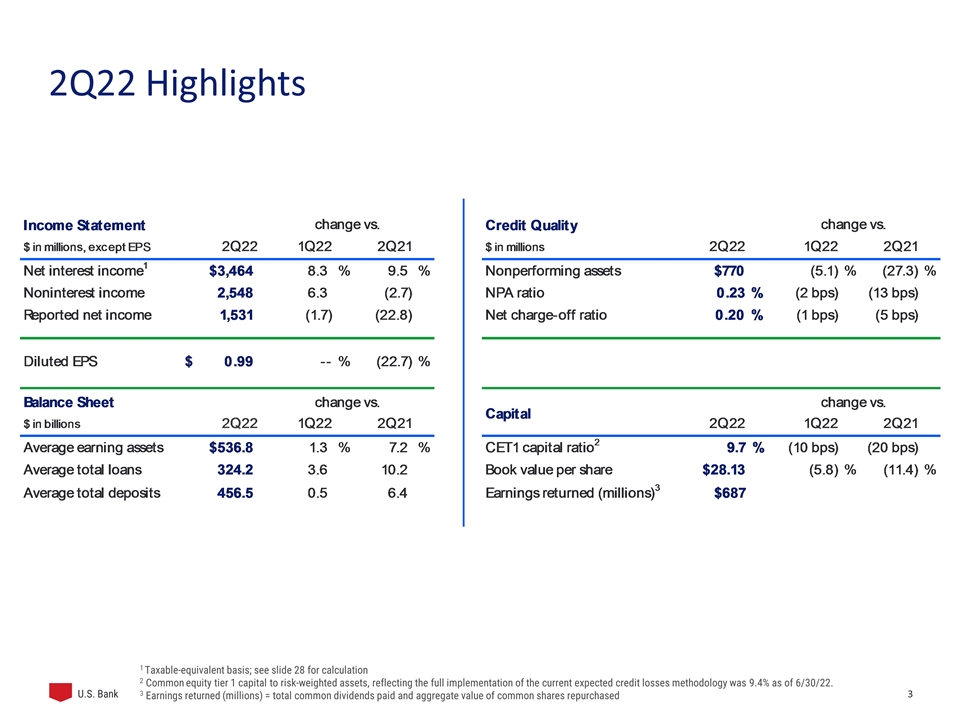
2Q22 Highlights 1 Taxable-equivalent basis; see slide 28 for calculation 2 Common equity tier 1 capital to risk-weighted assets, reflecting the full implementation of the current expected credit losses methodology was 9.4% as of 6/30/22. 3 Earnings returned (millions) = total common dividends paid and aggregate value of common shares repurchased
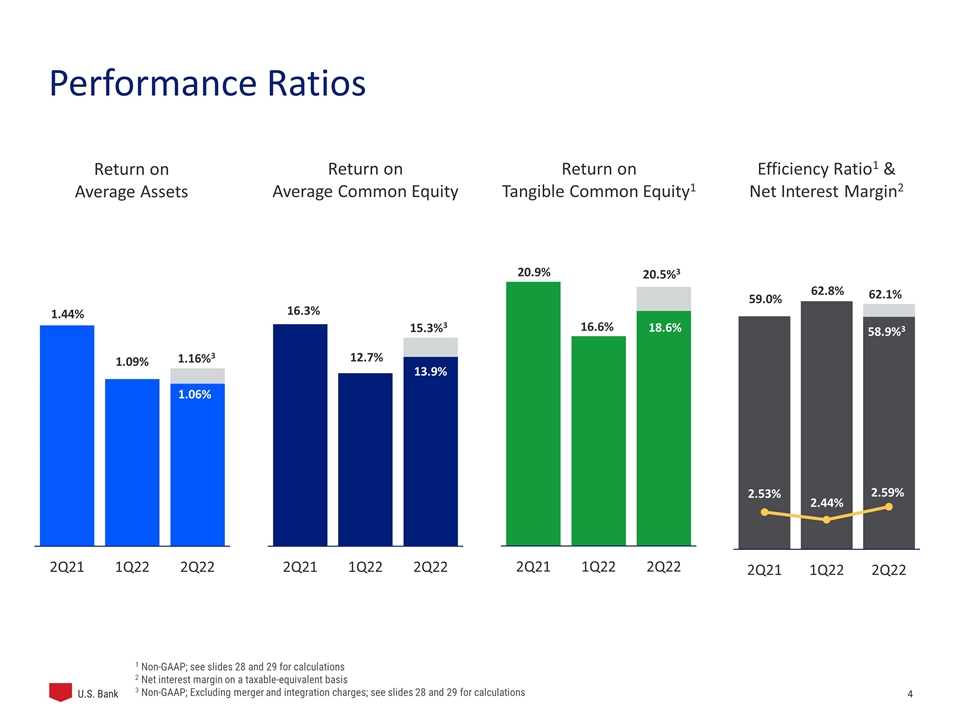
Performance Ratios Return on Average Assets Efficiency Ratio1 & Net Interest Margin2 Return on Average Common Equity Return on Tangible Common Equity1 1 Non-GAAP; see slides 28 and 29 for calculations 2 Net interest margin on a taxable-equivalent basis 3 Non-GAAP; Excluding merger and integration charges; see slides 28 and 29 for calculations 1.16%3 15.3%3 20.5%3 62.1% 58.9%3
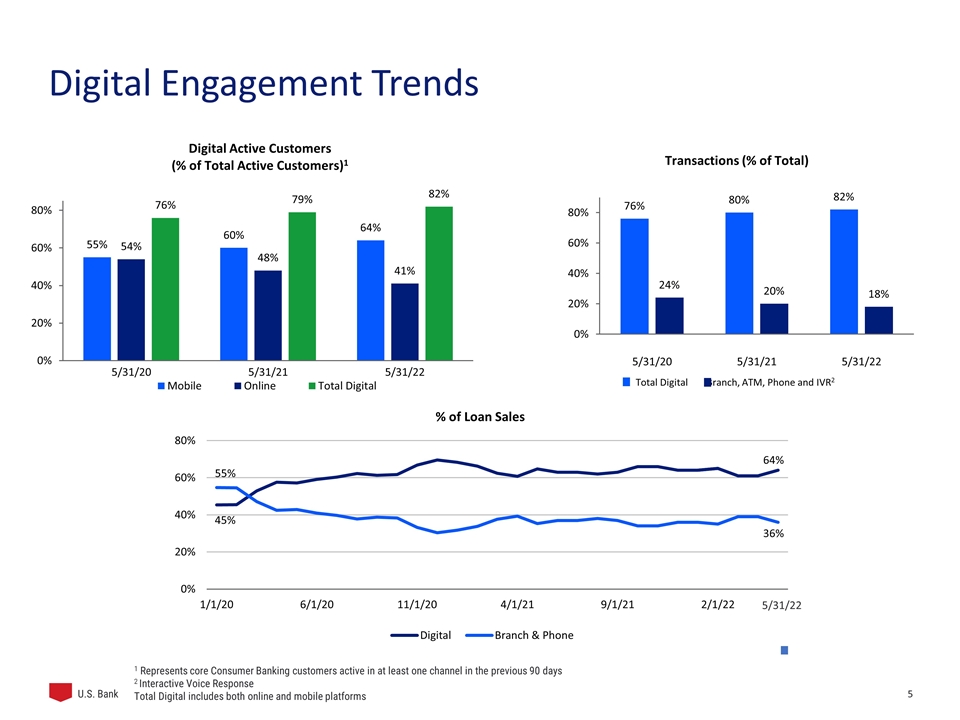
Digital Engagement Trends 5/31/22 1 Represents core Consumer Banking customers active in at least one channel in the previous 90 days 2 Interactive Voice Response Total Digital includes both online and mobile platforms
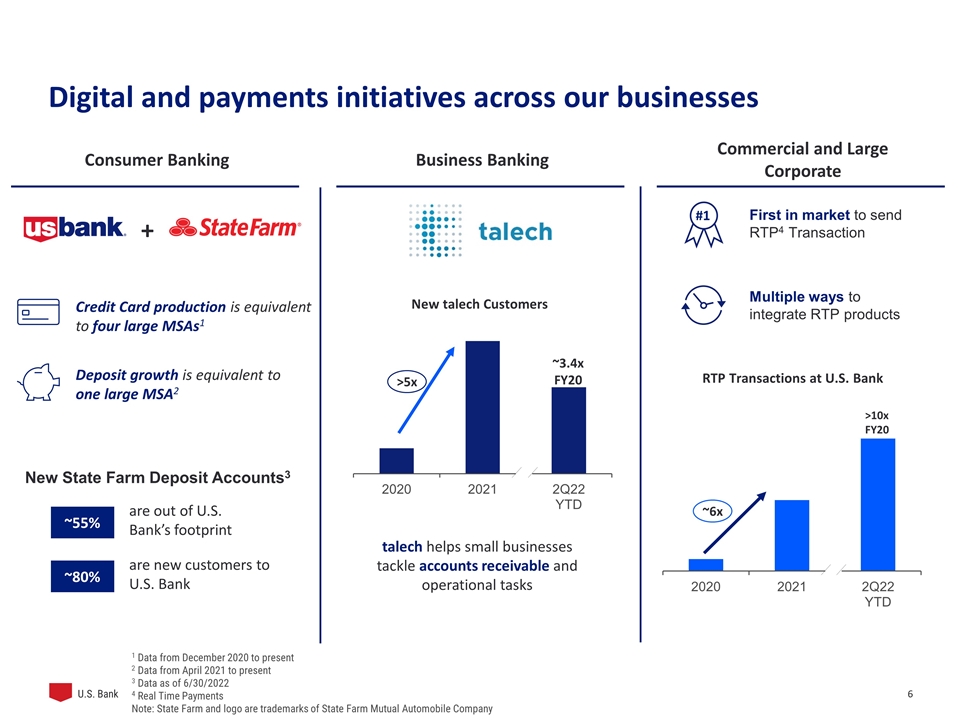
Digital and payments initiatives across our businesses Commercial and Large Corporate Business Banking Consumer Banking ~6x >10x FY20 RTP Transactions at U.S. Bank First in market to send RTP4 Transaction Multiple ways to integrate RTP products #1 are out of U.S. Bank’s footprint ~55% New State Farm Deposit Accounts3 are new customers to U.S. Bank ~80% + Deposit growth is equivalent to one large MSA2 Credit Card production is equivalent to four large MSAs1 >5x ~3.4x FY20 talech helps small businesses tackle accounts receivable and operational tasks 1 Data from December 2020 to present 2 Data from April 2021 to present 3 Data as of 6/30/2022 4 Real Time Payments Note: State Farm and logo are trademarks of State Farm Mutual Automobile Company New talech Customers
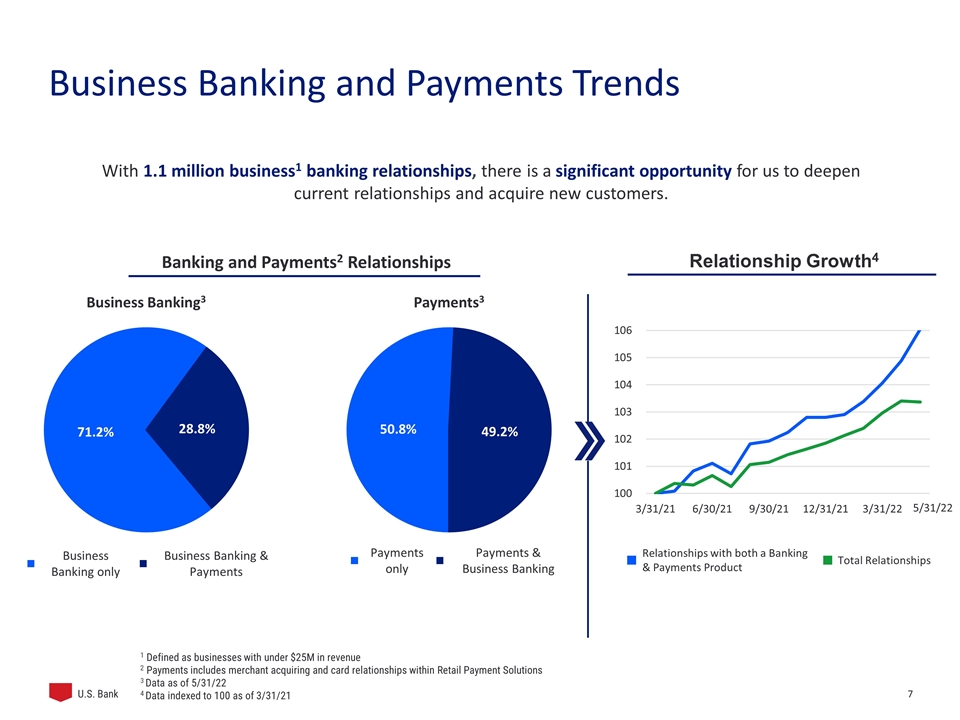
Business Banking and Payments Trends With 1.1 million business1 banking relationships, there is a significant opportunity for us to deepen current relationships and acquire new customers. Banking and Payments2 Relationships Business Banking only Business Banking & Payments Payments only Payments & Business Banking 1 Defined as businesses with under $25M in revenue 2 Payments includes merchant acquiring and card relationships within Retail Payment Solutions 3 Data as of 5/31/22 4 Data indexed to 100 as of 3/31/21 Relationship Growth4 Relationships with both a Banking & Payments Product Total Relationships 5/31/22
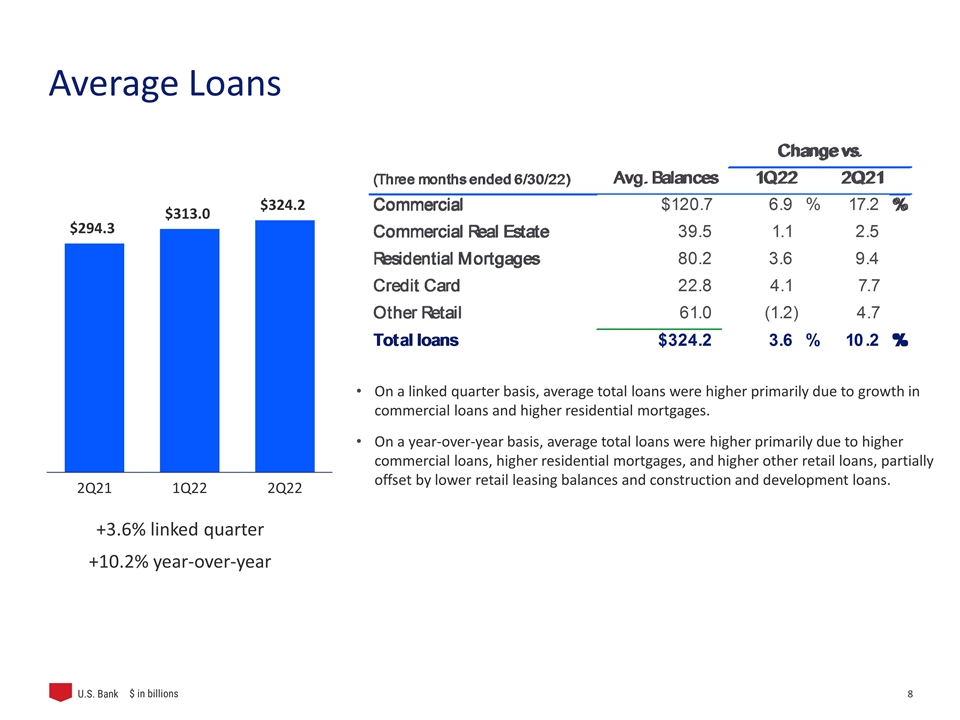
Average Loans +3.6% linked quarter +10.2% year-over-year On a linked quarter basis, average total loans were higher primarily due to growth in commercial loans and higher residential mortgages. On a year-over-year basis, average total loans were higher primarily due to higher commercial loans, higher residential mortgages, and higher other retail loans, partially offset by lower retail leasing balances and construction and development loans. $ in billions
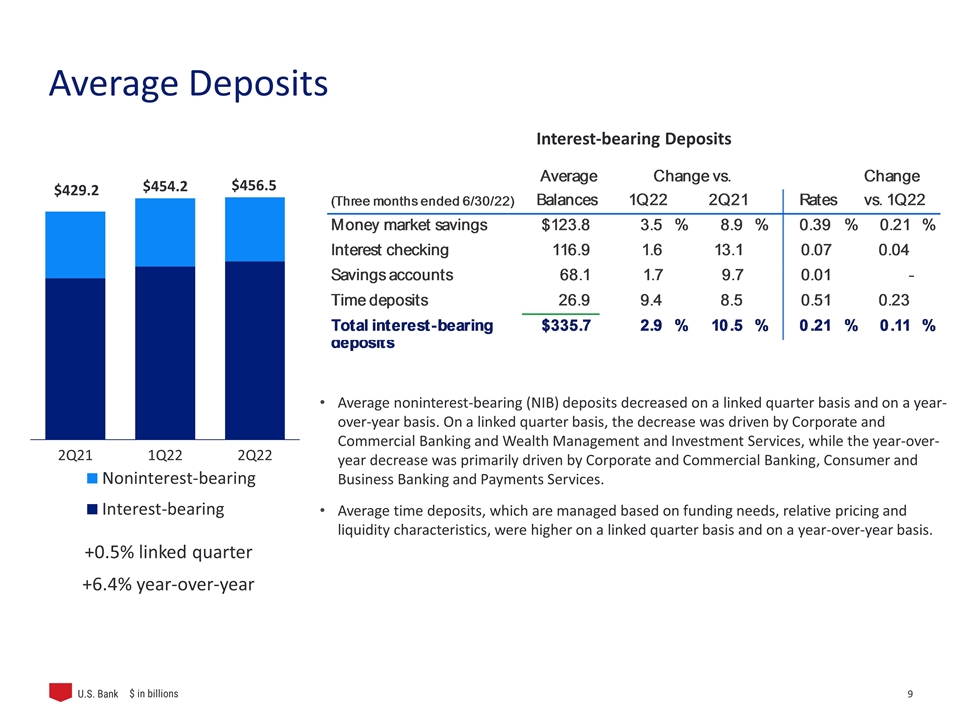
Average Deposits +0.5% linked quarter +6.4% year-over-year Interest-bearing Deposits Average noninterest-bearing (NIB) deposits decreased on a linked quarter basis and on a year-over-year basis. On a linked quarter basis, the decrease was driven by Corporate and Commercial Banking and Wealth Management and Investment Services, while the year-over-year decrease was primarily driven by Corporate and Commercial Banking, Consumer and Business Banking and Payments Services. Average time deposits, which are managed based on funding needs, relative pricing and liquidity characteristics, were higher on a linked quarter basis and on a year-over-year basis. $ in billions
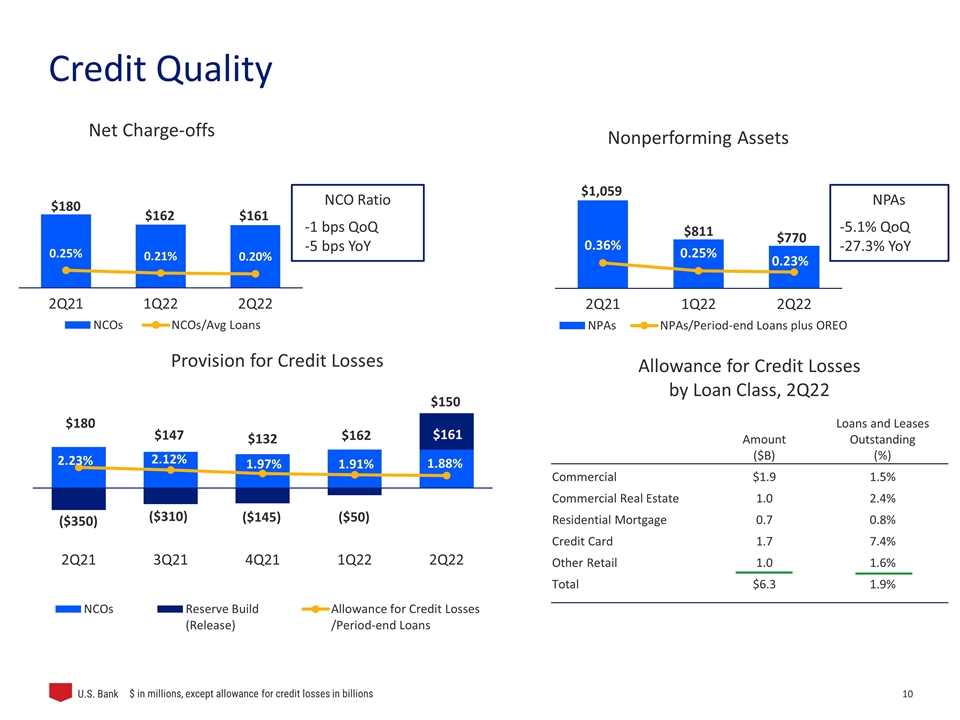
NCO Ratio -1 bps QoQ -5 bps YoY NPAs -5.1% QoQ -27.3% YoY $ in millions, except allowance for credit losses in billions Allowance for Credit Losses by Loan Class, 2Q22 Amount ($B) Loans and Leases Outstanding (%) Commercial $1.9 1.5% Commercial Real Estate 1.0 2.4% Residential Mortgage 0.7 0.8% Credit Card 1.7 7.4% Other Retail 1.0 1.6% Total $6.3 1.9% Credit Quality
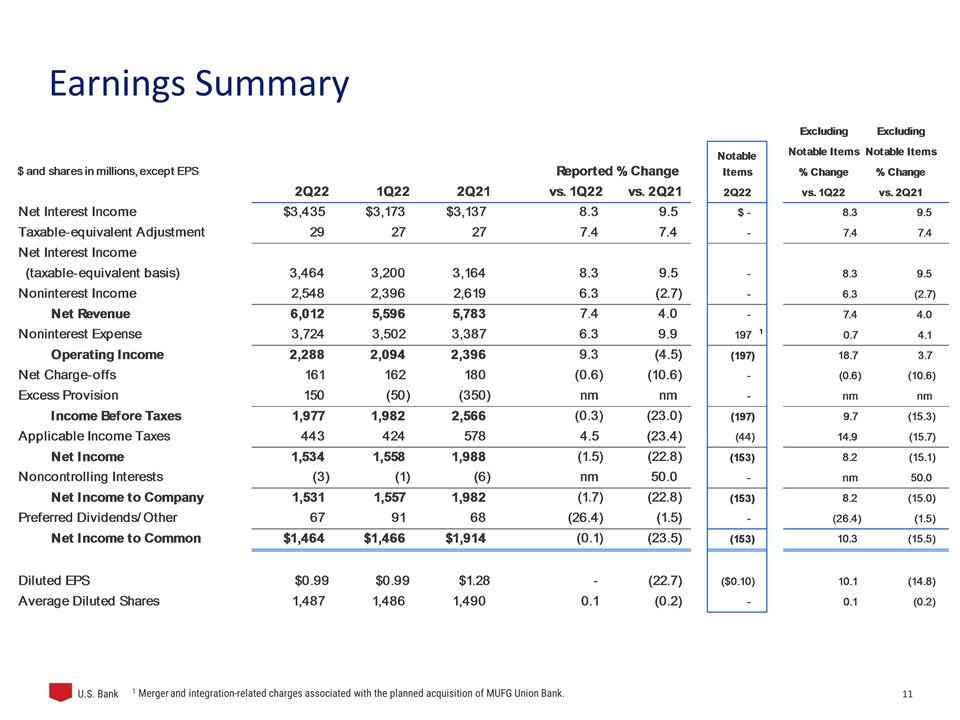
Earnings Summary 1 Merger and integration-related charges associated with the planned acquisition of MUFG Union Bank.
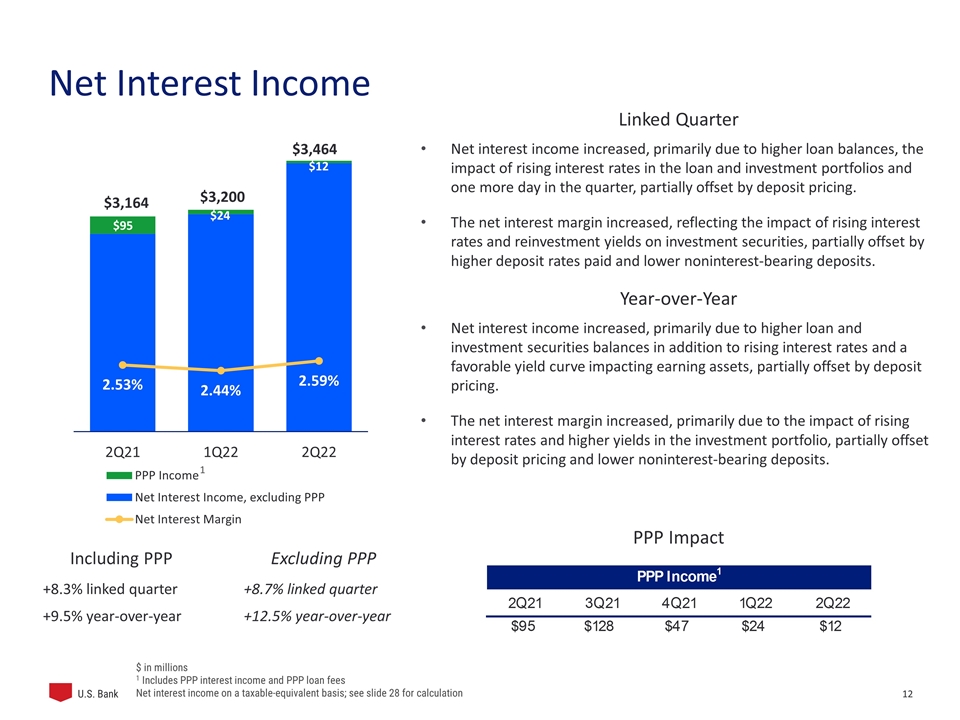
Net Interest Income +8.3% linked quarter +9.5% year-over-year $ in millions 1 Includes PPP interest income and PPP loan fees Net interest income on a taxable-equivalent basis; see slide 28 for calculation Including PPP Excluding PPP +8.7% linked quarter +12.5% year-over-year $3,164 $3,200 $3,464 Linked Quarter Net interest income increased, primarily due to higher loan balances, the impact of rising interest rates in the loan and investment portfolios and one more day in the quarter, partially offset by deposit pricing. The net interest margin increased, reflecting the impact of rising interest rates and reinvestment yields on investment securities, partially offset by higher deposit rates paid and lower noninterest-bearing deposits. Year-over-Year Net interest income increased, primarily due to higher loan and investment securities balances in addition to rising interest rates and a favorable yield curve impacting earning assets, partially offset by deposit pricing. The net interest margin increased, primarily due to the impact of rising interest rates and higher yields in the investment portfolio, partially offset by deposit pricing and lower noninterest-bearing deposits. PPP Impact 1
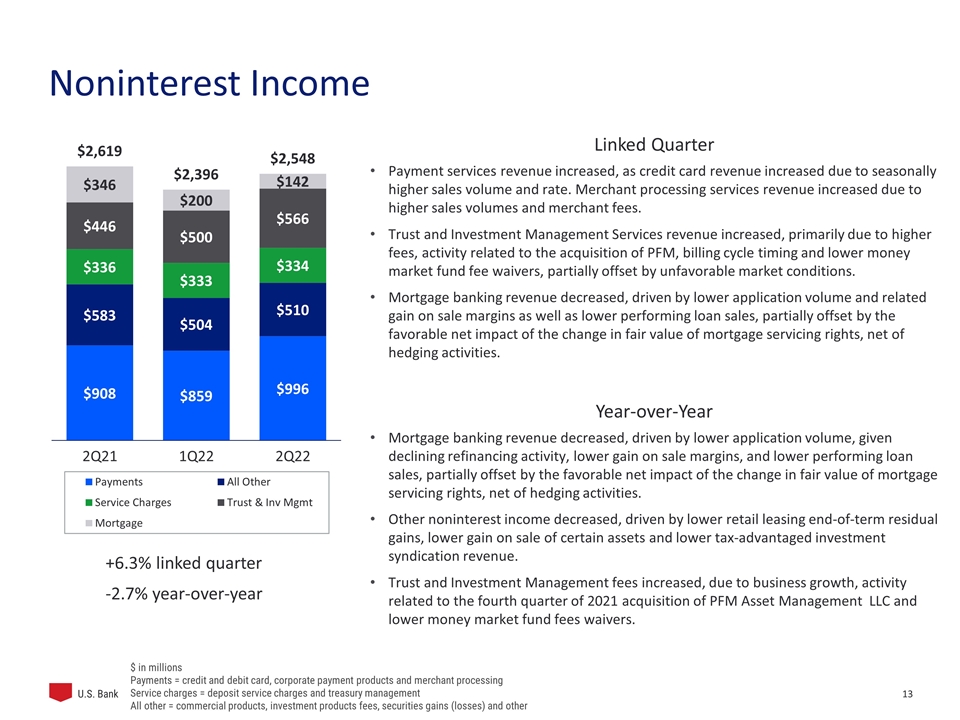
Noninterest Income +6.3% linked quarter -2.7% year-over-year Linked Quarter Payment services revenue increased, as credit card revenue increased due to seasonally higher sales volume and rate. Merchant processing services revenue increased due to higher sales volumes and merchant fees. Trust and Investment Management Services revenue increased, primarily due to higher fees, activity related to the acquisition of PFM, billing cycle timing and lower money market fund fee waivers, partially offset by unfavorable market conditions. Mortgage banking revenue decreased, driven by lower application volume and related gain on sale margins as well as lower performing loan sales, partially offset by the favorable net impact of the change in fair value of mortgage servicing rights, net of hedging activities. Year-over-Year Mortgage banking revenue decreased, driven by lower application volume, given declining refinancing activity, lower gain on sale margins, and lower performing loan sales, partially offset by the favorable net impact of the change in fair value of mortgage servicing rights, net of hedging activities. Other noninterest income decreased, driven by lower retail leasing end-of-term residual gains, lower gain on sale of certain assets and lower tax-advantaged investment syndication revenue. Trust and Investment Management fees increased, due to business growth, activity related to the fourth quarter of 2021 acquisition of PFM Asset Management LLC and lower money market fund fees waivers. $ in millions Payments = credit and debit card, corporate payment products and merchant processing Service charges = deposit service charges and treasury management All other = commercial products, investment products fees, securities gains (losses) and other
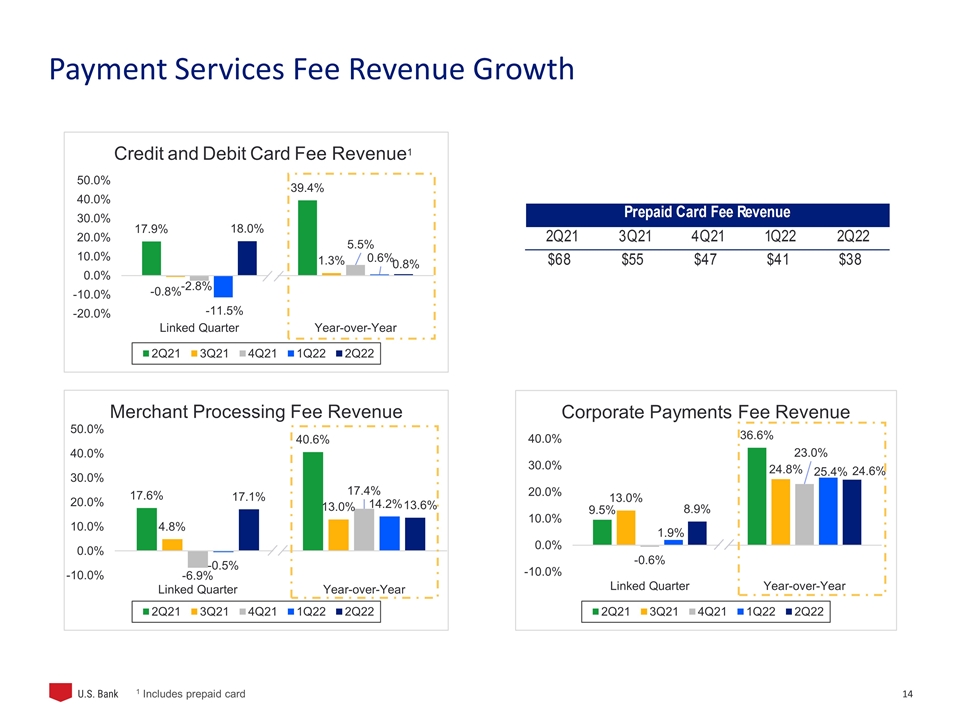
Payment Services Fee Revenue Growth 1 Includes prepaid card
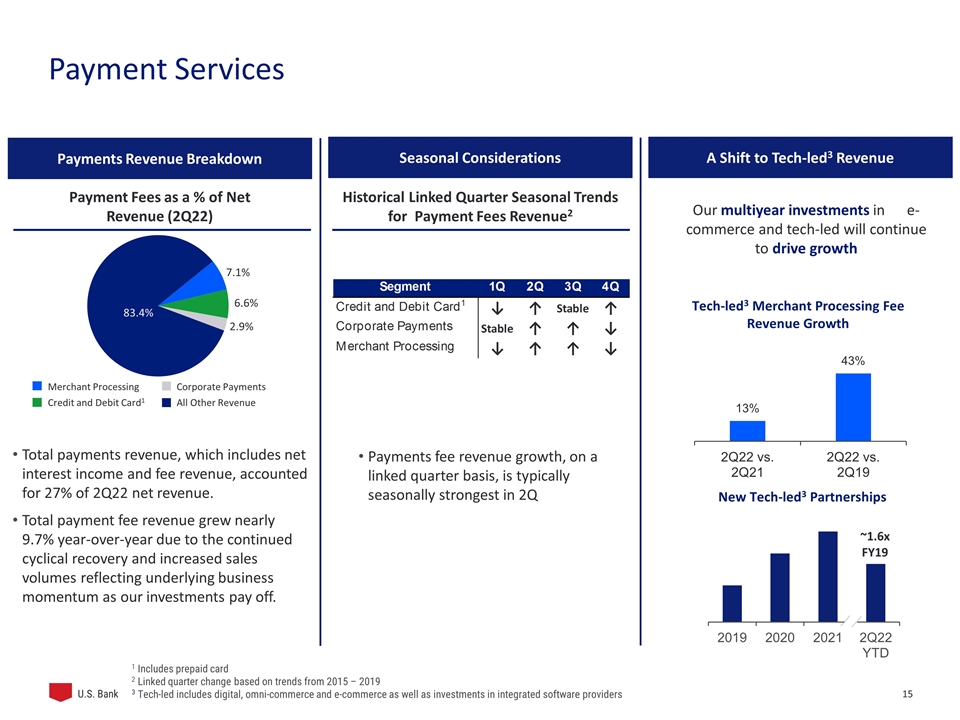
Merchant Processing Credit and Debit Card1 Corporate Payments All Other Revenue Payment Services Payments Revenue Breakdown Total payments revenue, which includes net interest income and fee revenue, accounted for 27% of 2Q22 net revenue. Total payment fee revenue grew nearly 9.7% year-over-year due to the continued cyclical recovery and increased sales volumes reflecting underlying business momentum as our investments pay off. Seasonal Considerations A Shift to Tech-led3 Revenue Historical Linked Quarter Seasonal Trends for Payment Fees Revenue2 1 Includes prepaid card 2 Linked quarter change based on trends from 2015 – 2019 3 Tech-led includes digital, omni-commerce and e-commerce as well as investments in integrated software providers Payment Fees as a % of Net Revenue (2Q22) Payments fee revenue growth, on a linked quarter basis, is typically seasonally strongest in 2Q Our multiyear investments in e-commerce and tech-led will continue to drive growth Tech-led3 Merchant Processing Fee Revenue Growth ~1.6x FY19 New Tech-led3 Partnerships
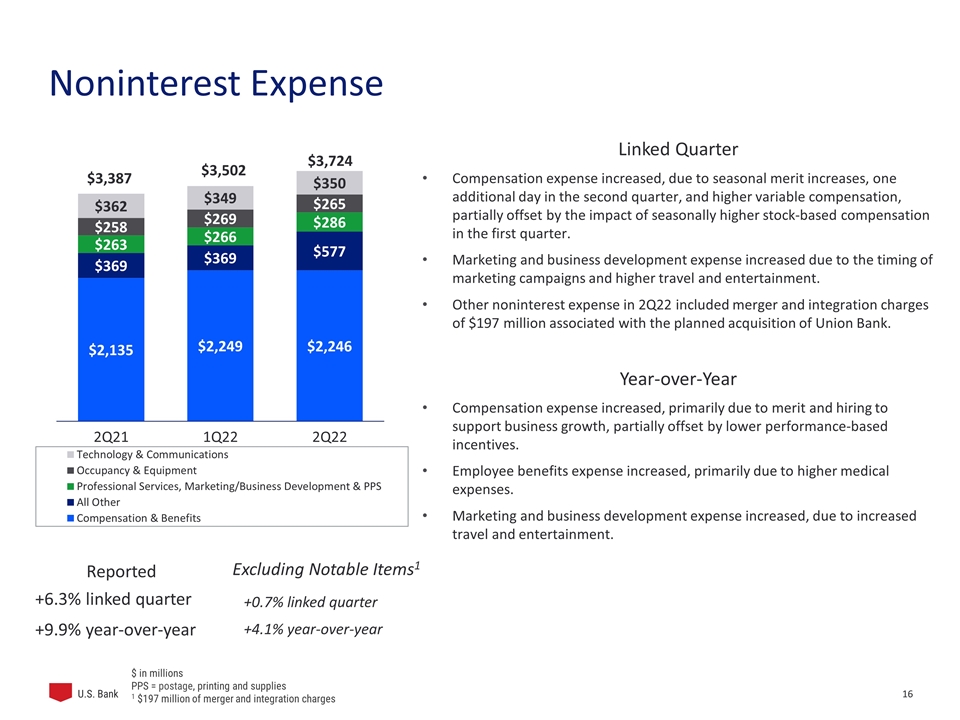
Noninterest Expense +6.3% linked quarter +9.9% year-over-year Linked Quarter Compensation expense increased, due to seasonal merit increases, one additional day in the second quarter, and higher variable compensation, partially offset by the impact of seasonally higher stock-based compensation in the first quarter. Marketing and business development expense increased due to the timing of marketing campaigns and higher travel and entertainment. Other noninterest expense in 2Q22 included merger and integration charges of $197 million associated with the planned acquisition of Union Bank. Year-over-Year Compensation expense increased, primarily due to merit and hiring to support business growth, partially offset by lower performance-based incentives. Employee benefits expense increased, primarily due to higher medical expenses. Marketing and business development expense increased, due to increased travel and entertainment. $ in millions PPS = postage, printing and supplies 1 $197 million of merger and integration charges Reported Excluding Notable Items1 +0.7% linked quarter +4.1% year-over-year
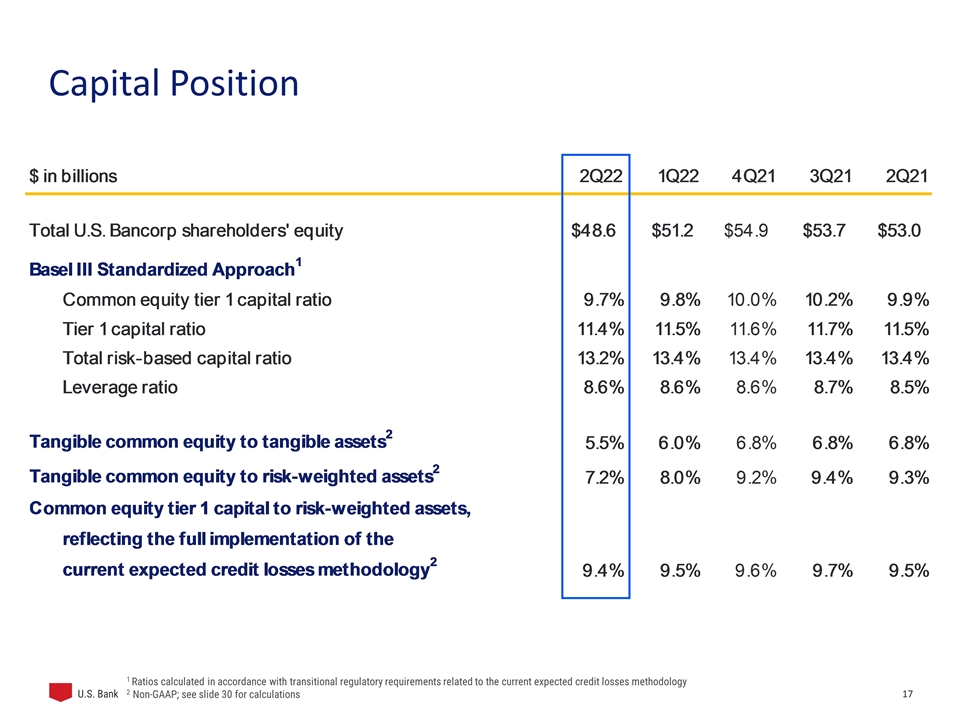
Capital Position 1 Ratios calculated in accordance with transitional regulatory requirements related to the current expected credit losses methodology 2 Non-GAAP; see slide 30 for calculations
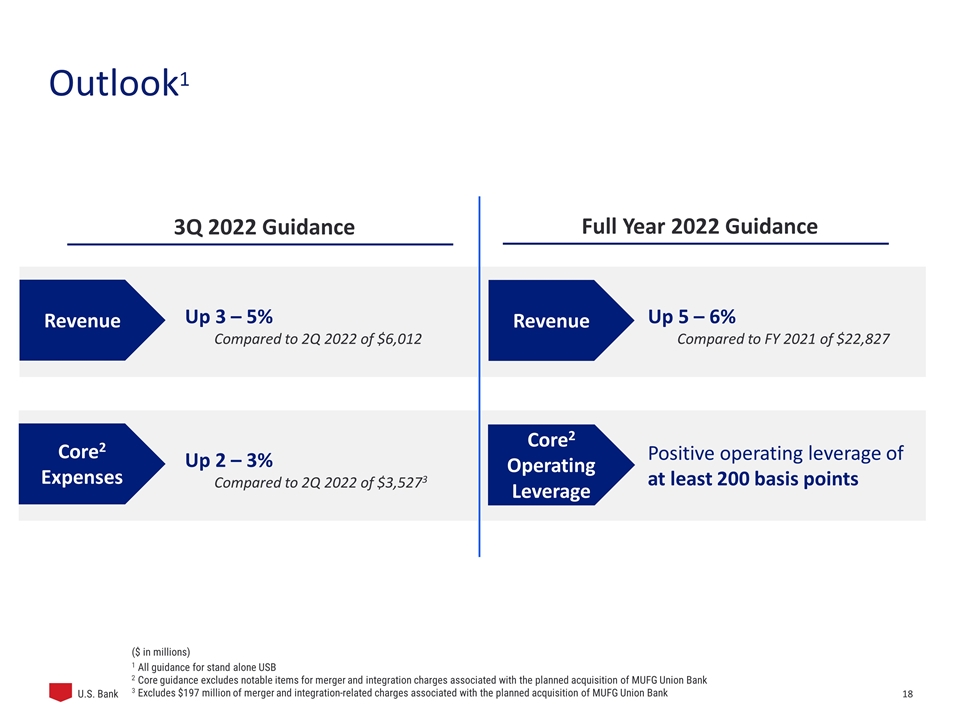
1 All guidance for stand alone USB 2 Core guidance excludes notable items for merger and integration charges associated with the planned acquisition of MUFG Union Bank 3 Excludes $197 million of merger and integration-related charges associated with the planned acquisition of MUFG Union Bank Outlook1 3Q 2022 Guidance Revenue Up 3 – 5% Compared to 2Q 2022 of $6,012 ($ in millions) Core2 Expenses Full Year 2022 Guidance Up 5 – 6% Compared to FY 2021 of $22,827 Positive operating leverage of at least 200 basis points Core2 Operating Leverage Revenue Up 2 – 3% Compared to 2Q 2022 of $3,5273
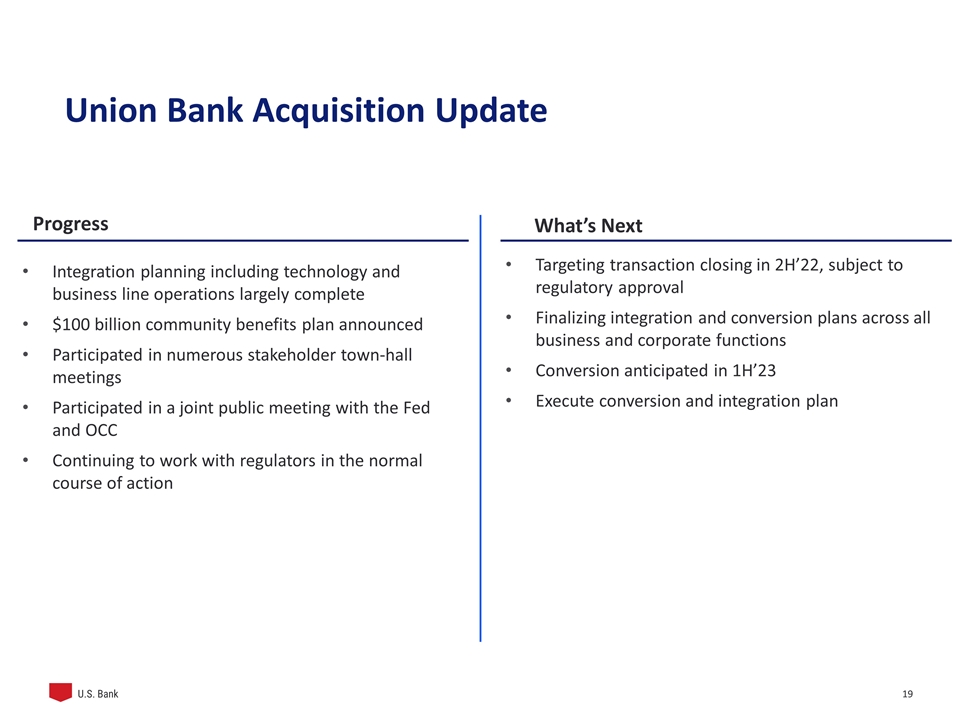
Progress What’s Next Integration planning including technology and business line operations largely complete $100 billion community benefits plan announced Participated in numerous stakeholder town-hall meetings Participated in a joint public meeting with the Fed and OCC Continuing to work with regulators in the normal course of action Targeting transaction closing in 2H’22, subject to regulatory approval Finalizing integration and conversion plans across all business and corporate functions Conversion anticipated in 1H’23 Execute conversion and integration plan Union Bank Acquisition Update
Appendix
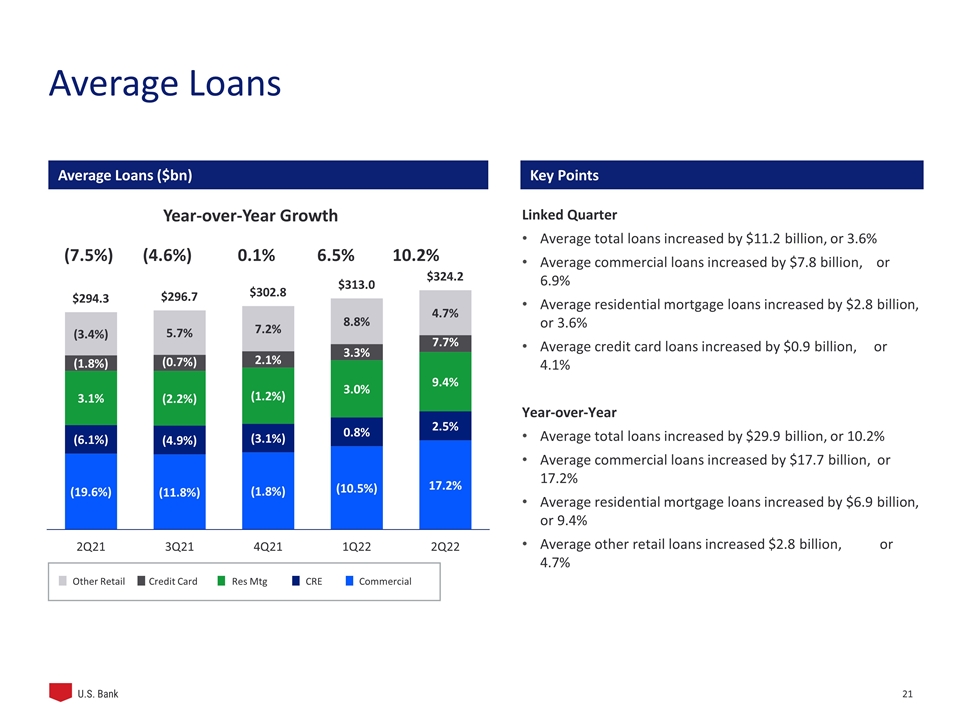
Average Loans Linked Quarter Average total loans increased by $11.2 billion, or 3.6% Average commercial loans increased by $7.8 billion, or 6.9% Average residential mortgage loans increased by $2.8 billion, or 3.6% Average credit card loans increased by $0.9 billion, or 4.1% Year-over-Year Average total loans increased by $29.9 billion, or 10.2% Average commercial loans increased by $17.7 billion, or 17.2% Average residential mortgage loans increased by $6.9 billion, or 9.4% Average other retail loans increased $2.8 billion, or 4.7% Key Points Year-over-Year Growth (7.5%) (4.6%) 0.1% 6.5% 10.2% Commercial CRE Res Mtg Other Retail Credit Card Average Loans ($bn)
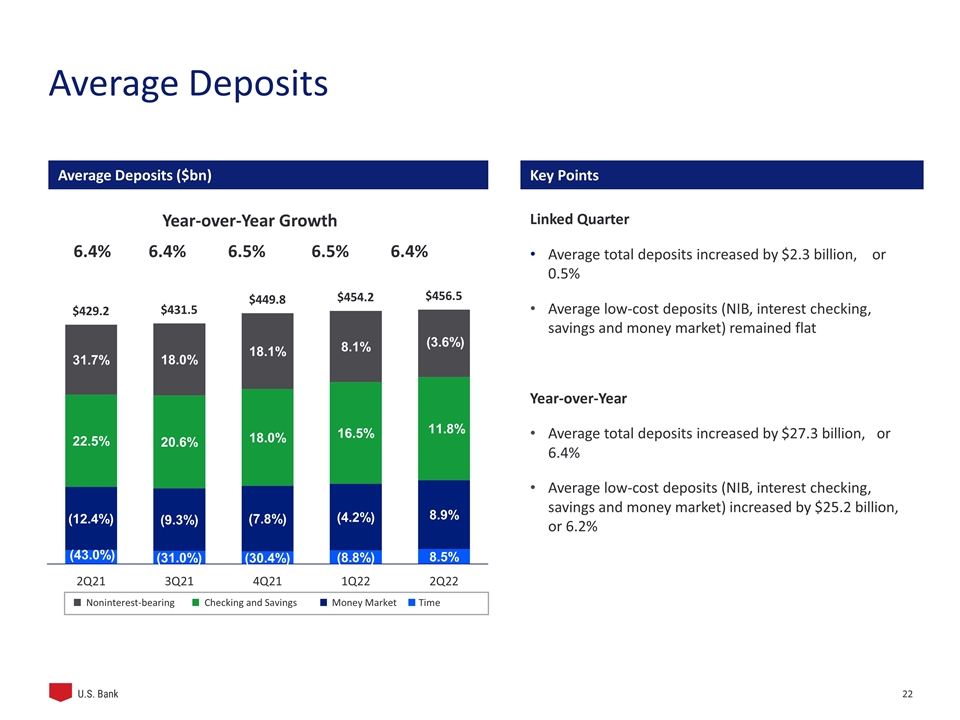
Key Points Year-over-Year Growth 6.4% 6.4% 6.5% 6.5% 6.4% Time Money Market Checking and Savings Noninterest-bearing Average Deposits Average Deposits ($bn) Linked Quarter Average total deposits increased by $2.3 billion, or 0.5% Average low-cost deposits (NIB, interest checking, savings and money market) remained flat Year-over-Year Average total deposits increased by $27.3 billion, or 6.4% Average low-cost deposits (NIB, interest checking, savings and money market) increased by $25.2 billion, or 6.2%
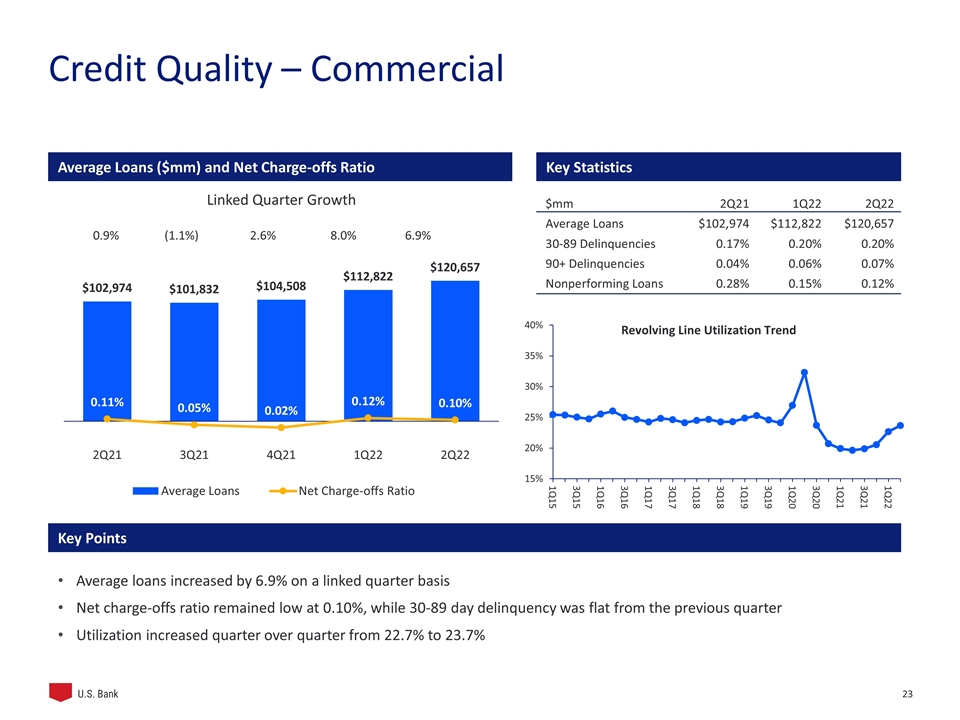
Average Loans ($mm) and Net Charge-offs Ratio Key Statistics Key Points $mm2Q21 1Q22 2Q22 Average Loans$102,974 $112,822 $120,657 30-89 Delinquencies0.17% 0.20% 0.20% 90+ Delinquencies0.04% 0.06% 0.07% Nonperforming Loans0.28% 0.15% 0.12% 0.9% (1.1%) 2.6% 8.0% 6.9% Average loans increased by 6.9% on a linked quarter basis Net charge-offs ratio remained low at 0.10%, while 30-89 day delinquency was flat from the previous quarter Utilization increased quarter over quarter from 22.7% to 23.7% Credit Quality – Commercial Linked Quarter Growth
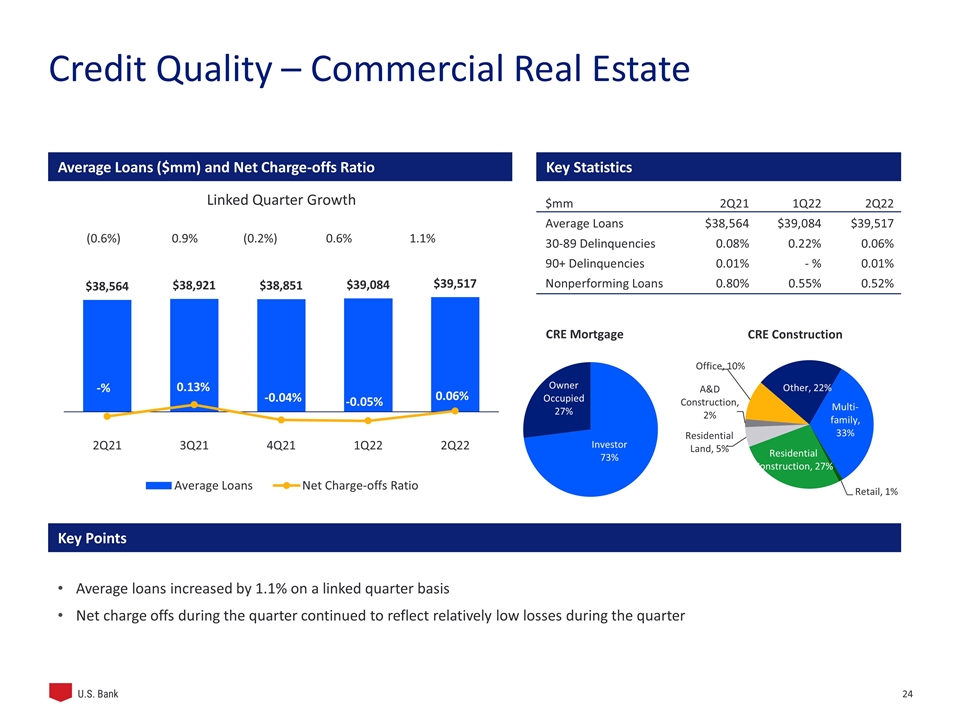
$mm2Q21 1Q22 2Q22 Average Loans$38,564 $39,084 $39,517 30-89 Delinquencies0.08% 0.22%0.06% 90+ Delinquencies0.01%- %0.01% Nonperforming Loans0.80% 0.55% 0.52% Linked Quarter Growth (0.6%) 0.9% (0.2%) 0.6% 1.1% Average loans increased by 1.1% on a linked quarter basis Net charge offs during the quarter continued to reflect relatively low losses during the quarter Key Points Credit Quality – Commercial Real Estate Average Loans ($mm) and Net Charge-offs Ratio Key Statistics
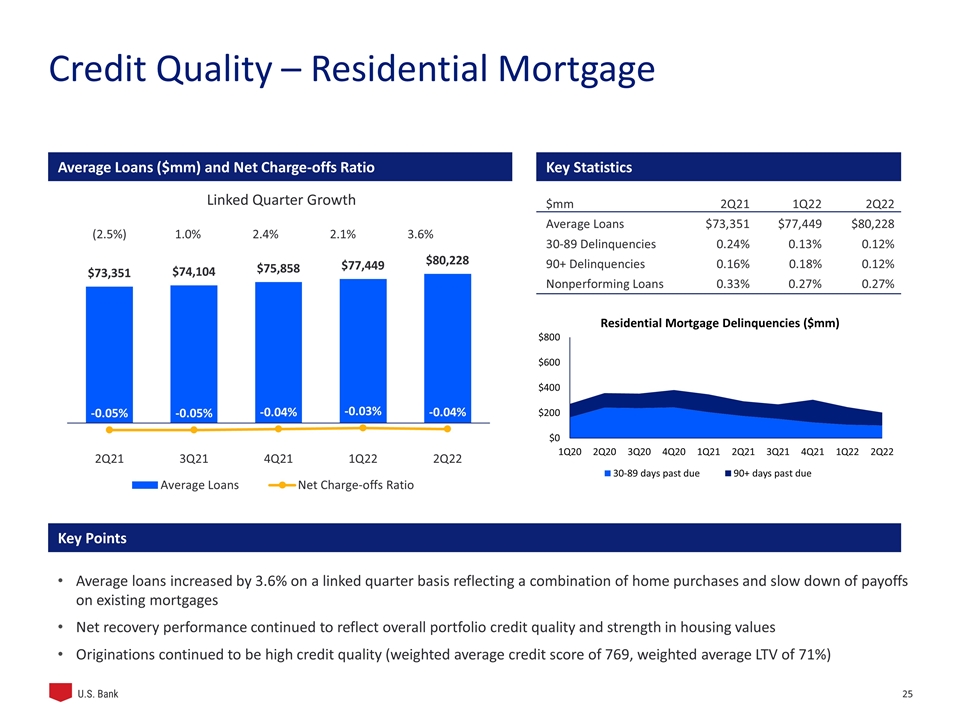
Credit Quality – Residential Mortgage $mm2Q211Q222Q22 Average Loans$73,351 $77,449 $80,228 30-89 Delinquencies0.24%0.13% 0.12% 90+ Delinquencies0.16% 0.18% 0.12% Nonperforming Loans0.33%0.27%0.27% (2.5%) 1.0% 2.4% 2.1% 3.6% Key Points Average loans increased by 3.6% on a linked quarter basis reflecting a combination of home purchases and slow down of payoffs on existing mortgages Net recovery performance continued to reflect overall portfolio credit quality and strength in housing values Originations continued to be high credit quality (weighted average credit score of 769, weighted average LTV of 71%) Linked Quarter Growth Average Loans ($mm) and Net Charge-offs Ratio Key Statistics
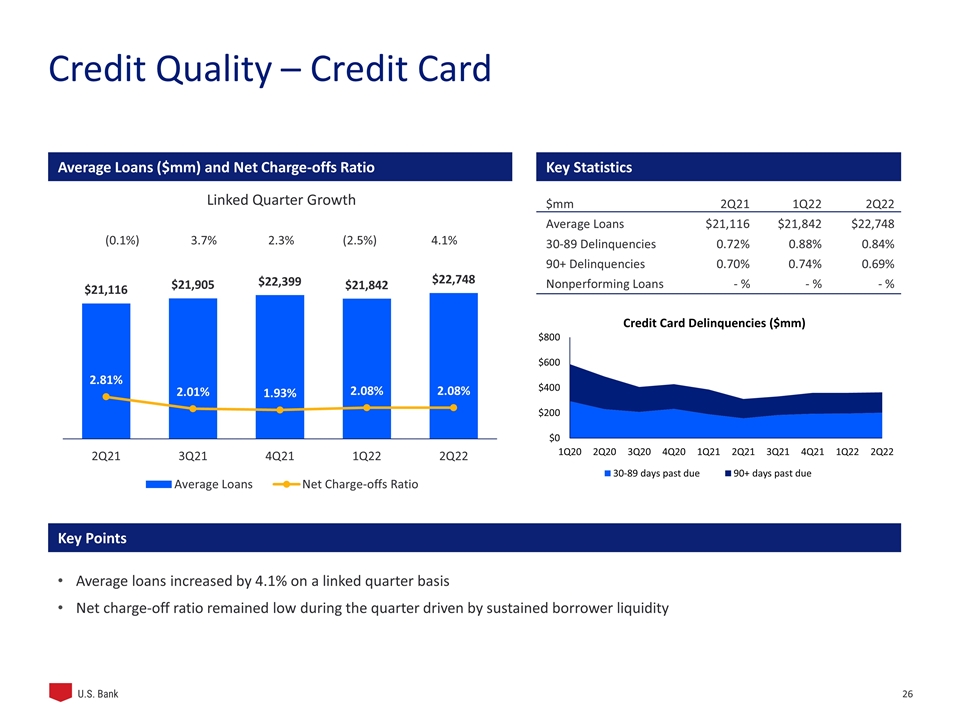
Credit Quality – Credit Card $mm2Q211Q222Q22 Average Loans$21,116 $21,842 $22,748 30-89 Delinquencies0.72% 0.88% 0.84% 90+ Delinquencies0.70%0.74% 0.69% Nonperforming Loans - %- %- % (0.1%) 3.7% 2.3% (2.5%) 4.1% Key Points Linked Quarter Growth Average loans increased by 4.1% on a linked quarter basis Net charge-off ratio remained low during the quarter driven by sustained borrower liquidity Average Loans ($mm) and Net Charge-offs Ratio Key Statistics
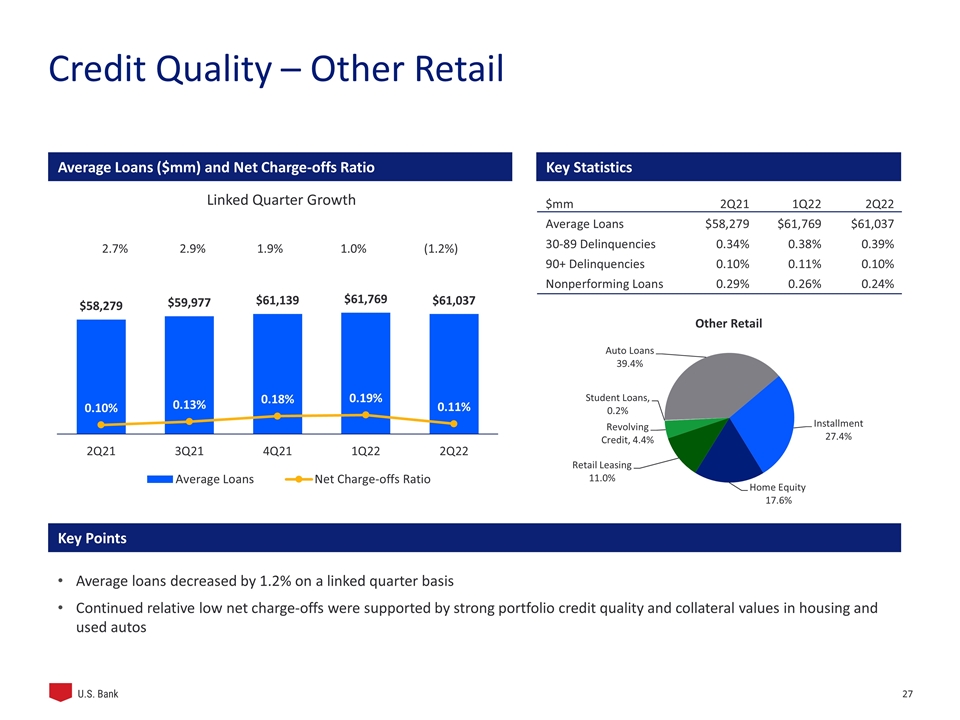
$mm2Q211Q222Q22 Average Loans$58,279 $61,769$61,037 30-89 Delinquencies0.34%0.38% 0.39% 90+ Delinquencies0.10%0.11% 0.10% Nonperforming Loans0.29%0.26% 0.24% 2.7% 2.9% 1.9% 1.0% (1.2%) Credit Quality – Other Retail Key Points Linked Quarter Growth Average loans decreased by 1.2% on a linked quarter basis Continued relative low net charge-offs were supported by strong portfolio credit quality and collateral values in housing and used autos Average Loans ($mm) and Net Charge-offs Ratio Key Statistics
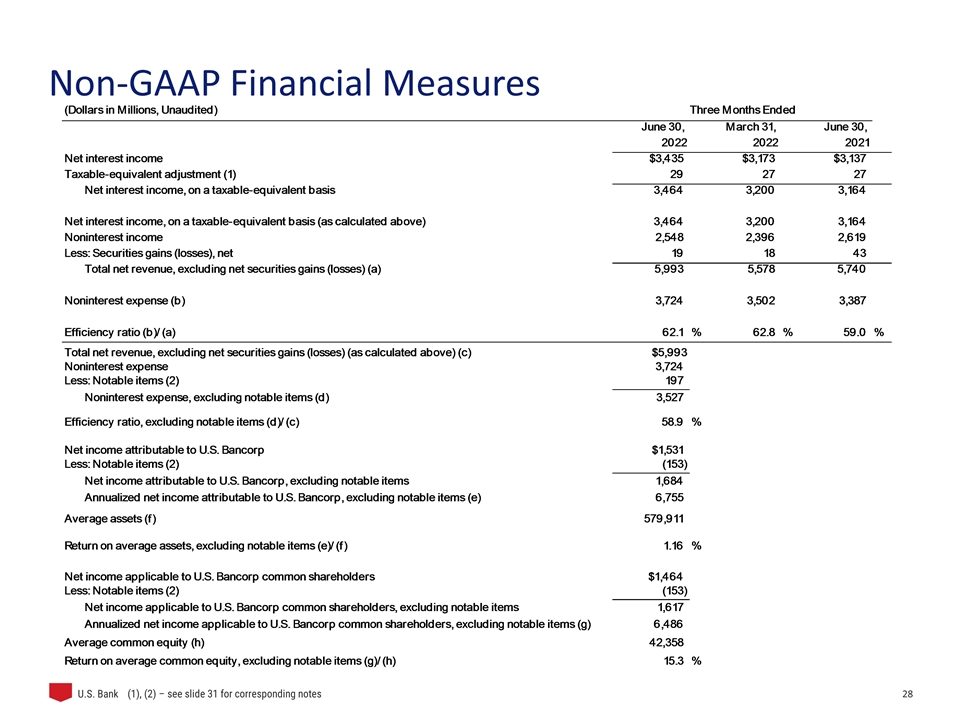
Non-GAAP Financial Measures (1), (2) – see slide 31 for corresponding notes
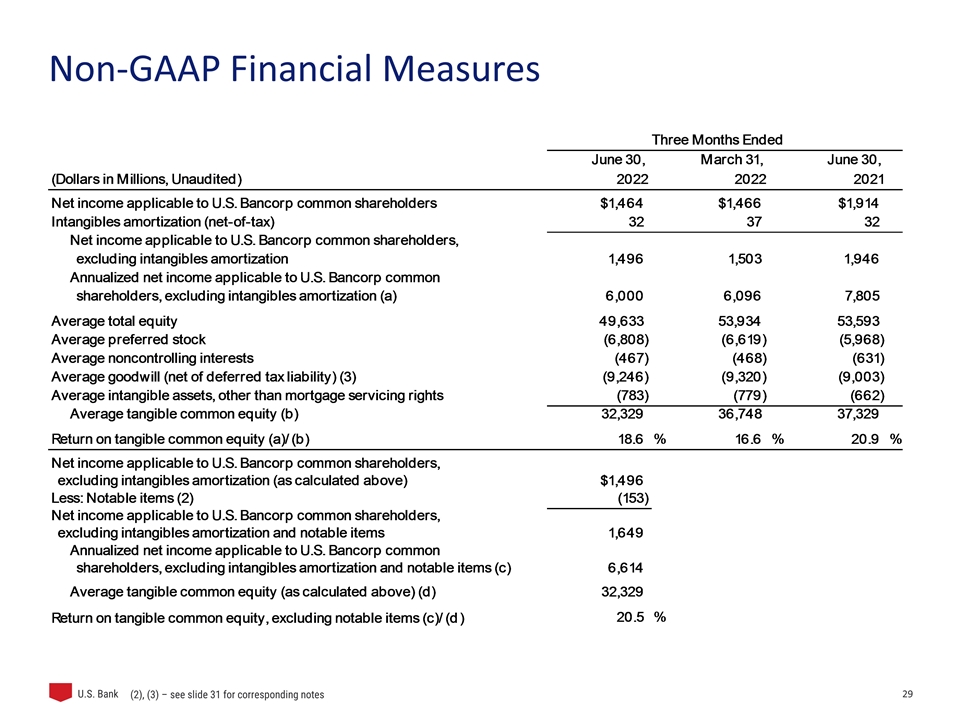
Non-GAAP Financial Measures (2), (3) – see slide 31 for corresponding notes
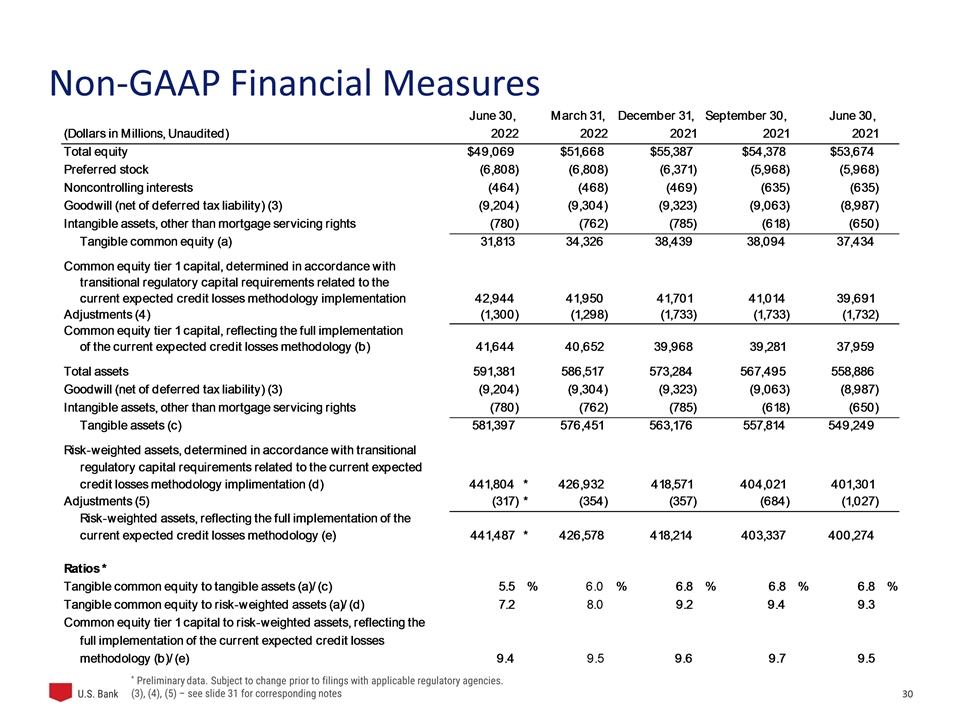
Non-GAAP Financial Measures * Preliminary data. Subject to change prior to filings with applicable regulatory agencies. (3), (4), (5) – see slide 31 for corresponding notes
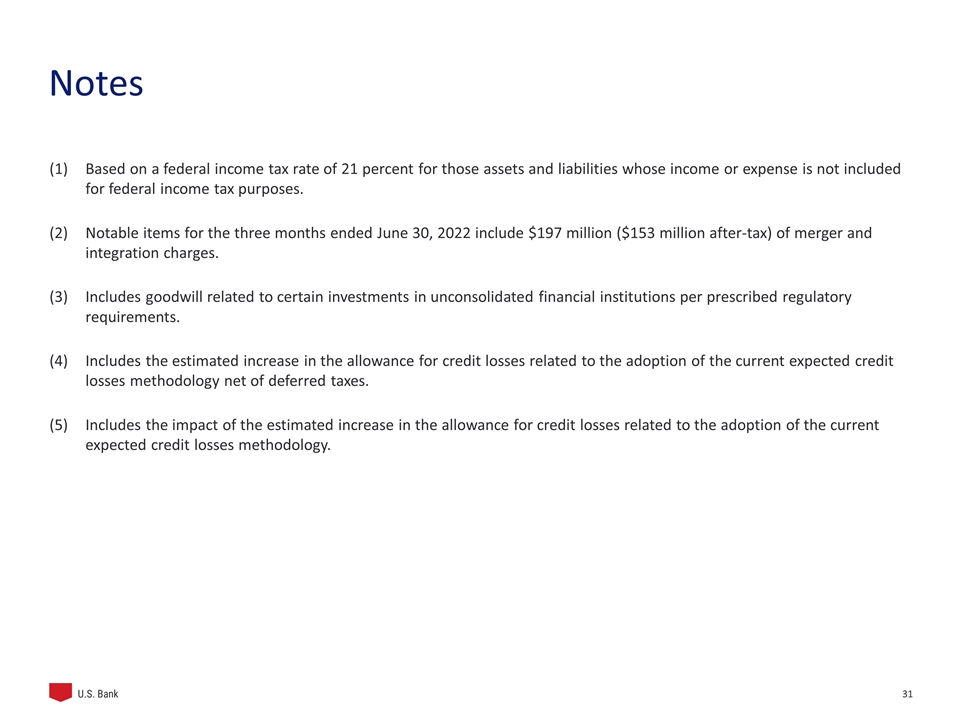
Notes Based on a federal income tax rate of 21 percent for those assets and liabilities whose income or expense is not included for federal income tax purposes. Notable items for the three months ended June 30, 2022 include $197 million ($153 million after-tax) of merger and integration charges. Includes goodwill related to certain investments in unconsolidated financial institutions per prescribed regulatory requirements. Includes the estimated increase in the allowance for credit losses related to the adoption of the current expected credit losses methodology net of deferred taxes. Includes the impact of the estimated increase in the allowance for credit losses related to the adoption of the current expected credit losses methodology.
