 | News Release |
Trustmark Corporation Announces 2014 Financial Results
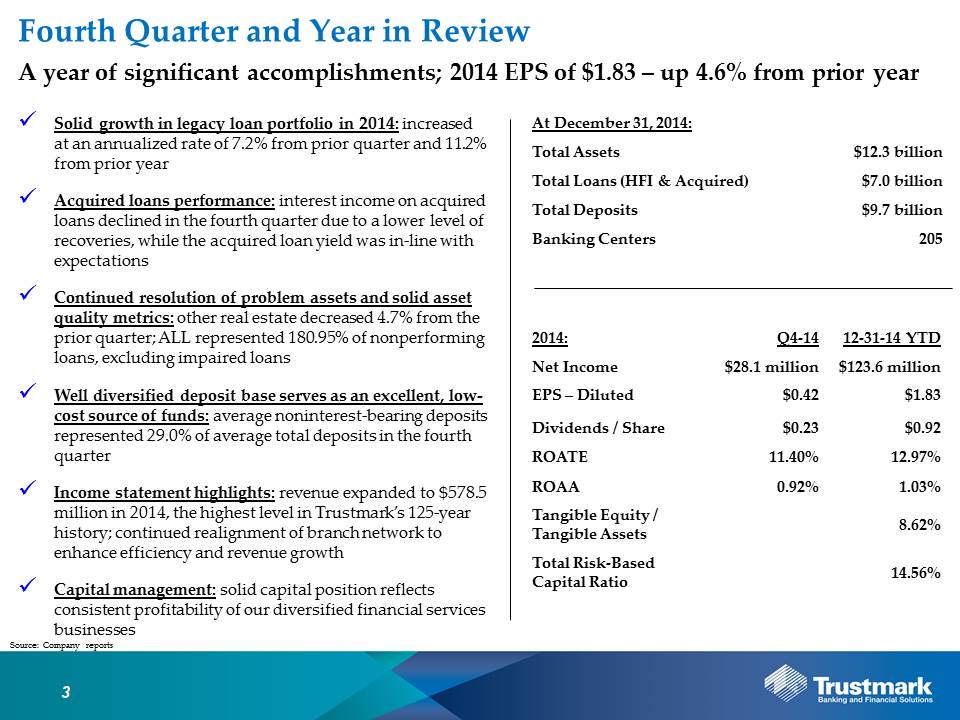
JACKSON, Miss. – January 27, 2015 – Trustmark Corporation (NASDAQ:TRMK) reported net income of $28.1 million in the fourth quarter of 2014, which represented diluted earnings per share of $0.42. For the full year 2014, net income totaled $123.6 million, which resulted in diluted earnings per share of $1.83, an increase of 4.6% from the prior year. Trustmark’s performance during 2014 produced a return on average tangible equity of 12.97% and a return on average assets of 1.03%. Trustmark’s Board of Directors declared a quarterly cash dividend of $0.23 per share payable March 15, 2015, to shareholders of record on March 1, 2015.
Gerard R. Host, President and CEO, stated, “2014 was a year of significant accomplishments for Trustmark. We continued to build upon and expand customer relationships, as reflected by growth in our diversified banking, wealth management and insurance businesses. Over the course of the year, total revenue expanded to $578.5 million, the highest level in Trustmark’s 125-year history. Credit quality continued to improve and remained an important contributor to our financial success. We continued investing in technology to increase revenue, improve efficiency, and ensure compliance with regulatory mandates. We have the necessary infrastructure in place to support a significantly larger organization and are well-positioned to meet the financial needs of our customers and create value for our shareholders.”
Balance Sheet Management
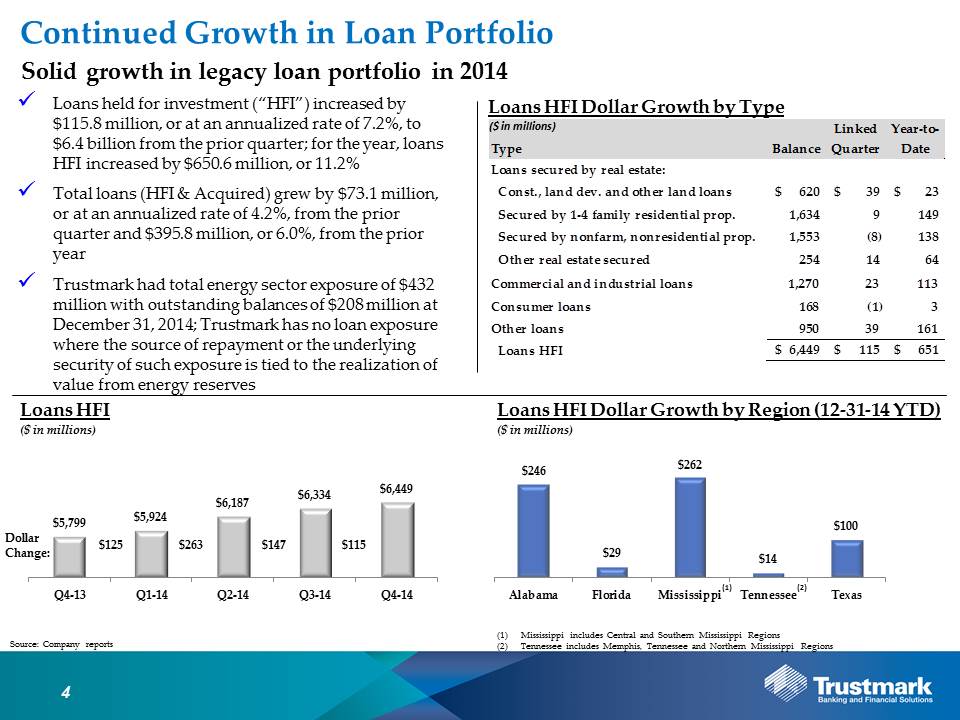
| ● | Loans held for investment increased $650.6 million, or 11.2%, in 2014 |
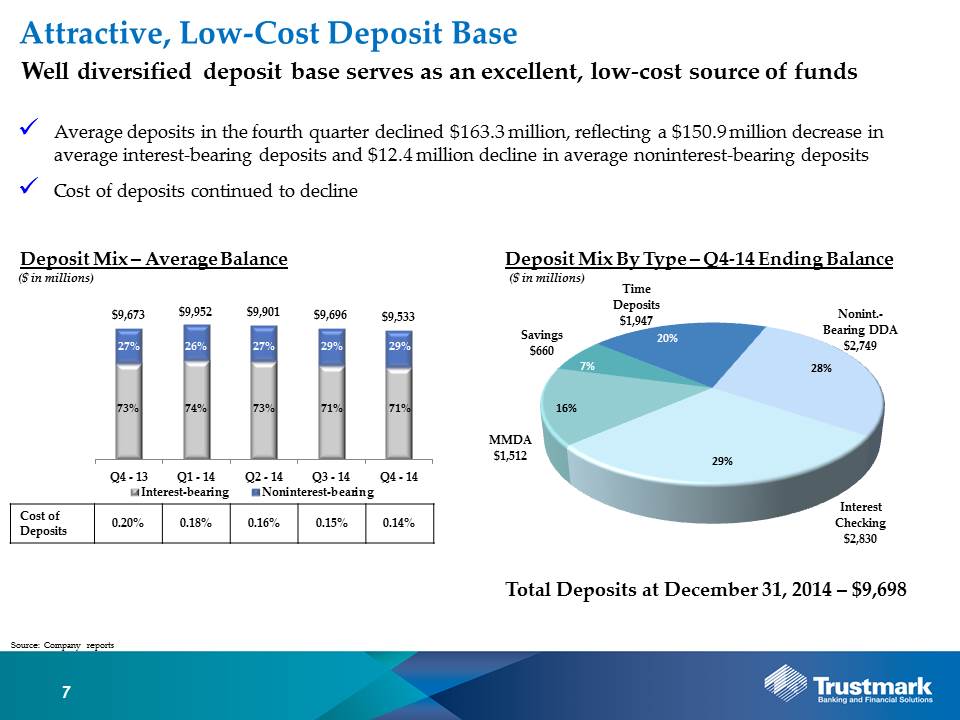
| ● | Average noninterest-bearing deposits represented 29.0% of average total deposits in the fourth quarter |
| ● | Capital base provides opportunity to support additional growth |
Loans held for investment totaled $6.4 billion at December 31, 2014, an increase of $115.8 million, or 7.2% annualized, from the prior quarter and $650.6 million, or 11.2%, from one year earlier. The sequential quarter increase reflected diversified loan growth across Trustmark’s five-state franchise. Construction, land development and other land loans increased $39.1 million during the fourth quarter driven by commercial and residential construction in Trustmark’s Texas, Alabama and Tennessee markets, which was offset in part by reductions in Mississippi. Other loans, which include lending to states and municipalities, nonprofits and real estate investment trusts, increased $38.8 million during the fourth quarter as a result of growth in Trustmark’s Mississippi, Texas and Alabama markets. Commercial and industrial loans increased $23.6 million during the quarter principally due to growth in the Mississippi and Alabama markets. Other real estate secured loans, which include multifamily projects, increased $14.0 million during the quarter as growth in Trustmark’s Mississippi and Alabama markets was offset in part by reductions in Texas. The single-family mortgage portfolio increased $8.9 million during the fourth quarter, reflecting growth in Trustmark’s Alabama and Mississippi markets. Loans secured by nonfarm and nonresidential real estate decreased $7.7 million during the quarter as growth in owner-occupied real estate was more than offset by declines in income producing loans.
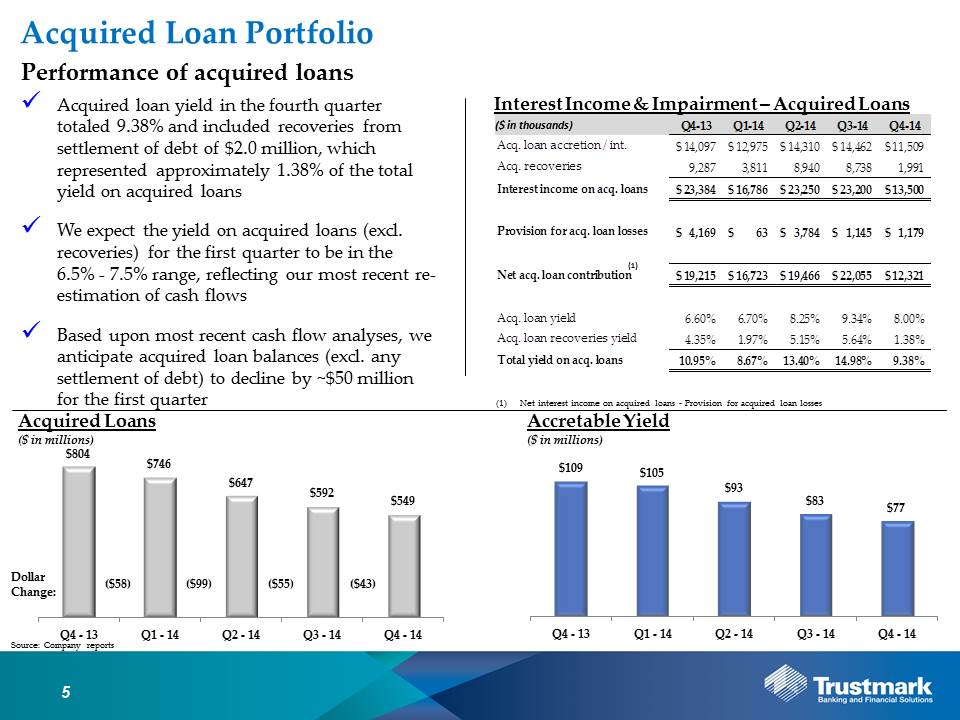
Acquired loans totaled $549.4 million at December 31, 2014, down $42.7 million from the prior quarter. Collectively, loans held for investment and acquired loans totaled $7.0 billion at December 31, 2014, up $73.1 million, or 4.2% annualized, from the prior quarter.
Average earning assets during the fourth quarter increased $58.2 million relative to the prior quarter principally due to increased balances of loans held for investment. Average deposits in the fourth quarter declined $163.3 million, reflecting a $150.9 million decrease in average interest-bearing deposits and $12.4 million decline in average noninterest-bearing deposits.
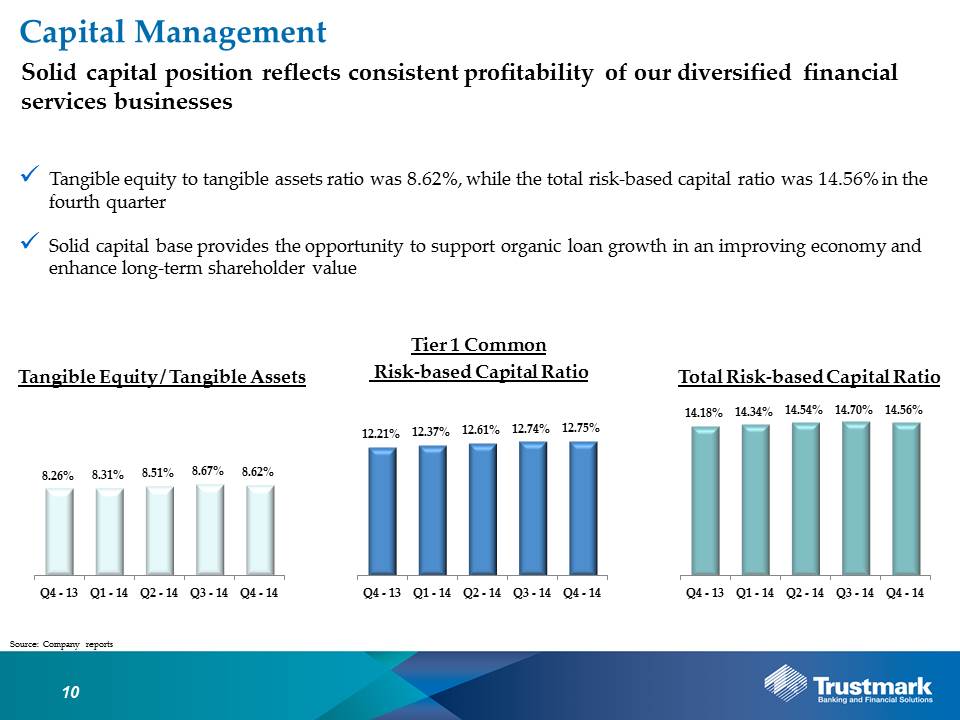
Trustmark’s capital position remained solid, reflecting the consistent profitability of its diversified financial services businesses. At December 31, 2014, Trustmark’s tangible equity to tangible assets ratio was 8.62%, while the total risk-based capital ratio was 14.56%. Trustmark’s solid capital base provides the opportunity to support organic loan growth in an improving economy and enhance long-term shareholder value.
Credit Quality
| ● | Significant improvement in classified and criticized loan balances |
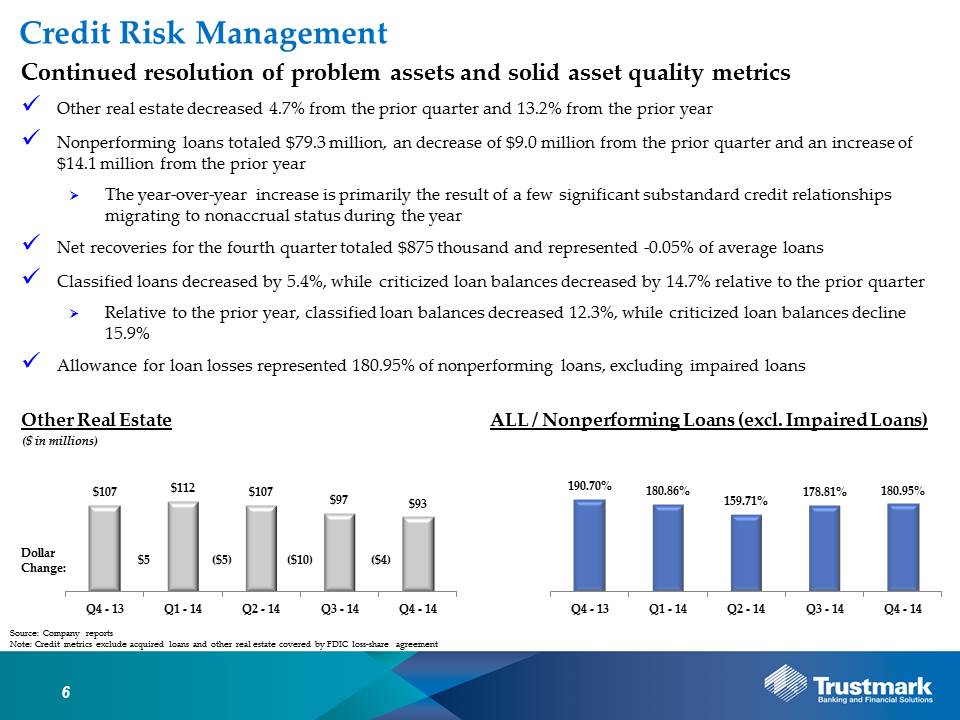
| ● | Other real estate declined 4.7% and 13.2% from the prior quarter and year, respectively |
| ● | Allowance for loan losses represented 180.95% of nonperforming loans, excluding impaired loans |
Nonperforming loans totaled $79.3 million at December 31, 2014, a decrease of $9.0 million from the prior quarter and an increase of $14.1 million from one year earlier. The increase in nonperforming loans year-over-year was primarily the result of a few significant substandard credit relationships migrating to nonaccrual status during the year. Other real estate totaled $92.5 million, a decrease of $4.5 million, or 4.7%, from the prior quarter. Relative to levels one year earlier, other real estate decreased $14.0 million, or 13.2%. Collectively, nonperforming assets totaled $171.9 million, a decrease of $13.5 million from the prior quarter and an increase of $75 thousand from one year earlier.
During the fourth quarter of 2014, recoveries exceeded charge-offs, resulting in a net recovery position of $875 thousand. This compares favorably to the net recovery position in the prior quarter of $428 thousand and net charge-off position of $201 thousand for the comparable period one year earlier. During 2014, Trustmark had a net recovery position of $2.0 million, comparing favorably to a net recovery position of $1.1 million in the prior year. During the fourth quarter of 2014, the provision for loan losses for loans held for investment was a negative $1.4 million; for the year 2014, the provision for loan losses for loans held for investment was $1.2 million compared to a negative $13.4 million for 2013.
During the fourth quarter, Trustmark experienced a 5.4% reduction in classified loan balances and a 14.7% decline in criticized loan balances relative to the prior quarter. When compared to the prior year, classified loan balances decreased 12.3% while criticized loan balances declined 15.9%.
Allocation of Trustmark’s $69.6 million allowance for loan losses represented 1.23% of commercial loans and 0.67% of consumer and home mortgage loans, resulting in an allowance to total loans held for investment of 1.08% at December 31, 2014, which represents a level management considers commensurate with the inherent risk in the loan portfolio. The allowance for loan losses represented 180.95% of nonperforming loans, excluding impaired loans.
All of the above credit quality metrics exclude acquired loans and other real estate covered by FDIC loss-share agreement.
Revenue Generation
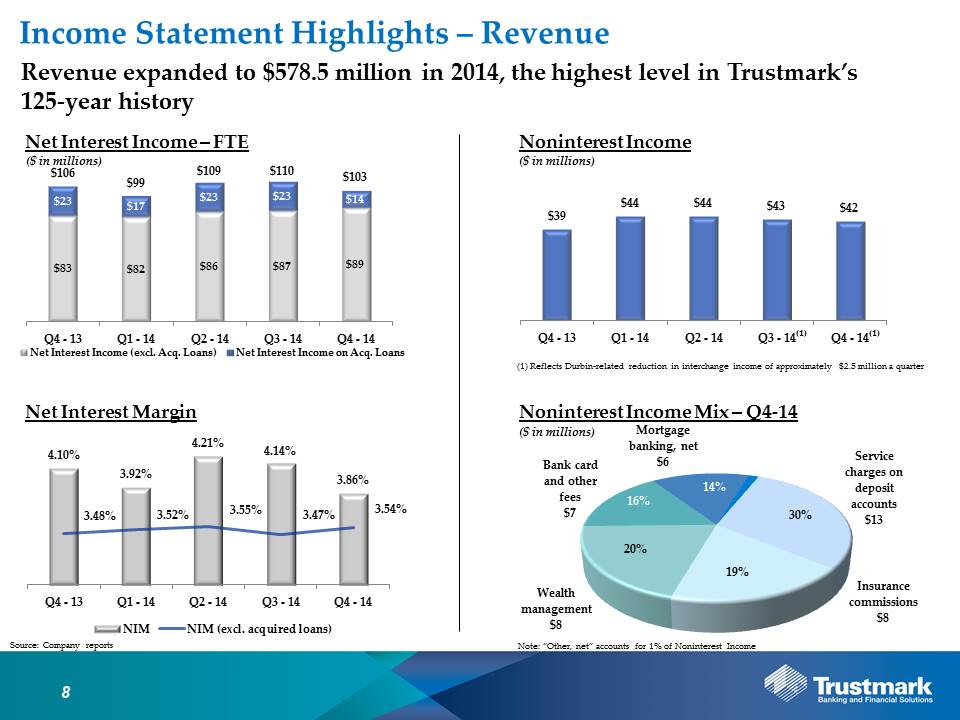
| ● | Total revenue expanded to $578.5 million in 2014 |
| ● | Net interest income (FTE) achieved record level of $421.2 million in 2014 |
| ● | Insurance and wealth management revenue increased 8.6% and 9.7%, respectively, during the year |
Net interest income (FTE) in the fourth quarter totaled $103.1 million, resulting in a net interest margin of 3.86%. Relative to the prior quarter, interest income (FTE) decreased $7.2 million due principally to a $6.7 million decline in recoveries on acquired loans. The yield on acquired loans in the fourth quarter totaled 9.38% and included recoveries from settlement of debt of $2.0 million, which represented approximately 1.38% of the total acquired annualized loan yield in the fourth quarter. Excluding acquired loans, the net interest margin in the fourth quarter totaled 3.54% and included $2.2 million (eight basis points) of yield maintenance payments on prepaid securities. Net interest income (FTE) in 2014 totaled $421.2 million, an increase of 4.4% from the prior year; the net interest margin (FTE) was 4.03% in 2014 compared to 4.01% in 2013.
Noninterest income totaled $42.0 million in the fourth quarter, a decrease of 2.0% from the prior quarter and an increase of 8.7% from levels one year earlier. Total noninterest income in 2014 was $173.1 million, down 0.4% from the prior year. Bank card and other fees totaled $6.7 million in the fourth quarter, a decrease of 7.8% from the prior quarter and 29.9% from the comparable period one year earlier, reflecting the impact of decreased interchange income as a result of Trustmark becoming subject to debit card interchange fee standards effective July 1, 2014. Service charges on deposit accounts totaled $12.5 million, a decline of 1.8% from the prior quarter and 4.6% from the comparable period one year earlier; the decline was attributable to a reduction in NSF and overdraft fees resulting from changes in customer practices.
Insurance revenue in the fourth quarter totaled $7.8 million, reflecting a seasonal decrease of 15.2% relative to the prior quarter and an increase of 6.6% from levels one year earlier. Improved performance year-over-year resulted from increasing business development efforts. Insurance revenue totaled $33.5 million in 2014, an increase of 8.6% relative to the prior year.
Wealth management revenue totaled $8.5 million in the fourth quarter, an increase of 5.3% from the prior quarter and 3.9% from the comparable period one year earlier. This growth was attributable to improved profitability within the trust management business as well as increased sales within investment services resulting from improved market conditions. Wealth management revenue in 2014 totaled $32.3 million, an increase of 9.7% relative to the prior year.
Mortgage banking revenue in the fourth quarter totaled $5.9 million, an increase of 1.3% relative to the prior quarter and 14.1% from the comparable period one year earlier. Mortgage loan production in the fourth quarter totaled $293.8 million, reflecting a seasonal decrease of 14.9% from the prior quarter and an increase of 6.5% from levels one year earlier due to expanded originations in Trustmark’s Alabama markets. Mortgage loan production in 2014 totaled $1.2 billion, a decline of 17.8% from levels in 2013, while mortgage banking revenue declined 26.0% to $24.8 million principally due to lower secondary marketing gains resulting from tightening mortgage spreads and reduced volume.
Noninterest Expense
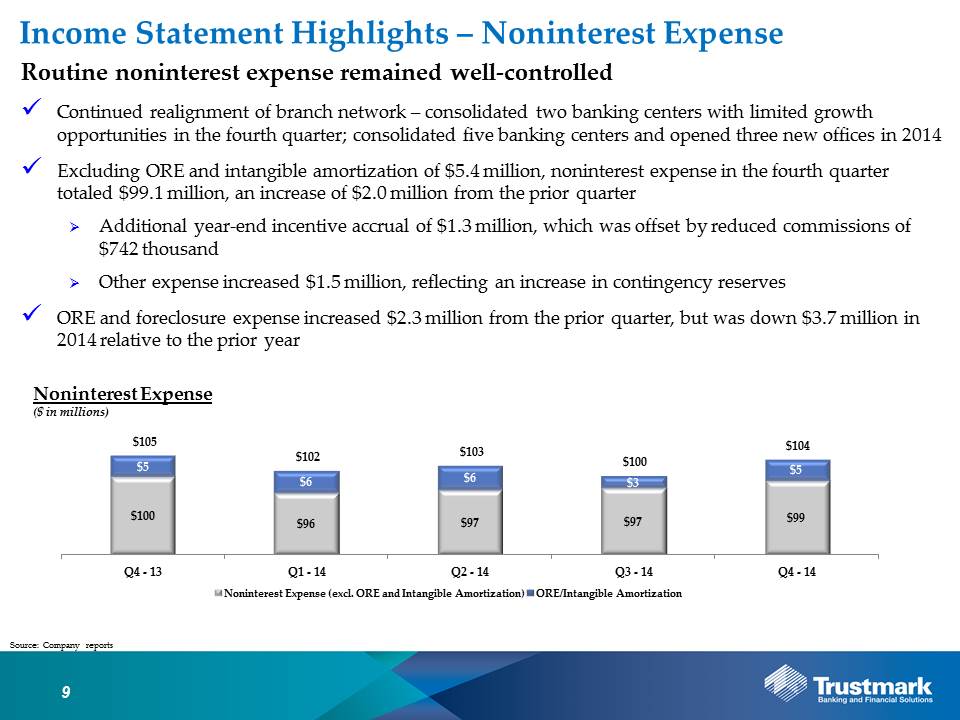
| ● | Routine noninterest expense remained well-controlled |
| ● | Continued realignment of branch network to enhance efficiency and revenue growth |
| ● | Tax credit investments reduced the effective tax rate to 23.8% in 2014 |
Noninterest expense totaled $104.4 million in the fourth quarter. Excluding ORE expense and intangible amortization of $5.4 million, noninterest expense during the fourth quarter totaled $99.1 million, an increase of $2.0 million from comparable expenses in the prior quarter. The increase during the quarter was primarily reflected in salaries and benefits and other expenses. Salaries and benefits reflected an increase of $484 thousand, which included an additional year-end incentive accrual of $1.3 million offset by reductions in commissions of $742 thousand. Other expense increased $1.5 million, which was principally attributable to contingency reserves. Noninterest expense in 2014 totaled $409.0 million, a decrease of 1.6% relative to the prior year.
Trustmark continued realignment of its branch network to enhance productivity and efficiency as well as promote additional revenue growth. During the fourth quarter, Trustmark consolidated two banking centers with limited growth opportunities. Over the course of 2014, Trustmark consolidated five banking centers and opened three new offices – one each in Birmingham and Montgomery, Alabama, and Memphis, Tennessee. Trustmark is committed to investments to support profitable revenue growth as well as reengineering and efficiency opportunities to enhance shareholder value.
Additional Information
As previously announced, Trustmark will conduct a conference call with analysts on Wednesday, January 28, 2015, at 10:00 a.m. Central Time to discuss the Corporation’s financial results. Interested parties may listen to the conference call by dialing (877) 317-3051 or by clicking on the link provided under the Investor Relations section of our website at www.trustmark.com, which will also include a slide presentation Management will review during the conference call. A replay of the conference call will also be available through Wednesday, February 11, 2015, in archived format at the same web address or by calling (877) 344-7529, passcode 10058131.
Trustmark Corporation is a financial services company providing banking and financial solutions through 205 offices in Alabama, Florida, Mississippi, Tennessee and Texas.
Forward-Looking Statements
Certain statements contained in this document constitute forward-looking statements within the meaning of the Private Securities Litigation Reform Act of 1995. You can identify forward-looking statements by words such as “may,” “hope,” “will,” “should,” “expect,” “plan,” “anticipate,” “intend,” “believe,” “estimate,” “predict,” “potential,” “continue,” “could,” “future” or the negative of those terms or other words of similar meaning. You should read statements that contain these words carefully because they discuss our future expectations or state other “forward-looking” information. These forward-looking statements include, but are not limited to, statements relating to anticipated future operating and financial performance measures, including net interest margin, credit quality, business initiatives, growth opportunities and growth rates, among other things, and encompass any estimate, prediction, expectation, projection, opinion, anticipation, outlook or statement of belief included therein as well as the management assumptions underlying these forward-looking statements. You should be aware that the occurrence of the events described under the caption “Risk Factors” in Trustmark’s filings with the Securities and Exchange Commission could have an adverse effect on our business, results of operations and financial condition. Should one or more of these risks materialize, or should any such underlying assumptions prove to be significantly different, actual results may vary significantly from those anticipated, estimated, projected or expected.
Risks that could cause actual results to differ materially from current expectations of Management include, but are not limited to, changes in the level of nonperforming assets and charge-offs, local, state and national economic and market conditions, including the extent and duration of the current volatility in the credit and financial markets, changes in our ability to measure the fair value of assets in our portfolio, material changes in the level and/or volatility of market interest rates, the performance and demand for the products and services we offer, including the level and timing of withdrawals from our deposit accounts, the costs and effects of litigation and of unexpected or adverse outcomes in such litigation, our ability to attract noninterest-bearing deposits and other low-cost funds, competition in loan and deposit pricing, as well as the entry of new competitors into our markets through de novo expansion and acquisitions, economic conditions, and monetary and other governmental actions designed to address the level and volatility of interest rates and the volatility of securities, currency and other markets, the enactment of legislation and changes in existing regulations, or enforcement practices, or the adoption of new regulations, changes in accounting standards and practices, including changes in the interpretation of existing standards, that affect our consolidated financial statements, changes in consumer spending, borrowings and savings habits, technological changes, changes in the financial performance or condition of our borrowers, changes in our ability to control expenses, changes in our compensation and benefit plans, greater than expected costs or difficulties related to the integration of acquisitions or new products and lines of business, natural disasters, environmental disasters, acts of war or terrorism, and other risks described in our filings with the Securities and Exchange Commission.
Although we believe that the expectations reflected in such forward-looking statements are reasonable, we can give no assurance that such expectations will prove to be correct. Except as required by law, we undertake no obligation to update or revise any of this information, whether as the result of new information, future events or developments or otherwise.
Trustmark Investor Contacts:
Louis E. Greer
Treasurer and
Principal Financial Officer
601-208-2310
F. Joseph Rein, Jr.
Senior Vice President
601-208-6898
Trustmark Media Contact:
Melanie A. Morgan
Senior Vice President
601-208-2979
The following table is a summary of the estimated fair value of securities available for sale and the amortized cost of securities held to maturity ($ in thousands):
| | | 12/31/2014 | | | 9/30/2014 | | | 6/30/2014 | | | 3/31/2014 | | | 12/31/2013 | |
| SECURITIES AVAILABLE FOR SALE | | | | | | | | | | | | | | | |
| U.S. Treasury securities | | $ | 100 | | | $ | 100 | | | $ | 100 | | | $ | 100 | | | $ | 502 | |
| U.S. Government agency obligations | | | | | | | | | | | | | | | | | | | | |
| Issued by U.S. Government agencies | | | 79,656 | | | | 83,011 | | | | 117,489 | | | | 123,368 | | | | 129,293 | |
| Issued by U.S. Government sponsored agencies | | | 32,818 | | | | 30,779 | | | | 40,848 | | | | 40,601 | | | | 40,179 | |
| Obligations of states and political subdivisions | | | 162,258 | | | | 165,463 | | | | 171,229 | | | | 172,437 | | | | 171,738 | |
| Mortgage-backed securities | | | | | | | | | | | | | | | | | | | | |
| Residential mortgage pass-through securities | | | | | | | | | | | | | | | | | | | | |
| Guaranteed by GNMA | | | 12,427 | | | | 12,828 | | | | 13,492 | | | | 14,263 | | | | 14,474 | |
| Issued by FNMA and FHLMC | | | 204,441 | | | | 213,420 | | | | 225,229 | | | | 232,488 | | | | 241,118 | |
| Other residential mortgage-backed securities | | | | | | | | | | | | | | | | | | | | |
| Issued or guaranteed by FNMA, FHLMC, or GNMA | | | 1,661,833 | | | | 1,603,138 | | | | 1,543,619 | | | | 1,530,068 | | | | 1,290,741 | |
| Commercial mortgage-backed securities | | | | | | | | | | | | | | | | | | | | |
| Issued or guaranteed by FNMA, FHLMC, or GNMA | | | 189,334 | | | | 221,641 | | | | 229,283 | | | | 232,072 | | | | 242,172 | |
| Asset-backed securities and structured financial products | | | 31,700 | | | | 33,515 | | | | 35,142 | | | | 37,044 | | | | 63,937 | |
| Total securities available for sale | | $ | 2,374,567 | | | $ | 2,363,895 | | | $ | 2,376,431 | | | $ | 2,382,441 | | | $ | 2,194,154 | |
| | | | | | | | | | | | | | | | | | | | | |
| SECURITIES HELD TO MATURITY | | | | | | | | | | | | | | | | | | | | |
| U.S. Government agency obligations | | | | | | | | | | | | | | | | | | | | |
| Issued by U.S. Government sponsored agencies | | $ | 100,971 | | | $ | 100,767 | | | $ | 100,563 | | | $ | 100,361 | | | $ | 100,159 | |
| Obligations of states and political subdivisions | | | 63,505 | | | | 64,538 | | | | 65,193 | | | | 65,757 | | | | 65,987 | |
| Mortgage-backed securities | | | | | | | | | | | | | | | | | | | | |
| Residential mortgage pass-through securities | | | | | | | | | | | | | | | | | | | | |
| Guaranteed by GNMA | | | 19,115 | | | | 13,368 | | | | 13,959 | | | | 12,177 | | | | 9,433 | |
| Issued by FNMA and FHLMC | | | 11,437 | | | | 11,816 | | | | 12,165 | | | | 12,395 | | | | 12,724 | |
| Other residential mortgage-backed securities | | | | | | | | | | | | | | | | | | | | |
| Issued or guaranteed by FNMA, FHLMC, or GNMA | | | 834,176 | | | | 836,966 | | | | 822,444 | | | | 822,135 | | | | 837,393 | |
| Commercial mortgage-backed securities | | | | | | | | | | | | | | | | | | | | |
| Issued or guaranteed by FNMA, FHLMC, or GNMA | | | 141,481 | | | | 142,185 | | | | 142,466 | | | | 142,744 | | | | 143,032 | |
| Total securities held to maturity | | $ | 1,170,685 | | | $ | 1,169,640 | | | $ | 1,156,790 | | | $ | 1,155,569 | | | $ | 1,168,728 | |
During the fourth quarter of 2013, Trustmark reclassified approximately $1.099 billion of securities available for sale to securities held to maturity. The securities were transferred at fair value, which became the cost basis for the securities held to maturity. At the date of transfer, the net unrealized holding loss on the available for sale securities totaled approximately $46.6 million ($28.8 million, net of tax). The net unrealized holding loss is amortized over the remaining life of the securities as a yield adjustment in a manner consistent with the amortization or accretion of the original purchase premium or discount on the associated security. There were no gains or losses recognized as a result of the transfer. At December 31, 2014, the net unamortized, unrealized loss on the transferred securities included in accumulated other comprehensive (loss) income in the accompanying balance sheet totaled approximately $40.4 million ($24.9 million, net of tax).
During the fourth quarter of 2013, Trustmark sold $135.6 million of Collateralized Loan Obligations (CLO) generating a net gain of $1.3 million. These securities were identified as available for sale and had been carried in the asset-backed securities and structured financial products line item in the table shown above. This sale left Trustmark with a CLO balance of $25.9 million at December 31, 2013, which was subsequently sold in its entirety for a gain of $389 thousand in January 2014.
Management continues to focus on asset quality as one of the strategic goals of the securities portfolio, which is evidenced by the investment of approximately 93% of the portfolio in GSE-backed obligations and other Aaa rated securities as determined by Moody’s. None of the securities owned by Trustmark are collateralized by assets which are considered sub-prime. Furthermore, outside of stock ownership in the Federal Home Loan Bank of Dallas, Federal Home Loan Bank of Atlanta and Federal Reserve Bank, Trustmark does not hold any other equity investment in a GSE.
 | TRUSTMARK CORPORATION AND SUBSIDIARIES NOTES TO CONSOLIDATED FINANCIALS |
Note 2 – Loan Composition
| LHFI BY TYPE (excluding acquired loans) | | 12/31/2014 | | | 9/30/2014 | | | 6/30/2014 | | | 3/31/2014 | | | 12/31/2013 | |
| Loans secured by real estate: | | | | | | | | | | | | | | | |
| Construction, land development and other land loans | | $ | 619,877 | | | $ | 580,794 | | | $ | 531,651 | | | $ | 592,658 | | | $ | 596,889 | |
| Secured by 1-4 family residential properties | | | 1,634,397 | | | | 1,625,480 | | | | 1,581,859 | | | | 1,533,781 | | | | 1,485,564 | |
| Secured by nonfarm, nonresidential properties | | | 1,553,193 | | | | 1,560,901 | | | | 1,544,516 | | | | 1,461,947 | | | | 1,415,139 | |
| Other real estate secured | | | 253,787 | | | | 239,819 | | | | 250,383 | | | | 193,221 | | | | 189,362 | |
| Commercial and industrial loans | | | 1,270,350 | | | | 1,246,753 | | | | 1,250,146 | | | | 1,207,367 | | | | 1,157,614 | |
| Consumer loans | | | 167,964 | | | | 168,813 | | | | 165,372 | | | | 160,153 | | | | 165,308 | |
| Other loans | | | 949,901 | | | | 911,091 | | | | 863,073 | | | | 774,639 | | | | 789,005 | |
| LHFI | | | 6,449,469 | | | | 6,333,651 | | | | 6,187,000 | | | | 5,923,766 | | | | 5,798,881 | |
| Allowance for loan losses | | | (69,616 | ) | | | (70,134 | ) | | | (66,648 | ) | | | (67,518 | ) | | | (66,448 | ) |
| Net LHFI | | $ | 6,379,853 | | | $ | 6,263,517 | | | $ | 6,120,352 | | | $ | 5,856,248 | | | $ | 5,732,433 | |
| ACQUIRED NONCOVERED LOANS BY TYPE | | 12/31/2014 | | | 9/30/2014 | | | 6/30/2014 | | | 3/31/2014 | | | 12/31/2013 | |
| Loans secured by real estate: | | | | | | | | | | | | | | | |
| Construction, land development and other land loans | | $ | 58,309 | | | $ | 64,808 | | | $ | 75,353 | | | $ | 88,683 | | | $ | 98,928 | |
| Secured by 1-4 family residential properties | | | 116,920 | | | | 120,366 | | | | 133,191 | | | | 145,213 | | | | 157,914 | |
| Secured by nonfarm, nonresidential properties | | | 202,323 | | | | 214,806 | | | | 226,967 | | | | 271,696 | | | | 287,136 | |
| Other real estate secured | | | 27,813 | | | | 28,036 | | | | 30,918 | | | | 34,787 | | | | 33,948 | |
| Commercial and industrial loans | | | 88,256 | | | | 103,185 | | | | 114,212 | | | | 135,114 | | | | 149,495 | |
| Consumer loans | | | 9,772 | | | | 11,236 | | | | 14,733 | | | | 15,024 | | | | 18,428 | |
| Other loans | | | 22,390 | | | | 22,105 | | | | 21,537 | | | | 23,130 | | | | 24,141 | |
| Noncovered loans | | | 525,783 | | | | 564,542 | | | | 616,911 | | | | 713,647 | | | | 769,990 | |
| Allowance for loan losses | | | (10,541 | ) | | | (11,136 | ) | | | (9,770 | ) | | | (9,952 | ) | | | (7,249 | ) |
| Net noncovered loans | | $ | 515,242 | | | $ | 553,406 | | | $ | 607,141 | | | $ | 703,695 | | | $ | 762,741 | |
| ACQUIRED COVERED LOANS BY TYPE | | 12/31/2014 | | | 9/30/2014 | | | 6/30/2014 | | | 3/31/2014 | | | 12/31/2013 | |
| Loans secured by real estate: | | | | | | | | | | | | | | | |
| Construction, land development and other land loans | | $ | 1,197 | | | $ | 1,721 | | | $ | 2,130 | | | $ | 2,239 | | | $ | 2,363 | |
| Secured by 1-4 family residential properties | | | 13,180 | | | | 14,114 | | | | 14,565 | | | | 15,572 | | | | 16,416 | |
| Secured by nonfarm, nonresidential properties | | | 7,672 | | | | 8,270 | | | | 8,831 | | | | 10,629 | | | | 10,945 | |
| Other real estate secured | | | 1,096 | | | | 2,949 | | | | 2,376 | | | | 2,470 | | | | 2,644 | |
| Commercial and industrial loans | | | 277 | | | | 327 | | | | 336 | | | | 361 | | | | 394 | |
| Consumer loans | | | - | | | | - | | | | - | | | | 49 | | | | 119 | |
| Other loans | | | 204 | | | | 226 | | | | 1,390 | | | | 1,350 | | | | 1,335 | |
| Covered loans | | | 23,626 | | | | 27,607 | | | | 29,628 | | | | 32,670 | | | | 34,216 | |
| Allowance for loan losses | | | (1,518 | ) | | | (813 | ) | | | (1,409 | ) | | | (588 | ) | | | (2,387 | ) |
| Net covered loans | | $ | 22,108 | | | $ | 26,794 | | | $ | 28,219 | | | $ | 32,082 | | | $ | 31,829 | |
| | TRUSTMARK CORPORATION AND SUBSIDIARIES NOTES TO CONSOLIDATED FINANCIALS |
| Note 2 – Loan Composition (continued) | | | | | | | | | | | | | | | | | | |
| | | December 31, 2014 | |
LHFI - COMPOSITION BY REGION (1) | | Total | | | Alabama | | | Florida | | | Mississippi (Central and Southern Regions) | | | Tennessee (Memphis, TN and Northern MS Regions) | | | Texas | |
| Loans secured by real estate: | | | | | | | | | | | | | | | | | | |
| Construction, land development and other land loans | | $ | 619,877 | | | $ | 65,331 | | | $ | 61,688 | | | $ | 236,571 | | | $ | 44,165 | | | $ | 212,122 | |
| Secured by 1-4 family residential properties | | | 1,634,397 | | | | 41,779 | | | | 51,169 | | | | 1,396,497 | | | | 127,872 | | | | 17,080 | |
| Secured by nonfarm, nonresidential properties | | | 1,553,193 | | | | 91,507 | | | | 168,941 | | | | 776,102 | | | | 150,489 | | | | 366,154 | |
| Other real estate secured | | | 253,787 | | | | 13,017 | | | | 4,438 | | | | 174,275 | | | | 26,653 | | | | 35,404 | |
| Commercial and industrial loans | | | 1,270,350 | | | | 84,244 | | | | 10,881 | | | | 820,428 | | | | 95,117 | | | | 259,680 | |
| Consumer loans | | | 167,964 | | | | 16,483 | | | | 2,307 | | | | 129,489 | | | | 16,990 | | | | 2,695 | |
| Other loans | | | 949,901 | | | | 56,204 | | | | 46,156 | | | | 690,005 | | | | 59,517 | | | | 98,019 | |
| Loans | | $ | 6,449,469 | | | $ | 368,565 | | | $ | 345,580 | | | $ | 4,223,367 | | | $ | 520,803 | | | $ | 991,154 | |
| | | | | | | | | | | | | | | | | | | | | | | | | |
| | | | | | | | | | | | | | | | | | | | | | | | | |
| | | | | | | | | | | | | | | | | | | | | | | | | |
CONSTRUCTION, LAND DEVELOPMENT AND OTHER LAND LOANS BY REGION (1) | | | | | | | | | | | | | | | | | |
| Lots | | $ | 48,056 | | | $ | 4,697 | | | $ | 24,764 | | | $ | 13,402 | | | $ | 1,975 | | | $ | 3,218 | |
| Development | | | 50,745 | | | | 764 | | | | 6,997 | | | | 33,732 | | | | 920 | | | | 8,332 | |
| Unimproved land | | | 114,106 | | | | 6,607 | | | | 22,619 | | | | 50,104 | | | | 22,744 | | | | 12,032 | |
| 1-4 family construction | | | 136,693 | | | | 22,108 | | | | 7,160 | | | | 69,888 | | | | 3,926 | | | | 33,611 | |
| Other construction | | | 270,277 | | | | 31,155 | | | | 148 | | | | 69,445 | | | | 14,600 | | | | 154,929 | |
| Construction, land development and other land loans | | $ | 619,877 | | | $ | 65,331 | | | $ | 61,688 | | | $ | 236,571 | | | $ | 44,165 | | | $ | 212,122 | |
| | | | | | | | | | | | | | | | | | | | | | | | | |
| | | | | | | | | | | | | | | | | | | | | | | | | |
| | | | | | | | | | | | | | | | | | | | | | | | | |
| | | | | | | | | | | | | | | | | | | | | | | | | |
LOANS SECURED BY NONFARM, NONRESIDENTIAL PROPERTIES BY REGION (1) | | | | | | | | | | |
| Income producing: | | | | | | | | | | | | | | | | | | | | | | | | |
| Retail | | $ | 189,291 | | | $ | 19,701 | | | $ | 41,904 | | | $ | 63,464 | | | $ | 16,887 | | | $ | 47,335 | |
| Office | | | 202,804 | | | | 10,254 | | | | 41,803 | | | | 81,629 | | | | 8,089 | | | | 61,029 | |
| Nursing homes/assisted living | | | 114,769 | | | | - | | | | - | | | | 89,654 | | | | 5,974 | | | | 19,141 | |
| Hotel/motel | | | 111,998 | | | | 11,700 | | | | 18,013 | | | | 38,238 | | | | 33,934 | | | | 10,113 | |
| Industrial | | | 46,423 | | | | 5,409 | | | | 4,892 | | | | 11,581 | | | | 1,130 | | | | 23,411 | |
| Health care | | | 25,949 | | | | 2,414 | | | | - | | | | 23,498 | | | | 37 | | | | - | |
| Convenience stores | | | 10,679 | | | | 245 | | | | - | | | | 5,491 | | | | 1,238 | | | | 3,705 | |
| Other | | | 147,212 | | | | 4,942 | | | | 18,269 | | | | 67,990 | | | | 9,054 | | | | 46,957 | |
| Total income producing loans | | | 849,125 | | | | 54,665 | | | | 124,881 | | | | 381,545 | | | | 76,343 | | | | 211,691 | |
| | | | | | | | | | | | | | | | | | | | | | | | | |
| Owner-occupied: | | | | | | | | | | | | | | | | | | | | | | | | |
| Office | | | 128,248 | | | | 6,554 | | | | 16,831 | | | | 63,820 | | | | 10,617 | | | | 30,426 | |
| Churches | | | 98,364 | | | | 3,839 | | | | 3,195 | | | | 49,382 | | | | 31,599 | | | | 10,349 | |
| Industrial warehouses | | | 116,876 | | | | 3,338 | | | | 4,037 | | | | 62,513 | | | | 7,677 | | | | 39,311 | |
| Health care | | | 112,555 | | | | 14,333 | | | | 8,535 | | | | 63,308 | | | | 7,519 | | | | 18,860 | |
| Convenience stores | | | 50,561 | | | | 504 | | | | 1,546 | | | | 32,873 | | | | 2,766 | | | | 12,872 | |
| Retail | | | 38,566 | | | | 2,014 | | | | 4,101 | | | | 25,754 | | | | 3,339 | | | | 3,358 | |
| Restaurants | | | 31,566 | | | | 1,621 | | | | 1,984 | | | | 23,147 | | | | 3,613 | | | | 1,201 | |
| Auto dealerships | | | 7,847 | | | | - | | | | 100 | | | | 6,196 | | | | 1,529 | | | | 22 | |
| Other | | | 119,485 | | | | 4,639 | | | | 3,731 | | | | 67,564 | | | | 5,487 | | | | 38,064 | |
| Total owner-occupied loans | | | 704,068 | | | | 36,842 | | | | 44,060 | | | | 394,557 | | | | 74,146 | | | | 154,463 | |
| Loans secured by nonfarm, nonresidential properties | | $ | 1,553,193 | | | $ | 91,507 | | | $ | 168,941 | | | $ | 776,102 | | | $ | 150,489 | | | $ | 366,154 | |
| | | | | | | | | | | | | | | | | | | | | | | | | |
| (1) Excludes acquired loans. | | | | | | | | | | | | | | | | | | | | | | | | |
| | TRUSTMARK CORPORATION AND SUBSIDIARIES NOTES TO CONSOLIDATED FINANCIALS |
Note 3 – Yields on Earning Assets and Interest-Bearing Liabilities
The following table illustrates the yields on earning assets by category as well as the rates paid on interest-bearing liabilities on a tax equivalent basis:
| | | Quarter Ended | | | Year Ended | |
| | | 12/31/2014 | | | 9/30/2014 | | | 6/30/2014 | | | 3/31/2014 | | | 12/31/2013 | | | 12/31/2014 | | | 12/31/2013 | |
| Securities – taxable | | | 2.59 | % | | | 2.35 | % | | | 2.35 | % | | | 2.39 | % | | | 2.30 | % | | | 2.42 | % | | | 2.27 | % |
| Securities – nontaxable | | | 4.20 | % | | | 4.20 | % | | | 4.27 | % | | | 4.31 | % | | | 4.28 | % | | | 4.24 | % | | | 4.32 | % |
| Securities – total | | | 2.67 | % | | | 2.44 | % | | | 2.45 | % | | | 2.50 | % | | | 2.40 | % | | | 2.52 | % | | | 2.38 | % |
| Loans - LHFI & LHFS | | | 4.32 | % | | | 4.36 | % | | | 4.53 | % | | | 4.51 | % | | | 4.55 | % | | | 4.43 | % | | | 4.68 | % |
| Acquired loans | | | 9.38 | % | | | 14.98 | % | | | 13.40 | % | | | 8.67 | % | | | 10.95 | % | | | 11.52 | % | | | 9.11 | % |
| Loans - total | | | 4.73 | % | | | 5.29 | % | | | 5.43 | % | | | 5.00 | % | | | 5.36 | % | | | 5.11 | % | | | 5.24 | % |
| FF sold & rev repo | | | 0.94 | % | | | 0.84 | % | | | 0.91 | % | | | 0.31 | % | | | 0.50 | % | | | 0.63 | % | | | 0.37 | % |
| Other earning assets | | | 3.16 | % | | | 3.66 | % | | | 4.19 | % | | | 4.13 | % | | | 4.53 | % | | | 3.73 | % | | | 4.20 | % |
| Total earning assets | | | 4.05 | % | | | 4.34 | % | | | 4.42 | % | | | 4.15 | % | | | 4.35 | % | | | 4.24 | % | | | 4.27 | % |
| | | | | | | | | | | | | | | | | | | | | | | | | | | | | |
| Interest-bearing deposits | | | 0.20 | % | | | 0.21 | % | | | 0.22 | % | | | 0.24 | % | | | 0.27 | % | | | 0.22 | % | | | 0.28 | % |
| FF pch & repo | | | 0.14 | % | | | 0.13 | % | | | 0.11 | % | | | 0.11 | % | | | 0.11 | % | | | 0.13 | % | | | 0.12 | % |
| Other borrowings | | | 1.20 | % | | | 1.88 | % | | | 3.07 | % | | | 2.99 | % | | | 2.96 | % | | | 1.94 | % | | | 3.05 | % |
| Total interest-bearing liabilities | | | 0.26 | % | | | 0.27 | % | | | 0.28 | % | | | 0.30 | % | | | 0.33 | % | | | 0.28 | % | | | 0.34 | % |
| | | | | | | | | | | | | | | | | | | | | | | | | | | | | |
| Net interest margin | | | 3.86 | % | | | 4.14 | % | | | 4.21 | % | | | 3.92 | % | | | 4.10 | % | | | 4.03 | % | | | 4.01 | % |
| Net interest margin excluding acquired loans | | | 3.54 | % | | | 3.47 | % | | | 3.55 | % | | | 3.52 | % | | | 3.48 | % | | | 3.52 | % | | | 3.55 | % |
Reflected in the table above are yields on earning assets and liabilities, along with the net interest margin which equals reported net interest income-FTE, annualized, as a percent of average earning assets. In addition, the table includes net interest margin excluding acquired loans, which equals reported net interest income-FTE excluding interest income on acquired loans, annualized, as a percent of average earning assets excluding average acquired loans. The net interest margin decreased 28 basis points during the fourth quarter of 2014 primarily due to a decline in recoveries on acquired loans from $8.7 million during the third quarter of 2014 to $2.0 million during the fourth quarter of 2014, which was partially offset by yield maintenance payments on prepaid securities of $2.2 million.
Excluding the recoveries on acquired loans, the yield on average acquired loans totaled 8.0% during the fourth quarter of 2014. The net interest margin, excluding acquired loans and yield maintenance payments on prepaid securities, totaled 3.46% during the fourth quarter of 2014.
Note 4 – Mortgage Banking
Trustmark utilizes a portfolio of exchange-traded derivative instruments, such as Treasury note futures contracts and option contracts, to achieve a fair value return that offsets the changes in fair value of mortgage servicing rights (MSR) attributable to interest rates. These transactions are considered freestanding derivatives that do not otherwise qualify for hedge accounting under generally accepted accounting principles (GAAP). Changes in the fair value of these exchange-traded derivative instruments, including administrative costs, are recorded in noninterest income in mortgage banking, net and are offset by the changes in the fair value of the MSR. The MSR fair value represents the present value of future cash flows, which among other things includes decay and the effect of changes in interest rates. Ineffectiveness of hedging the MSR fair value is measured by comparing the change in value of hedge instruments to the change in the fair value of the MSR asset attributable to changes in interest rates and other market driven changes in valuation inputs and assumptions. The impact of this strategy resulted in a net positive ineffectiveness of $61 thousand and $1.0 million for the quarters ended December 31, 2014 and 2013, respectively.
The following table illustrates the components of mortgage banking revenues included in noninterest income in the accompanying income statements:
| | | Quarter Ended | | | Year Ended | |
| | | 12/31/2014 | | | 9/30/2014 | | | 6/30/2014 | | | 3/31/2014 | | | 12/31/2013 | | | 12/31/2014 | | | 12/31/2013 | |
| Mortgage servicing income, net | | $ | 4,814 | | | $ | 4,674 | | | $ | 4,592 | | | $ | 4,539 | | | $ | 4,688 | | | $ | 18,619 | | | $ | 17,892 | |
| Change in fair value-MSR from runoff | | | (1,999 | ) | | | (2,364 | ) | | | (2,391 | ) | | | (1,812 | ) | | | (2,182 | ) | | | (8,566 | ) | | | (9,805 | ) |
| Gain on sales of loans, net | | | 2,910 | | | | 3,272 | | | | 2,749 | | | | 1,839 | | | | 2,202 | | | | 10,770 | | | | 26,429 | |
| Other, net | | | 132 | | | | (323 | ) | | | 695 | | | | 400 | | | | (533 | ) | | | 904 | | | | (4,719 | ) |
| Mortgage banking income before hedge ineffectiveness | | | 5,857 | | | | 5,259 | | | | 5,645 | | | | 4,966 | | | | 4,175 | | | | 21,727 | | | | 29,797 | |
| Change in fair value-MSR from market changes | | | (4,142 | ) | | | 700 | | | | (3,038 | ) | | | (723 | ) | | | 3,937 | | | | (7,203 | ) | | | 11,818 | |
| Change in fair value of derivatives | | | 4,203 | | | | (117 | ) | | | 3,584 | | | | 2,586 | | | | (2,926 | ) | | | 10,256 | | | | (8,111 | ) |
| Net positive hedge ineffectiveness | | | 61 | | | | 583 | | | | 546 | | | | 1,863 | | | | 1,011 | | | | 3,053 | | | | 3,707 | |
| Mortgage banking, net | | $ | 5,918 | | | $ | 5,842 | | | $ | 6,191 | | | $ | 6,829 | | | $ | 5,186 | | | $ | 24,780 | | | $ | 33,504 | |
| | TRUSTMARK CORPORATION AND SUBSIDIARIES NOTES TO CONSOLIDATED FINANCIALS |
Note 5 – Other Noninterest Income and Expense
Other noninterest income consisted of the following for the periods presented ($ in thousands):
| | | Quarter Ended | | | Year Ended | |
| | | 12/31/2014 | | | 9/30/2014 | | | 6/30/2014 | | | 3/31/2014 | | | 12/31/2013 | | | 12/31/2014 | | | 12/31/2013 | |
| Partnership amortization for tax credit purposes | | $ | (2,806 | ) | | $ | (3,006 | ) | | $ | (3,006 | ) | | $ | (3,006 | ) | | $ | (5,642 | ) | | $ | (11,824 | ) | | $ | (12,368 | ) |
| (Decrease) increase in FDIC indemnification asset | | | (735 | ) | | | (452 | ) | | | (999 | ) | | | (688 | ) | | | (2,429 | ) | | | (2,874 | ) | | | (5,900 | ) |
| Other miscellaneous income | | | 4,137 | | | | 3,298 | | | | 4,204 | | | | 3,673 | | | | 3,269 | | | | 15,312 | | | | 10,295 | |
| Total other, net | | $ | 596 | | | $ | (160 | ) | | $ | 199 | | | $ | (21 | ) | | $ | (4,802 | ) | | $ | 614 | | | $ | (7,973 | ) |
Trustmark invests in partnerships that provide income tax credits on a Federal and/or State basis (i.e., new market tax credits, low income housing tax credits or historical tax credits). These investments are recorded based on the equity method of accounting, which requires the equity in partnership losses to be recognized when incurred and are recorded as a reduction in other income. The income tax credits related to these partnerships are utilized as specifically allowed by income tax law and are recorded as a reduction in income tax expense.
During the fourth quarter of 2014, other noninterest income included a write-down of the FDIC indemnification asset of $735 thousand on acquired covered loans obtained from Heritage as a result of loan pay-offs, improved cash flow projections and lower loss expectations for loan pools.
Other noninterest expense consisted of the following for the periods presented ($ in thousands):
| | | Quarter Ended | | | Year Ended | |
| | | 12/31/2014 | | | 9/30/2014 | | | 6/30/2014 | | | 3/31/2014 | | | 12/31/2013 | | | 12/31/2014 | | | 12/31/2013 | |
| Loan expense | | $ | 3,312 | | | $ | 3,070 | | | $ | 3,107 | | | $ | 3,464 | | | $ | 4,419 | | | $ | 12,953 | | | $ | 15,071 | |
| Non-routine transaction expenses on acquisitions | | | - | | | | - | | | | - | | | | - | | | | - | | | | - | | | | 7,920 | |
| Amortization of intangibles | | | 2,123 | | | | 2,150 | | | | 2,190 | | | | 2,293 | | | | 2,434 | | | | 8,756 | | | | 8,814 | |
| Other miscellaneous expense | | | 8,985 | | | | 7,744 | | | | 7,934 | | | | 7,495 | | | | 8,555 | | | | 32,158 | | | | 33,756 | |
| Total other expense | | $ | 14,420 | | | $ | 12,964 | | | $ | 13,231 | | | $ | 13,252 | | | $ | 15,408 | | | $ | 53,867 | | | $ | 65,561 | |
In addition to capital ratios defined by GAAP and banking regulators, Trustmark utilizes various tangible common equity measures when evaluating capital utilization and adequacy. Tangible common equity, as defined by Trustmark, represents common equity less goodwill and identifiable intangible assets.
Trustmark believes these measures are important because they reflect the level of capital available to withstand unexpected market conditions. Additionally, presentation of these measures allows readers to compare certain aspects of Trustmark’s capitalization to other organizations. These ratios differ from capital measures defined by banking regulators principally in that the numerator excludes shareholders’ equity associated with preferred securities, the nature and extent of which varies across organizations.
These calculations are intended to complement the capital ratios defined by GAAP and banking regulators. Because GAAP does not include these capital ratio measures, Trustmark believes there are no comparable GAAP financial measures to these tangible common equity ratios. Despite the importance of these measures to Trustmark, there are no standardized definitions for them and, as a result, Trustmark’s calculations may not be comparable with other organizations. Also there may be limits in the usefulness of these measures to investors. As a result, Trustmark encourages readers to consider its consolidated financial statements in their entirety and not to rely on any single financial measure. The following table reconciles Trustmark’s calculation of these measures to amounts reported under GAAP.