News Release |
Trustmark Corporation Announces Second Quarter 2015 Financial Results
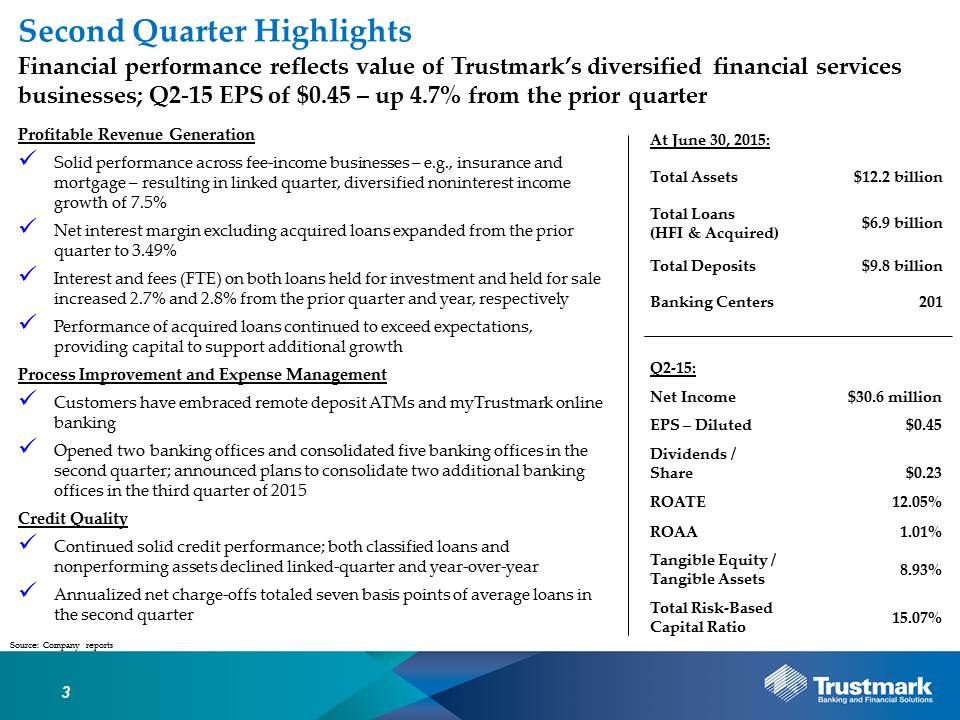
JACKSON, Miss. – July 28, 2015 – Trustmark Corporation (NASDAQ:TRMK) reported net income of $30.6 million in the second quarter of 2015, which represented diluted earnings per share of $0.45. Trustmark’s performance during the second quarter of 2015 produced a return on average tangible equity of 12.05% and a return on average assets of 1.01%. During the first six months of 2015, Trustmark’s net income totaled $59.8 million, which represented diluted earnings per share of $0.88. Trustmark’s Board of Directors declared a quarterly cash dividend of $0.23 per share payable September 15, 2015, to shareholders of record on September 1, 2015.
Second Quarter Highlights
● | Revenue totaled $142.5 million, a 7.8% annualized increase from the prior quarter; efficiency ratio improved linked quarter to 66.00% |
● | Net interest income (FTE) totaled $100.9 million; net interest margin excluding acquired loans expanded from the prior quarter to 3.49% |
● | Noninterest income increased 7.5% from the prior quarter, reflecting diversified growth across Trustmark’s fee-income businesses |
● | Continued solid credit performance; nonaccrual loans declined 11.1% from the prior quarter |
Gerard R. Host, President and CEO, stated, “Trustmark’s financial performance reflects the value of our diversified financial services businesses. We experienced solid loan growth in our Alabama and Texas markets. Noninterest income increased 7.5% linked quarter, resulting from strong growth across our fee-income businesses. During the quarter, we expanded our mortgage-production capabilities with the addition of ten mortgage producers in Mobile and Florence, Alabama, as well as Pensacola and Destin, Florida. Noninterest expense remained well-controlled and credit quality remained strong, both of which continued to be important contributors to our financial success. Thanks to our associates, solid profitability and strong capital base, Trustmark remains well-positioned to continue to add value to the customers, clients, communities and shareholders we serve.”
Balance Sheet Management
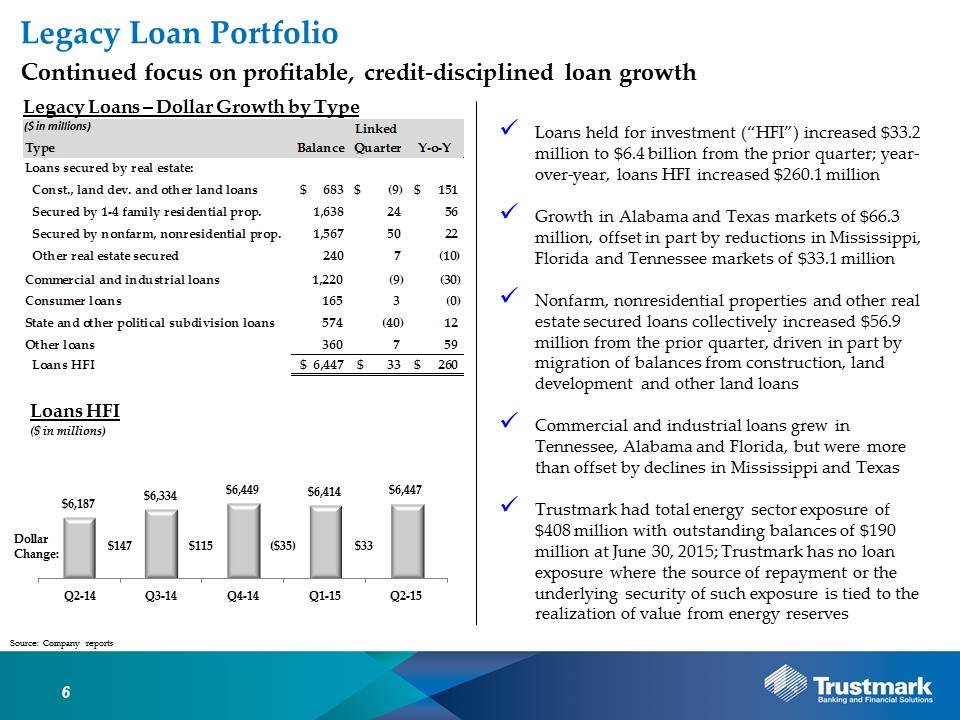
● | Legacy loan growth in Alabama and Texas markets of $66.3 million, offset in part by reductions in Mississippi, Florida and Tennessee markets of $33.1 million |
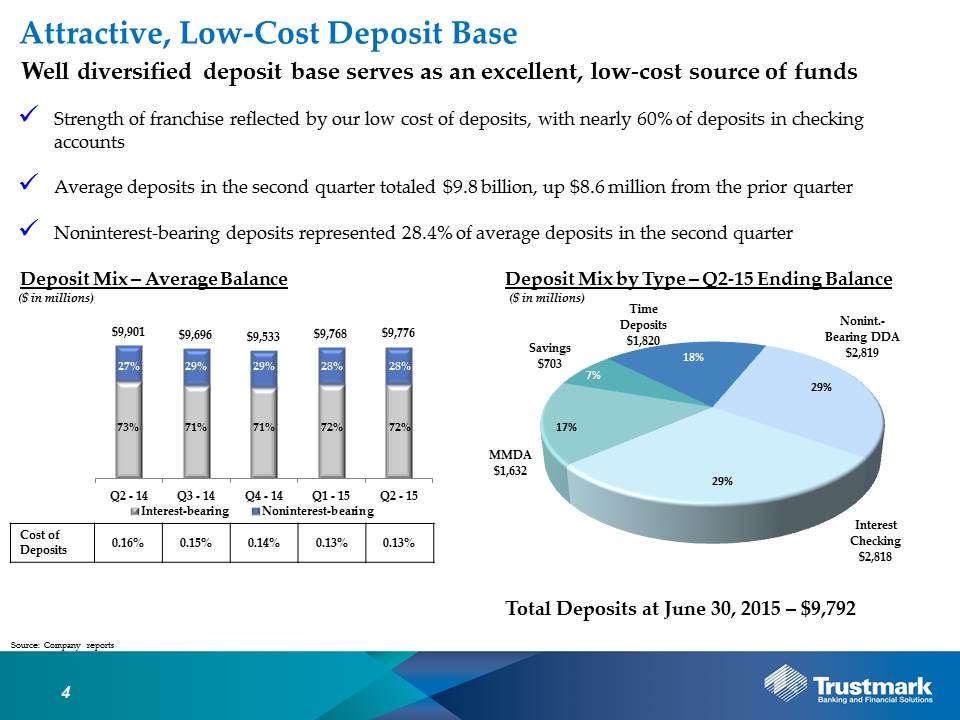
● | Average earning assets and deposits remained stable at $10.6 billion and $9.8 billion, respectively |
● | Capital base provides opportunity to support additional growth |
Loans held for investment totaled $6.4 billion at June 30, 2015, an increase of $33.2 million, or 0.5%, from the prior quarter and an increase of $260.1 million, or 4.2%, from one year earlier. Loans secured by nonfarm, nonresidential real estate increased by $50.1 million linked quarter as growth in Texas, Alabama and Mississippi was partially offset by declines in Florida and Tennessee. The single-family mortgage portfolio expanded by $23.9 million due principally to growth in the Mississippi and Alabama markets. Other loans, which include loans to nonprofits and real estate investment trusts, increased $7.1 million, reflecting growth in Texas, Alabama, Florida and Tennessee. Commercial and industrial loans declined $9.1 million as growth in Tennessee, Alabama and Florida was more than offset by paydowns in the Mississippi market. Loans to states and other political subdivisions decreased by $40.1 million, while construction, land development and other land loans decreased $9.2 million, reflecting in part migration of balances to loans secured by nonfarm, nonresidential real estate and other loans secured by real estate.
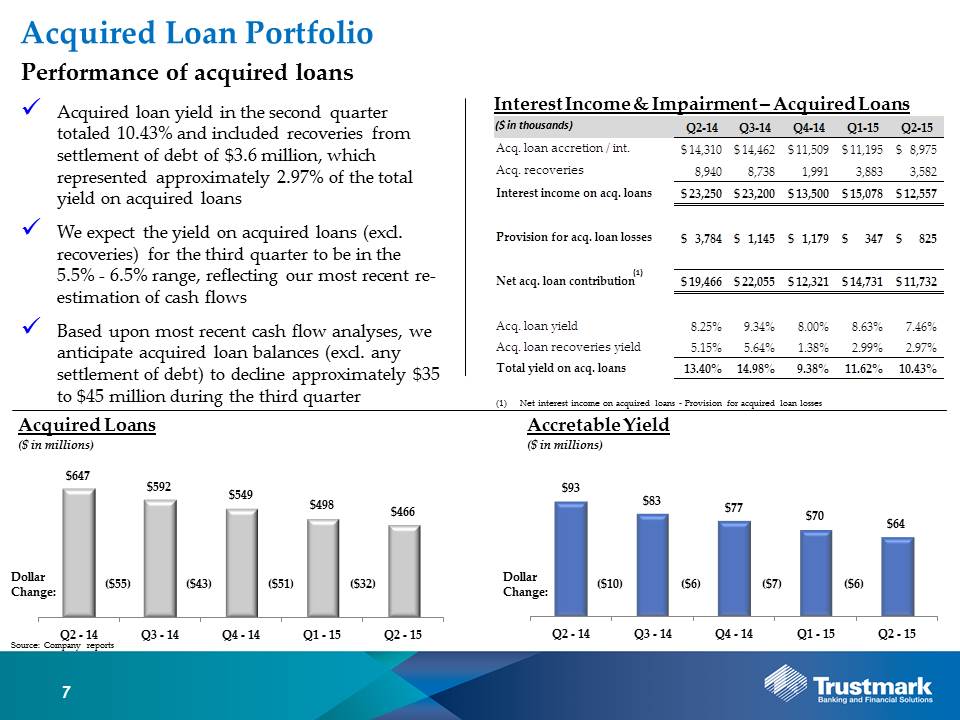
Acquired loans totaled $466.4 million at June 30, 2015, down $32.0 million from the prior quarter. Collectively, loans held for investment and acquired loans totaled $6.9 billion at June 30, 2015, up $1.2 million from the prior quarter.
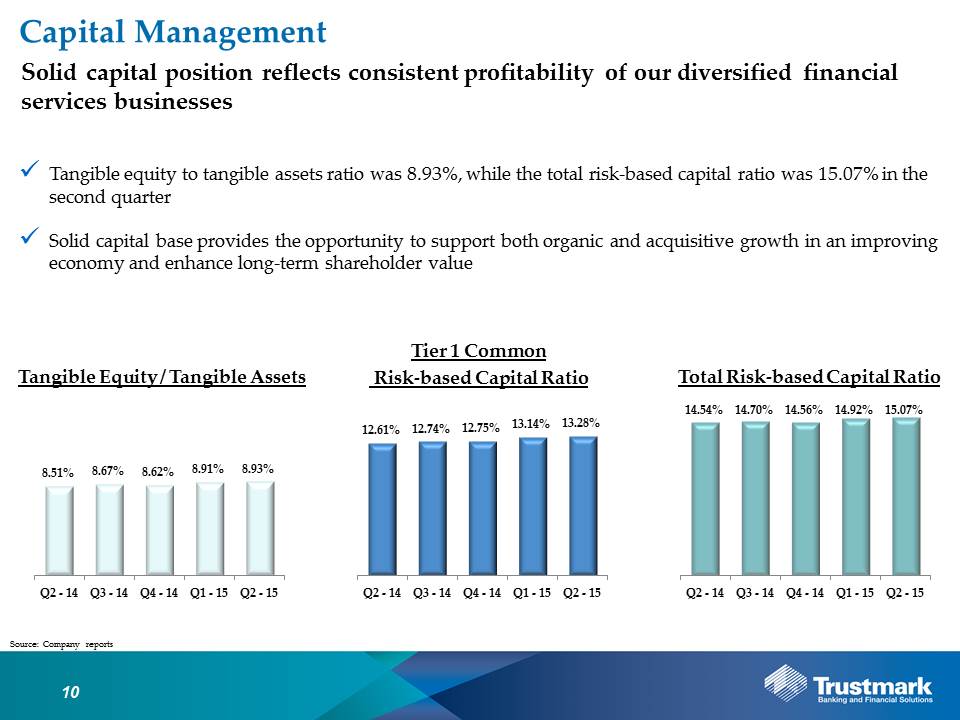
Trustmark’s capital position remained solid, reflecting the consistent profitability of its diversified financial services businesses. At June 30, 2015, Trustmark’s tangible equity to tangible assets ratio was 8.93%, while its total risk-based capital ratio was 15.07%. Tangible book value per share was $15.58 at June 30, 2015, up 5.4% from the prior year.
Credit Quality
● | Continued improvement in classified loan balances |
● | Nonperforming assets declined 4.8% linked quarter and 10.6% year-over-year |
● | Annualized net charge-offs totaled seven basis points of average loans in the second quarter |
Classified loans continued to reflect steady improvement. Relative to the prior quarter, Trustmark's classified loan balances declined 1.8%; when compared to the prior year, classified loan balances declined 11.0%.
Nonperforming assets declined $8.0 million, or 4.8%, from the prior quarter and $18.9 million, or 10.6%, from the comparable period one year earlier. The decline during the quarter was attributable to a reduction in nonaccrual loans, while the year-over-year decline was attributable to both a reduction in nonaccrual loans and other real estate.
Allocation of Trustmark's $71.2 million allowance for loan losses represented 1.30% of commercial loans and 0.59% of consumer and home mortgage loans, resulting in an allowance to total loans held for investment of 1.10% at June 30, 2015, representing a level management considers commensurate with the inherent risk in the loan portfolio. The allowance for loan losses represented 192.6% of nonperforming loans, excluding impaired loans at June 30, 2015.
All of the above credit quality metrics exclude acquired loans and other real estate covered by FDIC loss-share agreement.
Revenue Generation
● | Net interest income (FTE) remained stable compared to the prior quarter; net interest margin excluding acquired loans expanded linked quarter to 3.49% |
● | Noninterest income increased 7.5% from the prior quarter; insurance commissions and service charges on deposit accounts increased 9.1% and 7.5%, respectively, from the prior quarter |
Revenue in the second quarter increased 2.0%, or 7.8% annualized, from the prior quarter to $142.5 million, continuing to reflect Trustmark’s diversified business model. Net interest income (FTE) in the second quarter totaled $100.9 million, resulting in a net interest margin of 3.81%. Compared to results in the prior quarter, interest income (FTE) benefited from increased income on both the held for investment and held for sale loan portfolio as well as the securities portfolio, but was offset by lower interest and fees on acquired loans. The yield on acquired loans in the second quarter totaled 10.43% and included recoveries from settlement of debt of $3.6 million, which represented approximately 2.97% of the annualized total acquired loan yield. Excluding acquired loans, the net interest margin in the second quarter totaled 3.49%, up from 3.47% in the prior quarter.
Noninterest income totaled $45.5 million in the second quarter, an increase of 7.5% from the prior quarter and an increase of 3.2% from levels one year earlier. Service charges on deposit accounts increased 7.5% linked quarter, rebounding from a seasonal reduction in fees in the prior quarter. Bank card and other fees increased 9.7% from the prior quarter as a result of increased interchange income and fees on interest rate swaps for commercial loan customers. Other income, net improved $622 thousand linked quarter due to gains associated with bank-owned life insurance in the second quarter and a previously disclosed loss on the disposition of a branch location in the prior quarter. The improvements in other income, net were partially offset by FDIC indemnification asset write-downs due to continued improvement in credit quality of acquired covered loans and dispositions of covered other real estate.
Insurance revenue in the second quarter totaled $9.4 million, an increase of 9.1% from the prior quarter and 13.3% from levels one year earlier. The solid performance this quarter was primarily due to growth in the commercial property and casualty line of business, resulting from both a continued focus on new business and development of new production staff. Wealth management revenue totaled $7.8 million, down $232 thousand, or 2.9%, due in part to lower income from brokerage commissions and retirement plan services.
Mortgage banking revenue in the second quarter totaled $9.5 million, up 5.8% and 53.1% from levels in the prior quarter and year, respectively. The increase in mortgage revenue from the prior quarter primarily reflects favorable mortgage servicing hedge ineffectiveness and expanded secondary marketing gains. Mortgage loan production in the second quarter totaled $416.9 million, up 36.9% from the prior quarter and 29.4% from levels one year earlier.
Noninterest Expense
● | Noninterest expense totaled $100.3 million, up 1.1% from the prior quarter and down 2.4% from the prior year |
● | Efficiency ratio improved linked quarter to 66.00% |
● | During the first six months of the year, Trustmark closed or consolidated six banking offices and opened two new banking offices in markets with higher growth opportunities |
Excluding ORE expense and intangible amortization of $2.9 million, noninterest expense totaled $97.4 million, an increase of $1.3 million, or 1.3%, from comparable expenses in the prior quarter. Salaries and benefits totaled $57.4 million in the second quarter, up 0.4% on a linked quarter basis due primarily to increased commissions from higher mortgage production; in contrast, headcount, on a full-time equivalent basis, decreased by 49 and 106 from the prior quarter and year, respectively. Services and fees increased $884 thousand from the prior quarter, reflecting additional legal and data processing expense. ORE and foreclosure expense declined $194 thousand and $2.9 million from the prior quarter and year, respectively. Other expense increased $480 thousand relative to the prior quarter due principally to higher loan expense.
Trustmark also continued the optimization of its retail delivery channels to enhance productivity and efficiency as well as promote additional revenue growth. During the second quarter, Trustmark completed the previously announced consolidation of five banking offices and announced plans to consolidate two additional offices in the third quarter of 2015. Separately, Trustmark expanded its mortgage-banking platform with the addition of a new mortgage loan-production office in Florence, Alabama, while opening new banking offices in Spanish Fort and Inverness, Alabama. In July, Trustmark opened a mortgage loan-production office in Pensacola, Florida. Trustmark is committed to investments that support profitable revenue growth as well as reengineering and efficiency opportunities to enhance shareholder value.
Additional Information
As previously announced, Trustmark will conduct a conference call with analysts on Wednesday, July 29, 2015, at 10:00 a.m. Central Time to discuss the Corporation’s financial results. Interested parties may listen to the conference call by dialing (877) 317-3051 or by clicking on the link provided under the Investor Relations section of our website at www.trustmark.com, which will also include a slide presentation Management will review during the conference call. A replay of the conference call will also be available through Wednesday, August 12, 2015, in archived format at the same web address or by calling (877) 344-7529, passcode 10068030.
Trustmark Corporation is a financial services company providing banking and financial solutions through 201 offices in Alabama, Florida, Mississippi, Tennessee and Texas.
Forward-Looking Statements
Certain statements contained in this document constitute forward-looking statements within the meaning of the Private Securities Litigation Reform Act of 1995. You can identify forward-looking statements by words such as “may,” “hope,” “will,” “should,” “expect,” “plan,” “anticipate,” “intend,” “believe,” “estimate,” “predict,” “potential,” “continue,” “could,” “future” or the negative of those terms or other words of similar meaning. You should read statements that contain these words carefully because they discuss our future expectations or state other “forward-looking” information. These forward-looking statements include, but are not limited to, statements relating to anticipated future operating and financial performance measures, including net interest margin, credit quality, business initiatives, growth opportunities and growth rates, among other things, and encompass any estimate, prediction, expectation, projection, opinion, anticipation, outlook or statement of belief included therein as well as the management assumptions underlying these forward-looking statements. You should be aware that the occurrence of the events described under the caption “Risk Factors” in Trustmark’s filings with the Securities and Exchange Commission could have an adverse effect on our business, results of operations and financial condition. Should one or more of these risks materialize, or should any such underlying assumptions prove to be significantly different, actual results may vary significantly from those anticipated, estimated, projected or expected.
Risks that could cause actual results to differ materially from current expectations of Management include, but are not limited to, changes in the level of nonperforming assets and charge-offs, local, state and national economic and market conditions, including the extent and duration of the current volatility in the credit and financial markets as well as crude oil prices, changes in our ability to measure the fair value of assets in our portfolio, material changes in the level and/or volatility of market interest rates, the performance and demand for the products and services we offer, including the level and timing of withdrawals from our deposit accounts, the costs and effects of litigation and of unexpected or adverse outcomes in such litigation, our ability to attract noninterest-bearing deposits and other low-cost funds, competition in loan and deposit pricing, as well as the entry of new competitors into our markets through de novo expansion and acquisitions, economic conditions, including the potential impact of issues relating to the European financial system, and monetary and other governmental actions designed to address the level and volatility of interest rates and the volatility of securities, currency and other markets, the enactment of legislation and changes in existing regulations, or enforcement practices, or the adoption of new regulations, changes in accounting standards and practices, including changes in the interpretation of existing standards, that affect our consolidated financial statements, changes in consumer spending, borrowings and savings habits, technological changes, changes in the financial performance or condition of our borrowers, changes in our ability to control expenses, changes in our compensation and benefit plans, greater than expected costs or difficulties related to the integration of acquisitions or new products and lines of business, natural disasters, environmental disasters, acts of war or terrorism, and other risks described in our filings with the Securities and Exchange Commission.
Although we believe that the expectations reflected in such forward-looking statements are reasonable, we can give no assurance that such expectations will prove to be correct. Except as required by law, we undertake no obligation to update or revise any of this information, whether as the result of new information, future events or developments or otherwise.
Trustmark Investor Contacts:
Louis E. Greer
Treasurer and
Principal Financial Officer
601-208-2310
F. Joseph Rein, Jr.
Senior Vice President
601-208-6898
Trustmark Media Contact:
Melanie A. Morgan
Senior Vice President
601-208-2979
TRUSTMARK CORPORATION AND SUBSIDIARIES CONSOLIDATED FINANCIAL INFORMATION June 30, 2015 ($ in thousands) (unaudited) |
Linked Quarter | Year over Year | |||||||||||||||||||||||||||
QUARTERLY AVERAGE BALANCES | 6/30/2015 | 3/31/2015 | 6/30/2014 | $ Change | % Change | $ Change | % Change | |||||||||||||||||||||
Securities AFS-taxable | $ | 2,255,485 | $ | 2,190,344 | $ | 2,205,352 | $ | 65,141 | 3.0 | % | $ | 50,133 | 2.3 | % | ||||||||||||||
Securities AFS-nontaxable | 120,330 | 127,623 | 135,956 | (7,293 | ) | -5.7 | % | (15,626 | ) | -11.5 | % | |||||||||||||||||
Securities HTM-taxable | 1,143,273 | 1,119,979 | 1,120,448 | 23,294 | 2.1 | % | 22,825 | 2.0 | % | |||||||||||||||||||
Securities HTM-nontaxable | 38,173 | 41,405 | 43,551 | (3,232 | ) | -7.8 | % | (5,378 | ) | -12.3 | % | |||||||||||||||||
Total securities | 3,557,261 | 3,479,351 | 3,505,307 | 77,910 | 2.2 | % | 51,954 | 1.5 | % | |||||||||||||||||||
Loans (including loans held for sale) | 6,554,739 | 6,561,430 | 6,160,781 | (6,691 | ) | -0.1 | % | 393,958 | 6.4 | % | ||||||||||||||||||
Acquired loans: | ||||||||||||||||||||||||||||
Noncovered loans | 462,418 | 502,534 | 664,733 | (40,116 | ) | -8.0 | % | (202,315 | ) | -30.4 | % | |||||||||||||||||
Covered loans | 20,574 | 23,593 | 31,122 | (3,019 | ) | -12.8 | % | (10,548 | ) | -33.9 | % | |||||||||||||||||
Fed funds sold and rev repos | 557 | 217 | 2,648 | 340 | n/m | (2,091 | ) | -79.0 | % | |||||||||||||||||||
Other earning assets | 41,242 | 46,368 | 36,259 | (5,126 | ) | -11.1 | % | 4,983 | 13.7 | % | ||||||||||||||||||
Total earning assets | 10,636,791 | 10,613,493 | 10,400,850 | 23,298 | 0.2 | % | 235,941 | 2.3 | % | |||||||||||||||||||
Allowance for loan losses | (84,331 | ) | (81,993 | ) | (77,652 | ) | (2,338 | ) | 2.9 | % | (6,679 | ) | 8.6 | % | ||||||||||||||
Cash and due from banks | 272,292 | 290,251 | 304,441 | (17,959 | ) | -6.2 | % | (32,149 | ) | -10.6 | % | |||||||||||||||||
Other assets | 1,288,507 | 1,303,552 | 1,343,384 | (15,045 | ) | -1.2 | % | (54,877 | ) | -4.1 | % | |||||||||||||||||
Total assets | $ | 12,113,259 | $ | 12,125,303 | $ | 11,971,023 | $ | (12,044 | ) | -0.1 | % | $ | 142,236 | 1.2 | % | |||||||||||||
Interest-bearing demand deposits | $ | 1,924,447 | $ | 1,847,374 | $ | 1,826,019 | $ | 77,073 | 4.2 | % | $ | 98,428 | 5.4 | % | ||||||||||||||
Savings deposits | 3,226,380 | 3,252,586 | 3,260,634 | (26,206 | ) | -0.8 | % | (34,254 | ) | -1.1 | % | |||||||||||||||||
Time deposits less than $100,000 | 1,101,477 | 1,139,912 | 1,225,706 | (38,435 | ) | -3.4 | % | (124,229 | ) | -10.1 | % | |||||||||||||||||
Time deposits of $100,000 or more | 751,129 | 785,715 | 911,531 | (34,586 | ) | -4.4 | % | (160,402 | ) | -17.6 | % | |||||||||||||||||
Total interest-bearing deposits | 7,003,433 | 7,025,587 | 7,223,890 | (22,154 | ) | -0.3 | % | (220,457 | ) | -3.1 | % | |||||||||||||||||
Fed funds purchased and repos | 497,606 | 421,206 | 387,289 | 76,400 | 18.1 | % | 110,317 | 28.5 | % | |||||||||||||||||||
Short-term borrowings | 128,761 | 256,714 | 59,465 | (127,953 | ) | -49.8 | % | 69,296 | n/m | |||||||||||||||||||
Long-term FHLB advances | 1,213 | 1,243 | 8,291 | (30 | ) | -2.4 | % | (7,078 | ) | -85.4 | % | |||||||||||||||||
Subordinated notes | 49,947 | 49,939 | 49,915 | 8 | 0.0 | % | 32 | 0.1 | % | |||||||||||||||||||
Junior subordinated debt securities | 61,856 | 61,856 | 61,856 | - | 0.0 | % | - | 0.0 | % | |||||||||||||||||||
Total interest-bearing liabilities | 7,742,816 | 7,816,545 | 7,790,706 | (73,729 | ) | -0.9 | % | (47,890 | ) | -0.6 | % | |||||||||||||||||
Noninterest-bearing deposits | 2,772,741 | 2,741,945 | 2,676,907 | 30,796 | 1.1 | % | 95,834 | 3.6 | % | |||||||||||||||||||
Other liabilities | 143,201 | 129,844 | 111,170 | 13,357 | 10.3 | % | 32,031 | 28.8 | % | |||||||||||||||||||
Total liabilities | 10,658,758 | 10,688,334 | 10,578,783 | (29,576 | ) | -0.3 | % | 79,975 | 0.8 | % | ||||||||||||||||||
Shareholders' equity | 1,454,501 | 1,436,969 | 1,392,240 | 17,532 | 1.2 | % | 62,261 | 4.5 | % | |||||||||||||||||||
Total liabilities and equity | $ | 12,113,259 | $ | 12,125,303 | $ | 11,971,023 | $ | (12,044 | ) | -0.1 | % | $ | 142,236 | 1.2 | % | |||||||||||||
Linked Quarter | Year over Year | |||||||||||||||||||||||||||
PERIOD END BALANCES | 6/30/2015 | 3/31/2015 | 6/30/2014 | $ Change | % Change | $ Change | % Change | |||||||||||||||||||||
Cash and due from banks | $ | 255,050 | $ | 335,244 | $ | 322,960 | $ | (80,194 | ) | -23.9 | % | $ | (67,910 | ) | -21.0 | % | ||||||||||||
Fed funds sold and rev repos | - | - | 5,000 | - | n/m | (5,000 | ) | -100.0 | % | |||||||||||||||||||
Securities available for sale | 2,446,383 | 2,381,459 | 2,376,431 | 64,924 | 2.7 | % | 69,952 | 2.9 | % | |||||||||||||||||||
Securities held to maturity | 1,190,161 | 1,184,554 | 1,156,790 | 5,607 | 0.5 | % | 33,371 | 2.9 | % | |||||||||||||||||||
Loans held for sale (LHFS) | 147,539 | 150,365 | 142,103 | (2,826 | ) | -1.9 | % | 5,436 | 3.8 | % | ||||||||||||||||||
Loans held for investment (LHFI) | 6,447,073 | 6,413,876 | 6,187,000 | 33,197 | 0.5 | % | 260,073 | 4.2 | % | |||||||||||||||||||
Allowance for loan losses | (71,166 | ) | (71,321 | ) | (66,648 | ) | 155 | -0.2 | % | (4,518 | ) | 6.8 | % | |||||||||||||||
Net LHFI | 6,375,907 | 6,342,555 | 6,120,352 | 33,352 | 0.5 | % | 255,555 | 4.2 | % | |||||||||||||||||||
Acquired loans: | ||||||||||||||||||||||||||||
Noncovered loans | 447,160 | 478,172 | 616,911 | (31,012 | ) | -6.5 | % | (169,751 | ) | -27.5 | % | |||||||||||||||||
Covered loans | 19,239 | 20,271 | 29,628 | (1,032 | ) | -5.1 | % | (10,389 | ) | -35.1 | % | |||||||||||||||||
Allowance for loan losses, acquired loans | (12,629 | ) | (11,837 | ) | (11,179 | ) | (792 | ) | 6.7 | % | (1,450 | ) | 13.0 | % | ||||||||||||||
Net acquired loans | 453,770 | 486,606 | 635,360 | (32,836 | ) | -6.7 | % | (181,590 | ) | -28.6 | % | |||||||||||||||||
Net LHFI and acquired loans | 6,829,677 | 6,829,161 | 6,755,712 | 516 | 0.0 | % | 73,965 | 1.1 | % | |||||||||||||||||||
Premises and equipment, net | 196,220 | 198,039 | 201,639 | (1,819 | ) | -0.9 | % | (5,419 | ) | -2.7 | % | |||||||||||||||||
Mortgage servicing rights | 71,422 | 62,903 | 65,049 | 8,519 | 13.5 | % | 6,373 | 9.8 | % | |||||||||||||||||||
Goodwill | 365,500 | 365,500 | 365,500 | - | 0.0 | % | - | 0.0 | % | |||||||||||||||||||
Identifiable intangible assets | 32,042 | 31,250 | 37,506 | 792 | 2.5 | % | (5,464 | ) | -14.6 | % | ||||||||||||||||||
Other real estate, excluding covered other real estate | 90,748 | 90,175 | 106,970 | 573 | 0.6 | % | (16,222 | ) | -15.2 | % | ||||||||||||||||||
Covered other real estate | 3,755 | 4,794 | 3,872 | (1,039 | ) | -21.7 | % | (117 | ) | -3.0 | % | |||||||||||||||||
FDIC indemnification asset | 2,632 | 4,743 | 10,866 | (2,111 | ) | -44.5 | % | (8,234 | ) | -75.8 | % | |||||||||||||||||
Other assets | 551,319 | 540,977 | 569,598 | 10,342 | 1.9 | % | (18,279 | ) | -3.2 | % | ||||||||||||||||||
Total assets | $ | 12,182,448 | $ | 12,179,164 | $ | 12,119,996 | $ | 3,284 | 0.0 | % | $ | 62,452 | 0.5 | % | ||||||||||||||
Deposits: | ||||||||||||||||||||||||||||
Noninterest-bearing | $ | 2,819,171 | $ | 2,936,875 | $ | 2,729,199 | $ | (117,704 | ) | -4.0 | % | $ | 89,972 | 3.3 | % | |||||||||||||
Interest-bearing | 6,973,003 | 6,970,115 | 7,131,167 | 2,888 | 0.0 | % | (158,164 | ) | -2.2 | % | ||||||||||||||||||
Total deposits | 9,792,174 | 9,906,990 | 9,860,366 | (114,816 | ) | -1.2 | % | (68,192 | ) | -0.7 | % | |||||||||||||||||
Fed funds purchased and repos | 477,462 | 523,187 | 559,316 | (45,725 | ) | -8.7 | % | (81,854 | ) | -14.6 | % | |||||||||||||||||
Short-term borrowings | 201,744 | 50,570 | 61,227 | 151,174 | n/m | 140,517 | n/m | |||||||||||||||||||||
Long-term FHLB advances | 1,204 | 1,222 | 8,236 | (18 | ) | -1.5 | % | (7,032 | ) | -85.4 | % | |||||||||||||||||
Subordinated notes | 49,953 | 49,944 | 49,920 | 9 | 0.0 | % | 33 | 0.1 | % | |||||||||||||||||||
Junior subordinated debt securities | 61,856 | 61,856 | 61,856 | - | 0.0 | % | - | 0.0 | % | |||||||||||||||||||
Other liabilities | 147,646 | 139,311 | 119,184 | 8,335 | 6.0 | % | 28,462 | 23.9 | % | |||||||||||||||||||
Total liabilities | 10,732,039 | 10,733,080 | 10,720,105 | (1,041 | ) | 0.0 | % | 11,934 | 0.1 | % | ||||||||||||||||||
Common stock | 14,076 | 14,076 | 14,051 | - | 0.0 | % | 25 | 0.2 | % | |||||||||||||||||||
Capital surplus | 359,533 | 358,583 | 353,196 | 950 | 0.3 | % | 6,337 | 1.8 | % | |||||||||||||||||||
Retained earnings | 1,117,993 | 1,103,077 | 1,063,201 | 14,916 | 1.4 | % | 54,792 | 5.2 | % | |||||||||||||||||||
Accum other comprehensive | ||||||||||||||||||||||||||||
loss, net of tax | (41,193 | ) | (29,652 | ) | (30,557 | ) | (11,541 | ) | 38.9 | % | (10,636 | ) | 34.8 | % | ||||||||||||||
Total shareholders' equity | 1,450,409 | 1,446,084 | 1,399,891 | 4,325 | 0.3 | % | 50,518 | 3.6 | % | |||||||||||||||||||
Total liabilities and equity | $ | 12,182,448 | $ | 12,179,164 | $ | 12,119,996 | $ | 3,284 | 0.0 | % | $ | 62,452 | 0.5 | % | ||||||||||||||
n/m - percentage changes greater than +/- 100% are considered not meaningful | ||||||||||||||||||||||||||||
See Notes to Consolidated Financials |
TRUSTMARK CORPORATION AND SUBSIDIARIES CONSOLIDATED FINANCIAL INFORMATION June 30, 2015 ($ in thousands except per share data) (unaudited) |
Quarter Ended | Linked Quarter | Year over Year | ||||||||||||||||||||||||||
INCOME STATEMENTS | 6/30/2015 | 3/31/2015 | 6/30/2014 | $ Change | % Change | $ Change | % Change | |||||||||||||||||||||
Interest and fees on LHFS & LHFI-FTE | $ | 71,546 | $ | 69,658 | $ | 69,618 | $ | 1,888 | 2.7 | % | $ | 1,928 | 2.8 | % | ||||||||||||||
Interest and fees on acquired loans | 12,557 | 15,078 | 23,250 | (2,521 | ) | -16.7 | % | (10,693 | ) | -46.0 | % | |||||||||||||||||
Interest on securities-taxable | 19,731 | 19,586 | 19,522 | 145 | 0.7 | % | 209 | 1.1 | % | |||||||||||||||||||
Interest on securities-tax exempt-FTE | 1,688 | 1,789 | 1,912 | (101 | ) | -5.6 | % | (224 | ) | -11.7 | % | |||||||||||||||||
Interest on fed funds sold and rev repos | 2 | - | 6 | 2 | n/m | (4 | ) | -66.7 | % | |||||||||||||||||||
Other interest income | 392 | 393 | 379 | (1 | ) | -0.3 | % | 13 | 3.4 | % | ||||||||||||||||||
Total interest income-FTE | 105,916 | 106,504 | 114,687 | (588 | ) | -0.6 | % | (8,771 | ) | -7.6 | % | |||||||||||||||||
Interest on deposits | 3,204 | 3,247 | 3,970 | (43 | ) | -1.3 | % | (766 | ) | -19.3 | % | |||||||||||||||||
Interest on fed funds pch and repos | 179 | 143 | 110 | 36 | 25.2 | % | 69 | 62.7 | % | |||||||||||||||||||
Other interest expense | 1,614 | 1,649 | 1,375 | (35 | ) | -2.1 | % | 239 | 17.4 | % | ||||||||||||||||||
Total interest expense | 4,997 | 5,039 | 5,455 | (42 | ) | -0.8 | % | (458 | ) | -8.4 | % | |||||||||||||||||
Net interest income-FTE | 100,919 | 101,465 | 109,232 | (546 | ) | -0.5 | % | (8,313 | ) | -7.6 | % | |||||||||||||||||
Provision for loan losses, LHFI | 1,033 | 1,785 | 351 | (752 | ) | -42.1 | % | 682 | n/m | |||||||||||||||||||
Provision for loan losses, acquired loans | 825 | 347 | 3,784 | 478 | n/m | (2,959 | ) | -78.2 | % | |||||||||||||||||||
Net interest income after provision-FTE | 99,061 | 99,333 | 105,097 | (272 | ) | -0.3 | % | (6,036 | ) | -5.7 | % | |||||||||||||||||
Service charges on deposit accounts | 11,920 | 11,085 | 11,846 | 835 | 7.5 | % | 74 | 0.6 | % | |||||||||||||||||||
Insurance commissions | 9,401 | 8,616 | 8,300 | 785 | 9.1 | % | 1,101 | 13.3 | % | |||||||||||||||||||
Wealth management | 7,758 | 7,990 | 7,710 | (232 | ) | -2.9 | % | 48 | 0.6 | % | ||||||||||||||||||
Bank card and other fees | 7,416 | 6,762 | 9,894 | 654 | 9.7 | % | (2,478 | ) | -25.0 | % | ||||||||||||||||||
Mortgage banking, net | 9,481 | 8,965 | 6,191 | 516 | 5.8 | % | 3,290 | 53.1 | % | |||||||||||||||||||
Other, net | (433 | ) | (1,055 | ) | 199 | 622 | 59.0 | % | (632 | ) | n/m | |||||||||||||||||
Nonint inc-excl sec gains (losses), net | 45,543 | 42,363 | 44,140 | 3,180 | 7.5 | % | 1,403 | 3.2 | % | |||||||||||||||||||
Security gains (losses), net | - | - | - | - | n/m | - | n/m | |||||||||||||||||||||
Total noninterest income | 45,543 | 42,363 | 44,140 | 3,180 | 7.5 | % | 1,403 | 3.2 | % | |||||||||||||||||||
Salaries and employee benefits | 57,393 | 57,169 | 56,134 | 224 | 0.4 | % | 1,259 | 2.2 | % | |||||||||||||||||||
Services and fees | 15,005 | 14,121 | 14,543 | 884 | 6.3 | % | 462 | 3.2 | % | |||||||||||||||||||
Net occupancy-premises | 6,243 | 6,191 | 6,413 | 52 | 0.8 | % | (170 | ) | -2.7 | % | ||||||||||||||||||
Equipment expense | 5,903 | 5,974 | 6,136 | (71 | ) | -1.2 | % | (233 | ) | -3.8 | % | |||||||||||||||||
FDIC assessment expense | 2,615 | 2,940 | 2,468 | (325 | ) | -11.1 | % | 147 | 6.0 | % | ||||||||||||||||||
ORE/Foreclosure expense | 921 | 1,115 | 3,836 | (194 | ) | -17.4 | % | (2,915 | ) | -76.0 | % | |||||||||||||||||
Other expense | 12,186 | 11,706 | 13,231 | 480 | 4.1 | % | (1,045 | ) | -7.9 | % | ||||||||||||||||||
Total noninterest expense | 100,266 | 99,216 | 102,761 | 1,050 | 1.1 | % | (2,495 | ) | -2.4 | % | ||||||||||||||||||
Income before income taxes and tax eq adj | 44,338 | 42,480 | 46,476 | 1,858 | 4.4 | % | (2,138 | ) | -4.6 | % | ||||||||||||||||||
Tax equivalent adjustment | 3,970 | 4,073 | 3,944 | (103 | ) | -2.5 | % | 26 | 0.7 | % | ||||||||||||||||||
Income before income taxes | 40,368 | 38,407 | 42,532 | 1,961 | 5.1 | % | (2,164 | ) | -5.1 | % | ||||||||||||||||||
Income taxes | 9,766 | 9,259 | 9,635 | 507 | 5.5 | % | 131 | 1.4 | % | |||||||||||||||||||
Net income | $ | 30,602 | $ | 29,148 | $ | 32,897 | $ | 1,454 | 5.0 | % | $ | (2,295 | ) | -7.0 | % | |||||||||||||
Per share data | ||||||||||||||||||||||||||||
Earnings per share - basic | $ | 0.45 | $ | 0.43 | $ | 0.49 | $ | 0.02 | 4.7 | % | $ | (0.04 | ) | -8.2 | % | |||||||||||||
Earnings per share - diluted | $ | 0.45 | $ | 0.43 | $ | 0.49 | $ | 0.02 | 4.7 | % | $ | (0.04 | ) | -8.2 | % | |||||||||||||
Dividends per share | $ | 0.23 | $ | 0.23 | $ | 0.23 | $ | - | 0.0 | % | $ | - | 0.0 | % | ||||||||||||||
Weighted average shares outstanding | ||||||||||||||||||||||||||||
Basic | 67,556,825 | 67,525,791 | 67,439,659 | |||||||||||||||||||||||||
Diluted | 67,685,449 | 67,639,326 | 67,582,714 | |||||||||||||||||||||||||
Period end shares outstanding | 67,557,395 | 67,556,591 | 67,439,788 | |||||||||||||||||||||||||
OTHER FINANCIAL DATA | ||||||||||||||||||||||||||||
Return on equity | 8.44 | % | 8.23 | % | 9.48 | % | ||||||||||||||||||||||
Return on average tangible equity | 12.05 | % | 11.86 | % | 13.90 | % | ||||||||||||||||||||||
Return on assets | 1.01 | % | 0.97 | % | 1.10 | % | ||||||||||||||||||||||
Interest margin - Yield - FTE | 3.99 | % | 4.07 | % | 4.42 | % | ||||||||||||||||||||||
Interest margin - Cost | 0.19 | % | 0.19 | % | 0.21 | % | ||||||||||||||||||||||
Net interest margin - FTE | 3.81 | % | 3.88 | % | 4.21 | % | ||||||||||||||||||||||
Efficiency ratio (1) | 66.00 | % | 66.46 | % | 64.31 | % | ||||||||||||||||||||||
Full-time equivalent employees | 2,989 | 3,038 | 3,095 | |||||||||||||||||||||||||
STOCK PERFORMANCE | ||||||||||||||||||||||||||||
Market value-Close | $ | 24.98 | $ | 24.28 | $ | 24.69 | ||||||||||||||||||||||
Book value | $ | 21.47 | $ | 21.41 | $ | 20.76 | ||||||||||||||||||||||
Tangible book value | $ | 15.58 | $ | 15.53 | $ | 14.78 | ||||||||||||||||||||||
(1) - The efficiency ratio is noninterest expense to total net interest income (FTE) and noninterest income, excluding security gains (losses), amortization of | ||||||||||||||||||||||||||||
partnership tax credits, amortization of purchased intangibles, and nonroutine income and expense items. | ||||||||||||||||||||||||||||
n/m - percentage changes greater than +/- 100% are considered not meaningful | ||||||||||||||||||||||||||||
See Notes to Consolidated Financials |
TRUSTMARK CORPORATION AND SUBSIDIARIES CONSOLIDATED FINANCIAL INFORMATION June 30, 2015 ($ in thousands) (unaudited) |
Quarter Ended | Linked Quarter | Year over Year | ||||||||||||||||||||||||||
NONPERFORMING ASSETS (1) | 6/30/2015 | 3/31/2015 | 6/30/2014 | $ Change | % Change | $ Change | % Change | |||||||||||||||||||||
Nonaccrual loans | ||||||||||||||||||||||||||||
Alabama | $ | 713 | $ | 902 | $ | 80 | $ | (189 | ) | -21.0 | % | $ | 633 | n/m | ||||||||||||||
Florida | 7,892 | 8,179 | 11,041 | (287 | ) | -3.5 | % | (3,149 | ) | -28.5 | % | |||||||||||||||||
Mississippi (2) | 52,051 | 52,145 | 49,430 | (94 | ) | -0.2 | % | 2,621 | 5.3 | % | ||||||||||||||||||
Tennessee (3) | 5,468 | 4,197 | 4,244 | 1,271 | 30.3 | % | 1,224 | 28.8 | % | |||||||||||||||||||
Texas | 2,314 | 11,585 | 6,323 | (9,271 | ) | -80.0 | % | (4,009 | ) | -63.4 | % | |||||||||||||||||
Total nonaccrual loans | 68,438 | 77,008 | 71,118 | (8,570 | ) | -11.1 | % | (2,680 | ) | -3.8 | % | |||||||||||||||||
Other real estate | ||||||||||||||||||||||||||||
Alabama | 21,849 | 21,795 | 24,541 | 54 | 0.2 | % | (2,692 | ) | -11.0 | % | ||||||||||||||||||
Florida | 31,059 | 34,746 | 43,207 | (3,687 | ) | -10.6 | % | (12,148 | ) | -28.1 | % | |||||||||||||||||
Mississippi (2) | 14,094 | 15,143 | 18,723 | (1,049 | ) | -6.9 | % | (4,629 | ) | -24.7 | % | |||||||||||||||||
Tennessee (3) | 9,707 | 10,072 | 12,073 | (365 | ) | -3.6 | % | (2,366 | ) | -19.6 | % | |||||||||||||||||
Texas | 14,039 | 8,419 | 8,426 | 5,620 | 66.8 | % | 5,613 | 66.6 | % | |||||||||||||||||||
Total other real estate | 90,748 | 90,175 | 106,970 | 573 | 0.6 | % | (16,222 | ) | -15.2 | % | ||||||||||||||||||
Total nonperforming assets | $ | 159,186 | $ | 167,183 | $ | 178,088 | $ | (7,997 | ) | -4.8 | % | $ | (18,902 | ) | -10.6 | % | ||||||||||||
LOANS PAST DUE OVER 90 DAYS (4) | ||||||||||||||||||||||||||||
LHFI | $ | 1,771 | $ | 1,413 | $ | 1,936 | $ | 358 | 25.3 | % | $ | (165 | ) | -8.5 | % | |||||||||||||
LHFS-Guaranteed GNMA serviced loans | ||||||||||||||||||||||||||||
(no obligation to repurchase) | $ | 11,987 | $ | 7,584 | $ | 21,810 | $ | 4,403 | 58.1 | % | $ | (9,823 | ) | -45.0 | % | |||||||||||||
Quarter Ended | Linked Quarter | Year over Year | ||||||||||||||||||||||||||
ALLOWANCE FOR LOAN LOSSES (4) | 6/30/2015 | 3/31/2015 | 6/30/2014 | $ Change | % Change | $ Change | % Change | |||||||||||||||||||||
Beginning Balance | $ | 71,321 | $ | 69,616 | $ | 67,518 | $ | 1,705 | 2.4 | % | $ | 3,803 | 5.6 | % | ||||||||||||||
Provision for loan losses | 1,033 | 1,785 | 351 | (752 | ) | -42.1 | % | 682 | n/m | |||||||||||||||||||
Charge-offs | (4,278 | ) | (3,004 | ) | (3,820 | ) | (1,274 | ) | 42.4 | % | (458 | ) | 12.0 | % | ||||||||||||||
Recoveries | 3,090 | 2,924 | 2,599 | 166 | 5.7 | % | 491 | 18.9 | % | |||||||||||||||||||
Net (charge-offs) recoveries | (1,188 | ) | (80 | ) | (1,221 | ) | (1,108 | ) | n/m | 33 | -2.7 | % | ||||||||||||||||
Ending Balance | $ | 71,166 | $ | 71,321 | $ | 66,648 | $ | (155 | ) | -0.2 | % | $ | 4,518 | 6.8 | % | |||||||||||||
PROVISION FOR LOAN LOSSES (4) | ||||||||||||||||||||||||||||
Alabama | $ | 623 | $ | 761 | $ | 696 | $ | (138 | ) | -18.1 | % | $ | (73 | ) | -10.5 | % | ||||||||||||
Florida | (1,168 | ) | 1,833 | (2,014 | ) | (3,001 | ) | n/m | 846 | -42.0 | % | |||||||||||||||||
Mississippi (2) | 2,046 | (2,729 | ) | 2,877 | 4,775 | n/m | (831 | ) | -28.9 | % | ||||||||||||||||||
Tennessee (3) | (483 | ) | 1,432 | (277 | ) | (1,915 | ) | n/m | (206 | ) | 74.4 | % | ||||||||||||||||
Texas | 15 | 488 | (931 | ) | (473 | ) | -96.9 | % | 946 | n/m | ||||||||||||||||||
Total provision for loan losses | $ | 1,033 | $ | 1,785 | $ | 351 | $ | (752 | ) | -42.1 | % | $ | 682 | n/m | ||||||||||||||
NET CHARGE-OFFS (4) | ||||||||||||||||||||||||||||
Alabama | $ | 216 | $ | 144 | $ | 84 | $ | 72 | 50.0 | % | $ | 132 | n/m | |||||||||||||||
Florida | 539 | (28 | ) | (525 | ) | 567 | n/m | 1,064 | n/m | |||||||||||||||||||
Mississippi (2) | 1,028 | 143 | 1,518 | 885 | n/m | (490 | ) | -32.3 | % | |||||||||||||||||||
Tennessee (3) | 105 | (216 | ) | 87 | 321 | n/m | 18 | 20.7 | % | |||||||||||||||||||
Texas | (700 | ) | 37 | 57 | (737 | ) | n/m | (757 | ) | n/m | ||||||||||||||||||
Total net charge-offs (recoveries) | $ | 1,188 | $ | 80 | $ | 1,221 | $ | 1,108 | n/m | $ | (33 | ) | -2.7 | % | ||||||||||||||
CREDIT QUALITY RATIOS (1) | ||||||||||||||||||||||||||||
Net charge-offs/average loans | 0.07 | % | 0.00 | % | 0.08 | % | ||||||||||||||||||||||
Provision for loan losses/average loans | 0.06 | % | 0.11 | % | 0.02 | % | ||||||||||||||||||||||
Nonperforming loans/total loans (incl LHFS) | 1.04 | % | 1.17 | % | 1.12 | % | ||||||||||||||||||||||
Nonperforming assets/total loans (incl LHFS) | 2.41 | % | 2.55 | % | 2.81 | % | ||||||||||||||||||||||
Nonperforming assets/total loans (incl LHFS) +ORE | 2.38 | % | 2.51 | % | 2.77 | % | ||||||||||||||||||||||
ALL/total loans (excl LHFS) | 1.10 | % | 1.11 | % | 1.08 | % | ||||||||||||||||||||||
ALL-commercial/total commercial loans | 1.30 | % | 1.30 | % | 1.20 | % | ||||||||||||||||||||||
ALL-consumer/total consumer and home mortgage loans | 0.59 | % | 0.61 | % | 0.75 | % | ||||||||||||||||||||||
ALL/nonperforming loans | 103.99 | % | 92.62 | % | 93.71 | % | ||||||||||||||||||||||
ALL/nonperforming loans - | ||||||||||||||||||||||||||||
(excl impaired loans) | 192.60 | % | 205.52 | % | 159.71 | % | ||||||||||||||||||||||
CAPITAL RATIOS | ||||||||||||||||||||||||||||
Total equity/total assets | 11.91 | % | 11.87 | % | 11.55 | % | ||||||||||||||||||||||
Tangible equity/tangible assets | 8.93 | % | 8.91 | % | 8.51 | % | ||||||||||||||||||||||
Tangible equity/risk-weighted assets | 12.34 | % | 12.34 | % | 12.19 | % | ||||||||||||||||||||||
Tier 1 leverage ratio | 10.14 | % | 9.99 | % | 9.43 | % | ||||||||||||||||||||||
Tier 1 common risk-based capital ratio | 13.28 | % | 13.14 | % | 12.61 | % | ||||||||||||||||||||||
Tier 1 risk-based capital ratio | 13.97 | % | 13.83 | % | 13.34 | % | ||||||||||||||||||||||
Total risk-based capital ratio | 15.07 | % | 14.92 | % | 14.54 | % | ||||||||||||||||||||||
(1) - Excludes acquired loans and covered other real estate | ||||||||||||||||||||||||||||
(2) - Mississippi includes Central and Southern Mississippi Regions | ||||||||||||||||||||||||||||
(3) - Tennessee includes Memphis, Tennessee and Northern Mississippi Regions | ||||||||||||||||||||||||||||
(4) - Excludes acquired loans | ||||||||||||||||||||||||||||
n/m - percentage changes greater than +/- 100% are considered not meaningful | ||||||||||||||||||||||||||||
See Notes to Consolidated Financials |
TRUSTMARK CORPORATION AND SUBSIDIARIES CONSOLIDATED FINANCIAL INFORMATION June 30, 2015 ($ in thousands) (unaudited) |
Quarter Ended | Six Months Ended | |||||||||||||||||||||||||||
AVERAGE BALANCES | 6/30/2015 | 3/31/2015 | 12/31/2014 | 9/30/2014 | 6/30/2014 | 6/30/2015 | 6/30/2014 | |||||||||||||||||||||
Securities AFS-taxable | $ | 2,255,485 | $ | 2,190,344 | $ | 2,204,361 | $ | 2,202,020 | $ | 2,205,352 | $ | 2,223,094 | $ | 2,171,062 | ||||||||||||||
Securities AFS-nontaxable | 120,330 | 127,623 | 129,403 | 131,305 | 135,956 | 123,956 | 142,812 | |||||||||||||||||||||
Securities HTM-taxable | 1,143,273 | 1,119,979 | 1,117,989 | 1,126,309 | 1,120,448 | 1,131,690 | 1,119,602 | |||||||||||||||||||||
Securities HTM-nontaxable | 38,173 | 41,405 | 42,040 | 43,114 | 43,551 | 39,780 | 37,330 | |||||||||||||||||||||
Total securities | 3,557,261 | 3,479,351 | 3,493,793 | 3,502,748 | 3,505,307 | 3,518,520 | 3,470,806 | |||||||||||||||||||||
Loans (including loans held for sale) | 6,554,739 | 6,561,430 | 6,494,369 | 6,387,251 | 6,160,781 | 6,558,066 | 6,056,331 | |||||||||||||||||||||
Acquired loans: | ||||||||||||||||||||||||||||
Noncovered loans | 462,418 | 502,534 | 544,260 | 585,675 | 664,733 | 482,365 | 707,988 | |||||||||||||||||||||
Covered loans | 20,574 | 23,593 | 27,039 | 28,971 | 31,122 | 22,075 | 32,456 | |||||||||||||||||||||
Fed funds sold and rev repos | 557 | 217 | 1,269 | 4,228 | 2,648 | 388 | 4,543 | |||||||||||||||||||||
Other earning assets | 41,242 | 46,368 | 48,224 | 41,871 | 36,259 | 43,791 | 36,538 | |||||||||||||||||||||
Total earning assets | 10,636,791 | 10,613,493 | 10,608,954 | 10,550,744 | 10,400,850 | 10,625,205 | 10,308,662 | |||||||||||||||||||||
Allowance for loan losses | (84,331 | ) | (81,993 | ) | (82,851 | ) | (78,227 | ) | (77,652 | ) | (83,168 | ) | (78,688 | ) | ||||||||||||||
Cash and due from banks | 272,292 | 290,251 | 284,754 | 272,925 | 304,441 | 281,222 | 355,476 | |||||||||||||||||||||
Other assets | 1,288,507 | 1,303,552 | 1,317,217 | 1,345,771 | 1,343,384 | 1,295,989 | 1,359,614 | |||||||||||||||||||||
Total assets | $ | 12,113,259 | $ | 12,125,303 | $ | 12,128,074 | $ | 12,091,213 | $ | 11,971,023 | $ | 12,119,248 | $ | 11,945,064 | ||||||||||||||
Interest-bearing demand deposits | $ | 1,924,447 | $ | 1,847,374 | $ | 1,815,999 | $ | 1,808,710 | $ | 1,826,019 | $ | 1,886,123 | $ | 1,863,056 | ||||||||||||||
Savings deposits | 3,226,380 | 3,252,586 | 2,963,771 | 3,050,743 | 3,260,634 | 3,239,411 | 3,227,053 | |||||||||||||||||||||
Time deposits less than $100,000 | 1,101,477 | 1,139,912 | 1,152,622 | 1,187,794 | 1,225,706 | 1,120,588 | 1,252,958 | |||||||||||||||||||||
Time deposits of $100,000 or more | 751,129 | 785,715 | 838,309 | 874,333 | 911,531 | 768,326 | 929,421 | |||||||||||||||||||||
Total interest-bearing deposits | 7,003,433 | 7,025,587 | 6,770,701 | 6,921,580 | 7,223,890 | 7,014,448 | 7,272,488 | |||||||||||||||||||||
Fed funds purchased and repos | 497,606 | 421,206 | 526,482 | 540,870 | 387,289 | 459,617 | 335,341 | |||||||||||||||||||||
Short-term borrowings | 128,761 | 256,714 | 385,841 | 181,114 | 59,465 | 192,384 | 62,222 | |||||||||||||||||||||
Long-term FHLB advances | 1,213 | 1,243 | 2,652 | 8,050 | 8,291 | 1,228 | 8,348 | |||||||||||||||||||||
Subordinated notes | 49,947 | 49,939 | 49,931 | 49,923 | 49,915 | 49,943 | 49,911 | |||||||||||||||||||||
Junior subordinated debt securities | 61,856 | 61,856 | 61,856 | 61,856 | 61,856 | 61,856 | 61,856 | |||||||||||||||||||||
Total interest-bearing liabilities | 7,742,816 | 7,816,545 | 7,797,463 | 7,763,393 | 7,790,706 | 7,779,476 | 7,790,166 | |||||||||||||||||||||
Noninterest-bearing deposits | 2,772,741 | 2,741,945 | 2,762,332 | 2,774,745 | 2,676,907 | 2,757,428 | 2,653,973 | |||||||||||||||||||||
Other liabilities | 143,201 | 129,844 | 146,011 | 140,218 | 111,170 | 136,561 | 120,906 | |||||||||||||||||||||
Total liabilities | 10,658,758 | 10,688,334 | 10,705,806 | 10,678,356 | 10,578,783 | 10,673,465 | 10,565,045 | |||||||||||||||||||||
Shareholders' equity | 1,454,501 | 1,436,969 | 1,422,268 | 1,412,857 | 1,392,240 | 1,445,783 | 1,380,019 | |||||||||||||||||||||
Total liabilities and equity | $ | 12,113,259 | $ | 12,125,303 | $ | 12,128,074 | $ | 12,091,213 | $ | 11,971,023 | $ | 12,119,248 | $ | 11,945,064 | ||||||||||||||
PERIOD END BALANCES | 6/30/2015 | 3/31/2015 | 12/31/2014 | 9/30/2014 | 6/30/2014 | |||||||||||||||||||||||
Cash and due from banks | $ | 255,050 | $ | 335,244 | $ | 315,973 | $ | 237,497 | $ | 322,960 | ||||||||||||||||||
Fed funds sold and rev repos | - | - | 1,885 | 4,013 | 5,000 | |||||||||||||||||||||||
Securities available for sale | 2,446,383 | 2,381,459 | 2,374,567 | 2,363,895 | 2,376,431 | |||||||||||||||||||||||
Securities held to maturity | 1,190,161 | 1,184,554 | 1,170,685 | 1,169,640 | 1,156,790 | |||||||||||||||||||||||
Loans held for sale (LHFS) | 147,539 | 150,365 | 132,196 | 135,562 | 142,103 | |||||||||||||||||||||||
Loans held for investment (LHFI) | 6,447,073 | 6,413,876 | 6,449,469 | 6,333,651 | 6,187,000 | |||||||||||||||||||||||
Allowance for loan losses | (71,166 | ) | (71,321 | ) | (69,616 | ) | (70,134 | ) | (66,648 | ) | ||||||||||||||||||
Net LHFI | 6,375,907 | 6,342,555 | 6,379,853 | 6,263,517 | 6,120,352 | |||||||||||||||||||||||
Acquired loans: | ||||||||||||||||||||||||||||
Noncovered loans | 447,160 | 478,172 | 525,783 | 564,542 | 616,911 | |||||||||||||||||||||||
Covered loans | 19,239 | 20,271 | 23,626 | 27,607 | 29,628 | |||||||||||||||||||||||
Allowance for loan losses, acquired loans | (12,629 | ) | (11,837 | ) | (12,059 | ) | (11,949 | ) | (11,179 | ) | ||||||||||||||||||
Net acquired loans | 453,770 | 486,606 | 537,350 | 580,200 | 635,360 | |||||||||||||||||||||||
Net LHFI and acquired loans | 6,829,677 | 6,829,161 | 6,917,203 | 6,843,717 | 6,755,712 | |||||||||||||||||||||||
Premises and equipment, net | 196,220 | 198,039 | 200,781 | 200,474 | 201,639 | |||||||||||||||||||||||
Mortgage servicing rights | 71,422 | 62,903 | 64,358 | 67,090 | 65,049 | |||||||||||||||||||||||
Goodwill | 365,500 | 365,500 | 365,500 | 365,500 | 365,500 | |||||||||||||||||||||||
Identifiable intangible assets | 32,042 | 31,250 | 33,234 | 35,357 | 37,506 | |||||||||||||||||||||||
Other real estate, excluding covered other real estate | 90,748 | 90,175 | 92,509 | 97,037 | 106,970 | |||||||||||||||||||||||
Covered other real estate | 3,755 | 4,794 | 6,060 | 4,146 | 3,872 | |||||||||||||||||||||||
FDIC indemnification asset | 2,632 | 4,743 | 6,997 | 8,154 | 10,866 | |||||||||||||||||||||||
Other assets | 551,319 | 540,977 | 568,685 | 564,234 | 569,598 | |||||||||||||||||||||||
Total assets | $ | 12,182,448 | $ | 12,179,164 | $ | 12,250,633 | $ | 12,096,316 | $ | 12,119,996 | ||||||||||||||||||
Deposits: | ||||||||||||||||||||||||||||
Noninterest-bearing | $ | 2,819,171 | $ | 2,936,875 | $ | 2,748,635 | $ | 2,723,480 | $ | 2,729,199 | ||||||||||||||||||
Interest-bearing | 6,973,003 | 6,970,115 | 6,949,723 | 6,789,745 | 7,131,167 | |||||||||||||||||||||||
Total deposits | 9,792,174 | 9,906,990 | 9,698,358 | 9,513,225 | 9,860,366 | |||||||||||||||||||||||
Fed funds purchased and repos | 477,462 | 523,187 | 443,543 | 607,851 | 559,316 | |||||||||||||||||||||||
Short-term borrowings | 201,744 | 50,570 | 425,077 | 316,666 | 61,227 | |||||||||||||||||||||||
Long-term FHLB advances | 1,204 | 1,222 | 1,253 | 8,003 | 8,236 | |||||||||||||||||||||||
Subordinated notes | 49,953 | 49,944 | 49,936 | 49,928 | 49,920 | |||||||||||||||||||||||
Junior subordinated debt securities | 61,856 | 61,856 | 61,856 | 61,856 | 61,856 | |||||||||||||||||||||||
Other liabilities | 147,646 | 139,311 | 150,670 | 123,689 | 119,184 | |||||||||||||||||||||||
Total liabilities | 10,732,039 | 10,733,080 | 10,830,693 | 10,681,218 | 10,720,105 | |||||||||||||||||||||||
Common stock | 14,076 | 14,076 | 14,060 | 14,051 | 14,051 | |||||||||||||||||||||||
Capital surplus | 359,533 | 358,583 | 356,244 | 354,251 | 353,196 | |||||||||||||||||||||||
Retained earnings | 1,117,993 | 1,103,077 | 1,092,120 | 1,081,161 | 1,063,201 | |||||||||||||||||||||||
Accum other comprehensive | ||||||||||||||||||||||||||||
loss, net of tax | (41,193 | ) | (29,652 | ) | (42,484 | ) | (34,365 | ) | (30,557 | ) | ||||||||||||||||||
Total shareholders' equity | 1,450,409 | 1,446,084 | 1,419,940 | 1,415,098 | 1,399,891 | |||||||||||||||||||||||
Total liabilities and equity | $ | 12,182,448 | $ | 12,179,164 | $ | 12,250,633 | $ | 12,096,316 | $ | 12,119,996 | ||||||||||||||||||
See Notes to Consolidated Financials |
TRUSTMARK CORPORATION AND SUBSIDIARIES CONSOLIDATED FINANCIAL INFORMATION June 30, 2015 ($ in thousands except per share data) (unaudited) |
Quarter Ended | Six Months Ended | |||||||||||||||||||||||||||
INCOME STATEMENTS | 6/30/2015 | 3/31/2015 | 12/31/2014 | 9/30/2014 | 6/30/2014 | 6/30/2015 | 6/30/2014 | |||||||||||||||||||||
Interest and fees on LHFS & LHFI-FTE | $ | 71,546 | $ | 69,658 | $ | 70,775 | $ | 70,197 | $ | 69,618 | $ | 141,204 | $ | 135,803 | ||||||||||||||
Interest and fees on acquired loans | 12,557 | 15,078 | 13,500 | 23,200 | 23,250 | 27,635 | 40,036 | |||||||||||||||||||||
Interest on securities-taxable | 19,731 | 19,586 | 21,694 | 19,712 | 19,522 | �� | 39,317 | 38,742 | ||||||||||||||||||||
Interest on securities-tax exempt-FTE | 1,688 | 1,789 | 1,814 | 1,845 | 1,912 | 3,477 | 3,832 | |||||||||||||||||||||
Interest on fed funds sold and rev repos | 2 | - | 3 | 9 | 6 | 2 | 11 | |||||||||||||||||||||
Other interest income | 392 | 393 | 384 | 386 | 379 | 785 | 754 | |||||||||||||||||||||
Total interest income-FTE | 105,916 | 106,504 | 108,170 | 115,349 | 114,687 | 212,420 | 219,178 | |||||||||||||||||||||
Interest on deposits | 3,204 | 3,247 | 3,382 | 3,606 | 3,970 | 6,451 | 8,335 | |||||||||||||||||||||
Interest on fed funds pch and repos | 179 | 143 | 184 | 180 | 110 | 322 | 186 | |||||||||||||||||||||
Other interest expense | 1,614 | 1,649 | 1,510 | 1,425 | 1,375 | 3,263 | 2,738 | |||||||||||||||||||||
Total interest expense | 4,997 | 5,039 | 5,076 | 5,211 | 5,455 | 10,036 | 11,259 | |||||||||||||||||||||
Net interest income-FTE | 100,919 | 101,465 | 103,094 | 110,138 | 109,232 | 202,384 | 207,919 | |||||||||||||||||||||
Provision for loan losses, LHFI | 1,033 | 1,785 | (1,393 | ) | 3,058 | 351 | 2,818 | (454 | ) | |||||||||||||||||||
Provision for loan losses, acquired loans | 825 | 347 | 1,179 | 1,145 | 3,784 | 1,172 | 3,847 | |||||||||||||||||||||
Net interest income after provision-FTE | 99,061 | 99,333 | 103,308 | 105,935 | 105,097 | 198,394 | 204,526 | |||||||||||||||||||||
Service charges on deposit accounts | 11,920 | 11,085 | 12,514 | 12,743 | 11,846 | 23,005 | 23,414 | |||||||||||||||||||||
Insurance commissions | 9,401 | 8,616 | 7,831 | 9,240 | 8,300 | 18,017 | 16,397 | |||||||||||||||||||||
Wealth management | 7,758 | 7,990 | 8,460 | 8,038 | 7,710 | 15,748 | 15,845 | |||||||||||||||||||||
Bank card and other fees | 7,416 | 6,762 | 6,712 | 7,279 | 9,894 | 14,178 | 18,975 | |||||||||||||||||||||
Mortgage banking, net | 9,481 | 8,965 | 5,918 | 5,842 | 6,191 | 18,446 | 13,020 | |||||||||||||||||||||
Other, net | (433 | ) | (1,055 | ) | 596 | (160 | ) | 199 | (1,488 | ) | 178 | |||||||||||||||||
Nonint inc-excl sec gains (losses), net | 45,543 | 42,363 | 42,031 | 42,982 | 44,140 | 87,906 | 87,829 | |||||||||||||||||||||
Security gains (losses), net | - | - | - | (89 | ) | - | - | 389 | ||||||||||||||||||||
Total noninterest income | 45,543 | 42,363 | 42,031 | 42,893 | 44,140 | 87,906 | 88,218 | |||||||||||||||||||||
Salaries and employee benefits | 57,393 | 57,169 | 57,159 | 56,675 | 56,134 | 114,562 | 112,860 | |||||||||||||||||||||
Services and fees | 15,005 | 14,121 | 14,401 | 14,489 | 14,543 | 29,126 | 27,708 | |||||||||||||||||||||
Net occupancy-premises | 6,243 | 6,191 | 6,632 | 6,817 | 6,413 | 12,434 | 13,019 | |||||||||||||||||||||
Equipment expense | 5,903 | 5,974 | 5,911 | 5,675 | 6,136 | 11,877 | 12,274 | |||||||||||||||||||||
FDIC assessment expense | 2,615 | 2,940 | 2,669 | 2,644 | 2,468 | 5,555 | 4,884 | |||||||||||||||||||||
ORE/Foreclosure expense | 921 | 1,115 | 3,240 | 930 | 3,836 | 2,036 | 7,151 | |||||||||||||||||||||
Other expense | 12,186 | 11,706 | 14,420 | 12,964 | 13,231 | 23,892 | 26,483 | |||||||||||||||||||||
Total noninterest expense | 100,266 | 99,216 | 104,432 | 100,194 | 102,761 | 199,482 | 204,379 | |||||||||||||||||||||
Income before income taxes and tax eq adj | 44,338 | 42,480 | 40,907 | 48,634 | 46,476 | 86,818 | 88,365 | |||||||||||||||||||||
Tax equivalent adjustment | 3,970 | 4,073 | 4,179 | 3,909 | 3,944 | 8,043 | 7,727 | |||||||||||||||||||||
Income before income taxes | 40,368 | 38,407 | 36,728 | 44,725 | 42,532 | 78,775 | 80,638 | |||||||||||||||||||||
Income taxes | 9,766 | 9,259 | 8,655 | 11,136 | 9,635 | 19,025 | 18,738 | |||||||||||||||||||||
Net income | $ | 30,602 | $ | 29,148 | $ | 28,073 | $ | 33,589 | $ | 32,897 | $ | 59,750 | $ | 61,900 | ||||||||||||||
Per share data | ||||||||||||||||||||||||||||
Earnings per share - basic | $ | 0.45 | $ | 0.43 | $ | 0.42 | $ | 0.50 | $ | 0.49 | $ | 0.88 | $ | 0.92 | ||||||||||||||
Earnings per share - diluted | $ | 0.45 | $ | 0.43 | $ | 0.42 | $ | 0.50 | $ | 0.49 | $ | 0.88 | $ | 0.92 | ||||||||||||||
Dividends per share | $ | 0.23 | $ | 0.23 | $ | 0.23 | $ | 0.23 | $ | 0.23 | $ | 0.46 | $ | 0.46 | ||||||||||||||
Weighted average shares outstanding | ||||||||||||||||||||||||||||
Basic | 67,556,825 | 67,525,791 | 67,445,721 | 67,439,788 | 67,439,659 | 67,541,394 | 67,424,984 | |||||||||||||||||||||
Diluted | 67,685,449 | 67,639,326 | 67,633,637 | 67,608,612 | 67,582,714 | 67,662,757 | 67,566,640 | |||||||||||||||||||||
Period end shares outstanding | 67,557,395 | 67,556,591 | 67,481,992 | 67,439,788 | 67,439,788 | 67,557,395 | 67,439,788 | |||||||||||||||||||||
OTHER FINANCIAL DATA | ||||||||||||||||||||||||||||
Return on equity | 8.44 | % | 8.23 | % | 7.83 | % | 9.43 | % | 9.48 | % | 8.33 | % | 9.05 | % | ||||||||||||||
Return on average tangible equity | 12.05 | % | 11.86 | % | 11.40 | % | 13.70 | % | 13.90 | % | 11.96 | % | 13.43 | % | ||||||||||||||
Return on assets | 1.01 | % | 0.97 | % | 0.92 | % | 1.10 | % | 1.10 | % | 0.99 | % | 1.05 | % | ||||||||||||||
Interest margin - Yield - FTE | 3.99 | % | 4.07 | % | 4.05 | % | 4.34 | % | 4.42 | % | 4.03 | % | 4.29 | % | ||||||||||||||
Interest margin - Cost | 0.19 | % | 0.19 | % | 0.19 | % | 0.20 | % | 0.21 | % | 0.19 | % | 0.22 | % | ||||||||||||||
Net interest margin - FTE | 3.81 | % | 3.88 | % | 3.86 | % | 4.14 | % | 4.21 | % | 3.84 | % | 4.07 | % | ||||||||||||||
Efficiency ratio (1) | 66.00 | % | 66.46 | % | 69.16 | % | 62.80 | % | 64.31 | % | 66.23 | % | 66.24 | % | ||||||||||||||
Full-time equivalent employees | 2,989 | 3,038 | 3,060 | 3,067 | 3,095 | |||||||||||||||||||||||
STOCK PERFORMANCE | ||||||||||||||||||||||||||||
Market value-Close | $ | 24.98 | $ | 24.28 | $ | 24.54 | $ | 23.04 | $ | 24.69 | ||||||||||||||||||
Book value | $ | 21.47 | $ | 21.41 | $ | 21.04 | $ | 20.98 | $ | 20.76 | ||||||||||||||||||
Tangible book value | $ | 15.58 | $ | 15.53 | $ | 15.13 | $ | 15.04 | $ | 14.78 | ||||||||||||||||||
(1) - The efficiency ratio is noninterest expense to total net interest income (FTE) and noninterest income, excluding security gains (losses), amortization of | ||||||||||||||||||||||||||||
partnership tax credits, amortization of purchased intangibles, and nonroutine income and expense items. | ||||||||||||||||||||||||||||
See Notes to Consolidated Financials |
TRUSTMARK CORPORATION AND SUBSIDIARIES CONSOLIDATED FINANCIAL INFORMATION June 30, 2015 ($ in thousands) (unaudited) |
Quarter Ended | ||||||||||||||||||||||||||||
NONPERFORMING ASSETS (1) | 6/30/2015 | 3/31/2015 | 12/31/2014 | 9/30/2014 | 6/30/2014 | |||||||||||||||||||||||
Nonaccrual loans | ||||||||||||||||||||||||||||
Alabama | $ | 713 | $ | 902 | $ | 852 | $ | 852 | $ | 80 | ||||||||||||||||||
Florida | 7,892 | 8,179 | 11,091 | 10,986 | 11,041 | |||||||||||||||||||||||
Mississippi (2) | 52,051 | 52,145 | 57,129 | 65,751 | 49,430 | |||||||||||||||||||||||
Tennessee (3) | 5,468 | 4,197 | 5,819 | 5,901 | 4,244 | |||||||||||||||||||||||
Texas | 2,314 | 11,585 | 4,452 | 4,824 | 6,323 | |||||||||||||||||||||||
Total nonaccrual loans | 68,438 | 77,008 | 79,343 | 88,314 | 71,118 | |||||||||||||||||||||||
Other real estate | ||||||||||||||||||||||||||||
Alabama | 21,849 | 21,795 | 21,196 | 24,256 | 24,541 | |||||||||||||||||||||||
Florida | 31,059 | 34,746 | 35,324 | 36,608 | 43,207 | |||||||||||||||||||||||
Mississippi (2) | 14,094 | 15,143 | 17,397 | 16,419 | 18,723 | |||||||||||||||||||||||
Tennessee (3) | 9,707 | 10,072 | 10,292 | 11,347 | 12,073 | |||||||||||||||||||||||
Texas | 14,039 | 8,419 | 8,300 | 8,407 | 8,426 | |||||||||||||||||||||||
Total other real estate | 90,748 | 90,175 | 92,509 | 97,037 | 106,970 | |||||||||||||||||||||||
Total nonperforming assets | $ | 159,186 | $ | 167,183 | $ | 171,852 | $ | 185,351 | $ | 178,088 | ||||||||||||||||||
LOANS PAST DUE OVER 90 DAYS (4) | ||||||||||||||||||||||||||||
LHFI | $ | 1,771 | $ | 1,413 | $ | 2,764 | $ | 3,839 | $ | 1,936 | ||||||||||||||||||
LHFS-Guaranteed GNMA serviced loans | ||||||||||||||||||||||||||||
(no obligation to repurchase) | $ | 11,987 | $ | 7,584 | $ | 25,943 | $ | 24,979 | $ | 21,810 | ||||||||||||||||||
Quarter Ended | Six Months Ended | |||||||||||||||||||||||||||
ALLOWANCE FOR LOAN LOSSES (4) | 6/30/2015 | 3/31/2015 | 12/31/2014 | 9/30/2014 | 6/30/2014 | 6/30/2015 | 6/30/2014 | |||||||||||||||||||||
Beginning Balance | $ | 71,321 | $ | 69,616 | $ | 70,134 | $ | 66,648 | $ | 67,518 | $ | 69,616 | $ | 66,448 | ||||||||||||||
Provision for loan losses | 1,033 | 1,785 | (1,393 | ) | 3,058 | 351 | 2,818 | (454 | ) | |||||||||||||||||||
Charge-offs | (4,278 | ) | (3,004 | ) | (3,174 | ) | (3,216 | ) | (3,820 | ) | (7,282 | ) | (6,836 | ) | ||||||||||||||
Recoveries | 3,090 | 2,924 | 4,049 | 3,644 | 2,599 | 6,014 | 7,490 | |||||||||||||||||||||
Net (charge-offs) recoveries | (1,188 | ) | (80 | ) | 875 | 428 | (1,221 | ) | (1,268 | ) | 654 | |||||||||||||||||
Ending Balance | $ | 71,166 | $ | 71,321 | $ | 69,616 | $ | 70,134 | $ | 66,648 | $ | 71,166 | $ | 66,648 | ||||||||||||||
PROVISION FOR LOAN LOSSES (4) | ||||||||||||||||||||||||||||
Alabama | $ | 623 | $ | 761 | $ | 283 | $ | 1,093 | $ | 696 | $ | 1,384 | $ | 1,168 | ||||||||||||||
Florida | (1,168 | ) | 1,833 | (66 | ) | (147 | ) | (2,014 | ) | 665 | (5,513 | ) | ||||||||||||||||
Mississippi (2) | 2,046 | (2,729 | ) | (3,065 | ) | 4,679 | 2,877 | (683 | ) | 4,860 | ||||||||||||||||||
Tennessee (3) | (483 | ) | 1,432 | 1,993 | 244 | (277 | ) | 949 | (1,192 | ) | ||||||||||||||||||
Texas | 15 | 488 | (538 | ) | (2,811 | ) | (931 | ) | 503 | 223 | ||||||||||||||||||
Total provision for loan losses | $ | 1,033 | $ | 1,785 | $ | (1,393 | ) | $ | 3,058 | $ | 351 | $ | 2,818 | $ | (454 | ) | ||||||||||||
NET CHARGE-OFFS (4) | ||||||||||||||||||||||||||||
Alabama | $ | 216 | $ | 144 | $ | 92 | $ | 172 | $ | 84 | $ | 360 | $ | 139 | ||||||||||||||
Florida | 539 | (28 | ) | (226 | ) | (89 | ) | (525 | ) | 511 | (3,049 | ) | ||||||||||||||||
Mississippi (2) | 1,028 | 143 | (880 | ) | 462 | 1,518 | 1,171 | 2,194 | ||||||||||||||||||||
Tennessee (3) | 105 | (216 | ) | 325 | 48 | 87 | (111 | ) | 86 | |||||||||||||||||||
Texas | (700 | ) | 37 | (186 | ) | (1,021 | ) | 57 | (663 | ) | (24 | ) | ||||||||||||||||
Total net charge-offs (recoveries) | $ | 1,188 | $ | 80 | $ | (875 | ) | $ | (428 | ) | $ | 1,221 | $ | 1,268 | $ | (654 | ) | |||||||||||
CREDIT QUALITY RATIOS (1) | ||||||||||||||||||||||||||||
Net charge-offs/average loans | 0.07 | % | 0.00 | % | -0.05 | % | -0.03 | % | 0.08 | % | 0.04 | % | -0.02 | % | ||||||||||||||
Provision for loan losses/average loans | 0.06 | % | 0.11 | % | -0.09 | % | 0.19 | % | 0.02 | % | 0.09 | % | -0.02 | % | ||||||||||||||
Nonperforming loans/total loans (incl LHFS) | 1.04 | % | 1.17 | % | 1.21 | % | 1.37 | % | 1.12 | % | ||||||||||||||||||
Nonperforming assets/total loans (incl LHFS) | 2.41 | % | 2.55 | % | 2.61 | % | 2.87 | % | 2.81 | % | ||||||||||||||||||
Nonperforming assets/total loans (incl LHFS) +ORE | 2.38 | % | 2.51 | % | 2.57 | % | 2.82 | % | 2.77 | % | ||||||||||||||||||
ALL/total loans (excl LHFS) | 1.10 | % | 1.11 | % | 1.08 | % | 1.11 | % | 1.08 | % | ||||||||||||||||||
ALL-commercial/total commercial loans | 1.30 | % | 1.30 | % | 1.23 | % | 1.26 | % | 1.20 | % | ||||||||||||||||||
ALL-consumer/total consumer and home mortgage loans | 0.59 | % | 0.61 | % | 0.67 | % | 0.69 | % | 0.75 | % | ||||||||||||||||||
ALL/nonperforming loans | 103.99 | % | 92.62 | % | 87.74 | % | 79.41 | % | 93.71 | % | ||||||||||||||||||
ALL/nonperforming loans - | ||||||||||||||||||||||||||||
(excl impaired loans) | 192.60 | % | 205.52 | % | 180.95 | % | 178.81 | % | 159.71 | % | ||||||||||||||||||
CAPITAL RATIOS | ||||||||||||||||||||||||||||
Total equity/total assets | 11.91 | % | 11.87 | % | 11.59 | % | 11.70 | % | 11.55 | % | ||||||||||||||||||
Tangible equity/tangible assets | 8.93 | % | 8.91 | % | 8.62 | % | 8.67 | % | 8.51 | % | ||||||||||||||||||
Tangible equity/risk-weighted assets | 12.34 | % | 12.34 | % | 12.17 | % | 12.24 | % | 12.19 | % | ||||||||||||||||||
Tier 1 leverage ratio | 10.14 | % | 9.99 | % | 9.63 | % | 9.54 | % | 9.43 | % | ||||||||||||||||||
Tier 1 common risk-based capital ratio | 13.28 | % | 13.14 | % | 12.75 | % | 12.74 | % | 12.61 | % | ||||||||||||||||||
Tier 1 risk-based capital ratio | 13.97 | % | 13.83 | % | 13.47 | % | 13.47 | % | 13.34 | % | ||||||||||||||||||
Total risk-based capital ratio | 15.07 | % | 14.92 | % | 14.56 | % | 14.70 | % | 14.54 | % | ||||||||||||||||||
(1) - Excludes acquired loans and covered other real estate | ||||||||||||||||||||||||||||
(2) - Mississippi includes Central and Southern Mississippi Regions | ||||||||||||||||||||||||||||
(3) - Tennessee includes Memphis, Tennessee and Northern Mississippi Regions | ||||||||||||||||||||||||||||
(4) - Excludes acquired loans | ||||||||||||||||||||||||||||
See Notes to Consolidated Financials |
TRUSTMARK CORPORATION AND SUBSIDIARIES NOTES TO CONSOLIDATED FINANCIALS June 30, 2015 ($ in thousands) (unaudited) |
Note 1 - Securities Available for Sale and Held to Maturity
The following table is a summary of the estimated fair value of securities available for sale and the amortized cost of securities held to maturity ($ in thousands):
6/30/2015 | 3/31/2015 | 12/31/2014 | 9/30/2014 | 6/30/2014 | ||||||||||||||||
SECURITIES AVAILABLE FOR SALE | ||||||||||||||||||||
U.S. Treasury securities | $ | - | $ | - | $ | 100 | $ | 100 | $ | 100 | ||||||||||
U.S. Government agency obligations | ||||||||||||||||||||
Issued by U.S. Government agencies | 74,409 | 78,115 | 79,656 | 83,011 | 117,489 | |||||||||||||||
Issued by U.S. Government sponsored agencies | 33,009 | 33,076 | 32,818 | 30,779 | 40,848 | |||||||||||||||
Obligations of states and political subdivisions | 151,322 | 160,154 | 162,258 | 165,463 | 171,229 | |||||||||||||||
Mortgage-backed securities | ||||||||||||||||||||
Residential mortgage pass-through securities | ||||||||||||||||||||
Guaranteed by GNMA | 20,651 | 12,010 | 12,427 | 12,828 | 13,492 | |||||||||||||||
Issued by FNMA and FHLMC | 185,651 | 195,470 | 204,441 | 213,420 | 225,229 | |||||||||||||||
Other residential mortgage-backed securities | ||||||||||||||||||||
Issued or guaranteed by FNMA, FHLMC, or GNMA | 1,662,476 | 1,646,710 | 1,661,833 | 1,603,138 | 1,543,619 | |||||||||||||||
Commercial mortgage-backed securities | ||||||||||||||||||||
Issued or guaranteed by FNMA, FHLMC, or GNMA | 290,398 | 225,826 | 189,334 | 221,641 | 229,283 | |||||||||||||||
Asset-backed securities and structured financial products | 28,467 | 30,098 | 31,700 | 33,515 | 35,142 | |||||||||||||||
Total securities available for sale | $ | 2,446,383 | $ | 2,381,459 | $ | 2,374,567 | $ | 2,363,895 | $ | 2,376,431 | ||||||||||
SECURITIES HELD TO MATURITY | ||||||||||||||||||||
U.S. Government agency obligations | ||||||||||||||||||||
Issued by U.S. Government sponsored agencies | $ | 101,374 | $ | 101,171 | $ | 100,971 | $ | 100,767 | $ | 100,563 | ||||||||||
Obligations of states and political subdivisions | 56,978 | 62,928 | 63,505 | 64,538 | 65,193 | |||||||||||||||
Mortgage-backed securities | ||||||||||||||||||||
Residential mortgage pass-through securities | ||||||||||||||||||||
Guaranteed by GNMA | 18,265 | 18,861 | 19,115 | 13,368 | 13,959 | |||||||||||||||
Issued by FNMA and FHLMC | 10,965 | 11,341 | 11,437 | 11,816 | 12,165 | |||||||||||||||
Other residential mortgage-backed securities | ||||||||||||||||||||
Issued or guaranteed by FNMA, FHLMC, or GNMA | 838,989 | 842,827 | 834,176 | 836,966 | 822,444 | |||||||||||||||
Commercial mortgage-backed securities | ||||||||||||||||||||
Issued or guaranteed by FNMA, FHLMC, or GNMA | 163,590 | 147,426 | 141,481 | 142,185 | 142,466 | |||||||||||||||
Total securities held to maturity | $ | 1,190,161 | $ | 1,184,554 | $ | 1,170,685 | $ | 1,169,640 | $ | 1,156,790 |
During the fourth quarter of 2013, Trustmark reclassified approximately $1.099 billion of securities available for sale to securities held to maturity. The securities were transferred at fair value, which became the cost basis for the securities held to maturity. At the date of transfer, the net unrealized holding loss on the available for sale securities totaled approximately $46.6 million ($28.8 million, net of tax). The net unrealized holding loss is amortized over the remaining life of the securities as a yield adjustment in a manner consistent with the amortization or accretion of the original purchase premium or discount on the associated security. There were no gains or losses recognized as a result of the transfer. At June 30, 2015, the net unamortized, unrealized loss on the transferred securities included in accumulated other comprehensive (loss) income in the accompanying balance sheet totaled approximately $37.3 million ($23.0 million, net of tax).
Management continues to focus on asset quality as one of the strategic goals of the securities portfolio, which is evidenced by the investment of approximately 94% of the portfolio in GSE-backed obligations and other Aaa rated securities as determined by Moody’s. None of the securities owned by Trustmark are collateralized by assets which are considered sub-prime. Furthermore, outside of stock ownership in the Federal Home Loan Bank of Dallas, Federal Home Loan Bank of Atlanta and Federal Reserve Bank, Trustmark does not hold any other equity investment in a GSE.
TRUSTMARK CORPORATION AND SUBSIDIARIES NOTES TO CONSOLIDATED FINANCIALS June 30, 2015 ($ in thousands) (unaudited) |
Note 2 – Loan Composition
LHFI BY TYPE (excluding acquired loans) | 6/30/2015 | 3/31/2015 | 12/31/2014 | 9/30/2014 | 6/30/2014 | |||||||||||||||
Loans secured by real estate: | ||||||||||||||||||||
Construction, land development and other land loans | $ | 682,444 | $ | 691,657 | $ | 619,877 | $ | 580,794 | $ | 531,651 | ||||||||||
Secured by 1-4 family residential properties | 1,637,933 | 1,613,993 | 1,634,397 | 1,625,480 | 1,581,859 | |||||||||||||||
Secured by nonfarm, nonresidential properties | 1,567,035 | 1,516,895 | 1,553,193 | 1,560,901 | 1,544,516 | |||||||||||||||
Other real estate secured | 240,056 | 233,322 | 253,787 | 239,819 | 250,383 | |||||||||||||||
Commercial and industrial loans | 1,219,684 | 1,228,788 | 1,270,350 | 1,246,753 | 1,250,146 | |||||||||||||||
Consumer loans | 165,215 | 161,535 | 167,964 | 168,813 | 165,372 | |||||||||||||||
State and other political subdivision loans | 574,265 | 614,330 | 602,727 | 585,382 | 562,415 | |||||||||||||||
Other loans | 360,441 | 353,356 | 347,174 | 325,709 | 300,658 | |||||||||||||||
LHFI | 6,447,073 | 6,413,876 | 6,449,469 | 6,333,651 | 6,187,000 | |||||||||||||||
Allowance for loan losses | (71,166 | ) | (71,321 | ) | (69,616 | ) | (70,134 | ) | (66,648 | ) | ||||||||||
Net LHFI | $ | 6,375,907 | $ | 6,342,555 | $ | 6,379,853 | $ | 6,263,517 | $ | 6,120,352 |
ACQUIRED NONCOVERED LOANS BY TYPE | 6/30/2015 | 3/31/2015 | 12/31/2014 | 9/30/2014 | 6/30/2014 | |||||||||||||||
Loans secured by real estate: | ||||||||||||||||||||
Construction, land development and other land loans | $ | 50,867 | $ | 51,363 | $ | 58,309 | $ | 64,808 | $ | 75,353 | ||||||||||
Secured by 1-4 family residential properties | 101,027 | 111,830 | 116,920 | 120,366 | 133,191 | |||||||||||||||
Secured by nonfarm, nonresidential properties | 168,698 | 177,210 | 202,323 | 214,806 | 226,967 | |||||||||||||||
Other real estate secured | 25,666 | 26,819 | 27,813 | 28,036 | 30,918 | |||||||||||||||
Commercial and industrial loans | 73,732 | 81,261 | 88,256 | 103,185 | 114,212 | |||||||||||||||
Consumer loans | 7,273 | 8,494 | 9,772 | 11,236 | 14,733 | |||||||||||||||
Other loans | 19,897 | 21,195 | 22,390 | 22,105 | 21,537 | |||||||||||||||
Noncovered loans | 447,160 | 478,172 | 525,783 | 564,542 | 616,911 | |||||||||||||||
Allowance for loan losses | (11,927 | ) | (11,106 | ) | (10,541 | ) | (11,136 | ) | (9,770 | ) | ||||||||||
Net noncovered loans | $ | 435,233 | $ | 467,066 | $ | 515,242 | $ | 553,406 | $ | 607,141 |
ACQUIRED COVERED LOANS BY TYPE | 6/30/2015 | 3/31/2015 | 12/31/2014 | 9/30/2014 | 6/30/2014 | |||||||||||||||
Loans secured by real estate: | ||||||||||||||||||||
Construction, land development and other land loans | $ | 904 | $ | 1,447 | $ | 1,197 | $ | 1,721 | $ | 2,130 | ||||||||||
Secured by 1-4 family residential properties | 11,080 | 11,200 | 13,180 | 14,114 | 14,565 | |||||||||||||||
Secured by nonfarm, nonresidential properties | 5,206 | 5,844 | 7,672 | 8,270 | 8,831 | |||||||||||||||
Other real estate secured | 1,622 | 1,469 | 1,096 | 2,949 | 2,376 | |||||||||||||||
Commercial and industrial loans | 371 | 255 | 277 | 327 | 336 | |||||||||||||||
Consumer loans | - | - | - | - | - | |||||||||||||||
Other loans | 56 | 56 | 204 | 226 | 1,390 | |||||||||||||||
Covered loans | 19,239 | 20,271 | 23,626 | 27,607 | 29,628 | |||||||||||||||
Allowance for loan losses | (702 | ) | (731 | ) | (1,518 | ) | (813 | ) | (1,409 | ) | ||||||||||
Net covered loans | $ | 18,537 | $ | 19,540 | $ | 22,108 | $ | 26,794 | $ | 28,219 |
TRUSTMARK CORPORATION AND SUBSIDIARIES NOTES TO CONSOLIDATED FINANCIALS June 30, 2015 ($ in thousands) (unaudited) |
Note 2 – Loan Composition (continued) | ||||||||||||||||||||||||
June 30, 2015 | ||||||||||||||||||||||||
LHFI - COMPOSITION BY REGION (1) | Total | Alabama | Florida | Mississippi (Central and Southern Regions) | Tennessee (Memphis, TN and Northern MS Regions) | Texas | ||||||||||||||||||
Loans secured by real estate: | ||||||||||||||||||||||||
Construction, land development and other land loans | $ | 682,444 | $ | 90,143 | $ | 59,123 | $ | 250,180 | $ | 55,907 | $ | 227,091 | ||||||||||||
Secured by 1-4 family residential properties | 1,637,933 | 51,114 | 50,074 | 1,400,973 | 118,877 | 16,895 | ||||||||||||||||||
Secured by nonfarm, nonresidential properties | 1,567,035 | 127,686 | 163,491 | 771,774 | 147,094 | 356,990 | ||||||||||||||||||
Other real estate secured | 240,056 | 16,920 | 5,630 | 143,176 | 17,932 | 56,398 | ||||||||||||||||||
Commercial and industrial loans | 1,219,684 | 87,282 | 12,290 | 750,577 | 115,896 | 253,639 | ||||||||||||||||||
Consumer loans | 165,215 | 17,228 | 2,594 | 125,937 | 16,886 | 2,570 | ||||||||||||||||||
State and other political subdivision loans | 574,265 | 45,427 | 26,826 | 408,388 | 20,732 | 72,892 | ||||||||||||||||||
Other loans | 360,441 | 22,861 | 19,707 | 237,846 | 38,742 | 41,285 | ||||||||||||||||||
Loans | $ | 6,447,073 | $ | 458,661 | $ | 339,735 | $ | 4,088,851 | $ | 532,066 | $ | 1,027,760 | ||||||||||||
CONSTRUCTION, LAND DEVELOPMENT AND OTHER LAND LOANS BY REGION (1) | ||||||||||||||||||||||||
Lots | $ | 46,755 | $ | 5,766 | $ | 21,435 | $ | 13,767 | $ | 2,297 | $ | 3,490 | ||||||||||||
Development | 52,087 | 7,610 | 5,471 | 29,861 | 796 | 8,349 | ||||||||||||||||||
Unimproved land | 113,535 | 8,061 | 21,608 | 46,250 | 21,915 | 15,701 | ||||||||||||||||||
1-4 family construction | 144,864 | 24,526 | 10,127 | 69,343 | 1,941 | 38,927 | ||||||||||||||||||
Other construction | 325,203 | 44,180 | 482 | 90,959 | 28,958 | 160,624 | ||||||||||||||||||
Construction, land development and other land loans | $ | 682,444 | $ | 90,143 | $ | 59,123 | $ | 250,180 | $ | 55,907 | $ | 227,091 | ||||||||||||
LOANS SECURED BY NONFARM, NONRESIDENTIAL PROPERTIES BY REGION (1) | ||||||||||||||||||||||||
Income producing: | ||||||||||||||||||||||||
Retail | $ | 212,385 | $ | 36,496 | $ | 35,661 | $ | 71,404 | $ | 21,084 | $ | 47,740 | ||||||||||||
Office | 205,966 | 15,924 | 38,868 | 77,619 | 6,225 | 67,330 | ||||||||||||||||||
Nursing homes/assisted living | 76,658 | - | - | 70,847 | 5,811 | - | ||||||||||||||||||
Hotel/motel | 110,620 | 11,372 | 18,477 | 37,192 | 33,472 | 10,107 | ||||||||||||||||||
Industrial | 43,212 | 5,325 | 5,795 | 11,316 | 1,091 | 19,685 | ||||||||||||||||||
Health care | 25,319 | 2,174 | - | 23,126 | 19 | - | ||||||||||||||||||
Convenience stores | 13,471 | 239 | - | 7,356 | 1,180 | 4,696 | ||||||||||||||||||
Other | 154,628 | 6,257 | 19,021 | 69,527 | 3,089 | 56,734 | ||||||||||||||||||
Total income producing loans | 842,259 | 77,787 | 117,822 | 368,387 | 71,971 | 206,292 | ||||||||||||||||||
Owner-occupied: | ||||||||||||||||||||||||
Office | 114,409 | 7,234 | 17,756 | 57,401 | 7,887 | 24,131 | ||||||||||||||||||
Churches | 94,059 | 3,967 | 2,791 | 47,170 | 30,108 | 10,023 | ||||||||||||||||||
Industrial warehouses | 129,256 | 3,776 | 2,659 | 68,110 | 11,419 | 43,292 | ||||||||||||||||||
Health care | 110,329 | 13,310 | 8,182 | 59,034 | 10,044 | 19,759 | ||||||||||||||||||
Convenience stores | 66,751 | 463 | 1,492 | 49,544 | 2,914 | 12,338 | ||||||||||||||||||
Retail | 36,774 | 2,305 | 5,396 | 22,629 | 3,369 | 3,075 | ||||||||||||||||||
Restaurants | 33,161 | 1,946 | 1,908 | 23,960 | 3,928 | 1,419 | ||||||||||||||||||
Auto dealerships | 13,473 | 7,629 | 80 | 4,439 | 1,313 | 12 | ||||||||||||||||||
Other | 126,564 | 9,269 | 5,405 | 71,100 | 4,141 | 36,649 | ||||||||||||||||||
Total owner-occupied loans | 724,776 | 49,899 | 45,669 | 403,387 | 75,123 | 150,698 | ||||||||||||||||||
Loans secured by nonfarm, nonresidential properties | $ | 1,567,035 | $ | 127,686 | $ | 163,491 | $ | 771,774 | $ | 147,094 | $ | 356,990 | ||||||||||||
(1) Excludes acquired loans. |
TRUSTMARK CORPORATION AND SUBSIDIARIES NOTES TO CONSOLIDATED FINANCIALS June 30, 2015 ($ in thousands) (unaudited) |
The following table illustrates the yields on earning assets by category as well as the rates paid on interest-bearing liabilities on a tax equivalent basis:
Quarter Ended | Six Months Ended | |||||||||||||||||||||||||||
6/30/2015 | 3/31/2015 | 12/31/2014 | 9/30/2014 | 6/30/2014 | 6/30/2015 | 6/30/2014 | ||||||||||||||||||||||
Securities – taxable | 2.33 | % | 2.40 | % | 2.59 | % | 2.35 | % | 2.35 | % | 2.36 | % | 2.37 | % | ||||||||||||||
Securities – nontaxable | 4.27 | % | 4.29 | % | 4.20 | % | 4.20 | % | 4.27 | % | 4.28 | % | 4.29 | % | ||||||||||||||
Securities – total | 2.42 | % | 2.49 | % | 2.67 | % | 2.44 | % | 2.45 | % | 2.45 | % | 2.47 | % | ||||||||||||||
Loans - LHFI & LHFS | 4.38 | % | 4.31 | % | 4.32 | % | 4.36 | % | 4.53 | % | 4.34 | % | 4.52 | % | ||||||||||||||
Acquired loans | 10.43 | % | 11.62 | % | 9.38 | % | 14.98 | % | 13.40 | % | 11.05 | % | 10.90 | % | ||||||||||||||
Loans - total | 4.79 | % | 4.85 | % | 4.73 | % | 5.29 | % | 5.43 | % | 4.82 | % | 5.22 | % | ||||||||||||||
FF sold & rev repo | 1.44 | % | 0.00 | % | 0.94 | % | 0.84 | % | 0.91 | % | 1.04 | % | 0.49 | % | ||||||||||||||
Other earning assets | 3.81 | % | 3.44 | % | 3.16 | % | 3.66 | % | 4.19 | % | 3.61 | % | 4.16 | % | ||||||||||||||
Total earning assets | 3.99 | % | 4.07 | % | 4.05 | % | 4.34 | % | 4.42 | % | 4.03 | % | 4.29 | % | ||||||||||||||
Interest-bearing deposits | 0.18 | % | 0.19 | % | 0.20 | % | 0.21 | % | 0.22 | % | 0.19 | % | 0.23 | % | ||||||||||||||
FF pch & repo | 0.14 | % | 0.14 | % | 0.14 | % | 0.13 | % | 0.11 | % | 0.14 | % | 0.11 | % | ||||||||||||||
Other borrowings | 2.68 | % | 1.81 | % | 1.20 | % | 1.88 | % | 3.07 | % | 2.15 | % | 3.03 | % | ||||||||||||||
Total interest-bearing liabilities | 0.26 | % | 0.26 | % | 0.26 | % | 0.27 | % | 0.28 | % | 0.26 | % | 0.29 | % | ||||||||||||||
Net interest margin | 3.81 | % | 3.88 | % | 3.86 | % | 4.14 | % | 4.21 | % | 3.84 | % | 4.07 | % | ||||||||||||||
Net interest margin excluding acquired loans | 3.49 | % | 3.47 | % | 3.54 | % | 3.47 | % | 3.55 | % | 3.48 | % | 3.54 | % |
Reflected in the table above are yields on earning assets and liabilities, along with the net interest margin which equals reported net interest income-FTE, annualized, as a percent of average earning assets. In addition, the table includes net interest margin excluding acquired loans, which equals reported net interest income-FTE excluding interest income on acquired loans, annualized, as a percent of average earning assets excluding average acquired loans. The net interest margin decreased 7 basis points during the second quarter of 2015. The decline in the net interest margin was primarily due to a $2.2 million decrease in accretion and recoveries on acquired loans during the second quarter of 2015.
The net interest margin, excluding acquired loans, increased 2 basis points to 3.49% during the second quarter of 2015 from a total of 3.47% during the first quarter of 2015. During the fourth quarter of 2014, the net interest margin, excluding acquired loans as well as $2.2 million of yield maintenance payments on prepaid securities, totaled 3.46%.
Note 4 – Mortgage Banking
Trustmark utilizes a portfolio of exchange-traded derivative instruments, such as Treasury note futures contracts and option contracts, to achieve a fair value return that offsets the changes in fair value of mortgage servicing rights (MSR) attributable to interest rates. These transactions are considered freestanding derivatives that do not otherwise qualify for hedge accounting under generally accepted accounting principles (GAAP). Changes in the fair value of these exchange-traded derivative instruments, including administrative costs, are recorded in noninterest income in mortgage banking, net and are offset by the changes in the fair value of the MSR. The MSR fair value represents the present value of future cash flows, which among other things includes decay and the effect of changes in interest rates. Ineffectiveness of hedging the MSR fair value is measured by comparing the change in value of hedge instruments to the change in the fair value of the MSR asset attributable to changes in interest rates and other market driven changes in valuation inputs and assumptions. The impact of this strategy resulted in a net positive ineffectiveness of $2.1 million and $546 thousand for the quarters ended June 30, 2015 and 2014, respectively.
The following table illustrates the components of mortgage banking revenues included in noninterest income in the accompanying income statements:
Quarter Ended | Six Months Ended | |||||||||||||||||||||||||||
6/30/2015 | 3/31/2015 | 12/31/2014 | 9/30/2014 | 6/30/2014 | 6/30/2015 | 6/30/2014 | ||||||||||||||||||||||
Mortgage servicing income, net | $ | 4,696 | $ | 4,897 | $ | 4,814 | $ | 4,674 | $ | 4,592 | $ | 9,593 | $ | 9,131 | ||||||||||||||
Change in fair value-MSR from runoff | (2,587 | ) | (2,213 | ) | (1,999 | ) | (2,364 | ) | (2,391 | ) | (4,800 | ) | (4,203 | ) | ||||||||||||||
Gain on sales of loans, net | 5,114 | 3,716 | 2,910 | 3,272 | 2,749 | 8,830 | 4,588 | |||||||||||||||||||||
Other, net | 206 | 1,245 | 132 | (323 | ) | 695 | 1,451 | 1,095 | ||||||||||||||||||||
Mortgage banking income before hedge ineffectiveness | 7,429 | 7,645 | 5,857 | 5,259 | 5,645 | 15,074 | 10,611 | |||||||||||||||||||||
Change in fair value-MSR from market changes | 6,076 | (2,368 | ) | (4,142 | ) | 700 | (3,038 | ) | 3,708 | (3,761 | ) | |||||||||||||||||
Change in fair value of derivatives | (4,024 | ) | 3,688 | 4,203 | (117 | ) | 3,584 | (336 | ) | 6,170 | ||||||||||||||||||
Net positive hedge ineffectiveness | 2,052 | 1,320 | 61 | 583 | 546 | 3,372 | 2,409 | |||||||||||||||||||||
Mortgage banking, net | $ | 9,481 | $ | 8,965 | $ | 5,918 | $ | 5,842 | $ | 6,191 | $ | 18,446 | $ | 13,020 |
During the first quarter of 2015, Trustmark exercised its option to repurchase delinquent loans serviced for GNMA. These loans were subsequently sold to a third party under different repurchase provisions. Trustmark retained the servicing for these loans, which are fully guaranteed by FHA/VA. As a result of this repurchase and sale, the loans are no longer carried as "LHFS-Guaranteed GNMA serviced loans" (see pages 3 and 6). The transaction resulted in a gain of $304 thousand, which was recorded during the first quarter of 2015 and is included in the table above as "Gain on sales of loans, net.”
TRUSTMARK CORPORATION AND SUBSIDIARIES NOTES TO CONSOLIDATED FINANCIALS June 30, 2015 ($ in thousands) (unaudited) |
Note 5 – Other Noninterest Income and Expense
Other noninterest income consisted of the following for the periods presented ($ in thousands):
Quarter Ended | Six Months Ended | |||||||||||||||||||||||||||
6/30/2015 | 3/31/2015 | 12/31/2014 | 9/30/2014 | 6/30/2014 | 6/30/2015 | 6/30/2014 | ||||||||||||||||||||||
Partnership amortization for tax credit purposes | $ | (2,480 | ) | $ | (2,472 | ) | $ | (2,806 | ) | $ | (3,006 | ) | $ | (3,006 | ) | $ | (4,952 | ) | $ | (6,012 | ) | |||||||
Decrease in FDIC indemnification asset | (1,798 | ) | (970 | ) | (735 | ) | (452 | ) | (999 | ) | (2,768 | ) | (1,687 | ) | ||||||||||||||
Increase in life insurance cash surrender value | 1,673 | 1,675 | 1,693 | 1,702 | 1,857 | 3,348 | 3,945 | |||||||||||||||||||||
Other miscellaneous income | 2,172 | 712 | 2,444 | 1,596 | 2,347 | 2,884 | 3,932 | |||||||||||||||||||||
Total other, net | $ | (433 | ) | $ | (1,055 | ) | $ | 596 | $ | (160 | ) | $ | 199 | $ | (1,488 | ) | $ | 178 |
Trustmark invests in partnerships that provide income tax credits on a Federal and/or State basis (i.e., new market tax credits, low income housing tax credits or historical tax credits). These investments are recorded based on the equity method of accounting, which requires the equity in partnership losses to be recognized when incurred and are recorded as a reduction in other income. The income tax credits related to these partnerships are utilized as specifically allowed by income tax law and are recorded as a reduction in income tax expense.
During the second quarter of 2015, other noninterest income included a write-down of the FDIC indemnification asset of $1.8 million on acquired covered loans and covered other real estate obtained from the Heritage Banking Group as a result of loan pay-offs, real estate sales, improved cash flow projections and valuation of covered other real estate.
Other noninterest expense consisted of the following for the periods presented ($ in thousands):
Quarter Ended | Six Months Ended | |||||||||||||||||||||||||||
6/30/2015 | 3/31/2015 | 12/31/2014 | 9/30/2014 | 6/30/2014 | 6/30/2015 | 6/30/2014 | ||||||||||||||||||||||
Loan expense | $ | 3,342 | $ | 2,721 | $ | 3,312 | $ | 3,070 | $ | 3,107 | $ | 6,063 | $ | 6,571 | ||||||||||||||
Amortization of intangibles | 1,959 | 1,991 | 2,123 | 2,150 | 2,190 | 3,950 | 4,483 | |||||||||||||||||||||
Other miscellaneous expense | 6,885 | 6,994 | 8,985 | 7,744 | 7,934 | 13,879 | 15,429 | |||||||||||||||||||||
Total other expense | $ | 12,186 | $ | 11,706 | $ | 14,420 | $ | 12,964 | $ | 13,231 | $ | 23,892 | $ | 26,483 |
Note 6 – Non-GAAP Financial Measures
In addition to capital ratios defined by GAAP and banking regulators, Trustmark utilizes various tangible common equity measures when evaluating capital utilization and adequacy. Tangible common equity, as defined by Trustmark, represents common equity less goodwill and identifiable intangible assets.
Trustmark believes these measures are important because they reflect the level of capital available to withstand unexpected market conditions. Additionally, presentation of these measures allows readers to compare certain aspects of Trustmark’s capitalization to other organizations. These ratios differ from capital measures defined by banking regulators principally in that the numerator excludes shareholders’ equity associated with preferred securities, the nature and extent of which varies across organizations.
These calculations are intended to complement the capital ratios defined by GAAP and banking regulators. Because GAAP does not include these capital ratio measures, Trustmark believes there are no comparable GAAP financial measures to these tangible common equity ratios. Despite the importance of these measures to Trustmark, there are no standardized definitions for them and, as a result, Trustmark’s calculations may not be comparable with other organizations. Also there may be limits in the usefulness of these measures to investors. As a result, Trustmark encourages readers to consider its consolidated financial statements in their entirety and not to rely on any single financial measure. The following table reconciles Trustmark’s calculation of these measures to amounts reported under GAAP.
TRUSTMARK CORPORATION AND SUBSIDIARIES NOTES TO CONSOLIDATED FINANCIALS June 30, 2015 ($ in thousands) (unaudited) |
Note 6 - Non-GAAP Financial Measures (continued) | |||||||||||||||||||||||||||||||
Quarter Ended | Six Months Ended | ||||||||||||||||||||||||||||||
6/30/2015 | 3/31/2015 | 12/31/2014 | 9/30/2014 | 6/30/2014 | 6/30/2015 | 6/30/2014 | |||||||||||||||||||||||||
TANGIBLE EQUITY | |||||||||||||||||||||||||||||||
AVERAGE BALANCES | |||||||||||||||||||||||||||||||
Total shareholders' equity | $ | 1,454,501 | $ | 1,436,969 | $ | 1,422,268 | $ | 1,412,857 | $ | 1,392,240 | $ | 1,445,783 | $ | 1,380,019 | |||||||||||||||||
Less: | Goodwill | (365,500 | ) | (365,500 | ) | (365,500 | ) | (365,500 | ) | (365,500 | ) | (365,500 | ) | (369,090 | ) | ||||||||||||||||
Identifiable intangible assets | (30,385 | ) | (32,398 | ) | (34,411 | ) | (36,553 | ) | (38,711 | ) | (31,386 | ) | (39,857 | ) | |||||||||||||||||
Total average tangible equity | $ | 1,058,616 | $ | 1,039,071 | $ | 1,022,357 | $ | 1,010,804 | $ | 988,029 | $ | 1,048,897 | $ | 971,072 | |||||||||||||||||
PERIOD END BALANCES | |||||||||||||||||||||||||||||||
Total shareholders' equity | $ | 1,450,409 | $ | 1,446,084 | $ | 1,419,940 | $ | 1,415,098 | $ | 1,399,891 | |||||||||||||||||||||
Less: | Goodwill | (365,500 | ) | (365,500 | ) | (365,500 | ) | (365,500 | ) | (365,500 | ) | ||||||||||||||||||||
Identifiable intangible assets | (32,042 | ) | (31,250 | ) | (33,234 | ) | (35,357 | ) | (37,506 | ) | |||||||||||||||||||||
Total tangible equity | (a) | $ | 1,052,867 | $ | 1,049,334 | $ | 1,021,206 | $ | 1,014,241 | $ | 996,885 | ||||||||||||||||||||
TANGIBLE ASSETS | |||||||||||||||||||||||||||||||
Total assets | $ | 12,182,448 | $ | 12,179,164 | $ | 12,250,633 | $ | 12,096,316 | $ | 12,119,996 | |||||||||||||||||||||
Less: | Goodwill | (365,500 | ) | (365,500 | ) | (365,500 | ) | (365,500 | ) | (365,500 | ) | ||||||||||||||||||||
Identifiable intangible assets | (32,042 | ) | (31,250 | ) | (33,234 | ) | (35,357 | ) | (37,506 | ) | |||||||||||||||||||||
Total tangible assets | (b) | $ | 11,784,906 | $ | 11,782,414 | $ | 11,851,899 | $ | 11,695,459 | $ | 11,716,990 | ||||||||||||||||||||
Risk-weighted assets | (c) | $ | 8,530,144 | $ | 8,503,102 | $ | 8,387,799 | $ | 8,287,608 | $ | 8,175,622 | ||||||||||||||||||||
NET INCOME ADJUSTED FOR INTANGIBLE AMORTIZATION | |||||||||||||||||||||||||||||||
Net income | $ | 30,602 | $ | 29,148 | $ | 28,073 | $ | 33,589 | $ | 32,897 | $ | 59,750 | $ | 61,900 | |||||||||||||||||
Plus: | Intangible amortization net of tax | 1,210 | 1,229 | 1,312 | 1,328 | 1,353 | 2,439 | 2,770 | |||||||||||||||||||||||
Net income adjusted for intangible amortization | $ | 31,812 | $ | 30,377 | $ | 29,385 | $ | 34,917 | $ | 34,250 | $ | 62,189 | $ | 64,670 | |||||||||||||||||
Period end common shares outstanding | (d) | 67,557,395 | 67,556,591 | 67,481,992 | 67,439,788 | 67,439,788 | |||||||||||||||||||||||||
TANGIBLE COMMON EQUITY MEASUREMENTS | |||||||||||||||||||||||||||||||
Return on average tangible equity (1) | 12.05 | % | 11.86 | % | 11.40 | % | 13.70 | % | 13.90 | % | 11.96 | % | 13.43 | % | |||||||||||||||||
Tangible equity/tangible assets | (a)/(b) | 8.93 | % | 8.91 | % | 8.62 | % | 8.67 | % | 8.51 | % | ||||||||||||||||||||
Tangible equity/risk-weighted assets | (a)/(c) | 12.34 | % | 12.34 | % | 12.17 | % | 12.24 | % | 12.19 | % | ||||||||||||||||||||
Tangible book value | (a)/(d)*1,000 | $ | 15.58 | $ | 15.53 | $ | 15.13 | $ | 15.04 | $ | 14.78 | ||||||||||||||||||||
TIER 1 COMMON RISK-BASED CAPITAL - BASEL I | |||||||||||||||||||||||||||||||
Total shareholders' equity | $ | 1,419,940 | $ | 1,415,098 | $ | 1,399,891 | |||||||||||||||||||||||||
Eliminate qualifying AOCI | 42,484 | 34,365 | 30,557 | ||||||||||||||||||||||||||||
Qualifying tier 1 capital | 60,000 | 60,000 | 60,000 | ||||||||||||||||||||||||||||
Disallowed goodwill | (365,500 | ) | (365,500 | ) | (365,500 | ) | |||||||||||||||||||||||||
Adj to goodwill allowed for deferred taxes | 15,855 | 15,503 | 15,150 | ||||||||||||||||||||||||||||
Other disallowed intangibles | (33,234 | ) | (35,357 | ) | (37,506 | ) | |||||||||||||||||||||||||
Disallowed servicing intangible | (6,436 | ) | (6,709 | ) | (6,505 | ) | |||||||||||||||||||||||||
Disallowed deferred taxes | (3,479 | ) | (1,234 | ) | (5,134 | ) | |||||||||||||||||||||||||
Total tier 1 capital | 1,129,630 | 1,116,166 | 1,090,953 | ||||||||||||||||||||||||||||
Less: | Qualifying tier 1 capital | (60,000 | ) | (60,000 | ) | (60,000 | ) | ||||||||||||||||||||||||
Total tier 1 common capital | (e) | $ | 1,069,630 | $ | 1,056,166 | $ | 1,030,953 | ||||||||||||||||||||||||
Tier 1 common risk-based capital ratio | (e)/(c) | 12.75 | % | 12.74 | % | 12.61 | % | ||||||||||||||||||||||||
COMMON EQUITY TIER 1 CAPITAL (CET1) - BASEL III | |||||||||||||||||||||||||||||||
Total shareholders' equity | $ | 1,450,409 | $ | 1,446,084 | |||||||||||||||||||||||||||
AOCI-related adjustments | 41,193 | 29,652 | |||||||||||||||||||||||||||||
CET1 adjustments and deductions: | |||||||||||||||||||||||||||||||
Goodwill net of associated deferred tax liabilities (DTLs) | (348,940 | ) | (349,292 | ) | |||||||||||||||||||||||||||
Other adjustments and deductions for CET1 (2) | (9,568 | ) | (9,104 | ) | |||||||||||||||||||||||||||
CET1 capital | (f) | 1,133,094 | 1,117,340 | ||||||||||||||||||||||||||||
Additional tier 1 capital instruments plus related surplus | 60,000 | 60,000 | |||||||||||||||||||||||||||||
Less: additional tier 1 capital deductions | (1,571 | ) | (1,762 | ) | |||||||||||||||||||||||||||
Additional tier 1 capital | 58,429 | 58,238 | |||||||||||||||||||||||||||||
Tier 1 capital | $ | 1,191,523 | $ | 1,175,578 | |||||||||||||||||||||||||||
Tier 1 common risk-based capital ratio | (f)/(c) | 13.28 | % | 13.14 | % | ||||||||||||||||||||||||||
(1) Calculation = ((net income adjusted for intangible amortization/number of days in period)*number of days in year)/total average tangible equity | |||||||||||||||||||||||||||||||
(2) Includes other intangible assets, net of DTLs, disallowed deferred tax assets (DTAS), threshold deductions and transition adjustments, as applicable. |