Trustmark Corporation Announces 2015 Financial Results
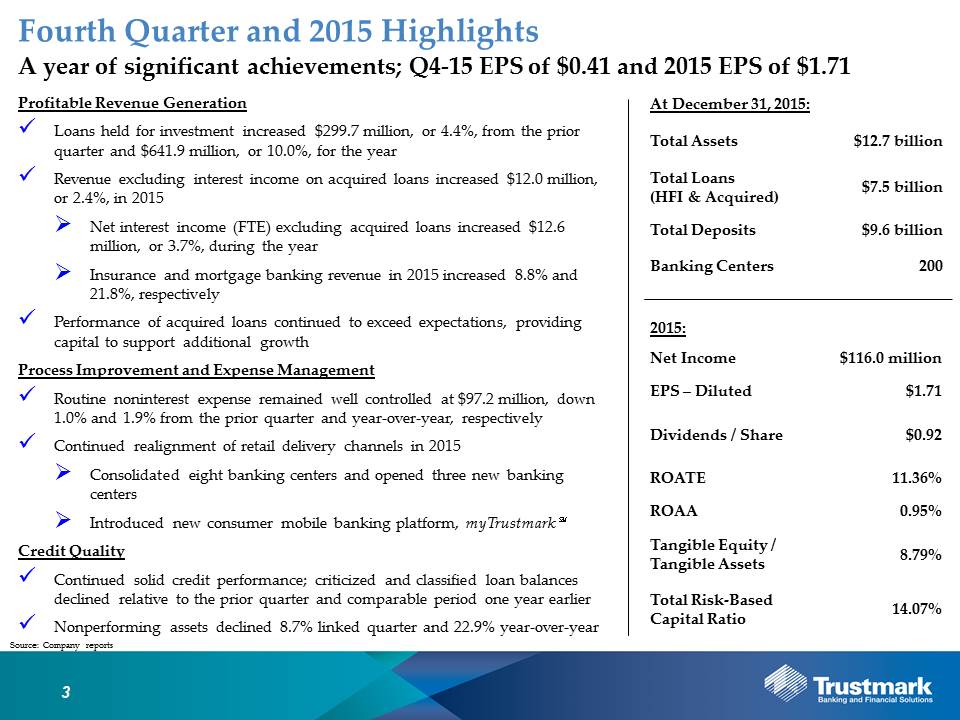
JACKSON, Miss. – January 26, 2016 – Trustmark Corporation (NASDAQ:TRMK) reported net income of $27.9 million in the fourth quarter of 2015, which represented diluted earnings per share of $0.41. For the full year, Trustmark’s net income totaled $116.0 million, which represented diluted earnings per share of $1.71, and produced a return on average tangible equity of 11.36% and a return on average assets of 0.95%. Trustmark’s Board of Directors declared a quarterly cash dividend of $0.23 per share payable March 15, 2016, to shareholders of record on March 1, 2016.
Fourth Quarter Highlights
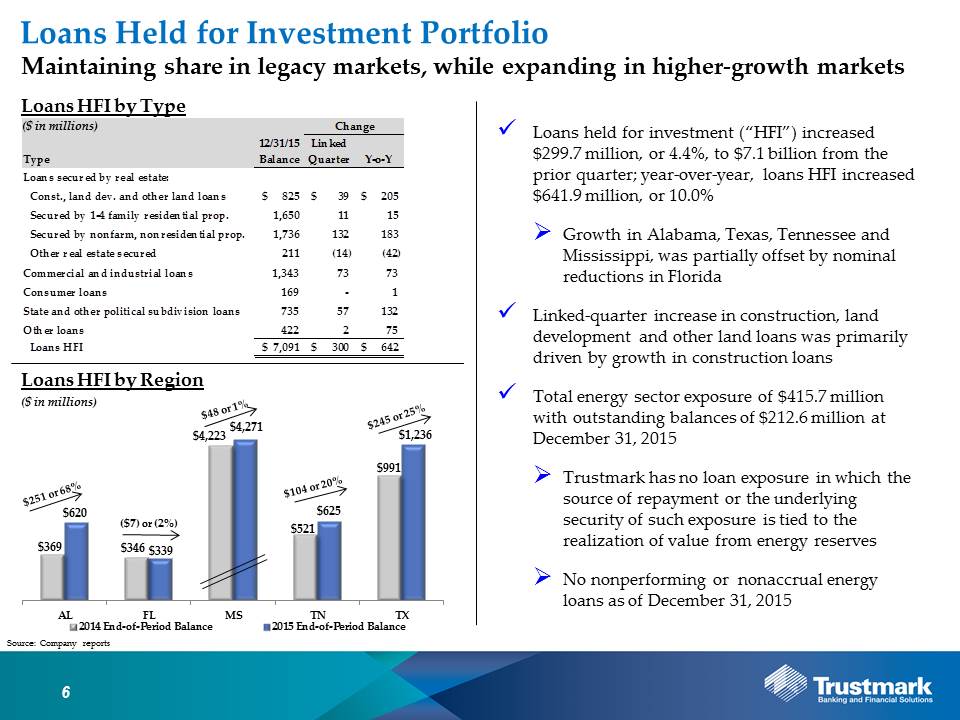
| ● | Loans held for investment increased $299.7 million, or 4.4%, from the prior quarter and $641.9 million, or 10.0%, from the comparable period one year earlier |
| ● | Credit quality remained solid; nonperforming assets declined 8.7% and 22.9% from the prior quarter and year-over-year, respectively |
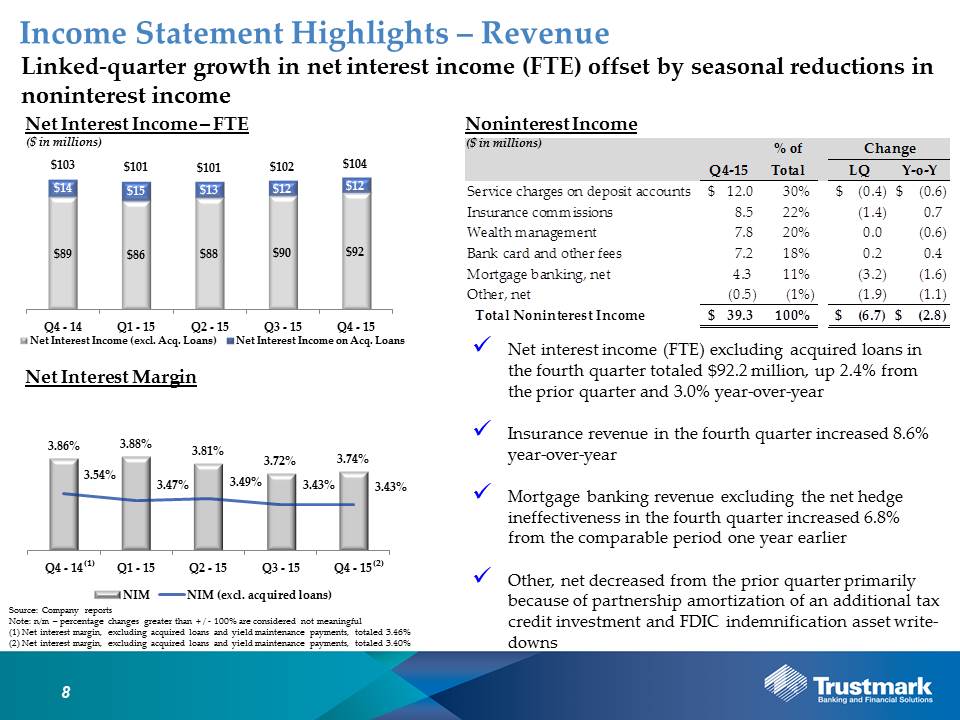
| ● | Net interest income (FTE) excluding acquired loans in the fourth quarter totaled $92.2 million, up 2.4% from the prior quarter and 3.0% year-over-year |
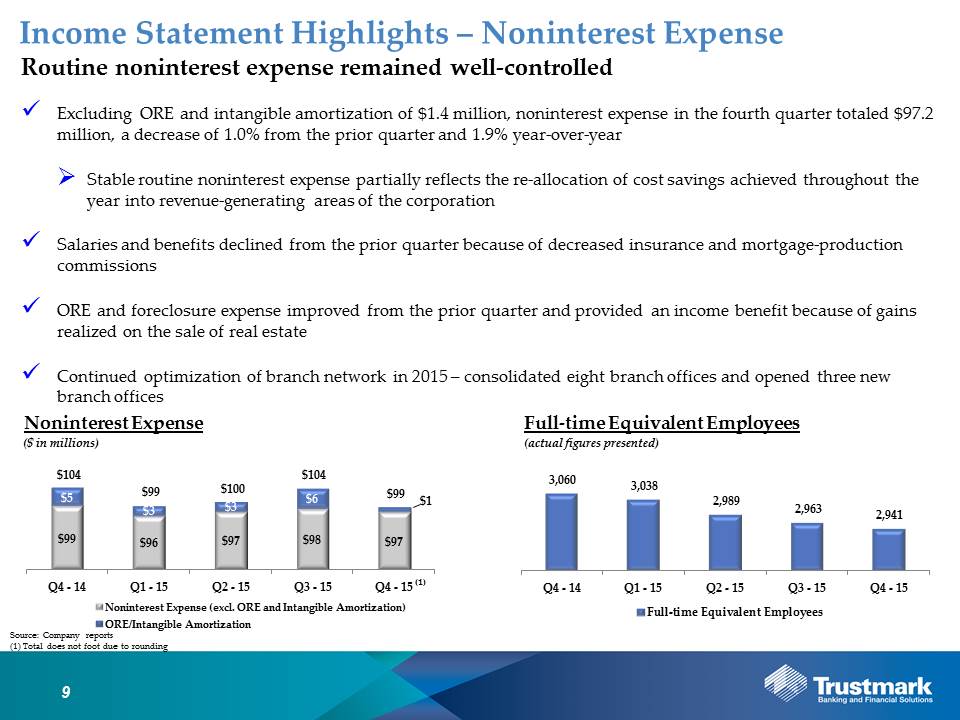
| ● | Routine noninterest expense, which excludes ORE and intangible amortization, totaled $97.2 million, down 1.0% and 1.9% from the prior quarter and year-over-year, respectively |
Gerard R. Host, President and CEO, stated, “We made significant achievements in 2015. Throughout the year, we realigned the expense base and reallocated cost savings into areas such as technology, including enhanced performance measurements systems and myTrustmark℠, our new consumer mobile banking service. We also continued to invest in higher-growth markets via new banking centers and loan production offices, while also retaining additional relationship managers. The initial results of these investments are evident in this past year’s results, but ultimately we anticipate their impact to be greater over time. As we look forward in 2016, we will continue to manage the franchise for the long term by expanding and building sustainable relationships, an ideal that has worked for the past 126 years. Thanks to our associates, solid profitability and strong capital base, Trustmark remains well-positioned to continue meeting the needs of our customers and creating long-term value for our shareholders.”
Balance Sheet Management
| ● | Loans held for investment expanded $641.9 million, or 10.0%, in 2015 |
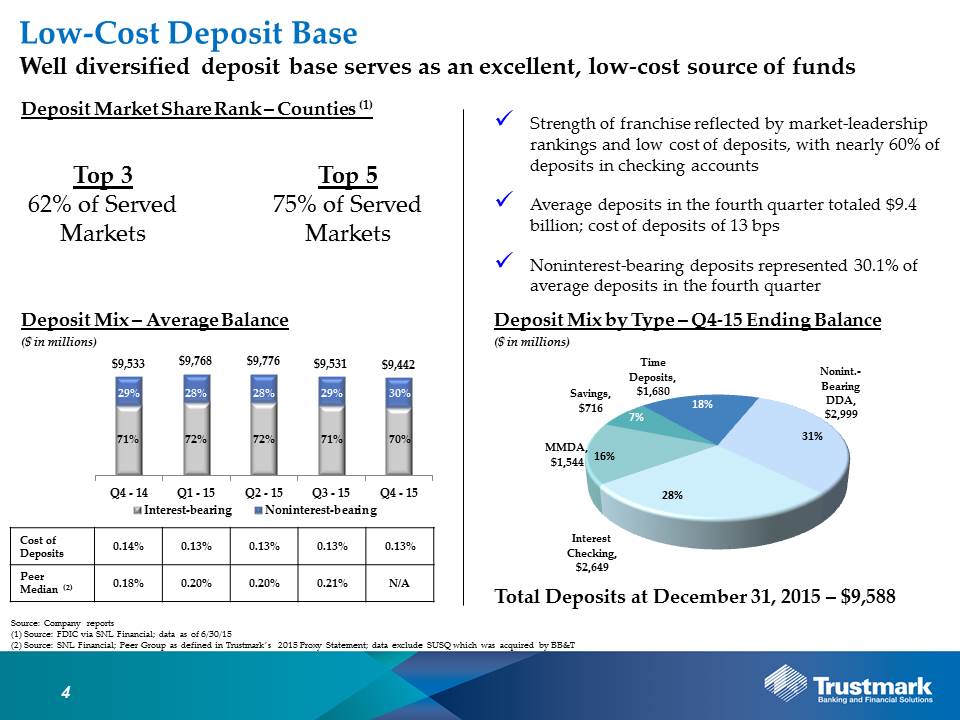
| ● | Average noninterest-bearing deposits in 2015 increased 2.6% and represented 28.9% of average total deposits |
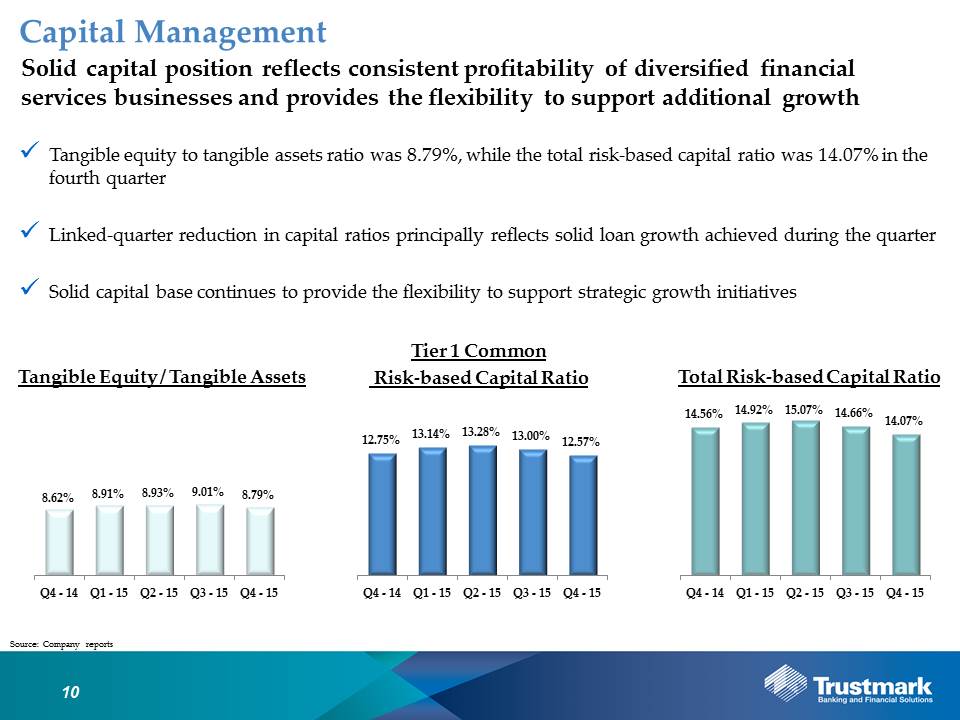
| ● | Solid capital base provides flexibility to support additional growth |
Loans held for investment totaled $7.1 billion at December 31, 2015, an increase of 4.4% from the prior quarter and 10.0% from the same period one year earlier. Compared to the prior quarter, loans secured by nonfarm, nonresidential real estate expanded $132.0 million, resulting from growth in Texas, Alabama, Mississippi and Florida. Commercial and industrial loans increased $72.9 million as growth in Texas, Tennessee and Alabama, more than offset declines in Mississippi and Florida. Loans to state and other political subdivisions increased $57.1 million, led principally by growth in Mississippi and Texas. Construction, land development and other land loans expanded $39.3 million, driven primarily by growth in construction loans.
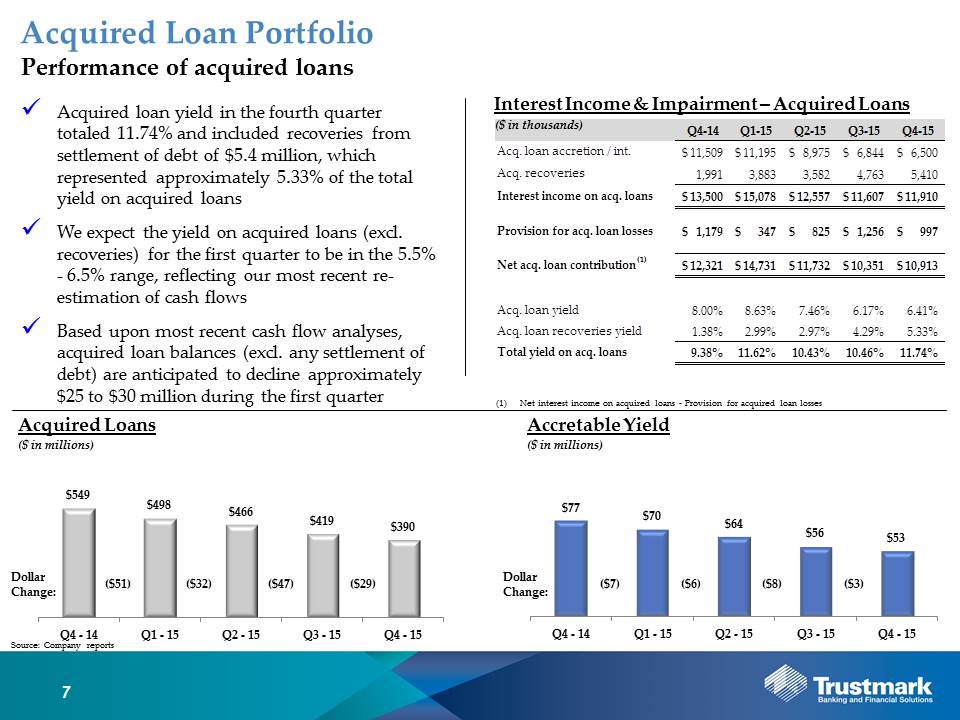
Acquired loans totaled $390.4 million at December 31, 2015, down $28.8 million from the prior quarter. Collectively, loans held for investment and acquired loans totaled $7.5 billion at December 31, 2015, up $271.0 million, or 3.8%, from the prior quarter.
Deposits totaled $9.6 billion at December 31, 2015, an increase of $175.8 million from the prior quarter. Trustmark continues to maintain an attractive, low-cost deposit base with approximately 60% of deposits in checking accounts and a total cost of deposits of 0.13%. The favorable mix of interest-bearing liabilities yielded a total cost of funds of 0.26% for the fourth quarter of 2015.
Trustmark’s capital position remained solid, reflecting the consistent profitability of its diversified financial services businesses. At December 31, 2015, Trustmark’s tangible equity to tangible assets ratio was 8.79%, while its total risk-based capital ratio was 14.07%. Tangible book value per share was $15.98 at December 31, 2015, up 5.6% year-over-year.
Credit Quality
| ● | Solid improvement in criticized and classified loan balances |
| ● | Nonperforming loans and other real estate decreased 30.3% and 16.6%, respectively, in 2015 |
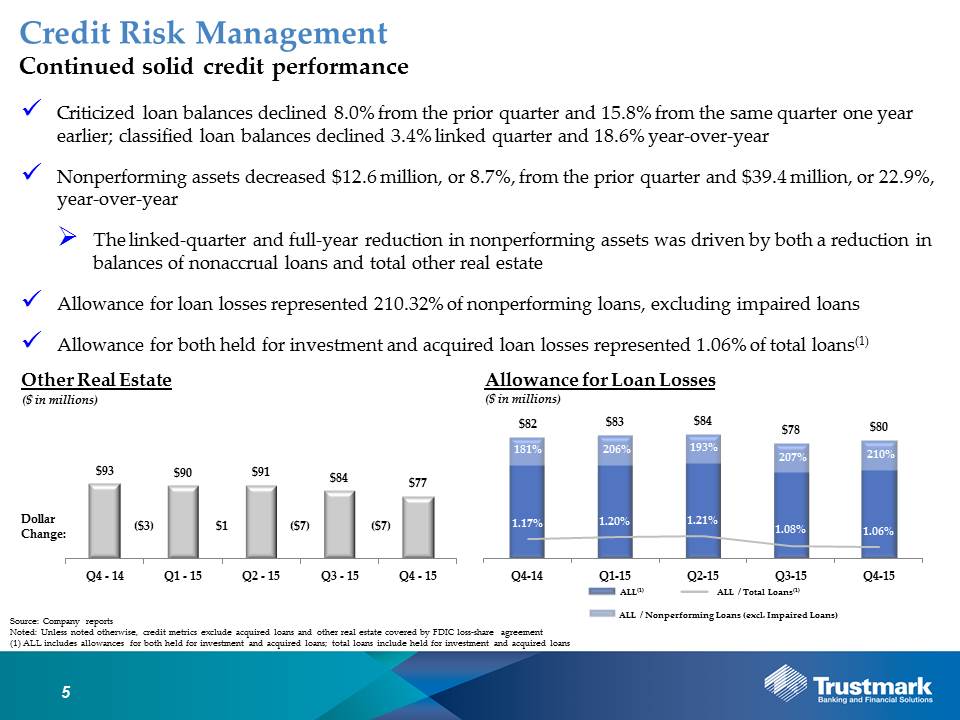
| ● | Allowance for loan losses represented 210.32% of nonperforming loans, excluding impaired loans |
Criticized and classified loan balances continued to reflect steady improvement. Relative to the prior quarter, criticized and classified loan balances decreased 8.0% and 3.4%, respectively. Compared to levels one year earlier, criticized and classified loan balances decreased 15.8% and 18.6%, respectively.
Nonperforming loans totaled $55.3 million at December 31, 2015, down 9.5% from the prior quarter and 30.3% year-over-year. Other real estate totaled $77.2 million, reflecting an 8.1% linked-quarter decrease and a 16.6% year-over-year reduction. Collectively, nonperforming assets totaled $132.5 million, reflecting a linked-quarter and year-over-year decrease of 8.7% and 22.9%, respectively.
Allocation of Trustmark's $67.6 million allowance for loan losses represented 1.05% of commercial loans and 0.66% of consumer and home mortgage loans, resulting in an allowance to total loans held for investment of 0.95% at December 31, 2015, representing a level management considers commensurate with the inherent risk in the loan portfolio. In aggregate, the allowance for both held for investment and acquired loan losses represented 1.06% of total loans, which include held for investment and acquired loans.
Unless noted otherwise, all of the above credit quality metrics exclude acquired loans and other real estate covered by FDIC loss-share agreement.
Revenue Generation
| ● | Net interest income (FTE) excluding acquired loans in 2015 totaled $357.0 million, up 3.7%, from the prior year |
| ● | Noninterest income for the year totaled $173.1 million, reflecting in part growth from investments in insurance and mortgage businesses |
| ● | Insurance revenue in 2015 totaled $36.4 million, the highest level in Trustmark’s history |
| ● | Mortgage loan production volume in 2015 totaled $1.5 billion, up 24.3% from the prior year |
Revenue in the fourth quarter totaled $139.1 million, down 3.1% from the prior quarter, reflecting in part a seasonal reduction in noninterest income. Net interest income (FTE) in the fourth quarter totaled $104.2 million, resulting in a net interest margin of 3.74%. Compared to the prior quarter, net interest income (FTE) increased $2.5 million primarily the result of growth in interest income (FTE) from both the held for sale and held for investment loan portfolios as well as the securities portfolio. The yield on acquired loans in the fourth quarter totaled 11.74% and included recoveries from settlement of debt of $5.4 million, which represented approximately 5.33% of the annualized total acquired loan yield. Excluding acquired loans, the net interest margin in the fourth quarter remained at 3.43%. Net interest income (FTE) in 2015 totaled $408.2 million, resulting in a net interest margin (FTE) of 3.78%; excluding acquired loans, the net interest margin (FTE) was 3.46%.
Noninterest income totaled $39.3 million in the fourth quarter, down from the prior quarter primarily as a result of seasonally lower mortgage banking revenues and insurance commissions, as well as decreased other income. In the fourth quarter, bank card and other fees totaled $7.2 million, up 2.8% from the prior quarter, while service charges on deposit accounts totaled $12.0 million, down 3.5% from the prior quarter. Other income, net decreased $1.9 million linked quarter, reflecting a $932 thousand increase in partnership amortization principally due to an additional tax credit investment as well as a $909 thousand increase in FDIC indemnification asset write-downs, which resulted from decreased write-downs of covered other real estate and the re-estimation of cash flows on covered acquired loans. Noninterest income for the year totaled $173.1 million and remained stable when compared to the prior year.
Insurance revenue in the fourth quarter totaled $8.5 million, reflecting a seasonal decrease of 14.2% from the prior quarter and an increase of 8.6% from levels one year earlier. For the year, insurance revenue totaled $36.4 million, up 8.8% relative to the prior year. The solid performance in 2015 reflects increased business development efforts, investments in additional producers and restructuring initiatives that supported enhanced productivity.
Wealth management revenue totaled $7.8 million in the fourth quarter, remaining stable relative to the prior quarter and down 7.4% from levels one year earlier. The year-over-year decline is primarily attributable to decreased brokerage activity, resulting in part from volatile market conditions. Wealth management revenue in 2015 totaled $31.4 million, down 3.0% relative to the prior year. Despite turbulent investment markets, Trustmark remained focused on servicing clients and realigned processes to enhance productivity.
Mortgage banking revenue in the fourth quarter totaled $4.3 million, down $3.2 million from the prior quarter. The linked-quarter decline is primarily attributable to a $2.5 million decrease in the mortgage servicing hedge ineffectiveness and a $1.6 million decrease in mark-to-market adjustments on mortgage loans held for sale. Mortgage loan production totaled $340.0 million, a seasonal decrease of 19.1% from the prior quarter and an increase of 15.7% year-over-year. In 2015, mortgage banking revenue totaled $30.2 million, up 21.8% from the prior year; mortgage loan production totaled $1.5 billion, up 24.3% from the prior year. The growth in mortgage banking revenue partially reflects a continued focus on productivity and customer service enhancements as well as investments in additional mortgage-loan producers and loan-production offices.
Noninterest Expense
| ● | Routine noninterest expense in 2015 remained well controlled and totaled $388.9 million, partially reflecting the re-allocation of cost savings into revenue-generating areas of the corporation |
| ● | ORE and foreclosure expense decreased $6.4 million for the year, resulting from the continued resolution of problem assets |
| ● | Tax credit investments reduced the effective tax rate to 23.4% in 2015 |
| ● | Continued retail delivery channel optimization in 2015: consolidated eight banking centers and opened three banking centers; realigned branch staffing levels; introduced new consumer mobile banking platform, myTrustmark℠ |
Excluding ORE expense and intangible amortization of $1.4 million, routine noninterest expense in the fourth quarter totaled $97.2 million, a decrease of $1.0 million, or 1.0%, from comparable expenses in the prior quarter. Salaries and benefits totaled $57.4 million in the fourth quarter, down 1.6% linked quarter and reflecting decreased insurance and mortgage-production commissions. Services and fees declined 6.6% from the prior quarter, reflecting in part a reduction in lower communications expense and third-party consulting fees. ORE and foreclosure expense improved from the prior quarter and provided an income benefit because of gains realized on the sale of foreclosed real estate. Relative to 2014, routine noninterest expense remained stable at $388.9 million as savings from realigned staffing levels and technology productivity enhancements were reallocated into new loan-production offices, additional relationship managers and new mobile-banking platforms.
Trustmark continued the optimization of its retail delivery channels to enhance productivity and efficiency as well as promote additional growth. During the fourth quarter, Trustmark opened a mortgage loan-production office in Tuscaloosa, Alabama. In 2015, Trustmark consolidated eight branch offices across Mississippi, Tennessee, Florida and Texas, and reallocated a portion of those resources into three new branch offices across Alabama and Mississippi. Overall, these collective efforts resulted in the consolidation of 27 branch offices and the establishment of eight new branch offices over the past three years. Trustmark is committed to developing and maintaining relationships, while supporting investments that promote profitable revenue growth as well as reengineering and efficiency opportunities to enhance shareholder value.
Additional Information
As previously announced, Trustmark will conduct a conference call with analysts on Wednesday, January 27, 2016, at 10:00 a.m. Central Time to discuss the Corporation’s financial results. Interested parties may listen to the conference call by dialing (877) 317-3051 or by clicking on the link provided under the Investor Relations section of our website at www.trustmark.com, which will also include a slide presentation Management will review during the conference call. A replay of the conference call will also be available through Wednesday, February 10, 2016, in archived format at the same web address or by calling (877) 344-7529, passcode 10078271.
Trustmark Corporation is a financial services company providing banking and financial solutions through 200 offices in Alabama, Florida, Mississippi, Tennessee and Texas.
Forward-Looking Statements
Certain statements contained in this document constitute forward-looking statements within the meaning of the Private Securities Litigation Reform Act of 1995. You can identify forward-looking statements by words such as “may,” “hope,” “will,” “should,” “expect,” “plan,” “anticipate,” “intend,” “believe,” “estimate,” “predict,” “potential,” “continue,” “could,” “future” or the negative of those terms or other words of similar meaning. You should read statements that contain these words carefully because they discuss our future expectations or state other “forward-looking” information. These forward-looking statements include, but are not limited to, statements relating to anticipated future operating and financial performance measures, including net interest margin, credit quality, business initiatives, growth opportunities and growth rates, among other things, and encompass any estimate, prediction, expectation, projection, opinion, anticipation, outlook or statement of belief included therein as well as the management assumptions underlying these forward-looking statements. You should be aware that the occurrence of the events described under the caption “Risk Factors” in Trustmark’s filings with the Securities and Exchange Commission could have an adverse effect on our business, results of operations and financial condition. Should one or more of these risks materialize, or should any such underlying assumptions prove to be significantly different, actual results may vary significantly from those anticipated, estimated, projected or expected.
Risks that could cause actual results to differ materially from current expectations of Management include, but are not limited to, changes in the level of nonperforming assets and charge-offs, local, state and national economic and market conditions, including conditions in the housing and real estate markets in the regions in which Trustmark operates and the extent and duration of the current volatility in the credit and financial markets as well as crude oil prices, changes in our ability to measure the fair value of assets in our portfolio, material changes in the level and/or volatility of market interest rates, the performance and demand for the products and services we offer, including the level and timing of withdrawals from our deposit accounts, the costs and effects of litigation and of unexpected or adverse outcomes in such litigation, our ability to attract noninterest-bearing deposits and other low-cost funds, competition in loan and deposit pricing, as well as the entry of new competitors into our markets through de novo expansion and acquisitions, economic conditions, including the potential impact of issues relating to the European financial system, and monetary and other governmental actions designed to address the level and volatility of interest rates and the volatility of securities, currency and other markets, the enactment of legislation and changes in existing regulations, or enforcement practices, or the adoption of new regulations, changes in accounting standards and practices, including changes in the interpretation of existing standards, that affect our consolidated financial statements, changes in consumer spending, borrowings and savings habits, technological changes, changes in the financial performance or condition of our borrowers, changes in our ability to control expenses, changes in our compensation and benefit plans, greater than expected costs or difficulties related to the integration of acquisitions or new products and lines of business, cyber-attacks and other breaches which could affect our information system security, natural disasters, environmental disasters, acts of war or terrorism, and other risks described in our filings with the Securities and Exchange Commission.
Although we believe that the expectations reflected in such forward-looking statements are reasonable, we can give no assurance that such expectations will prove to be correct. Except as required by law, we undertake no obligation to update or revise any of this information, whether as the result of new information, future events or developments or otherwise.
Trustmark Investor Contacts:
Louis E. Greer
Treasurer and
Principal Financial Officer
601-208-2310
F. Joseph Rein, Jr.
Senior Vice President
601-208-6898
Trustmark Media Contact:
Melanie A. Morgan
Senior Vice President
601-208-2979
Note 1 - Securities Available for Sale and Held to Maturity
The following table is a summary of the estimated fair value of securities available for sale and the amortized cost of securities held to maturity ($ in thousands):
| | | 12/31/2015 | | | 9/30/2015 | | | 6/30/2015 | | | 3/31/2015 | | | 12/31/2014 | |
| SECURITIES AVAILABLE FOR SALE | | | | | | | | | | | | | | | |
| U.S. Treasury securities | | $ | - | | | $ | - | | | $ | - | | | $ | - | | | $ | 100 | |
| U.S. Government agency obligations | | | | | | | | | | | | | | | | | | | | |
| Issued by U.S. Government agencies | | | 68,135 | | | | 71,282 | | | | 74,409 | | | | 78,115 | | | | 79,656 | |
| Issued by U.S. Government sponsored agencies | | | 281 | | | | 23,016 | | | | 33,009 | | | | 33,076 | | | | 32,818 | |
| Obligations of states and political subdivisions | | | 138,609 | | | | 147,794 | | | | 151,322 | | | | 160,154 | | | | 162,258 | |
| Mortgage-backed securities | | | | | | | | | | | | | | | | | | | | |
| Residential mortgage pass-through securities | | | | | | | | | | | | | | | | | | | | |
| Guaranteed by GNMA | | | 25,812 | | | | 26,651 | | | | 20,651 | | | | 12,010 | | | | 12,427 | |
| Issued by FNMA and FHLMC | | | 225,542 | | | | 177,411 | | | | 185,651 | | | | 195,470 | | | | 204,441 | |
| Other residential mortgage-backed securities | | | | | | | | | | | | | | | | | | | | |
| Issued or guaranteed by FNMA, FHLMC, or GNMA | | | 1,582,860 | | | | 1,630,402 | | | | 1,662,476 | | | | 1,646,710 | | | | 1,661,833 | |
| Commercial mortgage-backed securities | | | | | | | | | | | | | | | | | | | | |
| Issued or guaranteed by FNMA, FHLMC, or GNMA | | | 279,226 | | | | 279,609 | | | | 290,398 | | | | 225,826 | | | | 189,334 | |
| Asset-backed securities and structured financial products | | | 24,957 | | | | 26,657 | | | | 28,467 | | | | 30,098 | | | | 31,700 | |
| Total securities available for sale | | $ | 2,345,422 | | | $ | 2,382,822 | | | $ | 2,446,383 | | | $ | 2,381,459 | | | $ | 2,374,567 | |
| | | | | | | | | | | | | | | | | | | | | |
| SECURITIES HELD TO MATURITY | | | | | | | | | | | | | | | | | | | | |
| U.S. Government agency obligations | | | | | | | | | | | | | | | | | | | | |
| Issued by U.S. Government sponsored agencies | | $ | 101,782 | | | $ | 101,578 | | | $ | 101,374 | | | $ | 101,171 | | | $ | 100,971 | |
| Obligations of states and political subdivisions | | | 55,892 | | | | 56,661 | | | | 56,978 | | | | 62,928 | | | | 63,505 | |
| Mortgage-backed securities | | | | | | | | | | | | | | | | | | | | |
| Residential mortgage pass-through securities | | | | | | | | | | | | | | | | | | | | |
| Guaranteed by GNMA | | | 17,363 | | | | 17,783 | | | | 18,265 | | | | 18,861 | | | | 19,115 | |
| Issued by FNMA and FHLMC | | | 10,368 | | | | 10,669 | | | | 10,965 | | | | 11,341 | | | | 11,437 | |
| Other residential mortgage-backed securities | | | | | | | | | | | | | | | | | | | | |
| Issued or guaranteed by FNMA, FHLMC, or GNMA | | | 820,012 | | | | 808,763 | | | | 838,989 | | | | 842,827 | | | | 834,176 | |
| Commercial mortgage-backed securities | | | | | | | | | | | | | | | | | | | | |
| Issued or guaranteed by FNMA, FHLMC, or GNMA | | | 182,401 | | | | 182,986 | | | | 163,590 | | | | 147,426 | | | | 141,481 | |
| Total securities held to maturity | | $ | 1,187,818 | | | $ | 1,178,440 | | | $ | 1,190,161 | | | $ | 1,184,554 | | | $ | 1,170,685 | |
During the fourth quarter of 2013, Trustmark reclassified approximately $1.099 billion of securities available for sale to securities held to maturity. The securities were transferred at fair value, which became the cost basis for the securities held to maturity. At the date of transfer, the net unrealized holding loss on the available for sale securities totaled approximately $46.6 million ($28.8 million, net of tax). The net unrealized holding loss is amortized over the remaining life of the securities as a yield adjustment in a manner consistent with the amortization or accretion of the original purchase premium or discount on the associated security. There were no gains or losses recognized as a result of the transfer. At December 31, 2015, the net unamortized, unrealized loss on the transferred securities included in accumulated other comprehensive loss in the accompanying balance sheet totaled approximately $34.0 million ($21.0 million, net of tax).
Management continues to focus on asset quality as one of the strategic goals of the securities portfolio, which is evidenced by the investment of approximately 94% of the portfolio in GSE-backed obligations and other Aaa rated securities as determined by Moody’s. None of the securities owned by Trustmark are collateralized by assets which are considered sub-prime. Furthermore, outside of stock ownership in the Federal Home Loan Bank of Dallas, Federal Home Loan Bank of Atlanta and Federal Reserve Bank, Trustmark does not hold any other equity investment in a GSE.
 | TRUSTMARK CORPORATION AND SUBSIDIARIES NOTES TO CONSOLIDATED FINANCIALS |
Note 2 – Loan Composition
| LHFI BY TYPE (excluding acquired loans) | | 12/31/2015 | | | 9/30/2015 | | | 6/30/2015 | | | 3/31/2015 | | | 12/31/2014 | |
| Loans secured by real estate: | | | | | | | | | | | | | | | |
| Construction, land development and other land loans | | $ | 824,723 | | | $ | 785,472 | | | $ | 682,444 | | | $ | 691,657 | | | $ | 619,877 | |
| Secured by 1-4 family residential properties | | | 1,649,501 | | | | 1,638,639 | | | | 1,637,933 | | | | 1,613,993 | | | | 1,634,397 | |
| Secured by nonfarm, nonresidential properties | | | 1,736,476 | | | | 1,604,453 | | | | 1,567,035 | | | | 1,516,895 | | | | 1,553,193 | |
| Other real estate secured | | | 211,228 | | | | 225,523 | | | | 240,056 | | | | 233,322 | | | | 253,787 | |
| Commercial and industrial loans | | | 1,343,211 | | | | 1,270,277 | | | | 1,219,684 | | | | 1,228,788 | | | | 1,270,350 | |
| Consumer loans | | | 169,135 | | | | 169,509 | | | | 165,215 | | | | 161,535 | | | | 167,964 | |
| State and other political subdivision loans | | | 734,615 | | | | 677,539 | | | | 574,265 | | | | 614,330 | | | | 602,727 | |
| Other loans | | | 422,496 | | | | 420,231 | | | | 360,441 | | | | 353,356 | | | | 347,174 | |
| LHFI | | | 7,091,385 | | | | 6,791,643 | | | | 6,447,073 | | | | 6,413,876 | | | | 6,449,469 | |
| Allowance for loan losses | | | (67,619 | ) | | | (65,607 | ) | | | (71,166 | ) | | | (71,321 | ) | | | (69,616 | ) |
| Net LHFI | | $ | 7,023,766 | | | $ | 6,726,036 | | | $ | 6,375,907 | | | $ | 6,342,555 | | | $ | 6,379,853 | |
| ACQUIRED NONCOVERED LOANS BY TYPE | | 12/31/2015 | | | 9/30/2015 | | | 6/30/2015 | | | 3/31/2015 | | | 12/31/2014 | |
| Loans secured by real estate: | | | | | | | | | | | | | | | |
| Construction, land development and other land loans | | $ | 41,623 | | | $ | 45,299 | | | $ | 50,867 | | | $ | 51,363 | | | $ | 58,309 | |
| Secured by 1-4 family residential properties | | | 86,950 | | | | 96,870 | | | | 101,027 | | | | 111,830 | | | | 116,920 | |
| Secured by nonfarm, nonresidential properties | | | 135,626 | | | | 146,614 | | | | 168,698 | | | | 177,210 | | | | 202,323 | |
| Other real estate secured | | | 23,860 | | | | 23,816 | | | | 25,666 | | | | 26,819 | | | | 27,813 | |
| Commercial and industrial loans | | | 55,075 | | | | 57,748 | | | | 73,732 | | | | 81,261 | | | | 88,256 | |
| Consumer loans | | | 5,641 | | | | 6,295 | | | | 7,273 | | | | 8,494 | | | | 9,772 | |
| Other loans | | | 23,936 | | | | 23,886 | | | | 19,897 | | | | 21,195 | | | | 22,390 | |
| Noncovered loans | | | 372,711 | | | | 400,528 | | | | 447,160 | | | | 478,172 | | | | 525,783 | |
| Allowance for loan losses | | | (11,259 | ) | | | (11,417 | ) | | | (11,927 | ) | | | (11,106 | ) | | | (10,541 | ) |
| Net noncovered loans | | $ | 361,452 | | | $ | 389,111 | | | $ | 435,233 | | | $ | 467,066 | | | $ | 515,242 | |
| ACQUIRED COVERED LOANS BY TYPE | | 12/31/2015 | | | 9/30/2015 | | | 6/30/2015 | | | 3/31/2015 | | | 12/31/2014 | |
| Loans secured by real estate: | | | | | | | | | | | | | | | |
| Construction, land development and other land loans | | $ | 1,021 | | | $ | 966 | | | $ | 904 | | | $ | 1,447 | | | $ | 1,197 | |
| Secured by 1-4 family residential properties | | | 10,058 | | | | 10,546 | | | | 11,080 | | | | 11,200 | | | | 13,180 | |
| Secured by nonfarm, nonresidential properties | | | 4,638 | | | | 5,363 | | | | 5,206 | | | | 5,844 | | | | 7,672 | |
| Other real estate secured | | | 1,286 | | | | 1,511 | | | | 1,622 | | | | 1,469 | | | | 1,096 | |
| Commercial and industrial loans | | | 624 | | | | 205 | | | | 371 | | | | 255 | | | | 277 | |
| Consumer loans | | | - | | | | - | | | | - | | | | - | | | | - | |
| Other loans | | | 73 | | | | 54 | | | | 56 | | | | 56 | | | | 204 | |
| Covered loans | | | 17,700 | | | | 18,645 | | | | 19,239 | | | | 20,271 | | | | 23,626 | |
| Allowance for loan losses | | | (733 | ) | | | (768 | ) | | | (702 | ) | | | (731 | ) | | | (1,518 | ) |
| Net covered loans | | $ | 16,967 | | | $ | 17,877 | | | $ | 18,537 | | | $ | 19,540 | | | $ | 22,108 | |
| | TRUSTMARK CORPORATION AND SUBSIDIARIES NOTES TO CONSOLIDATED FINANCIALS |
| Note 2 – Loan Composition (continued) | | | | | | | | | | | | | | | | | | |
| | | December 31, 2015 | |
LHFI - COMPOSITION BY REGION (1) | | Total | | | Alabama | | | Florida | | | Mississippi (Central and Southern Regions) | | | Tennessee (Memphis, TN and Northern MS Regions) | | | Texas | |
| Loans secured by real estate: | | | | | | | | | | | | | | | | | | |
| Construction, land development and other land loans | | $ | 824,723 | | | $ | 125,498 | | | $ | 55,546 | | | $ | 313,173 | | | $ | 44,043 | | | $ | 286,463 | |
| Secured by 1-4 family residential properties | | | 1,649,501 | | | | 58,893 | | | | 49,176 | | | | 1,409,421 | | | | 112,529 | | | | 19,482 | |
| Secured by nonfarm, nonresidential properties | | | 1,736,476 | | | | 218,852 | | | | 165,992 | | | | 807,331 | | | | 145,551 | | | | 398,750 | |
| Other real estate secured | | | 211,228 | | | | 18,581 | | | | 5,954 | | | | 108,176 | | | | 17,807 | | | | 60,710 | |
| Commercial and industrial loans | | | 1,343,211 | | | | 107,549 | | | | 12,763 | | | | 702,876 | | | | 220,294 | | | | 299,729 | |
| Consumer loans | | | 169,135 | | | | 18,059 | | | | 2,871 | | | | 128,357 | | | | 17,038 | | | | 2,810 | |
| State and other political subdivision loans | | | 734,615 | | | | 45,559 | | | | 27,361 | | | | 513,481 | | | | 24,784 | | | | 123,430 | |
| Other loans | | | 422,496 | | | | 26,617 | | | | 19,335 | | | | 288,698 | | | | 42,783 | | | | 45,063 | |
| Loans | | $ | 7,091,385 | | | $ | 619,608 | | | $ | 338,998 | | | $ | 4,271,513 | | | $ | 624,829 | | | $ | 1,236,437 | |
| | | | | | | | | | | | | | | | | | | | | | | | | |
| | | | | | | | | | | | | | | | | | | | | | | | | |
| | | | | | | | | | | | | | | | | | | | | | | | | |
CONSTRUCTION, LAND DEVELOPMENT AND OTHER LAND LOANS BY REGION (1) | | | | | | | | | | | | | | | | | |
| Lots | | $ | 49,906 | | | $ | 6,655 | | | $ | 20,054 | | | $ | 16,671 | | | $ | 2,164 | | | $ | 4,362 | |
| Development | | | 54,174 | | | | 8,760 | | | | 4,210 | | | | 25,451 | | | | 764 | | | | 14,989 | |
| Unimproved land | | | 109,681 | | | | 8,799 | | | | 18,485 | | | | 43,945 | | | | 18,698 | | | | 19,754 | |
| 1-4 family construction | | | 155,008 | | | | 30,226 | | | | 9,317 | | | | 75,090 | | | | 1,826 | | | | 38,549 | |
| Other construction | | | 455,954 | | | | 71,058 | | | | 3,480 | | | | 152,016 | | | | 20,591 | | | | 208,809 | |
| Construction, land development and other land loans | | $ | 824,723 | | | $ | 125,498 | | | $ | 55,546 | | | $ | 313,173 | | | $ | 44,043 | | | $ | 286,463 | |
| | | | | | | | | | | | | | | | | | | | | | | | | |
| | | | | | | | | | | | | | | | | | | | | | | | | |
| | | | | | | | | | | | | | | | | | | | | | | | | |
| | | | | | | | | | | | | | | | | | | | | | | | | |
LOANS SECURED BY NONFARM, NONRESIDENTIAL PROPERTIES BY REGION (1) | | | | | | | | | | |
| Income producing: | | | | | | | | | | | | | | | | | | | | | | | | |
| Retail | | $ | 215,549 | | | $ | 51,801 | | | $ | 36,545 | | | $ | 69,580 | | | $ | 19,122 | | | $ | 38,501 | |
| Office | | | 216,832 | | | | 31,277 | | | | 31,794 | | | | 74,840 | | | | 7,275 | | | | 71,646 | |
| Nursing homes/assisted living | | | 95,170 | | | | - | | | | - | | | | 89,716 | | | | 5,454 | | | | - | |
| Hotel/motel | | | 149,813 | | | | 33,468 | | | | 22,200 | | | | 38,257 | | | | 32,668 | | | | 23,220 | |
| Industrial | | | 70,422 | | | | 7,053 | | | | 8,493 | | | | 9,994 | | | | 3,949 | | | | 40,933 | |
| Health care | | | 24,515 | | | | 530 | | | | 871 | | | | 23,111 | | | | 3 | | | | - | |
| Convenience stores | | | 16,783 | | | | 233 | | | | - | | | | 10,855 | | | | 1,121 | | | | 4,574 | |
| Other | | | 186,930 | | | | 20,452 | | | | 17,992 | | | | 80,627 | | | | 3,902 | | | | 63,957 | |
| Total income producing loans | | | 976,014 | | | | 144,814 | | | | 117,895 | | | | 396,980 | | | | 73,494 | | | | 242,831 | |
| | | | | | | | | | | | | | | | | | | | | | | | | |
| Owner-occupied: | | | | | | | | | | | | | | | | | | | | | | | | |
| Office | | | 119,550 | | | | 9,506 | | | | 20,902 | | | | 59,584 | | | | 8,971 | | | | 20,587 | |
| Churches | | | 93,227 | | | | 8,049 | | | | 2,267 | | | | 45,311 | | | | 28,212 | | | | 9,388 | |
| Industrial warehouses | | | 129,216 | | | | 5,049 | | | | 4,117 | | | | 63,085 | | | | 10,840 | | | | 46,125 | |
| Health care | | | 118,931 | | | | 19,632 | | | | 7,905 | | | | 60,774 | | | | 10,428 | | | | 20,192 | |
| Convenience stores | | | 81,653 | | | | 6,787 | | | | 1,798 | | | | 47,007 | | | | 2,802 | | | | 23,259 | |
| Retail | | | 29,568 | | | | 2,482 | | | | 5,648 | | | | 15,884 | | | | 2,822 | | | | 2,732 | |
| Restaurants | | | 28,214 | | | | 2,466 | | | | 1,768 | | | | 22,624 | | | | - | | | | 1,356 | |
| Auto dealerships | | | 10,842 | | | | 8,246 | | | | 105 | | | | 2,491 | | | | - | | | | - | |
| Other | | | 149,261 | | | | 11,821 | | | | 3,587 | | | | 93,591 | | | | 7,982 | | | | 32,280 | |
| Total owner-occupied loans | | | 760,462 | | | | 74,038 | | | | 48,097 | | | | 410,351 | | | | 72,057 | | | | 155,919 | |
| Loans secured by nonfarm, nonresidential properties | | $ | 1,736,476 | | | $ | 218,852 | | | $ | 165,992 | | | $ | 807,331 | | | $ | 145,551 | | | $ | 398,750 | |
| | | | | | | | | | | | | | | | | | | | | | | | | |
| (1) Excludes acquired loans. | | | | | | | | | | | | | | | | | | | | | | | | |
| | TRUSTMARK CORPORATION AND SUBSIDIARIES NOTES TO CONSOLIDATED FINANCIALS |
Note 3 – Yields on Earning Assets and Interest-Bearing Liabilities
The following table illustrates the yields on earning assets by category as well as the rates paid on interest-bearing liabilities on a tax equivalent basis:
| | | Quarter Ended | | | Year Ended | |
| | | 12/31/2015 | | | 9/30/2015 | | | 6/30/2015 | | | 3/31/2015 | | | 12/31/2014 | | | 12/31/2015 | | | 12/31/2014 | |
| Securities – taxable | | | 2.50 | % | | | 2.35 | % | | | 2.33 | % | | | 2.40 | % | | | 2.59 | % | | | 2.39 | % | | | 2.42 | % |
| Securities – nontaxable | | | 4.25 | % | | | 4.18 | % | | | 4.27 | % | | | 4.29 | % | | | 4.20 | % | | | 4.25 | % | | | 4.24 | % |
| Securities – total | | | 2.57 | % | | | 2.43 | % | | | 2.42 | % | | | 2.49 | % | | | 2.67 | % | | | 2.48 | % | | | 2.52 | % |
| Loans - LHFI & LHFS | | | 4.16 | % | | | 4.27 | % | | | 4.38 | % | | | 4.31 | % | | | 4.32 | % | | | 4.28 | % | | | 4.43 | % |
| Acquired loans | | | 11.74 | % | | | 10.46 | % | | | 10.43 | % | | | 11.62 | % | | | 9.38 | % | | | 11.06 | % | | | 11.52 | % |
| Loans - total | | | 4.57 | % | | | 4.65 | % | | | 4.79 | % | | | 4.85 | % | | | 4.73 | % | | | 4.71 | % | | | 5.11 | % |
| FF sold & rev repo | | | 1.15 | % | | | 0.68 | % | | | 1.44 | % | | | 0.00 | % | | | 0.94 | % | | | 0.96 | % | | | 0.63 | % |
| Other earning assets | | | 2.34 | % | | | 2.66 | % | | | 3.81 | % | | | 3.44 | % | | | 3.16 | % | | | 2.95 | % | | | 3.73 | % |
| Total earning assets | | | 3.92 | % | | | 3.91 | % | | | 3.99 | % | | | 4.07 | % | | | 4.05 | % | | | 3.97 | % | | | 4.24 | % |
| | | | | | | | | | | | | | | | | | | | | | | | | | | | | |
| Interest-bearing deposits | | | 0.18 | % | | | 0.18 | % | | | 0.18 | % | | | 0.19 | % | | | 0.20 | % | | | 0.18 | % | | | 0.22 | % |
| FF pch & repo | | | 0.19 | % | | | 0.15 | % | | | 0.14 | % | | | 0.14 | % | | | 0.14 | % | | | 0.16 | % | | | 0.13 | % |
| Other borrowings | | | 0.88 | % | | | 1.11 | % | | | 2.68 | % | | | 1.81 | % | | | 1.20 | % | | | 1.31 | % | | | 1.94 | % |
| Total interest-bearing liabilities | | | 0.26 | % | | | 0.26 | % | | | 0.26 | % | | | 0.26 | % | | | 0.26 | % | | | 0.26 | % | | | 0.28 | % |
| | | | | | | | | | | | | | | | | | | | | | | | | | | | | |
| Net interest margin | | | 3.74 | % | | | 3.72 | % | | | 3.81 | % | | | 3.88 | % | | | 3.86 | % | | | 3.78 | % | | | 4.03 | % |
| Net interest margin excluding acquired loans | | | 3.43 | % | | | 3.43 | % | | | 3.49 | % | | | 3.47 | % | | | 3.54 | % | | | 3.46 | % | | | 3.52 | % |
During the fourth quarter of 2015, the net interest margin included $902 thousand of yield maintenance payments on prepaid securities. The net interest margin, excluding acquired loans and the yield maintenance payments on prepaid securities, totaled 3.40% during the fourth quarter of 2015.
Note 4 – Mortgage Banking
Trustmark utilizes a portfolio of exchange-traded derivative instruments, such as Treasury note futures contracts and option contracts, to achieve a fair value return that offsets the changes in fair value of mortgage servicing rights (MSR) attributable to interest rates. These transactions are considered freestanding derivatives that do not otherwise qualify for hedge accounting under generally accepted accounting principles (GAAP). Changes in the fair value of these exchange-traded derivative instruments, including administrative costs, are recorded in noninterest income in mortgage banking, net and are offset by the changes in the fair value of the MSR. The MSR fair value represents the present value of future cash flows, which among other things includes decay and the effect of changes in interest rates. Ineffectiveness of hedging the MSR fair value is measured by comparing the change in value of hedge instruments to the change in the fair value of the MSR asset attributable to changes in interest rates and other market driven changes in valuation inputs and assumptions. The impact of this strategy resulted in a net negative ineffectiveness of $2.0 million compared to a net positive ineffectiveness of $61 thousand for the quarters ended December 31, 2015 and 2014, respectively.
The following table illustrates the components of mortgage banking revenues included in noninterest income in the accompanying income statements:
| | | Quarter Ended | | | Years Ended | |
| | | 12/31/2015 | | | 9/30/2015 | | | 6/30/2015 | | | 3/31/2015 | | | 12/31/2014 | | | 12/31/2015 | | | 12/31/2014 | |
| Mortgage servicing income, net | | $ | 5,126 | | | $ | 4,906 | | | $ | 4,696 | | | $ | 4,897 | | | $ | 4,814 | | | $ | 19,625 | | | $ | 18,619 | |
| Change in fair value-MSR from runoff | | | (2,091 | ) | | | (2,636 | ) | | | (2,587 | ) | | | (2,213 | ) | | | (1,999 | ) | | | (9,527 | ) | | | (8,566 | ) |
| Gain on sales of loans, net | | | 4,656 | | | | 4,479 | | | | 5,114 | | | | 3,716 | | | | 2,910 | | | | 17,965 | | | | 10,770 | |
| Other, net | | | (1,433 | ) | | | 215 | | | | 206 | | | | 1,245 | | | | 132 | | | | 233 | | | | 904 | |
| Mortgage banking income before hedge ineffectiveness | | | 6,258 | | | | 6,964 | | | | 7,429 | | | | 7,645 | | | | 5,857 | | | | 28,296 | | | | 21,727 | |
| Change in fair value-MSR from market changes | | | 2,010 | | | | (4,141 | ) | | | 6,076 | | | | (2,368 | ) | | | (4,142 | ) | | | 1,577 | | | | (7,203 | ) |
| Change in fair value of derivatives | | | (3,981 | ) | | | 4,620 | | | | (4,024 | ) | | | 3,688 | | | | 4,203 | | | | 303 | | | | 10,256 | |
| Net (negative) positive hedge ineffectiveness | | | (1,971 | ) | | | 479 | | | | 2,052 | | | | 1,320 | | | | 61 | | | | 1,880 | | | | 3,053 | |
| Mortgage banking, net | | $ | 4,287 | | | $ | 7,443 | | | $ | 9,481 | | | $ | 8,965 | | | $ | 5,918 | | | $ | 30,176 | | | $ | 24,780 | |
During the first quarter of 2015, Trustmark exercised its option to repurchase approximately $28.5 million of delinquent loans serviced for GNMA. These loans were subsequently sold to a third party under different repurchase provisions. Trustmark retained the servicing for these loans, which are subject to guarantees by FHA/VA. As a result of this repurchase and sale, the loans are no longer carried as "LHFS-Guaranteed GNMA serviced loans" (see pages 3 and 6). The transaction resulted in a gain of $304 thousand, which was recorded during the first quarter of 2015 and is included in the table above as "Gain on sales of loans, net.”
| | TRUSTMARK CORPORATION AND SUBSIDIARIES NOTES TO CONSOLIDATED FINANCIALS |
Note 5 – Other Noninterest Income and Expense
Other noninterest income consisted of the following for the periods presented ($ in thousands):
| | | Quarter Ended | | | Year Ended | |
| | | 12/31/2015 | | | 9/30/2015 | | | 6/30/2015 | | | 3/31/2015 | | | 12/31/2014 | | | 12/31/2015 | | | 12/31/2014 | |
| Partnership amortization for tax credit purposes | | $ | (3,015 | ) | | $ | (2,083 | ) | | $ | (2,480 | ) | | $ | (2,472 | ) | | $ | (2,806 | ) | | $ | (10,050 | ) | | $ | (11,824 | ) |
| (Decrease) Increase in FDIC indemnification asset | | | (827 | ) | | | 82 | | | | (1,798 | ) | | | (970 | ) | | | (735 | ) | | | (3,513 | ) | | | (2,874 | ) |
| Increase in life insurance cash surrender value | | | 1,667 | | | | 1,687 | | | | 1,673 | | | | 1,675 | | | | 1,693 | | | | 6,702 | | | | 7,340 | |
| Other miscellaneous income | | | 1,709 | | | | 1,784 | | | | 2,172 | | | | 712 | | | | 2,444 | | | | 6,377 | | | | 7,972 | |
| Total other, net | | $ | (466 | ) | | $ | 1,470 | | | $ | (433 | ) | | $ | (1,055 | ) | | $ | 596 | | | $ | (484 | ) | | $ | 614 | |
Trustmark invests in partnerships that provide income tax credits on a Federal and/or State basis (i.e., new market tax credits, low income housing tax credits or historical tax credits). These investments are recorded based on the equity method of accounting, which requires the equity in partnership losses to be recognized when incurred and are recorded as a reduction in other income. The income tax credits related to these partnerships are utilized as specifically allowed by income tax law and are recorded as a reduction in income tax expense.
During the fourth quarter of 2015, other noninterest income included a net downward adjustment of the FDIC indemnification asset of $827 thousand on acquired covered loans and covered other real estate obtained from the Heritage Banking Group primarily as a result of decreases in write-downs of covered other real estate when compared to the third quarter of 2015.
Other noninterest expense consisted of the following for the periods presented ($ in thousands):
| | | Quarter Ended | | | Year Ended | |
| | | 12/31/2015 | | | 9/30/2015 | | | 6/30/2015 | | | 3/31/2015 | | | 12/31/2014 | | | 12/31/2015 | | | 12/31/2014 | |
| Loan expense | | $ | 3,356 | | | $ | 3,416 | | | $ | 3,342 | | | $ | 2,721 | | | $ | 3,312 | | | $ | 12,835 | | | $ | 12,953 | |
| Amortization of intangibles | | | 1,927 | | | | 1,942 | | | | 1,959 | | | | 1,991 | | | | 2,123 | | | | 7,819 | | | | 8,756 | |
| Other miscellaneous expense | | | 7,749 | | | | 6,840 | | | | 6,885 | | | | 6,994 | | | | 8,985 | | | | 28,468 | | | | 32,158 | |
| Total other expense | | $ | 13,032 | | | $ | 12,198 | | | $ | 12,186 | | | $ | 11,706 | | | $ | 14,420 | | | $ | 49,122 | | | $ | 53,867 | |