Third Quarter 2019 Financial Results October 22, 2019 Exhibit 99.2
Forward–Looking Statements Certain statements contained in this document constitute forward-looking statements within the meaning of the Private Securities Litigation Reform Act of 1995. You can identify forward-looking statements by words such as “may,” “hope,” “will,” “should,” “expect,” “plan,” “anticipate,” “intend,” “believe,” “estimate,” “predict,” “potential,” “continue,” “could,” “future” or the negative of those terms or other words of similar meaning. You should read statements that contain these words carefully because they discuss our future expectations or state other “forward-looking” information. These forward-looking statements include, but are not limited to, statements relating to anticipated future operating and financial performance measures, including net interest margin, credit quality, business initiatives, growth opportunities and growth rates, among other things, and encompass any estimate, prediction, expectation, projection, opinion, anticipation, outlook or statement of belief included therein as well as the management assumptions underlying these forward-looking statements. You should be aware that the occurrence of the events described under the caption “Risk Factors” in Trustmark’s filings with the Securities and Exchange Commission could have an adverse effect on our business, results of operations and financial condition. Should one or more of these risks materialize, or should any such underlying assumptions prove to be significantly different, actual results may vary significantly from those anticipated, estimated, projected or expected. Risks that could cause actual results to differ materially from current expectations of Management include, but are not limited to, changes in the level of nonperforming assets and charge-offs, local, state and national economic and market conditions, including potential market impacts of efforts by the Board of Governors of the Federal Reserve System (FRB) to reduce the size of its balance sheet, conditions in the housing and real estate markets in the regions in which Trustmark operates and the extent and duration of the current volatility in the credit and financial markets as well as crude oil prices, changes in our ability to measure the fair value of assets in our portfolio, material changes in the level and/or volatility of market interest rates, the performance and demand for the products and services we offer, including the level and timing of withdrawals from our deposit accounts, the costs and effects of litigation and of unexpected or adverse outcomes in such litigation, our ability to attract noninterest-bearing deposits and other low-cost funds, competition in loan and deposit pricing, as well as the entry of new competitors into our markets through de novo expansion and acquisitions, economic conditions, including the potential impact of issues relating to the European financial system and monetary and other governmental actions designed to address credit, securities, and/or commodity markets, the enactment of legislation and changes in existing regulations or enforcement practices or the adoption of new regulations, changes in accounting standards and practices, including changes in the interpretation of existing standards, that affect our consolidated financial statements, changes in consumer spending, borrowings and savings habits, technological changes, changes in the financial performance or condition of our borrowers, changes in our ability to control expenses, greater than expected costs or difficulties related to the integration of acquisitions or new products and lines of business, cyber-attacks and other breaches which could affect our information system security, natural disasters, environmental disasters, acts of war or terrorism, and other risks described in our filings with the Securities and Exchange Commission. Although we believe that the expectations reflected in such forward-looking statements are reasonable, we can give no assurance that such expectations will prove to be correct. Except as required by law, we undertake no obligation to update or revise any of this information, whether as the result of new information, future events or developments or otherwise.
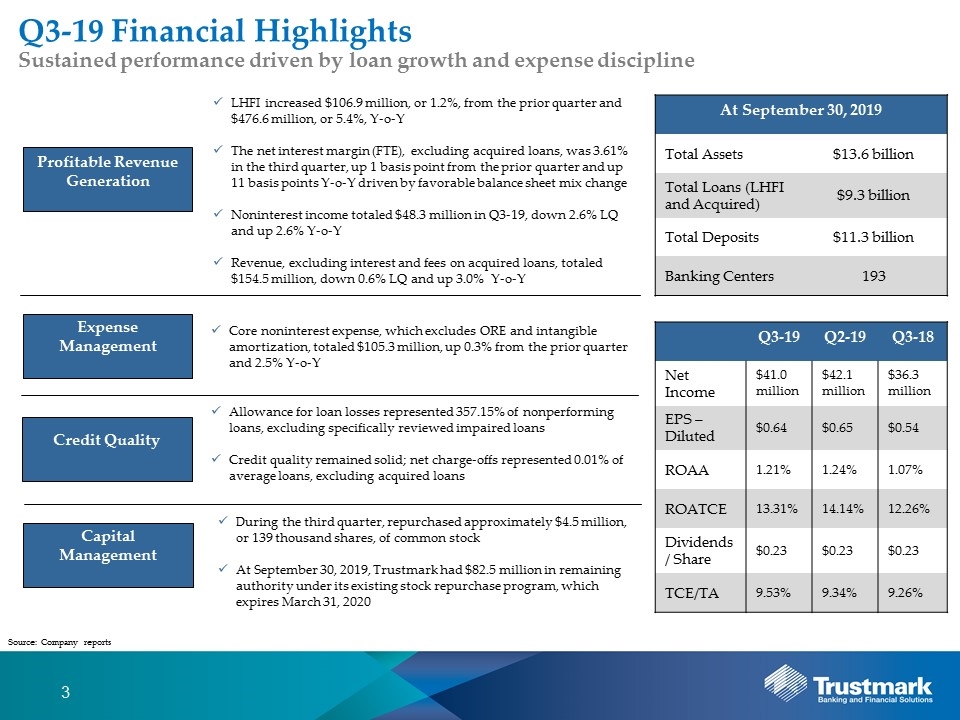
Profitable Revenue Generation Expense Management Credit Quality Capital Management LHFI increased $106.9 million, or 1.2%, from the prior quarter and $476.6 million, or 5.4%, Y-o-Y The net interest margin (FTE), excluding acquired loans, was 3.61% in the third quarter, up 1 basis point from the prior quarter and up 11 basis points Y-o-Y driven by favorable balance sheet mix change Noninterest income totaled $48.3 million in Q3-19, down 2.6% LQ and up 2.6% Y-o-Y Revenue, excluding interest and fees on acquired loans, totaled $154.5 million, down 0.6% LQ and up 3.0% Y-o-Y Core noninterest expense, which excludes ORE and intangible amortization, totaled $105.3 million, up 0.3% from the prior quarter and 2.5% Y-o-Y Allowance for loan losses represented 357.15% of nonperforming loans, excluding specifically reviewed impaired loans Credit quality remained solid; net charge-offs represented 0.01% of average loans, excluding acquired loans During the third quarter, repurchased approximately $4.5 million, or 139 thousand shares, of common stock At September 30, 2019, Trustmark had $82.5 million in remaining authority under its existing stock repurchase program, which expires March 31, 2020 Sustained performance driven by loan growth and expense discipline At September 30, 2019 Total Assets $13.6 billion Total Loans (LHFI and Acquired) $9.3 billion Total Deposits $11.3 billion Banking Centers 193 Q3-19 Financial Highlights Source: Company reports Q3-19 Q2-19 Q3-18 Net Income $41.0 million $42.1 million $36.3 million EPS – Diluted $0.64 $0.65 $0.54 ROAA 1.21% 1.24% 1.07% ROATCE 13.31% 14.14% 12.26% Dividends / Share $0.23 $0.23 $0.23 TCE/TA 9.53% 9.34% 9.26%
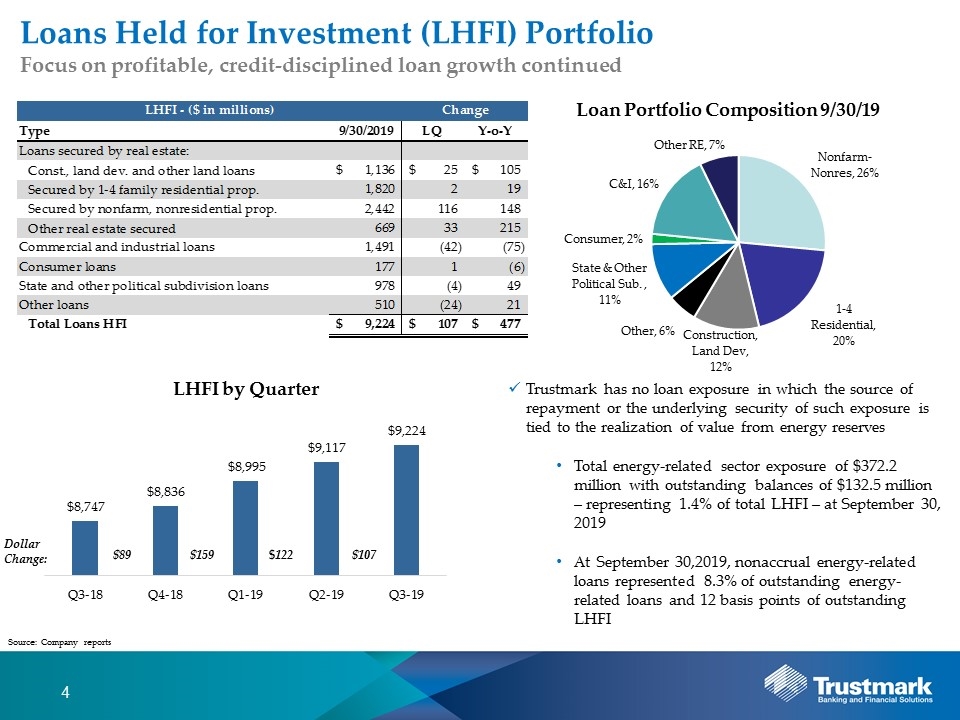
Loans Held for Investment (LHFI) Portfolio Focus on profitable, credit-disciplined loan growth continued Trustmark has no loan exposure in which the source of repayment or the underlying security of such exposure is tied to the realization of value from energy reserves Total energy-related sector exposure of $372.2 million with outstanding balances of $132.5 million – representing 1.4% of total LHFI – at September 30, 2019 At September 30,2019, nonaccrual energy-related loans represented 8.3% of outstanding energy-related loans and 12 basis points of outstanding LHFI Source: Company reports Dollar Change: $89 $159 $122 $107
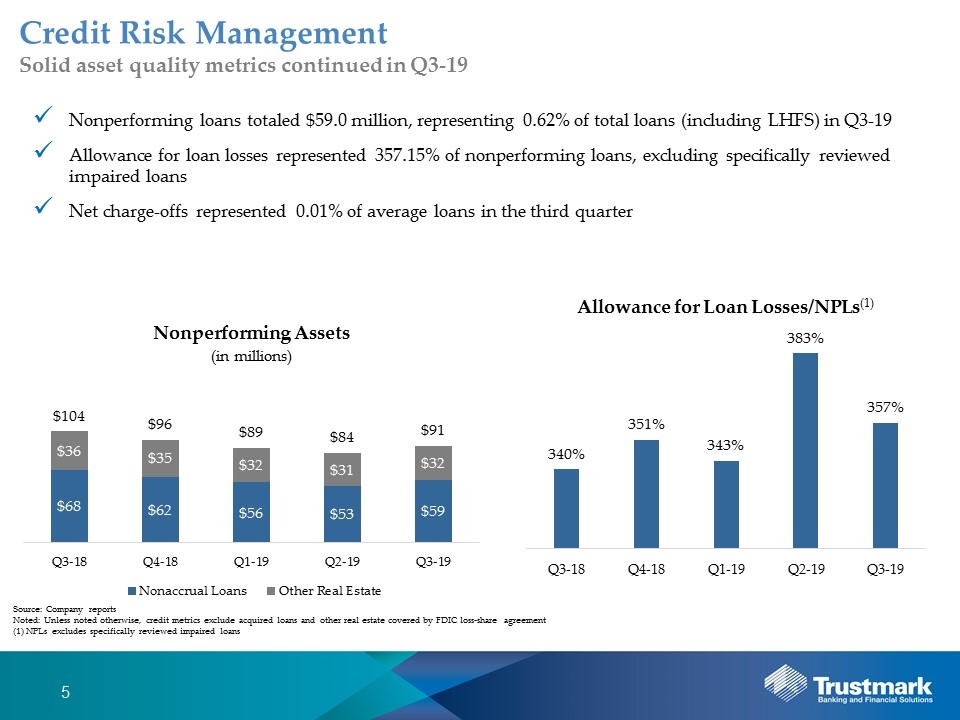
Credit Risk Management Solid asset quality metrics continued in Q3-19 Nonperforming loans totaled $59.0 million, representing 0.62% of total loans (including LHFS) in Q3-19 Allowance for loan losses represented 357.15% of nonperforming loans, excluding specifically reviewed impaired loans Net charge-offs represented 0.01% of average loans in the third quarter Source: Company reports Noted: Unless noted otherwise, credit metrics exclude acquired loans and other real estate covered by FDIC loss-share agreement (1) NPLs excludes specifically reviewed impaired loans
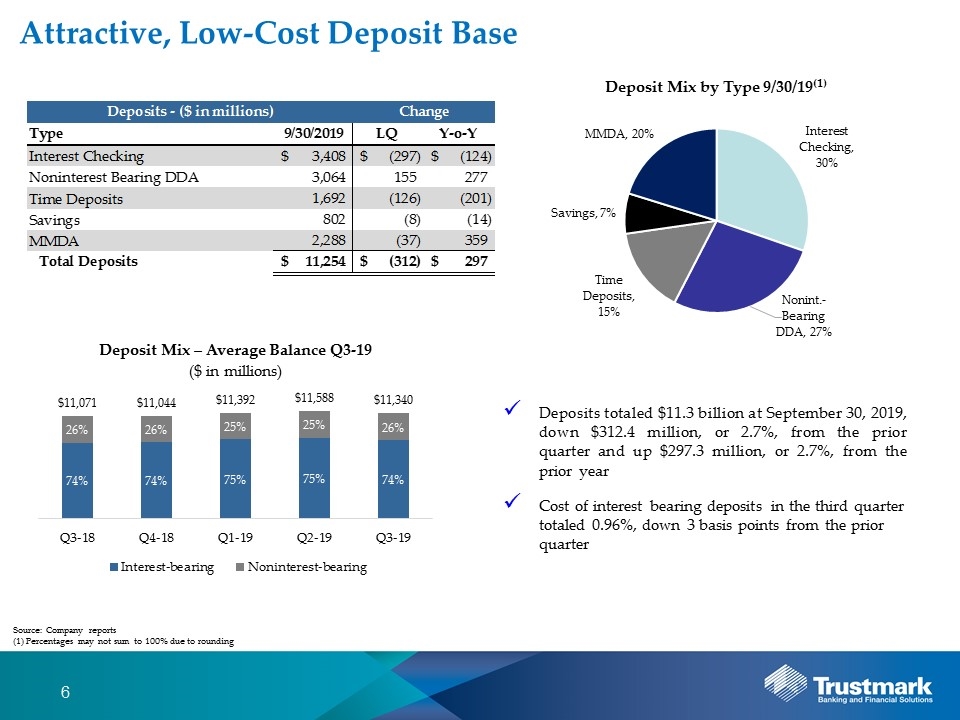
Attractive, Low-Cost Deposit Base Deposits totaled $11.3 billion at September 30, 2019, down $312.4 million, or 2.7%, from the prior quarter and up $297.3 million, or 2.7%, from the prior year Cost of interest bearing deposits in the third quarter totaled 0.96%, down 3 basis points from the prior quarter Source: Company reports (1) Percentages may not sum to 100% due to rounding

Income Statement Highlights – Net Interest Income Net interest income (FTE), excluding acquired loans, totaled $109.4 million in the third quarter, an increase of 0.4% from the prior quarter and 3.1% year-over-year Inclusive of acquired loans, net interest income (FTE) increased 0.7% from the prior quarter to total $111.7 million, reflecting a $93 thousand increase in interest income and a $650 thousand decrease in interest expense The net interest margin (FTE), excluding acquired loans, was 3.61% in the third quarter, up 1 basis point from the prior quarter and up 11 basis points year-over-year Source: Company reports (1) Totals may not foot due to rounding (2) Loan Yield and NIM exclude acquired loans
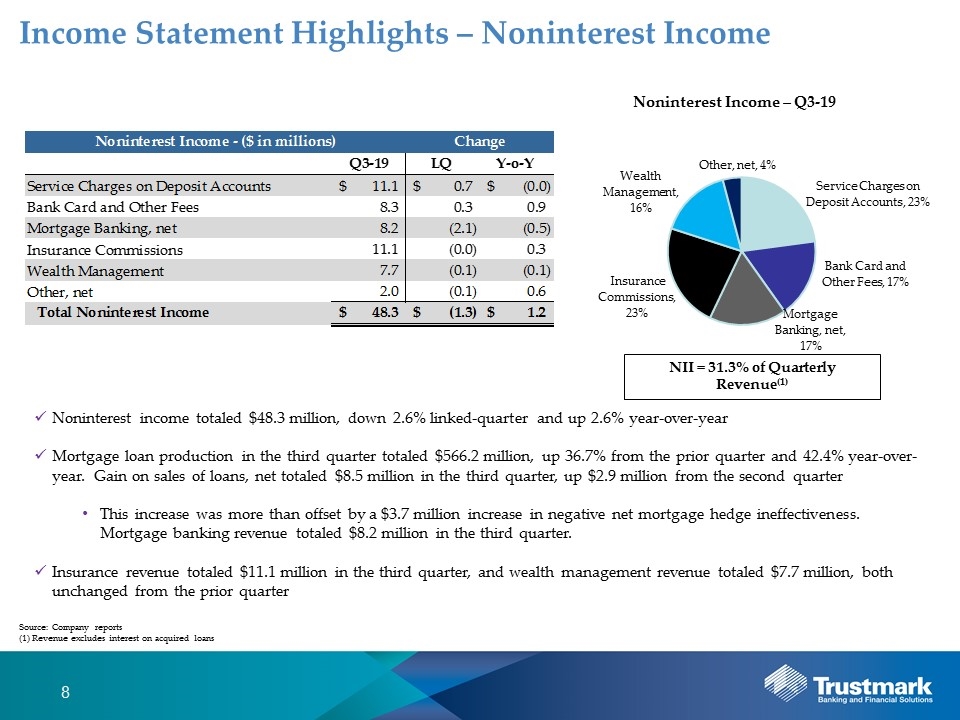
Income Statement Highlights – Noninterest Income Noninterest income totaled $48.3 million, down 2.6% linked-quarter and up 2.6% year-over-year Mortgage loan production in the third quarter totaled $566.2 million, up 36.7% from the prior quarter and 42.4% year-over-year. Gain on sales of loans, net totaled $8.5 million in the third quarter, up $2.9 million from the second quarter This increase was more than offset by a $3.7 million increase in negative net mortgage hedge ineffectiveness. Mortgage banking revenue totaled $8.2 million in the third quarter. Insurance revenue totaled $11.1 million in the third quarter, and wealth management revenue totaled $7.7 million, both unchanged from the prior quarter Source: Company reports (1) Revenue excludes interest on acquired loans NII = 31.3% of Quarterly Revenue(1)
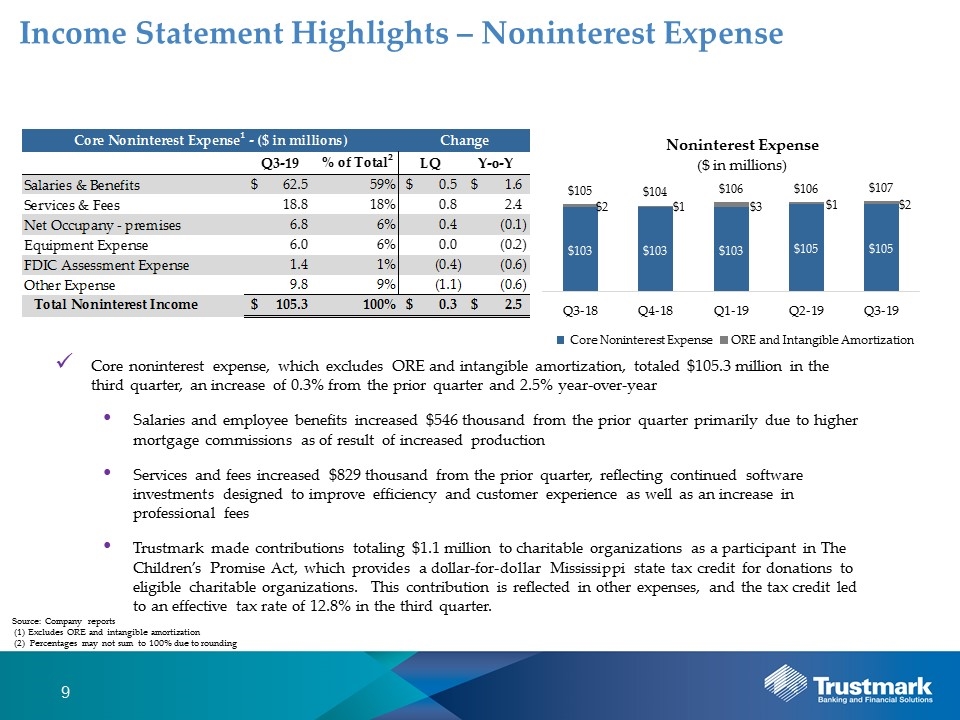
Income Statement Highlights – Noninterest Expense Core noninterest expense, which excludes ORE and intangible amortization, totaled $105.3 million in the third quarter, an increase of 0.3% from the prior quarter and 2.5% year-over-year Salaries and employee benefits increased $546 thousand from the prior quarter primarily due to higher mortgage commissions as of result of increased production Services and fees increased $829 thousand from the prior quarter, reflecting continued software investments designed to improve efficiency and customer experience as well as an increase in professional fees Trustmark made contributions totaling $1.1 million to charitable organizations as a participant in The Children’s Promise Act, which provides a dollar-for-dollar Mississippi state tax credit for donations to eligible charitable organizations. This contribution is reflected in other expenses, and the tax credit led to an effective tax rate of 12.8% in the third quarter. Source: Company reports (1) Excludes ORE and intangible amortization (2) Percentages may not sum to 100% due to rounding
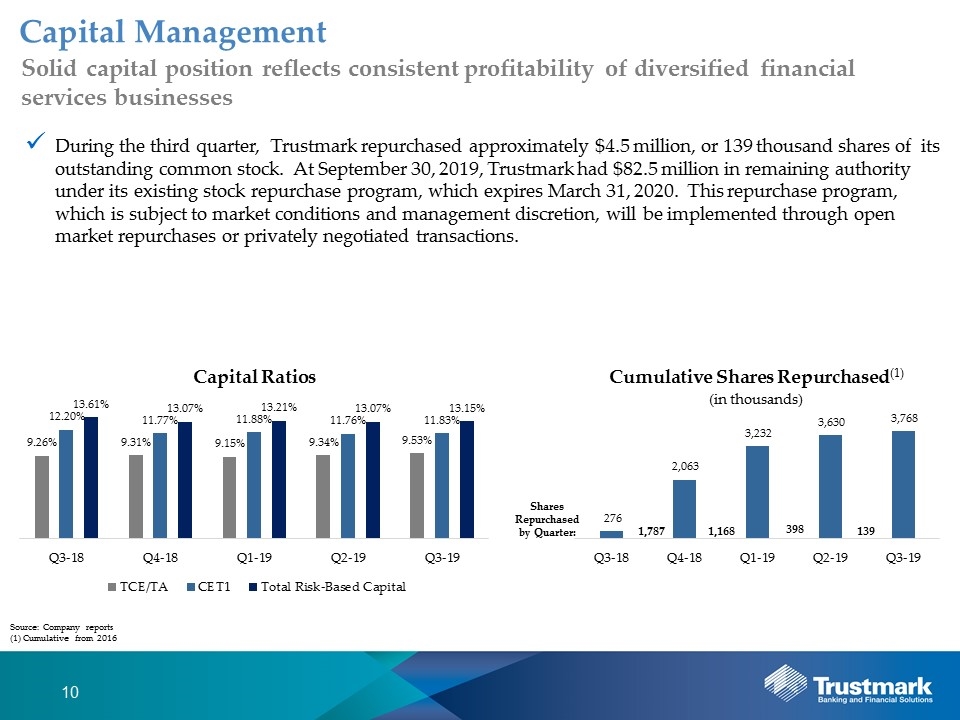
Capital Management Solid capital position reflects consistent profitability of diversified financial services businesses During the third quarter, Trustmark repurchased approximately $4.5 million, or 139 thousand shares of its outstanding common stock. At September 30, 2019, Trustmark had $82.5 million in remaining authority under its existing stock repurchase program, which expires March 31, 2020. This repurchase program, which is subject to market conditions and management discretion, will be implemented through open market repurchases or privately negotiated transactions. Source: Company reports (1) Cumulative from 2016 1,787 1,168 398 139 Shares Repurchased by Quarter:
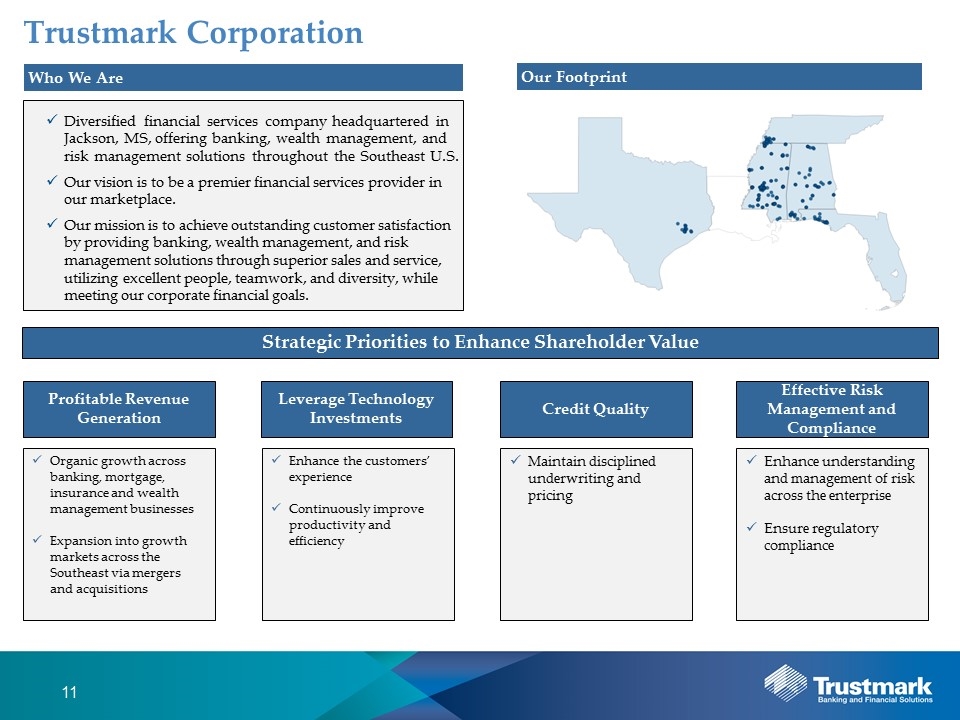
Profitable Revenue Generation Organic growth across banking, mortgage, insurance and wealth management businesses Expansion into growth markets across the Southeast via mergers and acquisitions Enhance the customers’ experience Continuously improve productivity and efficiency Maintain disciplined underwriting and pricing Enhance understanding and management of risk across the enterprise Ensure regulatory compliance Trustmark Corporation Who We Are Diversified financial services company headquartered in Jackson, MS, offering banking, wealth management, and risk management solutions throughout the Southeast U.S. Our vision is to be a premier financial services provider in our marketplace. Our mission is to achieve outstanding customer satisfaction by providing banking, wealth management, and risk management solutions through superior sales and service, utilizing excellent people, teamwork, and diversity, while meeting our corporate financial goals. Leverage Technology Investments Credit Quality Effective Risk Management and Compliance Our Footprint Strategic Priorities to Enhance Shareholder Value


