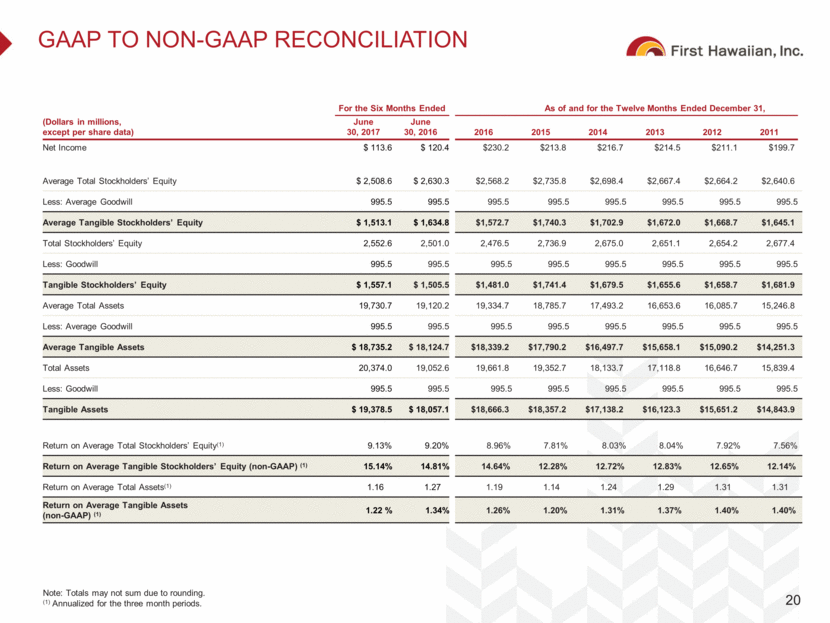
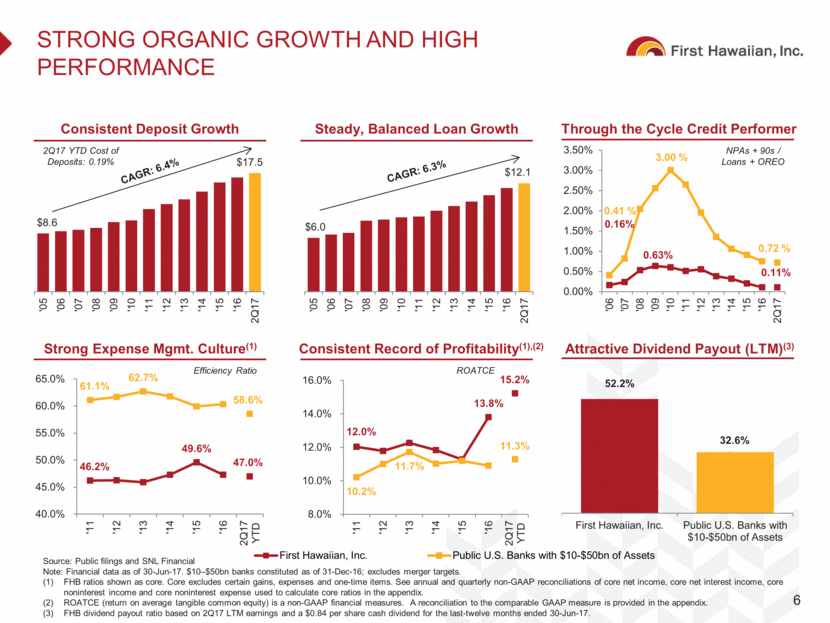
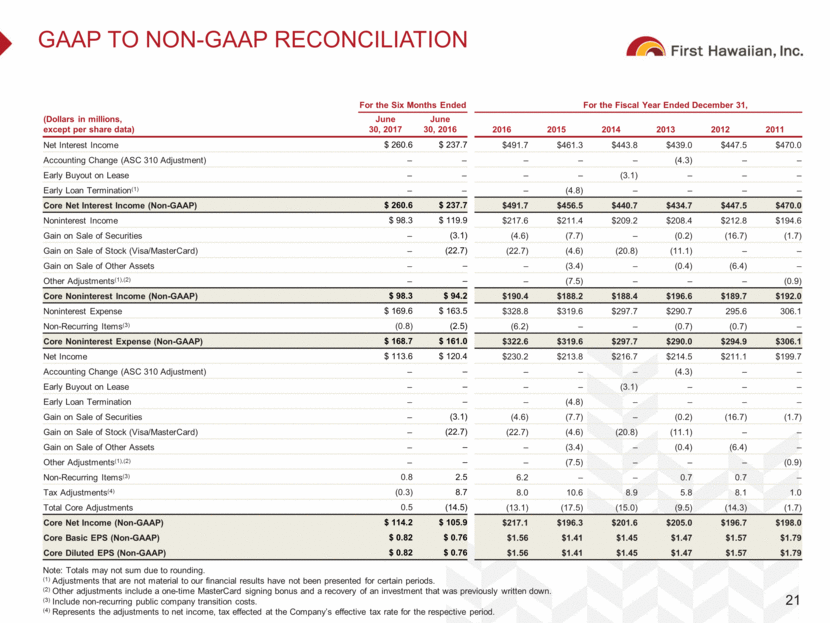
GAAP to Non-GAAP Reconciliation 20 Note: Totals may not sum due to rounding. (1) Annualized for the three month periods. For the Six Months Ended As of and for the Twelve Months Ended December 31, (Dollars in millions, except per share data) June 30, 2017 June 30, 2016 2016 2015 2014 2013 2012 2011 Net Income $ 113.6 $ 120.4 $230.2 $213.8 $216.7 $214.5 $211.1 $199.7 Average Total Stockholders’ Equity $ 2,508.6 $ 2,630.3 $2,568.2 $2,735.8 $2,698.4 $2,667.4 $2,664.2 $2,640.6 Less: Average Goodwill 995.5 995.5 995.5 995.5 995.5 995.5 995.5 995.5 Average Tangible Stockholders’ Equity $ 1,513.1 $ 1,634.8 $1,572.7 $1,740.3 $1,702.9 $1,672.0 $1,668.7 $1,645.1 Total Stockholders’ Equity 2,552.6 2,501.0 2,476.5 2,736.9 2,675.0 2,651.1 2,654.2 2,677.4 Less: Goodwill 995.5 995.5 995.5 995.5 995.5 995.5 995.5 995.5 Tangible Stockholders’ Equity $ 1,557.1 $ 1,505.5 $1,481.0 $1,741.4 $1,679.5 $1,655.6 $1,658.7 $1,681.9 Average Total Assets 19,730.7 19,120.2 19,334.7 18,785.7 17,493.2 16,653.6 16,085.7 15,246.8 Less: Average Goodwill 995.5 995.5 995.5 995.5 995.5 995.5 995.5 995.5 Average Tangible Assets $ 18,735.2 $ 18,124.7 $18,339.2 $17,790.2 $16,497.7 $15,658.1 $15,090.2 $14,251.3 Total Assets 20,374.0 19,052.6 19,661.8 19,352.7 18,133.7 17,118.8 16,646.7 15,839.4 Less: Goodwill 995.5 995.5 995.5 995.5 995.5 995.5 995.5 995.5 Tangible Assets $ 19,378.5 $ 18,057.1 $18,666.3 $18,357.2 $17,138.2 $16,123.3 $15,651.2 $14,843.9 Return on Average Total Stockholders’ Equity(1) 9.13% 9.20% 8.96% 7.81% 8.03% 8.04% 7.92% 7.56% Return on Average Tangible Stockholders’ Equity (non-GAAP) (1) 15.14% 14.81% 14.64% 12.28% 12.72% 12.83% 12.65% 12.14% Return on Average Total Assets(1) 1.16 1.27 1.19 1.14 1.24 1.29 1.31 1.31 Return on Average Tangible Assets (non-GAAP) (1) 1.22 % 1.34% 1.26% 1.20% 1.31% 1.37% 1.40% 1.40%
