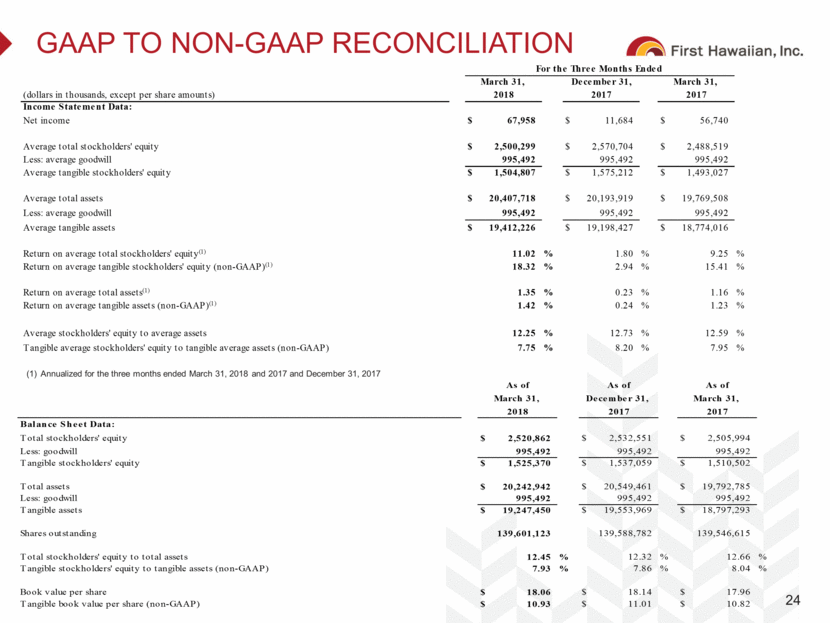
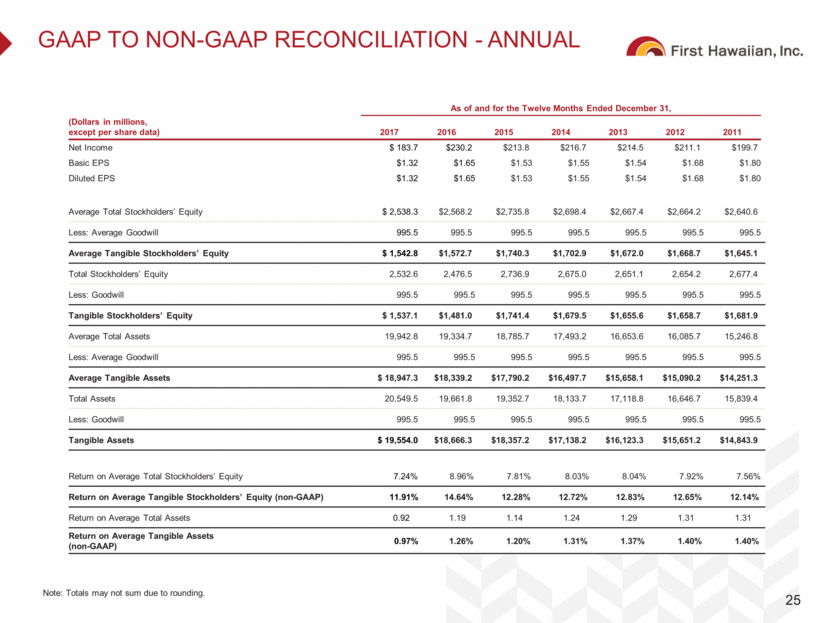
GAAP to Non-gaap reconciliation 24 (1) Annualized for the three months ended March 31, 2018 and 2017 and December 31, 2017 (dollars in thousands, except per share amounts) Income Statement Data: Net income $ 67,958 $ 11,684 $ 56,740 Average total stockholders' equity $ 2,500,299 $ 2,570,704 $ 2,488,519 Less: average goodwill 995,492 995,492 995,492 Average tangible stockholders' equity $ 1,504,807 $ 1,575,212 $ 1,493,027 Average total assets $ 20,407,718 $ 20,193,919 $ 19,769,508 Less: average goodwill 995,492 995,492 995,492 Average tangible assets $ 19,412,226 $ 19,198,427 $ 18,774,016 Return on average total stockholders' equity (1) 11.02 % 1.80 % 9.25 % Return on average tangible stockholders' equity (non-GAAP) (1) 18.32 % 2.94 % 15.41 % Return on average total assets (1) 1.35 % 0.23 % 1.16 % Return on average tangible assets (non-GAAP) (1) 1.42 % 0.24 % 1.23 % Average stockholders' equity to average assets 12.25 % 12.73 % 12.59 % Tangible average stockholders' equity to tangible average assets (non-GAAP) 7.75 % 8.20 % 7.95 % For the Three Months Ended March 31, December 31, March 31, 2018 2017 2017 Balance Sheet Data: Total stockholders' equity $ 2,520,862 $ 2,532,551 $ 2,505,994 Less: goodwill 995,492 995,492 995,492 Tangible stockholders' equity $ 1,525,370 $ 1,537,059 $ 1,510,502 Total assets $ 20,242,942 $ 20,549,461 $ 19,792,785 Less: goodwill 995,492 995,492 995,492 Tangible assets $ 19,247,450 $ 19,553,969 $ 18,797,293 Shares outstanding 139,601,123 139,588,782 139,546,615 Total stockholders' equity to total assets 12.45 % 12.32 % 12.66 % 7.93 % 7.86 % 8.04 % Book value per share $ 18.06 $ 18.14 $ 17.96 Tangible book value per share (non-GAAP) $ 10.93 $ 11.01 $ 10.82 Tangible stockholders' equity to tangible assets (non-GAAP) March 31, 2018 As of December 31, March 31, 2017 2017 As of As of