Exhibit 99
PRESS RELEASE
| | | |
|
| For Release: | | November 5, 2010 |
| Nasdaq: | | MFNC |
| Contact: | | Investor Relations at (888) 343-8147 |
| Website: | | www.bankmbank.com |
MACKINAC FINANCIAL CORPORATION
REPORTS THIRD QUARTER AND NINE MONTHS 2010 RESULTS
(Manistique, Michigan) — Mackinac Financial Corporation (Nasdaq: MFNC), the bank holding company for mBank (the “Bank”) today announced a third quarter 2010 loss of $.104 million or $(.03) per share compared to net income of $1.536 million, or $.45 per share for the third quarter of 2009. Net income for the first nine months of 2010 totaled $.934 million, or $.27 per share, compared to $2.087 million, or $.61 per share, for the same period in 2009.
The third quarter results include a provision for loan losses of $1.000 million compared to $.700 million for the three month period in 2009. Operating results for the nine month period in 2010 include a $4.700 million provision, $1.948 million in OREO write-downs, $.215 million in security gains and a $3.500 million deferred tax benefit. The nine month and three month results for 2009 include a $1.208 million gain from the sale of two branch offices and $.644 million in security gains.
Income before tax and loan loss provision for the third quarter of 2010 amounted to $1.111 million compared to $1.433 million in 2009 before tax, loan loss provision and also excluding the branch sale and security gains noted above. The 2010 nine month income before provision, taxes and nonrecurring items noted above, would total $3.330 million in compared to $3.100 million in 2009. Outside of the continuing impact of higher provisions and other costs associated with remediation of problem credits, the company continued its momentum in terms of strong core deposit growth and noninterest income generation from loan sales. Core deposits have increased by $77 million in 2010 and income from SBA and secondary mortgage loans totaled $.958 million thus far in 2010 compared to $.472 million in 2009, more than a 100% increase.
Nonperforming assets at the end of the third quarter of 2010 totaled $17.005 million, 3.41% of total assets, a reduction of $4.036 million from 2009 year end balances of $21.041 million. Nonaccrual loans represent 1.16% of total loans and loan delinquencies greater than 30 days have remained stable and continue to reside below peer levels and manageable. The company’s Texas Ratio remained satisfactory at 27.68%. Kelly George, President and Chief Executive Officer of mBank, commented, “We are pleased to record lower levels of nonperforming assets and we will continue our timely and aggressive efforts in the identification and resolution of nonperforming assets which should result in more normalized loan loss provisions and lowered credit related costs in future periods. However, we continue to be hindered from the impacts of reappraising problem assets due to the slow disposition process from an accommodating Michigan legal system for borrowers, but are encouraged that we are facing few new problem situations.”
4
Loans at September 30, 2010 totaled $382.727 million down slightly from the $384.100 million at September 30, 2009 and from 2009 year end balances of $384.310 million. Loan balances have been impacted by normal principal runoff of $38.0 million along with pay-offs of $17.8 million and SBA sales. Mr. George stated, “Although our outstanding loan balances have not increased, we are pleased with current year to date production which totaled $58.0 million, with 72% originating in the Upper Peninsula. Our fourth quarter pipeline is strong with continued success with the SBA and USDA loan guarantee programs. Thus far in 2010 we have sold $8.9 million of these loan balances and recognized $.647 million in gains.”
Total assets of the Corporation at September 30, 2010 were $499.066 million, down $14.174 million, or 2.76% from the $513.180 million in total assets reported at September 30, 2009 and down $16.371 million, or 3.18%, from total assets of $515.377 million at year-end 2009. Asset totals at September 30, 2010 reflect the decrease of $9.063 million in securities.
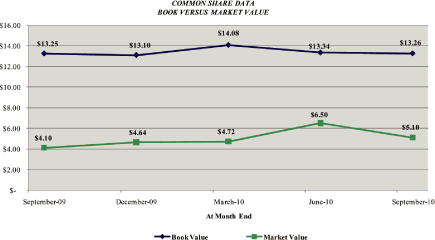
Total shareholders’ equity at September 30, 2010 totaled $55.987 million, compared to $55.766 million on September 30, 2009, an increase of $.221 million, or .40%. The capital levels at the bank and on a consolidated basis are strong with Tier 1 above 8% and total risk based capital above 11%. Book value of common shareholders’ equity was $13.26 per share at September 30, 2010 compared to $13.25 per share at September 30, 2009.
Total deposits of $404.524 were lower than deposit totals reported at September 30, 2009 of $418.581 million and 2009 year-end deposits of $421.389 million. The decreased deposit level was due entirely to lower levels of brokered deposits, a very positive initiative given the current regulatory climate for this type of funding source, which totaled $94.660 million at September 30, 2010 compared to $175.176 million at 2009 year end and $192.631 million at September 30, 2009.
Noninterest income, totaled $.648 million in the third quarter of 2010, compared to $2.418 million in the same period in 2009. Noninterest income for the 2010 nine month period totaled $2.048 million compared to $3.248 million in 2009. Noninterest income for the third quarter and nine month periods of 2009 included $1.208 million of branch sale gains and $.644 million of security gains. The Corporation also recognized $.215 million in gains from the sale of securities which was recorded in the first quarter of 2010.
Noninterest expense totaled $3.601 million in the third quarter, an increase of $.158 million from the third quarter of 2009. On a year to date basis 2010 noninterest expense totaled $12.560 million, an increase of $2.408 million when compared to the nine months ended September 30, 2009. The increase in expenses is primarily attributed to costs associated with nonperforming assets which were $2.2 million higher in 2010 and included OREO write-downs of $1.948 million. Noninterest expenses, excluding the extraordinary costs incurred for remediation of nonperforming assets, are well managed and below peer averages.
MFNC Chairman and CEO Paul Tobias concluded, “Thus far in 2010, we have focused our efforts on preserving shareholders’ equity with extensive efforts in nonperforming asset remediation. Our results through the first nine months reflect the costs associated with this effort. We are confident that the worst is behind us and pleased to report that our core earnings are increasing. We will continue to look for opportunities that will enhance the franchise value while improving our current platform to increase core earnings.”
Mackinac Financial Corporation is a registered bank holding company formed under the Bank Holding Company Act of 1956 with assets in excess of $450 million and whose common stock is traded on the NASDAQ stock market as “MFNC.” The principal subsidiary of the Corporation is mBank. Headquartered in Manistique, Michigan, mBank has 11 branch locations in Michigan; seven in the Upper Peninsula, three in the Northern Lower Peninsula and one in Oakland County. The Company’s banking services include commercial
5
lending and treasury management products and services geared toward small to mid-sized businesses, as well as a full array of personal and business deposit products and consumer loans.
Forward-Looking Statements
This release contains certain forward-looking statements. Words such as “anticipates,” “believes,” “estimates,” “expects,” “intends,” “should,” “will,” and variations of such words and similar expressions are intended to identify forward-looking statements: as defined by the Private Securities Litigation Reform Act of 1995. These statements reflect management’s current beliefs as to expected outcomes of future events and are not guarantees of future performance. These statements involve certain risks, uncertainties and assumptions that are difficult to predict with regard to timing, extent, likelihood and degree of occurrence. Therefore, actual results and outcomes may materially differ from what may be expressed or forecasted in such forward-looking statements. Factors that could cause a difference include among others: changes in the national and local economies or market conditions; changes in interest rates and banking regulations; the impact of competition from traditional or new sources; and the possibility that anticipated cost savings and revenue enhancements from mergers and acquisitions, bank consolidations, branch closings and other sources may not be fully realized at all or within specified time frames as well as other risks and uncertainties including but not limited to those detailed from time to time in filings of the Company with the Securities and Exchange Commission. These and other factors may cause decisions and actual results to differ materially from current expectations. Mackinac Financial Corporation undertakes no obligation to revise, update, or clarify forward-looking statements to reflect events or conditions after the date of this release.
6
MACKINAC FINANCIAL CORPORATION AND SUBSIDIARIES
SELECTED FINANCIAL HIGHLIGHTS
| | | | | | | | | | | | | |
| | | For The Period Ended | |
| | | September 30, | | | December 31, | | | September 30, | |
| | | 2010 | | | 2009 | | | 2009 | |
| (Dollars in thousands, except per share data) | | (Unaudited) | | | | | | (Unaudited) | |
Selected Financial Condition Data (at end of period): | | | | | | | | | | | | |
| Assets | | $ | 499,006 | | | $ | 515,377 | | | $ | 513,180 | |
| | | | | | | | | | |
| Loans | | | 382,727 | | | | 384,310 | | | | 384,100 | |
| | | | | | | | | | |
| Investment securities | | | 37,450 | | | | 46,513 | | | | 80,203 | |
| | | | | | | | | | |
| Deposits | | | 404,524 | | | | 421,389 | | | | 418,581 | |
| | | | | | | | | | |
| Borrowings | | | 36,069 | | | | 36,140 | | | | 36,140 | |
| | | | | | | | | | |
| Shareholders’ Equity | | | 55,987 | | | | 55,299 | | | | 55,766 | |
| | | | | | | | | | |
| | | | | | | | | | | | | |
Selected Statements of Income Data(nine months and year ended): | | | | | | | | | | | | |
| | | | | | | | | | |
| Net interest income | | $ | 12,109 | | | $ | 16,287 | | | $ | 11,856 | |
| | | | | | | | | | |
| Provision for loan losses | | | 4,700 | | | | 3,700 | | | | 1,400 | |
| | | | | | | | | | |
| Income (Loss) before taxes and preferred dividend | | | (3,103 | ) | | | 3,536 | | | | 3,552 | |
| | | | | | | | | | |
| Net income | | | 934 | | | | 1,907 | | | | 2,087 | |
| | | | | | | | | | |
| Income per common share — Basic | | | .27 | | | | .56 | | | | .61 | |
| | | | | | | | | | |
| Income per common share — Diluted | | | .27 | | | | .56 | | | | .61 | |
| | | | | | | | | | |
| | | | | | | | | | | | | |
Three Months Ended: | | | | | | | | | | | | |
| | | | | | | | | | |
| Net interest income | | $ | 4,064 | | | $ | 4,431 | | | $ | 4,310 | |
| | | | | | | | | | |
| Income (Loss) before taxes and preferred dividend | | | 111 | | | | (16 | ) | | | 2,585 | |
| | | | | | | | | | |
| Net income (Loss) | | | (104 | ) | | | (180 | ) | | | 1,536 | |
| | | | | | | | | | |
| Income (Loss) per common share — Basic | | | (.03 | ) | | | (.05 | ) | | | .45 | |
| | | | | | | | | | |
| Income (Loss) per common share — Diluted | | | (.03 | ) | | | (.05 | ) | | | .45 | |
| | | | | | | | | | |
| Weighted average shares outstanding | | | 3,419,736 | | | | 3,419,736 | | | | 3,419,736 | |
| | | | | | | | | | |
| | | | | | | | | | | | | |
Selected Financial Ratios and Other Data (ninemonths and year ended): | | | | | | | | | | | | |
| | | | | | | | | | |
Performance Ratios: | | | | | | | | | | | | |
| | | | | | | | | | |
| Net interest margin | | | 3.59 | % | | | 3.59 | % | | | 3.54 | % |
| | | | | | | | | | | |
| Efficiency ratio | | | 74.12 | | | | 73.37 | | | | 77.71 | |
| | | | | | | | | | |
| Return on average assets | | | .25 | | | | .39 | | | | .57 | |
| | | | | | | | | | |
| Return on average equity | | | 2.21 | | | | 3.77 | | | | 5.72 | |
| | | | | | | | | | |
| |
| Average total assets | | $ | 507,938 | | | $ | 493,652 | | | $ | 486,760 | |
| | | | | | | | | | |
| Average total shareholders’ equity | | $ | 56,561 | | | $ | 50,531 | | | $ | 48,801 | |
| | | | | | | | | | |
| Average loans to average deposits ratio | | | 93.19 | % | | | 92.99 | % | | | 93.22 | % |
| | | | | | | | | | | |
| | | | | | | | | | | | | |
Common Share Data (at end of period): | | | | | | | | | | | | |
| | | | | | | | | | |
| Market price per common share | | $ | 5.10 | | | $ | 4.64 | | | $ | 4.10 | |
| | | | | | | | | | |
| Book value per common share | | $ | 13.26 | | | $ | 13.10 | | | $ | 13.25 | |
| | | | | | | | | | |
| Common shares outstanding | | | 3,419,736 | | | | 3,419,736 | | | | 3,419,736 | |
| | | | | | | | | | |
| | | | | | | | | | | | | |
Other Data (at end of period): | | | | | | | | | | | | |
| | | | | | | | | | |
| Allowance for loan losses | | $ | 5,437 | | | $ | 5,225 | | | $ | 4,081 | |
| | | | | | | | | | |
| Non-performing assets | | $ | 17,005 | | | $ | 21,041 | | | $ | 17,349 | |
| | | | | | | | | | |
| Allowance for loan losses to total loans | | | 1.42 | % | | | 1.36 | % | | | 1.06 | % |
| | | | | | | | | | | |
| Non-performing assets to total assets | | | 3.41 | % | | | 4.08 | % | | | 3.38 | % |
| | | | | | | | | | | |
| Texas Ratio* | | | 27.68 | % | | | 34.77 | % | | | 28.99 | % |
| | | | | | | | | | | |
| Number of: | | | | | | | | | | | | |
| | | | | | | | | | |
| Branch locations | | | 11 | | | | 10 | | | | 10 | |
| | | | | | | | | | |
| FTE Employees | | | 98 | | | | 100 | | | | 97 | |
| | | | | | | | | | |
| | |
| * | | Texas Ratio: Non-performing Assets divided by Total Equity plus Allowance for Loan Losses |
7
MACKINAC FINANCIAL CORPORATION AND SUBSIDIARIES
CONSOLIDATED BALANCE SHEETS
| | | | | | | | | | | | | |
| | | September 30, | | | December 31, | | | September 30, | |
| (Dollars in thousands) | | 2010 | | | 2009 | | | 2009 | |
| | | (Unaudited) | | | | | | | (Unaudited) | |
ASSETS | | | | | | | | | | | | |
| | | | | | | | | | | | | |
| Cash and due from banks | | $ | 36,561 | | | $ | 18,433 | | | $ | 23,249 | |
| Federal funds sold | | | 12,000 | | | | 27,000 | | | | — | |
| | | | | | | | | | |
| Cash and cash equivalents | | | 48,561 | | | | 45,433 | | | | 23,249 | |
| | | | | | | | | | | | | |
| Interest-bearing deposits in other financial institutions | | | 692 | | | | 678 | | | | 662 | |
| Securities available for sale | | | 37,450 | | | | 46,513 | | | | 80,203 | |
| Federal Home Loan Bank stock | | | 3,794 | | | | 3,794 | | | | 3,794 | |
| | | | | | | | | | | | | |
| Loans: | | | | | | | | | | | | |
| Commercial | | | 295,262 | | | | 305,670 | | | | 306,590 | |
| Mortgage | | | 82,312 | | | | 74,350 | | | | 73,116 | |
| Installment | | | 5,153 | | | | 4,290 | | | | 4,394 | |
| | | | | | | | | | |
| Total Loans | | | 382,727 | | | | 384,310 | | | | 384,100 | |
| Allowance for loan losses | | | (5,437 | ) | | | (5,225 | ) | | | (4,081 | ) |
| | | | | | | | | | |
| Net loans | | | 377,290 | | | | 379,085 | | | | 380,019 | |
| | | | | | | | | | | | | |
| Premises and equipment | | | 9,843 | | | | 10,165 | | | | 10,281 | |
| Other real estate held for sale | | | 5,758 | | | | 5,804 | | | | 5,821 | |
| Other assets | | | 15,618 | | | | 23,905 | | | | 9,151 | |
| | | | | | | | | | |
| | | | | | | | | | | | | |
TOTAL ASSETS | | $ | 499,006 | | | $ | 515,377 | | | $ | 513,180 | |
| | | | | | | | | | |
| | | | | | | | | | | | | |
LIABILITIES AND SHAREHOLDERS’ EQUITY | | | | | | | | | | | | |
| LIABILITIES: | | | | | | | | | | | | |
| Deposits: | | | | | | | | | | | | |
| Noninterest bearing deposits | | $ | 44,402 | | | $ | 35,878 | | | $ | 33,254 | |
| NOW, money market, checking | | | 127,828 | | | | 95,790 | | | | 88,843 | |
| Savings | | | 20,265 | | | | 18,207 | | | | 18,807 | |
| CDs<$100,000 | | | 94,560 | | | | 59,953 | | | | 59,637 | |
| CDs>$100,000 | | | 22,809 | | | | 36,385 | | | | 25,409 | |
| Brokered | | | 94,660 | | | | 175,176 | | | | 192,631 | |
| | | | | | | | | | |
| Total deposits | | | 404,524 | | | | 421,389 | | | | 418,581 | |
| | | | | | | | | | | | | |
| Borrowings: | | | | | | | | | | | | |
| Federal Home Loan Bank | | | 35,000 | | | | 35,000 | | | | 35,000 | |
| Other | | | 1,069 | | | | 1,140 | | | | 1,140 | |
| | | | | | | | | | |
| Total borrowings | | | 36,069 | | | | 36,140 | | | | 36,140 | |
| Other liabilities | | | 2,426 | | | | 2,549 | | | | 2,693 | |
| | | | | | | | | | |
| Total liabilities | | | 443,019 | | | | 460,078 | | | | 457,414 | |
| | | | | | | | | | | | | |
| TOTAL SHAREHOLDERS’ EQUITY | | | 55,987 | | | | 55,299 | | | | 55,766 | |
| | | | | | | | | | |
| | | | | | | | | | | | | |
TOTAL LIABILITIES AND SHAREHOLDERS’ EQUITY | | $ | 499,006 | | | $ | 515,377 | | | $ | 513,180 | |
| | | | | | | | | | |
8
MACKINAC FINANCIAL CORPORATION AND SUBSIDIARIES
CONSOLIDATED STATEMENTS OF OPERATIONS
| | | | | | | | | | | | | | | | | |
| | | Three Months Ended | | | Nine Months Ended | |
| | | September 30, | | | September 30, | |
| (Dollars in thousands except per share data) | | 2010 | | | 2009 | | | 2010 | | | 2009 | |
| | | (Unaudited) | | | (Unaudited) | |
INTEREST INCOME: | | | | | | | | | | | | | | | | |
| Interest and fees on loans: | | | | | | | | | | | | | | | | |
| Taxable | | $ | 5,300 | | | $ | 5,106 | | | $ | 15,718 | | | $ | 15,212 | |
| Tax-exempt | | | 46 | | | | 63 | | | | 145 | | | | 237 | |
| Interest on securities: | | | | | | | | | | | | | | | | |
| Taxable | | | 324 | | | | 888 | | | | 1,077 | | | | 2,020 | |
| Tax-exempt | | | 7 | | | | 7 | | | | 21 | | | | 11 | |
| Other interest income | | | 23 | | | | 28 | | | | 100 | | | | 44 | |
| | | | | | | | | | | | | |
| Total interest income | | | 5,700 | | | | 6,092 | | | | 17,061 | | | | 17,524 | |
| | | | | | | | | | | | | |
| | | | | | | | | | | | | | | | | |
INTEREST EXPENSE: | | | | | | | | | | | | | | | | |
| Deposits | | | 1,414 | | | | 1,550 | | | | 4,309 | | | | 4,894 | |
| Borrowings | | | 222 | | | | 232 | | | | 643 | | | | 774 | |
| | | | | | | | | | | | | |
| Total interest expense | | | 1,636 | | | | 1,782 | | | | 4,952 | | | | 5,668 | |
| | | | | | | | | | | | | |
| | | | | | | | | | | | | | | | | |
| Net interest income | | | 4,064 | | | | 4,310 | | | | 12,109 | | | | 11,856 | |
| Provision for loan losses | | | 1,000 | | | | 700 | | | | 4,700 | | | | 1,400 | |
| | | | | | | | | | | | | |
| Net interest income after provision for loan losses | | | 3,064 | | | | 3,610 | | | | 7,409 | | | | 10,456 | |
| | | | | | | | | | | | | |
| | | | | | | | | | | | | | | | | |
OTHER INCOME: | | | | | | | | | | | | | | | | |
| Service fees | | | 264 | | | | 235 | | | | 737 | | | | 750 | |
| Net security gains | | | (1 | ) | | | 644 | | | | 215 | | | | 644 | |
| Net gains on sale of secondary market loans | | | 322 | | | | 247 | | | | 897 | | | | 389 | |
| Other | | | 63 | | | | 1,292 | | | | 199 | | | | 1,465 | |
| | | | | | | | | | | | | |
| Total other income | | | 648 | | | | 2,418 | | | | 2,048 | | | | 3,248 | |
| | | | | | | | | | | | | |
| | | | | | | | | | | | | | | | | |
OTHER EXPENSES: | | | | | | | | | | | | | | | | |
| Salaries and employee benefits | | | 1,779 | | | | 1,603 | | | | 5,281 | | | | 4,761 | |
| Occupancy | | | 358 | | | | 336 | | | | 1,048 | | | | 1,069 | |
| Furniture and equipment | | | 202 | | | | 193 | | | | 593 | | | | 604 | |
| Data processing | | | 193 | | | | 221 | | | | 587 | | | | 665 | |
| Professional service fees | | | 168 | | | | 161 | | | | 502 | | | | 458 | |
| Loan and deposit | | | 441 | | | | 402 | | | | 3,297 | | | | 1,175 | |
| Telephone | | | 53 | | | | 50 | | | | 145 | | | | 139 | |
| Advertising | | | 77 | | | | 80 | | | | 220 | | | | 238 | |
| Other | | | 330 | | | | 397 | | | | 887 | | | | 1,043 | |
| | | | | | | | | | | | | |
| Total other expenses | | | 3,601 | | | | 3,443 | | | | 12,560 | | | | 10,152 | |
| | | | | | | | | | | | | |
| | | | | | | | | | | | | | | | | |
| Income (Loss) before provision for income taxes | | | 111 | | | | 2,585 | | | | (3,103 | ) | | | 3,552 | |
| Provision for (benefit of) income taxes | | | 30 | | | | 864 | | | | (4,593 | ) | | | 1,142 | |
| | | | | | | | | | | | | |
| | | | | | | | | | | | | | | | | |
NET INCOME (LOSS) | | | 81 | | | | 1,721 | | | | 1,490 | | | | 2,410 | |
| | | | | | | | | | | | | |
| | | | | | | | | | | | | | | | | |
Preferred dividend expense | | | 185 | | | | 185 | | | | 556 | | | | 323 | |
| | | | | | | | | | | | | | | | | |
| | | | | | | | | | | | | |
NET INCOME (LOSS) AVAILABLE TO COMMON SHAREHOLDERS | | $ | (104 | ) | | $ | 1,536 | | | $ | 934 | | | $ | 2,087 | |
| | | | | | | | | | | | | |
| | | | | | | | | | | | | | | | | |
INCOME (LOSS) PER COMMON SHARE: | | | | | | | | | | | | | | | | |
| Basic | | $ | (0.03 | ) | | $ | .45 | | | $ | .27 | | | $ | .61 | |
| | | | | | | | | | | | | |
| Diluted | | $ | (0.03 | ) | | $ | .45 | | | $ | .27 | | | $ | .61 | |
| | | | | | | | | | | | | |
9
MACKINAC FINANCIAL CORPORATION AND SUBSIDIARIES
LOAN PORTFOLIO AND CREDIT QUALITY
(Dollars in thousands)
Loan Portfolio Balances (at end of period):
| | | | | | | | | | | | | |
| | | September 30, | | | December 31, | | | September 30, | |
| | | 2010 | | | 2009 | | | 2009 | |
Commercial Loans | | | | | | | | | | | | |
| Real estate — operators of nonresidential buildings | | $ | 52,192 | | | $ | 48,689 | | | $ | 47,007 | |
| Hospitality and tourism | | | 39,998 | | | | 45,315 | | | | 45,867 | |
| Commercial construction | | | 25,718 | | | | 24,591 | | | | 24,076 | |
| Real estate agents and managers | | | 19,675 | | | | 24,242 | | | | 23,996 | |
| Other | | | 157,679 | | | | 162,833 | | | | 165,644 | |
| | | | | | | | | | |
| Total Commercial Loans | | | 295,262 | | | | 305,670 | | | | 306,590 | |
| | | | | | | | | | | | | |
| 1-4 family residential real estate and construction | | | 82,312 | | | | 74,350 | | | | 73,116 | |
| Consumer | | | 5,153 | | | | 4,290 | | | | 4,394 | |
| | | | | | | | | | |
| | | | | | | | | | | | | |
| Total Loans | | $ | 382,727 | | | $ | 384,310 | | | $ | 384,100 | |
| | | | | | | | | | |
Credit Quality (at end of period):
| | | | | | | | | | | | | |
| | | September 30, | | | December 31, | | | September 30, | |
| | | 2010 | | | 2009 | | | 2009 | |
Nonperforming Assets : | | | | | | | | | | | | |
| Nonaccrual loans | | $ | 4,447 | | | $ | 14,368 | | | $ | 10,655 | |
| Loans past due 90 days or more | | | — | | | | — | | | | — | |
| Restructured loans | | | 6,800 | | | | 869 | | | | 873 | |
| | | | | | | | | | |
| Total nonperforming loans | | | 11,247 | | | | 15,237 | | | | 11,528 | |
| Other real estate owned | | | 5,758 | | | | 5,804 | | | | 5,821 | |
| | | | | | | | | | |
| Total nonperforming assets | | $ | 17,005 | | | $ | 21,041 | | | $ | 17,349 | |
| | | | | | | | | | |
| Nonperforming loans as a % of loans | | | 2.94 | % | | | 3.96 | % | | | 3.00 | % |
| | | | | | | | | | |
| Nonperforming assets as a % of assets | | | 3.41 | % | | | 4.08 | % | | | 3.38 | % |
| | | | | | | | | | |
Reserve for Loan Losses: | | | | | | | | | | | | |
| At period end | | $ | 5,437 | | | $ | 5,225 | | | $ | 4,081 | |
| | | | | | | | | | |
| As a % of average loans | | | 1.42 | % | | | 1.39 | % | | | 1.10 | % |
| | | | | | | | | | |
| As a % of nonperforming loans | | | 48.34 | % | | | 34.29 | % | | | 35.40 | % |
| | | | | | | | | | |
| As a % of nonaccrual loans | | | 122.26 | % | | | 36.37 | % | | | 38.30 | % |
| | | | | | | | | | |
| | | | | | | | | | | | | |
Charge-off Information (year to date): | | | | | | | | | | | | |
| Average loans | | $ | 384,028 | | | $ | 374,796 | | | $ | 370,952 | |
| | | | | | | | | | |
| Net charge-offs | | $ | 4,488 | | | $ | 2,752 | | | $ | 1,596 | |
| | | | | | | | | | |
| Charge-offs as a % of average loans | | | 1.17 | % | | | .73 | % | | | .43 | % |
| | | | | | | | | | |
10
MACKINAC FINANCIAL CORPORATION AND SUBSIDIARIES
QUARTERLY FINANCIAL HIGHLIGHTS
| | | | | | | | | | | | | | | | | | | | | |
| | | QUARTER ENDED | |
| | | (Unaudited) | |
| | | September 30, | | | June 30, | | | March 31, | | | December 31, | | | September 30, | |
| | | 2010 | | | 2010 | | | 2010 | | | 2009 | | | 2009 | |
BALANCE SHEET(Dollars in thousands) | | | | | | | | | | | | | | | | | | | | |
| | | | | | | | | | | | | | | | | | | | | |
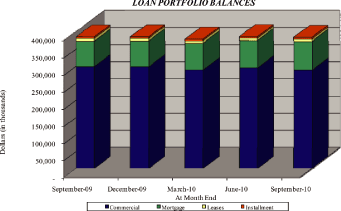
| Total loans | | $ | 382,727 | | | $ | 384,839 | | | $ | 377,311 | | | $ | 384,310 | | | $ | 384,100 | |
| Allowance for loan losses | | | (5,437 | ) | | | (6,371 | ) | | | (4,737 | ) | | | (5,225 | ) | | | (4,081 | ) |
| | | | | | | | | | | | | | | | |
| Total loans, net | | | 377,290 | | | | 378,468 | | | | 372,574 | | | | 379,085 | | | | 380,019 | |
| Intangible assets | | | — | | | | — | | | | — | | | | — | | | | — | |
| Total assets | | | 499,006 | | | | 500,774 | | | | 502,427 | | | | 515,377 | | | | 513,180 | |
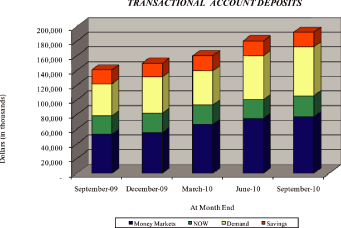
| Core deposits | | | 287,055 | | | | 271,026 | | | | 236,227 | | | | 209,828 | | | | 200,541 | |
Noncore deposits(1) | | | 117,469 | | | | 134,758 | | | | 168,985 | | | | 211,561 | | | | 218,040 | |
| | | | | | | | | | | | | | | | |
| Total deposits | | | 404,524 | | | | 405,784 | | | | 405,212 | | | | 421,389 | | | | 418,581 | |
| Total borrowings | | | 36,069 | | | | 36,140 | | | | 36,140 | | | | 36,140 | | | | 36,140 | |
| Total shareholders’ equity | | | 55,987 | | | | 56,231 | | | | 58,722 | | | | 55,299 | | | | 55,766 | |
| Total shares outstanding | | | 3,419,736 | | | | 3,419,736 | | | | 3,419,736 | | | | 3,419,736 | | | | 3,419,736 | |
| | | | | | | | | | | | | | | | | | | | | |
AVERAGE BALANCES(Dollars in thousands) | | | | | | | | | | | | | | | | | | | | |
| | | | | | | | | | | | | | | | | | | | | |
| Assets | | $ | 512,335 | | | $ | 502,942 | | | $ | 508,495 | | | $ | 514,102 | | | $ | 513,687 | |
| Loans | | | 385,268 | | | | 382,169 | | | | 384,640 | | | | 386,203 | | | | 370,310 | |
| Deposits | | | 416,847 | | | | 405,449 | | | | 413,897 | | | | 418,280 | | | | 419,102 | |
| Equity | | | 56,668 | | | | 57,889 | | | | 55,109 | | | | 55,665 | | | | 54,594 | |
| | | | | | | | | | | | | | | | | | | | | |
INCOME STATEMENT(Dollars in thousands) | | | | | | | | | | | | | | | | | | | | |
| | | | | | | | | | | | | | | | | | | | | |
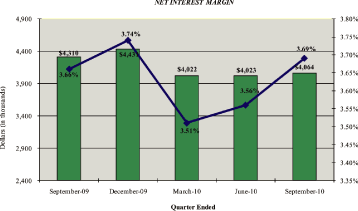
| Net interest income | | $ | 4,064 | | | $ | 4,023 | | | $ | 4,022 | | | $ | 4,431 | | | $ | 4,310 | |
| Provision for loan losses | | | 1,000 | | | | 2,800 | | | | 900 | | | | 2,300 | | | | 700 | |
| | | | | | | | | | | | | | | | |
| Net interest income after provision | | | 3,064 | | | | 1,223 | | | | 3,122 | | | | 2,131 | | | | 3,610 | |
| Total noninterest income | | | 648 | | | | 593 | | | | 807 | | | | 1,503 | | | | 2,418 | |
| Total noninterest expense | | | 3,601 | | | | 5,330 | | | | 3,629 | | | | 3,650 | | | | 3,443 | |
| | | | | | | | | | | | | | | | |
| Income (Loss) before taxes | | | 111 | | | | (3,514 | ) | | | 300 | | | | (16 | ) | | | 2,585 | |
| Provision for (benefit of) income taxes | | | 30 | | | | (1,212 | ) | | | (3,411 | ) | | | (22 | ) | | | 864 | |
| Preferred dividend expense | | | 185 | | | | 186 | | | | 185 | | | | 186 | | | | 185 | |
| | | | | | | | | | | | | | | | |
| Net income (loss) available to common shareholders | | $ | (104 | ) | | $ | (2,488 | ) | | $ | 3,526 | | | $ | (180 | ) | | $ | 1,536 | |
| | | | | | | | | | | | | | | | |
| | | | | | | | | | | | | | | | | | | | | |
PER SHARE DATA | | | | | | | | | | | | | | | | | | | | |
| | | | | | | | | | | | | | | | | | | | | |
| Earnings (Losses) — basic | | $ | (.03 | ) | | $ | (.73 | ) | | $ | 1.03 | | | $ | (.05 | ) | | $ | .45 | |
| Earnings (Losses)— diluted | | | (.03 | ) | | | (.73 | ) | | | 1.03 | | | | (.05 | ) | | | .45 | |
| Book value per common share | | | 13.26 | | | | 13.34 | | | | 14.08 | | | | 13.10 | | | | 13.25 | |
| Market value, closing price | | | 5.10 | | | | 6.50 | | | | 4.72 | | | | 4.64 | | | | 4.10 | |
| | | | | | | | | | | | | | | | | | | | | |
ASSET QUALITY RATIOS | | | | | | | | | | | | | | | | | | | | |
| | | | | | | | | | | | | | | | | | | | | |
| Nonperforming loans/total loans | | | 2.94 | % | | | 2.87 | % | | | 2.62 | % | | | 3.96 | % | | | 3.00 | % |
| Nonperforming assets/total assets | | | 3.41 | | | | 3.34 | | | | 3.51 | | | | 4.08 | | | | 3.38 | |
| Allowance for loan losses/total loans | | | 1.42 | | | | 1.66 | | | | 1.26 | | | | 1.36 | | | | 1.06 | |
| Allowance for loan losses/nonperforming loans | | | 48.34 | | | | 57.69 | | | | 47.87 | | | | 34.29 | | | | 35.40 | |
Texas Ratio(2) | | | 27.68 | | | | 26.71 | | | | 27.76 | | | | 34.77 | | | | 28.99 | |
| | | | | | | | | | | | | | | | | | | | | |
PROFITABILITY RATIOS | | | | | | | | | | | | | | | | | | | | |
| | | | | | | | | | | | | | | | | | | | | |
| Return on average assets | | | (.08) | % | | | (1.98 | )% | | | 2.81 | % | | | (.14 | )% | | | 1.19 | % |
| Return on average equity | | | (0.73 | ) | | | (17.24 | ) | | | 25.95 | | | | (1.28 | ) | | | 11.16 | |
| Net interest margin | | | 3.69 | | | | 3.56 | | | | 3.51 | | | | 3.74 | | | | 3.66 | |
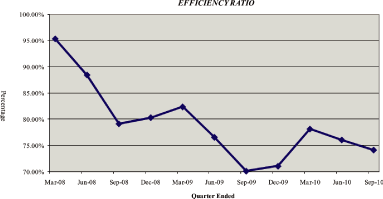
| Efficiency ratio | | | 75.98 | | | | 76.04 | | | | 78.12 | | | | 71.03 | | | | 70.09 | |
| Average loans/average deposits | | | 92.42 | | | | 94.26 | | | | 92.93 | | | | 92.33 | | | | 88.36 | |
| | | | | | | | | | | | | | | | | | | | | |
CAPITAL ADEQUACY RATIOS | | | | | | | | | | | | | | | | | | | | |
| | | | | | | | | | | | | | | | | | | | | |
| Tier 1 leverage ratio | | | 9.22 | % | | | 9.38 | % | | | 9.85 | % | | | 9.75 | % | | | 9.74 | % |
| Tier 1 capital to risk weighted assets | | | 11.73 | | | | 11.65 | | | | 12.48 | | | | 11.92 | | | | 12.18 | |
| Total capital to risk weighted assets | | | 12.98 | | | | 12.91 | | | | 13.69 | | | | 13.17 | | | | 13.19 | |
| Average equity/average assets | | | 11.06 | | | | 11.51 | | | | 10.84 | | | | 10.83 | | | | 10.63 | |
| Tangible equity/tangible assets | | | 11.06 | | | | 11.51 | | | | 10.84 | | | | 10.83 | | | | 10.87 | |
| | |
| (1) | | Noncore deposits includes Internet CDs, brokered deposits and CDs greater than $100,000 |
| |
| (2) | | Texas Ratio: Nonperforming Assets divided by Total Equity plus Allowance for Loan Losees |
8
MACKINAC FINANCIAL CORPORATION AND SUBSIDIARIES
QUARTERLY FINANCIAL HIGHLIGHTS
9