EXHIBIT 99
PRESS RELEASE
| | | |
| For Release: | | October 25, 2007 |
| Nasdaq: | | MFNC |
| Contact: | | Investor Relations at (888) 343-8147 |
| Website: | | www.bankmbank.com |
MACKINAC FINANCIAL CORPORATION
REPORTS THIRD QUARTER AND NINE MONTHS 2007 RESULTS
(Manistique, Michigan) — Mackinac Financial Corporation (Nasdaq: MFNC), the bank holding company for mBank (the “Bank”) today announced third quarter 2007 income of $8.055 million or $2.35 per share compared to net income of $.690 million, or $.20 per share for the third quarter of 2006. Net income for the first nine months of 2007 totaled $9.636 million, or $2.81 per share, compared to $1.378 million, or $.40 per share, for the same period in 2006. The results of operations for the first nine months of 2007 include the recognition of a deferred tax benefit in the amount of $7.500 million, $470,000, of proceeds from the settlement of a lawsuit against the Corporation’s former accountants, and a provision for loan losses of $400,000. The third quarter provision was impacted by one commercial credit which originated prior to the current management team. The loan, which currently is performing as agreed, is secured solely by a hotel property. The borrower has indicated their intent to default the loan unless a request for restructuring is granted. An appraisal was obtained as part of negotiations with the borrower which indicated some deterioration in the value of the underlying asset. These facts, coupled with our continued growth in outstanding loans, led management to conclude that a provision is necessary. During the comparable nine month period in 2006, the Bank recorded a $600,000 negative provision for loan losses in recognition of improved credit quality, as well as a $500,000 provision for the benefit of income taxes. Excluding these items provides a more revealing picture of operating results. The adjusted figures show net income in the first nine months of 2007 of $2.066 million, or $.60 per share, compared to an adjusted net income of $.278 million, or $.08 per share, for the same period in 2006. The adjusted 2007 third quarter figures show net income of $.955 million, or $.28 per share, compared to $.190 million, or $.06 per share, in the third quarter of 2006.
Paul Tobias, Chairman and Chief Executive Officer, commented, “We are extremely pleased that we have attained the earnings momentum necessary for us to recognize the deferred tax benefit related to NOL and tax credit carry-forwards. We have established, with our current asset base, the foundation for continued profitability as evidenced by our sixth consecutive quarter of core earnings.”
Tobias continued, “Our core earnings have been enhanced with increases in our net interest margin due to our strong pricing discipline. Growth within our organization is secondary to our increased profitability objectives. We continue to monitor the progress of Michigan’s economy and ongoing foreclosure trends related to consumer mortgage lending. As a bank focused on commercial lending, we are also monitoring, as part of our normal underwriting discipline, the valuation of our commercial real estate collateral and its importance in our loan grading system. While we are aware of the increased credit issues within our industry and within Michigan, we have not experienced any significant deterioration in our overall credit quality and our nonperforming assets are well below peer levels. We were not participants in the subprime mortgage industry.”
Total assets of the Corporation at September 30, 2007 were $401.213 million, up 10.47 percent from the $363.191 million in total assets reported at September 30, 2006. Third quarter-end total assets were up 4.81 percent from the $382.791 million of total assets at year-end 2006.
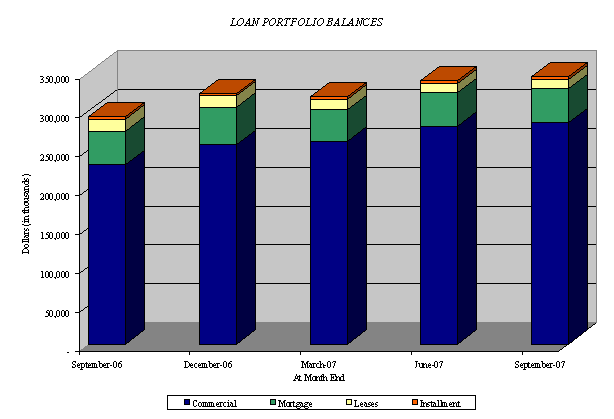
Total loans at September 30, 2007 were $344.149 million, a 17.61% increase from the $292.614 million at September 30, 2006. Total loans at the end of the third quarter of 2007 increased $21.658 million, or 6.69 percent from year-end 2006 total loans of $322.581 million. Tobias stated, “We are satisfied with our net loan growth thus far in 2007 and remain optimistic about future growth opportunities given our continued new loan production and pipeline activity. We experienced significant loan paydowns and refinancings earlier in 2007 due in part to our decision to hold the line on pricing and our unwillingness to compromise credit quality in the midst of an economic slowdown. We continue to have new loan opportunities, but feel it is prudent to exercise growth constraints in times of economic uncertainty. We expect to continue to grow loans over our long term planning horizon, but we have placed the emphasis on deposit growth and margin improvement in the current credit environment.”
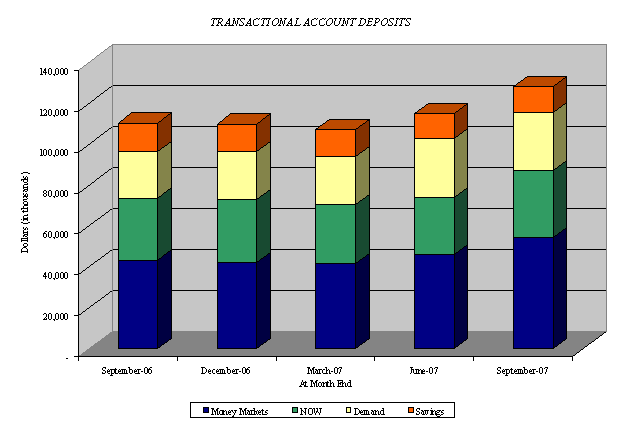
Total deposits of $321.371 million at September 30, 2007 were up 9.50 percent from deposits of $293.494 million on September 30, 2006. Deposits were up $8.950 million, 2.87 percent from year-end 2006 deposits of $312.421 million. Total 2007 deposit growth reflects decreases in noncore funding of $10.079 million and increases in core deposits of $19.029 million, or 9.53%. Mr. Tobias added, “The growth of core deposit balances continues to be a primary focal point in order to increase margin contribution. In 2007, we have been successful in the growth of core deposits to fund 100% of current year loan growth. Continued growth of core deposits, especially transactional account balances, will have the biggest impact on increased profitability and franchise value. We continue to build a culture that focuses on profitable relationships anchored by core deposits.”
Nonperforming loans at the end of the third quarter of 2007 totaled $3.172 million (.92% of loans), an increase of $.233 million from 2006 year end balances. This 2007 increase in nonperforming assets is not indicative of significant deterioration in portfolio credit quality and is still relatively low by comparative peer standards. Current nonperforming loan balances include one large commercial credit relationship which represents 56% of the total, approximately $1.8 million. The loans associated with this relationship originated before the current management team was in place. We have allocated specific reserve balances to these loans, which we believe covers our potential principal loss. Tobias, commenting on credit quality stated, “We remain confident that our credit process is a major strength. This process includes an aggressive early resolution process for nonperforming assets, which limits our losses.”
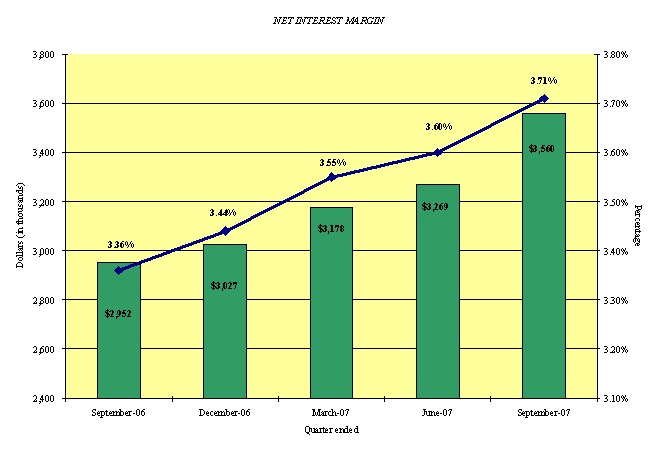
The net interest margin continues to show steady improvement, increasing from 3.36% in the third quarter of 2006 to 3.71% in the third quarter of 2007. Mr. Tobias commented, “The steady margin improvement is a clear illustration of the positive results achieved from loan and deposit pricing decisions and an improved deposit mix.”
Shareholders’ equity at September 30, 2007 totaled $38.697 million, or $11.29 per share, compared to $28.226 million, or $8.23 per share on September 30, 2006.
Tobias concluded, “We are pleased with our nine months earnings results. Our emphasis continues to be on core deposit growth. We recently expanded our deposit gathering efforts with courier services to small and medium sized businesses in addition to selective second quarter staffing additions. We continue to review opportunities to improve noninterest income. We have been moderately successful in generating fees from sales of loans to the secondary market, as well as the guaranteed portion of SBA loans. The contribution from increased noninterest income, expense control, and our diligence in pricing will move us toward our profitability objectives. We remain committed to our goal of increased profitability and shareholder value.”
Mackinac Financial Corporation is a registered bank holding company which owns mBank. The Bank has 12 offices; eight in the Upper Peninsula, three in the Northern Lower Peninsula and one in Oakland County, Michigan. The Company’s banking services include commercial lending and treasury management products and services geared toward small to mid-sized businesses; as well as checking and savings accounts, time deposits, interest bearing transaction accounts, safe deposit facilities, real estate mortgage lending, and direct and indirect consumer financing.
Forward-Looking Statements
This release contains certain forward-looking statements. Words such as “anticipates,” “believes,” “estimates,” “expects,” “intends,” “should,” “will,” and variations of such words and similar expressions are intended to identify forward-looking statements: as defined by the Private Securities Litigation Reform Act of 1995. These statements reflect management’s current beliefs as to expected outcomes of future events and are not guarantees of future performance. These statements involve certain risks, uncertainties and assumptions that are difficult to predict with regard to timing, extent, likelihood and degree of occurrence. Therefore, actual results and outcomes may materially differ from what may be expressed or forecasted in such forward-looking statements. Factors that could cause a difference include among others: changes in the national and local economies or market conditions; changes in interest rates and banking regulations; the impact of competition from traditional or new sources; and the possibility that anticipated cost savings and revenue enhancements from mergers and acquisitions, bank consolidations, branch closings and other sources may not be fully realized at all or within specified time frames as well as other risks and uncertainties including but not limited to those detailed from time to time in filings of the Company with the Securities and Exchange Commission. These and other factors may cause decisions and actual results to differ materially from current expectations. Mackinac Financial Corporation undertakes no obligation to revise, update, or clarify forward-looking statements to reflect events or conditions after the date of this release.
MACKINAC FINANCIAL CORPORATION AND SUBSIDIARIES
SELECTED FINANCIAL HIGHLIGHTS
| | | | | | | | | | | | | |
| (Dollars in thousands, except per share data) | | For The Period Ended | |
| | | September 30, | | | December 31, | | | September 30, | |
| | | 2007 | | | 2006 | | | 2006 | |
| | | (Unaudited) | | | | | | | (Unaudited) | |
Selected Financial Condition Data (at end of period): | | | | | | | | | | | | |
| Total assets | | $ | 401,213 | | | $ | 382,791 | | | $ | 363,191 | |
| Total loans | | | 344,149 | | | | 322,581 | | | | 292,614 | |
| Total deposits | | | 321,371 | | | | 312,421 | | | | 293,494 | |
| Borrowings and subordinated debentures | | | 38,239 | | | | 38,307 | | | | 38,307 | |
| Total shareholders’ equity | | | 38,697 | | | | 28,790 | | | | 28,226 | |
| | | | | | | | | | | | | |
Selected Statements of Income Data(nine months and year ended): | | | | | | | | | | | | |
| Net interest income | | $ | 10,007 | | | $ | 11,593 | | | $ | 8,566 | |
| Income before taxes | | | 2,136 | | | | 1,216 | | | | 878 | |
| Net income | | | 9,636 | | | | 1,716 | | | | 1,378 | |
| Income per common share — Basic | | | 2.81 | | | | .50 | | | | .40 | |
| Income per common share — Diluted | | | 2.81 | | | | .50 | | | | .40 | |
| | | | | | | | | | | | | |
Three Months Ended: | | | | | | | | | | | | |
| Net interest income | | $ | 3,560 | | | $ | 3,027 | | | $ | 2,952 | |
| Income before taxes | | | 555 | | | | 338 | | | | 190 | |
| Net income | | | 8,055 | | | | 338 | | | | 690 | |
| Income per common share — Basic | | | 2.35 | | | | .10 | | | | .20 | |
| Income per common share — Diluted | | | 2.35 | | | | .10 | | | | .20 | |
| | | | | | | | | | | | | |
Selected Financial Ratios and Other Data(nine months and year ended): | | | | | | | | | | | | |
Performance Ratios: | | | | | | | | | | | | |
| Net interest margin | | | 3.62 | % | | | 3.51 | % | | | 3.53 | % |
| Efficiency ratio | | | 79.94 | | | | 93.95 | | | | 93.83 | |
| Return on average assets | | | 3.32 | | | | .49 | | | | .54 | |
| Return on average equity | | | 42.07 | | | | 6.19 | | | | 6.71 | |
| Average total assets | | $ | 387,597 | | | $ | 347,927 | | | $ | 341,646 | |
| Average total shareholders’ equity | | $ | 30,627 | | | $ | 27,744 | | | $ | 27,440 | |
| Average loans to average deposits ratio | | | 103.89 | % | | | 99.77 | % | | | 98.86 | % |
| | | | | | | | | | | | | |
Common Share Data (at end of period): | | | | | | | | | | | | |
| Market price per common share | | $ | 8.75 | | | $ | 11.50 | | | $ | 10.56 | |
| Book value per common share | | $ | 11.29 | | | $ | 8.40 | | | $ | 8.23 | |
| Common shares outstanding | | | 3,428,695 | | | | 3,428,695 | | | | 3,428,695 | |
| Weighted average shares outstanding | | | 3,428,695 | | | | 3,428,695 | | | | 3,428,695 | |
| | | | | | | | | | | | | |
Other Data (at end of period): | | | | | | | | | | | | |
| Allowance for loan losses | | $ | 5,022 | | | $ | 5,006 | | | $ | 5,316 | |
| Non-performing assets | | $ | 3,623 | | | $ | 2,965 | | | $ | 2,091 | |
| Allowance for loan losses to total loans | | | 1.46 | % | | | 1.55 | % | | | 1.82 | % |
| Non-performing assets to total assets | | | .90 | % | | | .77 | % | | | .58 | % |
| Number of: | | | | | | | | | | | | |
| Branch locations | | | 13 | | | | 13 | | | | 13 | |
| FTE Employees | | | 105 | | | | 99 | | | | 97 | |
MACKINAC FINANCIAL CORPORATION AND SUBSIDIARIES
CONSOLIDATED BALANCE SHEETS
| | | | | | | | | | | | | |
| | | September 30, | | | December 31, | | | September 30, | |
| | | 2007 | | | 2006 | | | 2006 | |
| | | (unaudited) | | | | | | | (unaudited) | |
ASSETS | | | | | | | | | | | | |
| | | | | | | | | | | | | |
| Cash and due from banks | | $ | 7,364 | | | $ | 4,865 | | | $ | 5,537 | |
| Federal funds sold | | | 947 | | | | 5,841 | | | | 11,949 | |
| | | | | | | | | | |
| Cash and cash equivalents | | | 8,311 | | | | 10,706 | | | | 17,486 | |
| | | | | | | | | | | | | |
| Interest-bearing deposits in other financial institutions | | | 6,995 | | | | 856 | | | | 889 | |
| Securities available for sale | | | 17,973 | | | | 32,769 | | | | 36,129 | |
| Federal Home Loan Bank stock | | | 3,794 | | | | 3,794 | | | | 4,152 | |
| | | | | | | | | | | | | |
| Loans: | | | | | | | | | | | | |
| Commercial | | | 285,680 | | | | 261,726 | | | | 238,481 | |
| Mortgage | | | 54,962 | | | | 58,014 | | | | 51,341 | |
| Installment | | | 3,507 | | | | 2,841 | | | | 2,792 | |
| | | | | | | | | | |
| Total Loans | | | 344,149 | | | | 322,581 | | | | 292,614 | |
| Allowance for loan losses | | | (5,022 | ) | | | (5,006 | ) | | | (5,316 | ) |
| | | | | | | | | | |
| Net loans | | | 339,127 | | | | 317,575 | | | | 287,298 | |
| | | | | | | | | | | | | |
| Premises and equipment | | | 12,733 | | | | 12,453 | | | | 12,643 | |
| Other real estate held for sale | | | 451 | | | | 26 | | | | 26 | |
| Other assets | | | 11,829 | | | | 4,612 | | | | 4,568 | |
| | | | | | | | | | |
| | | | | | | | | | | | | |
| TOTAL ASSETS | | $ | 401,213 | | | $ | 382,791 | | | $ | 363,191 | |
| | | | | | | | | | |
| | | | | | | | | | | | | |
LIABILITIES AND SHAREHOLDERS’ EQUITY | | | | | | | | | | | | |
| Liabilities: | | | | | | | | | | | | |
| Non-interest-bearing deposits | | $ | 28,325 | | | $ | 23,471 | | | $ | 22,826 | |
| Interest-bearing deposits: | | | | | | | | | | | | |
| NOW and Money Market | | | 87,262 | | | | 73,188 | | | | 73,797 | |
| Savings | | | 12,831 | | | | 13,365 | | | | 13,915 | |
| CDs<$100,000 | | | 90,220 | | | | 89,585 | | | | 85,236 | |
| CDs>$100,000 | | | 24,432 | | | | 23,645 | | | | 20,305 | |
| Brokered | | | 78,301 | | | | 89,167 | | | | 77,415 | |
| | | | | | | | | | |
| Total deposits | | | 321,371 | | | | 312,421 | | | | 293,494 | |
| | | | | | | | | | | | | |
| Borrowings | | | 38,239 | | | | 38,307 | | | | 38,307 | |
| Other liabilities | | | 2,906 | | | | 3,273 | | | | 3,164 | |
| | | | | | | | | | |
| Total liabilities | | | 362,516 | | | | 354,001 | | | | 334,965 | |
| | | | | | | | | | | | | |
| Shareholders’ equity: | | | | | | | | | | | | |
| Preferred stock — No par value: | | | | | | | | | | | | |
| Authorized 500,000 shares, no shares outstanding | | | | | | | | | | | | |
| Common stock and additional paid in capital — No par value | | | | | | | | | | | | |
| Authorized — 18,000,000 shares | | | | | | | | | | | | |
| Issued and outstanding — 3,428,695 shares | | | 42,810 | | | | 42,722 | | | | 42,646 | |
| Accumulated deficit | | | (4,107 | ) | | | (13,745 | ) | | | (14,083 | ) |
| Accumulated other comprehensive (loss) | | | (6 | ) | | | (187 | ) | | | (337 | ) |
| | | | | | | | | | |
| | | | | | | | | | | | | |
| Total shareholders’ equity | | | 38,697 | | | | 28,790 | | | | 28,226 | |
| | | | | | | | | | |
| | | | | | | | | | | | | |
| TOTAL LIABILITIES AND SHAREHOLDERS’ EQUITY | | $ | 401,213 | | | $ | 382,791 | | | $ | 363,191 | |
| | | | | | | | | | |
MACKINAC FINANCIAL CORPORATION AND SUBSIDIARIES
CONSOLIDATED STATEMENTS OF OPERATIONS
| | | | | | | | | | | | | | | | | |
| | | Three Months Ended | | | Nine Months Ended | |
| | | September 30, | | | September 30, | |
| | | 2007 | | | 2006 | | | 2007 | | | 2006 | |
| | | | | | | | | | | | | | | | | |
INTEREST INCOME: | | | | | | | | | | | | | | | | |
| Interest and fees on loans: | | | | | | | | | | | | | | | | |
| Taxable | | $ | 6,929 | | | $ | 5,635 | | | $ | 19,610 | | | $ | 15,316 | |
| Tax-exempt | | | 118 | | | | 189 | | | | 432 | | | | 575 | |
| Interest on securities | | | | | | | | | | | | | | | | |
| Taxable | | | 263 | | | | 306 | | | | 857 | | | | 852 | |
| Tax-exempt | | | — | | | | 5 | | | | — | | | | 87 | |
| Other interest | | | 209 | | | | 268 | | | | 575 | | | | 631 | |
| | | | | | | | | | | | | |
| Total interest income | | | 7,519 | | | | 6,403 | | | | 21,474 | | | | 17,461 | |
| | | | | | | | | | | | | |
| | | | | | | | | | | | | | | | | |
INTEREST EXPENSE: | | | | | | | | | | | | | | | | |
| Deposits | | | 3,443 | | | | 2,951 | | | | 9,932 | | | | 7,540 | |
| Borrowings | | | 516 | | | | 500 | | | | 1,535 | | | | 1,355 | |
| | | | | | | | | | | | | |
| Total interest expense | | | 3,959 | | | | 3,451 | | | | 11,467 | | | | 8,895 | |
| | | | | | | | | | | | | |
| | | | | | | | | | | | | | | | | |
| Net interest income | | | 3,560 | | | | 2,952 | | | | 10,007 | | | | 8,566 | |
| Provision for loan losses | | | 400 | | | | — | | | | 400 | | | | (600 | ) |
| | | | | | | | | | | | | |
| Net interest income after provision for loan losses | | | 3,160 | | | | 2,952 | | | | 9,607 | | | | 9,166 | |
| | | | | | | | | | | | | |
| | | | | | | | | | | | | | | | | |
OTHER INCOME: | | | | | | | | | | | | | | | | |
| Service fees | | | 169 | | | | 133 | | | | 515 | | | | 365 | |
| Net gains on sale of secondary market loans | | | 165 | | | | 66 | | | | 364 | | | | 149 | |
| Proceeds from settlement of lawsuit | | | — | | | | — | | | | 470 | | | | — | |
| Other | | | 62 | | | | 41 | | | | 302 | | | | 193 | |
| | | | | | | | | | | | | |
| Total other income | | | 396 | | | | 240 | | | | 1,651 | | | | 707 | |
| | | | | | | | | | | | | |
| | | | | | | | | | | | | | | | | |
OTHER EXPENSE: | | | | | | | | | | | | | | | | |
| Salaries and employee benefits | | | 1,695 | | | | 1,487 | | | | 5,106 | | | | 4,577 | |
| Occupancy | | | 322 | | | | 333 | | | | 983 | | | | 943 | |
| Furniture and equipment | | | 178 | | | | 159 | | | | 501 | | | | 470 | |
| Data processing | | | 196 | | | | 176 | | | | 577 | | | | 512 | |
| Professional service fees | | | 78 | | | | 341 | | | | 403 | | | | 955 | |
| Loan and deposit | | | 63 | | | | 78 | | | | 214 | | | | 305 | |
| Telephone | | | 68 | | | | 55 | | | | 185 | | | | 155 | |
| Advertising | | | 97 | | | | 70 | | | | 280 | | | | 247 | |
| Other | | | 304 | | | | 303 | | | | 873 | | | | 831 | |
| | | | | | | | | | | | | |
| Total other expense | | | 3,001 | | | | 3,002 | | | | 9,122 | | | | 8,995 | |
| | | | | | | | | | | | | |
| | | | | | | | | | | | | | | | | |
| Income before income taxes | | | 555 | | | | 190 | | | | 2,136 | | | | 878 | |
| Provision for (benefit of) income taxes | | | (7,500 | ) | | | (500 | ) | | | (7,500 | ) | | | (500 | ) |
| | | | | | | | | | | | | |
NET INCOME | | $ | 8,055 | | | $ | 690 | | | $ | 9,636 | | | $ | 1,378 | |
| | | | | | | | | | | | | |
INCOME PER COMMON SHARE: | | | | | | | | | | | | | | | | |
| Basic | | $ | 2.35 | | | $ | .20 | | | $ | 2.81 | | | $ | .40 | |
| | | | | | | | | | | | | |
| Diluted | | $ | 2.35 | | | $ | .20 | | | $ | 2.81 | | | $ | .40 | |
| | | | | | | | | | | | | |
MACKINAC FINANCIAL CORPORATION AND SUBSIDIARIES
LOAN PORTFOLIO AND CREDIT QUALITY
(Dollars in thousands)
Loan Portfolio Balances (at end of period):
| | | | | | | | | | | | | |
| | | September 30, | | | December 31, | | | September 30, | |
| | | 2007 | | | 2006 | | | 2006 | |
Commercial Loans | | | | | | | | | | | | |
| Real estate — operators of nonresidential buildings | | $ | 43,422 | | | $ | 44,308 | | | $ | 35,965 | |
| Hospitality and tourism | | | 37,479 | | | | 30,826 | | | | 37,287 | |
| Real estate agents and managers | | | 25,662 | | | | 25,071 | | | | 19,744 | |
| Offices of holding companies | | | 10,831 | | | | 4,989 | | | | 1,496 | |
| Other | | | 122,460 | | | | 120,523 | | | | 110,894 | |
| | | | | | | | | | |
| Total Commercial Loans | | | 239,854 | | | | 225,717 | | | | 205,386 | |
| | | | | | | | | | | | | |
| 1-4 family residential real estate | | | 54,962 | | | | 58,014 | | | | 51,341 | |
| Construction | | | 45,826 | | | | 36,009 | | | | 33,095 | |
| Consumer | | | 3,507 | | | | 2,841 | | | | 2,792 | |
| | | | | | | | | | |
| | | | | | | | | | | | | |
| Total Loans | | $ | 344,149 | | | $ | 322,581 | | | $ | 292,614 | |
| | | | | | | | | | |
| | | | | | | | | | | | | |
| Average loans for the period | | $ | 327,810 | | | $ | 278,953 | | | $ | 271,351 | |
| | | | | | | | | | |
Credit Quality (at end of period):
| | | | | | | | | | | | | |
| | | September 30, | | | December 31, | | | September 30, | |
| | | 2007 | | | 2006 | | | 2006 | |
Nonperforming Assets : | | | | | | | | | | | | |
| Nonaccrual loans | | $ | 3,136 | | | $ | 2,899 | | | $ | 2,065 | |
| Loans past due 90 days or more | | | 36 | | | | 40 | | | | — | |
| Restructured loans | | | — | | | | — | | | | — | |
| | | | | | | | | | |
| Total nonperforming loans | | | 3,172 | | | | 2,939 | | | | 2,065 | |
| Other real estate owned | | | 451 | | | | 26 | | | | 26 | |
| | | | | | | | | | |
| Total nonperforming assets | | $ | 3,623 | | | $ | 2,965 | | | $ | 2,091 | |
| | | | | | | | | | |
| Nonperforming loans as a % of loans | | | .92 | % | | | .91 | % | | | .71 | % |
| | | | | | | | | | |
| Nonperforming assets as a % of assets | | | .90 | % | | | .77 | % | | | .58 | % |
| | | | | | | | | | |
Reserve for Loan Losses: | | | | | | | | | | | | |
| At period end | | $ | 5,022 | | | $ | 5,006 | | | $ | 5,316 | |
| | | | | | | | | | |
| As a % of loans | | | 1.46 | % | | | 1.55 | % | | | 1.82 | % |
| | | | | | | | | | |
| As a % of nonperforming loans | | | 158.32 | % | | | 170.33 | % | | | 257.43 | % |
| | | | | | | | | | |
| As a % of nonaccrual loans | | | 160.14 | % | | | 172.68 | % | | | 257.43 | % |
| | | | | | | | | | |
| Net charge-offs as a % of average loans | | | .12 | % | | | .08 | % | | | .07 | % |
| | | | | | | | | | |
MACKINAC FINANCIAL CORPORATION AND SUBSIDIARIES
QUARTERLY FINANCIAL HIGHLIGHTS
| | | | | | | | | | | | | | | | | | | | | |
| | | QUARTER ENDED | |
| | | (Unaudited) | |
| | | September 30, | | | June 30, | | | March 31, | | | December 31, | | | September 30, | |
| | | 2007 | | | 2007 | | | 2007 | | | 2006 | | | 2006 | |
BALANCE SHEET(Dollars in thousands) | | | | | | | | | | | | | | | | | | | | |
| | | | | | | | | | | | | | | | | | | | | |
| Total loans | | $ | 344,149 | | | $ | 338,896 | | | $ | 318,421 | | | $ | 322,581 | | | $ | 292,614 | |
| Allowance for loan losses | | | (5,022 | ) | | | (4,920 | ) | | | (4,975 | ) | | | (5,006 | ) | | | (5,316 | ) |
| | | | | | | | | | | | | | | | |
| Total loans, net | | | 339,127 | | | | 333,976 | | | | 313,446 | | | | 317,575 | | | | 287,298 | |
| Intangible assets | | | 143 | | | | 163 | | | | 182 | | | | 205 | | | | 237 | |
| Total assets | | | 401,213 | | | | 393,319 | | | | 375,644 | | | | 382,791 | | | | 363,191 | |
| Core deposits | | | 218,638 | | | | 211,773 | | | | 201,529 | | | | 199,609 | | | | 195,774 | |
Noncore deposits(1) | | | 102,733 | | | | 109,473 | | | | 102,883 | | | | 112,812 | | | | 97,720 | |
| | | | | | | | | | | | | | | | |
| Total deposits | | | 321,371 | | | | 321,246 | | | | 304,412 | | | | 312,421 | | | | 293,494 | |
| Total borrowings | | | 38,239 | | | | 38,307 | | | | 38,307 | | | | 38,307 | | | | 38,307 | |
| Total shareholders’ equity | | | 38,697 | | | | 30,485 | | | | 29,932 | | | | 28,790 | | | | 28,226 | |
| Total shares outstanding | | | 3,428,695 | | | | 3,428,695 | | | | 3,428,695 | | | | 3,428,695 | | | | 3,428,695 | |
| | | | | | | | | | | | | | | | | | | | | |
AVERAGE BALANCES(Dollars in thousands) | | | | | | | | | | | | | | | | | | | | |
| | | | | | | | | | | | | | | | | | | | | |
| Assets | | $ | 400,105 | | | $ | 382,065 | | | $ | 380,403 | | | $ | 366,566 | | | $ | 362,632 | |
| Loans | | | 340,391 | | | | 324,721 | | | | 318,072 | | | | 301,508 | | | | 289,210 | |
| Deposits | | | 327,293 | | | | 309,469 | | | | 309,619 | | | | 294,755 | | | | 296,608 | |
| Equity | | | 32,184 | | | | 30,412 | | | | 29,254 | | | | 28,646 | | | | 28,041 | |
| | | | | | | | | | | | | | | | | | | | | |
INCOME STATEMENT(Dollars in thousands) | | | | | | | | | | | | | | | | | | | | |
| | | | | | | | | | | | | | | | | | | | | |
| Net interest income | | $ | 3,560 | | | $ | 3,269 | | | $ | 3,178 | | | $ | 3,027 | | | $ | 2,952 | |
| Provision for loan losses | | | 400 | | | | — | | | | — | | | | (261 | ) | | | — | |
| | | | | | | | | | | | | | | | |
| Net interest income after provision | | | 3,160 | | | | 3,269 | | | | 3,178 | | | | 3,288 | | | | 2,952 | |
| Total noninterest income | | | 396 | | | | 342 | | | | 913 | | | | 276 | | | | 240 | |
| Total noninterest expense | | | 3,001 | | | | 3,065 | | | | 3,056 | | | | 3,226 | | | | 3,002 | |
| | | | | | | | | | | | | | | | |
| Income before taxes | | | 555 | | | | 546 | | | | 1,035 | | | | 338 | | | | 190 | |
| Provision for income taxes | | | (7,500 | ) | | | — | | | | — | | | | — | | | | (500 | ) |
| | | | | | | | | | | | | | | | |
| Net income | | $ | 8,055 | | | $ | 546 | | | $ | 1,035 | | | $ | 338 | | | $ | 690 | |
| | | | | | | | | | | | | | | | |
| | | | | | | | | | | | | | | | | | | | | |
PER SHARE DATA | | | | | | | | | | | | | | | | | | | | |
| | | | | | | | | | | | | | | | | | | | | |
| Earnings — basic | | $ | 2.35 | | | $ | .16 | | | $ | .30 | | | $ | .10 | | | $ | .20 | |
| Earnings — diluted | | | 2.35 | | | | .16 | | | | .30 | | | | .10 | | | | .20 | |
| Book value | | | 11.29 | | | | 8.89 | | | | 8.73 | | | | 8.40 | | | | 8.23 | |
| Market value, closing price | | | 8.75 | | | | 9.45 | | | | 9.26 | | | | 11.50 | | | | 10.56 | |
| | | | | | | | | | | | | | | | | | | | | |
ASSET QUALITY RATIOS | | | | | | | | | | | | | | | | | | | | |
| | | | | | | | | | | | | | | | | | | | | |
| Nonperforming loans/total loans | | | .92 | % | | | 1.49 | % | | | 1.53 | % | | | .91 | % | | | .71 | % |
| Nonperforming assets/total assets | | | .90 | | | | 1.30 | | | | 1.33 | | | | .77 | | | | .58 | |
| Allowance for loan losses/total loans | | | 1.46 | | | | 1.45 | | | | 1.56 | | | | 1.55 | | | | 1.82 | |
| Allowance for loan losses/nonperforming loans | | | 158.32 | | | | 97.45 | | | | 102.32 | | | | 170.33 | | | | 257.43 | |
| | | | | | | | | | | | | | | | | | | | | |
PROFITABILITY RATIOS | | | | | | | | | | | | | | | | | | | | |
| | | | | | | | | | | | | | | | | | | | | |
| Return on average assets | | | 7.99 | % | | | .57 | % | | | 1.10 | % | | | .37 | % | | | .75 | % |
| Return on average equity | | | 99.30 | | | | 7.20 | | | | 14.35 | | | | 4.68 | | | | 9.76 | |
| Net interest margin | | | 3.71 | | | | 3.60 | | | | 3.55 | | | | 3.44 | | | | 3.36 | |
| Efficiency ratio | | | 74.71 | | | | 83.21 | | | | 82.40 | | | | 94.60 | | | | 91.17 | |
| Average loans/average deposits | | | 104.00 | | | | 104.93 | | | | 102.73 | | | | 102.29 | | | | 97.51 | |
| | | | | | | | | | | | | | | | | | | | | |
CAPITAL ADEQUACY RATIOS | | | | | | | | | | | | | | | | | | | | |
| | | | | | | | | | | | | | | | | | | | | |
| Tier 1 leverage ratio | | | 8.03 | % | | | 7.97 | % | | | 7.85 | % | | | 7.85 | % | | | 7.81 | % |
| Tier 1 capital to risk weighted assets | | | 9.03 | | | | 8.85 | | | | 9.16 | | | | 8.77 | | | | 9.36 | |
| Total capital to risk weighted assets | | | 10.28 | | | | 10.10 | | | | 10.41 | | | | 10.02 | | | | 10.62 | |
| Average equity/average assets | | | 8.04 | | | | 7.96 | | | | 7.69 | | | | 7.81 | | | | 7.73 | |
| Tangible equity/tangible assets, period end | | | 9.61 | | | | 7.71 | | | | 7.92 | | | | 7.47 | | | | 7.71 | |
| | |
| (1) | | Noncore deposits includes Internet CDs, brokered deposits and CDs greater than $100,000 |
MACKINAC FINANCIAL CORPORATION AND SUBSIDIARIES
QUARTERLY FINANCIAL HIGHLIGHTS