| | | | | |
Table of Contents | | | | |
| | | | | |
| To Our Shareholders | | | 1 | |
| Selected Financial Highlights | | | 7 | |
| Five-Year Comparisons | | | 8 | |
| Quarterly Financial Summary | | | 10 | |
| Report of Independent Registered Public Accounting Firm | | | 11 | |
| Consolidated Balance Sheets | | | 12 | |
| Consolidated Statements of Operations | | | 13 | |
| Consolidated Statements of Changes in Shareholders’ Equity | | | 14 | |
| Consolidated Statements of Cash Flows | | | 15 | |
| Notes to Consolidated Financial Statements | | | 16 | |
| Selected Financial Data | | | 42 | |
| Summary Quarterly Financial Information | | | 43 | |
| Market Information | | | 45 | |
| Forward-Looking Statements | | | 46 | |
| Management’s Discussion and Analysis of Financial Condition and Results of Operations | | | 47 | |
| Directors and Officers | | | 68 | |
| Branch Locations | | | 69 | |
| Corporate Information | | | 70 | |
BUSINESS OF THE CORPORATION
Mackinac Financial Corporation is a registered bank holding company formed under the Bank Holding Company Act of 1956 with assets in excess of $400 million and whose common stock is traded on the NASDAQ stock market as “MFNC.” The principal subsidiary of the Corporation is mBank. Headquartered in Manistique, Michigan, mBank has 12 branch locations; eight in the Upper Peninsula, three in the Northern Lower Peninsula and one in Oakland County, Michigan. The Company’s banking services include commercial lending and treasury management products and services geared toward small to mid-sized businesses, as well as a full array of personal and business deposit products and consumer loans.
FORM 10-K
A copy of the Annual Report to the Securities and Exchange Commission on Form 10-K is available without charge by writing the Shareholders’ Relations Department, Mackinac Financial Corporation, 130 South Cedar Street, Manistique, Michigan, 49854.
MARKET SUMMARY
The Corporation’s common stock is traded on the Nasdaq Small Cap Market under the symbol MFNC. The Corporation had 1,660 shareholders of record as of March 31, 2008.
March 30, 2008
Dear Shareholders:
This letter will provide you with a review of the performance of Mackinac Financial Corporation through the end of 2007 and our thoughts about business strategy as we move through 2008.
The year ended December 31, 2007 was a year of continued progress for mBank and MFNC as loans, deposits and net income continued to grow in a very challenging market. This progress was affirmed by our ability to recognize the value of our net operating loss carry-forwards which resulted in a significant increase in our book value.
We continue to have success in generating commercial loans and have also made some progress in generating fee income from the sale of secondary mortgage and small business loans. However, to date, our ability to generate loans surpasses our ability to generate the core deposit growth that we need to create adequate profits and a return on equity that is more in line with shareholder expectations. Significant Federal Reserve rate decreases late in 2007 and early 2008 have exacerbated this problem putting pressure on net interest margin. As a result of these trends and the difficult regional economy, during 2007 we moved aggressively to focus on core deposit generation first, loan quality and pricing second and loan growth third. Fortunately, portfolio quality has remained relatively strong and we are in a position where we can aggressively re-price loan relationships where variable rate pricing and/or the lack of account balances brings the relationship yield below our targets. As we address reduced levels of growth in our balance sheet we will again focus on our costs and work to improve our efficiency. Following is additional detail on our progress to date.
The chart below is a recap of various balances and book value per share as of the end of the last three years (dollars in thousands, except per share data).
| | | | | | | | | | | | | | | | | | | | | | | | | | | | | |
| | | | | | | | | | | | | | | 2007/2006 | | 2006/2005 |
| | | As of December 31, | | Increase (Decrease) | | Increase (Decrease) |
| | | 2007 | | 2006 | | 2005 | | Dollars | | Percentage | | Dollars | | Percentage |
| Loans | | $ | 355,079 | | | $ | 322,581 | | | $ | 239,771 | | | $ | 32,498 | | | | 10.07 | % | | $ | 82,810 | | | | 34.54 | % |
| Assets | | | 408,880 | | | | 382,791 | | | | 298,722 | | | | 26,089 | | | | 6.82 | | | | 84,069 | | | | 28.14 | |
| Deposits | | | 320,827 | | | | 312,421 | | | | 232,632 | | | | 8,406 | | | | 2.69 | | | | 79,789 | | | | 34.30 | |
| Borrowings | | | 45,949 | | | | 38,307 | | | | 36,417 | | | | 7,642 | | | | 19.95 | | | | 1,890 | | | | 5.19 | |
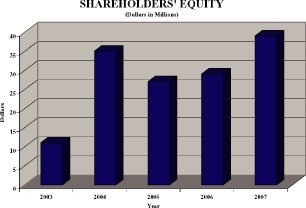
| Shareholders’ equity | | | 39,321 | | | | 28,790 | | | | 26,588 | | | | 10,531 | | | | 36.58 | | | | 2,202 | | | | 8.28 | |
| Book vaue per share | | | 11.47 | | | | 8.40 | | | | 7.75 | | | | 3.07 | | | | 36.55 | | | | 0.65 | | | | 8.39 | |
2007 Year-in-Review
| | § | | Loan growth of$32.498 million |
| |
| | § | | Credit quality still relatively strong with nonperforming assets to total assets of1.28% |
| |
| | § | | Gain on sale of loans of$.498 million |
| |
| | § | | Net interest margin at3.60%for the year |
| |
| | § | | Net income of$10.163million, or$2.96per common share |
1
2007 Earnings Recap
Mackinac Financial Corporation reported net income of $10.163 million, or $2.96 per share, for the year ended December 31, 2007, compared to a net income of $1.716 million, or $.50 per share, for 2006.
The results for 2007 include the recognition of a $7.500 million deferred tax benefit for NOL and tax credit carry-forwards and $.470 million of proceeds from the settlement of a lawsuit against the Corporation’s former accountants.
The 2006 operations include a $600,000 negative provision recorded in the first quarter in recognition of improved credit quality, a $261,000 negative provision recorded in the fourth quarter to recognize a specific reserve reduction on a loan payoff, and a $500,000 deferred tax benefit recorded in the third quarter in recognition of a portion of NOL and tax credit carry-forwards. The 2006 results also include $550,000 of expenses incurred to pursue legal action against the Corporation’s former accountants.
Excluding these items in both years would have resulted in net profit of $2.193 million, or $.64 per share, in 2007 versus $.907 million, or $.27 per share, in 2006.
We have been successful in executing the main thrust of our Strategic Plan by growing loans from $203.832 million at 2004 year end to $355.079 million at December 31, 2007. This production capability is matched with a conservative lending culture and a high level of expertise in back office credit review and loan workout areas.
Loan Growth/Production
Our success in sustaining our loan growth in 2007 occurred despite a challenging and tough Michigan economic climate. Each year we continue to evaluate and adjust underwriting standards to keep pace with the moving risk profile of the bank and corresponding Michigan economic climate. This focus has enabled the organization to maintain a low and manageable level of problem assets in relation to many peer and competing banks. These processes for managing our loan portfolio’s growth and overall risk have provided the foundation for net loans growing $32.498 million in 2007, despite high levels of loan pay-downs and runoff totaling $73.5 million. A good portion of loan runoff in 2007 was due to our discipline in qualifying renewal loans relative to pricing and risk. New loans originated for the year were $113.7 million and continued on a trend over the past three years, which totaled $366.7 million. The majority of the loan growth was centered in the real estate secured commercial, high net worth, and 1-4 family loan portfolios. We have purposely avoided the subprime lending opportunities in these sectors.
As previously stated, the success of our loan growth is the result of placing highly skilled commercial lenders in the markets which offer the most potential for loan growth, which has resulted in loan production in our three geographical regions as shown below.
| | | | | | | | | | | | | |
| | | For the Year Ending December 31, | |
| (dollars in thousands) | | 2007 | | | 2006 | | | 2005 | |
REGION | | | | | | | | | | | | |
| Upper Peninsula | | $ | 40,876 | | | $ | 37,115 | | | $ | 44,313 | |
| Northern Lower Peninsula | | | 22,448 | | | | 25,929 | | | | 36,619 | |
| Southeast Michigan | | | 50,404 | | | | 72,139 | | | | 36,827 | |
| |
| | | | | | | | | | |
| TOTAL | | $ | 113,728 | | | $ | 135,183 | | | $ | 117,759 | |
| | | | | | | | | | |
As you can see, we have generated loan growth in all regions. We will continue to evaluate loan growth potential in markets where we can grow loans with good credit quality and acceptable loan pricing enhanced by fee income.
In addition to enhanced underwriting and marketing initiatives, the Bank’s focus also centered around improving noninterest income through the development and implementation of (i) a successful government/SBA lending program and the sale of those guarantees for premiums, and (ii) the evolution of secondary market 1-4 family mortgage loan programs to sell mortgages to a variety of correspondent banks and government lenders. These programs not only significantly augment noninterest income, but also positively impact the bank balance sheet by freeing up liquidity and capital requirements to be allocated to continue earning asset generation, in addition to transferring all or part of the risk off the balance sheet.
2
Credit Quality
Loan quality, as mentioned earlier, continues to be one of our strengths. Nonperforming assets at the end of 2007 totaled $5.2 million, or 1.28%, of assets compared to $2.965 million, or .77% of assets at 2006 year-end. The increase in nonperforming assets, $2.269 million, in 2007 was due primarily to commercial credits that were originated prior to the recapitalization and existing management. An important aspect in the management of our loan portfolio is a program of continual credit monitoring which results in early detection of problem credits. We follow this detection process with a program that aggressively seeks an early resolution of problem loans to minimize principal loss and the expenses of problem credits.
Deposit Growth
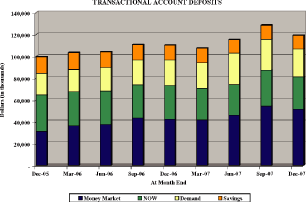
Core deposits, which we define as demand deposits, interest bearing checking accounts, money market savings accounts and certificates of deposit under $100,000 started to grow in mid 2005. We renamed the bank, changed all of our signs, altered every deposit product to bring about market place competitiveness and developed new collateral material and newspaper ads for our local markets. We grew core deposits by 14.0% in 2005 and continued this success in 2006 by growing core deposits by $25.079 million or 14.4%.
In the fourth quarter of 2007 we sold our Ripley branch office location with $9.3 million in deposits, including $1.0 million of noncore deposits. The sale of this branch location, in the Northwest region of the Upper Peninsula was in line with the overall strategic plan of the Corporation to focus on markets with higher growth potential. Excluding the Ripley sale, we increased core deposits in 2007 by $8.5 million, or 4.3%.
The following table illustrates the Bank’s deposit funding sources by region (dollars in thousands):
| | | | | | | | | | | | | | | | | |
| Deposit Funding Sources By Region | |
| As of December 31, 2007 | |
| | | Upper | | | Northern Lower | | | Southeast | | | | |
| | | Peninsula | | | Peninsula | | | Michigan | | | Total | |
| Funding Sources: | | | | | | | | | | | | | | | | |
| Transactional account deposits | | $ | 85,931 | | | $ | 21,606 | | | $ | 11,665 | | | $ | 119,202 | |
| CDs <$100,000 | | | 66,814 | | | | 13,554 | | | | 239 | | | | 80,607 | |
| | | | | | | | | | | | | |
| Total core funding | | | 152,745 | | | | 35,160 | | | | 11,904 | | | | 199,809 | |
| CDs >$100,000 | | | 14,485 | | | | 5,815 | | | | 2,055 | | | | 22,355 | |
| | | | | | | | | | | | | | | | | |
| | | | | | | | | | | | | |
| Total regional deposits | | $ | 167,230 | | | $ | 40,975 | | | $ | 13,959 | | | $ | 222,164 | |
| | | | | | | | | | | | | |
Growth of core deposits is a major component of our strategic plan, as illustrated in the table below.
| | | | | | | | | | | | | | | | | | | | | | | | | | | | | | | | | |
| | | DEPOSIT GROWTH | |
| | | As of December 31, | | | Percent Change | |
| | | 2007 | | | Mix | | | 2006 | | | Mix | | | 2005 | | | Mix | | | 2007/2006 | | | 2006/2005 | |
CORE DEPOSITS | | | | | | | | | | | | | | | | | | | | | | | | | | | | | | | | |
| Noninterest bearing | | $ | 25,557 | | | | 7.97 | % | | $ | 23,471 | | | | 7.51 | % | | $ | 19,684 | | | | 8.46 | % | | | 8.89 | % | | | 19.24 | % |
| NOW and money market | | | 81,160 | | | | 25.30 | | | | 73,188 | | | | 23.43 | | | | 64,566 | | | | 27.75 | | | | 10.89 | | | | 13.35 | |
| Savings and IRAs | | | 22,810 | | | | 7.11 | | | | 22,231 | | | | 7.12 | | | | 22,555 | | | | 9.70 | | | | 2.60 | | | | (1.44 | ) |
| Certificates of deposit <$100,000 | | | 70,282 | | | | 21.90 | | | | 80,719 | | | | 25.83 | | | | 67,725 | | | | 29.12 | | | | (12.93 | ) | | | 19.19 | |
| | | | | | | | | | | | | | | | | | | | | | | | | |
Total core deposits | | | 199,809 | | | | 62.28 | | | | 199,609 | | | | 63.89 | | | | 174,530 | | | | 75.03 | | | | 0.10 | | | | 14.37 | |
| | | | | | | | | | | | | | | | | | | | | | | | | |
| | | | | | | | | | | | | | | | | | | | | | | | | | | | | | | | | |
NON-CORE DEPOSITS | | | | | | | | | | | | | | | | | | | | | | | | | | | | | | | | |
| Certificates of deposit >$100,000 | | | 22,355 | | | | 6.97 | | | | 23,645 | | | | 7.57 | | | | 12,335 | | | | 5.30 | | | | (5.46 | ) | | | 91.69 | |
| Brokered CDs | | | 98,663 | | | | 30.75 | | | | 89,167 | | | | 28.54 | | | | 45,767 | | | | 19.67 | | | | 10.65 | | | | 94.83 | |
| | | | | | | | | | | | | | | | | | | | | | | | | |
Total non-core deposits | | | 121,018 | | | | 37.72 | | | | 112,812 | | | | 36.11 | | | | 58,102 | | | | 24.97 | | | | 7.27 | | | | 94.16 | |
| | | | | | | | | | | | | | | | | | | | | | | | | |
| | | | | | | | | | | | | | | | | | | | | | | | | | | | | | | | | |
| TOTAL DEPOSITS | | $ | 320,827 | | | | 100.00 | % | | $ | 312,421 | | | | 100.00 | % | | $ | 232,632 | | | | 100.00 | % | | | 2.69 | % | | | 34.30 | % |
| | | | | | | | | | | | | | | | | | | | | | | | | |
Throughout 2007, the bank continued to evaluate the way it does business to ensure it keeps pace with providing customers with simple, flexible, and convenient banking services to assist them in meeting all their financial needs. Specifically, the bank updated its electronic banking products for both consumers and businesses to make banking online quicker and more
3
efficient to assist in generating new transactional deposits, a critical part of our strategic initiatives. In addition, we successfully rolled out and implemented a comprehensive treasury management program encompassing the improved online banking capabilities, along with remote deposit capture machines where customers can deposit checks right from their place of business, saving them time and money of coming into the branch. The program also includes courier pick-up services for depositors when our remote deposit capture machine does not make economic sense. The program has been well received by customers and is tailored to fit the small/middle market business model focusing on these types of customers throughout the different regions to garner more market share.
For our business leaders and consumers, we offer a free ATM/Debit card. This service allows our customers to use any ATM in the continental U.S. without paying the service fees charged by the proprietary bank. For travelers, this makes mBank virtually nationwide and has led to the opening of a significant number of core demand deposit accounts. In 2007 we also added an Overdraft Privilege Program (ODP). This service provides customers with automatic overdraft coverage up to a set dollar amount which is determined by the account type opened. Not only has this provided a valuable service to our customer base, we have also experienced an increase in noninterest income by approximately $122,000. In the first quarter of 2008, we began offering Health Savings Accounts for individuals without healthcare coverage or those who have high deductible healthcare plans. We will also market health savings accounts to businesses looking for ways to reduce employment costs.
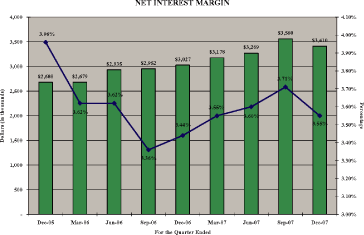
Net Interest Margin
Net interest income, the principal driver of our bottom line income, increased from $11.593 million in 2006 to $13.417 million in 2007, which was largely a reflection of our success in loan growth and a somewhat favorable interest rate environment. During the fourth quarter of 2007, we began to experience net interest margin pressure from reductions in interest rates. The Bank has a significant reliance on wholesale funding, which has not repriced in line with the asset side of our balance sheet. Our challenge is to decrease our reliance on wholesale funding by growing core deposits.
Noninterest Expense
Controlling noninterest expense is a distinct challenge for a strategy based upon growth. We accept this challenge and recognize that certain operational costs will increase in future periods. However, as we enter 2008, we are prepared to retard our growth in recognition of our environment and we have in fact continued our plan for reduction of noninterest expense in most other categories. The table below illustrates our expense control during a period of rapid growth:
| | | | | | | | | | | | |
| | | Year Ending December 31, | |
| (dollars in thousands) | | 2007 | | | 2006 | | | 2005 | |
| Salaries and employee benefits | | $ | 6,757 | | | $ | 6,132 | | | $ | 6,090 | |
| Occupancy | | | 1,272 | | | | 1,264 | | | | 1,053 | |
| Furniture and equipment | | | 678 | | | | 631 | | | | 560 | |
| Data processing | | | 785 | | | | 691 | | | | 1,720 | |
| Accounting, legal and consulting fees | | | 532 | | | | 1,425 | | | | 886 | |
| Loan and deposit | | | 285 | | | | 392 | | | | 852 | |
| Telephone | | | 228 | | | | 210 | | | | 271 | |
| Advertising | | | 370 | | | | 281 | | | | 768 | |
| Other | | | 1,193 | | | | 1,195 | | | | 6,055 | |
| | | | | | | | | | |
| Total noninterest expense | | | 12,100 | | | | 12,221 | | | | 18,255 | |
| | | | | | | | | | |
| Less: | | | | | | | | | | | | |
| Penalty — prepayment of FHLB borrowings | | | — | | | | — | | | | 4,320 | |
| Data processing conversion costs | | | — | | | | — | | | | 815 | |
| | | | | | | | | | |
| Noninterest expense, as adjusted | | $ | 12,100 | | | $ | 12,221 | | | $ | 13,120 | |
| | | | | | | | | | |
During 2006, we incurred significant unplanned legal expenses, approximately $.550 million, in the pursuit of legal action against the Corporation’s former accountants. This lawsuit was settled in 2007 for $.470 million, which recovered the majority of our costs.
4
The chart below illustrates the breakdown of noninterest expense as a percent of average assets.
The chart below illustrates the impact of controlling expenses and expanding our net interest margin has on our efficiency ratio.
5
COMPONENTS OF THE EFFICIENCY RATIO*
| | | | | | | | | | | | | |
| (dollars in thousands) | | 2007 | | | 2006 | | | 2005 | |
| Net interest income (FTE basis) | | $ | 13,691 | | | $ | 12,015 | | | $ | 10,344 | |
| Noninterest income, excluding securities gain/loss | | | 1,536 | | | | 983 | | | | 1,014 | |
| | | | | | | | | | |
| Total operating income (FTE basis) | | | 15,227 | | | | 12,998 | | | | 11,358 | |
| | | | | | | | | | |
| Noninterest expense | | $ | 12,100 | | | $ | 12,221 | | | $ | 13,120 | |
| | | | | | | | | | |
| Efficiency ratio | | | 79.46 | % | | | 94.02 | % | | | 115.51 | % |
| | | | | | | | | | |
| | |
| * | The efficiency ratio calculation excludes the FHLB prepayment penalty and the data processing conversion costs in 2005 and the lawsuit settlement proceeds in 2007. |
As illustrated above, this measurement of operational efficiency has shown improvement each year. We recognize that cost control is extremely important given interest margin pressures and our limited opportunities to increase noninterest income. The efficiency ratio for our peer group is still well below our current levels but we expect continued improvement.
Capital/Shareholders’ Equity
The Bank and Corporation were both well capitalized as of the end of 2007. On a consolidated basis, equity totaled $39.321 million at 2007 year end compared to $28.790 million at the end of 2006. Book value per share amounted to $11.40 compared to $8.40 a year earlier.
Looking Forward
We have entered 2008 knowing that we face an exceptionally challenging environment for financial institutions. Market credit issues and resultant liquidity issues led by the subprime lending crisis has resulted in significant rate reductions by the FOMC. Financial institutions across the country are facing increases in problem assets due to revaluations of loan collateral and borrower defaults. Our biggest challenge stems from declining rates, not credit quality. We will experience significant margin erosion in 2008, which will limit our earnings for the short term. We will be diligent in addressing this earnings deterioration. We aggressively re-priced our bank deposit products and maintain strict discipline in our lending process to maintain adequate spreads. We believe that some of the pressure from narrowing spreads will start to abate as the year goes on and that our margin will start to return to more stable levels. However, given our inability to predict the timing of this improvement we will address our expense structure and make the adjustments that we feel will maximize our short term and long terms earnings.
The Corporation is, and will remain, dedicated to the primary strategic objective of enhancing franchise and shareholder value in addition to supporting the communities and markets we do business in. We invite you to contact one of our knowledgeable loan officers to discuss how mBank’s broad array of loan products and services can be tailored to fit your corporate and personal needs.
We have made significant progress during the last three years and believe that we have demonstrated that we have a territory staked out in the Michigan marketplace that can provide strong returns for shareholders.
We thank you for your patience as we work through this difficult economic period and we welcome your comments and questions.
Sincerely,
Paul D. Tobias
Chairman and CEO
6
Selected Financial Highlights
(Dollars in Thousands, Except Per Share Data)
| | | | | | | | | |
| | | For The Years Ended December 31, |
| | | 2007 | | 2006 |
Selected Financial Condition Data (at end of period): | | | | | | | | |
| Total assets | | $ | 408,880 | | | $ | 382,791 | |
| Total loans | | | 355,079 | | | | 322,581 | |
| Total deposits | | | 320,827 | | | | 312,421 | |
| Borrowings | | | 45,949 | | | | 38,307 | |
| Total shareholders’ equity | | | 39,321 | | | | 28,790 | |
| | | | | | | | | |
Selected Statements of Income Data: | | | | | | | | |
| Net interest income | | $ | 13,417 | | | $ | 11,593 | |
| Income before taxes | | | 2,923 | | | | 1,216 | |
| Net income | | | 10,163 | | | | 1,716 | |
| Income per common share — Basic | | | 2.96 | | | | .50 | |
| Income per common share — Diluted | | | 2.96 | | | | .50 | |
| | | | | | | | | |
Selected Financial Ratios and Other Data: | | | | | | | | |
Performance Ratios: | | | | | | | | |
| Net interest margin | | | 3.60 | % | | | 3.51 | % |
| Efficiency ratio | | | 79.46 | | | | 93.95 | |
| Return on average assets | | | 2.59 | | | | .49 | |
| Return on average equity | | | 31.05 | | | | 6.19 | |
| |
| Average total assets | | $ | 392,313 | | | $ | 347,927 | |
| Average total shareholders’ equity | | | 32,731 | | | | 27,744 | |
| Average loans to average deposits ratio | | | 104.94 | % | | | 99.77 | % |
| | | | | | | | | |
Common Share Data at end of period: | | | | | | | | |
| Market price per common share | | $ | 8.98 | | | $ | 11.50 | |
| Book value per common share | | $ | 11.47 | | | $ | 8.40 | |
| Common shares outstanding | | | 3,428,695 | | | | 3,428,695 | |
| Weighted average shares | | | 3,428,695 | | | | 3,428,695 | |
| outstanding | | | | | | | | |
| | | | | | | | | |
Other Data at end of period: | | | | | | | | |
| Allowance for loan losses | | $ | 4,146 | | | $ | 5,006 | |
| Non-performing assets | | $ | 5,234 | | | $ | 2,965 | |
| Allowance for loan losses to total loans | | | 1.17 | % | | | 1.55 | % |
| Non-performing assets to total assets | | | 1.28 | % | | | .77 | % |
| Number of: | | | | | | | | |
| Branch locations | | | 12 | | | | 13 | |
| FTE employees | | | 100 | | | | 99 | |
The above summary should be read in connection with the related consolidated financial statements and notes included elsewhere in this report.
7
Five-Year Comparisons
| | | |
| | ASSETS |
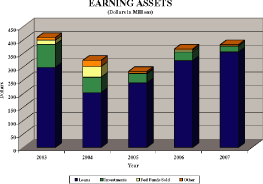
| | | Total assets on a consolidated basis increased by 6.8% during 2007 to $408.9 million. |
| | | |
| | EARNING ASSETS |
| | | Earning assets increased 4.4% during 2007 to $382.4 million. |
| | | |
| | LOANS |
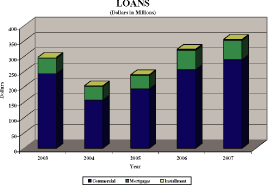
| | | Total loans increased 10.1% during 2007 to $355.1 million |
8
Five-Year Comparisons (Continued)
| | | |
| | SOURCE OF FUNDS |
| | | Source of funds increased by 4.6% to $366..8 million. |
| | | |
| | SHAREHOLDERS’ EQUITY |
| | | During 2007, shareholders’ equity increased by $10.5 million, or 36.58% to $39.3 million. |
| | | |
| | NET INCOME (LOSS) |
| | | Net income for 2007 was $10.2 million, as compared to net income of $1.7 million in 2006. |
9
MACKINAC FINANCIAL CORPORATION
QUARTERLY FINANCIAL SUMMARY
| | | | | | | | | | | | | | | | | | | | | | | | | | | | | | | | | | | | | | | | | |
| | | | | | | | | | | | | | | Average | | | | | | | | | | |
| | | Average | | Average | | Average | | Shareholders’ | | Return on Average | | Net Interest | | Efficiency | | Net Income | | Book Value |
| Quarter Ended | | Assets | | Loans | | Deposits | | Equity | | Assets | | Equity | | Margin | | Ratio | | Per Share | | Per Share |
December 31, 2007 | | $ | 406,308 | | | $ | 350,050 | | | $ | 324,194 | | | $ | 38,973 | | | | .51 | % | | | 5.36 | % | | | 3.55 | % | | | 78.02 | % | | $ | .15 | | | $ | 11.47 | |
September 30, 2007 | | | 400,105 | | | | 340,391 | | | | 327,293 | | | | 32,184 | | | | 7.99 | | | | 99.30 | | | | 3.71 | | | | 74.71 | | | | 2.35 | | | | 11.29 | |
June 30, 2007 | | | 382,065 | | | | 324,721 | | | | 309,469 | | | | 30,412 | | | | .57 | | | | 7.20 | | | | 3.60 | | | | 83.18 | | | | .16 | | | | 8.89 | |
March 31, 2007 | | | 380,403 | | | | 318,072 | | | | 309,619 | | | | 29,254 | | | | 1.10 | | | | 14.35 | | | | 3.55 | | | | 82.39 | | | | .30 | | | | 8.73 | |
| December 31, 2006 | | | 366,566 | | | | 301,508 | | | | 294,755 | | | | 28,646 | | | | .37 | | | | 4.68 | | | | 3.44 | | | | 94.60 | | | | .10 | | | | 8.40 | |
| September 30, 2006 | | | 362,632 | | | | 289,210 | | | | 296,608 | | | | 28,041 | | | | .75 | | | | 9.76 | | | | 3.36 | | | | 91.17 | | | | .20 | | | | 8.23 | |
| June 30, 2006 | | | 342,820 | | | | 273,686 | | | | 274,591 | | | | 27,213 | | | | .22 | | | | 2.82 | | | | 3.62 | | | | 91.41 | | | | .05 | | | | 7.93 | |
| March 31, 2006 | | | 319,007 | | | | 250,735 | | | | 251,720 | | | | 27,055 | | | | .63 | | | | 7.47 | | | | 3.62 | | | | 99.37 | | | | .15 | | | | 7.93 | |
| December 31, 2005 | | | 288,619 | | | | 224,386 | | | | 219,967 | | | | 27,288 | | | | (1.41 | ) | | | (14.95 | ) | | | 3.96 | | | | 128.37 | | | | (.30 | ) | | | 7.75 | |
10
| | | |
| | Plante & Moran, PLLC
Suite 500
2601 Cambridge Court
Auburn Hills, MI 48326
Tel: 248.375.7100
Fax: 248.375.7101
plantemoran.com |
Report of Independent Registered Public Accounting Firm
Board of Directors
Mackinac Financial Corporation, Inc.
We have audited the consolidated statement of financial condition of Mackinac Financial Corporation, Inc. as of December 31, 2007 and 2006 and the related consolidated statements of income, changes in stockholders’ equity, and cash flows for each year in the three-year period ended December 31, 2007. These consolidated financial statements are the responsibility of the Company’s management. Our responsibility is to express an opinion on these consolidated financial statements based on our audits.
We conducted our audits in accordance with the standards of the Public Company Accounting Oversight Board (United States). Those standards require that we plan and perform the audit to obtain reasonable assurance about whether the financial statements are free of material misstatement. The Company is not required to have, nor were we engaged to perform, an audit of its internal control over financial reporting. Our audits included consideration of internal control over financial reporting as a basis for designing audit procedures that are appropriate in the circumstances, but not for the purpose of expressing an opinion on the effectiveness of the Company’s internal control over financial reporting. Accordingly, we express no such opinion. An audit also includes examining, on a test basis, evidence supporting the amounts and disclosures in the financial statements, assessing the accounting principles used and significant estimates made by management, as well as evaluating the overall financial statement presentation. We believe that our audits provide a reasonable basis for our opinion.
In our opinion, the consolidated financial statements referred to above present fairly, in all material respects, the consolidated financial position of Mackinac Financial Corporation, Inc. as of December 31, 2007 and 2006 and the consolidated results of their operations and their cash flows for each year in the three-year period ended December 31, 2007, in conformity with accounting principles generally accepted in the United States of America.
| |
|
| |
Auburn Hills, Michigan
March 28, 2008 |
11
Consolidated Balance Sheets
MACKINAC FINANCIAL CORPORATION AND SUBSIDIARIES
December 31, 2007 and 2006
(Dollars in Thousands)
| | | | | | | | | |
| | | 2007 | | | 2006 | |
ASSETS | | | | | | | | |
| Cash and due from banks | | $ | 6,196 | | | $ | 4,865 | |
| Federal funds sold | | | 166 | | | | 5,841 | |
| | | | | | | |
| Cash and cash equivalents | | | 6,362 | | | | 10,706 | |
| | | | | | | | | |
| Interest-bearing deposits in other financial institutions | | | 1,810 | | | | 856 | |
| Securities available for sale | | | 21,597 | | | | 32,769 | |
| Federal Home Loan Bank stock | | | 3,794 | | | | 3,794 | |
| | | | | | | | | |
| Loans: | | | | | | | | |
| Commercial | | | 288,839 | | | | 261,726 | |
| Mortgage | | | 62,703 | | | | 58,014 | |
| Installment | | | 3,537 | | | | 2,841 | |
| | | | | | | |
| Total loans | | | 355,079 | | | | 322,581 | |
| Allowance for loan losses | | | (4,146 | ) | | | (5,006 | ) |
| | | | | | | |
| Net loans | | | 350,933 | | | | 317,575 | |
| | | | | | | | | |
| Premises and equipment | | | 11,609 | | | | 12,453 | |
| Other real estate held for sale | | | 1,226 | | | | 26 | |
| Other assets | | | 11,549 | | | | 4,612 | |
| | | | | | | |
| | | | | | | | | |
| TOTAL ASSETS | | $ | 408,880 | | | $ | 382,791 | |
| | | | | | | |
| | | | | | | | | |
LIABILITIES AND SHAREHOLDERS’ EQUITY | | | | | | | | |
| Liabilities: | | | | | | | | |
| Non-interest-bearing deposits | | $ | 25,557 | | | $ | 23,471 | |
| Interest-bearing deposits: | | | | | | | | |
| NOW and Money Market | | | 81,160 | | | | 73,188 | |
| Savings | | | 12,485 | | | | 13,365 | |
| CDs <$100,000 | | | 80,607 | | | | 89,585 | |
| CDs >$100,000 | | | 22,355 | | | | 23,645 | |
| Brokered | | | 98,663 | | | | 89,167 | |
| | | | | | | |
| Total deposits | | | 320,827 | | | | 312,421 | |
| | | | | | | | | |
| Borrowings: | | | | | | | | |
| Federal funds purchased | | | 7,710 | | | | — | |
| Short-term | | | 1,959 | | | | — | |
| Long-term | | | 36,280 | | | | 38,307 | |
| | | | | | | |
| Total borrowings | | | 45,949 | | | | 38,307 | |
| Other liabilities | | | 2,783 | | | | 3,273 | |
| | | | | | | |
| Total liabilities | | | 369,559 | | | | 354,001 | |
| | | | | | | | | |
| Shareholders’ equity: | | | | | | | | |
| Preferred stock - No par value: | | | | | | | | |
| Authorized 500,000 shares, no shares outstanding | | | — | | | | — | |
| Common stock and additional paid in capital - No par value | | | | | | | | |
| Authorized - 18,000,000 shares | | | | | | | | |
| Issued and outstanding - 3,428,695 shares | | | 42,843 | | | | 42,722 | |
| Accumulated deficit | | | (3,582 | ) | | | (13,745 | ) |
| Accumulated other comprehensive income (loss) | | | 60 | | | | (187 | ) |
| | | | | | | |
| | | | | | | | | |
| Total shareholders’ equity | | | 39,321 | | | | 28,790 | |
| | | | | | | |
| | | | | | | | | |
TOTAL LIABILITIES AND SHAREHOLDERS’ EQUITY | | $ | 408,880 | | | $ | 382,791 | |
| | | | | | | |
See accompanying notes to consolidated financial statements.
12
Consolidated Statements of Operations
MACKINAC FINANCIAL CORPORATION AND SUBSIDIARIES
Years Ended December 31, 2007, 2006, and 2005
(Dollars in Thousands, Except Per Share Data)
| | | | | | | | | | | | | |
| | | For The Years Ended December 31, | |
| | | 2007 | | | 2006 | | | 2005 | |
INTEREST INCOME: | | | | | | | | | | | | |
| Interest and fees on loans: | | | | | | | | | | | | |
| Taxable | | $ | 26,340 | | | $ | 21,239 | | | $ | 13,862 | |
| Tax-exempt | | | 533 | | | | 753 | | | | 928 | |
| Interest on securities: | | | | | | | | | | | | |
| Taxable | | | 1,100 | | | | 1,186 | | | | 1,455 | |
| Tax-exempt | | | — | | | | 87 | | | | 167 | |
| Other interest income | | | 722 | | | | 787 | | | | 564 | |
| | | | | | �� | | | | |
| Total interest income | | | 28,695 | | | | 24,052 | | | | 16,976 | |
| | | | | | | | | | |
| | | | | | | | | | | | | |
INTEREST EXPENSE: | | | | | | | | | | | | |
| Deposits | | | 13,224 | | | | 10,575 | | | | 5,259 | |
| Borrowings | | | 2,054 | | | | 1,884 | | | | 1,937 | |
| | | | | | | | | | |
| Total interest expense | | | 15,278 | | | | 12,459 | | | | 7,196 | |
| | | | | | | | | | |
| | | | | | | | | | | | | |
| Net interest income | | | 13,417 | | | | 11,593 | | | | 9,780 | |
| Provision for loan losses | | | 400 | | | | (861 | ) | | | — | |
| | | | | | | | | | |
| Net interest income after provision for loan losses | | | 13,017 | | | | 12,454 | | | | 9,780 | |
| | | | | | | | | | |
| | | | | | | | | | | | | |
OTHER INCOME: | | | | | | | | | | | | |
| Service fees | | | 688 | | | | 547 | | | | 586 | |
| Net gains on loan sales | | | 498 | | | | 197 | | | | 49 | |
| Proceeds from settlement of lawsuit | | | 470 | | | | — | | | | — | |
| Other | | | 350 | | | | 239 | | | | 476 | |
| | | | | | | | | | |
| Total other income | | | 2,006 | | | | 983 | | | | 1,111 | |
| | | | | | | | | | |
OTHER EXPENSE: | | | | | | | | | | | | |
| Salaries and employee benefits | | | 6,757 | | | | 6,132 | | | | 6,090 | |
| Occupancy | | | 1,272 | | | | 1,264 | | | | 1,053 | |
| Furniture and equipment | | | 678 | | | | 631 | | | | 560 | |
| Data processing | | | 785 | | | | 691 | | | | 1,720 | |
| Professional service fees | | | 532 | | | | 1,425 | | | | 886 | |
| Loan and deposit | | | 285 | | | | 392 | | | | 852 | |
| Telephone | | | 228 | | | | 210 | | | | 271 | |
| Advertising | | | 370 | | | | 346 | | | | 814 | |
| Penalty on prepayment of FHLB borrowings | | | — | | | | — | | | | 4,320 | |
| Other | | | 1,193 | | | | 1,130 | | | | 1,689 | |
| | | | | | | | | | |
| Total other expenses | | | 12,100 | | | | 12,221 | | | | 18,255 | |
| | | | | | | | | | |
| | | | | | | | | | | | | |
| Income (loss) before provision for income taxes | | | 2,923 | | | | 1,216 | | | | (7,364 | ) |
| Provision for (benefit of) income taxes | | | (7,240 | ) | | | (500 | ) | | | — | |
| | | | | | | | | | |
NET INCOME (LOSS) | | $ | 10,163 | | | $ | 1,716 | | | $ | (7,364 | ) |
| | | | | | | | | | |
INCOME (LOSS) PER COMMON SHARE: | | | | | | | | | | | | |
| Basic | | $ | 2.96 | | | $ | .50 | | | $ | (2.15 | ) |
| | | | | | | | | | |
| Diluted | | $ | 2.96 | | | $ | .50 | | | $ | (2.15 | ) |
| | | | | | | | | | |
See accompanying notes to consolidated financial statements.
13
Consolidated Statements of Changes in Shareholders’ Equity
MACKINAC FINANCIAL CORPORATION AND SUBSIDIARIES
Years Ended December 31, 2007, 2006, and 2005
(Dollars in Thousands)
| | | | | | | | | | | | | | | | | | | | | |
| | | | | | | | | | | | | | | Accumulated | | | | |
| | | Shares of | | | Common Stock | | | | | | | Other | | | | |
| | | Common | | | and Additional | | | Accumulated | | | Comprehensive | | | | |
| | | Stock | | | Paid in Capital | | | Deficit | | | Income (Loss) | | | Total | |
Balance, December 31, 2004 | | | 3,428,695 | | | $ | 42,335 | | | $ | (8,097 | ) | | $ | 492 | | | $ | 34,730 | |
| | | | | | | | | | | | | | | | | | | | | |
| Net loss | | | | | | | | | | | (7,364 | ) | | | | | | | (7,364 | ) |
| Other comprehensive loss: | | | | | | | | | | | | | | | | | | | | |
| Net unrealized loss on securities available for sale | | | | | | | | | | | | | | | (855 | ) | | | (855 | ) |
| | | | | | | | | | | | | | | | | | | | |
| Total comprehensive loss | | | | | | | | | | | | | | | | | | | (8,219 | ) |
| | | | | | | | | | | | | | | | | | | | | |
| Change in minority interest of consolidated subsidiary | | | | | | | 77 | | | | | | | | | | | | 77 | |
| |
| | | | | | | | | | | | | | | | |
Balance, December 31, 2005 | | | 3,428,695 | | | | 42,412 | | | | (15,461 | ) | | | (363 | ) | | | 26,588 | |
| | | | | | | | | | | | | | | | | | | | | |
| Net income | | | | | | | | | | | 1,716 | | | | | | | | 1,716 | |
| Other comprehensive income: | | | | | | | | | | | | | | | | | | | | |
| Net unrealized income on securities available for sale | | | | | | | | | | | | | | | 176 | | | | 176 | |
| | | | | | | | | | | | | | | | | | | | |
| Total comprehensive income | | | | | | | | | | | | | | | | | | | 1,892 | |
| | | | | | | | | | | | | | | | | | | | | |
| Stock option compensation | | | | | | | 310 | | | | | | | | | | | | 310 | |
| |
| | | | | | | | | | | | | | | | |
Balance, December 31, 2006 | | | 3,428,695 | | | | 42,722 | | | | (13,745 | ) | | | (187 | ) | | | 28,790 | |
| | | | | | | | | | | | | | | | | | | | | |
| Net income | | | | | | | | | | | 10,163 | | | | | | | | 10,163 | |
| Other comprehensive income: | | | | | | | | | | | | | | | | | | | | |
| Net unrealized income on securities available for sale | | | | | | | | | | | | | | | 247 | | | | 247 | |
| | | | | | | | | | | | | | | | | | | | |
| Total comprehensive income | | | | | | | | | | | | | | | | | | | 10,410 | |
| | | | | | | | | | | | | | | | | | | | | |
| Stock option compensation | | | | | | | 121 | | | | | | | | | | | | 121 | |
| |
| | | | | | | | | | | | | | | | |
Balance, December 31, 2007 | | | 3,428,695 | | | $ | 42,843 | | | $ | (3,582 | ) | | $ | 60 | | | $ | 39,321 | |
| | | | | | | | | | | | | | | | |
See accompanying notes to consolidated financial statements.
14
Consolidated Statements of Cash Flows
MACKINAC FINANCIAL CORPORATION AND SUBSIDIARIES
Years Ended December 31, 2007, 2006, and 2005
(Dollars in Thousands)
| | | | | | | | | | | | | |
| | | 2007 | | | 2006 | | | 2005 | |
Cash Flows from Operating Activities: | | | | | | | | | | | | |
| Net income (loss) | | $ | 10,163 | | | $ | 1,716 | | | $ | (7,364 | ) |
| Adjustments to reconcile net income (loss) to net cash provided by (used in) operating activities: | | | | | | | | | | | | |
| Depreciation and amortization | | | 733 | | | | 1,052 | | | | 918 | |
| Provision for loan losses | | | 400 | | | | (861 | ) | | | — | |
| Provision for (benefit of) deferred taxes | | | (7,240 | ) | | | (500 | ) | | | — | |
| (Gain) loss on sales/calls of securities available for sale | | | 1 | | | | 1 | | | | (95 | ) |
| (Gain) loss on sale of premises, equipment, branch and other real estate | | | (17 | ) | | | (60 | ) | | | 51 | |
| Writedown of other real estate | | | 40 | | | | — | | | | 200 | |
| Stock option compensation | | | 121 | | | | 310 | | | | — | |
| FHLB stock dividend | | | — | | | | — | | | | (101 | ) |
| Change in other assets | | | 221 | | | | (143 | ) | | | 1,501 | |
| Change in other liabilities | | | (491 | ) | | | 188 | | | | (993 | ) |
| | | | | | | | | | |
| Net cash (used in ) provided by operating activities | | | 3,931 | | | | 1,703 | | | | (5,883 | ) |
| | | | | | | | | | |
| | | | | | | | | | | | | |
Cash Flows from Investing Activities: | | | | | | | | | | | | |
| Net (increase) in loans | | | (35,043 | ) | | | (83,074 | ) | | | (37,429 | ) |
| Net (increase) decrease in interest-bearing deposits in other financial institutions | | | (954 | ) | | | 169 | | | | 17,510 | |
| Purchase of securities available for sale | | | (255,556 | ) | | | (5,000 | ) | | | (16,009 | ) |
| Proceeds from sales, maturities or calls of securities available for sale | | | 37,215 | | | | 6,579 | | | | 38,028 | |
| FHLB repurchase of stock | | | — | | | | 1,061 | | | | — | |
| Capital expenditures | | | (1,516 | ) | | | (1,367 | ) | | | (2,226 | ) |
| Proceeds from sale of premises, equipment, and other real estate | | | 323 | | | | 1,013 | | | | 1,437 | |
| Net cash paid in connection with branch sales | | | (8,042 | ) | | | — | | | | — | |
| Purchase of minority interest in subsidiary of bank | | | — | | | | — | | | | 77 | |
| | | | | | | | | | |
| Net cash (used in) provided by investing activities | | | (33,573 | ) | | | (80,619 | ) | | | 1,388 | |
| | | | | | | | | | |
| | | | | | | | | | | | | |
Cash Flows from financing activities: | | | | | | | | | | | | |
| Net increase in deposits | | $ | 17,656 | | | $ | 79,789 | | | $ | 16,982 | |
| Net increase in federal funds purchased | | | 7,710 | | | | — | | | | — | |
| Proceeds from issuance of debt | | | — | | | | 1,959 | | | | 1,651 | |
| Principal payments on borrowings | | | (68 | ) | | | (69 | ) | | | (50,273 | ) |
| | | | | | | | | | |
| Net cash (used in) provided by financing activities | | | 25,298 | | | | 81,679 | | | | (31,640 | ) |
| | | | | | | | | | |
| | | | | | | | | | | | | |
| Net increase (decrease) in cash and cash equivalents | | | (4,344 | ) | | | 2,763 | | | | (36,135 | ) |
| Cash and cash equivalents at beginning of period | | | 10,706 | | | | 7,943 | | | | 44,078 | |
| | | | | | | | | | |
| | | | | | | | | | | | | |
| Cash and cash equivalents at end of period | | $ | 6,362 | | | $ | 10,706 | | | $ | 7,943 | |
| | | | | | | | | | |
| | | | | | | | | | | | | |
Supplemental Cash Flow Information: | | | | | | | | | | | | |
| Cash paid during the year for: | | | | | | | | | | | | |
| Interest | | $ | 13,609 | | | $ | 12,270 | | | $ | 7,260 | |
| Income taxes | | | — | | | | — | | | | — | |
| | | | | | | | | | | | | |
Noncash Investing and Financing Activities: | | | | | | | | | | | | |
| Transfers of Foreclosures from Loans to Other Real Estate Held for Sale | | | 1,218 | | | | 23 | | | | 632 | |
| | | | | | | | | | | | | |
Assets and Liabilities Divested in Branch Sales: | | | | | | | | | | | | |
| Loans | | | 27 | | | | — | | | | — | |
| Premises and equipment | | | 1,181 | | | | — | | | | — | |
| Deposits | | | 9,250 | | | | — | | | | — | |
See accompaying notes to consolidated financial statements.
15
Notes to Consolidated Financial Statements
MACKINAC FINANCIAL CORPORATION AND SUBSIDIARIES
NOTE 1 — SUMMARY OF SIGNIFICANT ACCOUNTING POLICIES
The accounting policies of Mackinac Financial Corporation (the “Corporation”) and Subsidiaries conform to accounting principles generally accepted in the United States and prevailing practices within the banking industry. Significant accounting policies are summarized below.
Principles of Consolidation
The consolidated financial statements include the accounts of the Corporation and its wholly owned subsidiaries, mBank (the “Bank”) and other minor subsidiaries, after elimination of inter-company transactions and accounts.
Nature of Operations
The Corporation’s and the Bank’s revenues and assets are derived primarily from banking activities. The Bank’s primary market area is the Upper Peninsula, the northern portion of the Lower Peninsula of Michigan, and Oakland County in Lower Michigan. The Bank provides to its customers commercial, real estate, agricultural, and consumer loans, as well as a variety of traditional deposit products. A portion, approximately 3.7%, of the Bank’s commercial loan portfolio consists of leases to commercial and governmental entities, which are secured by various types of equipment. These leases are dispersed geographically throughout the country. Approximately 1% of the Corporation’s business activity is with Canadian customers and denominated in Canadian dollars.
While the Corporation’s chief decision makers monitor the revenue streams of the various Corporation products and services, operations are managed and financial performance is evaluated on a Corporation-wide basis. Accordingly, all of the Corporation’s banking operations are considered by management to be aggregated in one reportable operating segment.
Use of Estimates in Preparation of Financial Statements
The preparation of financial statements in conformity with accounting principles generally accepted in the United States requires management to make estimates and assumptions that affect the reported amounts of assets and liabilities and disclosure of contingent assets and liabilities at the date of the financial statements, and the reported amounts of revenue and expenses during the period. Actual results could differ from those estimates.
Material estimates that are particularly susceptible to significant change in the near term relate to the determination of the allowance for loan losses, the valuation of investment securities, the valuation of foreclosed real estate, deferred tax assets, and impairment of intangible assets.
Cash and Cash Equivalents
For purposes of reporting cash flows, cash and cash equivalents include cash on hand, noninterest-bearing deposits in correspondent banks, and federal funds sold. Generally, federal funds are purchased and sold for one-day periods.
Securities
The Corporation’s securities are classified and accounted for as securities available for sale. These securities are stated at fair value. Premiums and discounts are recognized in interest income using the interest method over the period to maturity. Unrealized holding gains and losses on securities available for sale are reported as accumulated other comprehensive income within shareholders’ equity until realized. When it is determined that securities or other investments are impaired and the impairment is other than temporary, an impairment loss is recognized in earnings and a new basis in the affected security is established. Gains and losses on the sale of securities are recorded on the trade date and determined using the specific-identification method.
16
Notes to Consolidated Financial Statements
MACKINAC FINANCIAL CORPORATION AND SUBSIDIARIES
NOTE 1 — SUMMARY OF SIGNIFICANT ACCOUNTING POLICIES(CONTINUED)
Federal Home Loan Bank Stock
As a member of the Federal Home Loan Bank (FHLB) system, the Bank is required to hold stock in the FHLB based on the anticipated level of borrowings to be advanced. This stock is recorded at cost, which approximates fair value. Transfer of the stock is substantially restricted.
Interest Income and Fees on Loans
Interest on loans is accrued and credited to income based on the principal amount outstanding. The accrual of interest on loans is discontinued when, in the opinion of management, it is probable that the borrower may be unable to meet payments as they become due. Upon such discontinuance, all unpaid accrued interest is reversed. Loans are returned to accrual status when all principal and interest amounts contractually due are brought current and future payments are reasonably assured. Interest income on impaired and nonaccrual loans is recorded on the cash basis. Loan-origination fees and allocated costs of originating loans are deferred and recognized over the term of the loan as an adjustment to yield in accordance with FASB Statement No. 91.
Allowance for Loan Losses
The allowance for loan losses includes specific allowances related to commercial loans, when they have been judged to be impaired. A loan is impaired when, based on current information, it is probable that the Corporation will not collect all amounts due in accordance with the contractual terms of the loan agreement. These specific allowances are based on discounted cash flows of expected future payments using the loan’s initial effective interest rate or the fair value of the collateral if the loan is collateral dependent.
The Corporation continues to maintain a general allowance for loan losses for loans not considered impaired. The allowance for loan losses is maintained at a level which management believes is adequate to provide for possible loan losses. Management periodically evaluates the adequacy of the allowance using the Corporation’s past loan loss experience, known and inherent risks in the portfolio, composition of the portfolio, current economic conditions, and other factors. The allowance does not include the effects of expected losses related to future events or future changes in economic conditions. This evaluation is inherently subjective since it requires material estimates that may be susceptible to significant change. Loans are charged against the allowance for loan losses when management believes the collectability of the principal is unlikely. In addition, various regulatory agencies periodically review the allowance for loan losses. These agencies may require additions to the allowance for loan losses based on their judgments of collectability.
In management’s opinion, the allowance for loan losses is adequate to cover probable losses relating to specifically identified loans, as well as probable losses inherent in the balance of the loan portfolio as of the balance sheet date.
Other Real Estate Held for Sale
Other real estate held for sale consists of assets acquired through, or in lieu of, foreclosure and other long-lived assets to be disposed of by sale, whether previously held and used or newly acquired. Other real estate held for sale is initially recorded at the lower of cost or fair value, less costs to sell, establishing a new cost basis. Valuations are periodically performed by management, and the assets’ carrying values are adjusted to the lower of cost basis or fair value less costs to sell. Impairment losses are recognized for any initial or subsequent write-downs. Net revenue and expenses from operations of other real estate held for sale are included in other expense.
17
Notes to Consolidated Financial Statements
MACKINAC FINANCIAL CORPORATION AND SUBSIDIARIES
NOTE 1 — SUMMARY OF SIGNIFICANT ACCOUNTING POLICIES (CONTINUED)
Premises and Equipment
Premises and equipment are stated at cost less accumulated depreciation. Maintenance and repair costs are charged to expense as incurred. Gains or losses on disposition of premises and equipment are reflected in income. Depreciation is computed on the straight-line method over the estimated useful lives of the assets.
Intangible Assets
Intangible assets attributable to the value of core deposits are stated at cost less accumulated amortization. The core deposit premium is amortized on a straight-line basis over a period of ten years and is subject to an annual impairment test based on the change in deposit base.
The Corporation reviews intangible assets for impairment whenever events or changes in circumstances indicate that the carrying amount of an asset may not be recoverable. The evaluation includes assessing the estimated fair value of the intangible asset based on market prices for similar assets, where available, and the present value of the estimated future cash flows associated with the intangible asset. Adjustments are recorded if it is determined that the benefit of the intangible asset has decreased.
Stock Option Plans
The Corporation sponsors three stock option plans. One plan was approved during 2000 and applies to officers, employees, and nonemployee directors. This plan was amended as a part of the December 2004 stock offering and recapitalization. The amendment, approved by shareholders, increased the shares available under this plan by 428,587 shares from the original 25,000 (adjusted for the 1:20 split), to a total authorized share balance of 453,587. The other two plans, one for officers and employees and the other for nonemployee directors, were approved in 1997. A total of 30,000 (adjusted for the 1:20 split), were made available for grant under these plans. These two plans expired early in 2007. Options under all of the plans are granted at the discretion of a committee of the Corporation’s Board of Directors. Options to purchase shares of the Corporation’s stock are granted at a price equal to the market price of the stock at the date of grant. The committee determines the vesting of the options when they are granted as established under the plan.
The Corporation adopted SFAS No. 123 (Revised) “Share Based Payments” in the first quarter of 2006. This statement supersedes APB Opinion No. 25, “Accounting for Stock Issue to Employees” and its related implementation guidance. Under Opinion No. 25, issuing stock options to employees generally resulted in recognition of no compensation cost. This adoption resulted in the recognition of after tax compensation expense in the amount of $121,000 for 2007 and $310,000 for 2006. The expense recorded recognizes the current period vesting of options outstanding. The after tax compensation expense, using this same accounting treatment would have amounted to $307,000 in 2005. The per share impact of this accounting change was approximately $.01 per share in each quarter of 2007, $.04 for the year. In 2006, the per share impact per quarter was $.02 and $.08 for the year.
18
Notes to Consolidated Financial Statements
MACKINAC FINANCIAL CORPORATION AND SUBSIDIARIES
NOTE 1 — SUMMARY OF SIGNIFICANT ACCOUNTING POLICIES(CONTINUED)
The table below illustrates earnings and per share impact that would have resulted if SFAS No. 123 had been in effect for 2005.
| | | | | |
| | | 2005 | |
Net income (loss): | | | | |
| | | | | |
| As reported | | $ | (7,364 | ) |
| Total stock-based compensations expense determined under fair value-based method | | | (307 | ) |
| Amount expensed in reported period | | | — | |
| | | | |
| | | | | |
| Pro forma | | $ | (7,671 | ) |
| | | | |
| | | | | |
Income (Loss) per share — Basic: | | | | |
| | | | | |
| As reported | | $ | (2.15 | ) |
| | | | |
| | | | | |
| Pro forma | | $ | (2.24 | ) |
| | | | |
| | | | | |
Income (Loss) per share — Diluted: | | | | |
| | | | | |
| As reported | | $ | (2.15 | ) |
| | | | |
| | | | | |
| Pro forma | | $ | (2.24 | ) |
| | | | |
| | | | | |
| Weighted average shares outstanding | | | 3,428,695 | |
| | | | |
Comprehensive Income (Loss)
Comprehensive income (loss) consists of net income (loss) and other comprehensive income (loss). Other comprehensive income (loss) includes unrealized gains and losses on securities available for sale, which are recognized as a separate component of equity and accumulated other comprehensive income (loss).
Earnings per Common Share
Basic earnings per common share is net income divided by the weighted average number of common shares outstanding during the period. Diluted earnings per common share includes the dilutive effect of additional potential common shares issuable under stock option agreements.
19
Notes to Consolidated Financial Statements
MACKINAC FINANCIAL CORPORATION AND SUBSIDIARIES
NOTE 1 — SUMMARY OF SIGNIFICANT ACCOUNTING POLICIES(CONTINUED)
Earnings (loss) per share are based upon the weighted average number of shares outstanding. The following shows the computation of basic and diluted income (loss) per share for the years ended December 31 (dollars in thousands, except per share data):
| | | | | | | | | | | | | |
| | | | | | | Weighted | | | | |
| | | | | | | Average | | | Income (Loss) | |
| | | Net Income (Loss) | | | Number of Shares | | | per Share | |
2007 | | | | | | | | | | | | |
Income per share — Basic and diluted | | $ | 10,163 | | | | 3,428,695 | | | $ | 2.96 | |
| | | | | | | | | | |
| | | | | | | | | | | | | |
| 2006 | | | | | | | | | | | | |
| Income per share — Basic and diluted | | $ | 1,716 | | | | 3,428,695 | | | $ | .50 | |
| | | | | | | | | | |
| | | | | | | | | | | | | |
| 2005 | | | | | | | | | | | | |
| Loss per share — Basic and diluted | | $ | (7,364 | ) | | | 3,428,695 | | | $ | (2.15 | ) |
| | | | | | | | | | |
In the above disclosure the dilutive effect of additional shares outstanding, as a result of stock options exercisable, was not taken into account since the additional shares issued as a result of vested options under the Company’s option plans would not have a dilutive effect on the earnings or loss calculated per share.
Income Taxes
Deferred income taxes have been provided under the liability method. Deferred tax assets and liabilities are determined based upon the difference between the financial statement and tax bases of assets and liabilities as measured by the enacted tax rates which will be in effect when these differences are expected to reverse. Deferred tax expense (credit) is the result of changes in the deferred tax asset and liability. A valuation allowance is provided against deferred tax assets when it is more likely than not that some or all of the deferred asset will not be realized. The Corporation recorded a $.260 million current tax provision in the fourth quarter of 2007. In the third quarter of 2007, the Corporation reversed a portion of the valuation allowance that pertained to the deferred tax benefit of NOL and tax credit carryforwards. This valuation adjustment, $7.500 million, was recorded as a current period income tax benefit. In 2006, the Corporation recorded a $500,000 tax benefit and utilized additional NOL carryforward benefits to offset current taxable income. The recognition of the deferred tax benefit in 2007 and 2006 was in accordance with generally accepted accounting principles, and considered, among other things, the probability of utilizing the NOL and credit carryforwards. Further discussion on the NOL carryforward and future benefits is presented in the “Management’s Discussion and Analysis” section of this report. There was no current tax provision or benefit recorded for 2005.
Off-Balance-Sheet Financial Instruments
In the ordinary course of business, the Corporation has entered into off-balance-sheet financial instruments consisting of commitments to extend credit, commitments under credit card arrangements, commercial letters of credit, and standby letters of credit. For letters of credit, the Corporation recognizes a liability for the fair market value of the obligations it assumes under that guarantee.
Reclassifications
Certain amounts in the 2006 and 2005 consolidated financial statements have been reclassified to conform to the 2007 presentation.
20
Notes to Consolidated Financial Statements
MACKINAC FINANCIAL CORPORATION AND SUBSIDIARIES
NOTE 2 — RECENT ACCOUNTING PRONOUNCEMENTS
FASB Interpretation No. 48 (FIN 48), Accounting for Uncertainty in Income Taxes
In July 2006, the Financial Accounting Standards Board (FASB) issued this interpretation to clarify the accounting for uncertainty in tax positions. FIN 48 requires, among other matters, that the Corporation recognize in its financial statements the impact of a tax position, if that position is more likely than not of being sustained on an audit, based on the technical merits of the position. The provisions of FIN 48 were effective as of the beginning of the Corporation’s 2007 fiscal year, and required any cumulative effect of the change in accounting principle recorded as an adjustment to opening retained earnings. The Corporation determined that no adjustment was required to implement FIN 48. In future periods, The Corporation will, in accordance with FIN 48, evaluate its tax positions to determine whether or not an adjustment to deferred tax balances and related valuation accounts is warranted.
SFAS No. 157, Fair Value Measurements
SFAS No. 157 defines fair value, establishes a framework for measuring fair value in generally accepted accounting principles (GAAP), and expands disclosures about fair value measurements. This statement is to be applied in concert with other accounting pronouncements which require or allow fair value measurements. This statement does not require any new fair value adjustments.
SFAS No. 159, The Fair Value Option for Financial Assets and Financial Liabilities (SFAS No. 159)
SFAS No. 159 permits an entity to measure certain financial assets and financial liabilities at fair value. The Statement’s objective is to improve financial reporting by allowing entities to mitigate volatility in reported earnings caused by the measurement of related assets and liabilities using different attributes, without having to apply complex hedge accounting provisions. Under SFAS No. 159, entities that elect the fair value option will report unrealized gains and losses in earnings at each subsequent reporting date. The fair value option may be elected on an instrument-by-instrument basis, with a few exceptions, as long as it is applied to the instrument in its entirety. The fair value option election is irrevocable, unless a new election date occurs. The new Statement establishes presentation and disclosure requirements to help financial statement users understand the effect of the entity’s election on its earnings but does not eliminate disclosure requirements of other accounting standards. Assets and liabilities that are measured at fair value must be displayed on the face of the balance sheet.
SFAS No. 157 and No. 159 are effective January 1, 2008. The adoption of SFAS No. 157 and No. 159 by the Corporation did not have any material impact on the consolidated financial statements.
NOTE 3 — RESTRICTIONS ON CASH AND CASH EQUIVALENTS
Cash and cash equivalents in the amount of $1.750 million were restricted on December 31, 2007 to meet the reserve requirements of the Federal Reserve System.
In the normal course of business, the Corporation maintains cash and due from bank balances with correspondent banks. Balances in these accounts may exceed the Federal Deposit Insurance Corporation’s insured limit of $100,000. Management believes that these financial institutions have strong credit ratings and the credit risk related to these deposits is minimal.
21
Notes to Consolidated Financial Statements
MACKINAC FINANCIAL CORPORATION AND SUBSIDIARIES
NOTE 4 — SECURITIES AVAILABLE FOR SALE
The carrying value and estimated fair value of securities available for sale are as follows (dollars in thousands):
| | | | | | | | | | | | | | | | | |
| | | | | | | Gross | | | Gross | | | | |
| | | Amortized | | | Unrealized | | | Unrealized | | | Estimated | |
| | | Cost | | | Gains | | | Losses | | | Fair Value | |
December 31, 2007 | | | | | | | | | | | | | | | | |
| | | | | | | | | | | | | | | | | |
US Agencies | | $ | 20,982 | | | $ | 25 | | | $ | 38 | | | $ | 20,969 | |
Obligations of states and political subdivisions | | | 556 | | | | 72 | | | | — | | | | 628 | |
| | | | | | | | | | | | | |
| | | | | | | | | | | | | | | | | |
Total securities available for sale | | $ | 21,538 | | | $ | 97 | | | $ | 38 | | | $ | 21,597 | |
| | | | | | | | | | | | | |
| | | | | | | | | | | | | | | | | |
December 31, 2006 | | | | | | | | | | | | | | | | |
| | | | | | | | | | | | | | | | | |
| US Agencies | | $ | 32,445 | | | $ | 2 | | | $ | 271 | | | $ | 32,176 | |
| Obligations of states and political subdivisions | | | 511 | | | | 82 | | | | — | | | | 593 | |
| | | | | | | | | | | | | |
| | | | | | | | | | | | | | | | | |
| Total securities available for sale | | $ | 32,956 | | | $ | 84 | | | $ | 271 | | | $ | 32,769 | |
| | | | | | | | | | | | | |
Following is information pertaining to securities with gross unrealized losses at December 31, 2007 and 2006 aggregated by investment category and length of time these individual securities have been in a loss position (dollars in thousands):
| | | | | | | | | | | | | | | | | |
| | | Less Than Twelve Months | | | Over Twelve Months | |
| | | Gross | | | | | | | Gross | | | | |
| | | Unrealized | | | Fair | | | Unrealized | | | Fair | |
| | | Losses | | | Value | | | Losses | | | Value | |
December 31, 2007 | | | | | | | | | | | | | | | | |
| | | | | | | | | | | | | | | | | |
US Agencies | | $ | (7 | ) | | $ | 6,978 | | | $ | (31 | ) | | $ | 8,969 | |
| | | | | | | | | | | | | |
| | | | | | | | | | | | | | | | | |
Total securities available for sale | | $ | (7 | ) | | $ | 6,978 | | | $ | (31 | ) | | $ | 8,969 | |
| | | | | | | | | | | | | |
| | | | | | | | | | | | | | | | | |
December 31, 2006 | | | | | | | | | | | | | | | | |
| | | | | | | | | | | | | | | | | |
| US Agencies | | $ | — | | | $ | — | | | $ | 271 | | | $ | 27,174 | |
| | | | | | | | | | | | | |
| | | | | | | | | | | | | | | | | |
| Total securities available for sale | | $ | — | | | $ | — | | | $ | 271 | | | $ | 27,174 | |
| | | | | | | | | | | | | |
The gross unrealized losses in the current portfolio are considered temporary in nature and related to interest rate fluctuations. The Corporation has both the ability and intent to hold the investment securities until their respective maturities and therefore does not anticipate the realization of the temporary losses.
22
Notes to Consolidated Financial Statements
MACKINAC FINANCIAL CORPORATION AND SUBSIDIARIES
NOTE 4 — SECURITIES AVAILABLE FOR SALE(CONTINUED)
Following is a summary of the proceeds from sales and calls of securities available for sale, as well as gross gains and losses for the years ended December 31 (dollars in thousands):
| | | | | | | | | | | | | |
| | | 2007 | | 2006 | | 2005 |
| Proceeds from sales and calls | | $ | 6,579 | | | $ | 3,010 | | | $ | 35,364 | |
| Gross gains on sales | | | — | | | | — | | | | 96 | |
| Gross losses on sales and calls | | | 1 | | | | 1 | | | | 1 | |
The carrying value and estimated fair value of securities available for sale at December 31, 2007, by contractual maturity, are shown below (dollars in thousands):
| | | | | | | | | |
| | | Amortized | | | Estimated | |
| | | Cost | | | Fair Value | |
| Due in one year or less | | $ | 18,987 | | | $ | 18,975 | |
| Due after one year through five years | | | 2,024 | | | | 2,023 | |
| Due after five years through ten years | | | 527 | | | | 599 | |
| Due after ten years | | | — | | | | — | |
| | | | | | | |
| | | | | | | | | |
| Total | | $ | 21,538 | | | $ | 21,597 | |
| | | | | | | |
Contractual maturities may differ from expected maturities because issuers may have the right to call or prepay obligations with or without call or prepayment penalties. See Note 10 for information on securities pledged to secure borrowings from the Federal Home Loan Bank.
NOTE 5 — LOANS
The composition of loans at December 31 is as follows (dollars in thousands):
| | | | | | | | | |
| | | 2007 | | | 2006 | |
| Commercial real estate | | $ | 171,695 | | | $ | 154,332 | |
| Commercial, financial, and agricultural | | | 78,192 | | | | 71,385 | |
| One to four family residential real estate | | | 57,613 | | | | 58,014 | |
| Construction : | | | | | | | | |
| Consumer | | | 5,090 | | | | 5,946 | |
| Commerical | | | 38,952 | | | | 30,063 | |
| Consumer | | | 3,537 | | | | 2,841 | |
| | | | | | | |
| | | | | | | | | |
| Total loans | | $ | 355,079 | | | $ | 322,581 | |
| | | | | | | |
23
Notes to Consolidated Financial Statements
MACKINAC FINANCIAL CORPORATION AND SUBSIDIARIES
NOTE 5 — LOANS(CONTINUED)
An analysis of the allowance for loan losses for the years ended December 31 is as follows (dollars in thousands):
| | | | | | | | | | | | | |
| | | 2007 | | | 2006 | | | 2005 | |
| Balance, January 1 | | $ | 5,006 | | | $ | 6,108 | | | $ | 6,966 | |
| Recoveries on loans previously charged off | | | 50 | | | | 91 | | | | 134 | |
| Loans charged off | | | (1,310 | ) | | | (332 | ) | | | (992 | ) |
| Provision | | | 400 | | | | (861 | ) | | | — | |
| | | | | | | | | | |
| | | | | | | | | | | | | |
| Balance, December 31 | | $ | 4,146 | | | $ | 5,006 | | | $ | 6,108 | |
| | | | | | | | | | |
In 2007, net charge off activity was $1.260 million, or .38% of average loans outstanding compared to net charge-offs of $241,000, or .08% of average loans, in the same period in 2006 and $858,000, or .41% of average loans, in 2005. In December of 2005, the Bank completed a sale of nonperforming assets, which resulted in a charge to the reserve of $.4 million. During the third quarter of 2007, a provision of $400,000 was made to increase the reserve. This provision was made in accordance with the Corporation’s allowance for loan loss reserve policy, which calls for a measurement of the adequacy of the reserve at each quarter end. This process includes an analysis of the loan portfolio to take into account increases in loans outstanding and portfolio composition, historical loss rates, and specific reserve requirements of nonperforming loans. In the first quarter of 2006, the Corporation reduced the allowance for loan losses by recording a negative provision amounting to $600,000. In the fourth quarter of 2006, a reduction of $261,000 was made to the reserve due to the resolution of a problem loan with an excess specific reserve. These reductions in the reserve were made in recognition of the improved credit quality existent in the loan portfolio and are discussed in more detail under “Management’s Discussion and Analysis.”
Impaired Loans
Nonperforming loans are those which are contractually past due 90 days or more as to interest or principal payments, on nonaccrual status, or loans, the terms of which have been renegotiated to provide a reduction or deferral on interest or principal. The interest income recorded and that which would have been recorded had nonaccrual and renegotiated loans been current, or not troubled was not material to the consolidated financial statements for the years ended December 31, 2007 and 2006.
A loan is considered impaired, based on current information and events, if it is probable that the Bank will be unable to collect the scheduled payments of principal or interest when due, according to the contractual terms of the loan agreement.
24
Notes to Consolidated Financial Statements
MACKINAC FINANCIAL CORPORATION AND SUBSIDIARIES
NOTE 5 — LOANS(CONTINUED)
The following is a summary of impaired loans and their effect on interest income (dollars in thousands):
| | | | | | | | | | | | | | | | | | | | | | | | | |
| | | Impaired Loans | | | Valuation Reserve | |
| | | December 31, | | | December 31, | |
| | | 2007 | | | 2006 | | | 2005 | | | 2007 | | | 2006 | | | 2005 | |
| Balances, at period end | | | | | | | | | | | | | | | | | | | | | | | | |
| Impaired loans with valuation reserve | | $ | 3,639 | | | $ | 1,804 | | | $ | — | | | $ | 1,320 | | | $ | 493 | | | $ | — | |
| Impaired loans with no valuation reserve | | | 369 | | | | 1,136 | | | | 114 | | | | — | | | | — | | | | — | |
| | | | | | | | | | | | | | | | | | | |
| | | | | | | | | | | | | | | | | | | | | | | | | |
| Total impaired loans | | $ | 4,008 | | | $ | 2,940 | | | $ | 114 | | | $ | 1,320 | | | $ | 493 | | | $ | ��� | |
| | | | | | | | | | | | | | | | | | | |
| | | | | | | | | | | | | | | | | | | | | | | | | |
| Impaired loans on nonaccrual basis (1) | | $ | 3,298 | | | $ | 2,900 | | | $ | 15 | | | $ | 1,219 | | | $ | 493 | | | $ | — | |
| Impaired loans on accrual basis | | | 710 | | | | 40 | | | | 99 | | | | 101 | | | | — | | | | — | |
| | | | | | | | | | | | | | | | | | | |
| | | | | | | | | | | | | | | | | | | | | | | | | |
| Total impaired loans | | $ | 4,008 | | | $ | 2,940 | | | $ | 114 | | | $ | 1,320 | | | $ | 493 | | | $ | — | |
| | | | | | | | | | | | | | | | | | | |
| | | | | | | | | | | | | | | | | | | | | | | | | |
| Average investment in impaired loans | | $ | 4,135 | | | $ | 1,192 | | | $ | 1,922 | | | | | | | | | | | | | |
| Interest income recognized during impairment | | | 129 | | | | 7 | | | | 78 | | | | | | | | | | | | | |
| Interest income that would have been recognized on an accrual basis | | | 391 | | | | 114 | | | | 134 | | | | | | | | | | | | | |
| Cash-basis interest income recognized | | | 84 | | | | 5 | | | | 76 | | | | | | | | | | | | | |
| | |
| (1) | | In addition to the valuation reserves on impaired loan as of December 31, 2007, the Bank had an SBA loan guarantee of $.435 million, which relates to a hotel/motel loan included with nonaccrual loans |
Insider Loans
The Bank, in the ordinary course of business, grants loans to the Corporation’s executive officers and directors, including their families and firms in which they are principal owners. Activity in such loans is summarized below (dollars in thousands):
| | | | | | | | | |
| | | 2007 | | | 2006 | |
| Loans outstanding, January 1 | | $ | 1,621 | | | $ | 578 | |
| New loans | | | — | | | | 1,647 | |
| Net activity on revolving lines of credit | | | 556 | | | | 271 | |
| Repayment | | | (457 | ) | | | (875 | ) |
| | | | | | | |
| | | | | | | | | |
| Loans outstanding, December 31 | | $ | 1,720 | | | $ | 1,621 | |
| | | | | | | |
No related party loans were classified substandard as of December 31, 2007 and 2006. In addition to the outstanding balances above, there were unused commitments of $44,000 to related parties at December 31, 2007.
25
Notes to Consolidated Financial Statements
MACKINAC FINANCIAL CORPORATION AND SUBSIDIARIES
NOTE 6 — PREMISES AND EQUIPMENT
Details of premises and equipment at December 31 are as follows (dollars in thousands):
| | | | | | | | | |
| | | 2007 | | | 2006 | |
| Land | | $ | 2,042 | | | $ | 2,421 | |
| Buildings and improvements | | | 12,258 | | | | 13,179 | |
| Furniture, fixtures, and equipment | | | 3,783 | | | | 3,303 | |
| Construction in progress | | | 224 | | | | 1 | |
| | | | | | | |
| Total cost basis | | | 18,307 | | | | 18,904 | |
| Less — Accumulated depreciation | | | 6,698 | | | | 6,451 | |
| | | | | | | |
| | | | | | | | | |
| Net book value | | $ | 11,609 | | | $ | 12,453 | |
| | | | | | | |
The construction in progress at the end of 2007 pertains to two technological improvement projects which were completed early in 2008.
In October 2007, the Bank sold its Ripley branch office, with deposits of approximately $9.3 million, premises and equipment with a net book value of $1.2 million, and loans totaling $27,000. During 2006, the Corporation opened a new full service branch office and relocated a full service branch office. The old branch office building was sold in 2007.
Depreciation of premises and equipment charged to operating expenses amounted to $891,000 in 2007, $890,000 in 2006, and $707,000 in 2005.
NOTE 7 — OTHER REAL ESTATE HELD FOR SALE
An analysis of other real estate held for sale for the years ended December 31 (dollars in thousands) is as follows:
| | | | | | | | | |
| | | 2007 | | | 2006 | |
| Balance, January 1 | | $ | 26 | | | $ | 945 | |
| Other real estate transferred from loans due to foreclosure | | | 1,218 | | | | 23 | |
| Other real estate sold / written down | | | (18 | ) | | | (942 | ) |
| | | | | | | |
| | | | | | | | | |
| Balance, December 31 | | $ | 1,226 | | | $ | 26 | |
| | | | | | | |
26
Notes to Consolidated Financial Statements
MACKINAC FINANCIAL CORPORATION AND SUBSIDIARIES
NOTE 8 — INTANGIBLE ASSET
Included in other assets are core deposit premiums acquired through acquisitions. These core deposit premiums are considered an intangible asset. As of December 31, 2007, the remaining balance of core deposit intangibles was $123,000. Core deposit premium expense amounted to $82,000 in 2007, $125,000 in 2006 and 2005.
The following table shows the estimated future amortization expense for the intangible asset. The projections of amortization expense are based on existing asset balances as of December 31, 2007 (dollars in thousands):
| | | | | |
| 2008 | | $ | 78 | |
| 2009 | | | 45 | |
| | | | |
| | | | | |
| Total | | $ | 123 | |
| | | | |
NOTE 9 — DEPOSITS
The distribution of deposits at December 31 is as follows (dollars in thousands):
| | | | | | | | | |
| | | 2007 | | | 2006 | |
| Non-interest-bearing | | $ | 25,557 | | | $ | 23,471 | |
| NOW and Money Market | | | 81,160 | | | �� | 73,188 | |
| Savings | | | 12,485 | | | | 13,365 | |
| CDs <$100,000 | | | 80,607 | | | | 89,585 | |
| CDs >$100,000 | | | 22,355 | | | | 23,645 | |
| Brokered | | | 98,663 | | | | 89,167 | |
| | | | | | | |
| | | | | | | | | |
| Total deposits | | $ | 320,827 | | | $ | 312,421 | |
| | | | | | | |
Maturities of non-brokered time deposits outstanding at December 31, 2007, (dollars in thousands) are as follows:
| | | | | |
| 2008 | | $ | 90,580 | |
| 2009 | | | 6,704 | |
| 2010 | | | 3,085 | |
| 2011 | | | 1,417 | |
| 2012 | | | 376 | |
| Thereafter | | | 800 | |
| | | | |
| | | | | |
| Total | | $ | 102,962 | |
| | | | |
Brokered deposits of $54.137 million mature in 2008. The Bank also has $44.229 of callable brokered CDs which mature in 2009 and 2010. These certificates of deposit can be paid off by the Bank earlier than the maturity date, subject to advance notification by the Bank.
27
Notes to Consolidated Financial Statements
MACKINAC FINANCIAL CORPORATION AND SUBSIDIARIES
NOTE 10 — SHORT-TERM BORROWINGS
Short-term borrowings consist of the following at December 31 (dollars in thousands):
| | | | | | | | | |
| | | 2007 | | | 2006 | |
| Fed funds purchased with a weighted average rate of 4.18% | | $ | 7,710 | | | $ | — | |
| | | | | | | | | |
| Advance outstanding on line of credit with a correspondent bank, interest payable at the prime rate, 7.25% as of December 31, 2007, maturing May 31, 2008 | | | 1,959 | | | | 1,959 | |
| | | | | | | |
| | | $ | 9,669 | | | $ | 1,959 | |
| | | | | | | |
In the second quarter of 2006, the Corporation established a $6 million line of credit with a correspondent bank. This line of credit, which is priced at the prime rate, will be utilized by the Corporation to infuse capital into the Bank in order to support the regulatory required 8% Tier 1 Capital and provide cash for holding company operations. This line of credit is secured by all of the shares of the Bank and matures May 31, 2008, with a provision for an automatic six-month extension to November 31, 2008.
NOTE 11 — LONG-TERM BORROWINGS
Long-term borrowings consist of the following at December 31 (dollars in thousands):
| | | | | | | | | |
| | | 2007 | | | 2006 | |
| Federal Home Loan Bank fixed rate advances at rates ranging from 4.98% to 5.16% maturing in 2010 | | $ | 15,000 | | | $ | 15,000 | |
| | | | | | | | | |
| Federal Home Loan Bank variable rate advances at rates ranging from 4.90% to 5.26% maturing in 2011 | | | 20,000 | | | | 20,000 | |
| | | | | | | | | |
| Farmers Home Administration, fixed-rate note payable, maturing August 24, 2024 interest payable at 1% | | | 1,280 | | | | 1,348 | |
| | | | | | | |
| | | $ | 36,280 | | | $ | 36,348 | |
| | | | | | | |
In the first quarter of 2005, the Corporation prepaid $48.555 million of the Federal Home Loan Bank (“FHLB”) borrowings and incurred a prepayment penalty of $4.320 million. This early payoff of FHLB borrowings reduced interest rate risk and better positioned the Corporation for future match funding of loan growth.
The Federal Home Loan Bank borrowings are collateralized at December 31, 2007 by the following: a collateral agreement on the Corporation’s one to four family residential real estate loans with a book value of approximately $22.136 million; U.S. government agency securities with an amortized cost and estimated fair value of $20.132 million and $20.119 million respectively; and Federal Home Loan Bank stock owned by the Bank totaling $3.794 million. Prepayment of the remaining advances is subject to the provisions and conditions of the credit policy of the Federal Home Loan Bank of Indianapolis in effect as of December 31, 2007.
The $35.000 million FHLB borrowings are comprised of both fixed and variable rate borrowings as shown in the above table. The FHLB has the option to convert the $15.000 million of fixed rate advances to adjustable rate advances, repricing quarterly at three month LIBOR flat, on the original call date and thereafter.
28
Notes to Consolidated Financial Statements
MACKINAC FINANCIAL CORPORATION AND SUBSIDIARIES
NOTE 11 — LONG-TERM BORROWINGS (CONTINUED)
The U.S.D.A. Rural Development borrowing is collateralized by loans totaling $.515 million originated and held by the Corporation’s wholly owned subsidiary, First Rural Relending and an assignment of a demand deposit account in the amount of $.938 million, and guaranteed by the Corporation.
Maturities of long-term borrowings outstanding at December 31, 2007 are as follows (dollars in thousands):
| | | | | |
| 2008 | | $ | — | |
| 2009 | | | — | |
| 2010 | | | 15,000 | |
| 2011 | | | 20,000 | |
| 2012 | | | — | |
| Thereafter | | | 1,280 | |
| | | | |
| | | | | |
| Total | | $ | 36,280 | |
| | | | |
NOTE 12 — INCOME TAXES
The components of the federal income tax provision (credit) for the years ended December 31 are as follows (dollars in thousands):
| | | | | | | | | | | | | |
| | | 2007 | | | 2006 | | | 2005 | |
| Current tax expense (credit) | | $ | 15 | | | $ | — | | | $ | — | |
| Change in valuation allowance | | | (7,255 | ) | | | (500 | ) | | | — | |
| | | | | | | | | | |
| | | | | | | | | | | | | |
| Total provision (credit) for income taxes | | $ | (7,240 | ) | | $ | (500 | ) | | $ | — | |
| | | | | | | | | | |
A summary of the source of differences between income taxes at the federal statutory rate and the provision (credit) for income taxes for the years ended December 31 is as follows (dollars in thousands):
| | | | | | | | | | | | | |
| | | 2007 | | | 2006 | | | 2005 | |
| Tax expense (benefit) at statutory rate | | $ | 993 | | | $ | 413 | | | $ | (2,504 | ) |
| Increase (decrease) in taxes resulting from: | | | | | | | | | | | | |
| Tax-exempt interest | | | (181 | ) | | | (252 | ) | | | (340 | ) |
| Change in valuation allowance | | | (8,136 | ) | | | (288 | ) | | | 2,863 | |
| Other | | | 84 | | | | (373 | ) | | | (19 | ) |
| | | | | | | | | | |
| | | | | | | | | | | | | |
| Provision for (benefit of) income taxes | | $ | (7,240 | ) | | $ | (500 | ) | | $ | — | |
| | | | | | | | | | |
29
Notes to Consolidated Financial Statements
MACKINAC FINANCIAL CORPORATION AND SUBSIDIARIES
NOTE 12 — INCOME TAXES (CONTINUED)
Deferred income taxes are provided for the temporary differences between the financial reporting and tax bases of the Corporation’s assets and liabilities. The major components of net deferred tax assets at December 31 are as follows (dollars in thousands):
| | | | | | | | | |
| | | 2007 | | | 2006 | |
| Deferred tax assets: | | | | | | | | |
| Allowance for loan losses | | $ | 1,410 | | | $ | 1,702 | |
| Deferred compensation | | | 350 | | | | 386 | |
| Intangible assets | | | 289 | | | | 322 | |
| Alternative Minimum Tax Credit | | | 1,463 | | | | 1,463 | |
| NOL carryforward | | | 11,623 | | | | 12,228 | |
| Depreciation | | | 65 | | | | 62 | |
| Tax credit carryovers | | | 672 | | | | 673 | |
| Other | | | 405 | | | | 322 | |
| | | | | | | |
| | | | | | | | | |
| Total deferred tax assets | | | 16,277 | | | | 17,158 | |
| | | | | | | |
| | | | | | | | | |
| Valuation allowance | | $ | (8,146 | ) | | $ | (16,282 | ) |
| | | | | | | |
| | | | | | | | | |
| Deferred tax liabilities: | | | | | | | | |
| | | | | | | | | |
| Total deferred tax liabilities | | | (376 | ) | | | (376 | ) |
| | | | | | | |
| | | | | | | | | |
| Net deferred tax asset (liabilty) | | $ | 7,755 | | | $ | 500 | |
| | | | | | | |
A valuation allowance is provided against deferred tax assets when it is more likely than not that some or all of the deferred tax asset will not be realized. At December 31, 2007 and 2006, the Corporation evaluated the valuation allowance against the net deferred tax asset which would require future taxable income in order to be utilized. The Corporation, as of December 31, 2007 had a net operating loss and tax credit carryforwards for tax purposes of approximately $34.2 million, and $2.1 million, respectively.
The Corporation utilized NOL carryforwards to offset taxable income for the first nine months of 2007. In the third quarter of 2007, the Corporation reversed a portion of the valuation allowance, $7.500 million that pertained to the deferred tax benefit of NOL and tax credit carryforwards. This valuation adjustment was recorded as a current period income tax benefit. In 2006, the Corporation recorded a $500,000 tax benefit and utilized additional NOL carryforwards to offset current taxable income. The recognition of the deferred tax benefit in 2007 and 2006 was in accordance with generally accepted accounting principles, and considered among other things, the probability of utilizing the NOL and credit carryforwards.
The Corporation recorded the future benefits from these carryforwards at such time as it became “more likely than not” that they would be utilized prior to expiration. Please refer to further discussion on income taxes contained in “Management’s Discussion and Analysis.” The net operating loss carryforwards expire twenty years from the date they originated. These carryforwards, if not utilized, will begin to expire in the year 2023. A portion of the NOL, approximately $22 million, and all of the credit carryforwards are subject to the limitations for utilization as set forth in Section 382 of the Internal Revenue Code. The annual limitation is $1.4 million for the NOL and the equivalent value of tax credits, which is approximately $.477 million. These limitations for use were established in conjunction with the recapitalization of the Corporation in December, 2004.
30
Notes to Consolidated Financial Statements
MACKINAC FINANCIAL CORPORATION AND SUBSIDIARIES
NOTE 13 — OPERATING LEASES
The Corporation leases space for one branch office. The lease is classified as an operating lease. The operating lease for our branch office in Birmingham, which originated in September 2005, had an original term of 66 months with an option to renew for an additional five year period. Future minimum payments, by year and in the aggregate, under the non-cancelable operating leases with initial or remaining terms in excess of one year, consisted of the following (dollars in thousands):
| | | | | |
| 2008 | | $ | 179 | |
| 2009 | | | 179 | |
| 2010 | | | 179 | |
| 2011 | | | 54 | |
| | | | |
| | | | | |
| Total | | $ | 591 | |
| | | | |
Rent expense for all operating leases amounted to $141,000 in 2007, $182,000 in 2006, and $91,000 in 2005.
NOTE 14 — RETIREMENT PLAN
The Corporation has established a 401(k) profit sharing plan. Employees who have completed three months of service and attained the age of 18 are eligible to participate in the plan. Eligible employees can elect to have a portion, not to exceed 80%, of their annual compensation paid into the plan. In addition, the Corporation may make discretionary contributions into the plan. Retirement plan contributions charged to operations totaled $112,000, $70,000, and $107,000 in 2007, 2006, and 2005, respectively.
NOTE 15 — DEFERRED COMPENSATION PLANS
As an incentive to retain key members of management and directors, the Corporation established a deferred compensation plan, with benefits based on the number of years the individuals have served the Corporation. This plan was discontinued and no longer applies to current officers and directors. A liability was recorded on a present value basis and discounted using the rates in effect at the time the deferred compensation agreement was entered into. The liability may change depending upon changes in long-term interest rates. The liability at December 31, 2007 and 2006, for vested benefits under this plan was $1,028,000 and $1,135,000 respectively. These benefits were originally contracted to be paid over a ten to fifteen-year period. The final payment is scheduled to occur in 2027. The deferred compensation plan is unfunded, however; the Bank maintains life insurance policies on the majority of the plan participants. The cash surrender value of the policies was $1,332,000 and $1,251,000 at December 31, 2007 and 2006, respectively. Deferred compensation expense for the plan was $90,000, $85,000, and $120,000 for 2007, 2006, and 2005 respectively.
NOTE 16 — REGULATORY MATTERS
The Corporation is subject to various regulatory capital requirements administered by the federal banking agencies. Failure to meet minimum capital requirements can initiate certain mandatory—and possibly additional discretionary—actions by regulators that, if undertaken, could have a direct material effect on the Corporation’s consolidated financial statements. Under capital adequacy guidelines and the regulatory framework for prompt corrective action, the Corporation must meet specific capital guidelines that involve quantitative measures of the Corporation’s assets, liabilities, and certain off-balance-sheet items as calculated under regulatory accounting practices. The Corporation’s capital amounts and classification are also subject to qualitative judgments by the regulators about components, risk weightings, and other factors.
Quantitative measures established by regulation to ensure capital adequacy require the Corporation to maintain minimum amounts and ratios (set forth in the table below) of total and Tier 1 capital to risk-weighted assets and of Tier 1 capital to average assets. Management has determined that, as of December 31, 2007, the Corporation is well capitalized.
31
Notes to Consolidated Financial Statements
MACKINAC FINANCIAL CORPORATION AND SUBSIDIARIES
NOTE 16 — REGULATORY MATTERS(CONTINUED)
To be categorized as well capitalized the Bank must maintain minimum total risk-based, Tier 1 risk-based, and Tier 1 leverage ratios as set forth in the table. In addition, federal banking regulators have established capital classifications beyond the minimum requirements in order to risk-rate deposit insurance premiums and to provide trigger points for prompt corrective action.
The Corporation’s and the Bank’s actual and required capital amounts and ratios as of December 31 (dollars in thousands) are as follows:
| | | | | | | | | | | | | | | | | | | | | | | | | | | | | | | | | | | | | |
| | | | | | | | | | | | | | | | | | | | | | | | | | | To Be Well |
| | | | | | | | | | | | | | | | | | | | | | | | | | | Capitalized Under |
| | | | | | | | | | | | | | | For Capital | | | | | | Prompt Corrective |
| | | Actual | | | | | | Adequacy Purposes | | | | | | Action Provisions |
| | | Amount | | Ratio | | | | | | Amount | | Ratio | | | | | | Amount | | | | | | Ratio |
2007 | | | | | | | | | | | | | | | | | | | | | | | | | | | | | | | | | | | | |
Total capital (to risk-weighted assets): | | | | | | | | | | | | | | | | | | | | | | | | | | | | | | | | | | | | |
Consolidated | | $ | 36,293 | | | | 10.1 | % | | | ³ | | | $ | 28,673 | | | ³ | 8.0 | % | | | | | | | N/A | | | | | | | | | |
mBank | | $ | 38,048 | | | | 10.6 | % | | | ³ | | | $ | 28,629 | | | ³ | 8.0 | % | | | ³ | | | $ | 35,786 | | | | ³ | | | | 10.0 | % |
| | | | | | | | | | | | | | | | | | | | | | | | | | | | | | | | | | | | | |
Tier 1 capital (to risk-weighted assets): | | | | | | | | | | | | | | | | | | | | | | | | | | | | | | | | | | | | |
Consolidated | | $ | 32,147 | | | | 9.0 | % | | | ³ | | | $ | 14,336 | | | ³ | 4.0 | % | | | | | | | N/A | | | | | | | | | |
mBank | | $ | 33,950 | | | | 9.5 | % | | | ³ | | | $ | 14,315 | | | ³ | 4.0 | % | | | ³ | | | $ | 21,472 | | | | ³ | | | | 6.0 | % |
| | | | | | | | | | | | | | | | | | | | | | | | | | | | | | | | | | | | | |
Tier 1 capital (to average assets): | | | | | | | | | | | | | | | | | | | | | | | | | | | | | | | | | | | | |
Consolidated | | $ | 32,147 | | | | 8.1 | % | | | ³ | | | $ | 15,967 | | | ³ | 4.0 | % | | | | | | | N/A | | | | | | | | | |
mBank | | $ | 33,950 | | | | 8.5 | % | | | ³ | | | $ | 15,951 | | | ³ | 4.0 | % | | | ³ | | | $ | 19,938 | | | | ³ | | | | 5.0 | % |
| | | | | | | | | | | | | | | | | | | | | | | | | | | | | | | | | | | | | |
2006 | | | | | | | | | | | | | | | | | | | | | | | | | | | | | | | | | | | | |
| Total capital (to risk-weighted assets): | | | | | | | | | | | | | | | | | | | | | | | | | | | | | | | | | | | | |
| Consolidated | | $ | 32,885 | | | | 10.0 | % | | | ³ | | | $ | 26,251 | | | ³ | 8.0 | % | | | | | | | N/A | | | | | | | | | |
| mBank | | $ | 34,557 | | | | 10.6 | % | | | ³ | | | $ | 26,167 | | | ³ | 8.0 | % | | | ³ | | | $ | 32,708 | | | | ³ | | | | 10.0 | % |
| | | | | | | | | | | | | | | | | | | | | | | | | | | | | | | | | | | | | |
| Tier 1 capital (to risk-weighted assets): | | | | | | | | | | | | | | | | | | | | | | | | | | | | | | | | | | | | |
| Consolidated | | $ | 28,772 | | | | 8.8 | % | | | ³ | | | $ | 13,125 | | | ³ | 4.0 | % | | | | | | | N/A | | | | | | | | | |
| mBank | | $ | 30,457 | | | | 9.3 | % | | | ³ | | | $ | 13,083 | | | ³ | 4.0 | % | | | ³ | | | $ | 19,625 | | | | ³ | | | | 6.0 | % |
| | | | | | | | | | | | | | | | | | | | | | | | | | | | | | | | | | | | | |
| Tier 1 capital (to average assets): | | | | | | | | | | | | | | | | | | | | | | | | | | | | | | | | | | | | |
| Consolidated | | $ | 28,772 | | | | 7.9 | % | | | ³ | | | $ | 14,654 | | | ³ | 4.0 | % | | | | | | | N/A | | | | | | | | | |
| mBank | | $ | 30,457 | | | | 8.3 | % | | | ³ | | | $ | 14,626 | | | ³ | 4.0 | % | | | ³ | | | $ | 18,282 | | | | ³ | | | | 5.0 | % |
At December 31, 2007, the Bank was not authorized to pay dividends to the Corporation without prior regulatory approval because of a negative retained earnings balance due to cumulative losses.
32
Notes to Consolidated Financial Statements
MACKINAC FINANCIAL CORPORATION AND SUBSIDIARIES
NOTE 17 — STOCK OPTION PLANS
The Corporation sponsors three stock option plans. All historical information presented below has been adjusted to reflect the 1 for 20 reverse stock split which occurred on December 16, 2004. One plan was approved during 2000 and applies to officers, employees, and non-employee directors. A total of 25,000 shares were made available for grant under this plan. This plan was amended as a part of the recapitalization to provide for additional authorized shares equal to 12.50% of all outstanding shares subsequent to the recapitalization, which amounted to 428,587 shares. The other two plans, one for officers and employees and the other for non-employee directors, were approved in 1997. A total of 30,000 shares were made available for grant under these plans. Options under all of the plans are granted at the discretion of a committee of the Corporation’s Board of Directors. Options to purchase shares of the Corporation’s stock are granted at a price equal to the market price of the stock at the date of grant. The committee determines the vesting of the options when they are granted as established under the plan.
The fair value of each option granted is estimated on the grant date using the Black-Scholes methodology. The following assumptions were made in estimating fair value for options granted for the years ended December 31, 2007, 2006 and 2005. The weighted average fair value of options granted as of their grant date, along with the assumptions used for each grant, is shown below for options granted in 2006 and 2005. There were no options granted in 2007.
| | | | | | | | | |
| | | 2006 | | 2005 |
| Shares granted | | | 72,500 | | | | 112,500 | |
| Weighted average exercise price | | $ | 10.65 | | | $ | 11.49 | |
| Dividend yield | | | 0.00 | % | | | 0.00 | % |
| Weighted average risk-free interest rate | | | 4.30 | % | | | 3.96 | % |
| Weighted average expected life (years) | | | 4.0 | | | | 4.0 | |
| Weighted average volatility | | | 20.00 | % | | | 28.00 | % |
| Weighted average fair value per share | | $ | 2.53 | | | $ | 3.36 | |
A summary of stock option transactions for the years ended December 31 is as follows:
| | | | | | | | | | | | | |
| | | 2007 | | | 2006 | | | 2005 | |
| Outstanding shares at beginning of year | | | 446,417 | | | | 375,417 | | | | 282,999 | |
| Granted during the year | | | — | | | | 72,500 | | | | 112,500 | |
| Expired / forfeited during the year | | | — | | | | (1,500 | ) | | | (20,082 | ) |
| | | | | | | | | | |
| | | | | | | | | | | | | |
| Outstanding shares at end of year | | | 446,417 | | | | 446,417 | | | | 375,417 | |
| | | | | | | | | | |
| | | | | | | | | | | | | |
| Exercisable shares at end of year | | | 164,626 | | | | 164,626 | | | | 149,126 | |
| | | | | | | | | | |
| | | | | | | | | | | | | |
| Weighted average exercise price per share at end of year | | $ | 12.29 | | | $ | 12.29 | | | $ | 14.15 | |
| | | | | | | | | | |
| | | | | | | | | | | | | |
| Shares available for grant at end of year | | | 18,488 | | | | 18,488 | | | | 89,488 | |
| | | | | | | | | | |
There were no options granted in 2007. The options granted in 2006, 72,500 shares, and in 2005, 112,500 shares, were granted at an exercise price which equaled market value at the date of grant.
33
Notes to Consolidated Financial Statements
MACKINAC FINANCIAL CORPORATION AND SUBSIDIARIES
NOTE 17 — STOCK OPTION PLANS (CONTINUED)
Following is a summary of the options outstanding and exercisable at December 31, 2007:
| | | | | | | | | | | | | | | | | |
| | | | | | | | | | | Weighted | | | | |
| | | | | | | | | | | Average | | | Weighted | |
| | | | | | | | | | | Remaining | | | Average | |
| Exercise | | Number of Shares | | | Contractual | | | Exercise | |
| Price Range | | Outstanding | | | Exercisable | | | Life-Years | | | Price | |
| $9.16 | | | 12,500 | | | | 5,000 | | | | 8.0 | | | $ | 9.16 | |
| $9.75 | | | 257,152 | | | | 120,861 | | | | 7.0 | | | | 9.75 | |
| $10.65 | | | 72,500 | | | | 14,500 | | | | 9.0 | | | | 10.65 | |
| $11.50 | | | 40,000 | | | | 8,000 | | | | 7.8 | | | | 11.50 | |
| $12.00 | | | 60,000 | | | | 12,000 | | | | 2.5 | | | | 12.00 | |
| $156.00 - $240.00 | | | 3,545 | | | | 3,545 | | | | 1.3 | | | | 186.75 | |
| $300.00 - $400.00 | | | 720 | | | | 720 | | | | 1.5 | | | | 345.00 | |
| | | | | | | | | | | | | |
| | | | | | | | | | | | | | | | | |
| | | | 446,417 | | | | 164,626 | | | | 7.4 | | | $ | 12.29 | |
| | | | | | | | | | | | | |
Options issued since the Corporation’s recapitalization in December of 2004 call for 20% immediate vesting upon issue and subsequent vesting to occur over a two to five year period, based upon the market value appreciation of the underlying Corporation’s stock. Compensation related to these options is expensed based upon the vesting period without consideration given to market value appreciation. Future compensation for all outstanding options is projected to total $84,210 in 2008, $82,210 in 2009 and $36,685 in 2010.
NOTE 18 — OTHER COMPREHENSIVE INCOME (LOSS)
Other comprehensive income (loss) components and related taxes for the years ended December 31 were as follows (dollars in thousands):
| | | | | | | | | | | | | |
| | | 2007 | | | 2006 | | | 2005 | |
| Unrealized holding gains (losses) on available for sale securities | | $ | 248 | | | $ | 177 | | | $ | (760 | ) |
| Less reclassification adjustments for gains (losses) later recognized in income | | | (1 | ) | | | (1 | ) | | | (95 | ) |
| | | | | | | | | | |
| Net unrealized gains (losses) | | | 247 | | | | 176 | | | | (855 | ) |
| Tax effect | | | — | | | | — | | | | — | |
| | | | | | | | | | |
| | | | | | | | | | | | | |
| Other comprehensive income (loss) | | $ | 247 | | | $ | 176 | | | $ | (855 | ) |
| | | | | | | | | | |
NOTE 19 — COMMITMENTS, CONTINGENCIES, AND CREDIT RISK
Financial Instruments with Off-Balance-Sheet Risk
The Corporation is a party to financial instruments with off-balance-sheet risk in the normal course of business to meet the financing needs of its customers. These financial instruments include commitments to extend credit and standby letters of credit. Those instruments involve, to varying degrees, elements of credit risk in excess of the amount recognized in the consolidated balance sheets.
34
Notes to Consolidated Financial Statements
MACKINAC FINANCIAL CORPORATION AND SUBSIDIARIES
NOTE 19 — COMMITMENTS, CONTINGENCIES, AND CREDIT RISK (CONTINUED)
The Corporation’s exposure to credit loss, in the event of nonperformance by the other party to the financial instrument for commitments to extend credit and standby letters of credit, is represented by the contractual amount of those instruments. The Corporation uses the same credit policies in making commitments and conditional obligations as it does for on-balance-sheet instruments. These commitments at December 31 (dollars in thousands) are as follows:
| | | | | | | | | |
| | | 2007 | | | 2006 | |
| Commitments to extend credit: | | | | | | | | |
| Variable rate | | $ | 43,903 | | | $ | 44,141 | |
| Fixed rate | | | 8,055 | | | | 9,288 | |
| Standby letters of credit — Variable rate | | | 5,930 | | | | 6,233 | |
| Credit card commitments — Fixed rate | | | 2,414 | | | | 2,391 | |
| | | | | | | |
| | | | | | | | | |
| | | $ | 60,302 | | | $ | 62,053 | |
| | | | | | | |
Commitments to extend credit are agreements to lend to a customer as long as there is no violation of any condition established in the contract. Commitments generally have fixed expiration dates or other termination clauses and may require payment of a fee. Since many of the commitments are expected to expire without being drawn upon, the total commitment amounts do not necessarily represent future cash requirements. The Corporation evaluates each customer’s creditworthiness on a case-by-case basis. The amount of collateral obtained, if deemed necessary by the Corporation upon extension of credit, is based on management’s credit evaluation of the party. Collateral held varies, but may include accounts receivable, inventory, property, plant and equipment, and income-producing commercial properties.
Standby letters of credit are irrevocable commitments issued by the Corporation to guarantee the performance of a customer
to a third party. Those guarantees are primarily issued to support public and private borrowing arrangements. The credit risk involved in issuing letters of credit is essentially the same as that involved in extending loan facilities to customers. The commitments are structured to allow for 100% collateralization on all standby letters of credit.
Credit card commitments are commitments on credit cards issued by the Corporation’s subsidiary and serviced by other companies. These commitments are unsecured.
Contingencies
In the normal course of business the Corporation is involved in various legal proceedings. For expanded discussion on the Corporation’s legal proceedings, see Note 22.
Concentration of Credit Risk
The Bank grants commercial, residential, agricultural, and consumer loans throughout Michigan. The Bank’s most prominent concentration in the loan portfolio relates to commercial real estate loans. This concentration at December 31, 2007 represents $41.6 million, or 14.4%, compared to $44.3 million, or 19.6%, of the commercial loan portfolio on December 31, 2006. The remainder of the commercial loan portfolio is diversified in such categories as hospitality and tourism, real estate agents and managers, new car dealers, gaming, petroleum, forestry, and agriculture. Due to the diversity of the Bank’s locations, the ability of debtors of residential and consumer loans to honor their obligations is not tied to any particular economic sector.
35
Notes to Consolidated Financial Statements
MACKINAC FINANCIAL CORPORATION AND SUBSIDIARIES
NOTE 20 — FAIR VALUE OF FINANCIAL INSTRUMENTS
Fair value estimates, methods, and assumptions are set forth below for the Corporation’s financial instruments:
Cash, cash equivalents, and interest-bearing deposits- The carrying values approximate the fair values for these assets.
Securities- Fair values are based on quoted market prices where available. If a quoted market price is not available, fair value is estimated using quoted market prices for similar securities.
Federal Home Loan Bank stock- Federal Home Loan Bank stock is carried at cost, which is its redeemable value and approximates its fair value, since the market for this stock is limited.
Loans- Fair values are estimated for portfolios of loans with similar financial characteristics. Loans are segregated by type such as commercial, residential mortgage, and other consumer. The fair value of loans is calculated by discounting scheduled cash flows using discount rates reflecting the credit and interest rate risk inherent in the loan.
The methodology in determining fair value of nonaccrual loans is to average them into the blended interest rate at 0% interest. This has the effect of decreasing the carrying amount below the risk-free rate amount and, therefore, discounts the estimated fair value.
Impaired loans are measured at the estimated fair value of the expected future cash flows at the loan’s effective interest rate or the fair value of the collateral for loans which are collateral dependent. Therefore, the carrying values of impaired loans approximate the estimated fair values for these assets.
Deposits- The fair value of deposits with no stated maturity, such as noninterest-bearing demand deposits and savings, is equal to the amount payable on demand at the reporting date. The fair value of time deposits is based on the discounted value of contractual cash flows applying interest rates currently being offered on similar time deposits.
Borrowings- Rates currently available for debt with similar terms and remaining maturities are used to estimate the fair value of existing debt. The fair value of borrowed funds due on demand is the amount payable at the reporting date.
Accrued interest- The carrying amount of accrued interest approximates fair value.
Off-balance-sheet instruments- The fair value of commitments is estimated using the fees currently charged to enter into similar agreements, taking into account the remaining terms of the agreements, the current interest rates, and the present creditworthiness of the counterparties. Since the differences in the current fees and those reflected to the off-balance-sheet instruments at year-end are immaterial, no amounts for fair value are presented.
36
Notes to Consolidated Financial Statements
MACKINAC FINANCIAL CORPORATION AND SUBSIDIARIES
NOTE 20 — FAIR VALUE OF FINANCIAL INSTRUMENTS(CONTINUED)
The following table presents information for financial instruments at December 31 (dollars in thousands):
| | | | | | | | | | | | | | | | | |
| | | 2007 | | | 2006 | |
| | | Carrying | | | Estimated | | | Carrying | | | Estimated | |
| | | Amount | | | Fair Value | | | Amount | | | Fair Value | |
| Financial assets: | | | | | | | | | | | | | | | | |
| Cash and cash equivalents | | $ | 6,362 | | | $ | 6,362 | | | $ | 10,706 | | | $ | 10,706 | |
| Interest-bearing deposits | | | 1,810 | | | | 1,810 | | | | 856 | | | | 856 | |
| Securities available for sale | | | 21,597 | | | | 21,597 | | | | 32,769 | | | | 32,769 | |
| Federal Home Loan Bank stock | | | 3,794 | | | | 3,794 | | | | 3,794 | | | | 3,794 | |
| Net loans | | | 350,933 | | | | 350,512 | | | | 317,575 | | | | 313,533 | |
| Cash surrender value — life insurance | | | 1,332 | | | | 1,332 | | | | 1,252 | | | | 1,252 | |
| Accrued interest receivable | | | 1,806 | | | | 1,806 | | | | 1,963 | | | | 1,963 | |
| | | | | | | | | | | | | |
| | | | | | | | | | | | | | | | | |
| Total financial assets | | $ | 387,634 | | | $ | 387,213 | | | $ | 368,915 | | | $ | 364,873 | |
| | | | | | | | | | | | | |
| | | | | | | | | | | | | | | | | |
| Financial liabilities: | | | | | | | | | | | | | | | | |
| Deposits | | $ | 320,827 | | | $ | 319,213 | | | $ | 312,421 | | | $ | 309,591 | |
| Borrowings | | | 45,949 | | | | 46,111 | | | | 38,307 | | | | 37,597 | |
| Directors deferred compensation | | | 1,028 | | | | 1,028 | | | | 1,135 | | | | 1,135 | |
| Accrued interest payable | | | 751 | | | | 751 | | | | 919 | | | | 919 | |
| | | | | | | | | | | | | |
| | | | | | | | | | | | | | | | | |
| Total financial liabilities | | $ | 368,555 | | | $ | 367,103 | | | $ | 352,782 | | | $ | 349,242 | |
| | | | | | | | | | | | | |
Limitations-Fair value estimates are made at a specific point in time based on relevant market information and information about the financial instrument. These estimates do not reflect any premium or discount that could result from offering for sale at one time the Corporation’s entire holdings of a particular financial instrument. Because no market exists for a significant portion of the Corporation’s financial instruments, fair value estimates are based on judgments regarding future expected loss experience, current economic conditions, risk characteristics of various financial instruments, and other factors. These estimates are subjective in nature and involve uncertainties and matters of significant judgment and therefore cannot be determined with precision. Changes in assumptions could significantly affect the estimates. Fair value estimates are based on existing on- and off-balance-sheet financial instruments without attempting to estimate the value of anticipated future business and the value of assets and liabilities that are not considered financial instruments. Significant assets and liabilities that are not considered financial assets or liabilities include premises and equipment, other assets, and other liabilities. In addition, the tax ramifications related to the realization of the unrealized gains and losses can have a significant effect on fair value estimates and have not been considered in the estimates.
37
Notes to Consolidated Financial Statements
MACKINAC FINANCIAL CORPORATION AND SUBSIDIARIES
NOTE 21 — PARENT COMPANY ONLY FINANCIAL STATEMENTS
BALANCE SHEETS
December 31, 2007 and 2006
(Dollars in Thousands)
| | | | | | | | | |
| | | 2007 | | | 2006 | |
ASSETS | | | | | | | | |
| Cash and cash equivalents | | $ | 119 | | | $ | 223 | |
| Investment in subsidiaries | | | 41,198 | | | | 30,635 | |
| Other assets | | | 78 | | | | 64 | |
| | | | | | | |
| | | | | | | | | |
| TOTAL ASSETS | | $ | 41,395 | | | $ | 30,922 | |
| | | | | | | |
| | | | | | | | | |
LIABILITIES AND SHAREHOLDERS’ EQUITY | | | | | | | | |
| | | | | | | | | |
| Borrowings | | $ | 1,959 | | | $ | 1,959 | |
| Other liabilities | | | 115 | | | | 173 | |
| Shareholders’ equity | | | 39,321 | | | | 28,790 | |
| | | | | | | |
| | | | | | | | | |
| TOTAL LIABILITIES AND SHAREHOLDERS’ EQUITY | | $ | 41,395 | | | $ | 30,922 | |
| | | | | | | |
38
Notes to Consolidated Financial Statements
MACKINAC FINANCIAL CORPORATION AND SUBSIDIARIES
NOTE 21 — PARENT COMPANY ONLY FINANCIAL STATEMENTS(CONTINUED)
STATEMENTS OF OPERATIONS
Years Ended December 31, 2007, 2006, and 2005
(Dollars in Thousands)
| | | | | | | | | | | | | |
| | | 2007 | | | 2006 | | | 2005 | |
INCOME: | | | | | | | | | | | | |
| Other | | $ | 482 | | | $ | 39 | | | $ | 34 | |
| | | | | | | | | | |
| | | | | | | | | | | | | |
| Total income | | | 482 | | | | 39 | | | | 34 | |
| | | | | | | | | | |
| | | | | | | | | | | | | |
EXPENSES: | | | | | | | | | | | | |
| Salaries and benefits | | | 300 | | | | 489 | | | | 120 | |
| Interest | | | 160 | | | | 68 | | | | — | |
| Professional service fees | | | 96 | | | | 728 | | | | 302 | |
| Other | | | 127 | | | | 137 | | | | 196 | |
| | | | | | | | | | |
| | | | | | | | | | | | | |
| Total expenses | | | 683 | | | | 1,422 | | | | 618 | |
| | | | | | | | | | |
| | | | | | | | | | | | | |
| Income (loss) before credit for income taxes and equity in undistributed net income (loss) of subsidiaries | | | (201 | ) | | | (1,383 | ) | | | (584 | ) |
| | | | | | | | | | |
| | | | | | | | | | | | | |
| Provision for (benefit of) income taxes | | | (50 | ) | | | — | | | | — | |
| | | | | | | | | | |
| | | | | | | | | | | | | |
| Income (loss) before equity in undistributed net income (loss) of subsidiaries | | | (151 | ) | | | (1,383 | ) | | | (584 | ) |
| Equity in undistributed net income (loss) of subsidiaries | | | 10,314 | | | | 3,099 | | | | (6,780 | ) |
| | | | | | | | | | |
| | | | | | | | | | | | | |
NET INCOME (LOSS) | | $ | 10,163 | | | $ | 1,716 | | | $ | (7,364 | ) |
| | | | | | | | | | |
39
Notes to Consolidated Financial Statements
MACKINAC FINANCIAL CORPORATION AND SUBSIDIARIES
NOTE 21 — PARENT COMPANY ONLY FINANCIAL STATEMENTS (CONTINUED)
STATEMENTS OF CASH FLOWS
Years Ended December 31, 2007, 2006, and 2005
(Dollars in Thousands)
| | | | | | | | | | | | | |
| | | 2007 | | | 2006 | | | 2005 | |
Cash Flows from Operating Activities: | | | | | | | | | | | | |
| Net income (loss) | | $ | 10,163 | | | $ | 1,716 | | | $ | (7,364 | ) |
| Adjustments to reconcile net income (loss) to net cash provided by operating activities: | | | | | | | | | | | | |
| Equity in undistributed net income (loss) of subsidiaries | | | (10,314 | ) | | | (3,099 | ) | | | 6,780 | |
| Change in other assets | | | (14 | ) | | | (11 | ) | | | (27 | ) |
| Change in other liabilities | | | (58 | ) | | | 125 | | | | (850 | ) |
| | | | | | | | | | |
| Net cash (used in) operating activities | | | (223 | ) | | | (1,269 | ) | | | (1,461 | ) |
| | | | | | | | | | |
| | | | | | | | | | | | | |
Cash Flows from Financing Activities: | | | | | | | | | | | | |
| Increase in borrowings | | | — | | | | 1,959 | | | | — | |
| Increase in capital from stock option compensation | | | 119 | | | | 310 | | | | | |
| Investments in subsidiaries | | | — | | | | (1,950 | ) | | | 321 | |
| | | | | | | | | | |
| Net cash provided by financing activities | | | 119 | | | | 319 | | | | 321 | |
| | | | | | | | | | |
| | | | | | | | | | | | | |
| Net (decrease) in cash and cash equivalents | | | (104 | ) | | | (950 | ) | | | (1,140 | ) |
| Cash and cash equivalents at beginning of period | | | 223 | | | | 1,173 | | | | 2,313 | |
| | | | | | | | | | |
| | | | | | | | | | | | | |
| Cash and cash equivalents at end of period | | $ | 119 | | | $ | 223 | | | $ | 1,173 | |
| | | | | | | | | | |
NOTE 22 — LEGAL PROCEEDINGS
The Corporation and its subsidiaries are subject to routine litigation incidental to the business of banking. The litigation that is not routine and incidental to the business of banking is described below.
Shareholder’s Derivative Litigation
Damon Trust v. Bittner, et al.
In an action styledVirginia M. Damon Trust v. North Country Financial Corporation, Nominal Defendant, and Dennis Bittner, Bernard A. Bouschor, Ronald G. Ford, Sherry L. Littlejohn, Stanley J. Gerou II, John D. Lindroth, Stephen Madigan, Spencer Shunk, Michael Hendrickson, Glen Tolksdorf, and Wesley Hoffman, filed in the U.S. District Court for the Western District of Michigan on July 1, 2003, a shareholder of the Corporation has brought a shareholder’s derivative action under Section 27 of the Exchange Act against the Corporation and certain of its current and former directors and senior executive officers.
On November 11, 2003, the Corporation filed a motion, as permitted by section 495 of the MBCA, M.C.L.§ 450.1495, requesting the Court to appoint a disinterested person to conduct a reasonable investigation of the claims made by the plaintiff and to make a good faith determination whether the maintenance of the derivative action is in the best interests of the Corporation. After additional written submissions to the Court by the defendants and the plaintiff concerning the issues presented by this motion, and after several conferences with the Court, on May 20, 2004, the Court entered an Order adopting the parties’ written stipulations concerning the appointment of a disinterested person and the manner of conducting the investigation of the claims made by the plaintiff and making recommendations as to whether the maintenance of the
40
Notes to Consolidated Financial Statements
MACKINAC FINANCIAL CORPORATION AND SUBSIDIARIES
NOTE 22 — LEGAL PROCEEDINGS (CONTINUED)
derivative action is in the best interests of the Corporation. The Corporation is a named “nominal” defendant which requires the Corporation to cooperate with the defendants’ defense of the plaintiff’s action. The Corporation is assisting the defendants in the discovery phase of this litigation and is incurring legal fees as a consequence of that cooperation. However, in total, the Corporation’s primary purpose will be to monitor the process of this legal action and the Corporation does not expect to incur substantial legal fees related to the case.
Damon Trust v. Wipfli
On August 27, 2004, a second shareholder’s derivative action, styledVirginia M. Damon Trust v. Wipfli Ullrich Bertelson, LLP, and North Country Financial Corporation, Nominal Defendant, was filed in the Michigan Circuit Court for Grand Traverse County by the same shareholder which brought the derivative action discussed above.
In an Order dated September 29, 2005, the Court realigned the Corporation as the plaintiff and made the Corporation exclusively responsible for prosecuting all further aspects of the case, including any settlement. In the same Order, the Court stated that the Virginia M. Damon Trust would remain as a nominal plaintiff in the case, entitled to notice.
This matter has been resolved and concluded with the Corporation receiving $470,000 in settlement proceeds.
41
Selected Financial Data
MACKINAC FINANCIAL CORPORATION AND SUBSIDIARIES
SELECTED FINANCIAL DATA
(Unaudited)
(Dollars in Thousands, Except Per Share Data)
| | | | | | | | | | | | | | | | | | | | | |
| | | Years Ended December 31 | |
| | | 2007 | | | 2006 | | | 2005 | | | 2004 | | | 2003 | |
SELECTED FINANCIAL CONDITION DATA: | | | | | | | | | | | | | | | | | | | | |
| Total assets | | $ | 408,880 | | | $ | 382,791 | | | $ | 298,722 | | | $ | 339,497 | | | $ | 422,539 | |
| Loans | | | 355,079 | | | | 322,581 | | | | 239,771 | | | | 203,832 | | | | 297,846 | |
| Securities | | | 21,597 | | | | 32,769 | | | | 34,210 | | | | 57,075 | | | | 84,774 | |
| Deposits | | | 320,827 | | | | 312,421 | | | | 232,632 | | | | 215,650 | | | | 305,794 | |
| Borrowings | | | 45,949 | | | | 38,307 | | | | 36,417 | | | | 85,039 | | | | 87,026 | |
| Total equity | | | 39,321 | | | | 28,790 | | | | 26,588 | | | | 34,730 | | | | 10,700 | |
| | | | | | | | | | | | | | | | | | | | | |
SELECTED OPERATIONS DATA: | | | | | | | | | | | | | | | | | | | | |
| Interest income | | $ | 28,695 | | | $ | 24,052 | | | $ | 16,976 | | | $ | 18,853 | | | $ | 23,641 | |
| Interest expense | | | (15,278 | ) | | | (12,459 | ) | | | (7,196 | ) | | | (10,615 | ) | | | (14,015 | ) |
| | | | | | | | | | | | | | | | |
| Net interest income | | | 13,417 | | | | 11,593 | | | | 9,780 | | | | 8,238 | | | | 9,626 | |
| Provision for loan losses | | | 400 | | | | (861 | ) | | | — | | | | — | | | | — | |
| Net security gains (losses) | | | (1 | ) | | | (1 | ) | | | 95 | | | | — | | | | 427 | |
| Other income | | | 2,007 | | | | 984 | | | | 1,016 | | | | 8,542 | | | | 2,804 | |
| Impairment loss on intangibles | | | — | | | | — | | | | — | | | | — | | | | (60 | ) |
| Other expenses | | | (12,100 | ) | | | (12,221 | ) | | | (18,255 | ) | | | (18,228 | ) | | | (20,056 | ) |
| | | | | | | | | | | | | | | | |
| Income (loss) before income taxes | | | 2,923 | | | | 1,216 | | | | (7,364 | ) | | | (1,448 | ) | | | (7,259 | ) |
| Provision (credit) for income taxes | | | (7,240 | ) | | | (500 | ) | | | — | | | | 147 | | | | 2,329 | |
| | | | | | | | | | | | | | | | |
| | | | | | | | | | | | | | | | | | | | | |
| Net income (loss) | | $ | 10,163 | | | $ | 1,716 | | | $ | (7,364 | ) | | $ | (1,595 | ) | | $ | (9,588 | ) |
| | | | | | | | | | | | | | | | |
| | | | | | | | | | | | | | | | | | | | | |
PER SHARE DATA: | | | | | | | | | | | | | | | | | | | | |
| Earnings (loss) — Basic | | $ | 2.96 | | | $ | .50 | | | $ | (2.15 | ) | | $ | (3.23 | ) | | $ | (27.32 | ) |
| Earnings (loss) — Diluted | | | 2.96 | | | | .50 | | | | (2.15 | ) | | | (3.23 | ) | | | (27.32 | ) |
| Cash dividends declared | | | — | | | | — | | | | — | | | | — | | | | — | |
| Book value | | | 11.47 | | | | 8.40 | | | | 7.75 | | | | 10.13 | | | | 30.40 | |
| Market value — closing price at year end | | | 8.98 | | | | 11.50 | | | | 9.10 | | | | 17.97 | | | | 35.00 | |
| | | | | | | | | | | | | | | | | | | | | |
FINANCIAL RATIOS: | | | | | | | | | | | | | | | | | | | | |
| Return on average equity | | | 31.05 | % | | | 6.19 | % | | | (25.63 | )% | | | (18.64 | )% | | | (59.15 | )% |
| Return on average assets | | | 2.59 | | | | .49 | | | | (2.58 | ) | | | (.44 | ) | | | (1.96 | ) |
| Dividend payout ratio | | | N/A | | | | N/A | | | | N/A | | | | N/A | | | | N/A | |
| Average equity to average assets | | | 8.34 | | | | 7.97 | | | | 10.05 | | | | 2.34 | | | | 3.32 | |
| Efficiency ratio | | | 79.46 | | | | 93.95 | | | | 160.43 | | | | 103.05 | | | | 150.82 | |
| Net interest margin | | | 3.60 | | | | 3.51 | | | | 3.64 | | | | 2.57 | | | | 2.25 | |
42
Summary Quarterly Information
MACKINAC FINANCIAL CORPORATION AND SUBSIDIARIES
SUMMARY QUARTERLY FINANCIAL INFORMATION
(Unaudited)
(Dollars in Thousands, Except per Share Data)
| | | | | | | | | | | | | | | | | | | | | | | | | | | | | | | | | | | | | |
| | | FOR THE QUARTER ENDED | | | | |
| | | 2007 | | 2006 | | | | |
| | | 12/31 | | 9/30 | | 6/30 | | 3/31 | | 12/31 | | 9/30 | | 6/30 | | 3/31 | | | | |
BALANCE SHEET | | | | | | | | | | | | | | | | | | | | | | | | | | | | | | | | | | | | |
| | | | | | | | | | | | | | | | | | | | | | | | | | | | | | | | | | | | | |
| Total loans | | $ | 355,079 | | | $ | 344,149 | | | $ | 338,896 | | | $ | 318,421 | | | $ | 322,605 | | | $ | 292,614 | | | $ | 283,110 | | | $ | 264,471 | | | | | |
| Allowance for loan losses | | | (4,146 | ) | | | (5,022 | ) | | | (4,920 | ) | | | (4,975 | ) | | | (5,006 | ) | | | (5,316 | ) | | | (5,415 | ) | | | (5,415 | ) | | | | |
| Total loans, net | | | 350,933 | | | | 339,127 | | | | 333,976 | | | | 313,446 | | | | 317,599 | | | | 287,298 | | | | 277,695 | | | | 259,056 | | | | | |
| Intangible assets | | | 124 | | | | 143 | | | | 163 | | | | 182 | | | | 205 | | | | 237 | | | | 268 | | | | 299 | | | | | |
| Total assets | | | 408,880 | | | | 401,213 | | | | 393,319 | | | | 375,644 | | | | 382,791 | | | | 363,191 | | | | 352,497 | | | | 334,591 | | | | | |
| Core deposits | | | 199,809 | | | | 218,638 | | | | 211,773 | | | | 201,529 | | | | 199,609 | | | | 195,774 | | | | 185,784 | | | | 183,438 | | | | | |
Noncore deposits(1) | | | 121,018 | | | | 102,733 | | | | 109,473 | | | | 102,883 | | | | 112,812 | | | | 97,720 | | | | 98,380 | | | | 84,516 | | | | | |
| Total deposits | | | 320,827 | | | | 321,371 | | | | 321,246 | | | | 304,412 | | | | 312,421 | | | | 293,494 | | | | 284,164 | | | | 267,954 | | | | | |
| Total borrowings | | | 45,949 | | | | 38,239 | | | | 38,307 | | | | 38,307 | | | | 38,307 | | | | 38,307 | | | | 37,617 | | | | 36,417 | | | | | |
| Total shareholders’ equity | | | 39,321 | | | | 38,697 | | | | 30,485 | | | | 29,932 | | | | 28,790 | | | | 28,226 | | | | 27,179 | | | | 27,173 | | | | | |
| Total shares outstanding | | | 3,428,695 | | | | 3,428,695 | | | | 3,428,695 | | | | 3,428,695 | | | | 3,428,695 | | | | 3,428,695 | | | | 3,428,695 | | | | 3,428,695 | | | | | |
| | | | | | | | | | | | | | | | | | | | | | | | | | | | | | | | | | | | | |
AVERAGE BALANCE SHEET | | | | | | | | | | | | | | | | | | | | | | | | | | |
| | | | | | | | | | | | | | | | | | | | | | | | | | | | | | | | | | | | | |
| Total loans | | $ | 350,050 | | | $ | 340,391 | | | $ | 324,721 | | | $ | 318,072 | | | $ | 301,508 | | | $ | 289,210 | | | $ | 273,686 | | | $ | 250,735 | | | | | |
| Allowance for loan losses | | | (4,719 | ) | | | (4,839 | ) | | | (4,972 | ) | | | (4,999 | ) | | | (5,129 | ) | | | (5,384 | ) | | | (5,428 | ) | | | (6,049 | ) | | | | |
| Total loans, net | | | 345,331 | | | | 335,552 | | | | 319,749 | | | | 313,073 | | | | 296,379 | | | | 283,826 | | | | 268,258 | | | | 244,686 | | | | | |
| Intangible assets | | | 133 | | | | 152 | | | | 172 | | | | 194 | | | | 220 | | | | 252 | | | | 284 | | | | 319 | | | | | |
| Total assets | | | 406,308 | | | | 400,105 | | | | 382,065 | | | | 380,403 | | | | 366,566 | | | | 362,632 | | | | 342,821 | | | | 319,007 | | | | | |
| Core deposits | | | 208,043 | | | | 217,500 | | | | 205,818 | | | | 200,965 | | | | 195,789 | | | | 192,881 | | | | 185,585 | | | | 180,281 | | | | | |
Noncore deposits(1) | | | 116,151 | | | | 109,793 | | | | 103,651 | | | | 108,654 | | | | 98,966 | | | | 103,727 | | | | 89,006 | | | | 71,440 | | | | | |
| Total deposits | | | 324,194 | | | | 327,293 | | | | 309,469 | | | | 309,619 | | | | 294,755 | | | | 296,608 | | | | 274,591 | | | | 251,721 | | | | | |
| Total borrowings | | | 39,876 | | | | 38,325 | | | | 39,209 | | | | 38,376 | | | | 39,187 | | | | 36,454 | | | | 37,610 | | | | 36,417 | | | | | |
| Total shareholders’ equity | | | 38,973 | | | | 32,184 | | | | 30,412 | | | | 29,254 | | | | 28,646 | | | | 28,041 | | | | 27,213 | | | | 27,055 | | | | | |
| | | | | | | | | | | | | | | | | | | | | | | | | | | | | | | | | | | | | |
ASSET QUALITY RATIOS | | | | | | | | | | | | | | | | | | | | | | | | | | |
| | | | | | | | | | | | | | | | | | | | | | | | | | | | | | | | | | | | | |
| Nonperforming loans/total loans | | | 1.13 | % | | | .92 | % | | | 1.49 | % | | | 1.53 | % | | | .91 | % | | | .71 | % | | | .16 | % | | | — | | | | % | |
| Nonperforming assets/total assets | | | 1.28 | | | | .90 | | | | 1.30 | | | | 1.33 | | | | .77 | | | | .58 | | | | .14 | | | | .28 | | | | | |
| Allowance for loan losses/total loans | | | 1.17 | | | | 1.46 | | | | 1.45 | | | | 1.56 | | | | 1.55 | | | | 1.82 | | | | 1.91 | | | | 2.05 | | | | | |
| Allowance for loan losses/nonperforming loans | | | 103.42 | | | | 158.32 | | | | 97.45 | | | | 102.32 | | | | 170.33 | | | | 257.43 | | | | 1,214.13 | | | | N/A | | | | | |
| Net charge-offs/average loans | | | .25 | | | | .09 | | | | .02 | | | | .01 | | | | .02 | | | | .03 | | | | — | | | | .04 | | | | | |
| | | | | | | | | | | | | | | | | | | | | | | | | | | | | | | | | | | | | |
CAPITAL ADEQUACY RATIOS | | | | | | | | | | | | | | | | | | | | | | | | | | |
| | | | | | | | | | | | | | | | | | | | | | | | | | | | | | | | | | | | | |
| Tier 1 leverage ratio | | | 8.05 | % | | | 8.03 | % | | | 7.97 | % | | | 7.85 | % | | | 7.85 | % | | | 7.81 | % | | | 8.04 | % | | | 8.54 | % | | | | |
| Tier 1 capital to risk weighted assets | | | 8.97 | | | | 9.03 | | | | 8.85 | | | | 9.16 | | | | 8.77 | | | | 9.36 | | | | 9.28 | | | | 9.74 | | | | | |
| Total capital to risk weighted assets | | | 10.13 | | | | 10.28 | | | | 10.10 | | | | 10.41 | | | | 10.02 | | | | 10.62 | | | | 10.54 | | | | 11.00 | | | | | |
| Average equity/average assets | | | 9.59 | | | | 8.04 | | | | 7.96 | | | | 7.69 | | | | 7.81 | | | | 7.73 | | | | 7.94 | | | | 8.48 | | | | | |
| Tangible equity/tangible assets | | | 9.59 | | | | 9.61 | | | | 7.71 | | | | 7.92 | | | | 7.47 | | | | 7.71 | | | | 7.64 | | | | 8.04 | | | | | |
| | |
| (1) | | Noncore deposits include brokered deposits and CDs greater than $100,000 |
43
Summary Quarterly Financial Information
MACKINAC FINANCIAL CORPORATION AND SUBSIDIARIES
SUMMARY QUARTERLY FINANCIAL INFORMATION
(Unaudited)
(Dollars in Thousands, Except per Share Data)
| | | | | | | | | | | | | | | | | | | | | | | | | | | | | | | | | |
| | | FOR THE QUARTER ENDED | |
| | | 2007 | | | 2006 | |
| | | 12/31 | | | 9/30 | | | 6/30 | | | 3/31 | | | 12/31 | | | 9/30 | | | 6/30 | | | 3/31 | |
INCOME STATEMENT | | | | | | | | | | | | | | | | | | | | | | | | | | | | | | | | |
| | | | | | | | | | | | | | | | | | | | | | | | | | | | | | | | | |
| Net interest income | | $ | 3,410 | | | $ | 3,560 | | | $ | 3,269 | | | $ | 3,178 | | | $ | 3,027 | | | $ | 2,952 | | | $ | 2,935 | | | $ | 2,679 | |
| Provision for loan losses | | | — | | | | 400 | | | | — | | | | — | | | | (261 | ) | | | — | | | | — | | | | (600 | ) |
| Net interest income after provision | | | 3,410 | | | | 3,160 | | | | 3,269 | | | | 3,178 | | | | 3,288 | | | | 2,952 | | | | 2,935 | | | | 3,279 | |
| Total noninterest income | | | 355 | | | | 396 | | | | 342 | | | | 913 | | | | 276 | | | | 240 | | | | 251 | | | | 216 | |
| Total noninterest expense | | | 2,978 | | | | 3,001 | | | | 3,065 | | | | 3,056 | | | | 3,226 | | | | 3,002 | | | | 2,996 | | | | 2,997 | |
| Income before taxes | | | 787 | | | | 555 | | | | 546 | | | | 1,035 | | | | 338 | | | | 190 | | | | 190 | | | | 498 | |
| Provision for income taxes | | | 260 | | | | (7,500 | ) | | | — | | | | — | | | | — | | | | (500 | ) | | | — | | | | — | |
| | | | | | | | | | | | | | | | | | | | | | | | | |
| Net income | | $ | 527 | | | $ | 8,055 | | | $ | 546 | | | $ | 1,035 | | | $ | 338 | | | $ | 690 | | | $ | 190 | | | $ | 498 | |
| | | | | | | | | | | | | | | | | | | | | | | | | |
| | | | | | | | | | | | | | | | | | | | | | | | | | | | | | | | | |
PER SHARE DATA | | | | | | | | | | | | | | | | | | | | | | | | | | | | | | | | |
| | | | | | | | | | | | | | | | | | | | | | | | | | | | | | | | | |
| Earnings per share — basic | | $ | .15 | | | $ | 2.35 | | | $ | .16 | | | $ | .30 | | | $ | .10 | | | $ | .20 | | | $ | .05 | | | $ | .15 | |
| Earnings per share — diluted | | | .15 | | | | 2.35 | | | | .16 | | | | .30 | | | | .10 | | | | .20 | | | | .05 | | | | .15 | |
| Book value per share | | | 11.47 | | | | 11.29 | | | | 8.89 | | | | 8.73 | | | | 8.40 | | | | 8.23 | | | | 7.93 | | | | 7.93 | |
| Market value per share | | | 8.98 | | | | 8.75 | | | | 9.45 | | | | 9.26 | | | | 11.50 | | | | 10.56 | | | | 10.27 | | | | 9.81 | |
| | | | | | | | | | | | | | | | | | | | | | | | | | | | | | | | | |
PROFITABILITY RATIOS | | | | | | | | | | | | | | | | | | | | | | | | | | | | | | | | |
| | | | | | | | | | | | | | | | | | | | | | | | | | | | | | | | | |
| Return on average assets | | | .51 | % | | | 7.99 | % | | | .57 | % | | | 1.10 | % | | | .37 | % | | | .75 | % | | | .22 | % | | | .63 | % |
| Return on average equity | | | 5.36 | | | | 99.30 | | | | 7.20 | | | | 14.35 | | | | 4.68 | | | | 9.76 | | | | 2.82 | | | | 7.47 | |
| Net interest margin | | | 3.55 | | | | 3.71 | | | | 3.60 | | | | 3.55 | | | | 3.44 | | | | 3.36 | | | | 3.62 | | | | 3.62 | |
| Efficiency ratio | | | 78.02 | | | | 74.71 | | | | 83.18 | | | | 82.39 | | | | 94.60 | | | | 91.17 | | | | 91.41 | | | | 99.37 | |
| Average loans/average deposits | | | 107.98 | | | | 104.00 | | | | 104.93 | | | | 102.73 | | | | 102.29 | | | | 97.51 | | | | 99.67 | | | | 98.44 | |
44
Market Information
MACKINAC FINANCIAL CORPORATION AND SUBSIDIARIES
MARKET INFORMATION
(Unaudited)
During 2001, the Corporation’s stock began trading on the NASDAQ Small Cap Market; effective on August 31, 2001, the Corporation changed its trading symbol from “NCUF” to “NCFC.” As part of the recapitalization, the Corporation changed its name from North Country Financial Corporation to Mackinac Financial Corporation and changed its trading symbol from “NCFC” to “MFNC”.
The following table sets forth the range of high and low bid prices of the Corporation’s common stock from January 1, 2006 through December 31, 2007, as reported by NASDAQ. Quotations for the NASDAQ Small Cap Market reflect inter-dealer prices, without retail mark-up, markdown, or commission, and may not reflect actual transactions.
| | | | | | | | | | | | | | | | | |
| | | For the Quarter Ended |
| | | March 31 | | June 30 | | September 30 | | December 31 |
2007 | | | | | | | | | | | | | | | | |
High | | $ | 11.50 | | | $ | 10.02 | | | $ | 9.70 | | | $ | 9.70 | |
Low | | | 9.25 | | | | 9.00 | | | | 7.75 | | | | 7.65 | |
Close | | | 9.26 | | | | 9.45 | | | | 8.75 | | | | 8.98 | |
Book value, at quarter end | | | 8.73 | | | | 8.89 | | | | 11.29 | | | | 11.47 | |
| | | | | | | | | | | | | | | | | |
2006 | | | | | | | | | | | | | | | | |
| High | | $ | 10.35 | | | $ | 11.00 | | | $ | 11.55 | | | $ | 11.50 | |
| Low | | | 9.10 | | | | 10.00 | | | | 10.20 | | | | 10.46 | |
| Close | | | 9.81 | | | | 10.27 | | | | 10.56 | | | | 11.50 | |
| Book value, at quarter end | | | 7.93 | | | | 7.93 | | | | 8.23 | | | | 8.40 | |
The Corporation had 1,660 shareholders of record as of March 31, 2008.
45
Forward-Looking Statements
This report contains certain forward-looking statements within the meaning of Section 27A of the Securities Act of 1933, as amended, and Section 21E of the Securities Exchange Act of 1934, as amended. The Corporation intends such forward-looking statements to be covered by the safe harbor provisions for forward-looking statements contained in the Private Securities Litigation Reform Act of 1995 and is including this statement for purposes of these safe harbor provisions. Forward-looking statements which are based on certain assumptions and describe future plans, strategies, or expectations of the Corporation, are generally identifiable by use of the words “believe”, “expect”, “intend”, “anticipate”, “estimate”, “project”, or similar expressions. The Corporation’s ability to predict results or the actual effect of future plans or strategies is inherently uncertain. Factors that could cause actual results to differ from the results in forward-looking statements include, but are not limited to:
| | • | | The highly regulated environment in which the Corporation operates could adversely affect its ability to carry out its strategic plan due to restrictions on new products, funding opportunities or new market entrances; |
| |
| | • | | General economic conditions, either nationally or in the state(s) in which the Corporation does business; |
| |
| | • | | Legislation or regulatory changes which affect the business in which the Corporation is engaged; |
| |
| | • | | Changes in the interest rate environment which increase or decrease interest rate margins; |
| |
| | • | | Changes in securities markets with respect to the market value of financial assets and the level of volatility in certain markets such as foreign exchange; |
| |
| | • | | Significant increases in competition in the banking and financial services industry resulting from industry consolidation, regulatory changes and other factors, as well as action taken by particular competitors; |
| |
| | • | | The ability of borrowers to repay loans; |
| |
| | • | | The effects on liquidity of unusual decreases in deposits; |
| |
| | • | | Changes in consumer spending, borrowing, and saving habits; |
| |
| | • | | Technological changes; |
| |
| | • | | Acquisitions and unanticipated occurrences which delay or reduce the expected benefits of acquisitions; |
| |
| | • | | Difficulties in hiring and retaining qualified management and banking personnel; |
| |
| | • | | The Corporation’s ability to increase market share and control expenses; |
| |
| | • | | The effect of compliance with legislation or regulatory changes; |
| |
| | • | | The effect of changes in accounting policies and practices; |
| |
| | • | | The costs and effects of existing and future litigation and of adverse outcomes in such litigation. |
These risks and uncertainties should be considered in evaluating forward-looking statements. Further information concerning the Corporation and its business, including additional factors that could materially affect the Corporation’s financial results, is included in the Corporation’s filings with the Securities and Exchange Commission. All forward-looking statements contained in this report are based upon information presently available and the Corporation assumes no obligation to update any forward-looking statements.
46
Management’s Discussion and Analysis of
Financial Condition and Results of Operations
The following discussion will cover results of operations for 2005 through 2007 and asset quality, financial position, liquidity, interest rate sensitivity, and capital resources for the years 2006 and 2007. The information included in this discussion is intended to assist readers in their analysis of, and should be read in conjunction with, the consolidated financial statements and related notes and other supplemental information presented elsewhere in this report. Throughout this discussion, the term “Bank” refers to mBank, the principal banking subsidiary of the Corporation.
EXECUTIVE OVERVIEW
The purpose of this section is to provide a brief overview of the 2007 results of operations. Additional detail of the balance sheet and Statement of Operations follows this summary.
The Corporation reported net income of $10.163 million, or $2.96 per share for the year ended December 31, 2007, compared to net income of $1.716 million, or $.50 per share for 2006. Weighted average shares outstanding amounted to 3,428,695 in both years.
The results for 2007 include the recognition of a $7.500 million deferred tax benefit for NOL and tax credit carryforwards and $.470 million of proceeds from the settlement of a lawsuit against the Corporation’s former accountants.
The 2006 operations include a $600,000 negative provision recorded in the first quarter in recognition of improved credit quality, a $261,000 negative provision recorded in the fourth quarter to recognize a specific reserve reduction on a loan payoff, and a $500,000 deferred tax benefit recorded in the third quarter in recognition of a portion of NOL and tax credit carryforwards. The 2006 results also include $550,000 of expenses incurred to pursue legal action against the Corporation’s former accountants.
Excluding these items in both years would have resulted in net profit of $2.193 million, or $.64 per share, in 2007 versus $.907 million, or $.27 per share, in 2006.
Total assets of the Corporation at December 31, 2007, were $408.880 million, an increase of $26.089 million, or 6.8% from total assets of $382.791 million reported at December 31, 2006.
At December 31, 2007, the Corporation’s loans stood at $355.079 million, an increase of $32.498 million, or 10.1%, from 2006 year-end balances of $322.581 million. Total loan originations in 2007 amounted to $114 million, while we experienced significant reductions from loan amortization and principal payoffs of $73.5 million. A good portion of these payoffs pertained to loan relationships that no longer met our pricing or credit standards.
Asset quality remains relatively strong. Nonperforming loans totaled $4.008 million, or 1.13% of total loans at December 31, 2007. Nonperforming assets at December 31, 2007, were $5.234 million, 1.28% of total assets, compared to $2.965 million or .77% of total assets at December 31, 2006.
Total deposits grew from $312.421 million at December 31, 2006, to $320.827 million at December 31, 2007, an increase of 2.7%. In the fourth quarter of 2007, we consummated the sale of a branch office with $9.3 million in deposits. This branch office sale was in line with the overall strategic plan of the Corporation to focus on markets with higher growth potential. Excluding the branch deposits sold, deposits grew by $17.706 million, of which $9.5 million consisted of brokered deposits.
Shareholders’ equity totaled $39.321 million at December 31, 2007, compared to $28.790 million at the end of 2006, an increase of $10.531 million. This increase reflects consolidated net income of $10.163 million, the capital contribution impact of stock options and also the increase in equity due to the increase in the market value of held-for-sale investments, which amounted to $.247 million. The book value per share at December 31, 2007, amounted to $11.47 compared to $8.40 at the end of 2006.
47
Management’s Discussion and Analysis of
Financial Condition and Results of Operations
FINANCIAL POSITION
Loans
In 2007, the Corporation increased loan balances by $32.498 million, or 10.1%, from 2006 year-end loan balances of $322.581 million. The loan growth in 2007 compares to loan growth in 2006 of $82.810 million, or 34.5% from 2005 year-end loan balances of $239.771 million. The loan growth in 2007 and 2006 was accomplished despite high loan payoffs of existing portfolio loans of $37.8 million in 2007 and $27.9 million in 2006 and represents the successful execution of the corporate strategic plan to grow commercial loans to provide the foundation for profitability. The Corporation’s plan execution is based upon the deployment of experienced relationship bankers. The Corporation emphasizes high quality commercial based lending with the majority of loans carrying variable interest rates which adjust up or down with the prime interest rate or other national indices. In 2006, the Corporation also experienced significant consumer loan growth with increases of $13.354 million or 29.9%, in one to four family mortgage loans and an increase of $.556 million, or 24.3% in other consumer related loans.
Loans represented 86.84% of total assets at the end of 2007 compared to 84.27% at the end of 2006. The loan to deposit ratio, at 110.68%, is higher than a peer average of approximately 90% due in part to the Bank’s utilization of Federal Home Loan Bank long-term borrowings as a funding source.
Following is a summary of the Corporation’s loan balances at December 31 (dollars in thousands):
| | | | | | | | | | | | | | | | | | | | | |
| | | | | | | | | | | | | | | Percent Change | |
| | | 2007 | | | 2006 | | | 2005 | | | 2007-2006 | | | 2006-2005 | |
| Commercial real estate | | $ | 171,695 | | | $ | 154,332 | | | $ | 118,637 | | | | 11.25 | % | | | 30.09 | % |
| Commercial, financial, and agricultural | | | 78,192 | | | | 71,385 | | | | 56,686 | | | | 9.54 | | | | 25.93 | |
| One to four family residential real estate | | | 57,613 | | | | 58,014 | | | | 44,660 | | | | (0.69 | ) | | | 29.90 | |
| Construction | | | 44,042 | | | | 36,009 | | | | 17,503 | | | | 22.31 | | | | 105.73 | |
| Consumer | | | 3,537 | | | | 2,841 | | | | 2,285 | | | | 24.50 | | | | 24.33 | |
| | | | | | | | | | | | | | | | |
| | | | | | | | | | | | | | | | | | | | | |
| Total | | $ | 355,079 | | | $ | 322,581 | | | $ | 239,771 | | | | 10.07 | % | | | 34.54 | % |
| | | | | | | | | | | | | | | | |
The above table more clearly illustrates the growth of the loan portfolio from 2005 through 2007 year end. This significant growth in loans for 2007 and 2006 was accomplished through a concentrated effort to return the Corporation to profitability by adding high quality commercial loans generated by a skilled commercial lending staff supported by an experienced credit review and underwriting team. The Corporation continues to feel that a properly positioned loan portfolio is the most attractive earning asset available. The Corporation is highly competitive in structuring loans to meet borrowing needs and meet strong underwriting requirements.
Looking forward, based upon the current economic outlook for the Michigan economy, management believes there will be limited opportunity for loan growth in the near term. The Corporation will continue to use a demanding pricing model for all new credit opportunities and existing loan renewals.
48
Management’s Discussion and Analysis of
Financial Condition and Results of Operations
Following is a table showing the significant industry types in the commercial loan portfolio as of December 31 (dollars in thousands):
| | | | | | | | | | | | | | | | | | | | | | | | | | | | | | | | | | | | | |
| | | 2007 | | | 2006 | | | 2005 | |
| | | | | | | % of | | | % of | | | | | | | % of | | | % of | | | | | | | % of | | | % of | |
| | | Balance | | | Loans | | | Capital | | | Balance | | | Loans | | | Capital | | | Balance | | | Loans | | | Capital | |
| Real estate — operators of nonres bldgs | | $ | 41,597 | | | | 14.40 | % | | | 105.79 | % | | $ | 44,308 | | | | 19.63 | % | | | 153.90 | % | | $ | 28,217 | | | | 16.09 | % | | | 106.13 | % |
| Hospitality and tourism | | | 37,604 | | | | 13.02 | | | | 95.63 | | | | 30,826 | | | | 13.66 | | | | 107.07 | | | | 37,681 | | | | 21.49 | | | | 141.72 | |
| Real estate agents and managers | | | 29,571 | | | | 10.24 | | | | 75.20 | | | | 25,071 | | | | 11.11 | | | | 87.08 | | | | 10,588 | | | | 6.04 | | | | 39.82 | |
| Other | | | 180,067 | | | | 62.34 | | | | 358.88 | | | | 125,512 | | | | 55.60 | | | | 435.96 | | | | 98,837 | | | | 56.38 | | | | 371.74 | |
| | | | | | | | | | | | | | | | | | | | | | | | | | | | |
| Total | | $ | 288,839 | | | | 100.00 | % | | | | | | $ | 225,717 | | | | 100.00 | % | | | | | | $ | 175,323 | | | | 100.00 | % | | | | |
| | | | | | | | | | | | | | | | | | | | | | | | | | | | | | | |
Management recognizes the additional risk presented by the concentration in certain segments of the portfolio. On a historical basis, the Corporation’s highest concentration of credit risk was the hospitality and tourism industry. Management does not consider the current loan concentrations in hospitality and tourism to be problematic, and has no intention of further reducing loans to this industry segment. Management does not believe that its current portfolio composition has increased exposure related to any specific industry concentration as of 2007 year end. The current concentration of real estate related loans represents a broad customer base composed of a high percentage of owner-occupied developments.
The Corporation has also extended credit to governmental units, including Native American organizations. Tax-exempt loans and leases decreased from $11.1 million at the end of 2006 to $6.6 million at 2007 year-end. The Corporation has elected to reduce its tax-exempt portfolio, since it currently provides no current tax benefit, due to tax net operating loss carryforwards.
Due to the seasonal nature of many of the Corporation’s commercial loan customers, loan payment terms provide flexibility by structuring payments to coincide with the customer’s business cycle. The lending staff evaluates the collectability of the past due loans based on documented collateral values and payment history. The Corporation discontinues the accrual of interest on loans when, in the opinion of management, there is an indication that the borrower may be unable to meet the payments as they become due. Upon such discontinuance, all unpaid accrued interest is reversed. Loans are returned to accrual status when all principal and interest amounts contractually due are brought current and future payments are reasonably assured.
Allowance for Loan Losses
Management analyzes the allowance for loan losses on a monthly basis to determine whether the losses inherent in the portfolio are properly reserved for. The Corporation utilizes a loan review consultant to perform a review of the loan portfolio. The opinion of this consultant, upon completion of the independent review in 2007, provided findings similar to management on the overall adequacy of the reserve. The Corporation will utilize this same consultant for loan review during 2008.
49
Management’s Discussion and Analysis of
Financial Condition and Results of Operations
A three year history of the Corporation’s credit quality is demonstrated in the following table (dollars in thousands):
| | | | | | | | | | | | | |
| | | 2007 | | | 2006 | | | 2005 | |
| Balance at beginning of period | | $ | 5,006 | | | $ | 6,108 | | | $ | 6,966 | |
| Loans charged off: | | | | | | | | | | | | |
| Commercial, Financial & Agricultural | | | 1,148 | | | | 199 | | | | 448 | |
| One-to-four family residential real estate | | | 89 | | | | 88 | | | | 493 | |
| Consumer | | | 73 | | | | 45 | | | | 51 | |
| | | | | | | | | | |
| Total loans charged off | | | 1,310 | | | | 332 | | | | 992 | |
| | | | | | | | | | |
| Recoveries of loans previously charged off: | | | | | | | | | | | | |
| Commercial, Financial & Agricultural | | | 15 | | | | 53 | | | | 102 | |
| One-to-four family residential real estate | | | — | | | | 13 | | | | 23 | |
| Consumer | | | 35 | | | | 25 | | | | 9 | |
| | | | | | | | | | |
| Total recoveries of loans previously charged off | | | 50 | | | | 91 | | | | 134 | |
| | | | | | | | | | |
| Net loans charged off | | | 1,260 | | | | 241 | | | | 858 | |
| | | | | | | | | | |
| Provision for loan losses | | | 400 | | | | (861 | ) | | | — | |
| Balance at end of period | | $ | 4,146 | | | $ | 5,006 | | | $ | 6,108 | |
| | | | | | | | | | |
| | | | | | | | | | | | | |
| Total loans, period end | | $ | 355,079 | | | $ | 322,581 | | | $ | 239,771 | |
| Average loans for the year | | | 333,415 | | | | 278,953 | | | | 207,928 | |
| Allowance to total loans at end of year | | | 1.17 | % | | | 1.55 | % | | | 2.55 | % |
| Net charge-offs to average loans | | | .38 | | | | .08 | | | | .41 | |
| Net charge-offs to beginning allowance balance | | | 25.17 | | | | 3.95 | | | | 12.32 | |
ASSET QUALITY
The table below shows balances of nonperforming assets for the three years ended December 31 (dollars in thousands):
| | | | | | | | | | | | | |
| | | 2007 | | | 2006 | | | 2005 | |
Nonperforming Assets: | | | | | | | | | | | | |
| Nonaccrual loans | | $ | 3,298 | | | $ | 2,899 | | | $ | 15 | |
| Accruing loans past due 90 days or more | | | 710 | | | | 40 | | | | 99 | |
| Restructured loans | | | — | | | | — | | | | — | |
| | | | | | | | | | |
| Total nonperforming loans | | | 4,008 | | | | 2,939 | | | | 114 | |
| Other real estate owned | | | 1,226 | | | | 26 | | | | 945 | |
| | | | | | | | | | |
| Total nonperforming assets | | $ | 5,234 | | | $ | 2,965 | | | $ | 1,059 | |
| | | | | | | | | | |
| Nonperforming loans as a % of loans | | | 1.13 | % | | | .91 | % | | | .05 | % |
| | | | | | | | | | |
| Nonperforming assets as a % of assets | | | 1.28 | % | | | .77 | % | | | .35 | % |
| | | | | | | | | | |
Reserve for Loan Losses: | | | | | | | | | | | | |
| At period end | | $ | 4,146 | | | $ | 5,006 | | | $ | 6,108 | |
| | | | | | | | | | |
| As a % of loans | | | 1.17 | % | | | 1.55 | % | | | 2.55 | % |
| | | | | | | | | | |
| As a % of nonperforming loans | | | 103.44 | % | | | 170.33 | % | | | 5,357.89 | % |
| | | | | | | | | | |
| As a % of nonaccrual loans | | | 125.71 | % | | | 172.68 | % | | | N/M | % |
| | | | | | | | | | |
50
Management’s Discussion and Analysis of
Financial Condition and Results of Operations
The following table details the impact of nonperforming loans on interest income for the three years ended December 31 (dollars in thousands):
| | | | | | | | | | | | | |
| | | 2007 | | | 2006 | | | 2005 | |
| Interest income that would have been recorded at original rate | | $ | 391 | | | $ | 114 | | | $ | 134 | |
| | | | | | | | | | |
| Interest income that was actually recorded | | | 129 | | | | 7 | | | | 78 | |
| | | | | | | | | | |
| Net interest lost | | $ | 262 | | | $ | 107 | | | $ | 56 | |
| | | | | | | | | | |
Nonaccrual loans currently represent less than 1% of all outstanding loans. This low balance is representative of management’s continued success in executing a significant expansion of the loan portfolio without compromising credit quality.
The following tables will provide additional information with respect to our nonperforming assets as of December 31, 2007 (dollars in thousands):
| | | | | | | | | | | | | | | | | | | | | | | | | | | | | |
| | | | | | | | | | | Estimated | | | | | | | | | | | | | | | Estimated | |
| | | | | | | | | | | Liquidation | | | (Deficiency) | | | SBA | | | Reserve | | | Net Surplus/ | |
| Collateral Type | | Balance | | | Originated | | | Value | | | Surplus | | | Guarantee | | | Allocation | | | (Exposure) | |
| | | (a) | | | (b) | | | ( c ) | | | (d)=( c )-(a) | | | (e) | | | (f) | | | (g)=(d)+(e)+(f) | |
Nonaccrual Loans | | | | | | | | | | | | | | | | | | | | | | | | | | | | |
| Motel/Hotel (NLP) | | $ | 1,698 | | | Pre-recap | | $ | 623 | | | $ | (1,075 | ) | | $ | 435 | | | $ | 730 | | | $ | 90 | |
| 1-4 Family (UP) | | | 281 | | | Pre-recap | | | 276 | | | | (5 | ) | | | — | | | | 11 | | | | 6 | |
| 1-4 Family (NLP) | | | 64 | | | Pre-recap | | | 56 | | | | (8 | ) | | | — | | | | — | | | | (8 | ) |
| Land (NLP) | | | 37 | | | Pre-recap | | | 88 | | | | 51 | | | | — | | | | — | | | | 51 | |
| Land Development/Condo (NLP) | | | 1,042 | | | Post-recap | | | 1,040 | | | | (2 | ) | | | — | | | | 400 | | | | 398 | |
| 1-4 Family (UP) | | | 176 | | | Post-recap | | | 100 | | | | (76 | ) | | | — | | | | 78 | | | | 2 | |
| | | | | | | | | | | | | | | | | | | | | | | |
| Total nonaccrual loans | | | 3,298 | | | | | | | | 2,183 | | | | (1,115 | ) | | | 435 | | | | 1,219 | | | | 539 | |
| | | | | | | | | | | | | | | | | | | | | | | |
| | | | | | | | | | | | | | | | | | | | | | | | | | | | | |
>90 Days Past Due | | | | | | | | | | | | | | | | | | | | | | | | | | | | |
| Cabins/Land (NLP) | | | 619 | | | Pre-recap | | | 637 | | | | 18 | | | | — | | | | 100 | | | | 118 | |
| 1-4 Family (UP) | | | 90 | | | Pre-recap | | | 85 | | | | (5 | ) | | | — | | | | 1 | | | | (4 | ) |
| Business — Liquor License (NLP) | | | 1 | | | Pre-recap | | | 6 | | | | 5 | | | | — | | | | — | | | | 5 | |
| | | | | | | | | | | | | | | | | | | | | | | |
| Total >90 days past due | | | 710 | | | | | | | | 728 | | | | 18 | | | | — | | | | 101 | | | | 119 | |
| | | | | | | | | | | | | | | | | | | | | | | |
| | | | | | | | | | | | | | | | | | | | | | | | | | | | | |
Other Real Estate Owned | | | | | | | | | | | | | | | | | | | | | | | | | | | | |
| Cabins/Land (NLP) | | | 291 | | | Pre-recap | | | 234 | | | | (57 | ) | | | — | | | | 60 | | | | 3 | |
| Downtown Store Frontage (UP) | | | 63 | | | Pre-recap | | | 32 | | | | (31 | ) | | | — | | | | 25 | | | | (6 | ) |
| 1-4 Family (UP) | | | 20 | | | Pre-recap | | | 10 | | | | (10 | ) | | | — | | | | 10 | | | | — | |
| Land Development (NLP) | | | 511 | | | Post-recap | | | 546 | | | | 35 | | | | — | | | | — | | | | 35 | |
| Equipment Storage Building (UP) | | | 264 | | | Post-recap | | | 209 | | | | (55 | ) | | | — | | | | 90 | | | | 35 | |
| Downtown Store Frontage/ 2 / 1-4 Family (UP) | | | 77 | | | Post-recap | | | 77 | | | | — | | | | — | | | | — | | | | — | |
| | | | | | | | | | | | | | | | | | | | | | | |
| Total other real estate owned | | | 1,226 | | | | | | | | 1,108 | | | | (118 | ) | | | — | | | | 185 | | | | 67 | |
| | | | | | | | | | | | | | | | | | | | | | | |
| Total “Pre-Recap” Nonperforming Assets | | | 3,164 | | | | | | | | 2,047 | | | | (1,117 | ) | | | 435 | | | | 937 | | | | 255 | |
| | | | | | | | | | | | | | | | | | | | | | | |
| |
| Total “Post-Recap” Nonperforming Assets | | | 2,070 | | | | | | | | 1,972 | | | | (98 | ) | | | — | | | | 568 | | | | 470 | |
| | | | | | | | | | | | | | | | | | | | | | | |
| |
| Total Nonperforming Assets | | $ | 5,234 | | | | | | | $ | 4,019 | | | $ | (1,215 | ) | | $ | 435 | | | $ | 1,505 | | | $ | 725 | |
| | | | | | | | | | | | | | | | | | | | | | | |
UP= Upper Peninsula
NLP= Northern Lower Peninsula
SEM= Southeast Michigan
The schedule above shows the detail of nonperforming assets categorized by type of loan/collateral. The nonperforming assets are also categorized by origination date defined as “Pre-Recap” or “Post-Recap.” The “Pre-Recap” time period refers to loan originations prior to the recapitalization of Mackinac Financial Corporation, which occurred in December 2004. The “Post-Recap” is defined as loans originated by the new management team subsequent to the recapitalization.
51
Management’s Discussion and Analysis of
Financial Condition and Results of Operations
In determining estimated liquidation value, management considered existing appraisals, the date of the appraisals, and current market conditions, along with related selling costs. Personal guarantees are also in place for various nonperforming assets, which will also help mitigate losses.
Below is a breakout of nonperforming assets at the end of the year by region (dollars in thousands):
| | | | | | | | | | | | | | | | | | | | | | | | | |
| | | | | | | Estimated | | | | | | | | | | | | | | | Estimated | |
| | | | | | | Liquidation | | | (Deficiency) | | | SBA | | | Reserve | | | Net Surplus/ | |
| Collateral Type | | Balance | | | Value | | | Surplus | | | Guarantee | | | Allocation | | | (Exposure) | |
| | | (a) | | | ( c ) | | | (d)=( c )-(a) | | | (e) | | | (f) | | | (g)=(d)+(e)+(f) | |
Pre-Recap | | | | | | | | | | | | | | | | | | | | | | | | |
| Northern Lower Peninsula (NLP) | | $ | 2,710 | | | $ | 1,644 | | | $ | (1,066 | ) | | $ | 435 | | | $ | 890 | | | $ | 259 | |
| Upper Peninsula (UP) | | | 454 | | | | 403 | | | | (51 | ) | | | — | | | | 47 | | | | (4 | ) |
| Southeast Michigan (SEM) | | | — | | | | — | | | | — | | | | — | | | | — | | | | — | |
| | | | | | | | | | | | | | | | | | | |
| Total “Pre-Recap” Nonperforming Assets | | | 3,164 | | | | 2,047 | | | | (1,117 | ) | | | 435 | | | | 937 | | | | 255 | |
| | | | | | | | | | | | | | | | | | | |
| | | | | | | | | | | | | | | | | | | | | | | | | |
Post-Recap | | | | | | | | | | | | | | | | | | | | | | | | |
| Northern Lower Peninsula (NLP) | | | 1,553 | | | | 1,586 | | | | 33 | | | | — | | | | 400 | | | | 433 | |
| Upper Peninsula (UP) | | | 517 | | | | 386 | | | | (131 | ) | | | — | | | | 168 | | | | 37 | |
| Southeast Michigan (SEM) | | | — | | | | — | | | | — | | | | — | | | | — | | | | — | |
| | | | | | | | | | | | | | | | | | | |
| Total “Post-Recap” Nonperforming Assets | | | 2,070 | | | | 1,972 | | | | (98 | ) | | | — | | | | 568 | | | | 470 | |
| | | | | | | | | | | | | | | | | | | |
| |
| Total Nonperforming Assets | | $ | 5,234 | | | $ | 4,019 | | | $ | (1,215 | ) | | $ | 435 | | | $ | 1,505 | | | $ | 725 | |
| | | | | | | | | | | | | | | | | | | |
The computation of the required allowance for loan losses as of any point in time is one of the critical accounting estimates made by management in the financial statements. As such, factors used to establish the allowance could change significantly from the assumptions made and impact future earnings positively or negatively. The future of the national and local economies and the resulting impact on borrowers’ ability to repay their loans and the value of collateral are examples of areas where assumptions must be made for individual loans, as well as the overall portfolio.
The Corporation’s computation of the allowance for loan losses follows the Interagency Policy Statement on Allowance for Loan and Lease Losses Methodologies and Documentation for Banks and Savings Associations issued by the Federal Financial Institutions Examination Council (FFIEC) in July 2001. The computation of the allowance for loan losses considers prevailing local and national economic conditions as well as past and present underwriting practices.
As part of the management of the loan portfolio, risk ratings are assigned to all commercial loans. Through the loan review process ratings are modified as believed to be appropriate to reflect changes in the credit. Using a historical average loss by loan type as a base, each loan graded as higher risk is assigned a specific percentage. Within the commercial loan portfolio, the historical loss rates are used for specific industries such as hospitality, gaming, petroleum, and forestry. The residential real estate and consumer loan portfolios are assigned a loss percentage as a homogenous group. If, however, on an individual loan the projected loss based on collateral value and payment histories are in excess of the computed allowance, the allocation is increased for the higher anticipated loss. These computations provide the basis for the allowance for loan losses as recorded by the Corporation.
Following is a table showing the specific loan allocation of the allowance for loan losses at December 31, 2007 (dollars in thousands):
| | | | | |
| Commercial, financial and agricultural loans | | $ | 3,808 | |
| One to four family residential real estate loans | | | 22 | |
| Consumer loans | | | 20 | |
| Unallocated and general reserves | | | 296 | |
| | | | |
| | | | | |
| Total | | $ | 4,146 | |
| | | | |
52
Management’s Discussion and Analysis of
Financial Condition and Results of Operations
At the end of 2007, the allowance for loan losses represented 1.17% of total loans. In management’s opinion, the allowance for loan losses is adequate to cover probable losses related to specifically identified loans, as well as probable losses inherent in the balance of the loan portfolio
As part of the process of resolving problem credits, the Corporation may acquire ownership of real estate collateral which secured such credits. The Corporation carries this collateral in other real estate on the balance sheet.
The following table represents the activity in other real estate (dollars in thousands):
| | | | | |
| Balance at January 1, 2006 | | $ | 945 | |
| Other real estate transferred from loans due to foreclosure | | | 23 | |
| Other real estate transferred to premises and equipment | | | — | |
| Other real estate sold / written down | | | (942 | ) |
| | | | |
| | | | | |
| Balance at December 31, 2006 | | | 26 | |
| Other real estate transferred from loans due to foreclosure | | | 1,218 | |
| Other real estate transferred to premises and equipment | | | — | |
| Other real estate sold / written down | | | (18 | ) |
| | | | |
| | | | | |
| Balance at December 31, 2007 | | $ | 1,226 | |
| | | | |
Other real estate is initially valued at the lower of cost or the fair value less selling costs. After the initial receipt, management periodically re-evaluates the recorded balance and any additional reductions in the fair value result in a write-down of other real estate.
Securities
The securities portfolio is an important component of the Corporation’s asset composition to provide diversity in its asset base and provide liquidity. Securities decreased $11.172 million in 2007, from $32.769 million at December 31, 2006 to $21.597 million at December 31, 2007.
The carrying value of the Corporation’s securities is as follows at December 31 (dollars in thousands):
| | | | | | | | | |
| | | 2007 | | | 2006 | |
| US Agencies | | $ | 20,969 | | | $ | 32,176 | |
| Obligations of states and political subdivisions | | | 628 | | | | 593 | |
| | | | | | | |
| | | | | | | | | |
| Total securities | | $ | 21,597 | | | $ | 32,769 | |
| | | | | | | |
The Corporation’s policy is to purchase securities of high credit quality, consistent with its asset/liability management strategies. During 2007, the Corporation did not reinvest maturities or calls of its investment portfolio into similar investments since yields were not attractive for mid to longer term strategies. Adequate liquidity was maintained by investing balances in federal funds sold and short term deposit instruments, which provided a better economic yield. A net gain of $95,000 on the sale of securities was recognized in 2005. The Corporation recorded $1,000 of net losses related to securities transactions in 2007 and 2006. The Corporation classifies all securities as available for sale, in order to maintain adequate liquidity and to maximize its ability to react to changing market conditions.
53
Management’s Discussion and Analysis of
Financial Condition and Results of Operations
Deposits
Total deposits at December 31, 2007, were $320.827 million compared to $312.421 million at the end of 2006. The table below shows the deposit mix for the periods indicated (dollars in thousands):
| | | | | | | | | | | | | | | | | | | | | | | | | |
| | | 2007 | | | Mix | | | 2006 | | | Mix | | | 2005 | | | Mix | |
| Non-interest-bearing | | $ | 25,557 | | | | 7.97 | % | | $ | 23,471 | | | | 7.51 | % | | $ | 19,684 | | | | 8.46 | % |
| NOW and Money Market | | | 81,160 | | | | 25.30 | | | | 73,188 | | | | 23.43 | | | | 64,566 | | | | 27.75 | |
| Savings | | | 12,485 | | | | 3.89 | | | | 13,365 | | | | 4.28 | | | | 22,555 | | | | 9.70 | |
| Certificates of Deposit <$100,000 | | | 80,607 | | | | 25.12 | | | | 89,585 | | | | 28.67 | | | | 67,725 | | | | 29.11 | |
| | | | | | | | | | | | | | | | | | | |
| Total core deposits | | | 199,809 | | | | 62.28 | | | | 199,609 | | | | 63.89 | | | | 174,530 | | | | 75.02 | |
| | | | | | | | | | | | | | | | | | | |
| | | | | | | | | | | | | | | | | | | | | | | | | |
| Certificates of Deposit >$100,000 | | | 22,355 | | | | 6.97 | | | | 23,645 | | | | 7.57 | | | | 12,335 | | | | 5.30 | |
| Internet CD | | | 297 | | | | .09 | | | | 1,189 | | | | .38 | | | | 35,811 | | | | 15.40 | |
| Brokered CDs | | | 98,366 | | | | 30.66 | | | | 87,978 | | | | 28.16 | | | | 9,956 | | | | 4.28 | |
| | | | | | | | | | | | | | | | | | | |
| Total non-core deposits | | | 121,018 | | | | 37.72 | | | | 112,812 | | | | 36.11 | | | | 58,102 | | | | 24.98 | |
| | | | | | | | | | | | | | | | | | | |
| | | | | | | | | | | | | | | | | | | | | | | | | |
| Total deposits | | $ | 320,827 | | | | 100.00 | % | | $ | 312,421 | | | | 100.00 | % | | $ | 232,632 | | | | 100.00 | % |
| | | | | | | | | | | | | | | | | | | |
In 2007, the Corporation increased its reliance on non-core funding due in part to the sale of a branch office in the northwest part of the Upper Peninsula of Michigan with $9.3 million of deposits. The sale of this branch office was in accordance with the overall strategy of the Corporation to focus on markets with higher growth potential. Although the Corporation has been successful in growing core deposits, the high level of funding required by loan growth has resulted in increased reliance upon brokered deposits. As of December 31, 2007, non-core deposits amounted to 37.81% of total deposits, an increase from 24.98% at 2005 year-end. The Bank had $98.663 million in brokered deposits at December 31, 2007, 30.75% of total deposits. Non-core funding has a negative effect on the Corporation’s net interest margin, as non-core out-of-market deposits carry higher interest costs.
Management continues to monitor existing deposit products in order to stay competitive, both as to terms and pricing. It is the intent of management to be aggressive in its markets to grow core deposits with an emphasis placed on transactional accounts.
Borrowings
The Corporation historically used alternative funding sources to provide long-term, stable sources of funds. Current borrowings total $35.0 million with stated maturities ranging through 2011. Borrowings at year end include $20.0 million with adjustable rates that reprice quarterly based upon the three month LIBOR. The FHLB has the option to convert the remaining $15.0 million fixed-rate advances to adjustable rate advances on the original call date and quarterly thereafter.
Shareholders’ Equity
Changes in shareholders’ equity are discussed in detail in the “Capital and Regulatory” section of this report.
54
Management’s Discussion and Analysis of
Financial Condition and Results of Operations
RESULTS OF OPERATIONS
Summary
The Corporation reported income of $10.163 million in 2007, compared to net income of $1.716 million in 2006 and a loss of $7.364 million in 2005. As previously mentioned, the 2007 results of operations include the $7.5 million recognition of a deferred tax benefit pertaining to NOL and tax credit carryforwards. Also included in the 2007 results is $470,000 from the settlement of the lawsuit against the Corporation’s former accountants. The 2006 operations include a $600,000 negative provision recorded in the first quarter, in recognition of improved credit quality, a $261,000 negative provision recorded in the fourth quarter to recognize a specific reserve reduction on a loan payoff, and a $500,000 deferred tax benefit recorded in the third quarter. The deferred tax benefit was recorded in accordance with generally accepted accounting principles for recognition of a portion of the benefits to be derived from NOL carry-forwards. The 2006 results also include $310,000 of stock option expense required under accounting rules for stock compensation plans, which were effective beginning in 2006, as well as $550,000 of expenses incurred to pursue legal action against the Corporation’s former accountants.
The following table details changes in earnings and earnings per share for the three years ended December 31 (dollars in thousands, except for per share data):
| | | | | | | | | | | | | | | | | | | | | | | | | | | | | |
| | | Income/Expense | | | Change | |
| | | 2007 | | | 2006 | | | 2005 | | | 2007-2006 | | | 2006-2005 | |
| | | Dollars | | | Dollars | | | Dollars | | | Dollars | | | Per Share | | | Dollars | | | Per Share | |
| Interest Income | | $ | 28,695 | | | $ | 24,052 | | | $ | 16,976 | | | $ | 4,643 | | | $ | 1.35 | | | $ | 7,076 | | | $ | 2.06 | |
| Interest Expense | | | 15,278 | | | | 12,459 | | | | 7,196 | | | | 2,819 | | | | .82 | | | | 5,263 | | | | 1.53 | |
| | | | | | | | | | | | | | | | | | | | | | |
| Net Interest Income | | | 13,417 | | | | 11,593 | | | | 9,780 | | | | 1,824 | | | | .53 | | | | 1,813 | | | | .53 | |
| Provision for Loan Losses | | | 400 | | | | (861 | ) | | | — | | | | 1,261 | | | | .37 | | | | (861 | ) | | | .25 | |
| | | | | | | | | | | | | | | | | | | | | | |
| Net interest income after provision | | | 13,017 | | | | 12,454 | | | | 9,780 | | | | 563 | | | | .16 | | | | 2,674 | | | | .78 | |
| Noninterest Income: | | | | | | | | | | | | | | | | | | | | | | | | | | | | |
| Service fees | | | 688 | | | | 547 | | | | 586 | | | | 141 | | | | .04 | | | | (39 | ) | | | (.01 | ) |
| Net gains on sale of secondary market loans | | | 498 | | | | 197 | | | | 49 | | | | 301 | | | | .09 | | | | 148 | | | | .04 | |
| Proceeds from settlement of lawsuit | | | 470 | | | | — | | | | — | | | | 470 | | | | .14 | | | | — | | | | — | |
| Other | | | 350 | | | | 239 | | | | 476 | | | | 111 | | | | .03 | | | | (237 | ) | | | (.07 | ) |
| | | | | | | | | | | | | | | | | | | | | | |
| Total noninterest income | | | 2,006 | | | | 983 | | | | 1,111 | | | | 1,023 | | | | .30 | | | | (128 | ) | | | (.04 | ) |
| | | | | | | | | | | | | | | | | | | | | | |
| Noninterest Expense: | | | | | | | | | | | | | | | | | | | | | | | | | | | | |
| Salaries and employee benefits | | | 6,757 | | | | 6,132 | | | | 6,090 | | | | 625 | | | | .18 | | | | 42 | | | | .01 | |
| Occupancy | | | 1,272 | | | | 1,264 | | | | 1,053 | | | | 8 | | | | — | | | | 211 | | | | .06 | |
| Furniture and equipment | | | 678 | | | | 631 | | | | 560 | | | | 47 | | | | .01 | | | | 71 | | | | .02 | |
| Data processing | | | 785 | | | | 691 | | | | 1,720 | | | | 94 | | | | .03 | | | | (1,029 | ) | | | (.30 | ) |
| Professional services: | | | | | | | | | | | | | | | | | | | | | | | | | | | | |
| Accounting | | | 308 | | | | 273 | | | | 284 | | | | 35 | | | | .01 | | | | (11 | ) | | | — | |
| Legal | | | 42 | | | | 927 | | | | 361 | | | | (885 | ) | | | (.26 | ) | | | 566 | | | | .16 | |
| Consulting and other | | | 182 | | | | 225 | | | | 241 | | | | (43 | ) | | | (.01 | ) | | | (16 | ) | | | — | |
| Loan and deposit | | | 285 | | | | 392 | | | | 852 | | | | (107 | ) | | | (.03 | ) | | | (460 | ) | | | (.13 | ) |
| Telephone | | | 228 | | | | 210 | | | | 271 | | | | 18 | | | | .01 | | | | (61 | ) | | | (.02 | ) |
| Advertising | | | 370 | | | | 281 | | | | 814 | | | | 89 | | | | .03 | | | | (533 | ) | | | (.16 | ) |
| Penalty on prepayment of FHLB borrowings | | | — | | | | — | | | | 4,320 | | | | — | | | | — | | | | (4,320 | ) | | | (1.26 | ) |
| Other | | | 1,193 | | | | 1,195 | | | | 1,689 | | | | (2 | ) | | | — | | | | (494 | ) | | | (.14 | ) |
| | | | | | | | | | | | | | | | | | | | | | |
| Total noninterest expense | | | 12,100 | | | | 12,221 | | | | 18,255 | | | | (121 | ) | | | (.03 | ) | | | (6,034 | ) | | | (1.76 | ) |
| | | | | | | | | | | | | | | | | | | | | | |
| Income (loss) before provision for income taxes | | | 2,923 | | | | 1,216 | | | | (7,364 | ) | | | 1,707 | | | | .49 | | | | 8,580 | | | | 2.50 | |
| Provision (credit) for income taxes | | | (7,240 | ) | | | (500 | ) | | | — | | | | (6,740 | ) | | | (1.97 | ) | | | (500 | ) | | | (.15 | ) |
| | | | | | | | | | | | | | | | | | | | | | |
| Change due to increase in outstanding shares | | | N/A | | | | N/A | | | | N/A | | | | — | | | | — | | | | — | | | | — | |
| Net Change | | | 10,163 | | | | 1,716 | | | | (7,364 | ) | | | 8,447 | | | | 2.46 | | | | 9,080 | | | | 2.65 | |
| | | | | | | | | | | | | | | | | | | | | | |
| | | | | | | | | | | | | | | | | | | | | | | | | | | | | |
| Net Income (loss), current period | | $ | 10,163 | | | $ | 1,716 | | | $ | (7,364 | ) | | $ | 8,447 | | | $ | 2.46 | | | $ | 9,080 | | | $ | 2.65 | |
| | | | | | | | | | | | | | | | | | | | | | |
Net interest income is the Corporation’s primary source of core earnings. Net interest income increased $1.824 million to $13.417 million, in 2007. In 2006, net interest income increased $1.813 million, from $9.780 million in 2005. The increases in net interest income for 2005 and 2006 were primarily the result of the successful expansion of the
55
Management’s Discussion and Analysis of
Financial Condition and Results of Operations
Corporation’s loan portfolio. The Corporation also benefited from increasing interest rates during this same period since a large portion of the Bank’s loan portfolio repriced immediately with each increase in the prime rate while the liability repricing lagged.
Net Interest Income
Net interest income represents the difference between the average yield earned on interest-earning assets and the average rate paid on interest-bearing obligations. The net interest income is impacted by economic and competitive factors that influence rates, loan demand, and the availability of funding.
Because the Corporation has a significant portion of its commercial loans at rates that adjust with changes to the prime rate, these rate changes have a significant impact on the Corporation’s interest income.
The Corporation’s net interest margin, on a fully taxable equivalent basis, was 3.68% in 2007 compared to 3.64% in 2006. From January 2005 to June 2006, the prime rate increased 300 basis points, from 5.25% to 8.25%. In 2007, the Federal Reserve Bank reduced the prime rate from 8.25% in September to 7.25% at 2007 year end. These changes in the prime rate have largely been favorable in recent years since approximately 65% of the Corporation’s loans repriced upward with each prime rate increase. The Corporation reduced bank deposit rates commensurate with prime rate reductions during the fourth quarter of 2007 to mitigate the impact of reduced rates on variable rate commercial loans. The current asset and liability repricing simulations indicate the Bank will not incur significant increases or decreases in its net interest income with gradual 100 basis point increases or decreases of the prime rate; however, reductions greater than 100 basis points over short time periods, less than one year, will have a more significant negative impact on the Corporation’s net interest margin.
The following table details sources of net interest income for the three years ended December 31, 2007 (dollars in thousands):
Sources of Net Interest Income
| | | | | | | | | | | | | | | | | | | | | | | | | |
| | | 2007 | | | Mix | | | 2006 | | | Mix | | | 2005 | | | Mix | |
| Interest Income | | | | | | | | | | | | | | | | | | | | | | | | |
| Loans | | $ | 26,873 | | | | 93.65 | % | | $ | 21,992 | | | | 91.44 | % | | $ | 14,790 | | | | 87.12 | % |
| Funds sold | | | 391 | | | | 1.36 | | | | 554 | | | | 2.30 | | | | 311 | | | | 1.83 | |
| Taxable securities | | | 1,100 | | | | 3.83 | | | | 1,186 | | | | 4.93 | | | | 1,455 | | | | 8.57 | |
| Nontaxable securities | | | — | | | | — | | | | 87 | | | | .36 | | | | 167 | | | | .99 | |
| Other interest-earning assets | | | 331 | | | | 1.16 | | | | 233 | | | | .97 | | | | 253 | | | | 1.49 | |
| | | | | | | | | | | | | | | | | | | |
| Total earning assets | | | 28,695 | | | | 100.00 | % | | | 24,052 | | | | 100.00 | % | | | 16,976 | | | | 100.00 | % |
| | | | | | | | | | | | | | | | | | | |
| Interest Expense | | | | | | | | | | | | | | | | | | | | | | | | |
| NOW and Money Markets | | | 2,668 | | | | 17.46 | % | | | 2,263 | | | | 18.16 | % | | | 1,132 | | | | 15.73 | % |
| Savings | | | 199 | | | | 1.30 | | | | 210 | | | | 1.69 | | | | 190 | | | | 2.64 | |
| CDs <$100,000 | | | 4,490 | | | | 29.39 | | | | 3,595 | | | | 28.85 | | | | 2,140 | | | | 29.74 | |
| CDs >$100,000 | | | 1,183 | | | | 7.74 | | | | 846 | | | | 6.79 | | | | 409 | | | | 5.68 | |
| Brokered deposits | | | 4,684 | | | | 30.66 | | | | 3,661 | | | | 29.39 | | | | 1,388 | | | | 19.29 | |
| Borrowings | | | 2,054 | | | | 13.45 | | | | 1,884 | | | | 15.12 | | | | 1,937 | | | | 26.92 | |
| | | | | | | | | | | | | | | | | | | |
| Total interest-bearing funds | | | 15,278 | | | | 100.00 | % | | | 12,459 | | | | 100.00 | % | | | 7,196 | | | | 100.00 | % |
| | | | | | | | | | | | | | | | | | | |
| | | | | | | | | | | | | | | | | | | | | | | | | |
| Net interest income | | $ | 13,417 | | | | | | | $ | 11,593 | | | | | | | $ | 9,780 | | | | | |
| | | | | | | | | | | | | | | | | | | | | | |
| | | | | | | | | | | | | | | | | | | | | | | | | |
| Average Rates | | | | | | | | | | | | | | | | | | | | | | | | |
| Earning assets | | | 7.71 | % | | | | | | | 7.28 | % | | | | | | | 6.31 | % | | | | |
| | | | | | | | | | | | | | | | | | | | | | |
| Interest-bearing funds | | | 4.62 | | | | | | | | 4.21 | | | | | | | | 3.10 | | | | | |
| | | | | | | | | | | | | | | | | | | | | | |
| Interest rate spread | | | 3.09 | | | | | | | | 3.07 | | | | | | | | 3.21 | | | | | |
| | | | | | | | | | | | | | | | | | | | | | |
While a majority of the Corporation’s loan portfolio, approximately 65%, is repriced with each prime rate change due to floating rate loans, interest paid on similar rate changes does not impact the pricing of interest-bearing liabilities to nearly
56
Management’s Discussion and Analysis of
Financial Condition and Results of Operations
the same degree. The mix of time deposits reflects the Corporation’s need to utilize the brokered certificate of deposit markets for loan funding when core deposits did not provide adequate sources.
The Corporation’s historical reliance on out-of-market non-core funding from brokered deposits along with the FHLB borrowings, have had a negative effect on net interest margin due to the relative high costs of this funding. The Corporation has placed a high priority on gathering in-market core deposits in order to reduce funding costs and reduce the risk associated with non-core funding.
Recent prime rate reductions have translated into lower yields on the Corporation’s earning assets, specifically variable rate commercial loans and short-term investments which reprice immediately. Offering rates on brokered certificates of deposit are influenced by other factors, such as overall market liquidity. Reliance upon wholesale funding and further rate reductions in the near term will unfavorably impact the net interest margin of the Corporation.
The following table presents the amount of interest income from average interest-earning assets and the yields earned on those assets, as well as the interest expense on average interest-bearing obligations and the rates paid on those obligations. All average balances are daily average balances.
| | | | | | | | | | | | | | | | | | | | | | | | | | | | | | | | | | | | | |
| | | Years ended December 31, | |
| | | 2007 | | | 2006 | | | 2005 | |
| (dollars in thousands) | | Average | | | | | | | Average | | | Average | | | | | | | Average | | | Average | | | | | | | Average | |
| | | Balance | | | Interest | | | Rate | | | Balance | | | Interest | | | Rate | | | Balance | | | Interest | | | Rate | |
ASSETS: | | | | | | | | | | | | | | | | | | | | | | | | | | | | | | | | | | | | |
| Loans (1,2,3) | | $ | 333,415 | | | $ | 27,146 | | | | 8.14 | % | | $ | 278,953 | | | $ | 22,380 | | | | 8.02 | % | | $ | 207,928 | | | $ | 15,268 | | | | 7.34 | % |
| Taxable securities | | | 25,061 | | | | 1,100 | | | | 4.39 | | | | 32,795 | | | | 1,186 | | | | 3.62 | | | | 40,254 | | | | 1,455 | | | | 3.62 | |
| Nontaxable securities (2) | | | 5 | | | | — | | | | — | | | | 1,658 | | | | 132 | | | | 7.96 | | | | 3,654 | | | | 253 | | | | 6.92 | |
| Federal Funds sold | | | 7,515 | | | | 391 | | | | 5.20 | | | | 11,123 | | | | 554 | | | | 4.98 | | | | 10,321 | | | | 311 | | | | 3.01 | |
| Other interest-earning assets | | | 6,358 | | | | 332 | | | | 5.22 | | | | 5,885 | | | | 233 | | | | 3.96 | | | | 6,702 | | | | 253 | | | | 3.77 | |
| | | | | | | | | | | | | | | | | | | | | | | | | | | | |
| Total earning assets | | | 372,354 | | | | 28,969 | | | | 7.78 | | | | 330,414 | | | | 24,485 | | | | 7.41 | | | | 268,859 | | | | 17,540 | | | | 6.52 | |
| | | | | | | | | | | | | | | | | | | | | | | | | | | | |
| Reserve for loan losses | | | (4,881 | ) | | | | | | | | | | | (5,495 | ) | | | | | | | | | | | (6,724 | ) | | | | | | | | |
| Cash and due from banks | | | 6,266 | | | | | | | | | | | | 5,775 | | | | | | | | | | | | 5,399 | | | | | | | | | |
| Fixed assets | | | 12,276 | | | | | | | | | | | | 12,375 | | | | | | | | | | | | 10,852 | | | | | | | | | |
| Other assets | | | 6,298 | | | | | | | | | | | | 4,858 | | | | | | | | | | | | 7,510 | | | | | | | | | |
| | | | | | | | | | | | | | | | | | | | | | | | | | | | | | | | | | |
| | | | 19,959 | | | | | | | | | | | | 17,513 | | | | | | | | | | | | 17,037 | | | | | | | | | |
| | | | | | | | | | | | | | | | | | | | | | | | | | | | | | | | | | |
| | | | | | | | | | | | | | | | | | | | | | | | | | | | | | | | | | | | | |
Total assets | | $ | 392,313 | | | | | | | | | | | $ | 347,927 | | | | | | | | | | | $ | 285,896 | | | | | | | | | |
| | | | | | | | | | | | | | | | | | | | | | | | | | | | | | | | | | |
| | | | | | | | | | | | | | | | | | | | | | | | | | | | | | | | | | | | | |
LIABILITIES AND SHAREHOLDERS’ EQUITY: | | | | | | | | | | | | | | | | | | | | | | | | | | |
| NOW and Money Markets | | $ | 77,942 | | | $ | 2,669 | | | | 3.42 | % | | $ | 70,417 | | | $ | 2,263 | | | | 3.21 | % | | $ | 56,644 | | | $ | 1,132 | | | | 2.00 | % |
| Savings deposits | | | 13,013 | | | | 199 | | | | 1.53 | | | | 14,412 | | | | 210 | | | | 1.46 | | | | 17,505 | | | | 190 | | | | 1.09 | |
| CDs <$100,000 | | | 91,313 | | | | 4,490 | | | | 4.92 | | | | 82,445 | | | | 3,595 | | | | 4.36 | | | | 64,037 | | | | 2,140 | | | | 3.34 | |
| CDs >$100,000 | | | 23,879 | | | | 1,183 | | | | 4.96 | | | | 18,128 | | | | 846 | | | | 4.67 | | | | 12,259 | | | | 409 | | | | 3.34 | |
| Brokered deposits | | | 85,703 | | | | 4,683 | | | | 5.46 | | | | 72,768 | | | | 3,661 | | | | 5.03 | | | | 40,908 | | | | 1,388 | | | | 3.39 | |
| Borrowings | | | 38,949 | | | | 2,054 | | | | 5.27 | | | | 37,422 | | | | 1,884 | | | | 5.03 | | | | 40,651 | | | | 1,937 | | | | 4.76 | |
| | | | | | | | | | | | | | | | | | | | | | | | | | | | |
| Total interest-bearing liabilities | | | 330,799 | | | | 15,278 | | | | 4.62 | | | | 295,592 | | | | 12,459 | | | | 4.21 | | | | 232,004 | | | | 7,196 | | | | 3.10 | |
| | | | | | | | | | | | | | | | | | | | | | | | | | | | |
| Demand deposits | | | 25,860 | | | | | | | | | | | | 21,414 | | | | | | | | | | | | 20,444 | | | | | | | | | |
| Other liabilities | | | 2,923 | | | | | | | | | | | | 3,177 | | | | | | | | | | | | 4,716 | | | | | | | | | |
| Shareholders’ equity | | | 32,731 | | | | | | | | | | | | 27,744 | | | | | | | | | | | | 28,732 | | | | | | | | | |
| | | | | | | | | | | | | | | | | | | | | | | | | | | | | | | | | | |
| | | | 61,514 | | | | | | | | | | | | 52,335 | | | | | | | | | | | | 53,892 | | | | | | | | | |
| | | | | | | | | | | | | | | | | | | | | | | | | | | | | | | | | | |
| | | | | | | | | | | | | | | | | | | | | | | | | | | | | | | | | | | | | |
Total liabilities and shareholders’ equity | | $ | 392,313 | | | | | | | | | | | $ | 347,927 | | | | | | | | | | | $ | 285,896 | | | | | | | | | |
| | | | | | | | | | | | | | | | | | | | | | | | | | | | | | | | | | |
| Rate spread | | | | | | | | | | | 3.16 | % | | | | | | | | | | | 3.20 | % | | | | | | | | | | | 3.42 | % |
| | | | | | | | | | | | | | | | | | | | | | | | | | | | | | | | | | |
| Net interest margin/revenue, tax equivalent basis | | | | | | $ | 13,691 | | | | 3.68 | % | | | | | | $ | 12,026 | | | | 3.64 | % | | | | | | $ | 10,344 | | | | 3.85 | % |
| | | | | | | | | | | | | | | | | | | | | | | | | | | | | | | |
| | |
| (1) | | For purposes of these computations, non-accruing loans are included in the daily average loan amounts outstanding. |
| |
| (2) | | The amount of interest income on nontaxable securities and loans has been adjusted to a tax equivalent basis, using a 34% tax rate. |
| |
| (3) | | Interest income on loans includes loan fees. |
57
Management’s Discussion and Analysis of
Financial Condition and Results of Operations
The following table presents the dollar amount, in thousands, of changes in interest income and interest expense for major components of interest-earning assets and interest-bearing obligations. It distinguishes between changes related to higher or lower outstanding balances and changes due to the levels and fluctuations in interest rates. For each category of interest-earning assets and interest-bearing obligations, information is provided for changes attributable to (i) changes in volume (i.e. changes in volume multiplied by old rate) and (ii) changes in rate (i.e., changes in rate multiplied by old volume). For purposes of this table, changes attributable to both rate and volume are shown as a separate variance.
| | | | | | | | | | | | | | | | | | | | | | | | | | | | | | | | | |
| | | Years ended December 31, | |
| | | 2007 vs. 2006 | | | 2006 vs. 2005 | |
| | | Increase (Decrease) | | | | | | | Increase (Decrease) | | | | |
| | | Due to | | | | | | | Due to | | | | |
| | | | | | | | | | | | | | | Total | | | | | | | | | | | | | | | Total | |
| | | | | | | | | | | Rate | | | Increase | | | | | | | | | | | Rate | | | Increase | |
| | | Volume | | | Rate | | | and Volume | | | (Decrease) | | | Volume | | | Rate | | | and Volume | | | (Decrease) | |
Interest earning assets: | | | | | | | | | | | | | | | | | | | | | | |
| Loans | | $ | 4,369 | | | $ | 332 | | | $ | 65 | | | $ | 4,766 | | | $ | 5,215 | | | $ | 1,414 | | | $ | 483 | | | $ | 7,112 | |
| Taxable securities | | | (279 | ) | | | 253 | | | | (60 | ) | | | (86 | ) | | | (270 | ) | | | 1 | | | | — | | | | (269 | ) |
| Nontaxable securities | | | (132 | ) | | | (132 | ) | | | 132 | | | | (132 | ) | | | (138 | ) | | | 38 | | | | (21 | ) | | | (121 | ) |
| Federal funds sold | | | (180 | ) | | | 25 | | | | (8 | ) | | | (163 | ) | | | 24 | | | | 203 | | | | 16 | | | | 243 | |
| Other interest earning assets | | | 19 | | | | 74 | | | | 6 | | | | 99 | | | | (31 | ) | | | 12 | | | | (2 | ) | | | (21 | ) |
| | | | | | | | | | | | | | | | | | | | | | | | | |
| | | | | | | | | | | | | | | | | | | | | | | | | | | | | | | | | |
| Total interest earning assets | | $ | 3,797 | | | $ | 552 | | | $ | 135 | | | $ | 4,484 | | | $ | 4,800 | | | $ | 1,668 | | | $ | 476 | | | $ | 6,944 | |
| | | | | | | | | | | | | | | | | | | | | | | | | |
| | | | | | | | | | | | | | | | | | | | | | | | | | | | | | | | | |
Interest bearing obligations | | | | | | | | | | | | | | | | | | | | | | |
| NOW and money market deposits | | $ | 242 | | | $ | 148 | | | $ | 16 | | | $ | 406 | | | $ | 275 | | | $ | 688 | | | $ | 167 | | | $ | 1,130 | |
| Savings deposits | | | (20 | ) | | | 10 | | | | (1 | ) | | | (11 | ) | | | (34 | ) | | | 65 | | | | (11 | ) | | | 20 | |
| CDs <$100,000 | | | 387 | | | | 459 | | | | 49 | | | | 895 | | | | 615 | | | | 652 | | | | 188 | | | | 1,455 | |
| CDs >$100,000 | | | 268 | | | | 52 | | | | 17 | | | | 337 | | | | 196 | | | | 163 | | | | 78 | | | | 437 | |
| Brokered deposits | | | 650 | | | | 316 | | | | 56 | | | | 1,022 | | | | 1,081 | | | | 670 | | | | 522 | | | | 2,273 | |
| Borrowings | | | 77 | | | | 89 | | | | 4 | | | | 170 | | | | (154 | ) | | | 110 | | | | (9 | ) | | | (53 | ) |
| | | | | | | | | | | | | | | | | | | | | | | | | |
| | | | | | | | | | | | | | | | | | | | | | | | | | | | | | | | | |
| Total interest bearing obligations | | $ | 1,604 | | | $ | 1,074 | | | $ | 141 | | | $ | 2,819 | | | $ | 1,979 | | | $ | 2,348 | | | $ | 935 | | | $ | 5,262 | |
| | | | | | | | | | | | | | | | | | | | | | | | | |
| | | | | | | | | | | | | | | | | | | | | | | | | | | | | | | | | |
Net interest income | | | | | | | | | | | | | | $ | 1,665 | | | | | | | | | | | | | | | $ | 1,682 | |
| | | | | | | | | | | | | | | | | | | | | | | | | | | | | | | |
Provision for Loan Losses
The Corporation records a provision for loan losses when it believes it is necessary to adjust the allowance for loan losses to maintain an adequate level after considering factors such as loan charge-offs and recoveries, changes in identified levels of risk in the loan portfolio, changes in the mix of loans in the portfolio, loan growth, and other economic factors. During the third quarter of 2007, the Corporation recorded a $.400 million provision in order to provide for the potential loss related to a commercial loan. In 2006, a negative loan loss provision of $.860 million was recorded. This negative provision was recorded due in part to recognize the overall reduction in loan portfolio risk and also as a direct result of a specific reserve reduction from a payoff of a problem loan. There was no provision for loan losses for the year ended December 31, 2005.
Noninterest Income
Noninterest income was $2.006 million, $.983 million, and $1.111 million in 2007, 2006, and 2005, respectively. The principal recurring sources of noninterest income are fees for services related to deposit and loan accounts. In 2007, the Corporation recognized $.470 million of income from the settlement of a lawsuit against its former accountants.
58
Management’s Discussion and Analysis of
Financial Condition and Results of Operations
The following table details noninterest income for the three years ended December 31 (dollars in thousands):
| | | | | | | | | | | | | | | | | | | | | |
| Noninterest Income | | | | | | | | | | | | | | % Increase (Decrease) | |
| | | 2007 | | | 2006 | | | 2005 | | | 2007-2006 | | | 2006-2005 | |
| Service fees | | $ | 688 | | | $ | 547 | | | $ | 586 | | | | 25.78 | % | | | (6.66 | )% |
| Net gains on loan sales | | | 498 | | | | 197 | | | | 49 | | | | 152.79 | | | | 302.04 | |
| Proceeds from settlement of lawsuit | | | 470 | | | | — | | | | — | | | | 100.00 | | | | — | |
| Other | | | 351 | | | | 240 | | | | 381 | | | | 46.25 | | | | (37.01 | ) |
| | | | | | | | | | | | | | | | |
| Subtotal | | | 2,007 | | | | 984 | | | | 1,016 | | | | 103.96 | | | | (3.15 | ) |
| | | | | | | | | | | | | | | | |
| Net security gains | | | (1 | ) | | | (1 | ) | | | 95 | | | | — | | | | (101.05 | ) |
| | | | | | | | | | | | | | | | |
| Total noninterest income | | $ | 2,006 | | | $ | 983 | | | $ | 1,111 | | | | 104.07 | % | | | (11.52 | )% |
| | | | | | | | | | | | | | | | |
The Corporation increased income from net gains on loan sales from $.197 million in 2006 to $.498 million in 2007. The gains in 2007 included significant activity from SBA loan sales which will continue to be a focus in future periods as the Corporation utilizes its lending expertise to facilitate financing for borrowers that have been increased risks but qualify for small business loan guarantee programs. Management continually reviews the pricing on its deposit products in relation to competition and alternative sources of funds. Service fees increased in 2007 largely due to the introduction of a deposit overdraft program late in 2006. Management expects to continue to fairly price its fees for services rendered.
Noninterest Expense
Noninterest expense was $12.100 million in 2007, compared to $12.221 million and $18.255 million in 2006 and 2005, respectively.
In 2007, the Corporation continued efforts to control or decrease noninterest expense. The most significant decrease in 2007 was in professional service fees, specifically legal expense, largely due to reduced cases in litigation and reductions in estimated liabilities of ongoing lawsuits. In the pursuit of this case in 2006, the Corporation expensed $.550 million. This case was settled in March 2007 with the Corporation recovering a majority of the legal fees expensed.
Loan and deposit expense also declined in 2007 due primarily to reduced FDIC deposit premium insurance which totaled $35,000 in 2007 compared to $106,000 in 2006 and $322,000 in 2005. The decrease in this expense in 2007 was due to a one-time FDIC assessment credit which the Bank was able to use to offset quarterly assessments. This assessment credit will also offset a good portion of 2008 and 2009 FDIC deposit assessments.
Salary and employee benefit expenses increased in 2007 by $.625 million. This increase was largely attributed to staffing increases by the Corporation to support deposit gathering initiatives related to small and medium sized businesses.
Data processing expenses, increased in 2007 by $94,000, or 13.6%. The increase in data processing from 2006 to 2007 was due primarily from added services, such as remote capture deposit services, along with increased volumes.
The total advertising costs for 2007 and 2006 included normal promotional and community marketing advertising programs compared to the 2005 expenses which were abnormally high because of the extensive new product introductions and the “mBank” re-branding which occurred. In 2007, the Corporation increased advertising expenses due to new product introduction ads and various community promotional events. Management expects to be successful in controlling noninterest expense in future periods.
In 2005, the Corporation, as a part of overall restructuring, incurred significant one-time charges, which included the $4.320 million FHLB prepayment penalty, $.550 million of advertising expenses incurred to promote the new mBank identity, new deposit products, full system conversion costs of $.815 million, and the $.200 million write-down of an other real estate property. The Corporation was also successful in 2005 in significantly reducing accounting, legal, and consulting fees due to increased management expertise and less reliance on external professionals.
59
Management’s Discussion and Analysis of
Financial Condition and Results of Operations
The following table details noninterest expense for the three years ended December 31 (dollars in thousands):
Noninterest Expense
| | | | | | | | | | | | | | | | | | | | | |
| | | | | | | | | | | | | | | % Increase (Decrease) | |
| | | 2007 | | | 2006 | | | 2005 | | | 2007-2006 | | | 2006-2005 | |
| Salaries and employee benefits | | $ | 6,757 | | | $ | 6,132 | | | $ | 6,090 | | | | 10.19 | % | | | 0.69 | % |
| Occupancy | | | 1,272 | | | | 1,264 | | | | 1,053 | | | | 0.63 | | | | 20.04 | |
| Furniture and equipment | | | 678 | | | | 631 | | | | 560 | | | | 7.45 | | | | 12.68 | |
| Data processing | | | 785 | | | | 691 | | | | 1,720 | | | | 13.60 | | | | (59.83 | ) |
| Professional service fees: | | | | | | | | | | | | | | | | | | | | |
| Accounting | | | 308 | | | | 273 | | | | 284 | | | | 12.82 | | | | (3.87 | ) |
| Legal | | | 42 | | | | 927 | | | | 361 | | | | (95.47 | ) | | | 156.79 | |
| Consulting and other | | | 182 | | | | 225 | | | | 241 | | | | (19.11 | ) | | | (6.64 | ) |
| | | | | | | | | | | | | | | | |
| Total professional service fees | | | 532 | | | | 1,425 | | | | 886 | | | | (62.67 | ) | | | 60.84 | |
| Loan and deposit | | | 285 | | | | 392 | | | | 852 | | | | (27.30 | ) | | | (53.99 | ) |
| Telephone | | | 228 | | | | 210 | | | | 271 | | | | 8.57 | | | | (22.51 | ) |
| ORE writedowns/impairment | | | 40 | | | | — | | | | 200 | | | | 100.00 | | | | (100.00 | ) |
| (Gain) loss on sale of premises, equipment branch and other real estate | | | (17 | ) | | | (60 | ) | | | 51 | | | | (71.67 | ) | | | (217.65 | ) |
| Advertising | | | 370 | | | | 281 | | | | 768 | | | | 31.67 | | | | (63.41 | ) |
| Amortization of intangibles | | | 82 | | | | 125 | | | | 125 | | | | (34.40 | ) | | | — | |
| Penalty on prepayment of FHLB borrowings | | | — | | | | — | | | | 4,320 | | | | — | | | | (100.00 | ) |
| Other operating expenses | | | 1,088 | | | | 1,130 | | | | 1,359 | | | | (3.72 | ) | | | (16.85 | ) |
| | | | | | | | | | | | | | | | |
| | | | | | | | | | | | | | | | | | | | | |
| Total noninterest expense | | $ | 12,100 | | | $ | 12,221 | | | $ | 18,255 | | | | (.99) | % | | | (33.05 | )% |
| | | | | | | | | | | | | | | | |
Federal Income Taxes
The Corporation recognized a federal deferred tax benefit of $7.500 million in the third quarter of 2007. The recognition of this deferred tax benefit relates to the generally accepted accounting principles applicable to the probability of utilizing the NOL and tax credit carryforwards of the Corporation. The Corporation, based upon current profitability trends largely supported by expansion of the net interest margin and controlled expenses, determined that the utilization of the NOL carryforward was probable. This tax benefit was recorded by reducing the valuation allowance that was recorded against the deferred tax assets of the Corporation. In 2006, the Corporation recognized a portion of this benefit, $500,000, based upon the then current probabilities. The $7.500 million recognition is based upon assumptions of a sustained level of taxable income within the NOL carryforward period and takes into account Section 382, establishing annual limitations. A valuation allowance is provided against deferred tax assets when it is more likely than not that some or all of the deferred tax assets will not be realized. As of December 31, 2007, the Corporation had an NOL carryforward of approximately $34.2 million along with various credit carryforwards of $2.1 million. This NOL and credit carryforward benefit is dependent upon the future profitability of the Corporation. A portion of the NOL, approximately $22 million, and all of the tax credit carryforwards are also subject to the use limitations of Section 382 of the Internal Revenue Code since they originated prior to the December 2004 recapitalization of the Corporation. The Corporation’s results of operations for the first nine month periods in 2007 and the entire 2006 year do not reflect the impact of federal income taxes due to the NOL carryforwards, a portion of which was utilized in each period to offset current federal taxes. The Corporation intends to further evaluate the utilization of the NOL and credit carryforwards in subsequent periods to determine if any further adjustment to the valuation allowance is necessary. The determination criteria for recognition of deferred tax benefits will include the assumption of future period taxable income based upon the projected profitability of the Corporation. The Corporation, in future periods, will record a current federal tax provision on income.
60
Management’s Discussion and Analysis of
Financial Condition and Results of Operations
QUANTITATIVE AND QUALITATIVE DISCLOSURES ABOUT MARKET RISK
Interest Rate Risk
In general, the Corporation attempts to manage interest rate risk by investing in a variety of assets which afford it an opportunity to reprice assets and increase interest income at a rate equal to or greater than the interest expense associated with repricing liabilities.
Interest rate risk is the exposure of the Corporation to adverse movements in interest rates. The Corporation derives its income primarily from the excess of interest collected on its interest-earning assets over the interest paid on its interest-bearing obligations. The rates of interest the Corporation earns on its assets and owes on its obligations generally are established contractually for a period of time. Since market interest rates change over time, the Corporation is exposed to lower profitability if it cannot adapt to interest rate changes. Accepting interest rate risk can be an important source of profitability and shareholder value; however, excess levels of interest rate risk could pose a significant threat to the Corporation’s earnings and capital base. Accordingly, effective risk management that maintains interest rate risk at prudent levels is essential to the Corporation’s safety and soundness.
Loans are the most significant earning asset. Management offers commercial and real estate loans priced at interest rates which fluctuate with various indices, such as the prime rate or rates paid on various government issued securities. When loans are made with longer-term fixed rates, the Corporation attempts to match these balances with sources of funding with similar maturities in order to mitigate interest rate risk. In addition, the Corporation prices loans so it has an opportunity to reprice the loan within 12 to 36 months.
The Bank has $21.597 million of securities, with a weighted average maturity of 7 months. The investment portfolio is intended to provide a source of liquidity to the Corporation with limited interest rate risk. The Corporation also has investments in federal funds sold to correspondent banks, as well as other interest bearing deposits with correspondent banks. These funds are generally repriced on a daily basis.
The Corporation offers deposit products with a variety of terms ranging from deposits whose interest rates can change on a weekly basis to certificates of deposit with repricing terms of up to five years. Longer-term deposits generally include penalty provisions for early withdrawal.
Beyond general efforts to shorten the loan pricing periods and extend deposit maturities, management can manage interest rate risk by the maturity periods of securities purchased, selling securities available for sale, and borrowing funds with targeted maturity periods, among other strategies. Also, the rate of interest rate changes can impact the actions taken, since the speed of change affects borrowers and depositors differently.
Exposure to interest rate risk is reviewed on a regular basis. Interest rate risk is the potential of economic losses due to future interest rate changes. These economic losses can be reflected as a loss of future net interest income and/or a loss of current fair market values. The objective is to measure the effect of interest rate changes on net interest income and to structure the composition of the balance sheet to minimize interest rate risk and, at the same time, maximize income.
Management realizes certain risks are inherent and that the goal is to identify and minimize the risks. Tools used by management include maturity and repricing analysis and interest rate sensitivity analysis. The Bank has monthly asset/ liability meetings with an outside consultant to review its current position and strategize about future opportunities on risks relative to pricing and positioning of assets and liabilities.
The difference between repricing assets and liabilities for a specific period is referred to as the GAP. An excess of repricable assets over liabilities is referred to as a positive gap. An excess of repricable liabilities over assets is referred to as a negative gap. The cumulative gap is the summation of the gap for all periods to the end of the period for which the cumulative gap is being measured.
Assets and liabilities scheduled to reprice are reported in the following timeframes. Those instruments with a variable interest rate tied to an index and considered immediately repricable are reported in the 1 to 90 day timeframe. The estimates of principal amortization and prepayments are assigned to the following time frames.
61
Management’s Discussion and Analysis of
Financial Condition and Results of Operations
The following is the Corporation’s repricing opportunities at December 31, 2007 (dollars in thousands):
| | | | | | | | | | | | | | | | | | | | | |
| | | 1-90 | | | 91-365 | | | >1-5 | | | Over 5 | | | | |
| | | Days | | | Days | | | Years | | | Years | | | Total | |
| Interest-earning assets: | | | | | | | | | | | | | | | | | | | | |
| Loans | | $ | 241,600 | | | $ | 8,309 | | | $ | 29,069 | | | $ | 76,101 | | | $ | 355,079 | |
| Securities | | | 9,056 | | | | 9,997 | | | | 2,000 | | | | 544 | | | | 21,597 | |
| Other | | | 1,976 | | | | — | | | | — | | | | 3,794 | | | | 5,770 | |
| | | | | | | | | | | | | | | | |
| | | | | | | | | | | | | | | | | | | | | |
| Total interest-earning assets | | | 252,632 | | | | 18,306 | | | | 31,069 | | | | 80,439 | | | | 382,446 | |
| | | | | | | | | | | | | | | | |
| | | | | | | | | | | | | | | | | | | | | |
| Interest-bearing obligations: | | | | | | | | | | | | | | | | | | | | |
| NOW, Money Market, and Savings deposits | | | 93,645 | | | | — | | | | — | | | | — | | | | 93,645 | |
| Time deposits | | | 32,668 | | | | 60,067 | | | | 9,427 | | | | 800 | | | | 102,962 | |
| Brokered CDs | | | 75,746 | | | | 22,917 | | | | — | | | | — | | | | 98,663 | |
| Borrowings | | | 27,710 | | | | 1,959 | | | | 15,000 | | | | 1,280 | | | | 45,949 | |
| | | | | | | | | | | | | | | | |
| | | | | | | | | | | | | | | | | | | | | |
| Total interest-bearing obligations | | | 229,769 | | | | 84,943 | | | | 24,427 | | | | 2,080 | | | | 341,219 | |
| | | | | | | | | | | | | | | | |
| | | | | | | | | | | | | | | | | | | | | |
| GAP | | $ | 22,863 | | | $ | 66,637 | ) | | $ | 6,642 | | | $ | 78,359 | | | $ | 41,227 | |
| | | | | | | | | | | | | | | | |
| | | | | | | | | | | | | | | | | | | | | |
| Cumulative GAP | | $ | 22,863 | | | $ | (43,774 | ) | | $ | 37,132 | ) | | $ | 41,227 | | | | | |
| | | | | | | | | | | | | | | | | |
The above analysis indicates that at December 31, 2007, the Corporation had a cumulative liability sensitivity GAP position of $43.774 million within the one-year timeframe. The Corporation’s cumulative liability sensitive GAP suggests that if market interest rates continue to increase in the next twelve months, the Corporation has the potential to earn less net interest income. Conversely, if market interest rates decrease in the next twelve months, the above GAP position suggests the Corporation’s net interest income would increase.
A limitation of the traditional GAP analysis is that it does not consider the timing or magnitude of non-contractual repricing or unexpected prepayments. In addition, the GAP analysis treats savings, NOW and money market accounts as repricing within 90 days, while experience suggests that these categories of deposits are actually comparatively resistant to rate sensitivity.
The borrowings in the table above and on the next page include $15 million of FHLB advances as fixed-rate advances. These advances actually give the FHLB the option to convert from a fixed-rate advance to an adjustable rate advance with quarterly repricing at three month LIBOR Flat. The exercise of this conversion feature by the FHLB would impact the maturity dates currently assumed in the tables.
The Corporation’s primary market risk exposure is interest rate risk and, to a lesser extent, liquidity risk and foreign exchange risk. The Corporation has no market risk sensitive instruments held for trading purposes. The Corporation has limited agricultural-related loan assets, and therefore, has minimal significant exposure to changes in commodity prices. Any impact that changes in foreign exchange rates and commodity prices would have on interest rates are assumed to be insignificant.
Evaluating the exposure to changes in interest rates includes assessing both the adequacy of the process used to control interest rate risk and the quantitative level of exposure. The Corporation’s interest rate risk management process seeks to ensure that appropriate policies, procedures, management information systems, and internal controls are in place to maintain interest rate risk at prudent levels with consistency and continuity. In evaluating the quantitative level of interest rate risk, the Corporation assesses the existing and potential future effects of changes in interest rates on its financial condition, including capital adequacy, earnings, liquidity, and asset quality.
62
Management’s Discussion and Analysis of
Financial Condition and Results of Operations
The table below measures current maturity levels of interest-earning assets and interest-bearing obligations, along with average stated rates and estimated fair values at December 31, 2007 (dollars in thousands). Nonaccrual loans of $3.298 million are included in the table at an average interest rate of 0.0% and a maturity greater than five years.
| | | | | | | | | | | | | | | | | | | | | | | | | | | | | | | | | |
| Principal/Notional Amount Maturing/Repricing In: | |
| | | | | | | | | | | | | | | | | | | | | | | | | | | | | | | Fair Value | |
| | | 2008 | | | 2009 | | | 2010 | | | 2011 | | | 2012 | | | Thereafter | | | Total | | | 12/31/2007 | |
Rate Sensitive Assets | | | | | | | | | | | | | | | | | | | | | | | | | | | | | | | | |
| Fixed interest rate securities | | $ | 18,975 | | | $ | 2,004 | | | $ | 6 | | | $ | 6 | | | $ | 7 | | | $ | 599 | | | $ | 21,597 | | | $ | 21,597 | |
| Average interest rate | | | 4.38 | % | | | 4.05 | % | | | 7.00 | % | | | 7.00 | % | | | 7.00 | % | | | 8.02 | % | | | 4.45 | % | | | | |
| | | | | | | | | | | | | | | | | | | | | | | | | | | | | | | | | |
| Fixed interest rate loans | | | 14,167 | | | | 21,903 | | | | 30,210 | | | | 17,621 | | | | 16,468 | | | | 16,703 | | | | 117,072 | | | | 115,683 | |
| Average interest rate | | | 7.32 | | | | 7.93 | | | | 7.65 | | | | 7.75 | | | | 7.51 | | | | 7.39 | | | | 7.62 | | | | | |
| | | | | | | | | | | | | | | | | | | | | | | | | | | | | | | | | |
| Variable interest rate loans | | | 234,773 | | | | — | | | | — | | | | — | | | | — | | | | 3,234 | | | | 238,007 | | | | 238,975 | |
| Average interest rate | | | 7.58 | | | | — | | | | — | | | | — | | | | — | | | | — | | | | 7.58 | | | | | |
| | | | | | | | | | | | | | | | | | | | | | | | | | | | | | | | | |
| Other assets | | | 1,976 | | | | — | | | | — | | | | — | | | | — | | | | 3,794 | | | | 5,770 | | | | 5,770 | |
| Average interest rate | | | 3.48 | | | | — | | | | — | | | | — | | | | — | | | | 4.75 | | | | 4.31 | | | | | |
| | | | | | | | | | | | | | | | | | | | | | | | | | | | | | | | | |
| | | | | | | | | | | | | | | | | | | | | | | | | |
| Total rate sensitive assets | | $ | 269,891 | | | $ | 23,907 | | | $ | 30,216 | | | $ | 17,627 | | | $ | 16,475 | | | $ | 24,330 | | | $ | 382,446 | | | $ | 382,025 | |
| | | | | | | | | | | | | | | | | | | | | | | | | |
| Average interest rate | | | 7.31 | % | | | 7.60 | % | | | 7.65 | % | | | 7.75 | % | | | 7.51 | % | | | 6.01 | % | | | 6.92 | % | | | | |
| | | | | | | | | | | | | | | | | | | | | | | | | |
| | | | | | | | | | | | | | | | | | | | | | | | | | | | | | | | | |
Rate Sensitive Liabilities | | | | | | | | | | | | | | | | | | | | | | | | | | | | | | | | |
| Interest-bearing savings, NOW, and MMAs | | | 93,645 | | | | — | | | | — | | | | — | | | | — | | | | — | | | | 93,645 | | | | 93,645 | |
| Average interest rate | | | 3.19 | % | | | — | | | | — | % | | | — | % | | | — | % | | | — | % | | | 3.19 | % | | | | |
| | | | | | | | | | | | | | | | | | | | | | | | | | | | | | | | | |
| Time deposits | | | 189,247 | | | | 6,704 | | | | 3,085 | | | | 1,417 | | | | 376 | | | | 796 | | | | 201,625 | | | | 200,011 | |
| Average interest rate | | | 5.03 | | | | 4.48 | | | | 4.75 | | | | 4.74 | | | | 9.75 | | | | 6.68 | | | | 5.02 | | | | | |
| | | | | | | | | | | | | | | | | | | | | | | | | | | | | | | | | |
| Fixed interest rate borrowings | | | — | | | | — | | | | — | | | | — | | | | — | | | | 1,280 | | | | 1,280 | | | | 1,280 | |
| Average interest rate | | | — | | | | — | | | | — | | | | — | | | | — | | | | 1.00 | | | | 1.00 | | | | | |
| | | | | | | | | | | | | | | | | | | | | | | | | | | | | | | | | |
| Variable interest rate borrowings | | | 9,669 | | | | — | | | | 15,000 | | | | 20,000 | | | | — | | | | — | | | | 44,669 | | | | 44,831 | |
| Average interest rate | | | 4.80 | | | | — | | | | 5.10 | | | | 5.08 | | | | — | | | | — | | | | 5.03 | | | | | |
| | | | | | | | | | | | | | | | | | | | | | | | | | | | | | | | | |
| | | | | | | | | | | | | | | | | | | | | | | | | |
| Total rate sensitive liabilities | | $ | 292,561 | | | $ | 6,704 | | | $ | 18,085 | | | $ | 21,417 | | | $ | 376 | | | $ | 2,076 | | | $ | 341,219 | | | $ | 339,767 | |
| | | | | | | | | | | | | | | | | | | | | | | | | |
| Average interest rate | | | 4.43 | % | | | 4.48 | % | | | 5.04 | % | | | 5.06 | % | | | 9.75 | % | | | 3.18 | % | | | 4.48 | % | | | | |
| | | | | | | | | | | | | | | | | | | | | | | | | |
In addition to changes in interest rates, the level of future net interest income is also dependent on a number of variables, including: the growth, composition and levels of loans, deposits, and other earning assets and interest-bearing obligations, and economic and competitive conditions; potential changes in lending, investing, and deposit strategies; customer preferences; and other factors.
Foreign Exchange Risk
In addition to managing interest rate risk, management also actively manages risk associated with foreign exchange. The Corporation provides foreign exchange services, makes loans to, and accepts deposits from, Canadian customers primarily at its banking office in Sault Ste. Marie. To protect against foreign exchange risk, the Corporation monitors the volume of Canadian deposits it takes in and then invests these Canadian funds in Canadian commercial loans and securities. As of December 31, 2007, the Corporation had excess Canadian assets of $.146 million (or $.143 million in U.S. dollars). Management believes the exposure to short-term foreign exchange risk is minimal and at an acceptable level for the Corporation. Management intends to limit the Corporation’s foreign exchange risk by acquiring deposit liabilities approximately equal to its Canadian assets.
63
Management’s Discussion and Analysis of
Financial Condition and Results of Operations
Off-Balance-Sheet Risk
Derivative financial instruments include futures, forwards, interest rate swaps, option contracts and other financial instruments with similar characteristics. The Corporation currently does not enter into futures, forwards, swaps or options. However, the Corporation is party to financial instruments with off-balance-sheet risk in the normal course of business to meet the financing needs of its customers. These financial instruments include commitments to extend credit and standby letters of credit and involve to varying degrees, elements of credit and interest rate risk in excess of the amount recognized in the consolidated balance sheets. Commitments to extend credit are agreements to lend to a customer as long as there is no violation of any condition established in the contract. Commitments generally have fixed expiration dates and may require collateral from the borrower if deemed necessary by the Corporation. Standby letters of credit are conditional commitments issued by the Corporation to guarantee the performance of a customer to a third party up to a stipulated amount and with specified terms and conditions.
Commitments to extend credit and standby letters of credit are not recorded as an asset or liability by the Corporation until the instrument is exercised. See Note 19 to the consolidated financial statements for additional information.
LIQUIDITY
Liquidity is defined as the ability to generate cash at a reasonable cost to fulfill lending commitments and support asset growth, while satisfying the withdrawal demands of customers and make payments on existing borrowing commitments. The Bank’s principal sources of liquidity are core deposits and loan and investment payments and prepayments. Providing a secondary source of liquidity is the available for sale investment portfolio. As a final source of liquidity, the Bank can exercise existing credit arrangements.
The Corporation’s primary source of liquidity on a stand-alone basis is dividends from the Bank. The Bank is currently prohibited from paying dividends because of a deficit in retained earnings. The Bank, in order to pay dividends in future periods, will need to restate its capital accounts, which requires the approval of the Office of Financial and Insurance Services of the State of Michigan. The Corporation has a $6 million correspondent bank line of credit available for short-term liquidity. This line of credit has an outstanding balance of $1.959 million as of December 31, 2007. The Corporation is currently exploring alternative opportunities for longer term sources of liquidity and permanent equity to support projected asset growth.
Liquidity is managed by the Corporation through its Asset and Liability Committee (“ALCO”). The ALCO Committee meets monthly to discuss asset and liability management in order to address liquidity and funding needs to provide a process to seek the best alternatives for investments of assets, funding costs, and risk management. The liquidity position of the Bank is managed daily, thus enabling the Bank to adapt its position according to market fluctuations. Core deposits are important in maintaining a strong liquidity position as they represent a stable and relatively low cost source of funds. The Bank’s liquidity is best illustrated by the mix in the Bank’s core and non-core funding dependence ratio, which explains the degree of reliance on non-core liabilities to fund long-term assets. Core deposits are herein defined as demand deposits, NOW (negotiable order withdrawals), money markets, savings and certificates of deposit under $100,000. Non-core funding consists of certificates of deposit greater than $100,000, brokered deposits, and FHLB and other borrowings. At December 31, 2007, the Bank’s core deposits in relation to total funding was 55.0% compared to 57.2% in 2006. These ratios indicated at December 31, 2006, that the Bank has decreased its reliance on non-core deposits and borrowings to fund the Bank’s long-term assets, namely loans and investments. The Bank believes that by maintaining adequate volumes of short-term investments and implementing competitive pricing strategies on deposits, it can ensure adequate liquidity to support future growth. The Bank also has correspondent lines of credit available to meet unanticipated short-term liquidity needs. As of December 31, 2007, the Bank had $14.875 million of unsecured lines available and another $10.571 million available if secured. As of December 31, 2007, the Bank had borrowings totaling $7.710 million against these available lines. The Bank believes that its liquidity position remains strong to meet both present and future financial obligations and commitments, events or uncertainties that have resulted or are reasonably likely to result in material changes with respect to the Bank’s liquidity.
From a long-term perspective, the Corporation’s liquidity plan for 2007 includes strategies to increase core deposits in the Corporation’s local markets. The new deposit products and strategic advertising are expected to aid in efforts of management in growing core deposits to reduce the dependency on non-core deposits, while also reducing interest costs. The Corporation’s liquidity plans in 2008 will continue to augment local deposit growth efforts with wholesale CD funding, to the extent necessary.
64
Management’s Discussion and Analysis of
Financial Condition and Results of Operations
CONTRACTUAL OBLIGATIONS AND COMMITMENTS
As disclosed in the Notes to the Consolidated Financial Statements, the Corporation has certain obligations and commitments to make future payments under contracts. At December 31, 2007, the aggregate contractual obligations and commitments are:
| | | | | | | | | | | | | | | | | | | | | |
| | | Payments Due by Period | |
| | | Less than 1 | | | 1 to 3 | | | 4 to 5 | | | After 5 | | | | |
| | | Year | | | Years | | | Years | | | Years | | | Total | |
| Contractual Obligations | | | | | | | | | | | | | | | | | | | | |
| | | | | | | | | | | | | | | | | | | | | |
| Total deposits | | $ | 308,449 | | | $ | 9,789 | | | $ | 1,793 | | | $ | 796 | | | $ | 320,827 | |
| Short-term borrowings | | | 1,959 | | | | — | | | | — | | | | — | | | | 1,959 | |
| Long-term borrowings | | | — | | | | 15,000 | | | | 20,000 | | | | 1,280 | | | | 36,280 | |
| Directors’ deferred compensation | | | 178 | | | | 274 | | | | 200 | | | | 1,069 | | | | 1,721 | |
| Annual rental / purchase commitments under noncancelable leases / contracts | | | 179 | | | | 358 | | | | 54 | | | | — | | | | 591 | |
| | | | | | | | | | | | | | | | |
| | | | | | | | | | | | | | | | | | | | | |
| TOTAL | | $ | 310,765 | | | $ | 25,421 | | | $ | 22,047 | | | $ | 3,145 | | | $ | 361,378 | |
| | | | | | | | | | | | | | | | |
| Other Commitments | | | | | | | | | | | | | | | | | | | | |
| | | | | | | | | | | | | | | | | | | | | |
| Letters of credit | | $ | 5,930 | | | $ | — | | | $ | — | | | $ | — | | | $ | 5,930 | |
| Commitments to extend credit | | | 51,958 | | | | — | | | | — | | | | — | | | | 51,958 | |
| Credit card commitments | | | 2,414 | | | | — | | | | — | | | | — | | | | 2,414 | |
| | | | | | | | | | | | | | | | |
| | | | | | | | | | | | | | | | | | | | | |
| TOTAL | | $ | 60,302 | | | $ | — | | | $ | — | | | $ | — | | | $ | 60,302 | |
| | | | | | | | | | | | | | | | |
65
Management’s Discussion and Analysis of
Financial Condition and Results of Operations
CAPITAL AND REGULATORY
As a bank holding company, the Corporation is required to maintain certain levels of capital under government regulation. There are several measurements of regulatory capital and the Corporation is required to meet minimum requirements under each measurement. The federal banking regulators have also established capital classifications beyond the minimum requirements in order to risk-rate deposit insurance premiums and to provide trigger points for prompt corrective action in the event an institution becomes financially troubled. As of December 31, 2007, the Corporation and Bank were well capitalized. During 2007, risk based capital increased by $3.408 million, while Tier 1 Capital increased by $3.375 million.
The following table details sources of capital for the three years ended December 31 (dollars in thousands):
| | | | | | | | | | | | | |
| | | 2007 | | | 2006 | | | 2005 | |
Capital Structure | | | | | | | | | | | | |
| Long-term debt | | $ | — | | | $ | — | | | $ | — | |
| Shareholders’ equity | | | 39,321 | | | | 28,790 | | | | 26,588 | |
| | | | | | | | | | |
| Total capitalization | | $ | 39,321 | | | $ | 28,790 | | | $ | 26,588 | |
| | | | | | | | | | |
| Tangible capital | | $ | 39,197 | | | $ | 28,585 | | | $ | 26,258 | |
| | | | | | | | | | |
| | | | | | | | | | | | | |
Intangible Assets | | | | | | | | | | | | |
| Subsidiaries: | | | | | | | | | | | | |
| Core deposit premium | | $ | 124 | | | $ | 205 | | | $ | 330 | |
| Other identifiable intangibles | | | — | | | | — | | | | — | |
| | | | | | | | | | |
| Total intangibles | | $ | 124 | | | $ | 205 | | | $ | 330 | |
| | | | | | | | | | |
| | | | | | | | | | | | | |
Risk-Based Capital | | | | | | | | | | | | |
| Tier 1 capital: | | | | | | | | | | | | |
| Shareholders’ equity | | $ | 39,321 | | | $ | 28,790 | | | $ | 26,588 | |
| Net unrealized (gains) losses on available for sale securities | | | (60 | ) | | | 187 | | | | 363 | |
| Less: disallowed deferred tax asset | | | (6,990 | ) | | | — | | | | — | |
| Less: intangibles | | | (124 | ) | | | (205 | ) | | | (330 | ) |
| | | | | | | | | | |
| Total Tier 1 capital | | $ | 32,147 | | | $ | 28,772 | | | $ | 26,621 | |
| | | | | | | | | | |
| Tier 2 Capital: | | | | | | | | | | | | |
| Allowable reserve for loan losses | | $ | 4,146 | | | $ | 4,113 | | | $ | 3,184 | |
| Qualifying long-term debt | | | — | | | | — | | | | — | |
| | | | | | | | | | |
| Total Tier 2 capital | | | 4,146 | | | | 4,113 | | | | 3,184 | |
| | | | | | | | | | |
| Total risk-based capital | | $ | 36,293 | | | $ | 32,885 | | | $ | 29,805 | |
| | | | | | | | | | |
Risk-weighted assets | | $ | 358,410 | | | $ | 328,133 | | | $ | 251,796 | |
| | | | | | | | | | |
Capital Ratios: | | | | | | | | | | | | |
| Tier 1 Capital to average assets | | | 8.05 | % | | | 7.85 | % | | | 9.23 | % |
| Tier 1 Capital to risk-weighted assets | | | 8.97 | % | | | 8.77 | % | | | 10.57 | % |
| Total Capital to risk-weighted assets | | | 10.13 | % | | | 10.02 | % | | | 11.84 | % |
Regulatory capital is not the same as shareholders’ equity reported in the accompanying financial statements. Certain assets cannot be considered assets for regulatory purposes. The Corporation’s acquisition intangibles and a portion of the deferred tax asset are examples of such assets.
66
Management’s Discussion and Analysis of
Financial Condition and Results of Operations
Presented below is a summary of the Corporation’s and Bank’s capital position in comparison to generally applicable regulatory requirements:
| | | | | | | | | | | | | | | | | | | | | |
| | | | | | | Tangible | | Tier 1 | | Tier 1 | | Total |
| | | Equity to | | Equity to | | Capital to | | Capital to | | Capital to |
| | | Year-end | | Year-end | | Average | | Risk Weighted | | Risk Weighted |
| | | Assets | | Assets | | Assets | | Assets | | Assets |
| Regulatory minimum for capital adequacy purposes | | | N/A | | | | N/A | | | | 4.00 | % | | | 4.00 | % | | | 8.00 | % |
| Regulatory defined well capitalized guideline | | | N/A | | | | N/A | | | | 5.00 | % | | | 6.00 | % | | | 10.00 | % |
| | | | | | | | | | | | | | | | | | | | | |
The Corporation: | | | | | | | | | | | | | | | | | | | | |
| | | | | | | | | | | | | | | | | | | | | |
December 31, 2007 | | | 9.62 | % | | | 9.59 | % | | | 8.05 | % | | | 8.97 | % | | | 10.13 | % |
| December 31, 2006 | | | 7.52 | % | | | 7.47 | % | | | 7.85 | % | | | 8.77 | % | | | 10.02 | % |
| | | | | | | | | | | | | | | | | | | | | |
The Bank: | | | | | | | | | | | | | | | | | | | | |
| | | | | | | | | | | | | | | | | | | | | |
December 31, 2007 | | | 10.04 | % | | | 10.01 | % | | | 8.51 | % | | | 9.49 | % | | | 10.63 | % |
| December 31, 2006 | | | 7.97 | % | | | 7.92 | % | | | 8.33 | % | | | 9.31 | % | | | 10.57 | % |
The Corporation intends to maintain the Bank’s total capital to risk-weighted assets at a minimum of 10.00% in order to qualify for reduced FDIC deposit based insurance.
IMPACT OF INFLATION AND CHANGING PRICES
The accompanying financial statements have been prepared in accordance with generally accepted accounting principles, which require the measurement of financial position and results of operations in historical dollars without considering the change in the relative purchasing power of money over time due to inflation. The impact of inflation is reflected in the increased cost of the Corporation’s operations. Nearly all the assets and liabilities of the Corporation are financial, unlike industrial or commercial companies. As a result, the Corporation’s performance is directly impacted by changes in interest rates, which are indirectly influenced by inflationary expectations. The Corporation’s ability to match the interest sensitivity of its financial assets to the interest sensitivity of its financial liabilities tends to minimize the effect of changes in interest rates on the Corporation’s performance. Changes in interest rates do not necessarily move to the same extent as changes in the prices of goods and services.
67
Directors and Officers
DIRECTORS
Mackinac Financial Corporation and mBank
| | | |
Walter J. Aspatore | | Robert H. Orley |
| Investment Banker | | Vice President and Secretary |
| Amherst Partners | | Real Estate Interests Group, Inc. |
Director Since: 2004 | | Director Since: 2004 |
| | | |
Dennis B. Bittner | | L. Brooks Patterson |
| Owner and President | | County Executive |
| Bittner Engineering, Inc. | | Oakland County |
Director Since: 2001 | | Director Since: 2006 |
| | | |
Joseph D. Garea | | Randolph C. Paschke |
| Managing Partner | | Chairman, Department of Accounting |
| Hancock Securities | | Wayne State University, School of Business Administration |
Director Since: 2007 | | Director Since: 2004 |
| | | |
Kelly W. George | | Eliot R. Stark |
| President, Mackinac Financial Corporation | | Vice Chairman |
| President and CEO, mBank | | Mackinac Financial Corporation |
Director Since: 2006 | | Director Since: 2004 |
| | | |
Robert E. Mahaney | | Paul D. Tobias |
| Sole Proprietor | | Chairman and CEO, Mackinac Financial Corporation |
| Veridea Group, LLC | | Chairman, mBank |
Director Since: 2008 | | Director Since: 2004 |
OFFICERS
| | | |
| Mackinac Financial Corporation | | mBank |
Paul D. Tobias | | Paul D. Tobias |
| Chairman and Chief Executive Officer | | Chairman |
| | | |
Eliot R. Stark | | Kelly W. George |
| Vice Chairman | | President and Chief Executive Officer |
| | | |
Kelly W. George | | David C. Crimmins |
| President | | Regional President, Southeast Michigan |
| | | |
Ernie R. Krueger | | Jack C. Frost |
| Executive Vice President/Chief Financial Officer | | Regional President, Upper Peninsula |
| | | |
| | | Andrew P. Sabatine |
| | | Regional President, Northern Lower Peninsula |
| | | |
| | | Ernie R. Krueger |
| | | Executive Vice President and Chief Financial Officer |
| | | |
| | | Kevin D. Evans |
| | | Senior Vice President/Branch Management/Retail Banking/Deposits |
| | | |
| | | Jake D. Martin |
| | | Senior Vice President — Information Technology |
| | | |
| | | Tamara R. McDowell |
| | | Senior Vice President/Senior Credit/Operations Officer |
| | | |
| | | Ann M. Stepp |
| | | Senior Vice President/Branch Administration Officer |
68
Branch Locations
UPPER PENINSULA
Regional President — Jack C. Frost
| | | | | |
MANISTIQUE | | NEWBERRY | | SOUTH RANGE |
| 130 South Cedar Street | | 414 Newberry Avenue | | 47 Trimountain Avenue |
| Manistique, MI 49854 | | Newberry, MI 49868 | | South Range, MI 49963 |
| (906) 341-8401 | | (906) 293-5165 | | (906) 482-1170 |
Manager: Julie L. Bosanic | | Manager: Michael A. Slaght | | Manager: Sandra L. Pesola |
| | | | | |
MARQUETTE MAIN | | ONTONAGON | | STEPHENSON |
| 300 North McClellan | | 601 River Street | | S216 Menominee Street |
| Marquette, MI 49855 | | Ontonagon, MI 49953 | | Stephenson, MI 49887 |
| (906) 226-5000 | | (906) 884-4115 | | (906) 753-2225 |
Manager: Teresa M. Same | | Manger: Sue A. Preiss | | Manager: Barbara A. Parrett |
| | | | | |
MARQUETTE PRESQUE ISLE | | SAULT STE. MARIE | | |
| 1400 Presque Isle | | 138 Ridge Street | | |
| Marquette, MI 49855 | | Sault Ste. Marie, MI 49783 | | |
| (906) 228-3640 | | (906) 635-3992 | | |
Bus. Dev. Officer: Shelby J. Bischoff | | Manager: David R. Thomas | | |
NORTHERN LOWER PENINSULA
Regional President — Andrew P. Sabatine
| | | | | |
GAYLORD | | KALEVA | | TRAVERSE CITY |
| 1955 South Otsego Avenue | | 14429 Wuoksi Avenue | | 3530 North Country Drive |
| Gaylord, MI 49735 | | Kaleva, MI 49645 | | Traverse City, MI 49684 |
| (989) 732-3750 | | (231) 362-3223 | | (231) 929-5600 |
Manager: Rosalba Boone | | Supervisor: Barb J. Miller | | Manager: Andrea M. Pease |
SOUTHEAST MICHIGAN
Regional President — David C. Crimmins
BIRMINGHAM
260 East Brown Street, Suite 300
Birmingham, MI 48009
(248) 290-5900
Manager: Elena C. Dritsas
69
Corporate Information
| | | |
CORPORATE HEADQUARTERS | | TRANSFER AGENT |
| Mackinac Financial Corporation | | Registrar and Transfer Company |
| 130 South Cedar Street | | 10 Commerce Drive |
| Manistique, Michigan 49854 | | Cranford, NJ 07016 |
| (888) 343-8147 | | (800) 368-5948 |
| | | |
INVESTOR RELATIONS | | WEBSITE |
| (888) 343-8147 | | www.bankmbank.com |
| | | |
INDEPENDENT REGISTERED PUBLIC ACCOUNTING FIRM | | STOCK LISTING AND SYMBOL |
| Plante and Moran, PLLC | | NASDAQ Small Cap Market |
| Auburn Hills, Michigan | | Symbol: MFNC |
SHAREHOLDER INFORMATION
Copies of the Corporation’s 10-K and 10-Q reports as filed with the Securities and Exchange Commission are available upon request from the Corporation.
ANNUAL SHAREHOLDERS’ MEETING
The 2008 Annual Meeting of the Shareholders of Mackinac Financial Corporation will be held on Wednesday, May 28, 2008.
Visit our website, www.bankmbank.com, for updated news releases, financial reports, SEC filings, corporate governance and other investor information
70