Exhibit 99

PRESS RELEASE
| For Release: | April 30, 2009 | |
| Nasdaq: | MFNC | |
| Contact: | Investor Relations at (888) 343-8147 | |
| Website: | www.bankmbank.com |
MACKINAC FINANCIAL CORPORATION
REPORTS FIRST QUARTER 2009 RESULTS
REPORTS FIRST QUARTER 2009 RESULTS
(Manistique, Michigan) – Mackinac Financial Corporation (Nasdaq: MFNC), the bank holding company for mBank (the “Bank”) today announced first quarter 2009 income of $.090 million or $.03 per share compared to net income of $.139 million, or $.04 per share for the first quarter of 2008. Operating results for the first quarter of 2009 included a provision for loan losses of $.550 million. There was no provision for the first quarter of 2008. Weighted average shares outstanding amounted to 3,419,736 in the first quarter of 2009 and 3,428,695 in the first quarter of 2008.
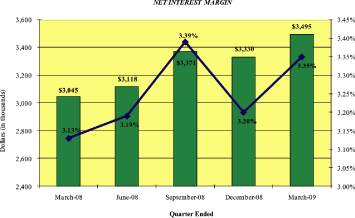
Net interest margin in the first quarter of 2009 increased to $3.495 million, 3.35%, compared to $3.045 million, or 3.13%, in the first quarter of 2008. This increase was primarily due to a reduction in funding costs between periods, as interest rates on brokered deposits declined. Paul Tobias, Chairman and Chief Executive Officer, commented, “We are pleased with the improvement in our net interest margin, which reflects not only the benefits received from decreased pricing on wholesale deposits, but also the positive impact of our disciplined internal loan and deposit pricing. In this low interest rate environment, we have been diligent in setting interest rate floors on loans and have aggressively lowered rates on deposit products, which will translate into increased margin contribution in future periods.”
Noninterest income, at $.391 million in the first quarter of 2009, increased $.081 million from the first quarter 2008 level of $.310 million, largely due to increased service fees. Noninterest expense of $3.239 million reflects an increase in FDIC insurance premiums of $.116 million for the first quarter of 2009 and in total showed a moderate increase of $.048 million, or 1.5%, from the first quarter of 2008.
Total assets of the Corporation at March 31, 2009 were $466.375 million, up 11.79 percent from the $417.175 million in total assets reported at March 31, 2008. First quarter 2009 total assets were up 3.31 percent from the $451.431 million of total assets at year-end 2008.
Total loans at March 31, 2009 were $370.776 million, a 2.98% increase from the $360.056 million at March 31, 2008. Total loans at the end of the first quarter of 2009 were up slightly from year-end 2008 total loans of $370.281 million. Tobias stated, “Loan growth in the first quarter was impacted by $14.425 million in paydowns; however, our first quarter new loan production was relatively strong at $9.390 million, with almost all new production occurring in the Upper Peninsula, which has not had the severe level of economic downturn that other parts of the state have experienced. We will be seeking loan growth opportunities in 2009 but will continue to adhere to our strict credit standards and pricing.”
Total deposits of $385.757 million at March 31, 2009 were up 18.31 percent from deposits of $326.047 million on March 31, 2008. Deposits were up 3.95 percent from year-end 2008 deposits of $371.097 million. Deposit growth increases in the 2009 first quarter were due to increases in wholesale brokered deposits of $11.123 million and growth in bank deposits of $3.537 million, primarily low cost transactional deposits. Deposit balances increased by $59.710 million from March 2008 to March 2009, with increased brokered deposits accounting for substantially all of the growth.
Nonperforming assets at the end of the first quarter of 2009 totaled $15.489 million which was up $8.413 million from 2008 year end balances. The increase in nonperforming assets in the first quarter includes two large commercial credit relationships in Southeast Michigan, with a total balance of $5.8 million. Tobias, commenting on credit quality, stated, “The Southeastern Michigan market continues to weaken. Real estate values have fallen rapidly. Our additions to nonperforming assets reflect two credits where original collateral values have decreased to the point where we needed to add to our reserve for loan losses. We are actively involved with these borrowers and are taking all necessary steps to collect our principal and minimize earnings impact.”
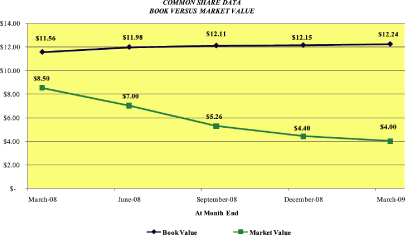
Shareholders’ equity at March 31, 2009 totaled $41.864 million, or $12.24 per share, compared to $39.633 million, or $11.56 per share on March 31, 2007.
Tobias concluded, “We start 2009 with a cautious, but positive outlook for the future. Our net interest margin will provide a solid platform for enhanced earnings; however, we are concerned about the economy, which continues to stress our borrowers. Late in April, we received the $11 million proceeds from the issuance of Series A Preferred Stock to the U.S. Treasury. This capital will be used to increase the strong capital position of the Bank. The Bank will use the capital to grow loans. In addition, the capital will allow the Corporation to consider acquisitions of deposit franchises that would enhance our funding mix.”
Mackinac Financial Corporation is a registered bank holding company formed under the Bank Holding Company Act of 1956 with assets in excess of $450 million and whose common stock is traded on the NASDAQ stock market as “MFNC.” The principal subsidiary of the Corporation is mBank. Headquartered in Manistique, Michigan, mBank has 13 branch locations; nine in the Upper Peninsula, three in the Northern Lower Peninsula and one in Oakland County, Michigan. The Company’s banking services include commercial lending and treasury management products and services geared toward small to mid-sized businesses, as well as a full array of personal and business deposit products and consumer loans.
Forward-Looking Statements
This release contains certain forward-looking statements. Words such as “anticipates,” “believes,” “estimates,” “expects,” “intends,” “should,” “will,” and variations of such words and similar expressions are intended to identify forward-looking statements: as defined by the Private Securities Litigation Reform Act of 1995. These statements reflect management’s current beliefs as to expected outcomes of future events and are not guarantees of future performance. These statements involve certain risks, uncertainties and assumptions that are difficult to predict with regard to timing, extent, likelihood, and degree of occurrence. Therefore, actual results and outcomes may materially differ from what may be expressed or forecasted in such forward-looking statements. Factors that could cause a difference include among others: changes in the national and local economies or market conditions; changes in interest rates and banking regulations; the impact of competition from traditional or new sources; and the possibility that anticipated cost savings and revenue enhancements from mergers and acquisitions, bank consolidations, branch closings and other sources may not be fully realized at all or within specified time frames as well as other risks and uncertainties including but not limited to those detailed from time to time in filings of the Company with the Securities and Exchange Commission. These and other factors may cause decisions and actual results to differ materially from current expectations. Mackinac Financial Corporation undertakes no obligation to revise, update, or clarify forward-looking statements to reflect events or conditions after the date of this release.
MACKINAC FINANCIAL CORPORATION AND SUBSIDIARIES
SELECTED FINANCIAL HIGHLIGHTS
SELECTED FINANCIAL HIGHLIGHTS
(Dollars in thousands, except per share data)
| For The Period Ended | ||||||||||||
| March 31, | December 31, | March 31, | ||||||||||
| 2009 | 2008 | 2008 | ||||||||||
| (Unaudited) | (Unaudited) | |||||||||||
Selected Financial Condition Data (at end of period): | ||||||||||||
| Assets | $ | 466,375 | $ | 451,431 | $ | 417,175 | ||||||
| Loans | 370,776 | 370,280 | 360,056 | |||||||||
| Investment securities | 51,071 | 47,490 | 24,581 | |||||||||
| Deposits | 385,757 | 371,097 | 326,047 | |||||||||
| Borrowings | 36,210 | 36,210 | 48,849 | |||||||||
| Shareholders’ Equity | 41,864 | 41,552 | 39,633 | |||||||||
Selected Statements of Income Data: | ||||||||||||
| Net interest income | $ | 3,495 | $ | 12,864 | $ | 3,045 | ||||||
| Income before taxes | 97 | 2,659 | 164 | |||||||||
| Net income | 90 | 1,872 | 139 | |||||||||
| Income per common share — Basic | .03 | .55 | .04 | |||||||||
| Income per common share — Diluted | .03 | .55 | .04 | |||||||||
| Weighted average shares outstanding | 3,419,736 | 3,422,012 | 3,428,695 | |||||||||
Selected Financial Ratios and Other Data: | ||||||||||||
Performance Ratios: | ||||||||||||
| Net interest margin | 3.35 | % | 3.23 | % | 3.13 | % | ||||||
| Efficiency ratio | 82.36 | 85.51 | 95.34 | |||||||||
| Return on average assets | .08 | .44 | .13 | |||||||||
| Return on average equity | .87 | 4.61 | 1.42 | |||||||||
| Average total assets | $ | 454,741 | $ | 425,343 | $ | 417,682 | ||||||
| Average total shareholders’ equity | 41,813 | 40,630 | 39,491 | |||||||||
| Average loans to average deposits ratio | 99.54 | % | 105.61 | % | 106.48 | % | ||||||
Common Share Data (at end of period): | ||||||||||||
| Market price per common share | $ | 4.00 | $ | 4.40 | $ | 8.50 | ||||||
| Book value per common share | $ | 12.24 | $ | 12.15 | $ | 11.56 | ||||||
| Common shares outstanding | 3,419,736 | 3,419,736 | 3,428,695 | |||||||||
Other Data (at end of period): | ||||||||||||
| Allowance for loan losses | $ | 4,793 | $ | 4,277 | $ | 3,924 | ||||||
| Non-performing assets | $ | 15,489 | $ | 7,076 | $ | 4,518 | ||||||
| Allowance for loan losses to total loans | 1.29 | % | 1.16 | % | 1.09 | % | ||||||
| Non-performing assets to total assets | 3.32 | % | 1.57 | % | 1.08 | % | ||||||
| Number of: | ||||||||||||
| Branch locations | 13 | 12 | 12 | |||||||||
| FTE Employees | 101 | 100 | 103 | |||||||||
MACKINAC FINANCIAL CORPORATION AND SUBSIDIARIES
CONSOLIDATED BALANCE SHEETS
CONSOLIDATED BALANCE SHEETS
(Dollars in thousands)
| March 31, | December 31, | March 31, | ||||||||||
| 2009 | 2008 | 2008 | ||||||||||
| (unaudited) | (unaudited) | |||||||||||
ASSETS | ||||||||||||
| Cash and due from banks | $ | 21,394 | $ | 10,112 | $ | 6,849 | ||||||
| Federal funds sold | — | — | 1,568 | |||||||||
| Cash and cash equivalents | 21,394 | 10,112 | 8,417 | |||||||||
| Interest-bearing deposits in other financial institutions | 569 | 582 | 382 | |||||||||
| Securities available for sale | 51,071 | 47,490 | 24,581 | |||||||||
| Federal Home Loan Bank stock | 3,794 | 3,794 | 3,794 | |||||||||
| Loans: | ||||||||||||
| Commercial | 295,595 | 296,088 | 291,980 | |||||||||
| Mortgage | 71,554 | 70,447 | 64,624 | |||||||||
| Installment | 3,627 | 3,745 | 3,452 | |||||||||
| Total Loans | 370,776 | 370,280 | 360,056 | |||||||||
| Allowance for loan losses | (4,793 | ) | (4,277 | ) | (3,924 | ) | ||||||
| Net loans | 365,983 | 366,003 | 356,132 | |||||||||
| Premises and equipment | 11,134 | 11,189 | 11,511 | |||||||||
| Other real estate held for sale | 2,199 | 2,189 | 1,137 | |||||||||
| Other assets | 10,231 | 10,072 | 11,221 | |||||||||
TOTAL ASSETS | $ | 466,375 | $ | 451,431 | $ | 417,175 | ||||||
LIABILITIES AND SHAREHOLDERS’ EQUITY | ||||||||||||
| LIABILITIES: | ||||||||||||
| Deposits: | ||||||||||||
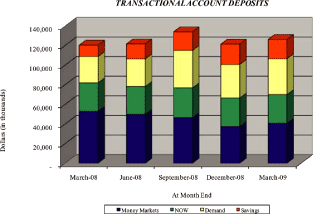
| Noninterest bearing deposits | $ | 31,541 | $ | 30,099 | $ | 26,876 | ||||||
| NOW, money market, checking | 75,026 | 70,584 | 81,952 | |||||||||
| Savings | 19,585 | 20,730 | 11,530 | |||||||||
| CDs<$100,000 | 70,708 | 73,752 | 83,087 | |||||||||
| CDs>$100,000 | 26,886 | 25,044 | 22,010 | |||||||||
| Brokered | 162,011 | 150,888 | 100,592 | |||||||||
| Total deposits | 385,757 | 371,097 | 326,047 | |||||||||
| Borrowings: | ||||||||||||
| Federal funds purchased | — | — | 10,410 | |||||||||
| Short-term | — | — | 2,159 | |||||||||
| Long-term | 36,210 | 36,210 | 36,280 | |||||||||
| Total borrowings | 36,210 | 36,210 | 48,849 | |||||||||
| Other liabilities | 2,544 | 2,572 | 2,646 | |||||||||
| Total liabilities | 424,511 | 409,879 | 377,542 | |||||||||
| Shareholders’ equity: | ||||||||||||
| Preferred stock — No par value: | ||||||||||||
| Authorized 500,000 shares, no shares outstanding | ||||||||||||
| Common stock and additional paid in capital — No par value | ||||||||||||
| Authorized - 18,000,000 shares | ||||||||||||
Issued and outstanding - 3,419,736; 3,419,736, and 3,428,695 respectively | 42,833 | 42,815 | 42,862 | |||||||||
| Accumulated deficit | (1,619 | ) | (1,708 | ) | (3,441 | ) | ||||||
| Accumulated other comprehensive income (loss) | 650 | 445 | 212 | |||||||||
| Total shareholders’ equity | 41,864 | 41,552 | 39,633 | |||||||||
TOTAL LIABILITIES AND SHAREHOLDERS’ EQUITY | $ | 466,375 | $ | 451,431 | $ | 417,175 | ||||||
MACKINAC FINANCIAL CORPORATION AND SUBSIDIARIES
CONSOLIDATED STATEMENTS OF OPERATIONS
CONSOLIDATED STATEMENTS OF OPERATIONS
(Dollars in thousands except per share data)
| Three Months Ended | ||||||||
| March 31, | ||||||||
| 2009 | 2008 | |||||||
| (Unaudited) | (Unaudited) | |||||||
INTEREST INCOME: | ||||||||
| Interest and fees on loans: | ||||||||
| Taxable | $ | 5,002 | $ | 6,100 | ||||
| Tax-exempt | 90 | 108 | ||||||
| Interest on securities: | ||||||||
| Taxable | 459 | 266 | ||||||
| Tax-exempt | 1 | 1 | ||||||
| Other interest income | 2 | 89 | ||||||
| Total interest income | 5,554 | 6,564 | ||||||
INTEREST EXPENSE: | ||||||||
| Deposits | 1,778 | 3,065 | ||||||
| Borrowings | 281 | 454 | ||||||
| Total interest expense | 2,059 | 3,519 | ||||||
| Net interest income | 3,495 | 3,045 | ||||||
| Provision for loan losses | 550 | — | ||||||
| Net interest income after provision for loan losses | 2,945 | 3,045 | ||||||
NONINTEREST INCOME: | ||||||||
| Service fees | 243 | 174 | ||||||
| Net security gains | — | 65 | ||||||
| Net gains on sale of secondary market loans | 58 | 48 | ||||||
| Other | 90 | 23 | ||||||
| Total noninterest income | 391 | 310 | ||||||
NONINTEREST EXPENSE: | ||||||||
| Salaries and employee benefits | 1,597 | 1,807 | ||||||
| Occupancy | 378 | 355 | ||||||
| Furniture and equipment | 189 | 178 | ||||||
| Data processing | 220 | 221 | ||||||
| Professional service fees | 153 | 153 | ||||||
| Loan and deposit | 136 | 101 | ||||||
| FDIC insurance assessment | 125 | 9 | ||||||
| Telephone | 43 | 45 | ||||||
| Advertising | 78 | 60 | ||||||
| Other | 320 | 262 | ||||||
| Total noninterest expense | 3,239 | 3,191 | ||||||
| Income before provision for income taxes | 97 | 164 | ||||||
| Provision for income taxes | 7 | 25 | ||||||
NET INCOME | $ | 90 | $ | 139 | ||||
INCOME PER COMMON SHARE: | ||||||||
| Basic | $ | .03 | $ | .04 | ||||
| Diluted | $ | .03 | $ | .04 | ||||
MACKINAC FINANCIAL CORPORATION AND SUBSIDIARIES
LOAN PORTFOLIO AND CREDIT QUALITY
LOAN PORTFOLIO AND CREDIT QUALITY
(Dollars in thousands)
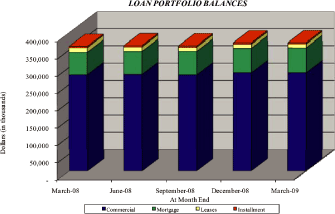
Loan Portfolio Balances (at end of period):
| March 31, | December 31, | March 31, | ||||||||||
| 2009 | 2008 | 2008 | ||||||||||
Commercial Loans | ||||||||||||
| Real estate — operators of nonresidential buildings | $ | 40,457 | $ | 41,299 | $ | 43,167 | ||||||
| Hospitality and tourism | 35,224 | 35,086 | 35,760 | |||||||||
| Real estate agents and managers | 28,012 | 29,292 | 30,235 | |||||||||
| Operators of nonresidential buildings | 13,512 | 13,467 | 9,039 | |||||||||
| Other | 151,732 | 145,831 | 146,226 | |||||||||
| Total Commercial Loans | 268,937 | 264,975 | 264,427 | |||||||||
| 1-4 family residential real estate | 65,792 | 65,595 | 59,532 | |||||||||
| Consumer | 3,627 | 3,745 | 3,452 | |||||||||
| Construction | ||||||||||||
| Commercial | 26,658 | 31,113 | 27,553 | |||||||||
| Consumer | 5,762 | 4,852 | 5,092 | |||||||||
| Total Loans | $ | 370,776 | $ | 370,280 | $ | 360,056 | ||||||
Credit Quality (at end of period):
| March 31, | December 31, | March 31, | ||||||||||
| 2009 | 2008 | 2008 | ||||||||||
Nonperforming Assets : | ||||||||||||
| Nonaccrual loans | $ | 12,698 | $ | 4,887 | $ | 3,381 | ||||||
| Loans past due 90 days or more | — | — | — | |||||||||
| Restructured loans | 592 | — | — | |||||||||
| Total nonperforming loans | 13,290 | 4,887 | 3,381 | |||||||||
| Other real estate owned | 2,199 | 2,189 | 1,137 | |||||||||
| Total nonperforming assets | $ | 15,489 | $ | 7,076 | $ | 4,518 | ||||||
| Nonperforming loans as a % of loans | 3.58 | % | 1.32 | % | .94 | % | ||||||
| Nonperforming assets as a % of assets | 3.32 | % | 1.57 | % | 1.08 | % | ||||||
Reserve for Loan Losses: | ||||||||||||
| At period end | $ | 4,793 | $ | 4,277 | $ | 3,924 | ||||||
| As a % of loans | 1.29 | % | 1.16 | % | 1.09 | % | ||||||
| As a % of nonperforming loans | 36.07 | % | 87.52 | % | 116.06 | % | ||||||
| As a % of nonaccrual loans | 37.75 | % | 87.52 | % | 116.06 | % | ||||||
Charge-off Information (year to date): | ||||||||||||
| Average loans | 370,943 | 361,324 | 357,778 | |||||||||
| Net charge-offs | 34 | 2,169 | 222 | |||||||||
| Charge-offs as a % of average loans | .01 | % | .60 | % | .06 | % | ||||||
MACKINAC FINANCIAL CORPORATION AND SUBSIDIARIES
QUARTERLY FINANCIAL HIGHLIGHTS
QUARTERLY FINANCIAL HIGHLIGHTS
| March 31, | December 31, | September 30, | June 30, | March 31, | ||||||||||||||||
| 2009 | 2008 | 2008 | 2008 | 2008 | ||||||||||||||||
BALANCE SHEET(Dollars in thousands) | ||||||||||||||||||||
| Total loans | $ | 370,776 | $ | 370,280 | $ | 361,521 | $ | 362,122 | $ | 360,056 | ||||||||||
| Allowance for loan losses | (4,793 | ) | (4,277 | ) | (3,385 | ) | (3,585 | ) | (3,924 | ) | ||||||||||
| Total loans, net | 365,983 | 366,003 | 358,136 | 358,537 | 356,132 | |||||||||||||||
| Intangible assets | 26 | 46 | 65 | 85 | 104 | |||||||||||||||
| Total assets | 466,375 | 451,431 | 440,953 | 437,327 | 417,175 | |||||||||||||||
| Core deposits | 196,860 | 195,165 | 208,940 | 200,293 | 203,445 | |||||||||||||||
Noncore deposits(1) | 188,897 | 175,932 | 151,754 | 156,683 | 122,602 | |||||||||||||||
| Total deposits | 385,757 | 371,097 | 360,694 | 356,976 | 326,047 | |||||||||||||||
| Total borrowings | 36,210 | 36,210 | 36,210 | 36,280 | 48,849 | |||||||||||||||
| Total shareholders’ equity | 41,864 | 41,552 | 41,427 | 40,975 | 39,633 | |||||||||||||||
| Total shares outstanding | 3,419,736 | 3,419,736 | 3,419,736 | 3,419,736 | 3,428,695 | |||||||||||||||
AVERAGE BALANCES(Dollars in thousands) | ||||||||||||||||||||
| Assets | $ | 454,741 | $ | 441,583 | $ | 423,702 | $ | 418,246 | $ | 417,682 | ||||||||||
| Loans | 370,943 | 366,077 | 358,844 | 362,574 | 357,778 | |||||||||||||||
| Deposits | 372,670 | 358,213 | 341,377 | 332,725 | 336,016 | |||||||||||||||
| Equity | 41,813 | 41,516 | 41,097 | 40,399 | 39,491 | |||||||||||||||
INCOME STATEMENT(Dollars in thousands) | ||||||||||||||||||||
| Net interest income | $ | 3,495 | $ | 3,330 | $ | 3,371 | $ | 3,118 | $ | 3,045 | ||||||||||
| Provision for loan losses | 550 | 1,100 | 450 | 750 | — | |||||||||||||||
| Net interest income after provision | 2,945 | 2,230 | 2,921 | 2,368 | 3,045 | |||||||||||||||
| Total noninterest income | 391 | 308 | 288 | 3,747 | 310 | |||||||||||||||
| Total noninterest expense | 3,239 | 2,961 | 2,935 | 3,471 | 3,191 | |||||||||||||||
| Income before taxes | 97 | (423 | ) | 274 | 2,644 | 164 | ||||||||||||||
| Provision for income taxes | 7 | (171 | ) | 58 | 875 | 25 | ||||||||||||||
| Net income | $ | 90 | $ | (252 | ) | $ | 216 | $ | 1,769 | $ | 139 | |||||||||
PER SHARE DATA | ||||||||||||||||||||
| Earnings — basic | $ | .03 | $ | (.07 | ) | $ | .06 | $ | .52 | $ | .04 | |||||||||
| Earnings — diluted | .03 | (.07 | ) | .06 | .52 | .04 | ||||||||||||||
| Book value | 12.24 | 12.15 | 12.11 | 11.98 | 11.56 | |||||||||||||||
| Market value, closing price | 4.00 | 4.40 | 5.26 | 7.00 | 8.50 | |||||||||||||||
ASSET QUALITY RATIOS | ||||||||||||||||||||
| Nonperforming loans/total loans | 3.58 | % | 1.32 | % | 1.29 | % | 1.27 | % | .94 | % | ||||||||||
| Nonperforming assets/total assets | 3.32 | 1.57 | 1.45 | 1.83 | 1.08 | |||||||||||||||
| Allowance for loan losses/total loans | 1.29 | 1.16 | .94 | .99 | 1.09 | |||||||||||||||
| Allowance for loan losses/nonperforming loans | 36.07 | 87.52 | 72.81 | 77.22 | 116.06 | |||||||||||||||
PROFITABILITY RATIOS | ||||||||||||||||||||
| Return on average assets | .08 | % | (.23 | )% | .20 | % | 1.70 | % | .13 | % | ||||||||||
| Return on average equity | 0.87 | (2.42 | ) | 2.08 | 17.62 | 1.42 | ||||||||||||||
| Net interest margin | 3.35 | 3.20 | 3.39 | 3.19 | 3.13 | |||||||||||||||
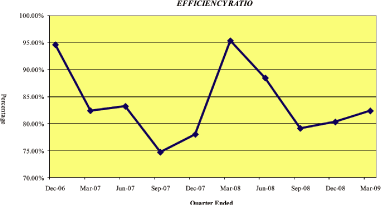
| Efficiency ratio | 82.36 | 80.30 | 79.12 | 88.45 | 95.34 | |||||||||||||||
| Average loans/average deposits | 99.54 | 102.20 | 105.12 | 108.97 | 106.48 | |||||||||||||||
CAPITAL ADEQUACY RATIOS | ||||||||||||||||||||
| Tier 1 leverage ratio | 7.86 | % | 8.01 | % | 8.31 | % | 8.56 | % | 7.85 | % | ||||||||||
| Tier 1 capital to risk weighted assets | 9.31 | 9.25 | 9.40 | 9.48 | 8.84 | |||||||||||||||
| Total capital to risk weighted assets | 10.56 | 10.38 | 10.31 | 10.45 | 9.92 | |||||||||||||||
| Average equity/average assets | 9.20 | 9.40 | 9.70 | 9.66 | 9.45 | |||||||||||||||
| Tangible equity/tangible assets | 8.97 | 9.20 | 9.38 | 9.35 | 9.48 | |||||||||||||||
| (1) | Noncore deposits include Internet CDs, brokered deposits and CDs greater than $100,000 |
MACKINAC FINANCIAL CORPORATION AND SUBSIDIARIES
QUARTERLY FINANCIAL HIGHLIGHTS
QUARTERLY FINANCIAL HIGHLIGHTS
 |  |
 |  |