Confidential
Presentation to:

Board of Directors
PROJECT ENERGIZER
June 4, 2002
| Steve Kent | Managing Director | |
| Jim Lott | Vice President | |
| Jeff Brand | Associate |

Keefe, Bruyette & Woods, Inc.—SPECIALISTS IN BANKING AND FINANCIAL SERVICES
TABLE OF CONTENTS
| | Section | ||
|---|---|---|---|
| Process & Transaction Overview | 1 | ||
| First National of Nebraska Overview | 2 | ||
| Valuation Methodologies | 3 | ||
| Valuation Analysis: | 4 | ||
| Comparable Public Company Analysis | 4a | ||
| Business Component Valuation Analysis | 4b | ||
| Comparable Merger & Acquisition Analysis | 4c | ||
| Comparable Self-tender Analysis | 4d | ||
| Discounted Cash Flow Analysis | 4e | ||
| Valuation Summary & Conclusions | 4f | ||
| Financial Impact of Tender to Remaining Shareholders | 5 | ||
Appendix | |||
| Peer Group Detail | A | ||
1
| Process & Transaction Overview |
KBW's Role & Process Overview
- •
- In conjunction with a proposed Odd-lot Tender Offer (the "Tender Offer") Keefe, Bruyette & Woods, Inc. ("KBW") has been retained by First National of Nebraska ("First National") to assist First National in determining a valuation range for the Tender Offer and to render an opinion (the "Opinion") as to the fairness, from a financial point of view, to the shareholders of First National (other than the Lauritzen family) of the per share consideration offered in the Tender Offer.
- •
- KBW conducted due diligence with senior management which included, but was not limited to:
- •
- History
- •
- Operations
- •
- Financial performance prospects
- •
- Strategy and goals
- •
- Future business opportunities
- •
- Trading characteristics of First National stock
- •
- KBW reviewed historical and projected operating performance of First National and completed various financial analyses related to the Tender Offer (see Valuation Methodologies section).
- •
- KBW completed various financial analyses related to First National including, but not limited to, discounted cash flow analysis and comparison of First National to selected comparable publicly-traded companies.
3
Key Assumptions Underlying KBW's Analysis
- •
- Based on discussions with the First National's management, KBW made the following assumptions with their consent:
- •
- All material assets and liabilities (contingent or otherwise, known or unknown) of First National are as set forth in their financial statements with no material changes since the date of the last of such statements provided to KBW.
- •
- The financial forecasts examined by or discussed with KBW were reasonably prepared on bases reflecting the best available estimates and good faith judgments of senior management of First National as to future financial performance of First National under various reasonable scenarios.
- •
- KBW did not make nor obtain an independent appraisal of assets or liabilities of First National.
- •
- KBW did not examine the loan portfolio of First National or of the banks. Direct examination would have been beyond the scope of this valuation assignment. KBW discussed the general condition of the loan portfolio and several larger credits with management, focusing on such aspects as delinquencies, nonaccrual loans, geographic concentrations, industry concentrations, credit to related parties, known problem loans and potential losses in the portfolio. Management represented that the valuation reserve for loan losses was adequate as of March 31, 2002.
4
- •
- KBW relied on advice of counsel and independent accountants to First National as to legal and financial matters concerning First National and the tender offer, and assumed that the tender offer will be conducted in a manner that complies in all respects with applicable statues, law, rules and regulations.
- •
- With respect to the financial impact to shareholders who will have an ongoing equity interest in First National after completion of the tender offer, KBW considered only to the impact on the income statement items, balance sheet items, financial ratios and capital ratios discussed in this presentation, and did not attempt to ascribe any particular value to any other factors, including the impact of First National no longer filing reports with the SEC.
- •
- KBW relied on the accuracy and completeness of all information provided by the management of First National, or obtained through publicly available sources.
- •
- The Tender Offer will be consummated in accordance with the terms of the Tender Offer Document without any amendment thereto.
5
Objectives
- •
- First National's Objectives of the Tender Offer Include:
- •
- To give a majority of its shareholders an opportunity to sell their stock above the current market price without, in many cases, incurring any sales commissions;
- •
- To allow us to become a private company in order to relieve First National of the administrative burdens of being an SEC-reporting company; and
- •
- To enhance First National's operational flexibility by permitting it to focus on long-term business strategies that are designed to fulfill the needs of its subsidiaries and their customers.
6
Valuation Summary
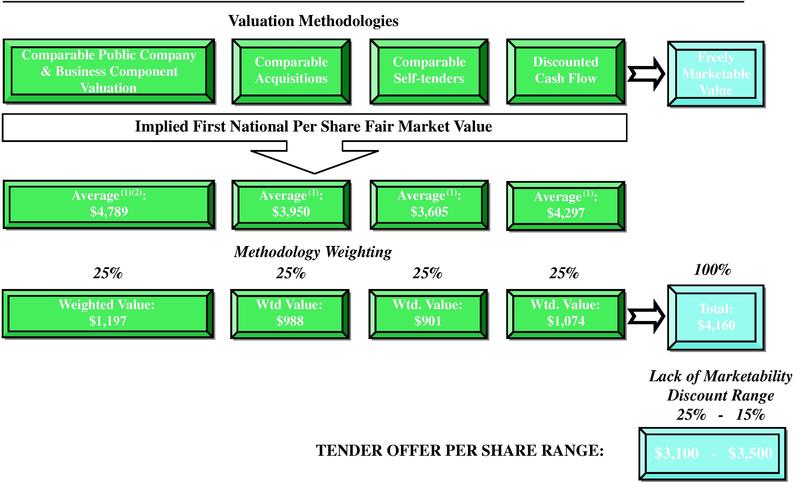
- (1)
- Average of median implied values that were derived from using various valuation multiples (ie price to book, price to earnings, etc.).
- (2)
- Average of Comparable Public ($4,939) and Business Component Valuation ($4,639) implied values.
7
Valuation Summary
| | | 5/29/02 | Valuation Range | |||||||||||||
|---|---|---|---|---|---|---|---|---|---|---|---|---|---|---|---|---|
| First National Data 3/31/02 | Price to: | |||||||||||||||
| $3,000 | $3,100 | $3,200 | $3,300 | $3,400 | $3,500 | |||||||||||
| $ | 275.25 | LTM EPS | 10.9 | x | 11.3 | x | 11.6 | x | 12.0 | x | 12.4 | x | 12.7 | x | ||
| $ | 330.04 | LQA EPS | 9.1 | x | 9.4 | x | 9.7 | x | 10.0 | x | 10.3 | x | 10.6 | x | ||
| $ | 318.22 | 2002 EPS | 9.4 | x | 9.7 | x | 10.1 | x | 10.4 | x | 10.7 | x | 11.0 | x | ||
| $ | 383.54 | 2003 EPS | 7.8 | x | 8.1 | x | 8.3 | x | 8.6 | x | 8.9 | x | 9.1 | x | ||
| $ | 2,509.80 | Book Value | 120 | % | 124 | % | 128 | % | 131 | % | 135 | % | 139 | % | ||
| $ | 1,978.54 | Tang. Book Value | 152 | % | 157 | % | 162 | % | 167 | % | 172 | % | 177 | % | ||
Market Premium: | ||||||||||||||||
| $ | 3,000.00 | Current | 0 | % | 3 | % | 7 | % | 10 | % | 13 | % | 17 | % | ||
| $ | 2,601.25 | 90 Day Average* | 15 | % | 19 | % | 23 | % | 27 | % | 31 | % | 35 | % | ||
"LTM" = Last 12 Months; "LQA" = Latest Quarter Annualized.
- *
- 90 Day Average inclusive of reported OTC Bulletin Board transactions and private transactions as reported by First National.
8
| First National of Nebraska Overview |
Company Snap Shot
- •
- First National is one of the top five in-house merchant processors in the United States, a top 15 Visa and MasterCard issuer, a top 20 processor of automated clearing house transactions and one of the 15 largest providers of remittance processing services.
| (Dollars in thousands) Financial Summary | 3/31/02 | Market Valuation | 5/29/02 | Ownership | | ||||||||
|---|---|---|---|---|---|---|---|---|---|---|---|---|---|
| Total Assets | $ | 9,976,823 | OTC BB Symbol | FINN | Inside | 41.69 | % | ||||||
| Total Loans | $ | 7,067,525 | Price | $ | 3,000 | Institutional | 0.85 | % | |||||
| Total Managed Credit Card Loans | $ | 3,640,310 | Quarterly Dividend | $ | 11.00 | ||||||||
| Total Deposits | $ | 8,260,140 | Market Cap | $ | 1,003,500 | Top Institutional Holders | % Held | ||||||
| Oper. Return on Avg. Assets (%) | 1.12 | % | Avg. Daily Volume | 15 | Bridges Investment Counsel | 0.31 | % | ||||||
| Oper. Return on Avg. Equity (%) | 13.33 | % | Price/LTM EPS | 10.9x | Karpas Strategies LLC | 0.30 | % | ||||||
| Net Interest Margin (%) | 5.68 | % | Price/2002 Est. EPS | 9.4x | Bridges Investment Management Inc | 0.16 | % | ||||||
| Efficiency Ratio (%) | 66.37 | % | Price/2003 Est. EPS | 7.8x | Lawson Kroeker Investment Inc | 0.03 | % | ||||||
| Price/Book | 119.5 | % | McDonald & Company Securities Inc | 0.03 | % | ||||||||
| Tier 1 Leverage Ratio (%) | 7.08 | Price/Tangible Book | 151.6 | % | |||||||||
| Tier 1 Capital Ratio (%) | 8.49 | LTM Dividend Payout | 14.9 | % | |||||||||
| Total Capital Ratio (%) | 10.72 | Dividend Yield | 1.47 | % | |||||||||
Reserves / NPAs (%) | 105.26 | Branches & ATMs | |||||||||||
| Reserves / Loans (%) | 1.74 | Branches by State | CO(22),GA(1),IL(10),KS(7),NE(31),SD(5),TX(1) | ||||||||||
| Net Charge-offs / Avg. Loans (%) | 2.06 | Avg. Deposits Per Branch | $ | 107,275 | |||||||||
| Number of ATMs | 258 | ||||||||||||
| Total Shares Outstanding | 334,500 | ||||||||||||
10
Financial Projections
| | Actual 2001 | Income Weighting | Projected 2002 | Income Weighting | Projected 2003 | Income Weighting | | |||||||||||
|---|---|---|---|---|---|---|---|---|---|---|---|---|---|---|---|---|---|---|
| Consumer Income(1) | 60,043 | 54.2 | % | 66,968 | 49.3 | % | 75,888 | 45.5 | % | |||||||||
| Processing Income | 3,530 | 3.2 | % | 3,223 | 2.4 | % | 3,637 | 2.2 | % | |||||||||
| Corporate & Affiliate Bank Income(2) | 47,259 | 42.6 | % | 65,541 | 48.3 | % | 87,318 | 52.3 | % | |||||||||
| FNBO Admin. & Other Expenses | (29,995 | ) | (29,289 | ) | (38,549 | ) | ||||||||||||
| Consolidated Net Income | 80,837 | 106,443 | 128,294 | |||||||||||||||
| Earnings Per Share | $ | 241.67 | $ | 318.22 | $ | 383.54 | ||||||||||||
| | Projected 2004 | Income Weighting | Projected 2005 | Income Weighting | Projected 2006 | Income Weighting | 5 Year CAGR | |||||||||||
|---|---|---|---|---|---|---|---|---|---|---|---|---|---|---|---|---|---|---|
| Consumer Income(1) | 78,421 | 40.8 | % | 85,002 | 37.1 | % | 94,978 | 35.1 | % | 9.6 | % | |||||||
| Processing Income | 5,107 | 2.7 | % | 6,432 | 2.8 | % | 7,414 | 2.7 | % | 16.0 | % | |||||||
| Corporate & Affiliate Bank Income(2) | 108,502 | 56.5 | % | 137,462 | 60.1 | % | 167,827 | 62.1 | % | 28.8 | % | |||||||
| FNBO Admin. & Other Expenses | (46,958 | ) | (53,491 | ) | (58,441 | ) | ||||||||||||
| Consolidated Net Income | 145,072 | 175,405 | 211,778 | 21.2 | % | |||||||||||||
| Earnings Per Share | $ | 433.70 | $ | 524.38 | $ | 633.12 | 21.2 | % | ||||||||||
Source: Management estimates.
- (1)
- Includes Cornerstone Mortgage business.
- (2)
- Includes corporate bank, affiliate banks and operations.
11
Price/Volume Graph
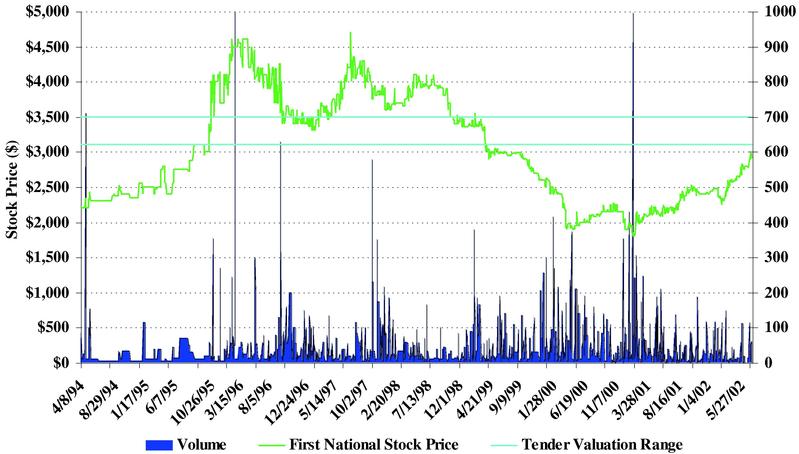
Source: Bloomberg LP
12
Historical Trading Multiples—Price to Book
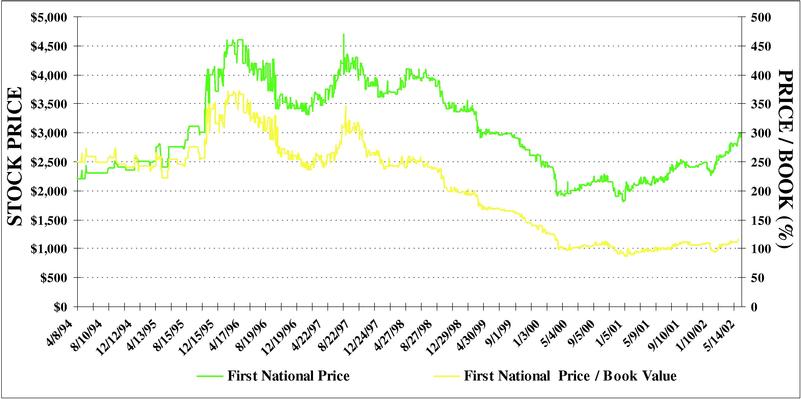
Source: Bloomberg LP. Data as of 5/29/02.
| | Since 4/8/94 | Since 1/1/98 | Since 1/1/01 | Year-to-date | ||||||||||||||||
|---|---|---|---|---|---|---|---|---|---|---|---|---|---|---|---|---|---|---|---|---|
| FINN | ||||||||||||||||||||
| Price | P/B (%) | Price | P/B (%) | Price | P/B (%) | Price | P/B (%) | |||||||||||||
| Current | $ | 3,000 | 120 | $ | 3,000 | 120 | $ | 3,000 | 120 | $ | 3,000 | 120 | ||||||||
| High | $ | 4,700 | 371 | $ | 4,100 | 259 | $ | 3,000 | 120 | $ | 3,000 | 120 | ||||||||
| Low | $ | 1,800 | 86 | $ | 1,800 | 86 | $ | 1,975 | 86 | $ | 2,250 | 92 | ||||||||
| Average | $ | 3,015 | 206 | $ | 2,746 | 147 | $ | 2,372 | 102 | $ | 2,618 | 106 | ||||||||
13
Historical Trading Multiples—Price to LTM EPS
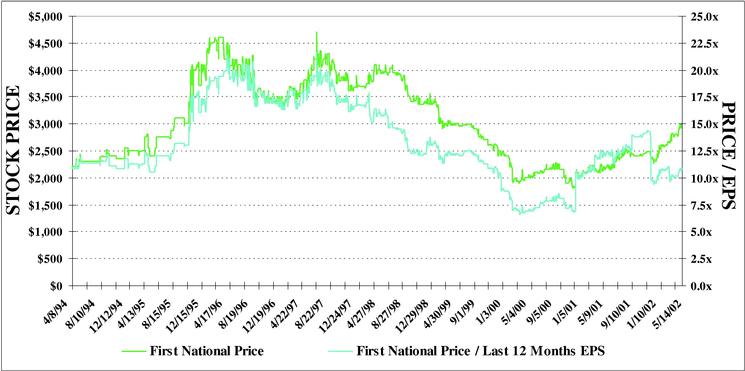
Source: Bloomberg LP. Data as of 5/29/02.
| | Since 4/8/94 | Since 1/1/98 | Since 1/1/01 | Year-to-date | |||||||||||||||||
|---|---|---|---|---|---|---|---|---|---|---|---|---|---|---|---|---|---|---|---|---|---|
| FINN | |||||||||||||||||||||
| Price | P/E | Price | P/E | Price | P/E | Price | P/E | ||||||||||||||
| Current | $ | 3,000 | 10.9 | x | $ | 3,000 | 10.9 | x | $ | 3,000 | 10.9 | x | $ | 3,000 | 10.9 | x | |||||
| High | $ | 4,700 | 21.7 | x | $ | 4,100 | 17.9 | x | $ | 3,000 | 14.3 | x | $ | 3,000 | 11.0 | x | |||||
| Low | $ | 1,800 | 6.6 | x | $ | 1,800 | 6.6 | x | $ | 1,975 | 9.3 | x | $ | 2,250 | 9.3 | x | |||||
| Average | $ | 3,015 | 13.3 | x | $ | 2,746 | 11.5 | x | $ | 2,372 | 11.6 | x | $ | 2,618 | 10.3 | x | |||||
14
Index Graphs & Total Return* Analysis
| Total Return | 3 Month | 1 Year | 3 Year | 5 Year | Since 4/94 | ||||||
|---|---|---|---|---|---|---|---|---|---|---|---|
| First National | 17 | % | 39 | % | 3 | % | -14 | % | 42 | % | |
| S&P 500 | -3 | % | -15 | % | -14 | % | 37 | % | 173 | % | |
| Nasdaq Bank Index | 9 | % | 22 | % | 41 | % | 81 | % | 250 | % | |
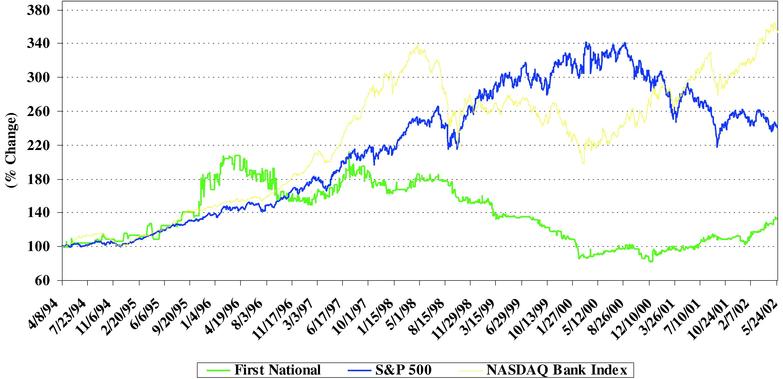
Source: Bloomberg LP.
*Total return for entire period assuming reinvestment of dividend in securities.
Note: NASDAQ Bank Index includes 569 banks and thrifts.
15
Previous Privately Negotiated First National Repurchases
| Quarter Ended | # of Shares Repurchased | Range of Prices Paid | Average Price Per Share | Trailing EPS (x) | Forward EPS (x) | BV per Share (%) | TBV per Share (%) | |||||||||
|---|---|---|---|---|---|---|---|---|---|---|---|---|---|---|---|---|
| March-02 | 5,160 | All at $2,564 | $ | 2,564 | 9.3 | x | 8.1 | x | 102 | % | 130 | % | ||||
| November-01 | 300 | All at $2,400 | $ | 2,400 | 8.3 | x | 13.1 | x | 105 | % | 121 | % | ||||
| June-01 | 15 | All at $1,850 | $ | 1,850 | 6.0 | x | 10.1 | x | 79 | % | 92 | % | ||||
| January-01 | 13 | All at $2,200 | $ | 2,200 | 7.0 | x | 12.0 | x | 98 | % | 115 | % | ||||
| December-00 | 13 | All at $1,850 | $ | 1,850 | 6.9 | x | 5.9 | x | 88 | % | 105 | % | ||||
| Average | 2,173 | 7.5 | x | 9.8 | x | 95 | % | 113 | % | |||||||
| First National—May 29, 2002 | 3,000 | 10.9 | x | 9.4 | x | 120 | % | 152 | % | |||||||
Note: Forward EPS for 2001 repurchases equals actual 2001 earnings per share. Forward EPS for 2002 repurchases equals 2002 projected earnings of $318.22 per share.
Sources: Tender Document.
16
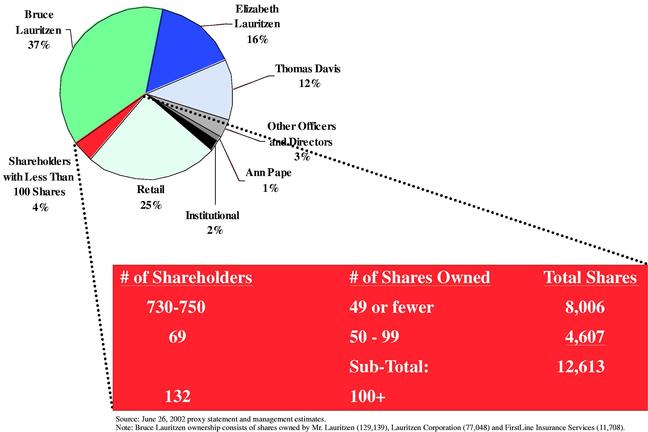
Minority Shareholder Composition
17
| Valuation Methodologies |
Summary Methodologies Description
KBW employed five primary methodologies in determining a valuation range for First National
- •
- Comparable Public Company Market Analysis
- •
- KBW compared financial and operating information of First National to four groups of financial institutions that KBW deemed relevant.
- •
- The first three groups of comparable companies analyzed were:
- —
- widely held bank holding companies (Group 1);
- —
- synthetic consumer banking companies (Group 2) and
- —
- processing oriented companies (Group 3).
- •
- A fourth group was also analyzed to illustrate the discount associated with closely-held companies.
- —
- closely-held banks (Group 4).
- •
- KBW arrived at a range of values by applying the median trading multiples of Peer Groups 1, 2, 3 & 4 (i.e. price to: historical earnings, projected earnings, book value and tangible book value) to First National's corresponding financials. The values were then weighted to reflect First National's relative composition of financial and operating characteristics in relation to the individual Peer Groups.
19
- •
- Business Component Valuation Analysis
- •
- KBW applied a frequently used public market capitalization method by applying business unit comparable price earnings multiples to the individual business component net income contributions of First National.
- •
- Comparable Merger and Acquisition Transaction Analysis
- •
- KBW identified a comparable group of control acquisitions announced since the beginning of 2001 of banking companies with deal values ranging from $1 - $7 billion.
- •
- KBW applied the maximum, minimum and average deal multiples of per share consideration paid to book value, tangible book value, trailing earnings per share, projected earnings per share as well as the premium over the 1 day market price of these transactions to the related financial statistics of First National.
- •
- KBW then took those implied values and discounted them by a determined control value premium to derive a freely marketable value.
20
- •
- Comparable Self Tender Analysis
- •
- KBW analyzed recent tender offers and measured the tender offer price in relation to: the premium over the 30 day average stock price, trailing earnings, projected earnings, book value and tangible book value. The medians were then used to imply values for First National based on their corresponding financials.
- •
- Discounted Cash Flows Analysis
- •
- KBW analyzed the net present value of future distributable free capital flows.
- •
- Terminal value assumptions capitalize the fifth year projected earnings at a range of market earnings multiples.
21
| Valuation Analysis: Comparable Public Company Analysis |
Overview
- •
- Comparable Public Company Analysis
- •
- widely held bank holding company peer group
- —
- banks with assets between $5 billion and $15 billion
- •
- synthetic consumer peer group
- —
- credit card companies and consumer oriented financial institutions
- •
- processing peer group
- —
- data processing and transaction processing companies
- •
- closely-held bank holding company peer group
- —
- banks over $2 billion with insider ownership greater than 25%
23
Widely Held Bank Holding Company Peer Group—Market Performance
| | | | | Price To: | | | | |||||||||||||||||
|---|---|---|---|---|---|---|---|---|---|---|---|---|---|---|---|---|---|---|---|---|---|---|---|---|
| | | | | Div. Payout Ratio (%) | Avg. Daily Volume (1 Mnth.) | | ||||||||||||||||||
| Ticker | Institution | 5/29/02 Price ($) | Market Cap ($MMs) | LTM EPS (x) | LQA EPS (x) | 2002E EPS (x) | 2003E EPS (x) | Book Value (%) | Tang. BV (%) | Insider Ownership (%) | ||||||||||||||
| ASBC | Associated Banc-Corp, (WI) | 37.08 | 2,812 | 14.5 | 13.4 | 13.4 | 12.4 | 228 | 279 | 40.8 | 269,763 | 4.0 | ||||||||||||
| CNB | Colonial BancGroup, Inc., (AL) | 15.51 | 1,863 | 14.2 | 13.4 | 12.8 | 11.7 | 196 | 245 | 44.8 | 238,172 | 7.9 | ||||||||||||
| CBH | Commerce Bancorp, Inc., (NJ) | 49.38 | 3,273 | 30.7 | 27.4 | 26.3 | 22.1 | 503 | 506 | 33.3 | 278,681 | 13.0 | ||||||||||||
| CBSH | Commerce Bancshares, Inc., (MO) | 45.27 | 2,964 | 16.5 | 15.9 | 15.3 | 13.7 | 227 | 237 | 22.9 | 102,790 | 10.6 | ||||||||||||
| CYN | City National Corporation, (CA) | 53.43 | 2,655 | 17.2 | 15.5 | 15.1 | 13.8 | 266 | 361 | 22.4 | 176,759 | 19.9 | ||||||||||||
| TCB | TCF Financial Corporation, (MN) | 51.26 | 3,920 | 18.6 | 18.8 | 16.3 | 14.4 | 425 | 511 | 38.3 | 259,418 | 8.3 | ||||||||||||
| FVB | First Virginia Banks, Inc., (VA) | 57.59 | 2,756 | 17.9 | 16.4 | 16.2 | 15.2 | 235 | 283 | 45.5 | 66,859 | 2.4 | ||||||||||||
| FMER | FirstMerit Corporation, (OH) | 27.05 | 2,298 | 15.5 | 14.1 | 12.6 | 11.5 | 250 | 294 | 47.1 | 152,890 | 4.8 | ||||||||||||
| MRBK | Mercantile Bankshares Corp., (MD) | 41.75 | 2,918 | 16.4 | 15.8 | 15.2 | 13.9 | 234 | 257 | 42.4 | 289,686 | 1.0 | ||||||||||||
| BXS | BancorpSouth, Inc., (MS) | 21.54 | 1,749 | 16.8 | 15.0 | 14.9 | 13.5 | 216 | 228 | 41.7 | 134,463 | 7.5 | ||||||||||||
| SKYF | Sky Financial Group Inc., (OH) | 22.38 | 1,850 | 15.1 | 14.7 | 14.0 | 12.6 | 275 | 311 | 50.0 | 126,181 | 5.2 | ||||||||||||
| VLY | Valley National Bancorp, (NJ) | 27.74 | 2,613 | 18.9 | 17.3 | 18.0 | 16.5 | 399 | 403 | 53.0 | 73,164 | 9.4 | ||||||||||||
| GBBK | Greater Bay Bancorp, (CA) | 33.27 | 1,680 | 17.4 | 16.0 | 14.8 | 12.9 | 341 | 524 | 22.1 | 659,122 | 10.1 | ||||||||||||
| CFR | Cullen/Frost Bankers, Inc., (TX) | 38.23 | 1,957 | 20.4 | 18.4 | 17.3 | 14.8 | 324 | 406 | 41.4 | 168,290 | 7.8 | ||||||||||||
| FULT | Fulton Financial Corporation, (PA) | 19.13 | 1,973 | 17.2 | 15.9 | 14.9 | 13.7 | 239 | 261 | 43.9 | 96,415 | 4.4 | ||||||||||||
| CBCF | Citizens Banking Corporation, (MI) | 32.83 | 1,478 | 16.3 | 15.5 | 14.0 | 13.1 | 211 | 237 | 51.9 | 87,713 | 4.9 | ||||||||||||
| WTNY | Whitney Holding Corporation, (LA) | 34.90 | 1,386 | 17.6 | 15.9 | 15.9 | 14.7 | 191 | 222 | 49.1 | 104,136 | 7.4 | ||||||||||||
| HU | Hudson United Bancorp, (NJ) | 31.30 | 1,415 | 19.0 | NM | 13.8 | 12.7 | 375 | 485 | 28.0 | 81,095 | 5.4 | ||||||||||||
| TRMK | Trustmark Corporation, (MS) | 25.95 | 1,633 | 14.7 | 13.0 | 13.6 | 12.7 | 238 | 262 | 31.3 | 84,236 | 18.2 | ||||||||||||
| FBAN | F.N.B. Corporation, (FL) | 31.05 | 1,360 | 14.2 | 10.2 | 14.8 | 13.4 | 249 | 309 | NM | 96,766 | 3.6 | ||||||||||||
| TSFG | South Financial Group, Inc. (The), (SC) | 22.95 | 924 | 19.8 | 16.9 | 16.3 | 14.8 | 213 | 273 | 35.3 | 130,463 | 4.6 | ||||||||||||
| FMBI | First Midwest Bancorp, Inc., (IL) | 29.06 | 1,410 | 17.1 | 16.1 | 15.9 | 14.5 | 316 | 328 | 37.8 | 98,463 | 5.5 | ||||||||||||
| CFBX | Community First Bankshares, Inc., (ND) | 26.86 | 1,071 | 14.9 | 14.3 | 13.6 | 12.5 | 304 | 420 | 40.4 | 107,513 | 9.0 | ||||||||||||
| UBSI | United Bankshares, Inc., (WV) | 29.75 | 1,274 | 15.3 | 14.9 | 14.4 | 13.0 | 252 | 305 | 46.0 | 98,250 | 15.4 | ||||||||||||
| SUSQ | Susquehanna Bancshares, Inc., (PA) | 23.87 | 940 | 16.5 | 16.1 | 15.3 | 14.4 | 189 | 209 | 54.1 | 117,295 | 6.9 | ||||||||||||
Maximum: | 3,920 | 30.7 | 27.4 | 26.3 | 22.1 | 503 | 524 | 54.1 | 659,122 | 19.9 | ||||||||||||||
| Minimum: | 924 | 14.2 | 10.2 | 12.6 | 11.5 | 189 | 209 | 22.1 | 66,859 | 1.0 | ||||||||||||||
| Mean: | 2,007 | 17.3 | 15.9 | 15.4 | 13.9 | 276 | 326 | 40.1 | 163,943 | 7.9 | ||||||||||||||
| Peer Median: | 1,850 | 16.8 | 15.8 | 14.9 | 13.7 | 249 | 294 | 41.5 | 117,295 | 7.4 | ||||||||||||||
| FINN | First National of Nebraska, (NE) | 3,000 | 1,004 | 10.9 | 9.1 | 9.4 | 7.8 | 120 | 152 | 13.3 | 15 | 41.7 | ||||||||||||
Source: SNL Finical. Financial data as of 3/31/02. Estimates from IBES.
LTM EPS = last twelve months operating earnings per share.
24
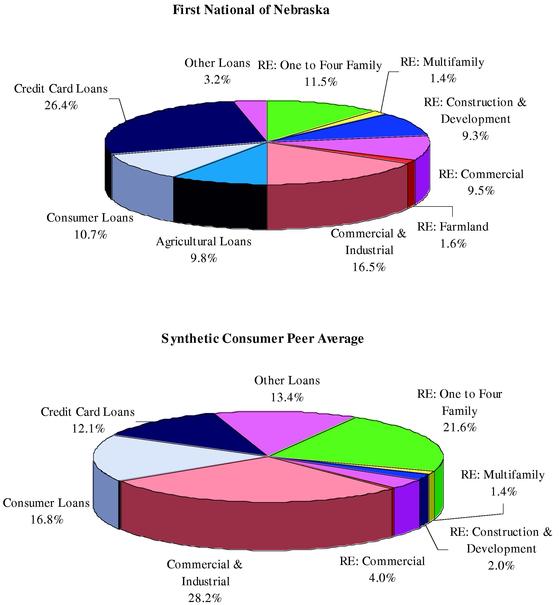
Loan Breakdown—First National vs. Widely Held Peer Group
(figures as of December 31, 2001)
| First National of Nebraska—Loans ($000) | ||||||
| RE: One to Four Family | 802,769 | 11.5 | % | |||
| RE: Multifamily | 100,393 | 1.4 | % | |||
| RE: Construction & Development | 649,786 | 9.3 | % | |||
| RE: Commercial | 661,650 | 9.5 | % | |||
| RE: Farmland | 109,167 | 1.6 | % | |||
| Commercial & Industrial | 1,150,981 | 16.5 | % | |||
| Agricultural Loans | 682,600 | 9.8 | % | |||
| Consumer Loans | 747,419 | 10.7 | % | |||
| Credit Card Loans | 1,837,368 | 26.4 | % | |||
| Other Loans | 225,437 | 3.2 | % | |||
| Total Loans | 6,967,570 | 100.0 | % | |||
| Peer Average—Loans ($000) | ||||||
| RE: One to Four Family | 1,479,903 | 26.9 | % | |||
| RE: Multifamily | 126,946 | 2.3 | % | |||
| RE: Construction & Development | 479,792 | 8.7 | % | |||
| RE: Commercial | 1,217,122 | 22.1 | % | |||
| RE: Farmland | 37,495 | 0.7 | % | |||
| Commercial & Industrial | 1,129,839 | 20.6 | % | |||
| Agricultural Loans | 31,060 | 0.6 | % | |||
| Consumer Loans | 706,555 | 12.9 | % | |||
| Credit Card Loans | 30,336 | 0.6 | % | |||
| Other Loans | 257,785 | 4.7 | % | |||
| Total Loans | 5,496,834 | 100.0 | % | |||
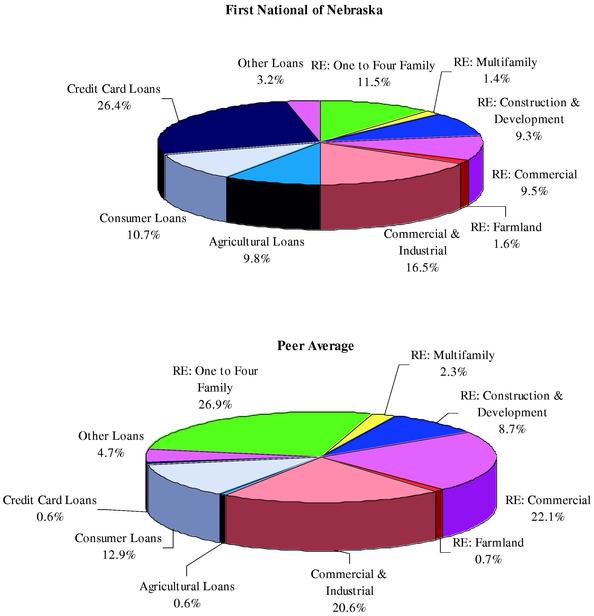
Source: SNL Financial.
25
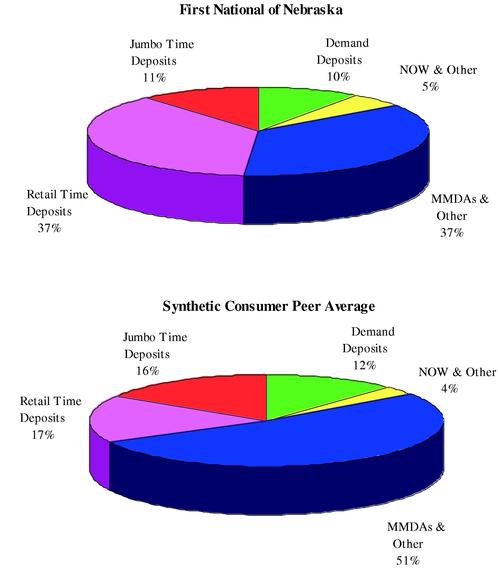
Deposit Breakdown—First National vs. Widely Held Peer Group
(figures as of December 31, 2001)
| First National of Nebraska—Deposits ($000) | ||||||
| Demand Deposits | 786,239 | 10 | % | |||
| NOW & Other | 422,297 | 5 | % | |||
| MMDAs & Other | 2,956,464 | 37 | % | |||
| Retail Time Deposits | 3,000,429 | 37 | % | |||
| Jumbo Time Deposits | 926,369 | 11 | % | |||
| Total Deposits | 8,091,798 | 100 | % | |||
| Widely Held Peer Average—Deposits ($000) | ||||||
| Demand Deposits | 753,798 | 12 | % | |||
| NOW & Other | 283,543 | 5 | % | |||
| MMDAs & Other | 2,805,975 | 46 | % | |||
| Retail Time Deposits | 1,475,696 | 24 | % | |||
| Jumbo Time Deposits | 833,795 | 14 | % | |||
| Total Deposits | 6,152,806 | 100 | % | |||
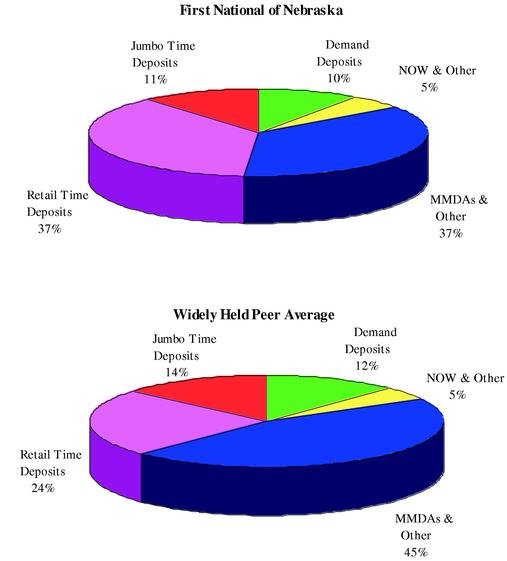
Source: SNL Financial.
26
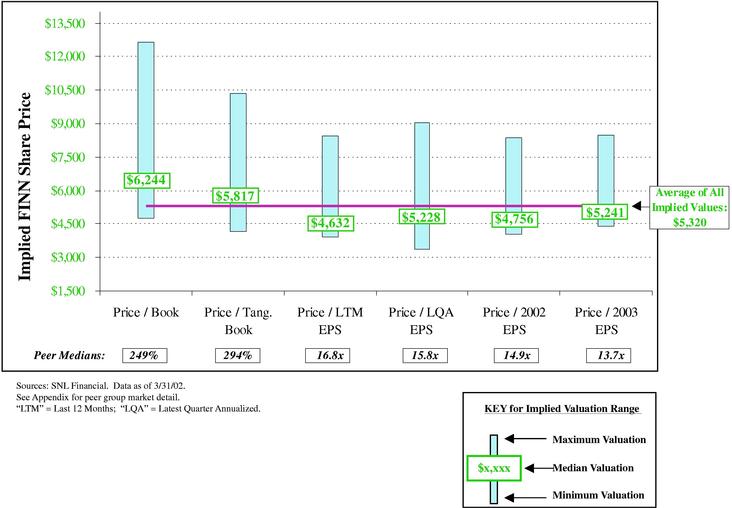
Implied First National Valuations Based on Widely Held Peer Group
Implied Per Share Value Ranges
27
Synthetic Consumer Peer Group—Market Performance
| | | | | Price To: | | | | |||||||||||||||||
|---|---|---|---|---|---|---|---|---|---|---|---|---|---|---|---|---|---|---|---|---|---|---|---|---|
| | | | | Div. Payout Ratio (%) | Avg. Daily Volume (1 Mnth.) | | ||||||||||||||||||
| Ticker | Institution | 5/29/02 Price ($) | Market Cap ($MMs) | LTM EPS (x) | LQA EPS (x) | 2002E EPS (x) | 2003E EPS (x) | Book Value (%) | Tang. BV (%) | Insider Ownership (%) | ||||||||||||||
| C | Citigroup, Inc., (NY) | 43.50 | 224,693 | 15.2 | 13.9 | 13.5 | 11.7 | 273 | 432 | 17.2 | 12,318,533 | 1.7 | ||||||||||||
| WM | Washington Mutual, Inc., (WA) | 38.25 | 37,240 | 11.4 | 9.8 | 9.7 | 8.8 | 202 | 315 | 25.5 | 3,164,014 | 1.7 | ||||||||||||
| ONE | Bank One Corporation, (IL) | 40.51 | 47,559 | 15.9 | 14.9 | 14.6 | 12.9 | 227 | 253 | 31.3 | 2,914,161 | 1.3 | ||||||||||||
| AXP | American Express Company, (NY) | 42.36 | 56,296 | NM | 23.0 | 21.2 | 18.8 | 451 | 504 | 17.4 | 4,311,690 | 0.8 | ||||||||||||
| KEY | KeyCorp, (OH) | 27.36 | 11,640 | NM | 12.2 | 11.5 | 10.6 | 182 | 221 | 0.0 | 1,586,419 | 1.6 | ||||||||||||
| KRB | MBNA Corporation, (DE) | 36.06 | 30,716 | 18.1 | 21.5 | 16.0 | 13.9 | 406 | 607 | 23.8 | 2,450,857 | 16.9 | ||||||||||||
| CCR | Countrywide Credit Industries, Inc., (CA) | 49.25 | 6,061 | 10.3 | 9.3 | 10.3 | 9.7 | 144 | 144 | 0.0 | 746,471 | 4.3 | ||||||||||||
| CF | Charter One Financial, Inc., (OH) | 35.25 | 7,756 | 17.7 | 15.7 | 13.8 | 12.3 | 271 | 309 | 32.3 | 922,742 | 5.8 | ||||||||||||
| SOV | Sovereign Bancorp, Inc., (PA) | 15.21 | 4,018 | 15.5 | 15.8 | 12.1 | 10.9 | 165 | 406 | 10.0 | 1,283,371 | 2.9 | ||||||||||||
| COF | Capital One Financial Corporation, (VA) | 62.24 | 13,724 | 20.2 | 18.7 | 17.3 | 14.5 | 373 | NA | 3.2 | 2,238,642 | 6.2 | ||||||||||||
| HBAN | Huntington Bancshares Incorporated, (OH) | 19.87 | 4,967 | NM | NM | 14.9 | 13.7 | 204 | 223 | 41.0 | 999,933 | 1.9 | ||||||||||||
| PVN | Providian Financial Corporation, (CA) | 7.65 | 2,210 | NM | NM | NM | 13.2 | 117 | NA | 0.0 | 3,012,585 | 4.4 | ||||||||||||
| TCB | TCF Financial Corporation, (MN) | 51.26 | 3,920 | 18.6 | 18.8 | 16.3 | 14.4 | 425 | 511 | 38.3 | 229,804 | 8.3 | ||||||||||||
| NYCB | New York Community Bancorp, Inc., (NY) | 28.09 | 2,870 | 19.1 | 15.3 | 13.5 | 11.8 | 279 | NM | 34.0 | 816,071 | 8.6 | ||||||||||||
| ICBC | Independence Community Bank Corp., (NY) | 31.38 | 1,812 | 17.6 | 15.1 | 14.8 | 12.9 | 206 | 264 | 21.2 | 288,823 | 10.4 | ||||||||||||
Maximum: | 224,693 | 20.2 | 23.0 | 21.2 | 18.8 | 451 | 607 | 41.0 | 12,318,533 | 16.9 | ||||||||||||||
| Minimum: | 1,812 | 10.3 | 9.3 | 9.7 | 8.8 | 117 | 144 | 0.0 | 229,804 | 0.8 | ||||||||||||||
| Mean: | 30,366 | 16.3 | 15.7 | 14.2 | 12.7 | 262 | 349 | 19.7 | 2,485,608 | 5.1 | ||||||||||||||
| Median: | 7,756 | 17.6 | 15.3 | 14.2 | 12.9 | 227 | 312 | 21.2 | 1,586,419 | 4.3 | ||||||||||||||
| FINN | First National of Nebraska, Inc., (NE) | 3,000 | 1,004 | 10.9 | 9.1 | 9.4 | 7.8 | 120 | 152 | 13.3 | 15 | 41.7 | ||||||||||||
Source: SNL Finical. Financial data as of 3/31/02. Estimates from IBES.
LTM EPS = last twelve months operating earnings per share.
28
Loan Breakdown—First National vs. Synthetic Consumer Peer Group
(figures as of December 31, 2001)
| First National of Nebraska—Loans $(000) | ||||||
| RE: One to Four Family | 802,769 | 11.5 | % | |||
| RE: Multifamily | 100,393 | 1.4 | % | |||
| RE: Construction & Development | 649,786 | 9.3 | % | |||
| RE: Commercial | 661,650 | 9.5 | % | |||
| RE: Farmland | 109,167 | 1.6 | % | |||
| Commercial & Industrial | 1,150,981 | 16.5 | % | |||
| Agricultural Loans | 682,600 | 9.8 | % | |||
| Consumer Loans | 747,419 | 10.7 | % | |||
| Credit Card Loans | 1,837,368 | 26.4 | % | |||
| Other Loans | 225,437 | 3.2 | % | |||
| Total Loans | 6,967,570 | 100.0 | % | |||
| Synthetic Consumer Peer Average—Loans $(000) | ||||||
| RE: One to Four Family | 11,023,555 | 21.6 | % | |||
| RE: Multifamily | 692,201 | 1.4 | % | |||
| RE: Construction & Development | 1,024,554 | 2.0 | % | |||
| RE: Commercial | 2,058,574 | 4.0 | % | |||
| RE: Farmland | 114,232 | 0.2 | % | |||
| Commercial & Industrial | 14,419,145 | 28.2 | % | |||
| Agricultural Loans | 173,287 | 0.3 | % | |||
| Consumer Loans | 8,588,467 | 16.8 | % | |||
| Credit Card Loans | 6,170,381 | 12.1 | % | |||
| Other Loans | 6,833,468 | 13.4 | % | |||
| Total Loans | 51,097,863 | 100.0 | % | |||
Source: SNL Financial.
29
Deposit Breakdown—First National vs. Synthetic Consumer Peer Group
(figures as of December 31, 2001)
| First National of Nebraska—Deposits $(000) | ||||||
| Demand Deposits | 786,239 | 10 | % | |||
| NOW & Other | 422,297 | 5 | % | |||
| MMDAs & Other | 2,956,464 | 37 | % | |||
| Retail Time Deposits | 3,000,429 | 37 | % | |||
| Jumbo Time Deposits | 926,369 | 11 | % | |||
| Total Deposits | 8,091,798 | 100 | % | |||
| Synthetic Consumer Peer Average—Deposits $(000) | ||||||
| Demand Deposits | 3,548,329 | 12 | % | |||
| NOW & Other | 1,071,468 | 4 | % | |||
| MMDAs & Other | 15,505,001 | 52 | % | |||
| Retail Time Deposits | 5,048,425 | 17 | % | |||
| Jumbo Time Deposits | 4,814,956 | 16 | % | |||
| Total Deposits | 29,988,180 | 100 | % | |||
Source: SNL Financial.
30
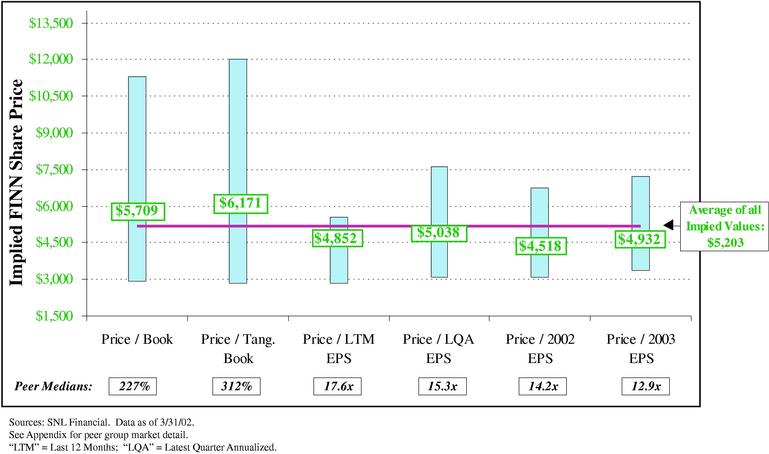
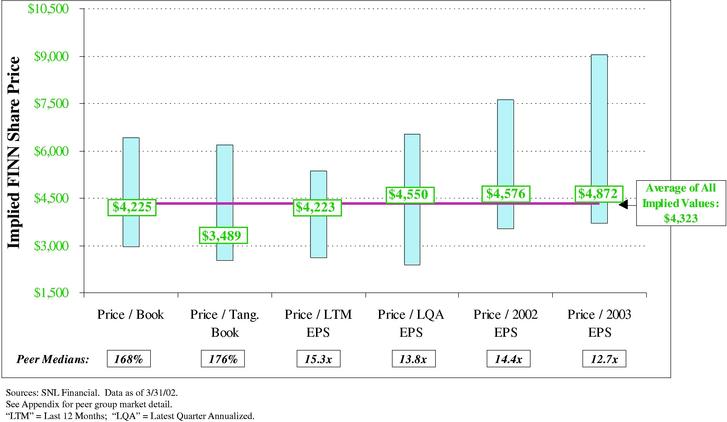
Implied First National Valuations Based on Synthetic Consumer Peer Group
Implied Per Share Value Ranges
31
Processing Peer Group—Market Performance
| | | | | Price To: | | | | | 3 Year CAGR | | ||||||||||||||||||
|---|---|---|---|---|---|---|---|---|---|---|---|---|---|---|---|---|---|---|---|---|---|---|---|---|---|---|---|---|
| | | | | Div. Payout Ratio (%) | | | | | ||||||||||||||||||||
| Ticker | Institution | 5/29/02 Price ($) | Market Cap ($MMs) | LTM EPS (x) | 2002E EPS (x) | 2003E EPS (x) | Book Value (%) | Return on Equity (%)(1) | EBIT Margin (%)(1) | EBITDA Margin (%)(1) | Oper. EPS (%) | Rev. (%) | Debt / Equity (%) | |||||||||||||||
| Data Processing | ||||||||||||||||||||||||||||
| AT | Alltel Corporation, (AR) | 51.90 | 16,138 | 17.5 | 16.1 | 15.0 | 284 | 39.6 | 20.02 | 23.12 | 38.49 | 9.89 | 9.64 | 64.86 | ||||||||||||||
| BSG | Bisys Group, Inc., (NY) | 34.23 | 4,085 | 37.6 | 35.3 | 29.1 | 642 | 0.0 | 19.14 | 21.49 | 27.59 | 19.29 | 26.85 | 52.77 | ||||||||||||||
| EDS | Electronic Data Systems Corp., (TX) | 53.86 | 25,800 | 19.0 | 16.5 | 14.7 | 379 | 20.4 | 23.53 | 10.33 | 17.21 | 16.38 | 25.90 | 67.77 | ||||||||||||||
| FISV(2) | Fiserv Inc., (WI) | 42.11 | 8,053 | 37.6 | 30.8 | 26.2 | 477 | 0.0 | 14.58 | 18.71 | 26.52 | 21.27 | 19.05 | 25.21 | ||||||||||||||
| MI | Marshall & Ilsley Corporation, (WI) | 62.76 | 6,682 | 16.3 | 14.8 | 13.8 | 253 | 27.6 | 14.27 | 10.51 | NA | 11.67 | 8.48 | 138.64 | ||||||||||||||
| Transaction Processing | ||||||||||||||||||||||||||||
| CEY | Certegey, Inc., (GA) | 42.30 | 2,941 | 33.3 | 29.5 | 25.7 | NM | 0.0 | 32.52 | 17.79 | 23.24 | 13.58 | 5.90 | 108.76 | ||||||||||||||
| CEFT | Concord EFS, Inc., (TN) | 31.95 | 16,311 | 50.7 | 42.2 | 33.2 | NM | 0.0 | 14.47 | 24.17 | 29.69 | 36.89 | 44.49 | 6.42 | ||||||||||||||
| GPN | Global Payments, Inc., (GA) | 34.90 | 1,282 | 29.8 | 28.4 | 24.8 | 419 | 6.2 | 12.11 | 16.40 | 22.56 | (11.51 | ) | (8.92 | ) | 25.08 | ||||||||||||
| FDC | First Data Corp, (CO) | 78.43 | 29,985 | 29.0 | 23.8 | 20.6 | 799 | 3.6 | 24.06 | 23.50 | 33.39 | 17.33 | 10.12 | 88.13 | ||||||||||||||
| NAP | National Processing Inc., (KY) | 28.30 | 1,471 | 25.5 | 23.8 | 20.3 | 354 | 0.0 | 13.83 | 18.23 | 22.53 | 57.79 | 55.92 | 0.00 | ||||||||||||||
| TSS | Total System Services Inc., (GA) | 22.50 | 4,432 | 40.9 | 36.1 | 29.8 | NM | 11.4 | 22.62 | 20.81 | 29.63 | 23.70 | 26.81 | 0.00 | ||||||||||||||
| FITB(3) | Fifth Third Bancorp, (OH) | 65.59 | 38,216 | 28.5 | 23.8 | 20.8 | 490 | 34.9 | 15.31 | NA | NA | 12.53 | 9.99 | 143.44 | ||||||||||||||
Maximum: | 38,216 | 50.7 | 42.2 | 33.2 | 799 | 39.6 | 32.52 | 24.17 | 38.49 | 57.79 | 55.92 | 143.44 | ||||||||||||||||
| Minimum: | 1,282 | 16.3 | 14.8 | 13.8 | 253 | 0.0 | 12.11 | 10.33 | 17.21 | (11.51 | ) | (8.92 | ) | 0.00 | ||||||||||||||
| Mean: | 12,950 | 30.5 | 26.7 | 22.8 | 455 | 12.0 | 18.87 | 18.64 | 27.09 | 19.07 | 19.52 | 60.09 | ||||||||||||||||
| Median: | 7,368 | 29.4 | 26.1 | 22.8 | 419 | 4.9 | 17.23 | 18.71 | 27.06 | 16.86 | 14.58 | 58.82 | ||||||||||||||||
| FINN | First National of Nebraska, (NE) | 3,000 | 1,004 | 10.9 | 9.4 | 7.8 | 120 | 13.3 | 13.33 | 18.02 | 19.22 | (3.06 | ) | 5.89 | 81.87 | |||||||||||||
Source: SNL Financial and Bloomberg LP. Financial data as of 3/31/02. Estimates from IBES.
LTM EPS = last twelve months operating earnings per share.
- (1)
- Peer data from Bloomberg as of 12/31/01.
- (2)
- 90% owned by Synovus Financial Corp.
- (3)
- FITB's Electronic Payment Processing segment consists of 10% of total revenue.
32
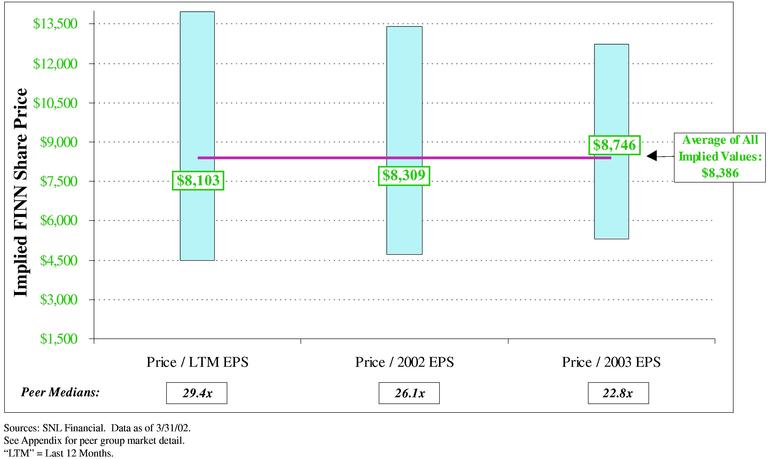
Implied First National Valuations Based on Processing Peer Group
Implied Per Share Value Ranges
33
Closely-held Peer Group—Market Performance
| | | | | Price To: | | | | |||||||||||||||||
|---|---|---|---|---|---|---|---|---|---|---|---|---|---|---|---|---|---|---|---|---|---|---|---|---|
| | | | | Div. Payout Ratio (%) | Avg. Daily Volume (1 Mnth.) | | ||||||||||||||||||
| Ticker | Institution | 5/29/02 Price ($) | Market Cap ($MMs) | LTM EPS (x) | LQA EPS (x) | 2002E EPS (x) | 2003E EPS (x) | Book Value (%) | Tang. BV (%) | Insider Ownership (%) | ||||||||||||||
| FCNCA | First Citizens BancShares, Inc., (NC) | 114.23 | 1,197 | 14.0 | 13.0 | NA | NA | 132 | 150 | 11.3 | 6,345 | 44.6 | ||||||||||||
| BOKF | BOK Financial Corporation, (OK) | 35.01 | 1,851 | 17.8 | 13.9 | 15.4 | 13.9 | 220 | 268 | 0.0 | 66,451 | 73.2 | ||||||||||||
| UMBF | UMB Financial Corporation, (MO) | 47.74 | 1,053 | 16.8 | 14.7 | 14.1 | 13.0 | 137 | 149 | 22.7 | 32,963 | 25.4 | ||||||||||||
| IBOC | International Bancshares Corporation, (TX) | 48.30 | 1,252 | 14.7 | 12.3 | 13.8 | NA | 255 | 313 | 47.6 | 20,331 | 29.5 | ||||||||||||
| RIGS | Riggs National Corporation, (DC) | 15.80 | 450 | NM | 19.8 | 23.9 | 18.0 | 126 | 128 | 100.0 | 43,404 | 51.4 | ||||||||||||
| TCNJ | Trust Company of New Jersey (The), (NJ) | 24.03 | 442 | 16.5 | 17.2 | NA | NA | 205 | 206 | 31.3 | 23,681 | 32.1 | ||||||||||||
| FCBN | First Citizens Bancorporation of SC, (SC) | 350.00 | 322 | 9.5 | 7.2 | NA | NA | 118 | 145 | 2.1 | 302 | 46.4 | ||||||||||||
| IFC | Irwin Financial Corporation, (IN) | 20.25 | 558 | 10.1 | 13.7 | 15.2 | 10.7 | 174 | 175 | 17.3 | 71,000 | 44.2 | ||||||||||||
| MBFI | MB Financial, Inc., (IL) | 31.27 | 549 | NM | 13.5 | 12.8 | 11.5 | 183 | 207 | 25.9 | 18,650 | 35.7 | ||||||||||||
| BANF | BancFirst Corporation, (OK) | 43.41 | 355 | 12.6 | 11.3 | 11.1 | 10.6 | 160 | 177 | 18.8 | 6,118 | 52.1 | ||||||||||||
| CORS | Corus Bankshares, Inc., (IL) | 50.94 | 721 | 17.0 | 19.6 | 16.4 | 12.7 | 156 | 157 | 21.2 | 25,313 | 36.6 | ||||||||||||
| IFNC | Intrust Financial Corporation, (KS) | 133.00 | 311 | 12.3 | 12.2 | NA | NA | 163 | 189 | 29.3 | 63 | 34.5 | ||||||||||||
| REPB | Republic Bancshares, Inc., (FL) | 20.05 | 227 | NM | NM | NM | 23.6 | 134 | 152 | 0.0 | 62,963 | 37.4 | ||||||||||||
| GBCB | GBC Bancorp, (CA) | 29.95 | 345 | 19.4 | NM | 18.2 | 9.7 | 175 | 175 | NM | 41,295 | 32.9 | ||||||||||||
| CBCL | Capitol Bancorp Ltd., (MI) | 21.94 | 233 | 15.3 | 14.4 | 15.3 | 13.1 | 185 | 211 | 26.3 | 15,440 | 27.9 | ||||||||||||
| UBH | U.S.B. Holding Co., Inc., (NY) | 15.88 | 293 | 15.0 | 14.2 | 13.5 | 12.3 | 213 | 224 | 28.1 | 7,754 | 35.0 | ||||||||||||
| FINB | First Indiana Corporation, (IN) | 19.75 | 306 | 16.3 | 12.0 | 11.2 | 10.2 | 144 | 154 | 39.0 | 19,631 | 25.1 | ||||||||||||
| MVBI | Mississippi Valley Bancshares, Inc., (MO) | 46.45 | 438 | 15.9 | 15.9 | 14.4 | 12.8 | 254 | 254 | 17.5 | 13,468 | 37.8 | ||||||||||||
Maximum: | 1,851 | 19.4 | 19.8 | 23.9 | 23.6 | 255 | 313 | 100.0 | 71,000 | 73.2 | ||||||||||||||
| Minimum: | 227 | 9.5 | 7.2 | 11.1 | 9.7 | 118 | 128 | 0.0 | 63 | 25.1 | ||||||||||||||
| Mean: | 606 | 14.9 | 14.1 | 15.0 | 13.2 | 174 | 191 | 25.8 | 26,398 | 39.0 | ||||||||||||||
| Peer Median: | 440 | 15.3 | 13.8 | 14.4 | 12.7 | 168 | 176 | 22.7 | 19,981 | 36.1 | ||||||||||||||
| FINN | First National of Nebraska, (NE) | 3,000 | 1,004 | 10.9 | 9.1 | 9.4 | 7.8 | 120 | 152 | 13.3 | 15 | 41.7 | ||||||||||||
Source: SNL Financial. Financial data as of 3/31/02. Estimates from IBES.
LTM EPS = last twelve months operating earnings per share.
34
Implied First National Valuations Based on Closely-held Peer Group
Implied Per Share Value Ranges
35
SUMMARY VALUATION
Comparable Peer Group Valuation
| | Average of Median Implied Values | Weighting | |||||
|---|---|---|---|---|---|---|---|
| Widely Held | $ | 5,320 | 15 | % | |||
| Synthetic Consumer | $ | 5,203 | 30 | % | |||
| Processing Companies | $ | 8,386 | 5 | % | |||
| Closely Held | $ | 4,323 | 50 | % | |||
| Weighted Average | $ | 4,939 | |||||
36
| Valuation Analysis: Business Component Valuation Analysis |
First National Business Component Build-up Valuation
Business Component Valuation
| | 2002 Adjusted $ Net Income(3) | Applicable Earnings Multiple 2002 P/E | Gross Value | ||||||
|---|---|---|---|---|---|---|---|---|---|
| Consumer Banking(1) | $ | 57,205 | 14.2 | x | $ | 812,181 | |||
| Corporate Banking(2) | $ | 13,245 | 14.1 | x(4) | $ | 186,755 | |||
| Community Banking | $ | 32,770 | 14.3 | x(5) | $ | 468,611 | |||
| Processing | $ | 3,223 | 26.1 | x | $ | 84,155 | |||
| Total | $ | 106,443 | $ | 1,551,702 | |||||
| Value Per Share: | $ | 4,639 | |||||||
- (1)
- Includes mortgage business.
- (2)
- Includes operations.
- (3)
- Equally allocates transfer fund pricing costs, unallocated overhead expenses and tax adjustments over the consumer bank, corporate bank and affiliate banks.
- (4)
- Represents KBW's 2002 P/E multiple on regional banks.
- (5)
- Represents KBW's 2002 P/E multiple on community banks.
38
| Valuation Analysis: Comparable Merger & Acquisition Analysis |
Nationwide Bank Deals Since January 1, 2001—Deal Value $1 to $7 Billion
| | | | | | | | | | | Price To: | | |||||||||||||||||
|---|---|---|---|---|---|---|---|---|---|---|---|---|---|---|---|---|---|---|---|---|---|---|---|---|---|---|---|---|
| | | | | | | | LTM Efficiency Ratio (%) | | | | ||||||||||||||||||
| Buyer Name | Target Name | Total Assets ($M) | Equity/ Assets (%) | NPAs/ Assets (%) | ROAA (%) | ROAE (%) | Annc. Date | Deal Value ($M) | Book (%) | Tang. Book (%) | LTM EPS (x) | Est. EPS (x) | 1 Day Prem. (%) | |||||||||||||||
| Citigroup, Inc. | Golden State Bancorp Inc., (CA) | 54,089 | 4.98 | NA | 0.89 | 18.92 | 52.55 | 5/21/02 | 5,889 | 216 | 283 | 13.3 | 11.7 | 12.71 | ||||||||||||||
| BNP Paribas Group | United California Bank, (CA) | 10,763 | 10.07 | 1.26 | 1.33 | 13.31 | 61.23 | 12/8/01 | 2,400 | 222 | 222 | 17.0 | NA | NA | ||||||||||||||
| BNP Paribas Group | BancWest Corporation, (HI) | 19,419 | 10.53 | 0.66 | 1.31 | 12.09 | 50.96 | 5/7/01 | 2,483 | 213 | 339 | 19.2 | 18.4 | 40.11 | ||||||||||||||
| Citigroup, Inc. | European American Bank, (NY) | 15,384 | 6.10 | 0.41 | 0.89 | 14.87 | 55.54 | 2/12/01 | 1,950 | 272 | 364 | 14.0 | NA | NA | ||||||||||||||
| Royal Bank of Canada | Centura Banks, Inc., (NC) | 11,482 | 8.33 | 0.47 | 0.88 | 11.10 | 56.42 | 1/26/01 | 2,330 | 238 | 279 | 23.4 | 15.9 | 29.45 | ||||||||||||||
| BB&T Corporation | F&M National Corporation, (VA) | 3,569 | 9.51 | 0.62 | 1.43 | 14.81 | 57.79 | 1/24/01 | 1,163 | 295 | 322 | 21.9 | 19.7 | 47.22 | ||||||||||||||
| Maximum | 54,089 | 10.53 | 1.26 | 1.43 | 18.92 | 61.23 | 5,889 | 295 | 364 | 23.4 | 19.7 | 47.22 | ||||||||||||||||
| Minimum | 3,569 | 4.98 | 0.41 | 0.88 | 11.10 | 50.96 | 1,163 | 213 | 222 | 13.3 | 11.7 | 12.71 | ||||||||||||||||
| Median | 13,433 | 8.92 | 0.62 | 1.10 | 14.06 | 55.98 | 2,365 | 230 | 303 | 18.1 | 17.1 | 34.78 | ||||||||||||||||
| Average | 19,118 | 8.25 | 0.68 | 1.12 | 14.18 | 55.75 | 2,702 | 243 | 301 | 18.1 | 16.4 | 32.37 | ||||||||||||||||
| First National of Nebraska | 9,977 | 8.41 | 0.30 | 1.12 | 13.33 | 64.89 | ||||||||||||||||||||||
Sources: SNL Financial, company SEC filings.
Most recent available financial data used for comparables.
Note: Golden State is a consumer oriented thrift.
40
Nationwide Bank Deals—ImpliedControlValuation
Implied Per Share Value Ranges
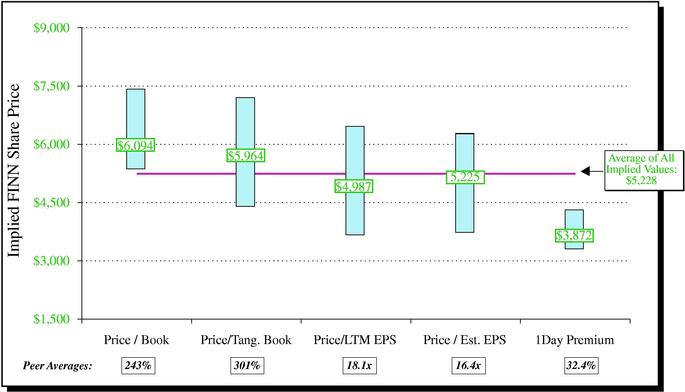
Sources: SNL Financial and SEC filings.
"LTM" = Last 12 Months; "LQA" = Latest Quarter Annualized.
41
Nationwide Bank Deals—Implied Control ValuationDiscounted*
Implied Per Share Value Ranges
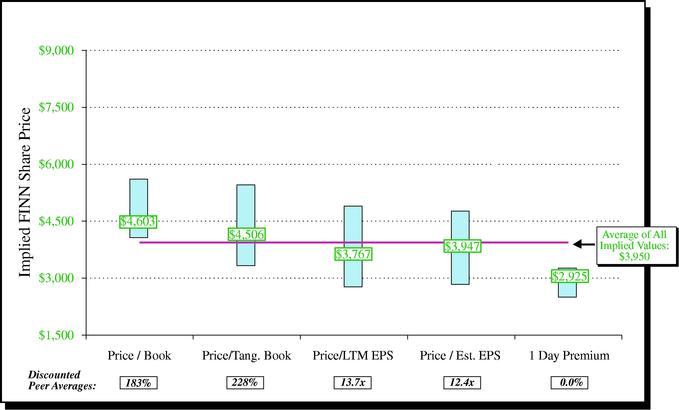
Note: Boxes indicate valuation ranges based on comparable acquisition maximum and minimum valuation multiples.
*Implied valuations discounted by Comparable Acquisition "Premium to Market" multiple average of 32.4%.
42
| Valuation Analysis: Comparable Self-tender Analysis |
Comparable Self-tenders
| | | Shares Tendered As a % of Shares: | | | | | | | | | | | | | |||||||||||||||||||
|---|---|---|---|---|---|---|---|---|---|---|---|---|---|---|---|---|---|---|---|---|---|---|---|---|---|---|---|---|---|---|---|---|---|
| | | | | | Final Tender Price to: | Earnings Per Share Accretion/(Dilution) | Book Value Per Share Accretion/(Dilution) | ||||||||||||||||||||||||||
| | Company | | in Offering | Closing Date | Final Tender Price | CMV 4/18/02 | 30 Day Avg. Price | Trailing EPS (x) | Forward EPS (x) | BV per Share (x) | TBV per Share (x) | ||||||||||||||||||||||
| | Out. | (%) | ($) | (%) | ($) | ||||||||||||||||||||||||||||
| Main Street Trust Inc.• | NA | NA | 5/31/02 | $ | 23.00 | $ | 22.80 | 21.8 | % | 15.9 | NA | 1.27 | 1.27 | NA | NA | NA | NA | ||||||||||||||||
| Summit Bank | 3.6 | % | 38.7 | % | 3/15/02 | $ | 17.00 | $ | 16.40 | 18.1 | % | 12.8 | NA | 1.20 | 1.27 | NA | NA | NA | NA | ||||||||||||||
| T | HCB Bancshares, Inc.• | 16.2 | % | 81.2 | % | 4/5/02 | $ | 14.75 | $ | 15.35 | 12.9 | % | 27.8 | NA | 0.86 | 0.87 | 21 | % | 0.11 | 4 | % | 0.64 | |||||||||||
| Washington Bancorp• | 0.3 | % | 25.3 | % | 2/15/02 | $ | 19.00 | $ | 19.30 | 5.6 | % | 7.8 | NA | 0.82 | 0.90 | NA | NA | NA | NA | ||||||||||||||
| Chester Bancorp, Inc. | 21.9 | % | 109.3 | % | 8/15/01 | $ | 17.75 | $ | 18.85 | 4.8 | % | 19.3 | 18.3 | 1.14 | 1.14 | NA | NA | NA | NA | ||||||||||||||
| T | StateFed Financial Corporation• | 15.4 | % | 100.4 | % | 6/11/01 | $ | 11.50 | $ | 10.50 | 21.8 | % | 17.7 | 20.9 | 1.02 | 1.02 | -10 | % | (0.06 | ) | 14 | % | 1.56 | ||||||||||
| Republic Bancorp, Inc. | 5.2 | % | 74.7 | % | 3/13/01 | $ | 10.00 | $ | 12.00 | 40.2 | % | 11.4 | 9.3 | 1.42 | 1.42 | NA | NA | NA | NA | ||||||||||||||
| FBL Financial Group, Inc.(1)• | 3.7 | % | 100.0 | % | 10/26/00 | $ | 20.00 | $ | 19.92 | 42.3 | % | 9.3 | 12.3 | 1.15 | 1.20 | NA | NA | NA | NA | ||||||||||||||
| BT Financial Corporation(2)*• | 10.4 | % | 103.7 | % | 10/31/00 | $ | 19.50 | NA | 9.8 | % | 16.0 | 18.9 | 1.75 | 1.95 | 37 | % | 0.41 | (9 | %) | -1.03 | |||||||||||||
| PS Financial, Inc.*• | 22.0 | % | 110.0 | % | 3/29/00 | $ | 12.00 | NA | 5.6 | % | 11.4 | 12.6 | 1.08 | 1.08 | 15 | % | 0.15 | (1 | %) | -0.07 | |||||||||||||
| T | Hemlock Federal Finl Corp.• | 26.0 | % | 108.2 | % | 3/1/00 | $ | 15.00 | $ | 24.50 | 5.2 | % | 10.4 | 8.6 | 0.94 | 0.94 | 3 | % | 0.04 | (0 | %) | -0.02 | |||||||||||
| First Merchants | 9.4 | % | 94.2 | % | 12/17/99 | $ | 28.00 | $ | 28.30 | �� | 26.7 | % | 16.7 | 16.9 | 2.55 | 2.60 | 8 | % | 0.13 | 2 | % | 0.25 | |||||||||||
| First Southern Bancshare, Inc. | 18.7 | % | 112.0 | % | 9/30/99 | $ | 13.50 | NA | 18.9 | % | 14.7 | NM | 1.25 | 1.25 | 9 | % | 0.07 | (4 | %) | -0.41 | |||||||||||||
| First Commonwealth Finl Corp(3)• | 6.2 | % | 95.5 | % | 9/29/99 | $ | 26.00 | $ | 13.96 | 10.5 | % | 14.3 | 15.9 | 2.26 | 2.33 | 0 | % | 0.00 | (14 | %) | -1.57 | ||||||||||||
| Bancfirst Corp. | 12.7 | % | 118.7 | % | 6/1/99 | $ | 38.00 | $ | 43.00 | 9.2 | % | 14.8 | 11.9 | 1.75 | 1.99 | 8 | % | 0.19 | (9 | %) | -2.03 | ||||||||||||
| T | EFC Bancorp, Inc.• | 24.0 | % | 96.1 | % | 6/2/99 | $ | 12.00 | $ | 15.00 | 18.6 | % | 16.0 | 13.8 | 0.96 | 0.96 | NM | NA | 1 | % | 0.16 | ||||||||||||
| First Banks, Inc.(4) | 2.6 | % | 78.7 | % | 2/3/99 | $ | 21.00 | $ | 40.70 | 23.7 | % | 23.7 | 14.6 | 1.80 | 2.10 | NA | NA | NA | NA | ||||||||||||||
| T | WesterFed Financial Corp.*• | 19.4 | % | 98.4 | % | 12/21/98 | $ | 20.00 | NA | 9.7 | % | 14.2 | 12.3 | 1.02 | 1.25 | 9 | % | 0.11 | 1 | % | 0.29 | ||||||||||||
| T | Tri-County Bancorp, Inc.*• | 26.8 | % | 100.0 | % | 12/7/98 | $ | 14.00 | NA | 19.3 | % | 15.9 | 16.5 | 1.10 | 1.10 | 10 | % | 0.08 | (11 | %) | -1.41 | ||||||||||||
| T | Klamath First Bancorp, Inc.• | 20.0 | % | 100.0 | % | 1/15/99 | $ | 19.50 | $ | 14.01 | 18.5 | % | 17.6 | 16.5 | 1.25 | 1.37 | 20 | % | 0.20 | (4 | %) | -0.63 | |||||||||||
| S&T Bancorp, Inc.(5) | 3.2 | % | 29.4 | % | 2/20/98 | $ | 49.00 | $ | 25.12 | 14.3 | % | 20.7 | 16.2 | 2.66 | 2.66 | 3 | % | 0.06 | (24 | %) | -4.42 | ||||||||||||
| Fauquier Bankshres(6) | 3.1 | % | 39.4 | % | 2/25/98 | $ | 39.00 | $ | 27.64 | 24.8 | % | 16.8 | 13.4 | 1.78 | 1.78 | NA | NA | NA | NA | ||||||||||||||
| Maximum | 26.8 | % | 118.7 | % | 42.3 | % | 27.8 | 20.9 | 2.66 | 2.66 | 37 | % | 0.41 | 14 | % | 1.56 | |||||||||||||||||
| Minimum | 0.3 | % | 25.3 | % | 4.8 | % | 7.8 | 8.6 | 0.82 | 0.87 | (10 | %) | (0.06 | ) | (24 | %) | (4.42 | ) | |||||||||||||||
| Median | 12.7 | % | 98.4 | % | 18.3 | % | 15.9 | 14.6 | 1.22 | 1.26 | 9 | % | 0.11 | (2 | %) | (0.24 | ) | ||||||||||||||||
| (1) | KBW acted as investment advisor to FFG in their acquisition of Kansas Farm Bureau Life. | * | Acquired | |||
| (2) | Changed name to Promistar Financial Corporation and their ticker to PRFC effective Nov. 15, 2000. | • | KBW acted as deal manager and information agent | |||
| (3) | KBW participated in FCF's TRUP. Adjusted for 2 for 1 stock split declared 3/14/00. | T | Denotes thrift institution. | |||
| (4) | Modified to fixed purchase at 1/29/99 at $21 per share. | |||||
| (5) | Adjusted for 2 for 1 stock split declared 9/23/98. | |||||
| (6) | Adjusted for 2 for 1 stock split declared 3/2/98. |
44
Comparable Self-tenders—Implied Valuations
Implied Per Share Value Ranges
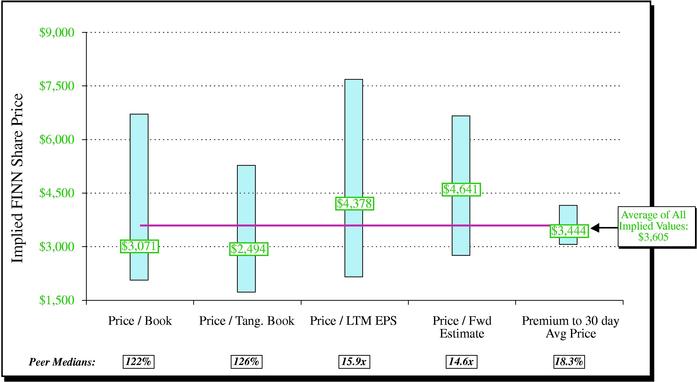
Sources: SNL Financial and SEC filings.
"LTM" = Last 12 Months.
45
| Valuation Analysis: Discounted Cash Flow Analysis |
Net Present Value
| | 2001 | 2002 | 2003 | 2004 | 2005 | 2006 | |||||||||||||
|---|---|---|---|---|---|---|---|---|---|---|---|---|---|---|---|---|---|---|---|
| Assets | $ | 10,336,854 | $ | 11,370,539 | $ | 12,507,593 | $ | 13,758,353 | $ | 15,134,188 | $ | 16,647,607 | |||||||
| Growth | 10% | 10% | 10% | 10% | 10% | ||||||||||||||
| Projected Net Income | $ | 106,443 | $ | 128,294 | $ | 145,071 | $ | 175,403 | $ | 211,778 | |||||||||
| Net Present Value Analysis | 2002 | 2003 | 2004 | 2005 | 2006 | ||||||||||||||
| Excess Capital | $ | 70,709 | $ | 43,015 | $ | 51,264 | $ | 72,215 | $ | 98,272 | |||||||||
| Terminal Value | 10.5x | 0 | 0 | 0 | 0 | $ | 2,223,669 | ||||||||||||
| Net Cash Flow | $ | 70,709 | $ | 43,015 | $ | 51,264 | $ | 72,215 | $ | 2,321,941 | |||||||||
| Net Present Value | $ | 1,436,337 | |||||||||||||||||
| per share | $ | 4,294 | |||||||||||||||||
| Discount Rate | 13.0% | ||||||||||||||||||
| Target Leverage Ratio | 7.50% | ||||||||||||||||||
Terminal Multiple
| 9.5× | 10.5× | 11.5x | |||||||||
| 12.0 | % | $ | 4,117 | $ | 4,476 | $ | 4,835 | ||||
| Discount Rate | 13.0 | % | $ | 3,950 | $ | 4,294 | $ | 4,637 | |||
| 14.0 | % | $ | 3,792 | $ | 4,120 | $ | 4,449 | ||||
| Average Value | $ | 4,297 | |||||||||
47
| Valuation Summary & Conclusions |
Process Summary
- •
- KBW's goal is to derive a Valuation Range to assist the board in its determination of the final tender offer price.
- •
- KBW weighted the various valuation methodologies employed to reflect the organizational, financial and operating characteristics of First National including:
- •
- its business component makeup
- •
- the impact of credit card receivables and related servicing and processing flow within the consumer bank segment
- •
- the historical market trading atmosphere for First National's common shares and the resulting lack of marketability condition
- •
- the pro-forma financial impact of the tender offer on First National
- •
- To reflect the relative additional lack of marketability inherent in First National's shares versus the public company comparables utilized in its analysis, KBW applied a 15% - 25% discount to the total weighted average value of the valuation methodologies.
49
Valuation Summary
- (1)
- Average of median implied values that were derived from using various valuation multiples (ie price to book, price to earnings, etc.).
- (2)
- Average of Comparable Public ($4,939) and Business Component Valuation ($4,639) implied values.
50
Valuation Summary
| First National Data 3/31/02 | | 5/29/02 | Valuation Range | ||||||||||||
|---|---|---|---|---|---|---|---|---|---|---|---|---|---|---|---|
| Price to: | $3,000 | $3,100 | $3,200 | $3,300 | $3,400 | $3,500 | |||||||||
| $ 275.25 | LTM EPS | 10.9x | 11.3x | 11.6x | 12.0x | 12.4x | 12.7x | ||||||||
| $ 330.04 | LQA EPS | 9.1x | 9.4x | 9.7x | 10.0x | 10.3x | 10.6x | ||||||||
| $ 318.22 | 2002 EPS | 9.4x | 9.7x | 10.1x | 10.4x | 10.7x | 11.0x | ||||||||
| $ 383.54 | 2003 EPS | 7.8x | 8.1x | 8.3x | 8.6x | 8.9x | 9.1x | ||||||||
| $2,509.80 | Book Value | 120 | % | 124 | % | 128 | % | 131 | % | 135 | % | 139 | % | ||
| $1,978.54 | Tang. Book Value | 152 | % | 157 | % | 162 | % | 167 | % | 172 | % | 177 | % | ||
Market Premium: | |||||||||||||||
| $3,000.00 | Current | 0 | % | 3 | % | 7 | % | 10 | % | 13 | % | 17 | % | ||
| $2,601.25 | 90 Day Average* | 15 | % | 19 | % | 23 | % | 27 | % | 31 | % | 35 | % | ||
"LTM" = Last 12 Months; "LQA" = Latest Quarter Annualized.
- *
- 90 Day Average inclusive of reported OTC Bulletin Board transactions and private transactions as reported by First National.
51
Final Valuation Range Conclusion
- •
- Total Transaction Size Sensitivity
First National Tender Offer Price Per Share
| | | $3,100 | $3,150 | $3,200 | $3,250 | $3,300 | $3,350 | $3,400 | $3,450 | $3,500 | |||||||||||||||||||
|---|---|---|---|---|---|---|---|---|---|---|---|---|---|---|---|---|---|---|---|---|---|---|---|---|---|---|---|---|---|
| 3,000 | $ | 9,300,000 | $ | 9,450,000 | $ | 9,600,000 | $ | 9,750,000 | $ | 9,900,000 | $ | 10,050,000 | $ | 10,200,000 | $ | 10,350,000 | $ | 10,500,000 | |||||||||||
| Shares Tendered | 5,000 | $ | 15,500,000 | $ | 15,750,000 | $ | 16,000,000 | $ | 16,250,000 | $ | 16,500,000 | $ | 16,750,000 | $ | 17,000,000 | $ | 17,250,000 | $ | 17,500,000 | ||||||||||
| 7,000 | $ | 21,700,000 | $ | 22,050,000 | $ | 22,400,000 | $ | 22,750,000 | $ | 23,100,000 | $ | 23,450,000 | $ | 23,800,000 | $ | 24,150,000 | $ | 24,500,000 | |||||||||||
| 9,000 | $ | 27,900,000 | $ | 28,350,000 | $ | 28,800,000 | $ | 29,250,000 | $ | 29,700,000 | $ | 30,150,000 | $ | 30,600,000 | $ | 31,050,000 | $ | 31,500,000 | |||||||||||
| 11,000 | $ | 34,100,000 | $ | 34,650,000 | $ | 35,200,000 | $ | 35,750,000 | $ | 36,300,000 | $ | 36,850,000 | $ | 37,400,000 | $ | 37,950,000 | $ | 38,500,000 | |||||||||||
| 13,000 | $ | 40,300,000 | $ | 40,950,000 | $ | 41,600,000 | $ | 42,250,000 | $ | 42,900,000 | $ | 43,550,000 | $ | 44,200,000 | $ | 44,850,000 | $ | 45,500,000 | |||||||||||
| 15,000 | $ | 46,500,000 | $ | 47,250,000 | $ | 48,000,000 | $ | 48,750,000 | $ | 49,500,000 | $ | 50,250,000 | $ | 51,000,000 | $ | 51,750,000 | $ | 52,500,000 | |||||||||||
52
SUMMARY VALUATION
| Comparable Peer Group Valuation | Business Component Valuation | |||||||||||||||
|---|---|---|---|---|---|---|---|---|---|---|---|---|---|---|---|---|
| | Average of Median Implied Values | Weighting | | 2002 Adjusted $ Net Income(3) | Applicable Earnings Multiple 2002 P/E | Gross Value | ||||||||||
| Widely Held | $ | 5,320 | 15 | % | Consumer Banking(1) | $ | 57,205 | 14.2x | $ | 812,181 | ||||||
| Synthetic Consumer | $ | 5,203 | 30 | % | Corporate Banking(2) | $ | 13,245 | 14.1x | (4) | $ | 186,755 | |||||
| Processing Companies | $ | 8,386 | 5 | % | Community Banking | $ | 32,770 | 14.3x | (5) | $ | 468,611 | |||||
| Closely Held | $ | 4,323 | 50 | % | Processing | $ | 3,223 | 26.1x | $ | 84,155 | ||||||
| Weighted Average | $ | 4,939 | Total | $ | 106,443 | $ | 1,551,702 | |||||||||
| Value Per Share: | $ | 4,639 | ||||||||||||||
- (1)
- Includes mortgage business.
- (2)
- Includes operations.
- (3)
- Equally allocates transfer fund pricing costs, unallocated overhead expenses and tax adjustments over the consumer bank, corporate bank and affiliate banks.
- (4)
- Represents KBW's 2002 P/E multiple on regional banks.
- (5)
- Represents KBW's 2002 P/E multiple on community banks.
Average
$4,789
53
Nationwide Bank Deals—Implied Control ValuationDiscounted*
Implied Per Share Value Ranges
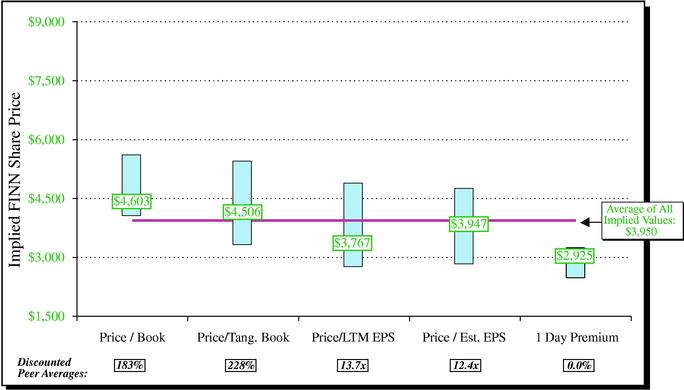
Note: Boxes indicate valuation ranges based on comparable acquisition maximum and minimum valuation multiples.
*Implied valuations discounted by Comparable Acquisition "Premium to Market" multiple average of 32.4%.
54
Comparable Self-tenders—Implied Valuations
Implied Per Share Value Ranges
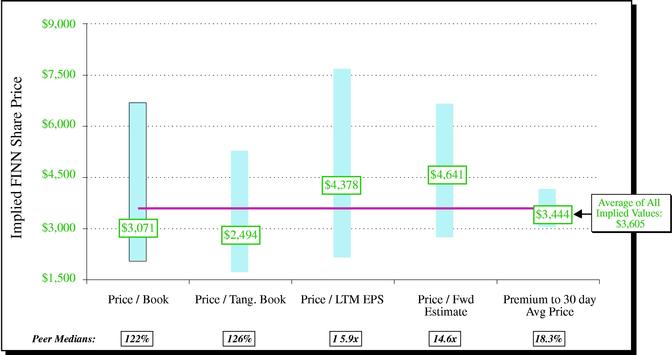
Sources: SNL Financial and SEC filings.
"LTM" = Last 12 Months.
55
Net Present Value
| | 2001 | 2002 | 2003 | 2004 | 2005 | 2006 | |||||||||||||
|---|---|---|---|---|---|---|---|---|---|---|---|---|---|---|---|---|---|---|---|
| Assets | $ | 10,336,854 | $ | 11,370,539 | $ | 12,507,593 | $ | 13,758,353 | $ | 15,134,188 | $ | 16,647,607 | |||||||
| Growth | 10% | 10% | 10% | 10% | 10% | ||||||||||||||
| Projected Net Income | $ | 106,443 | $ | 128,294 | $ | 145,071 | $ | 175,403 | $ | 211,778 | |||||||||
| Net Present Value Analysis | 2002 | 2003 | 2004 | 2005 | 2006 | ||||||||||||||
| Excess Capital | $ | 70,709 | $ | 43,015 | $ | 51,264 | $ | 72,215 | $ | 98,272 | |||||||||
| Terminal Value | 10.5x | 0 | 0 | 0 | 0 | $ | 2,223,669 | ||||||||||||
| Net Cash Flow | $ | 70,709 | $ | 43,015 | $ | 51,264 | $ | 72,215 | $ | 2,321,941 | |||||||||
| Net Present Value | $ | 1,436,337 | |||||||||||||||||
| per share | $ | 4,294 | |||||||||||||||||
| Discount Rate | 13.0% | ||||||||||||||||||
| Target Leverage Ratio | 7.50% | ||||||||||||||||||
Terminal Multiple
| 9.5× | 10.5× | 11.5× | |||||||||
| 12.0 | % | $ | 4,117 | $ | 4,476 | $ | 4,835 | ||||
| Discount Rate | 13.0 | % | $ | 3,950 | $ | 4,294 | $ | 4,637 | |||
| 14.0 | % | $ | 3,792 | $ | 4,120 | $ | 4,449 | ||||
Average Value | $ | 4,297 | |||||||||
56
| Financial Impact of Tender to Remaining Shareholders |
First National Tender Offer Assumptions
- •
- The median earnings and book value accretion/(dilution) of Comparable Tenders were calculated to compare with the financial impact of the proposed Tender Offer to remaining shareholders. The analysis assumes:
Numbers in (000s) except per share amounts.
| Basic Shares Outstanding as of 3/31/02 | 331 | Shares | |||||||
| Diluted Shares Outstanding as of 3/31/02 | 335 | Shares | |||||||
| 2002 Estimated: | |||||||||
| Earnings | $ | 106,443 | |||||||
| Diluted GAAP EPS | $ | 318.22 | |||||||
| 2003 Estimated: | |||||||||
| Earnings | $ | 128,294 | |||||||
| Diluted GAAP EPS | $ | 383.54 | |||||||
| Earnings Growth 2002 - 2003 | 20.53 | % | |||||||
| Repurchase Assumptions | |||||||||
| Current Stock Price (5/29/02) | $ | 3,000 | |||||||
| 2002 Estimated P/E | 9.4x | ||||||||
| Premium Over Current Stock Price | 3.3 | % | 16.7 | % | |||||
| Tender Offer Valuation Range | $ | 3,100 | - | $ | 3,500 | ||||
| 2002 Premium Adjusted Estimated P/E | 9.7x | 11.0x | |||||||
| Financing Assumptions | |||||||||
| Cost of Funding | 6.50 | % | |||||||
| After-tax Cost Saves from De-registration | $ | 260 | |||||||
| Effective Tax Rate | 35.00 | % |
58
Tender Offer Price Sensitivity
Assumes an 8,000 Share Repurchase
| | | Earnings Per Share Impact | Book Value Per Share Impact | ||||||||||||||||||||
|---|---|---|---|---|---|---|---|---|---|---|---|---|---|---|---|---|---|---|---|---|---|---|---|
| Tender Offer Price | 2002 P/E | % Change in 2002 EPS | % Change in 2003 EPS | $ Acc in 2002 EPS | $ Acc in 2003 EPS | % Change in 2002 BV | % Change in 2003 BV | $ Accretion/ (Dilution) in 2002 | $ Accretion/ (Dilution) in 2003 | ||||||||||||||
| $3,100 | 9.7 | 0.90 | % | 1.82 | % | $ | 2.87 | $ | 6.98 | (0.26 | )% | (0.03 | )% | $ | (7.34 | ) | $ | (0.90 | ) | ||||
| $3,150 | 9.9 | 0.89 | % | 1.81 | % | $ | 2.85 | $ | 6.93 | (0.31 | )% | (0.07 | )% | $ | (8.61 | ) | $ | (2.22 | ) | ||||
| $3,200 | 10.1 | 0.89 | % | 1.79 | % | $ | 2.82 | $ | 6.88 | (0.35 | )% | (0.11 | )% | $ | (9.87 | ) | $ | (3.54 | ) | ||||
| $3,250 | 10.2 | 0.88 | % | 1.78 | % | $ | 2.80 | $ | 6.83 | (0.40 | )% | (0.15 | )% | $ | (11.14 | ) | $ | (4.86 | ) | ||||
| $3,300 | 10.4 | 0.87 | % | 1.77 | % | $ | 2.77 | $ | 6.78 | (0.44 | )% | (0.20 | )% | $ | (12.41 | ) | $ | (6.18 | ) | ||||
| $3,350 | 10.5 | 0.86 | % | 1.75 | % | $ | 2.74 | $ | 6.73 | (0.49 | )% | (0.24 | )% | $ | (13.67 | ) | $ | (7.50 | ) | ||||
| $3,400 | 10.7 | 0.85 | % | 1.74 | % | $ | 2.72 | $ | 6.67 | (0.53 | )% | (0.28 | )% | $ | (14.94 | ) | $ | (8.81 | ) | ||||
| $3,450 | 10.8 | 0.85 | % | 1.73 | % | $ | 2.69 | $ | 6.62 | (0.58 | )% | (0.32 | )% | $ | (16.21 | ) | $ | (10.13 | ) | ||||
| $3,500 | 11.0 | 0.84 | % | 1.71 | % | $ | 2.67 | $ | 6.57 | (0.62 | )% | (0.36 | )% | $ | (17.47 | ) | $ | (11.45 | ) | ||||
59
Financial Impact Sensitivity of the Number of Shares Tendered
Numbers in (000s) except per share amounts.
- •
- Assumes a $3,100 Tender Offer Price
| | | | | 2002 | 2003 | 2002 | 2003 | ||||||||||||||||||||||
|---|---|---|---|---|---|---|---|---|---|---|---|---|---|---|---|---|---|---|---|---|---|---|---|---|---|---|---|---|---|
| Percent of Basic Shares Repurch. | Number of Total Shares Tendered | Amount of Repurch. | Net After-tax Financing Cost | Est. GAAP EPS | Change In GAAP EPS | Est. GAAP EPS | Change In GAAP EPS | Book Value Per Share | % Change Book Value | Book Value Per Share | % Change Book Value | ||||||||||||||||||
| 0.0% | 0.000 | $ | 0 | $ | 0 | $ | 318.22 | 0.00 | % | $ | 383.54 | 0.00 | % | $ | 2,817.97 | 0.00 | % | $ | 3,153.08 | 0.00 | % | ||||||||
| 0.6 | 2.000 | 6,200 | 262 | 319.51 | 0.41 | 385.84 | 0.60 | $ | 2,816.78 | (0.04 | ) | 3,154.08 | 0.03 | ||||||||||||||||
| 1.1 | 4.000 | 12,400 | 524 | 320.03 | 0.57 | 387.38 | 1.00 | $ | 2,814.75 | (0.11 | ) | 3,153.45 | 0.01 | ||||||||||||||||
| 1.6 | 6.000 | 18,600 | 786 | 320.56 | 0.74 | 388.94 | 1.41 | $ | 2,812.70 | (0.19 | ) | 3,152.82 | (0.01 | ) | |||||||||||||||
| 2.1 | 8.000 | 24,800 | 1,048 | 321.09 | 0.90 | 390.52 | 1.82 | $ | 2,810.63 | (0.26 | ) | 3,152.18 | (0.03 | ) | |||||||||||||||
| 2.6 | 10.000 | 31,000 | 1,310 | 321.62 | 1.07 | 392.12 | 2.24 | $ | 2,808.53 | (0.34 | ) | 3,151.53 | (0.05 | ) | |||||||||||||||
| 3.1 | 12.000 | 37,200 | 1,572 | 322.15 | 1.24 | 393.74 | 2.66 | $ | 2,806.40 | (0.41 | ) | 3,150.87 | (0.07 | ) | |||||||||||||||
| 3.6 | 14.000 | 43,400 | 1,834 | 322.69 | 1.41 | 395.38 | 3.09 | $ | 2,804.25 | (0.49 | ) | 3,150.20 | (0.09 | ) | |||||||||||||||
- •
- Assumes a $3,500 Tender Offer Price
| | | | | 2002 | 2003 | 2002 | 2003 | ||||||||||||||||||||||
|---|---|---|---|---|---|---|---|---|---|---|---|---|---|---|---|---|---|---|---|---|---|---|---|---|---|---|---|---|---|
| Percent of Basic Shares Repurch. | Number of Total Shares Tendered | Amount of Repurch. | Net After-tax Financing Cost | Est. GAAP EPS | Change In GAAP EPS | Est. GAAP EPS | Change In GAAP EPS | Book Value Per Share | % Change Book Value | Book Value Per Share | % Change Book Value | ||||||||||||||||||
| 0.0% | 0.000 | $ | 0 | $ | 0 | $ | 318.22 | 0.00 | % | $ | 383.54 | 0.00 | % | $ | 2,817.97 | 0.00 | % | $ | 3,153.08 | 0.00 | % | ||||||||
| 0.6 | 2.000 | 7,000 | 296 | 319.46 | 0.39 | 385.74 | 0.57 | $ | 2,814.29 | (0.13 | ) | 3,151.49 | (0.05 | ) | |||||||||||||||
| 1.1 | 4.000 | 14,000 | 592 | 319.93 | 0.54 | 387.18 | 0.95 | $ | 2,809.75 | (0.29 | ) | 3,148.24 | (0.15 | ) | |||||||||||||||
| 1.6 | 6.000 | 21,000 | 887 | 320.41 | 0.69 | 388.64 | 1.33 | $ | 2,805.15 | (0.45 | ) | 3,144.96 | (0.26 | ) | |||||||||||||||
| 2.1 | 8.000 | 28,000 | 1,183 | 320.88 | 0.84 | 390.11 | 1.71 | $ | 2,800.50 | (0.62 | ) | 3,141.63 | (0.36 | ) | |||||||||||||||
| 2.6 | 10.000 | 35,000 | 1,479 | 321.36 | 0.99 | 391.60 | 2.10 | $ | 2,795.78 | (0.79 | ) | 3,138.26 | (0.47 | ) | |||||||||||||||
| 3.1 | 12.000 | 42,000 | 1,775 | 321.84 | 1.14 | 393.11 | 2.50 | $ | 2,791.01 | (0.96 | ) | 3,134.85 | (0.58 | ) | |||||||||||||||
| 3.6 | 14.000 | 49,000 | 2,070 | 322.33 | 1.29 | 394.65 | 2.90 | $ | 2,786.18 | (1.13 | ) | 3,131.39 | (0.69 | ) | |||||||||||||||
Repurchase based on basic shares outstanding.
60
Financial Impact Sensitivity of the Number of Shares Tendered
Numbers in (000s)
- •
- Assumes a $3,100 Tender Offer Price
| | 2002 | 2003 | |||||||||||
|---|---|---|---|---|---|---|---|---|---|---|---|---|---|
| Number of Total Shares Tendered | Equity/Assets | ROAA | ROAE | Equity/Assets | ROAA | ROAE | |||||||
| 0.000% | 8.54 | % | 1.02 | % | 12.02 | % | 8.51 | % | 1.11 | % | 13.00 | % | |
| 2.000 | 8.49 | 1.02 | 12.12 | 8.47 | 1.11 | 13.08 | |||||||
| 4.000 | 8.44 | 1.02 | 12.19 | 8.42 | 1.11 | 13.14 | |||||||
| 6.000 | 8.39 | 1.02 | 12.26 | 8.37 | 1.11 | 13.20 | |||||||
| 8.000 | 8.33 | 1.02 | 12.34 | 8.32 | 1.10 | 13.26 | |||||||
| 10.000 | 8.28 | 1.02 | 12.41 | 8.27 | 1.10 | 13.32 | |||||||
| 12.000 | 8.23 | 1.02 | 12.49 | 8.23 | 1.10 | 13.38 | |||||||
| 14.000 | 8.17 | 1.02 | 12.57 | 8.18 | 1.10 | 13.45 | |||||||
- •
- Assumes a $3,500 Tender Offer Price
| | 2002 | 2003 | |||||||||||
|---|---|---|---|---|---|---|---|---|---|---|---|---|---|
| Number of Total Shares Tendered | Equity/Assets | ROAA | ROAE | Equity/Assets | ROAA | ROAE | |||||||
| 0.000% | 8.54 | % | 1.02 | % | 12.02 | % | 8.51 | % | 1.11 | % | 13.00 | % | |
| 2.000 | 8.49 | 1.02 | 12.13 | 8.46 | 1.11 | 13.09 | |||||||
| 4.000 | 8.43 | 1.02 | 12.21 | 8.41 | 1.11 | 13.15 | |||||||
| 6.000 | 8.37 | 1.02 | 12.29 | 8.35 | 1.11 | 13.22 | |||||||
| 8.000 | 8.31 | 1.02 | 12.38 | 8.30 | 1.10 | 13.29 | |||||||
| 10.000 | 8.25 | 1.02 | 12.46 | 8.24 | 1.10 | 13.36 | |||||||
| 12.000 | 8.19 | 1.02 | 12.55 | 8.19 | 1.10 | 13.43 | |||||||
| 14.000 | 8.13 | 1.01 | 12.64 | 8.13 | 1.10 | 13.51 | |||||||
ROA data assume 12.3% balance sheet growth. ROE data assume $44.00 cash dividend per share.
61
Capital Impact
- •
- Assumes a $3,100 Tender Offer Price
| | | | | | Trup Issued | | | | | | ||||||||||||||||||
|---|---|---|---|---|---|---|---|---|---|---|---|---|---|---|---|---|---|---|---|---|---|---|---|---|---|---|---|---|
| | Number of Total Shares Tendered | | | | | | | | | |||||||||||||||||||
| Basic Shares Repurch. | Amount of Repurch. | Required Trust Pref for Financing | Current Allowable Tier 1 Trust Pref | Tier 1 Allowable Trust Pref | Remaining Trust Pref For Tier 2 | Tier 1 Capital | Total Capital | Tier 1 Leverage Ratio | Tier 1 Capital Ratio | Total Capital Ratio | ||||||||||||||||||
| 0.0% | 0.000 | $ | 0 | $ | 0 | $ | 294,064 | $ | 0 | $ | 0 | 704,486 | 889,778 | 7.08 | % | 8.49 | % | 10.72 | % | |||||||||
| 0.6 | 2.000 | 6,200 | 6,200 | 291,997 | 0 | 0 | 698,286 | 883,578 | 7.02 | 8.41 | 10.64 | |||||||||||||||||
| 1.1 | 4.000 | 12,400 | 12,400 | 289,930 | 0 | 0 | 692,086 | 877,378 | 6.96 | 8.34 | 10.57 | |||||||||||||||||
| 1.6 | 6.000 | 18,600 | 18,600 | 287,864 | 0 | 0 | 685,886 | 871,178 | 6.90 | 8.26 | 10.49 | |||||||||||||||||
| 2.1 | 8.000 | 24,800 | 24,800 | 285,797 | 0 | 0 | 679,686 | 864,978 | 6.84 | 8.19 | 10.42 | |||||||||||||||||
| 2.6 | 10.000 | 31,000 | 31,000 | 283,730 | 0 | 0 | 673,486 | 858,778 | 6.77 | 8.11 | 10.34 | |||||||||||||||||
| 3.1 | 12.000 | 37,200 | 37,200 | 281,664 | 0 | 0 | 667,286 | 852,578 | 6.71 | 8.04 | 10.27 | |||||||||||||||||
| 3.6 | 14.000 | 43,400 | 43,400 | 279,597 | 0 | 0 | 661,086 | 846,378 | 6.65 | 7.96 | 10.19 | |||||||||||||||||
- •
- Assumes a $3,500 Tender Offer Price
| | | | | | Trup Issued | | | | | | ||||||||||||||||||
|---|---|---|---|---|---|---|---|---|---|---|---|---|---|---|---|---|---|---|---|---|---|---|---|---|---|---|---|---|
| | Number of Total Shares Tendered | | | | | | | | | |||||||||||||||||||
| Basic Shares Repurch. | Amount of Repurch. | Required Trust Pref for Financing | Current Allowable Tier 1 Trust Pref | Tier 1 Allowable Trust Pref | Remaining Trust Pref For Tier 2 | Tier 1 Capital | Total Capital | Tier 1 Leverage Ratio | Tier 1 Capital Ratio | Total Capital Ratio | ||||||||||||||||||
| 0.0% | 0.000 | $ | 0 | $ | 0 | $ | 294,064 | $ | 0 | $ | 0 | 704,486 | 889,778 | 7.08 | % | 8.49 | % | 10.72 | % | |||||||||
| 0.6 | 2.000 | 7,000 | 7,000 | 291,730 | 0 | 0 | 697,486 | 882,778 | 7.01 | 8.40 | 10.63 | |||||||||||||||||
| 1.1 | 4.000 | 14,000 | 14,000 | 289,397 | 0 | 0 | 690,486 | 875,778 | 6.94 | 8.32 | 10.55 | |||||||||||||||||
| 1.6 | 6.000 | 21,000 | 21,000 | 287,064 | 0 | 0 | 683,486 | 868,778 | 6.87 | 8.23 | 10.46 | |||||||||||||||||
| 2.1 | 8.000 | 28,000 | 28,000 | 284,730 | 0 | 0 | 676,486 | 861,778 | 6.80 | 8.15 | 10.38 | |||||||||||||||||
| 2.6 | 10.000 | 35,000 | 35,000 | 282,397 | 0 | 0 | 669,486 | 854,778 | 6.73 | 8.06 | 10.30 | |||||||||||||||||
| 3.1 | 12.000 | 42,000 | 42,000 | 280,064 | 0 | 0 | 662,486 | 847,778 | 6.66 | 7.98 | 10.21 | |||||||||||||||||
| 3.6 | 14.000 | 49,000 | 49,000 | 277,730 | 0 | 0 | 655,486 | 840,778 | 6.59 | 7.90 | 10.13 | |||||||||||||||||
Assumes no new tier 1 or 2 capital is issued.
62
| Appendix |
Widely Held Bank Holding Company Peer Group—Financial Performance
| | | | | | | | | | 3 Year CAGR | | | | | | ||||||||||||||||
|---|---|---|---|---|---|---|---|---|---|---|---|---|---|---|---|---|---|---|---|---|---|---|---|---|---|---|---|---|---|---|
| | Institution | Assets ($MMs) | Leverage Ratio (%) | Tier 1 Capital Ratio (%) | Total Capital Ratio (%) | NPAs/ Lns&REO (%) | Reserves/ Loans (%) | NCO's/Avg. Loans (%) | Oper. EPS (%) | Rev. (%) | Oper. ROAA (%) | Oper. ROAE (%) | NIM (%) | Efficiency Ratio (%) | Insider Ownership (%) | |||||||||||||||
| 1 | Associated Banc-Corp, (WI) | 14,328 | 7.28 | 9.43 | 12.73 | 0.71 | 1.48 | 0.31 | 6.92 | 4.66 | 1.52 | 18.15 | 3.92 | 47.96 | 4.0 | |||||||||||||||
| 2 | Colonial BancGroup, Inc., (AL) | 13,184 | 7.45 | 8.59 | 12.18 | 0.66 | 1.26 | 0.25 | 12.68 | 8.63 | 1.08 | 15.63 | 3.70 | 52.73 | 7.9 | |||||||||||||||
| 3 | Commerce Bancorp, Inc., (NJ) | 12,485 | 7.57 | 12.94 | 14.51 | 0.40 | 1.47 | 0.14 | 30.17 | 27.51 | 1.09 | 19.00 | 4.78 | 68.45 | 13.0 | |||||||||||||||
| 4 | Commerce Bancshares, Inc., (MO) | 12,268 | 10.05 | 12.78 | 14.15 | 0.38 | 1.71 | 0.39 | 8.99 | 5.25 | 1.53 | 14.43 | 4.28 | 59.56 | 10.6 | |||||||||||||||
| 5 | City National Corporation, (CA) | 11,217 | 7.41 | 9.17 | 13.66 | 0.65 | 2.01 | 0.37 | 14.15 | 16.27 | 1.68 | 18.42 | 5.27 | 47.85 | 19.9 | |||||||||||||||
| 6 | TCF Financial Corporation, (MN) | 11,171 | 6.92 | 10.42 | 11.44 | 0.86 | 0.93 | 0.43 | 19.47 | 7.22 | 1.82 | 22.40 | 4.83 | 59.64 | 8.3 | |||||||||||||||
| 7 | First Virginia Banks, Inc., (VA) | 10,788 | 9.53 | 13.88 | 14.90 | 0.30 | 1.11 | 0.16 | 7.63 | 1.20 | 1.60 | 14.47 | 4.93 | 53.66 | 2.4 | |||||||||||||||
| 8 | FirstMerit Corporation, (OH) | 10,233 | 7.97 | 9.33 | 12.31 | 0.99 | 1.67 | 1.04 | 15.04 | 5.09 | 1.60 | 17.87 | 4.42 | 46.21 | 4.8 | |||||||||||||||
| 9 | Mercantile Bankshares Corp., (MD) | 9,988 | 11.61 | 15.80 | 17.13 | 0.74 | 2.07 | 0.06 | 7.01 | 6.53 | 1.89 | 15.04 | 4.66 | 45.80 | 1.0 | |||||||||||||||
| 10 | BancorpSouth, Inc., (MS) | 9,817 | 9.13 | 10.05 | 11.04 | 0.42 | 1.37 | 0.39 | 0.31 | 5.66 | 1.23 | 14.58 | 4.32 | 59.20 | 7.5 | |||||||||||||||
| 11 | Sky Financial Group Inc., (OH) | 9,461 | 7.60 | 9.20 | 11.10 | 0.62 | 1.60 | 0.46 | 13.42 | 3.10 | 1.34 | 18.52 | 3.90 | 50.00 | 5.2 | |||||||||||||||
| 12 | Valley National Bancorp, (NJ) | 8,581 | 9.84 | 13.42 | 14.47 | 0.30 | 1.21 | 0.25 | 5.77 | 11.60 | 1.86 | 23.46 | 4.49 | 44.66 | 9.4 | |||||||||||||||
| 13 | Greater Bay Bancorp, (CA) | 8,330 | 7.67 | 10.31 | 11.99 | 0.74 | 2.79 | 1.39 | 26.91 | 33.00 | 1.37 | 20.01 | 4.91 | 47.36 | 10.1 | |||||||||||||||
| 14 | Cullen/Frost Bankers, Inc., (TX) | 8,072 | 7.90 | 10.54 | 14.43 | 0.89 | 1.70 | 0.21 | 3.57 | 8.08 | 1.37 | 18.11 | 4.63 | 60.78 | 7.8 | |||||||||||||||
| 15 | Fulton Financial Corporation, (PA) | 7,825 | 9.91 | 12.84 | 14.07 | 0.44 | 1.34 | 0.19 | 7.97 | 10.79 | 1.63 | 15.32 | 4.40 | 51.67 | 4.4 | |||||||||||||||
| 16 | Citizens Banking Corporation, (MI) | 7,482 | 8.08 | 10.21 | 11.46 | 1.37 | 1.43 | 0.36 | 2.31 | 3.62 | 1.27 | 13.76 | 4.42 | 58.52 | 4.9 | |||||||||||||||
| 17 | Whitney Holding Corporation, (LA) | 7,069 | 8.68 | 12.45 | 13.70 | 1.06 | 1.65 | 0.27 | NA | 8.41 | 1.22 | 12.09 | 4.41 | 58.87 | 7.4 | |||||||||||||||
| 18 | Hudson United Bancorp, (NJ) | 6,825 | 5.94 | 8.16 | 10.82 | 0.42 | 1.63 | 2.57 | 12.79 | (0.51 | ) | 0.35 | 6.19 | 4.67 | 52.44 | 5.4 | ||||||||||||||
| 19 | Trustmark Corporation, (MS) | 6,771 | 8.84 | 13.68 | 14.93 | 1.06 | 1.73 | 0.42 | 12.76 | 7.37 | 1.83 | 18.69 | 4.88 | 47.54 | 18.2 | |||||||||||||||
| 20 | F.N.B. Corporation, (FL) | 6,732 | 8.30 | 10.60 | 11.80 | 0.67 | 1.35 | 0.36 | 8.88 | 12.78 | 1.13 | 12.93 | 4.61 | 60.72 | 3.6 | |||||||||||||||
| 21 | South Financial Group, Inc. (The), (SC) | 6,058 | 6.56 | 8.87 | 10.90 | 1.34 | 1.20 | 0.60 | 1.09 | 8.34 | 0.92 | 12.10 | 3.84 | 56.58 | 4.6 | |||||||||||||||
| 22 | First Midwest Bancorp, Inc., (IL) | 5,843 | 7.45 | 9.94 | 11.05 | 0.58 | 1.42 | 0.60 | 12.10 | 4.12 | 1.53 | 19.13 | 4.32 | 47.75 | 5.5 | |||||||||||||||
| 23 | Community First Bankshares, Inc., (ND) | 5,658 | 6.63 | 8.92 | 12.85 | 0.65 | 1.52 | 0.31 | 11.87 | 1.35 | 1.36 | 21.72 | 5.29 | 59.13 | 9.0 | |||||||||||||||
| 24 | United Bankshares, Inc., (WV) | 5,558 | 7.74 | 10.31 | 11.71 | 0.63 | 1.37 | 0.20 | 12.82 | 5.80 | 1.61 | 17.11 | 4.12 | 44.88 | 15.4 | |||||||||||||||
| 25 | Susquehanna Bancshares, Inc., (PA) | 5,166 | 8.60 | 10.70 | 12.20 | 0.56 | 1.06 | 0.16 | 3.57 | 10.56 | 1.15 | 11.87 | 3.89 | 64.18 | 6.9 | |||||||||||||||
| Maximum: | 14,328 | 11.61 | 15.80 | 17.13 | 1.37 | 2.79 | 2.57 | 30.17 | 33.00 | 1.89 | 23.46 | 5.29 | 68.45 | 19.9 | ||||||||||||||||
| Minimum: | 5,166 | 5.94 | 8.16 | 10.82 | 0.30 | 0.93 | 0.06 | 0.31 | (0.51 | ) | 0.35 | 6.19 | 3.70 | 44.66 | 1.0 | |||||||||||||||
| Peer Median: | 8,330 | 7.90 | 10.31 | 12.31 | 0.65 | 1.47 | 0.36 | 10.43 | 7.22 | 1.37 | 17.11 | 4.42 | 52.73 | 7.4 | ||||||||||||||||
| First National of Nebraska, (NE) | 9,977 | 7.08 | 8.49 | 10.72 | 0.43 | 1.74 | 2.06 | (3.06 | ) | 5.89 | 1.12 | 13.33 | 5.68 | 66.37 | 41.7 | |||||||||||||||
Source: SNL Financial. Data as of 3/31/02.
63
Synthetic Consumer Peer Group—Financial Performance
| | Institution | Assets ($MMs) | Equity/ Assets (%) | Tangible Equity/ Assets (%) | NPAs/ Lns&REO (%) | Reserves/ Loans (%) | NCOs/ Avg Loans (%) | EPS CAGR '98 - '01 (%) | Rev. CAGR '98 - '01 (%) | ROAA (%) | ROAE (%) | NIM (%) | ||||||||||||
|---|---|---|---|---|---|---|---|---|---|---|---|---|---|---|---|---|---|---|---|---|---|---|---|---|
| 1 | Citigroup, Inc., (NY) | 1,057,657 | 7.91 | 5.20 | 2.76 | 2.79 | 2.25 | 28.04 | 13.48 | 1.84 | 23.29 | 4.50 | ||||||||||||
| 2 | Washington Mutual, Inc., (WA) | 275,223 | 6.59 | 4.32 | 1.98 | 1.11 | 0.26 | 22.59 | 14.01 | 1.34 | 20.71 | 3.76 | ||||||||||||
| 3 | Bank One Corporation, (IL) | 262,947 | 7.95 | 7.22 | 2.66 | 3.06 | 1.76 | (4.41 | ) | (2.20 | ) | 1.20 | 15.09 | 3.86 | ||||||||||
| 4 | American Express Company, (NY) | 146,783 | 8.51 | 7.68 | NA | 3.90 | NA | (13.99 | ) | 137.76 | 1.66 | 20.15 | 3.26 | |||||||||||
| 5 | KeyCorp, (OH) | 81,359 | 7.87 | 6.57 | 1.58 | 2.51 | 1.35 | (45.05 | ) | 2.76 | 1.19 | 15.31 | 3.90 | |||||||||||
| 6 | MBNA Corporation, (DE) | 46,510 | 16.74 | 11.98 | 2.21 | 6.22 | 7.71 | 25.56 | 29.29 | 3.26 | 19.16 | 5.73 | ||||||||||||
| 7 | Countrywide Credit Industries, Inc., (CA) | 42,614 | 9.86 | 9.86 | NA | NA | NA | 7.98 | 25.29 | 1.68 | 16.17 | NA | ||||||||||||
| 8 | Charter One Financial, Inc., (OH) | 37,704 | 7.58 | 6.72 | 1.12 | 1.05 | 0.40 | 20.60 | 6.17 | 1.49 | 19.35 | 3.26 | ||||||||||||
| 9 | Sovereign Bancorp, Inc., (PA) | 36,833 | 6.52 | 2.75 | 1.08 | 1.33 | 0.71 | (17.34 | ) | 36.26 | 0.76 | 11.76 | 3.53 | |||||||||||
| 10 | Capital One Financial Corporation, (VA) | 31,265 | 11.77 | NA | 0.00 | 4.05 | 3.50 | 30.15 | 40.88 | 2.51 | 21.05 | 8.56 | ||||||||||||
| 11 | Huntington Bancshares Incorporated, (OH) | 24,746 | 9.84 | 9.06 | 1.17 | 2.00 | 1.09 | (15.34 | ) | 1.96 | 1.47 | 16.50 | 4.11 | |||||||||||
| 12 | Providian Financial Corporation, (CA) | 18,729 | 10.09 | NA | NA | 17.02 | NA | (21.68 | ) | 36.83 | 0.21 | 2.04 | 7.92 | |||||||||||
| 13 | TCF Financial Corporation, (MN) | 11,171 | 8.25 | 6.97 | 0.86 | 0.93 | 0.43 | 15.33 | 7.22 | 2.01 | 24.68 | 4.83 | ||||||||||||
| 14 | New York Community Bancorp, Inc., (NY) | 9,270 | 10.75 | 3.67 | 0.21 | 0.73 | 0.00 | 31.45 | 55.88 | 2.00 | 18.88 | 4.09 | ||||||||||||
| 15 | Independence Community Bank Corp., (NY) | 7,910 | 11.10 | 8.88 | 0.51 | 1.38 | (0.02 | ) | NA | 28.23 | 1.50 | 13.07 | 4.22 | |||||||||||
| Maximum: | 1,057,657 | 16.74 | 11.98 | 2.76 | 17.02 | 7.71 | 31.45 | 137.76 | 3.26 | 24.68 | 8.56 | |||||||||||||
| Minimum: | 7,910 | 6.52 | 2.75 | 0.00 | 0.73 | (0.02 | ) | (45.05 | ) | (2.20 | ) | 0.21 | 2.04 | 3.26 | ||||||||||
| Mean: | 139,381 | 9.42 | 6.99 | 1.35 | 3.43 | 1.62 | 4.56 | 28.92 | 1.61 | 17.15 | 4.68 | |||||||||||||
| Median: | 37,704 | 8.51 | 6.97 | 1.15 | 2.26 | 0.90 | 11.65 | 25.29 | 1.50 | 18.88 | 4.10 | |||||||||||||
| First National of Nebraska, Inc., (NE) | 9,977 | 8.41 | 6.75 | 0.43 | 1.74 | 2.06 | (3.06 | ) | 5.89 | 1.12 | 13.33 | 5.68 | ||||||||||||
Source: SNL Financial. Data as of 3/31/02.
64
Closely-held Peer Group—Financial Performance
| | | | | | | | | | 3 Year CAGR | | | | | | ||||||||||||||||
|---|---|---|---|---|---|---|---|---|---|---|---|---|---|---|---|---|---|---|---|---|---|---|---|---|---|---|---|---|---|---|
| | Institution | Assets ($MMs) | Leverage Ratio (%) | Tier 1 Capital Ratio (%) | Total Capital Ratio (%) | NPAs/ Lns&REO (%) | Reserves/ Loans (%) | NCO's/Avg. Loans (%) | Oper. EPS (%) | Rev. (%) | Oper. ROAA (%) | Oper. ROAE (%) | NIM (%) | Efficiency Ratio (%) | Insider Ownership (%) | |||||||||||||||
| 1 | First Citizens BancShares, Inc., (NC) | 11,746 | 8.99 | 13.20 | 14.53 | 0.42 | 1.50 | 0.24 | 6.18 | 7.09 | 0.79 | 10.28 | 3.76 | 72.33 | 44.6 | |||||||||||||||
| 2 | BOK Financial Corporation, (OK) | 10,857 | 6.63 | 8.49 | 11.99 | 0.80 | 1.72 | 0.32 | 9.70 | 16.25 | 1.40 | 17.68 | 3.72 | 53.15 | 73.2 | |||||||||||||||
| 3 | UMB Financial Corporation, (MO) | 8,286 | 8.37 | 16.12 | 16.95 | 0.72 | 1.36 | 0.28 | 4.34 | 5.82 | 0.86 | 9.23 | 3.07 | 75.97 | 25.4 | |||||||||||||||
| 4 | International Bancshares Corporation, (TX) | 6,141 | 6.16 | 13.91 | 15.16 | 0.51 | (1) | 1.56 | 0.13 | 19.55 | 14.08 | 1.67 | 21.13 | 3.94 | 45.32 | 29.5 | ||||||||||||||
| 5 | Riggs National Corporation, (DC) | 5,860 | 8.13 | 15.24 | 23.60 | 0.14 | 0.96 | 0.13 | NM | 0.96 | 0.38 | 6.27 | 3.58 | 77.58 | 51.4 | |||||||||||||||
| 6 | Trust Company of New Jersey (The), (NJ) | 4,050 | 5.62 | 10.08 | 10.52 | 1.04 | 0.53 | 0.07 | 2.74 | 8.88 | 0.65 | 11.92 | 3.15 | 69.26 | 32.1 | |||||||||||||||
| 7 | First Citizens Bancorporation of SC, (SC) | 3,682 | 7.45 | 11.78 | 13.03 | 0.26 | (1) | 1.78 | 0.25 | 7.85 | 13.35 | 1.23 | 16.18 | 4.33 | 62.09 | 46.4 | ||||||||||||||
| 8 | Irwin Financial Corporation, (IN) | 3,543 | 11.61 | 9.39 | 12.76 | 1.01 | 1.33 | 0.40 | 18.69 | 14.69 | 1.08 | 13.74 | 5.84 | 74.12 | 44.2 | |||||||||||||||
| 9 | MB Financial, Inc., (IL) | 3,429 | 8.25 | 11.08 | 12.94 | 0.82 | 1.17 | 0.58 | 38.14 | 61.37 | 1.20 | 13.83 | 4.02 | 51.02 | 35.7 | |||||||||||||||
| 10 | BancFirst Corporation, (OK) | 2,749 | 8.06 | 11.02 | 12.25 | 1.01 | 1.38 | 0.33 | 10.21 | 6.65 | 1.16 | 14.06 | 4.37 | 63.12 | 52.1 | |||||||||||||||
| 11 | Corus Bankshares, Inc., (IL) | 2,654 | 15.94 | 18.02 | 20.68 | 0.14 | 2.53 | 0.06 | 9.29 | 1.04 | 1.41 | 8.26 | 3.62 | 45.71 | 36.6 | |||||||||||||||
| 12 | Intrust Financial Corporation, (KS) | 2,521 | 9.10 | 11.10 | 12.40 | 0.96 | (1) | 1.56 | 0.23 | 13.44 | 7.89 | 1.02 | 13.60 | 3.90 | 62.86 | 34.5 | ||||||||||||||
| 13 | Republic Bancshares, Inc., (FL) | 2,513 | 7.34 | 11.81 | 15.00 | 3.79 | 2.10 | 0.79 | (8.59 | ) | (13.86 | ) | 0.17 | 2.49 | 3.26 | 81.05 | 37.4 | |||||||||||||
| 14 | GBC Bancorp, (CA) | 2,512 | 7.82 | 10.65 | 14.13 | 4.88 | 3.05 | 2.15 | 0.51 | 8.40 | (0.48 | ) | (5.51 | ) | 4.03 | 38.30 | 32.9 | |||||||||||||
| 15 | Capitol Bancorp Ltd., (MI) | 2,174 | 9.59 | 10.54 | 11.85 | 1.08 | 1.38 | 0.13 | 23.31 | 35.08 | 0.58 | 14.91 | 4.65 | 73.35 | 27.9 | |||||||||||||||
| 16 | U.S.B. Holding Co., Inc., (NY) | 2,045 | 8.34 | 12.89 | 13.90 | 1.67 | 1.06 | 0.20 | 12.01 | 12.71 | 1.03 | 15.52 | 3.63 | 47.55 | 35.0 | |||||||||||||||
| 17 | First Indiana Corporation, (IN) | 2,045 | 9.79 | 10.55 | 11.81 | 2.46 | 2.21 | 0.36 | 6.95 | 10.88 | 1.26 | 12.07 | 3.60 | 57.57 | 25.1 | |||||||||||||||
| 18 | Mississippi Valley Bancshares, Inc., (MO) | 2,042 | 8.75 | 10.75 | 12.00 | 0.58 | 1.77 | 0.08 | (0.37 | ) | 10.91 | 1.37 | 17.29 | 3.75 | 42.06 | 37.8 | ||||||||||||||
| Maximum: | 11,746 | 15.94 | 18.02 | 23.60 | 4.88 | 3.05 | 2.15 | 38.14 | 61.37 | 1.67 | 21.13 | 5.84 | 81.05 | 73.2 | ||||||||||||||||
| Minimum: | 2,042 | 5.62 | 8.49 | 10.52 | 0.14 | 0.53 | 0.06 | (8.59 | ) | (13.86 | ) | (0.48 | ) | (5.51 | ) | 3.07 | 38.30 | 25.1 | ||||||||||||
| Mean: | 4,381 | 8.66 | 12.03 | 14.19 | 1.24 | 1.61 | 0.37 | 10.23 | 12.34 | 0.93 | 11.83 | 3.90 | 60.69 | 39.0 | ||||||||||||||||
| Median: | 3,089 | 8.30 | 11.09 | 12.99 | 0.89 | 1.53 | 0.25 | 9.29 | 9.88 | 1.06 | 13.67 | 3.76 | 62.48 | 36.1 | ||||||||||||||||
| First National of Nebraska, (NE) | 9,977 | 7.08 | 8.49 | 10.72 | 0.43 | 1.74 | 2.06 | (3.06 | ) | 5.89 | 1.12 | 13.33 | 5.68 | 66.37 | 41.7 | |||||||||||||||
Source: SNL Financial. Data as of 3/31/02.
1-Data as of 12/31/01.
65