Allegheny Energy
Edison Electric Institute
Financial Conference
November 5-8, 2006

Forward-Looking Statements
In addition to historical information, this presentation contains a number of "forward-looking
statements" as defined in the Private Securities Litigation Reform Act of 1995. Words such as
anticipate, expect, project, intend, plan, believe and words and terms of similar substance used in
connection with any discussion of future plans, actions or events identify forward-looking statements.
These include statements with respect to: regulation and the status of retail generation service supply
competition in states served by Allegheny Energy's delivery business, Allegheny Power; the closing of
various agreements; financing plans; demand for energy and the cost and availability of raw materials,
including coal; provider-of-last resort and power supply contracts; results of litigation; results of
operations; internal controls and procedures; capital expenditures; status and condition of plants and
equipment; regulatory matters; and accounting issues. Forward-looking statements involve estimates,
expectations, and projections and, as a result, are subject to risks and uncertainties. There can be no
assurance that actual results will not materially differ from expectations. Actual results have varied
materially and unpredictably from past expectations. Factors that could cause actual results to differ
materially include, among others, the following: changes in the price of power and fuel for electric
generation; general economic and business conditions; changes in access to capital; complications or
other factors that render it difficult or impossible to obtain necessary lender consents or regulatory
authorizations on a timely basis; environmental regulations; the results of regulatory proceedings,
including proceedings related to rates; changes in industry capacity, development, and other activities
by Allegheny's competitors; changes in the weather and other natural phenomena; changes in the
underlying inputs and assumptions, including market conditions used to estimate the fair values of
commodity contracts; changes in laws and regulations applicable to Allegheny, its markets or its
activities; the loss of any significant customers and suppliers; dependence on other electric
transmission and gas transportation systems and their constraints on availability; changes in PJM,
including changes to participants rules and tariffs; the effect of accounting policies issued periodically
by accounting standard-setting bodies; and the continuing effects of global instability, terrorism and
war. Additional risks and uncertainties are identified and discussed in Allegheny Energy's reports and
registration statements filed with the Securities and Exchange Commission. These forward-looking
statements speak only as of the date of this document. Allegheny Energy undertakes no obligation to
update its forward-looking statements to reflect events or circumstances after
the date of this document.
2

Non-GAAP Financial Measures
This presentation includes non-GAAP financial measures as defined in the
Securities and Exchange Commission’s Regulation G. Where noted, the
presentation shows certain financial information on an “as adjusted” basis, to
exclude the effect of certain items as described herein. By presenting “as adjusted”
results, management intends to provide investors with a better understanding of
the core results and underlying trends from which to consider past performance
and prospects for the future.
Users of this financial information should consider the types of events and
transactions for which adjustments have been made. “As adjusted” information
should not be considered in isolation or viewed as a substitute for, or superior to,
net income or other data prepared in accordance with GAAP as measures of our
operating performance or liquidity. In addition, the “as adjusted” information is not
necessarily comparable to similarly titled measures provided by other companies.
Pursuant to the requirements of Regulation G, we have attached a table that
reconciles the non-GAAP financial measures in this presentation to the most
directly comparable GAAP measures. The table is also available at
www.alleghenyenergy.com.
3

Allegheny Energy
Allegheny
Energy
Generation
Coal-fired, PJM
48.1 million MWH*
Delivery
1.6 million customers,
PA-MD-WV-VA
* 12 months ended December 31, 2005
4
Earnings Growth Drivers
Increase generation rates
Improve plant availability
Control O&M expense
Complete West Virginia rate case
Expand transmission system
Other growth catalysts
5

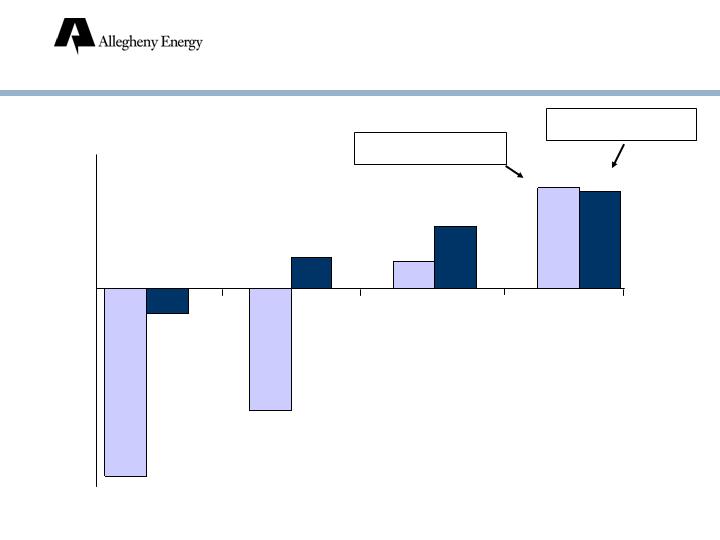
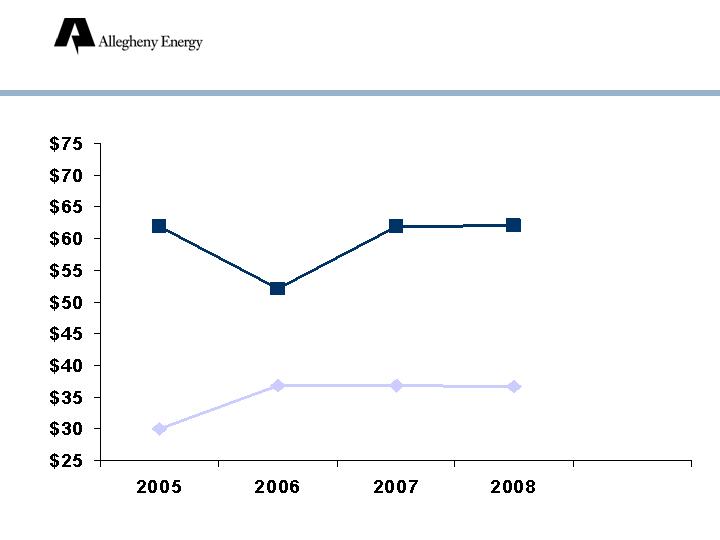
Pennsylvania POLR Rate
$ per MWH
Cumulative Increase in
Pre-Tax Operating Income
$ millions; estimates
Growth Driver:
Increase Generation Rates
6

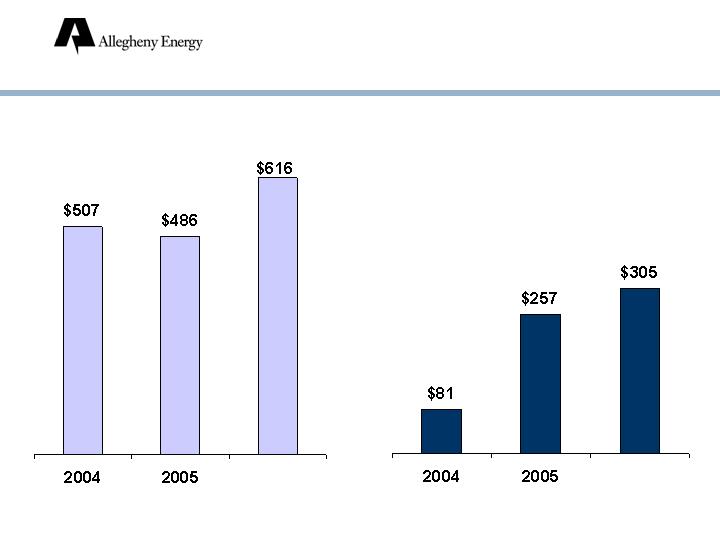
Growth Driver:
Increase Generation Rates
July January
2007 2009
State Virginia Maryland
MWH transitioning 1.0 - 3.2 million* 3.5 million
to market-based rates
Increase in pre-tax income $20-60 million* $60 million
* annualized
7
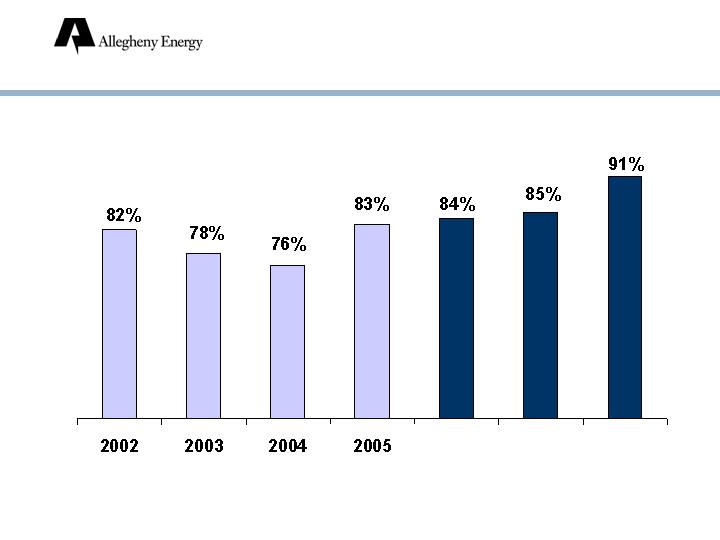
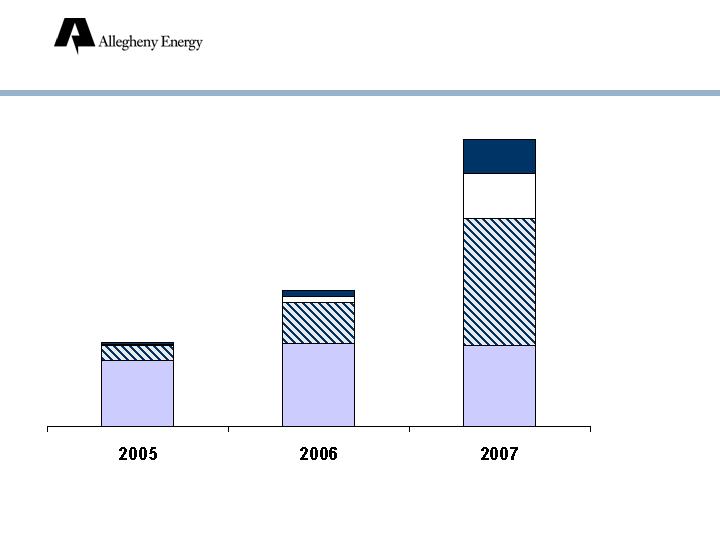
2008
Goal
Supercritical Coal Units
Each 1% improvement provides benefit >$10 million
2006
Est.
Growth Driver:
Improve Plant Availability
2007
Goal
8
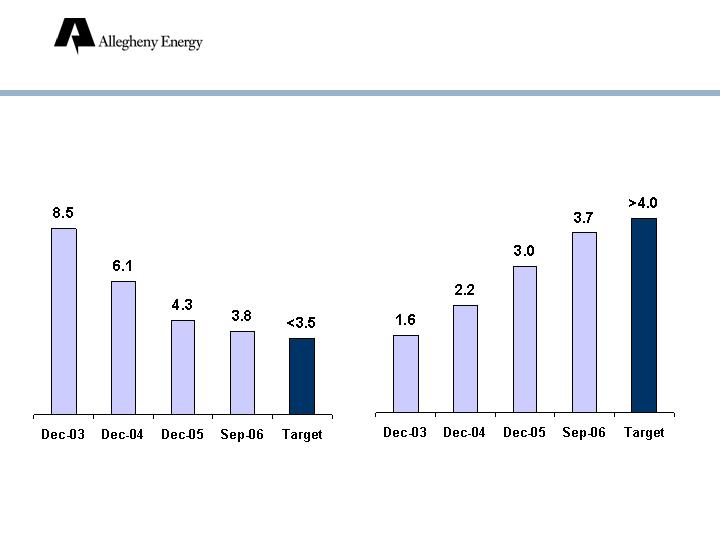
Achieve 91% Availability
Outage Factor
(supercritical units)
22%
24%
17%
16%
15%
9%
Reduce planned
outages
Reduce unplanned
outages
18%
9
2005
Ft. Martin 2
COMPLETED
PLANNED
Harrison 1
Harrison 3
Hatfield 1
Hatfield 3
Pleasants 2
Ft. Martin 1
Hatfield 2
Harrison 2
Pleasants 1
2006
2007
Improving Availability:
Conducting Extended Planned Outages
10

Unplanned Outage Factor
Units Which Completed Extended Outages
Planned Outages: Results
Pre-outage Post-outage
* Including transformer failure: Harrison 1 = 10%, average = 6%. Post-outage average is time weighted.
11
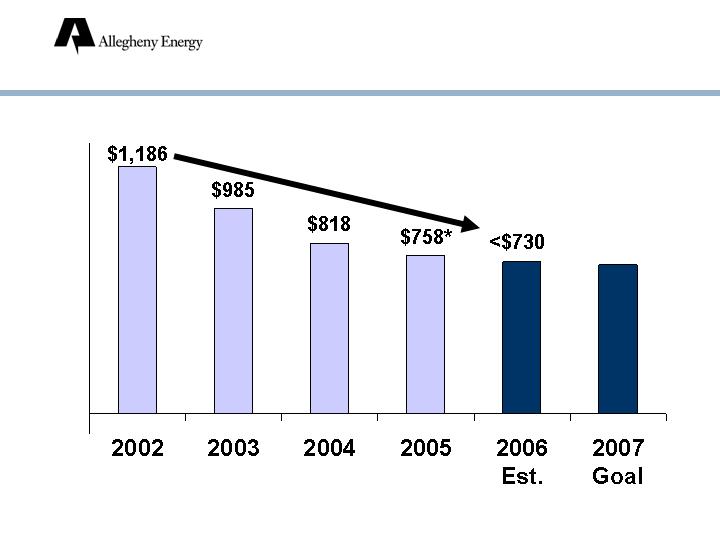
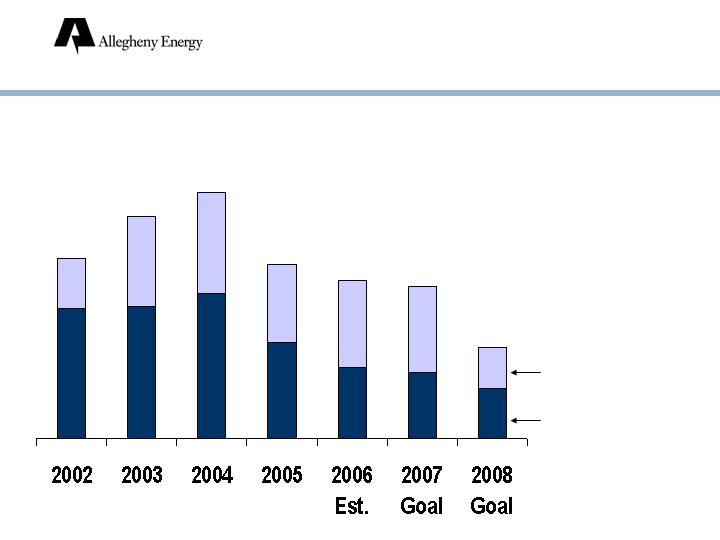
$700-730
Growth Driver:
Control O&M Expense
* 2005 = $775 after adjustment
($ millions)
12
Requested $100 million net increase
Fuel, purchased power: $126 million increase
Base rates: $26 million decrease
10% net increase (residential)
Requested reinstatement of fuel cost adjustment
Proposed ROE: 11.75%
Probable effective date: late May 2007
Growth Driver:
West Virginia Rate Case
13
Growth Driver:
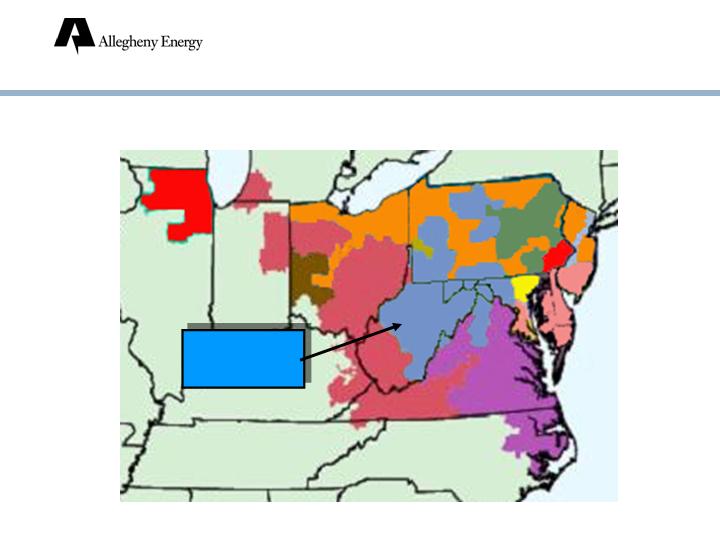
Expand Transmission System
Allegheny
Energy
Located In the Heart of PJM
14
Growth Driver:
Expand Transmission System
2007: enhance near-term reliability
Cost: $70 million
By 2011: construct ~210-mile line
Cost: over $850 million (preliminary estimate)
FERC approved incentive rate treatment,
including return during construction
Separate legal entity to own, construct
85% of costs recovered from other PJM
utilities
15

Approved Transmission Line
16

Potential for Additional
Transmission Investment
Most projects under
consideration pass
through Allegheny’s
service area
PJM to select best
solutions in early
2007
Under Consideration by PJM
for 2012-2021 Plan
17

Other Growth Catalysts
Projected PJM
Reserve Margin
Increasing marginal heat rate
Gas will more frequently impact PJM energy prices
Improving capacity values
16% PJM Target
18
Provides advance price signal for capacity needs
3-year forward auction market
Potentially significant benefits to Allegheny as POLR
contracts expire
FERC decision requested by late December 2006
Other Growth Catalysts
Proposed PJM Regional Pricing Model
19
Improve
Environmental Performance
By 2010:
One of the cleanest coal fleets in the U.S.
2009
$500 – 550
Ft. Martin Scrubbers
2009
~$650
Hatfield Scrubbers
2008
$110
Pleasants Bypass
IN
SERVICE
ESTIMATED
COST
($ Millions)
20
Improve
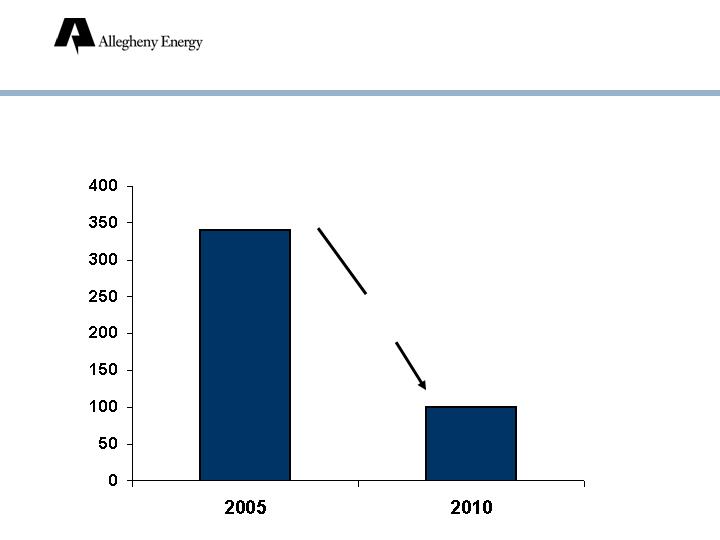
Environmental Performance
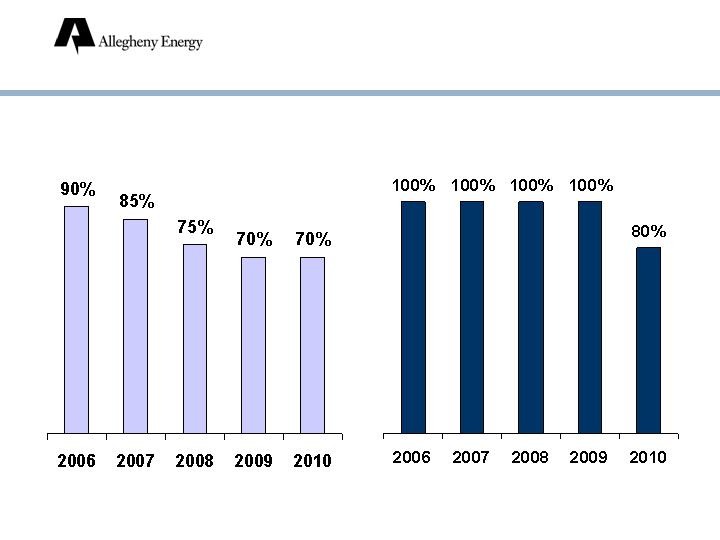
SO2 Emissions
(thousands of tons)
70%
reduction
21
Improving financial results
Reduced debt
Improving credit statistics
Contracting generation and coal
2007 earnings growth drivers
Financial Review
22
Improving Financial Results
Earnings per Share
2003
2005
2004
2006
9 mos.
($2.80)
($0.37)
($1.83)
$0.47
$0.40
$0.94
$1.51
$1.46
As Reported
As Adjusted
23
Cash Flow
($ millions)
Cash from Operations
as reported
Free Cash Flow
(adjusted cash from operations
net of capital expenditures)
2006
9 mos.
2006
9 mos.
24

Debt Outstanding
($ billions)
* $3.6 billion after $300 million maturity on October 1, 2006
25
Capital Expenditures
($ millions)
$307
~$1,000
~$500
Environmental –
other
Environmental –
securitized
All other
Transmission
26
Debt/EBITDA*
EBITDA/Interest*
* Based on adjusted EBITDA and adjusted interest for 12-month periods. Excludes
securitized debt and interest.
Credit Statistics:
Targets Remain Unchanged
27
Contracting Generation
and Coal
Generation Under Contract
% of Total Projected Output
Coal Under Contract
% of Fixed-Price Commitments*
* Excludes West Virginia
28

2007 Earnings Growth:
Key Drivers
*2007 vs. 2006 as adjusted
positive/negative
Other factors
10
Interest expense
(30)
Higher SO2 allowance costs
(45)
Higher coal prices
--
O&M expense
10
Plant availability
positive/negative
Market prices
10
Maryland customer credit
20
Virginia rates
60
West Virginia rate case
$50
Pennsylvania generation rates
CONTRIBUTION TO PRE-TAX INCOME*
($ millions; estimates)
29

Supplemental Information
30

Earnings (Loss) Per Share
0.56
0.65
Q3
0.22
0.18
Q2
$0.68
$0.67
2006: Q1
0.94
0.40
Year
0.02
0.02
Q4
0.45
0.21
Q3
0.08
(0.12)
Q2
$0.39
$0.29
2005: Q1
0.47
(1.83)
Year
0.22
0.48
Q4
0.37
(2.40)
Q3
(0.21)
(0.31)
Q2
$(0.03)
$0.25
2004: Q1
(0.37)
(2.80)
Year
(0.14)
(0.11)
Q4
0.11
(0.40)
Q3
$(0.23)
(1.82)
Q2
$(0.32)
$(0.46)
2003: Q1
As Adjusted
As Reported
31

EBITDA
286.3
286.3
Q3
193.6
193.6
Q2
$322.1
$322.1
2006: Q1
890.2
888.6
Year
162.1
162.1
Q4
274.2
254.7
Q3
192.7
210.6
Q2
$261.3
$261.3
2005: Q1
762.5
914.0
Year
221.8
312.7
Q4
243.2
243.2
Q3
122.0
110.3
Q2
$175.5
$247.8
2004: Q1
634.9
156.8
Year
185.6
197.4
Q4
225.3
117.3
Q3
150.1
(203.5)
Q2
$92.9
$77.6
2003: Q1
As Adjusted
As Reported
$ millions
Reported
32
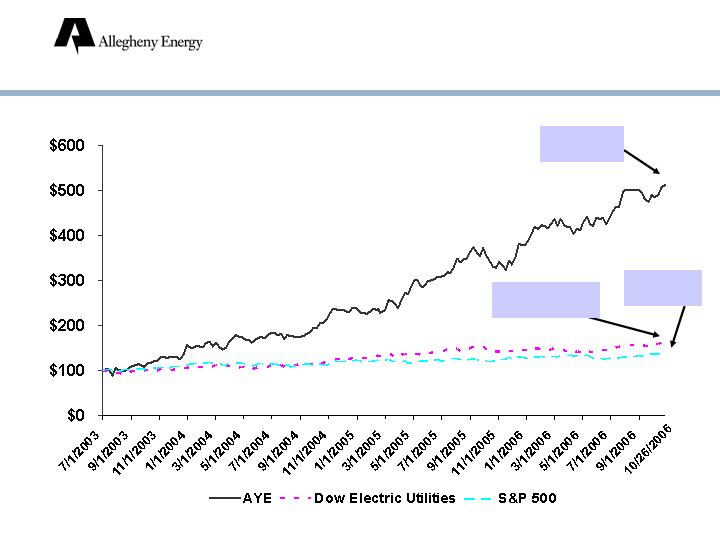
Stock Price Performance
$100 Invested on July 1, 2003
AYE: $512
Dow Electrics:
$164
S&P: $141
The Road to Growth
33

Enhance Operating Performance
Financial
Performance
Engaged
Employees
Environmental
Stewardship
Shareholder
Value
Operational
Excellence
VISION:
“To Be a Top Performing Utility by
Year-End 2007”
Customer
Satisfaction
34
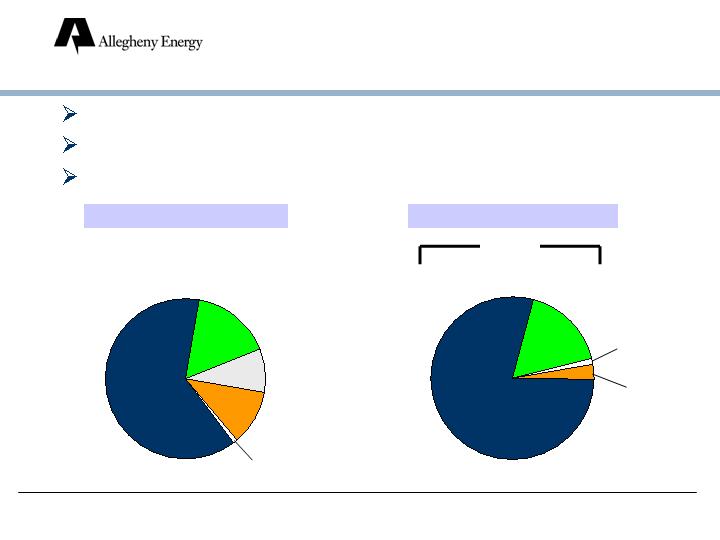
Generation and Marketing:
Overview
Capacity*
* Excludes Gleason peaking unit (held for sale). Output for year ended December 31, 2005.
Capacity: over 9,600 MW*
Primarily base load coal-fired plants
Located in PJM (13 states)
MWH Output*
Hydro
11%
Gas
9%
Supercritical
Coal
63%
Other Coal
16%
Oil
1%
Supercritical
Coal
79%
Gas
1%
Hydro
3%
Other Coal
17%
Coal
96%
35

Low-Cost Generation Fleet
Allegheny has an advantaged dispatch in PJM
PJM Dispatch Cost (Ozone Season): $/MWh
Allegheny Supercritical Coal Units
Dispatch Cost
Allegheny – Other Units
Assumptions: natural gas delivered at approximately $8.00/mmBTU; coal at approximately $2.75/mmBTU; SO 2
at $670/ton; NOx at $1,750/ton.
36
World’s largest competitive power market
Over 51 million people
700 million MWH of energy annually
163,500 MW of capacity
Nation’s most liquid spot power market
Model for FERC’s proposed Standard Market
Design
Provides transactional flexibility: contracts not
required
Generation and Marketing:
PJM -- An Attractive Market
37
Growth Driver:
Transition to Market-Based Rates
Market: Current*
POLR: Maryland
Generation Rates
$ per MWH
* As of October 9, 2006
38

Improving Performance,
Reducing Spending
O&M and Capital*
Unplanned outage
factor
High
Performance
Under-investment
Re-investment
Reduce
spending
* Special maintenance O&M and capital for supercritical coal units. Excludes environmental spending.
Goal
39

Exposure to
SO2 Allowance Market
SO2 Emissions
in Excess of Allowances
(tons; estimated as of October 2006)
* Approximately 75% of 2007 and 2008 short position is at Monongahela
Power
2006 -0-
2007 40,000*
2008 40,000 - 80,000*
40
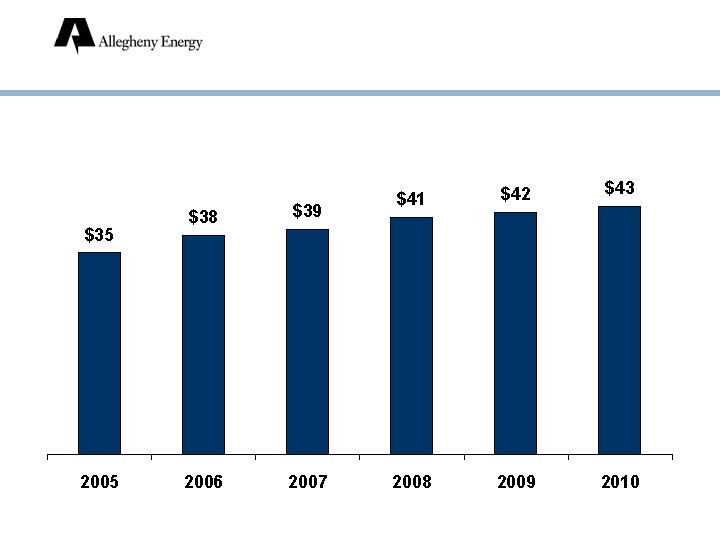
Coal:
Average Delivered Cost/Ton
Existing Contracts Only
41
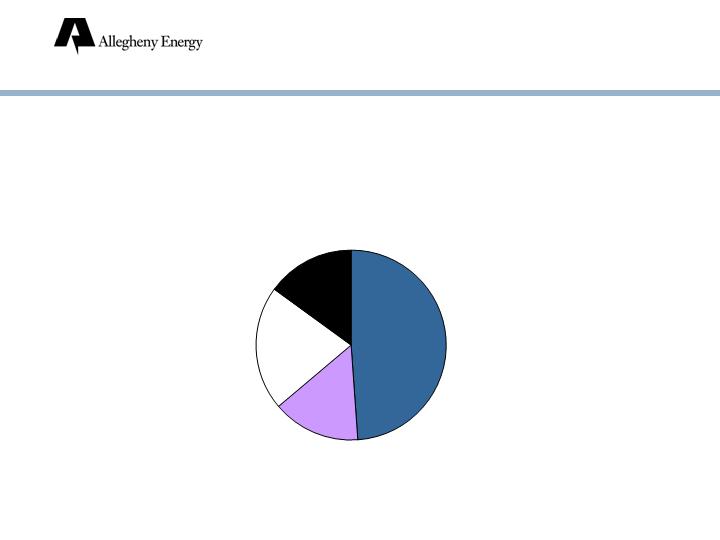
Only 15% of Coal
Delivered by Rail
Note: Some barge coal originates on short line railroads.
Rail
15%
Barge
49%
Conveyor
15%
Truck
21%
Coal Delivery Methods
2006
42
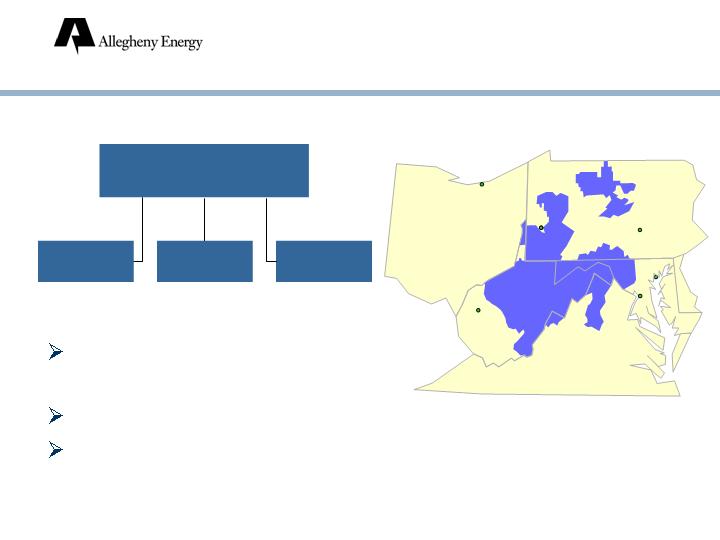
Delivery and Services:
Overview
In 4 states (PA, WV, MD,
VA)
1.6 million electric customers
Load growth: 2.0% compounded
annually (1995-2005; retail)
Allegheny Power
West Penn
Power
Monongahela
Power
Potomac
Edison
VIRGINIA
CHARLESTON
OHIO
HARRISBURG
MARYLAND
KENTUCKY
PENNSYLVANIA
CLEVELAND
BALTIMORE
PITTSBURGH
WASHINGTON, DC
WEST
VIRGINIA
43

Delivery and Services:
Retail Revenue Mix, 2005
By State
By Customer Class
Residential
43%
Industrial
31%
Commercial
25%
Other
1%
44
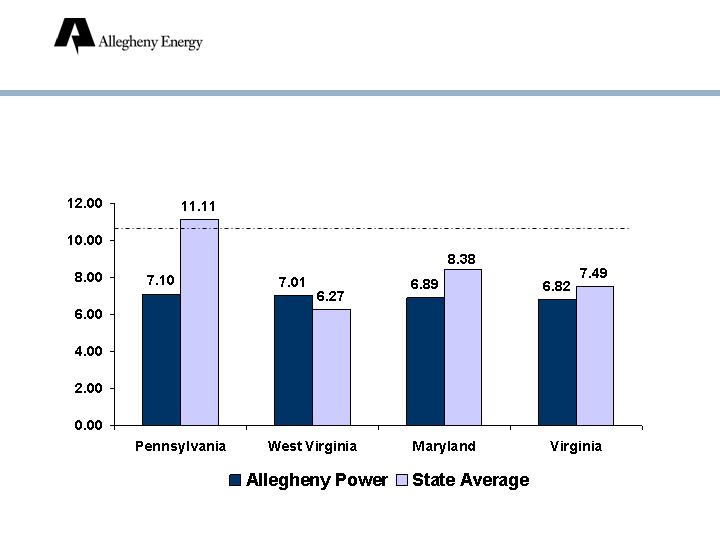
Delivery and Services:
Competitive Rates
National
Average =
10.62 ¢/kWh
Residential Rates
¢/kWh as of January 1, 2006
45
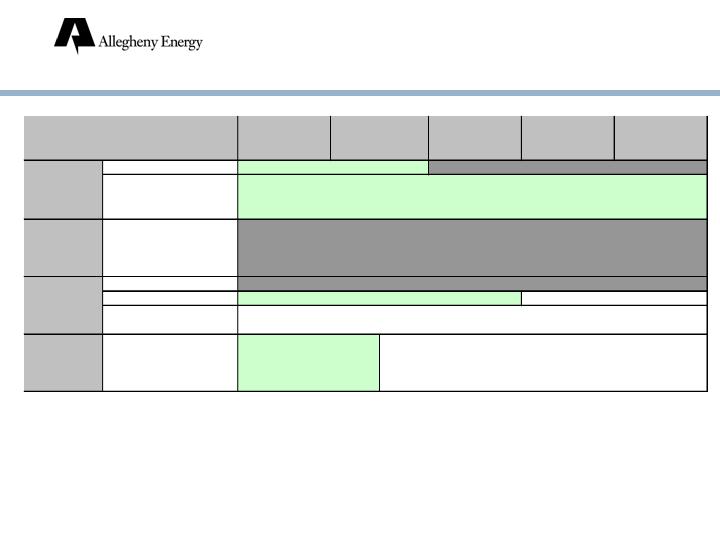
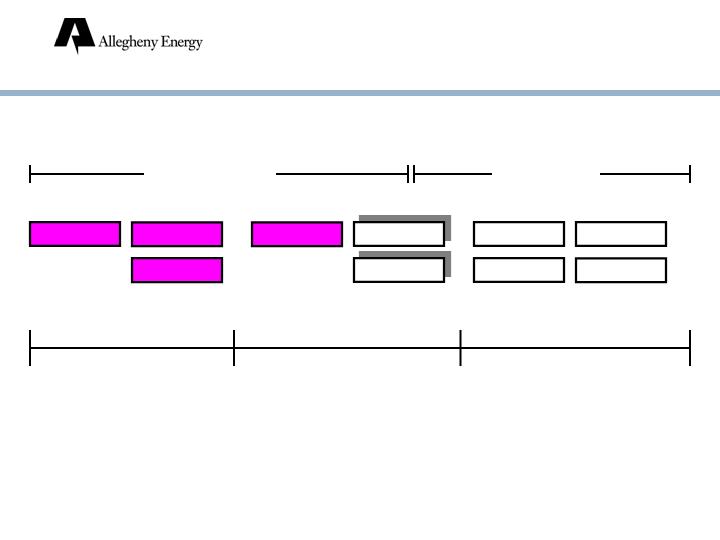
1 Generation rate caps include rate increases in each year, 2006-2010.
2 One-time T&D increase can be requested through 2007. After 2007, can
request recovery of purchased power and annual incremental T&D
reliability and environmental costs, and one additional T&D cost
increase.
Regulatory Timeline
46
2006
2008
2009
2010
T&D
Generation
T&D
Gen. - Res.
Through 2007
2
Gen. - Com. & Ind.
T&D
and
Generation
Regulated
Capped through 2008
Market-based
Market-based
Regulated
Distribution capped through 2007
Increases through 2010
1
2007
Through 2010
2
State
WV
T&D
and
Generation
Regulated
PA
MD
VA