
Fourth Quarter 2024 Earnings January 16, 2025

2 Disclaimers Non-GAAP Information Certain measures included in this document are “non-GAAP,” meaning they are not presented in accordance with generally accepted accounting principles in the U.S. and also are not codified in U.S. banking regulations currently applicable to FHN. FHN’s management believes such measures, even though not always comparable to non-GAAP measures used by other financial institutions, are relevant to understanding the financial condition, capital position, and financial results of FHN and its business segments. The non-GAAP measures presented in this document are listed, and are reconciled to the most comparable GAAP presentation, in the non-GAAP reconciliation table(s) appearing in the Appendix. In addition, presentation of regulatory measures, even those which are not GAAP, provides a meaningful base for comparability to other financial institutions subject to the same regulations as FHN. Although not GAAP terms, these regulatory measures are not considered “non-GAAP” under U.S. financial reporting rules as long as their presentation conforms to regulatory standards. Regulatory measures used in this document include: common equity tier 1 capital, generally defined as common equity less goodwill, other intangibles, and certain other required regulatory deductions; tier 1 capital, generally defined as the sum of core capital (including common equity and instruments that cannot be redeemed at the option of the holder) adjusted for certain items under risk-based capital regulations; and risk-weighted assets, which is a measure of total on- and off-balance sheet assets adjusted for credit and market risk, used to determine regulatory capital ratios. Forward-Looking Statements This document contains forward-looking statements within the meaning of the Private Securities Litigation Reform Act of 1995, Section 27A of the Securities Act of 1933, as amended, and Section 21E of the Securities Exchange Act of 1934, as amended, with respect to FHN's beliefs, plans, goals, expectations, and estimates. Forward- looking statements are not a representation of historical information, but instead pertain to future operations, strategies, financial results, or other developments. Forward- looking statements often use words such as “believe,” “expect,” “anticipate,” “intend,” “estimate,” “should,” “is likely,” “will,” “going forward,” and other similar expressions that indicate future events and trends. Forward-looking statements are necessarily based upon estimates and assumptions that are inherently subject to significant business, operational, economic, and competitive uncertainties and contingencies, many of which are beyond FHN’s control, and many of which, with respect to future business decisions and actions (including acquisitions and divestitures), are subject to change and could cause FHN’s actual future results and outcomes to differ materially from those contemplated or implied by forward-looking statements or historical performance. While there is no assurance that any list of uncertainties and contingencies is complete, examples of factors which could cause actual results to differ from those contemplated by forward-looking statements or historical performance include those mentioned: in this document; in Items 2.02 and 7.01 of FHN’s Current Report on Form 8-K to which this document has been furnished as an exhibit; in the forepart, and in Items 1, 1A, and 7, of FHN’s most recent Annual Report on Form 10-K; and in the forepart, and in Item 1A of Part II, of FHN’s Quarterly Report(s) on Form 10-Q filed after that Annual Report. Any forward-looking statements made by or on behalf of FHN speak only as of the date they are made, and FHN assumes no obligation to update or revise any forward-looking statements that are made in this document or in any other statement, release, report, or filing from time to time. Actual results could differ and expectations could change, possibly materially, because of one or more factors, including those factors listed in this document or the documents mentioned above, and other factors not listed. Throughout this document, numbers may not foot due to rounding, references to EPS are fully diluted, and capital ratios for the most recent quarter are estimates.

3TBVPS and ROTCE are non-GAAP and are reconciled to GAAP measures in the appendix. Pre-provision net revenue (PPNR) is a non-GAAP measure and is reconciled to pre-tax income (GAAP) in the table. $ in millions except per share data Reported Results 4Q24 Change vs. Reported Results 2024 change vs. 2023 4Q24 3Q24 2Q24 1Q24 4Q23 3Q24 4Q23 2024 2023 Net interest income $630 $627 $629 $625 $617 $2 —% $13 2% $2,511 $2,540 ($29) (1%) Fee income 99 200 186 194 183 (101) (51%) (84) (46%) 679 927 (248) (27%) Total revenue 729 828 815 819 800 (99) (12%) (71) (9%) 3,190 3,467 (277) (8%) Expense 508 511 500 515 572 (3) (1%) (64) (11%) 2,035 2,080 (45) (2%) Pre-provision net revenue (PPNR) 220 316 315 304 227 (96) (30%) (7) (3%) 1,155 1,388 (232) (17%) Provision for credit losses 10 35 55 50 50 (25) (71%) (40) (80%) 150 260 (110) (42%) Pre-tax income 210 281 260 254 177 (71) (25%) 33 19% 1,005 1,128 (122) (11%) Income tax expense 41 58 56 57 (11) (17) (30%) 52 NM 211 212 (1) —% Net income 170 223 204 197 188 (54) (24%) (18) (10%) 794 915 (122) (13%) Non-controlling interest 4 5 5 5 5 — (10%) (1) (11%) 19 19 — 2% Preferred dividends 8 5 15 8 8 3 51% — —% 36 32 4 13% Net income available to common shareholders (NIAC) $158 $213 $184 $184 $175 ($56) (26%) ($18) (10%) $738 $865 ($126) (15%) Diluted EPS $0.29 $0.40 $0.34 $0.33 $0.31 ($0.11) (26%) ($0.02) (6%) $1.36 $1.54 ($0.18) (12%) Average diluted shares outstanding 534 538 547 558 561 (4) (1%) (27) (5%) 544 562 (17) (3%) ROCE 7.4% 10.1% 9.0% 8.8% 8.6% (272bps) (122bps) 8.8% 11.0% (221bps) ROTCE 9.2% 12.6% 11.3% 11.0% 10.9% (343bps) (172bps) 11.0% 14.1% (311bps) ROA 0.8% 1.1% 1.0% 1.0% 0.9% (26bps) (9bps) 1.0% 1.1% (15bps) Net interest margin 3.33% 3.31% 3.38% 3.37% 3.27% 2bps 6bps 3.35% 3.42% (7bps) Fee income / total revenue 23.2% 24.1% 22.8% 23.7% 23.3% (86bps) (13bps) 23.4% 26.8% (339bps) Efficiency ratio 62.0% 61.9% 61.4% 62.9% 71.1% 9bps (916bps) 62.1% 59.9% 215bps FTEs (full-time equivalent associates) 7,158 7,186 7,297 7,327 7,277 (28) —% (119) (2%) 7,242 7,306 (64) (1%) CET1 ratio 11.2% 11.2% 11.0% 11.3% 11.4% (3bps) (20bps) 11.2% 11.4% (20bps) Effective tax rate 19.3% 20.6% 21.5% 22.5% (6.2%) (126bps) NM 21.0% 18.8% 221bps Tangible book value per share $12.85 $13.02 $12.22 $12.16 $12.13 ($0.17) (1%) $0.72 6% $12.85 $12.13 $0.72 6% Period end loans $62.6B $62.4B $62.8B $61.8B $61.3B $0.1 —% $1.3 2% $62.6B $61.3B $1.3 2% Period end deposits $65.6B $66.6B $64.8B $65.7B $65.8B ($1.0) (1%) ($0.2) —% $65.6B $65.8B ($0.2) —% Period end loan to deposit ratio 95% 94% 97% 94% 93% 160bps 222bps 95% 93% 222bps 4Q24 & 2024 GAAP financial summary
4 4Q24 and 2024 highlights . . . . . . . . . . . . . . . . . . . . . . . . . . . . . . . . . . . . . . . . . . . . . . . . . . . . . . . . . . . . . 5 4Q24 adjusted financial results . . . . . . . . . . . . . . . . . . . . . . . . . . . . . . . . . . . . . . . . . . . . . . . . . . . . . . . . 6 4Q24 notable items . . . . . . . . . . . . . . . . . . . . . . . . . . . . . . . . . . . . . . . . . . . . . . . . . . . . . . . . . . . . . . . . . . 7 NII and NIM . . . . . . . . . . . . . . . . . . . . . . . . . . . . . . . . . . . . . . . . . . . . . . . . . . . . . . . . . . . . . . . . . . . . . . . . . 8 Deposits . . . . . . . . . . . . . . . . . . . . . . . . . . . . . . . . . . . . . . . . . . . . . . . . . . . . . . . . . . . . . . . . . . . . . . . . . . . . 9 Loans . . . . . . . . . . . . . . . . . . . . . . . . . . . . . . . . . . . . . . . . . . . . . . . . . . . . . . . . . . . . . . . . . . . . . . . . . . . . . . 10 Adjusted fee income . . . . . . . . . . . . . . . . . . . . . . . . . . . . . . . . . . . . . . . . . . . . . . . . . . . . . . . . . . . . . . . . . . 11 Adjusted expense . . . . . . . . . . . . . . . . . . . . . . . . . . . . . . . . . . . . . . . . . . . . . . . . . . . . . . . . . . . . . . . . . . . . 12 Asset quality . . . . . . . . . . . . . . . . . . . . . . . . . . . . . . . . . . . . . . . . . . . . . . . . . . . . . . . . . . . . . . . . . . . . . . . . 13 Capital . . . . . . . . . . . . . . . . . . . . . . . . . . . . . . . . . . . . . . . . . . . . . . . . . . . . . . . . . . . . . . . . . . . . . . . . . . . . . 14 2025 outlook . . . . . . . . . . . . . . . . . . . . . . . . . . . . . . . . . . . . . . . . . . . . . . . . . . . . . . . . . . . . . . . . . . . . . . . . 15 Strategic focus . . . . . . . . . . . . . . . . . . . . . . . . . . . . . . . . . . . . . . . . . . . . . . . . . . . . . . . . . . . . . . . . . . . . . . 16 Appendix . . . . . . . . . . . . . . . . . . . . . . . . . . . . . . . . . . . . . . . . . . . . . . . . . . . . . . . . . . . . . . . . . . . . . . . . . . . 17 Table of Contents

5 CET1 ACL to Loans Ratio TBVPS Change FDIC Insured or Collateralized 11.2% 1.43% +6% YoY 66% Adj. EPS Adj. ROTCE Avg. Deposit Growth Avg. Loan Growth Fee Income Growth $1.55 12.5% +2% +3% +10% Adj. EPS Adj. ROTCE NIM ADR Growth NCO % $0.43 13.3% 3.33% +11% 0.08% ROTCE, TBVPS, ACL/loans ratio, and adjusted financial measures, including measures excluding deferred compensation, are non-GAAP and are reconciled to GAAP measures in the appendix. Net interest income and margin are adjusted to a fully taxable equivalent (“FTE”) basis assuming a statutory federal income tax of 21 percent and, where applicable, state income taxes. • Deployed excess capital via $604 million of share repurchases in 2024, while maintaining adequate levels of capital • ACL/loans ratio of 1.43% with net charge-offs down approximately $58 million to $112 million • TBVPS increased $0.72 on strong earnings performance and capital deployment strategies, supporting $0.60 of common dividends in addition to share repurchases • Adjusted pre-tax income of $304 million, up $8 million from 3Q24 • NIM expanded 2 basis points, as successful deposit repricing offset the impact of lower rates on loan yields • Fees excluding deferred comp down $5 million due to service charge declines, partially offset by fixed income production • Expenses excluding deferred comp increased by $14 million, primarily due to charitable foundation contribution 4Q24 Profitability 2024 Highlights Safety & Soundness Profitable 4Q24 performance closes a strong 2024 • Adjusted net income of $891 million, up $35 million from 2023 • Average loans up $1.8 billion from 2023 with broad based growth in C&I, CRE, and consumer real estate • Average deposits up $1.4 billion from 2023 with new clients funds used to pay-off wholesale funding • Fees excluding deferred comp increased $71 million, driven by the counter-cyclical lines of business

6ROTCE, TBVPS, ACL to loans ratio, and adjusted financial measures, including measures excluding deferred compensation, are non-GAAP and are reconciled to GAAP measures in the appendix. Adjusted pre-provision net revenue (PPNR) is a non-GAAP measure and is reconciled to pre-tax income (GAAP) in the appendix. Net interest income and margin are adjusted to a fully taxable equivalent (“FTE”) basis assuming a statutory federal income tax of 21 percent and, where applicable, state income taxes. $ in millions, except per share data Adjusted Results 4Q24 Change vs. 4Q24 3Q24 4Q23 3Q24 4Q23 Net interest income (FTE) $634 $631 $621 $2 —% $13 2% Fee income $190 $200 $179 ($10) (5%) $11 6% Total revenue (FTE) $824 $832 $800 ($8) (1%) $24 3% Expense $506 $497 $502 $9 2% $4 1% Pre-provision net revenue $318 $335 $298 ($17) (5%) $20 7% Provision for credit losses $10 $35 $50 ($25) (71%) ($40) (80%) Net charge-offs $13 $24 $36 ($11) (45%) ($23) (63%) Reserve build / (release) ($3) $11 $14 ($14) NM ($17) NM NIAC $228 $224 $178 $4 2% $50 28% Diluted EPS $0.43 $0.42 $0.32 $0.01 2% $0.11 35% Diluted shares 534 538 561 (4) (1%) (27) (5%) ROTCE 13.3% 13.2% 11.1% 3bps 222bps ROA 1.2% 1.1% 0.9% 4bps 25bps Net interest margin (NIM) 3.33% 3.31% 3.27% 2bps 6bps Fee income / total revenue 23.1% 24.0% 22.3% (85bps) 78bps Efficiency ratio 61.4% 59.9% 62.8% 157bps (141bps) CET1 Ratio 11.2% 11.2% 11.4% (3bps) (20bps) TBVPS $12.85 $13.02 $12.13 $(0.17) (1%) $0.72 6% Effective tax rate 21.0% 20.8% 21.7% 21bps (73bps) 4Q24 adjusted financial highlights • 4Q24 adjusted EPS of $0.43 increased $0.01 from 3Q24 • Adjusted ROTCE of 13.3%, increased from 3Q24 • Adjusted NIAC of $228 million, up 2% from 3Q24 • NII up $2 million linked quarter ◦ NIM expanded 2bps driven by a 34bps reduction in interest- bearing deposit costs and pay off of brokered CDs, partially offset by the impact of lower short-term rates on loan yields • Adjusted fee income decreased $5 million excluding deferred compensation, with higher fixed income production offset by changes within service charges and fees • Adjusted expense increased $14 million excluding deferred compensation, driven by a $10 million contribution to First Horizon Foundation • Provision expense of $10 million decreased $25 million from 3Q24, with an ACL to loans ratio of 1.43% and net charge-off ratio of 8bps • Strong earnings resulted in CET1 ratio of 11.2%, supporting $163 million of share repurchases and $69 million of after-tax losses ($91 million pre-tax) related to an opportunistic securities portfolio restructuring

7 4Q24 notable items Notable Items ($ in millions, except EPS) 4Q24 Securities gain/loss ($91) FDIC Special Assessment $1 Restructuring expense ($3) Pre-tax impact of notable items $(94) Tax impact on pre-tax notable items $23 NIAC impact of notable items ($71) EPS impact of notable items ($0.13) Pre-Tax Notable Items • $91 million pre-tax loss associated with an opportunistic restructuring of a portion of the securities portfolio ◦ Sold $1.2 billion of securities with an average yield of 1.9% and reinvested at 5.1% ◦ Estimated earnback timeline of 2.5 years on approximately $35 million of annual net interest income improvement ◦ Reduced effective duration from 3.2 years to 2.5 years on restructured securities • $3 million of restructuring expense, primarily related to implementing operational efficiencies • Expense credit of $1 million associated with a revised assessment rate for FDIC special assessment

8 $621 $628 $633 $631 $634 3.27% 3.37% 3.38% 3.31% 3.33% 4Q23 1Q24 2Q24 3Q24 4Q24 Net interest income ($) and NIM (%) Deposit pricing discipline delivered NIM expansion Net interest income and margin are adjusted to a fully taxable equivalent (“FTE”) basis assuming a statutory federal income tax of 21 percent and, where applicable, state income taxes. 1Does not include the impact of interest rate hedges. For more detail on the hedges, see slide 18 in the appendix. • Net interest income increased $2 million and net interest margin expanded 2bps versus 3Q24 ◦ Average interest-bearing deposit costs improved 34bps versus the prior quarter, while loan yields decreased by 28bps ◦ Retained ~95% of ~$18 billion of promotional deposits and CDs repriced in the fourth quarter, while achieving a 97bp reduction in the weighted average rate • 4Q24 securities restructuring expected to result in approximately $35 million of annual net interest income improvement • As of year end 2024, 56%1 of loans are indexed to short-term rates • Fixed rate cash flows over the next year include ~$4 billion of fixed rate loans with a roll-off yield of ~4.6% and $1 billion of securities at a roll-off yield of ~2.5% $ in millions NII Margin 3Q24 $631 3.31% Loan Yields $(45) (0.24)% Customer Deposit Rate Paid $37 0.19% Wholesale Funds $4 0.06% Other $6 0.01% 4Q24 $634 3.33%

9 Period end deposits $65.8B $65.7B $64.8B $66.6B $65.6B $17.2 $16.4 $16.3 $16.2 $16.0 $21.2 $19.2 $18.0 $16.3 $16.0 $18.4 $20.1 $20.3 $22.3 $21.5 $7.5 $9.0 $8.0 $9.2 $10.7 $1.4 $1.0 $2.1 $2.5 $1.4 Noninterest bearing deposits Base rate deposits Promotional deposits & CDs Indexed deposits Brokered CDs 4Q23 1Q24 2Q24 3Q24 4Q24 Repriced deposits while retaining balances and clients • 4Q24 period end deposits of $65.6 billion ◦ Decline of $1 billion versus 3Q24 driven by the pay-off of $1.1 billion of brokered CDs ◦ Mix shift into market indexed deposits reinforces down beta opportunities • 4Q24 average deposits of $66.1 billion were down $0.2 billion versus 3Q24 ◦ Brokered CDs averaged $0.8 billion lower in 4Q24 ◦ Noninterest-bearing balances remained relatively stable from previous quarter • 4Q24 interest-bearing rate paid of 3.10%, down 34bps ◦ Achieved ~56% beta versus 3Q24 ◦ Quarter end interest-bearing deposit spot rate was ~2.80% • Continuing to remain competitive while focusing on deepening relationship with existing clients

10 Period end loans • 4Q24 period end loans of $62.6 billion stable versus 3Q24 ◦ Loans to mortgage companies (LMC) continued to capitalize on market share gains, with balances up $227 million ◦ C&I excluding LMC up $110 million, with growth across multiple industry sectors ◦ CRE balances declined $284 million due to pay downs as clients are able to access the permanent markets • Period end line utilization of 43%1 • Loan yields compressed 28bps to 6.1% driven by lower short- term rates, partially offset by continued repricing of fixed rate cash flows • Asset sensitive profile reflected in loan composition of 56% variable rate, 12% ARM, and 32% fixed rate3 1Utilization rates exclude Loans to Mortgage Companies. 2Credit card & other is $0.8B from 4Q23 to 2Q24 and $0.7B in 3Q24 and 4Q24. 3Does not include the impact of interest rate hedges. For more detail on the hedges, see slide 18 in the appendix. Diversified portfolio across attractive geographic footprint $61.3B $61.8B $62.8B $62.4B $62.6B $30.6B $30.5B $30.5B $29.8B $30.0B $14.2B $14.4B $14.7B $14.7B $14.4B $13.6B $13.6B $13.9B $14.0B $14.0B $2.0B $2.4B $2.9B $3.2B $3.5B C&I ex LMC Commercial real estate (CRE) Consumer real estate LMC Credit card & other 4Q23 1Q24 2Q24 3Q24 4Q24 2

11 • 4Q24 adjusted fee income excluding deferred compensation decreased $5 million from 3Q24 ◦ Fixed income increased $3 million with an average daily revenue (ADR) of $659k, up 11%, driven by the continued momentum from declining short-term interest rates, creating improvement in the shape of the yield curve ◦ Mortgage banking income down $1 million from a seasonal decline in volume ◦ Service charges & fees declined $6 million, primarily due to a full quarter impact of overdraft changes which lowered fee income by $4 million from prior quarter Fixed income improvement provided partial offset to fee declines Adjusted financial measures, including measures excluding deferred compensation, are non-GAAP and are reconciled to GAAP measures in the appendix. 1Fixed Income ADR is based upon Fixed Income trading revenues and excludes other product revenues (e.g. investment advisory, derivatives, loan trading and other service related revenues). $ in millions Adjusted Results 4Q24 Change vs. Adjusted Results 2024 Change vs. 20234Q24 3Q24 2Q24 1Q24 4Q23 3Q24 4Q23 2024 2023 Fixed income $49 $47 $40 $52 $37 $3 6% $12 34% $187 $133 $54 41% Mortgage banking $8 $9 $10 $9 $5 ($1) (16%) $3 55% $35 $23 $12 51% Service charges and fees $53 $59 $58 $57 $59 ($6) (10%) ($6) (11%) $227 $233 ($6) (3%) Brokerage, trust, and insurance $41 $39 $38 $36 $36 $1 3% $4 12% $154 $139 $15 11% Card and digital banking fees $19 $19 $20 $19 $16 $0 (2%) $3 18% $77 $77 $0 —% Deferred compensation income $1 $6 $3 $9 $6 ($5) (78%) ($5) (79%) $19 $17 $1 7% Securities gains/(losses) $0 $1 $1 $0 $1 ($1) (98%) ($1) (96%) $2 $2 $1 32% Other noninterest income $20 $20 $16 $14 $19 $0 (1%) $1 5% $70 $75 ($5) (6%) Total fee income $190 $200 $186 $194 $179 ($10) (5%) $11 6% $771 $699 $72 10% Fee income ex deferred comp $189 $194 $183 $186 $173 ($5) (3%) $16 9% $752 $681 $71 10% Fixed income ADR1 $659k $593k $488k $731k $463k $66k 11% $196k 42% $617k $387k $230k 59%
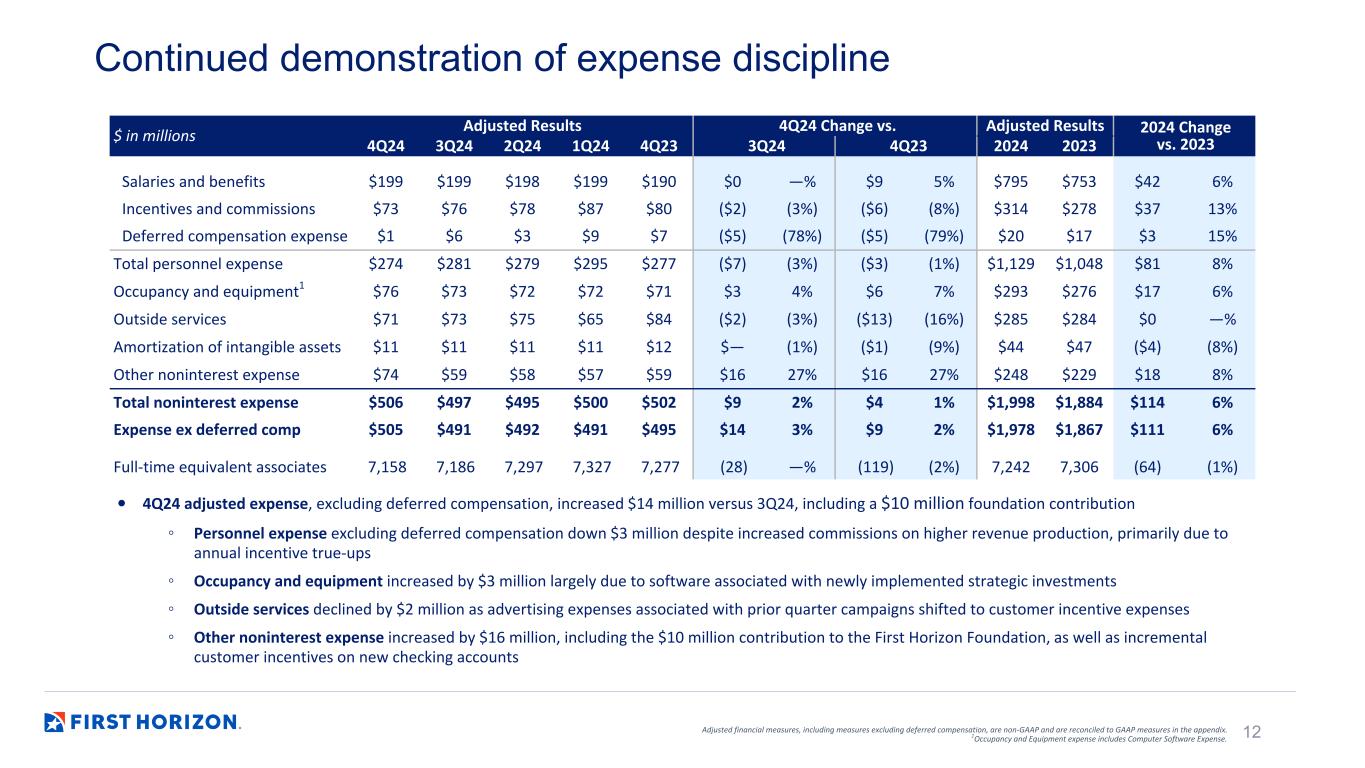
12 Continued demonstration of expense discipline • 4Q24 adjusted expense, excluding deferred compensation, increased $14 million versus 3Q24, including a $10 million foundation contribution ◦ Personnel expense excluding deferred compensation down $3 million despite increased commissions on higher revenue production, primarily due to annual incentive true-ups ◦ Occupancy and equipment increased by $3 million largely due to software associated with newly implemented strategic investments ◦ Outside services declined by $2 million as advertising expenses associated with prior quarter campaigns shifted to customer incentive expenses ◦ Other noninterest expense increased by $16 million, including the $10 million contribution to the First Horizon Foundation, as well as incremental customer incentives on new checking accounts $ in millions Adjusted Results 4Q24 Change vs. Adjusted Results 2024 Change vs. 20234Q24 3Q24 2Q24 1Q24 4Q23 3Q24 4Q23 2024 2023 Salaries and benefits $199 $199 $198 $199 $190 $0 —% $9 5% $795 $753 $42 6% Incentives and commissions $73 $76 $78 $87 $80 ($2) (3%) ($6) (8%) $314 $278 $37 13% Deferred compensation expense $1 $6 $3 $9 $7 ($5) (78%) ($5) (79%) $20 $17 $3 15% Total personnel expense $274 $281 $279 $295 $277 ($7) (3%) ($3) (1%) $1,129 $1,048 $81 8% Occupancy and equipment1 $76 $73 $72 $72 $71 $3 4% $6 7% $293 $276 $17 6% Outside services $71 $73 $75 $65 $84 ($2) (3%) ($13) (16%) $285 $284 $0 —% Amortization of intangible assets $11 $11 $11 $11 $12 $— (1%) ($1) (9%) $44 $47 ($4) (8%) Other noninterest expense $74 $59 $58 $57 $59 $16 27% $16 27% $248 $229 $18 8% Total noninterest expense $506 $497 $495 $500 $502 $9 2% $4 1% $1,998 $1,884 $114 6% Expense ex deferred comp $505 $491 $492 $491 $495 $14 3% $9 2% $1,978 $1,867 $111 6% Full-time equivalent associates 7,158 7,186 7,297 7,327 7,277 (28) —% (119) (2%) 7,242 7,306 (64) (1%) Adjusted financial measures, including measures excluding deferred compensation, are non-GAAP and are reconciled to GAAP measures in the appendix. 1Occupancy and Equipment expense includes Computer Software Expense.

13 Non-performing loans (NPLs)Allowance for credit losses (ACL) Net charge-offs FHN NCO%1 Average NCO% of BKX Index2 $36 $40 $34 $24 $13 0.23% 0.27% 0.22% 0.15% 0.08% 0.53% 0.56% 0.57% 0.57% 4Q23 1Q24 2Q24 3Q24 4Q24 FHN NCOs Disciplined lending leads to strong performance across the cycle ACL/ loans ratio is non-GAAP and is reconciled to GAAP measures in the appendix. 1Net charge-off % is annualized and as % of average loans. 2Excludes trust and investment banks. $856 $865 $887 $897 $894 1.40% 1.40% 1.41% 1.44% 1.43% ACL ACL/Loans 4Q23 1Q24 2Q24 3Q24 4Q24 $462 $505 $574 $578 $602 0.75% 0.82% 0.91% 0.92% 0.96% NPLs $ NPLs % 4Q23 1Q24 2Q24 3Q24 4Q24 • 4Q24 net charge-offs of $13 million declined for the third consecutive quarter ◦ Strong NCO ratio of 0.08% ◦ Includes $15 million of recoveries • Provision expense of $10 million in 4Q24 ◦ 4Q24 ACL to loans ratio decreased slightly to 1.43%, the net benefit of slightly more favorable economic outlook • NPL ratio of 96bps up 4bps from 3Q24 ◦ Within the commercial NPL portfolio, more than 60% of loans are current on payments
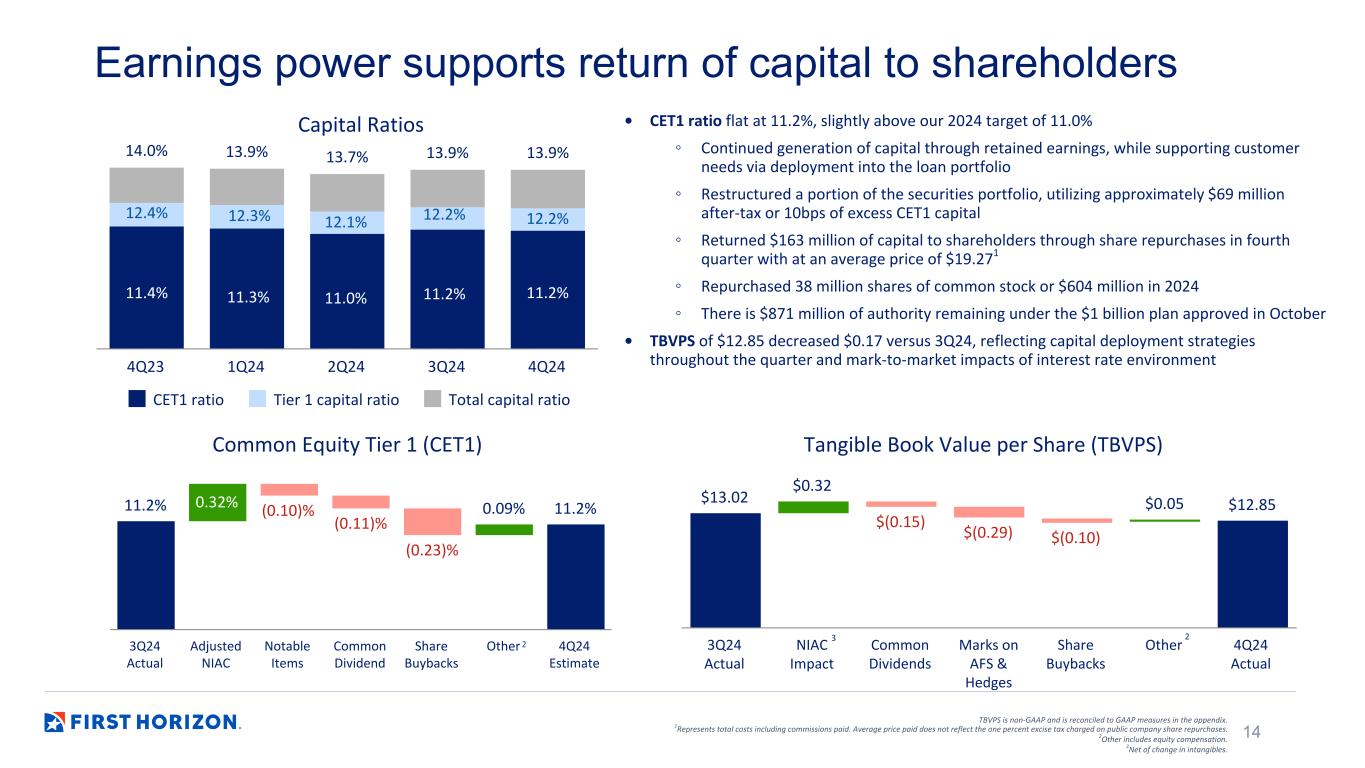
14 Capital Ratios Common Equity Tier 1 (CET1) Tangible Book Value per Share (TBVPS) 14.0% 13.9% 13.7% 13.9% 13.9% CET1 ratio Tier 1 capital ratio Total capital ratio 4Q23 1Q24 2Q24 3Q24 4Q24 Earnings power supports return of capital to shareholders $13.02 $0.32 $(0.15) $(0.29) $(0.10) $0.05 $12.85 3Q24 Actual NIAC Impact Common Dividends Marks on AFS & Hedges Share Buybacks Other 4Q24 Actual • CET1 ratio flat at 11.2%, slightly above our 2024 target of 11.0% ◦ Continued generation of capital through retained earnings, while supporting customer needs via deployment into the loan portfolio ◦ Restructured a portion of the securities portfolio, utilizing approximately $69 million after-tax or 10bps of excess CET1 capital ◦ Returned $163 million of capital to shareholders through share repurchases in fourth quarter with at an average price of $19.271 ◦ Repurchased 38 million shares of common stock or $604 million in 2024 ◦ There is $871 million of authority remaining under the $1 billion plan approved in October • TBVPS of $12.85 decreased $0.17 versus 3Q24, reflecting capital deployment strategies throughout the quarter and mark-to-market impacts of interest rate environment TBVPS is non-GAAP and is reconciled to GAAP measures in the appendix. 1Represents total costs including commissions paid. Average price paid does not reflect the one percent excise tax charged on public company share repurchases. 2Other includes equity compensation. 3Net of change in intangibles. 3 11.2% 0.32% (0.10)% (0.11)% (0.23)% 0.09% 11.2% 3Q24 Actual Adjusted NIAC Notable Items Common Dividend Share Buybacks Other 4Q24 Estimate 2 11.4% 11.3% 11.0% 11.2% 11.2% 12.2%12.1%12.3%12.4% 12.2% 2
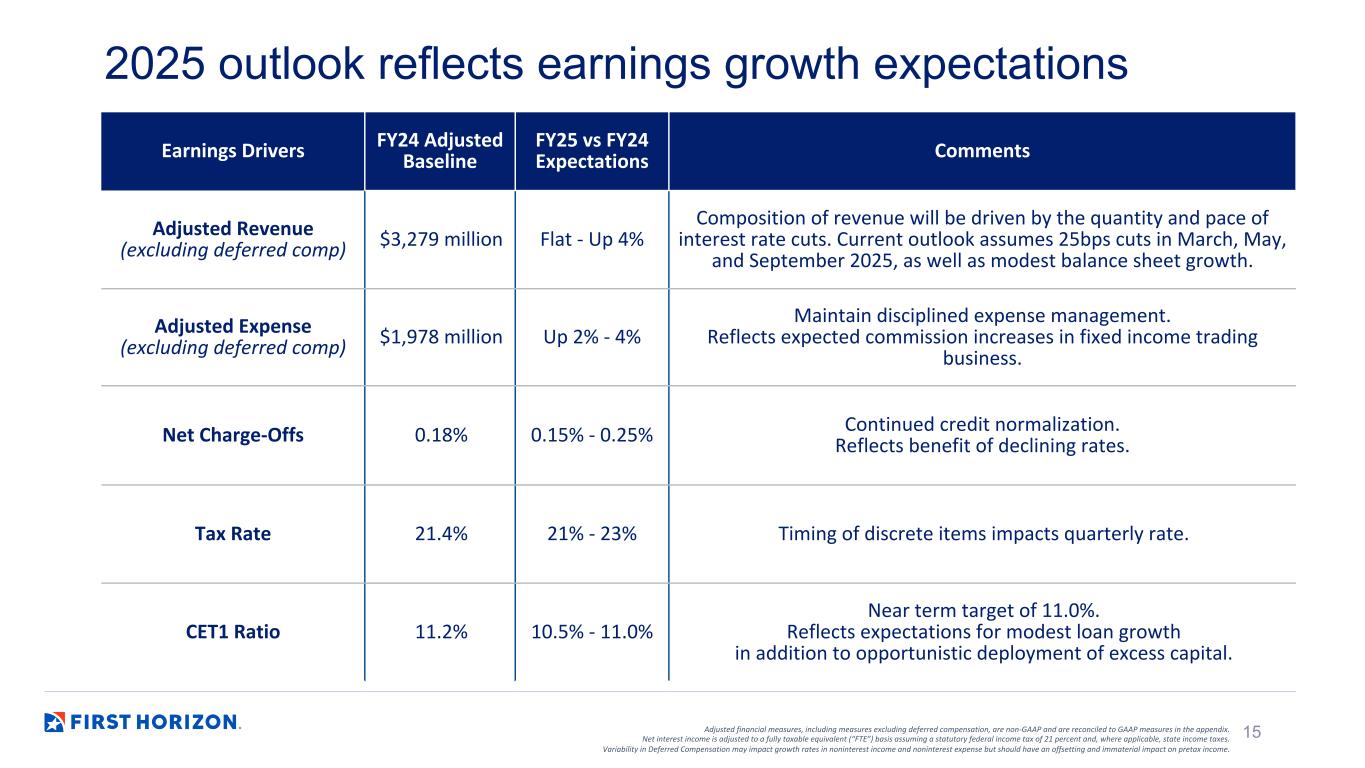
15 Earnings Drivers FY24 Adjusted Baseline FY25 vs FY24 Expectations Comments Adjusted Revenue (excluding deferred comp) $3,279 million Flat - Up 4% Composition of revenue will be driven by the quantity and pace of interest rate cuts. Current outlook assumes 25bps cuts in March, May, and September 2025, as well as modest balance sheet growth. Adjusted Expense (excluding deferred comp) $1,978 million Up 2% - 4% Maintain disciplined expense management. Reflects expected commission increases in fixed income trading business. Net Charge-Offs 0.18% 0.15% - 0.25% Continued credit normalization. Reflects benefit of declining rates. Tax Rate 21.4% 21% - 23% Timing of discrete items impacts quarterly rate. CET1 Ratio 11.2% 10.5% - 11.0% Near term target of 11.0%. Reflects expectations for modest loan growth in addition to opportunistic deployment of excess capital. Adjusted financial measures, including measures excluding deferred compensation, are non-GAAP and are reconciled to GAAP measures in the appendix. Net interest income is adjusted to a fully taxable equivalent (“FTE”) basis assuming a statutory federal income tax of 21 percent and, where applicable, state income taxes. Variability in Deferred Compensation may impact growth rates in noninterest income and noninterest expense but should have an offsetting and immaterial impact on pretax income. 2025 outlook reflects earnings growth expectations

16 Strategic capital management to opportunistically deploy excess capital and lower CET1 to 10% - 10.5% range Key steps to achieving 15%+ ROTCE Highly attractive geographic footprint in growth markets with opportunities to drive loan and deposit growth Diversified business model with balance between asset sensitivity and counter-cyclical businesses provides opportunity to deliver outperformance through a variety of economic cycles Disciplined execution of strategy and continuous focus on efficiency and profitability Maintaining prudent credit culture that minimizes losses and maximizes long-term returns

Appendix
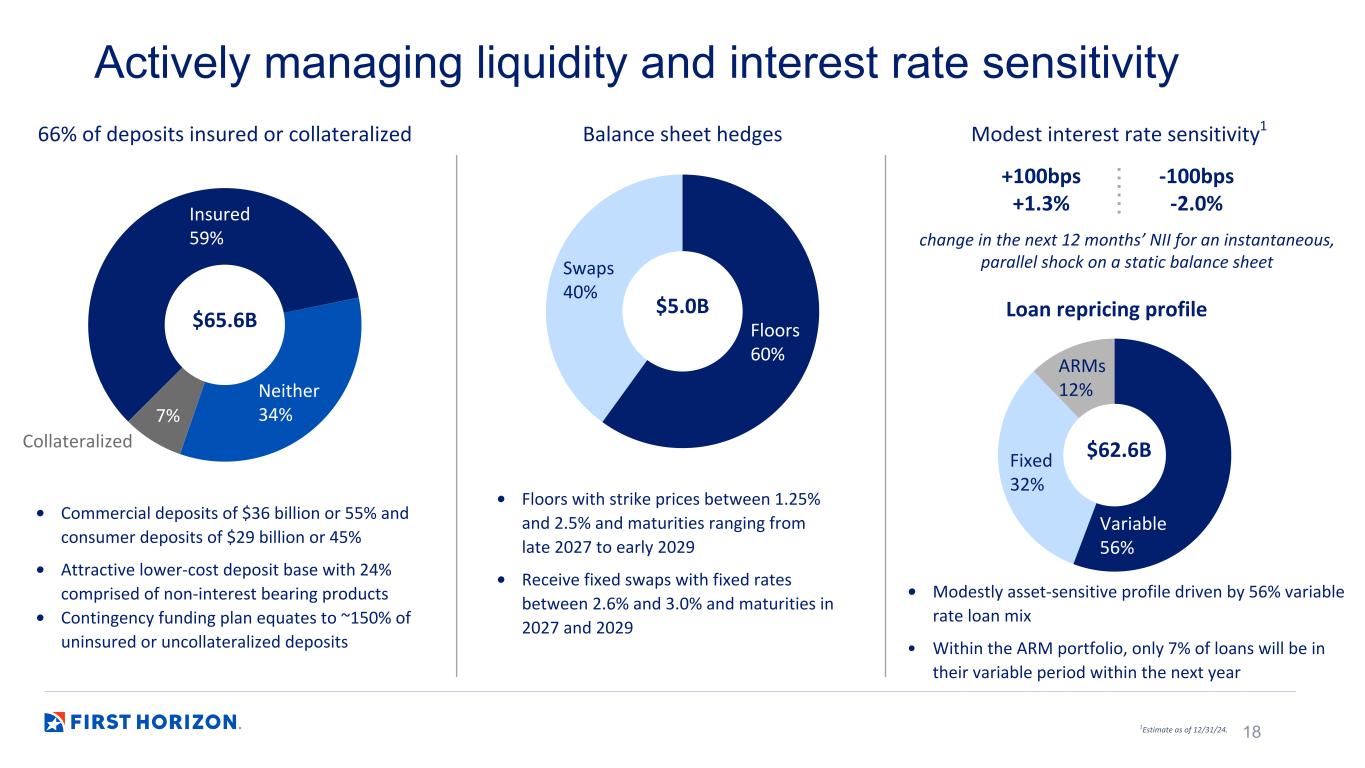
18 Actively managing liquidity and interest rate sensitivity Variable 56% Fixed 32% ARMs 12% $62.6B Floors 60% Swaps 40% $5.0B Loan repricing profile Balance sheet hedges Modest interest rate sensitivity1 +100bps +1.3% -100bps -2.0% • Modestly asset-sensitive profile driven by 56% variable rate loan mix • Within the ARM portfolio, only 7% of loans will be in their variable period within the next year • Floors with strike prices between 1.25% and 2.5% and maturities ranging from late 2027 to early 2029 • Receive fixed swaps with fixed rates between 2.6% and 3.0% and maturities in 2027 and 2029 1Estimate as of 12/31/24. change in the next 12 months’ NII for an instantaneous, parallel shock on a static balance sheet Insured 59% Neither 34%7% $65.6B 66% of deposits insured or collateralized Collateralized • Commercial deposits of $36 billion or 55% and consumer deposits of $29 billion or 45% • Attractive lower-cost deposit base with 24% comprised of non-interest bearing products • Contingency funding plan equates to ~150% of uninsured or uncollateralized deposits

19 Track record of strong results supported by stable, diversified business mix • Our diversified business model with a highly attractive geographic footprint provides opportunity to deliver strong performance through a variety of economic cycles • The counter-cyclical businesses (fixed income, loans to mortgage companies, and mortgage) provide a counterbalance to the asset sensitive balance sheet during periods of declining interest rates Adjusted pre-provision net revenue (PPNR) is a non-GAAP measure and is reconciled to pre-tax income (GAAP) in the appendix. Numbers may not foot due to rounding. 12019 and 1H20 are standalone FHN, as the IBKC merger-of-equals did not occur until July 1, 2020. 2Counter-cyclical PPNR includes direct and allocated fees and expenses, as well as net interest income net of funds transfer pricing. $756 $1,084 $1,222 $1,374 $1,370 $1,299 All Other Adjusted PPNR Counter-Cyclicals PPNR Avg Fed Funds Effective Rate 2019 (pre-IBKC) 2020 (IBKC in 2H20) 2021 2022 2023 2024 $— $200 $400 $600 $800 $1,000 $1,200 $1,400 0% 1% 2% 3% 4% 5% 6% 7% 8% $158 / 21% $406 / 37% $347 / 28% $81 / 6% $26 / 2% $108 / 8% $598 / 79% $678 / 63% $875 / 72% $1,267 / 92% $1,344 / 98% $1,218 / 94% PPNR in millions Average Fed Funds Effective 1 1 2
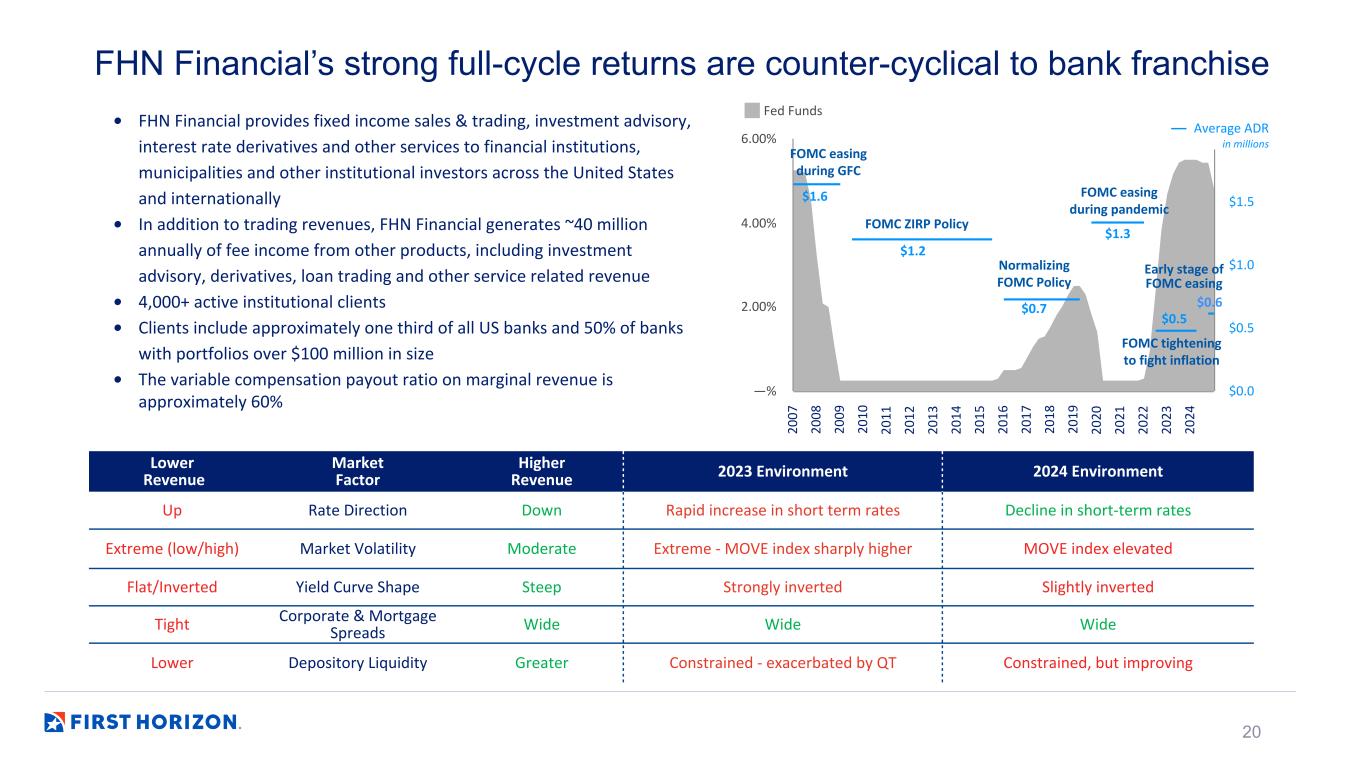
20 20 07 20 08 20 09 20 10 20 11 20 12 20 13 20 14 20 15 20 16 20 17 20 18 20 19 20 20 20 21 20 22 20 23 20 24 —% 2.00% 4.00% 6.00% $0.0 $0.5 $1.0 $1.5 $2.0 FHN Financial’s strong full-cycle returns are counter-cyclical to bank franchise Lower Revenue Market Factor Higher Revenue 2023 Environment 2024 Environment Up Rate Direction Down Rapid increase in short term rates Decline in short-term rates Extreme (low/high) Market Volatility Moderate Extreme - MOVE index sharply higher MOVE index elevated Flat/Inverted Yield Curve Shape Steep Strongly inverted Slightly inverted Tight Corporate & Mortgage Spreads Wide Wide Wide Lower Depository Liquidity Greater Constrained - exacerbated by QT Constrained, but improving • FHN Financial provides fixed income sales & trading, investment advisory, interest rate derivatives and other services to financial institutions, municipalities and other institutional investors across the United States and internationally • In addition to trading revenues, FHN Financial generates ~40 million annually of fee income from other products, including investment advisory, derivatives, loan trading and other service related revenue • 4,000+ active institutional clients • Clients include approximately one third of all US banks and 50% of banks with portfolios over $100 million in size • The variable compensation payout ratio on marginal revenue is approximately 60% FOMC easing during GFC FOMC ZIRP Policy Normalizing FOMC Policy FOMC easing during pandemic FOMC tightening to fight inflation Fed Funds Average ADR in millions $1.6 $1.2 $0.7 $1.3 $0.5 Early stage of FOMC easing $0.6

21 <$5 $3.3B $5-$10 $2.0B $10-$20 $2.7B $20-$30 $2.4B $30-$40 $2.2B $40-$50 $1.3B >$50 $0.6B CRE by property typeCRE by loan size2 CRE by state3 $3.9B $3.1B $2.5B $5.0B Floating Fixed 2025 2026 2027 2028+ High credit quality, diversified CRE portfolio All loan balances are period end unless otherwise noted. 1FHN’s CRE metrics database includes information for all loans in the Pro CRE LOB, as well as market/investor CRE loans $5+ million in commitments, which encompasses 75% of total CRE commitments. 2Loan size ranges in millions and dollar amounts are total funded balances in that size range to any single customer. 3Excludes CRE balances totaling $1.4B outside the Southeast and New York footprint. • Disciplined risk management practice and underwriting standards across CRE portfolio • No significant upcoming repricing event, as ~72% of loans are floating and maturities are dispersed over time • Granular portfolio with only 14 loans with commitments above $50 million • No property type comprises over 8% of total loans • Average debt service coverage of 1.4x and average stabilized LTV of 54%1 $ in billions $14.4B 35% 10% 10% 15% 15% 9% 4% 3% Multi-Family Traditional Office Medical Office Retail Industrial Hospitality Other Land + Residential Maturity schedule 82% 79% 71% 58% 18% 21% 29% 42%
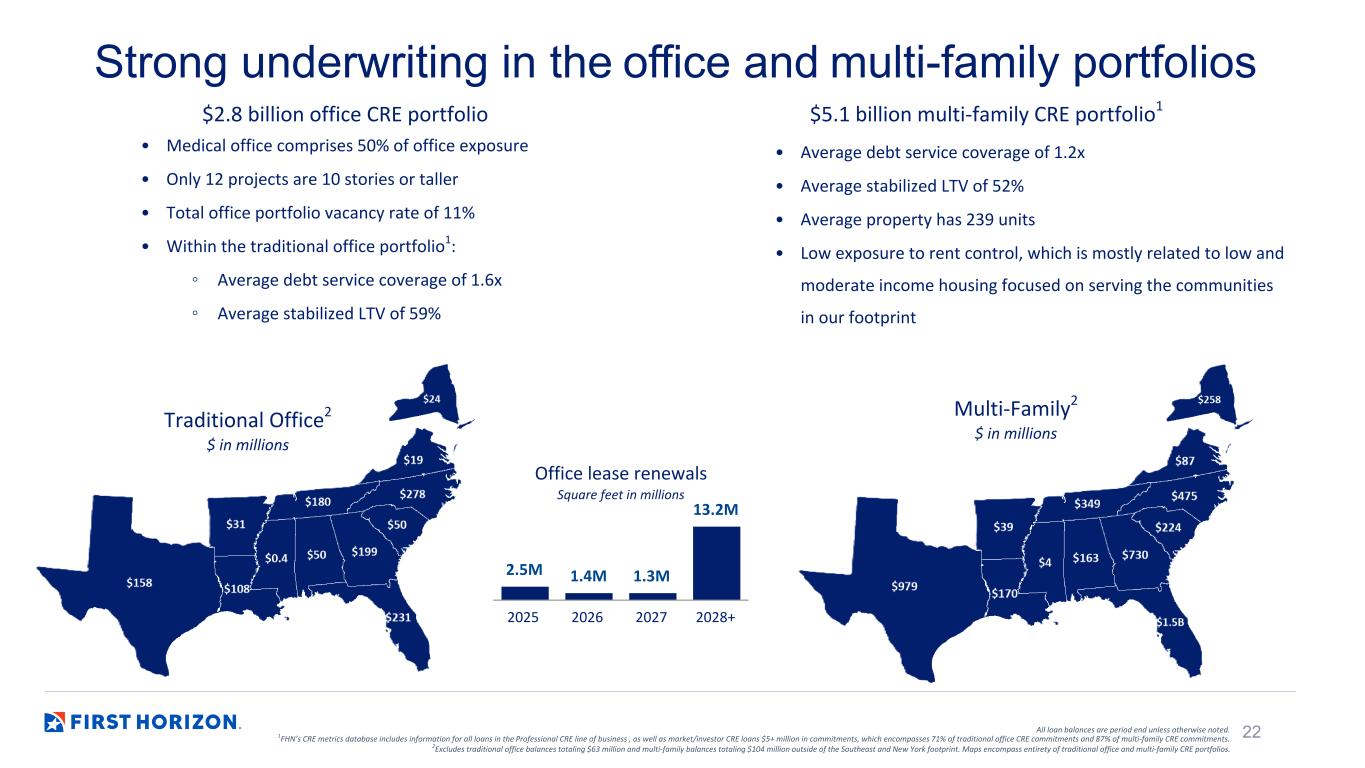
22 • Medical office comprises 50% of office exposure • Only 12 projects are 10 stories or taller • Total office portfolio vacancy rate of 11% • Within the traditional office portfolio1: ◦ Average debt service coverage of 1.6x ◦ Average stabilized LTV of 59% $2.8 billion office CRE portfolio $5.1 billion multi-family CRE portfolio1 2.5M 1.4M 1.3M 13.2M 2025 2026 2027 2028+ Multi-Family2 $ in millions Strong underwriting in the office and multi-family portfolios All loan balances are period end unless otherwise noted. 1FHN’s CRE metrics database includes information for all loans in the Professional CRE line of business , as well as market/investor CRE loans $5+ million in commitments, which encompasses 71% of traditional office CRE commitments and 87% of multi-family CRE commitments. 2Excludes traditional office balances totaling $63 million and multi-family balances totaling $104 million outside of the Southeast and New York footprint. Maps encompass entirety of traditional office and multi-family CRE portfolios. Traditional Office2 $ in millions • Average debt service coverage of 1.2x • Average stabilized LTV of 52% • Average property has 239 units • Low exposure to rent control, which is mostly related to low and moderate income housing focused on serving the communities in our footprint Office lease renewals Square feet in millions

23 C&I by state C&I by industry Consumer portfolio by product 81% 14% 5% Real estate installment loans HELOC Credit card and other Granular C&I portfolio and real estate backed consumer portfolio 20% 20% 12% 11% 9% 7% 6% 6% 4% 4% TN All Other FL TX Other Southeastern NC CA LA GA AL 12% 11% 10% 8% 7%7% 7% 5% 5% 4% 25% Real Estate & Leasing Finance & Insurance Mortgage Warehouse Healthcare & Social Assistance Wholesale Trade Manufacturing Accommodation & Food Service Retail Trade Transportation & Warehousing Energy Other 14 Industries • The C&I portfolio is both geographically diverse and benefits from a lack of industry concentration ◦ No more than 12% C&I exposure to any industry ◦ Southeastern footprint is economically and demographically strong ◦ Exposure to markets outside the southeast primarily driven by specialty businesses • Consumer portfolio focused on real estate, with negligible exposure to auto or consumer credit card All loan balances are period end unless otherwise noted. $33.4B $14.7B

24 4Q24 investment portfolio composition1 Steady principal cash flows2 Investment portfolio $0.3B $0.3B $0.3B $0.3B 1Q25 2Q25 3Q25 4Q25 Agency MBS 41% Agency CMBS 26% Agency CMO 17% U.S. Agencies & Treasury 12% States & Municipalities 4% $9.4B $9.6B $9.3B $9.4B $9.3B 2.62% 2.54% 2.58% 2.58% 2.69% Average AFS Securities Average HTM Securities Average Yield 4Q23 1Q24 2Q24 3Q24 4Q24 Investment portfolio prudently managed to support liquidity and IRR • 4Q24 investment portfolio represents ~11% of total assets ◦ Moderate total portfolio effective duration of 4.8 ◦ Low reliance on HTM designation at ~14% of total portfolio ◦ 96% U.S. government or agency-backed by GSEs • 4Q24 total unrealized losses on the AFS and HTM portfolios of $1.2B, increased from 3Q24 levels • $91 million pre-tax loss associated with an opportunistic restructuring of a portion of the securities portfolio ◦ Sold ~$1.2 billion of securities with an average yield of 1.9% and reinvested at 5.1% ◦ Estimated earnback timeline of 2.5 years 1Calculated based on period end market values. 2Estimated as of 12/31/24; includes maturities and projected calls. 4Q23 1Q24 2Q24 3Q24 4Q24 % of total assets 11% 12% 11% 11% 11% Pre-tax unrealized losses ($1.3B) ($1.4B) ($1.4B) ($1.0B) ($1.2B) Effective duration 5.0 5.0 4.9 4.6 4.8 Unencumbered securities / total securities1 30% 27% 25% 38% 29%
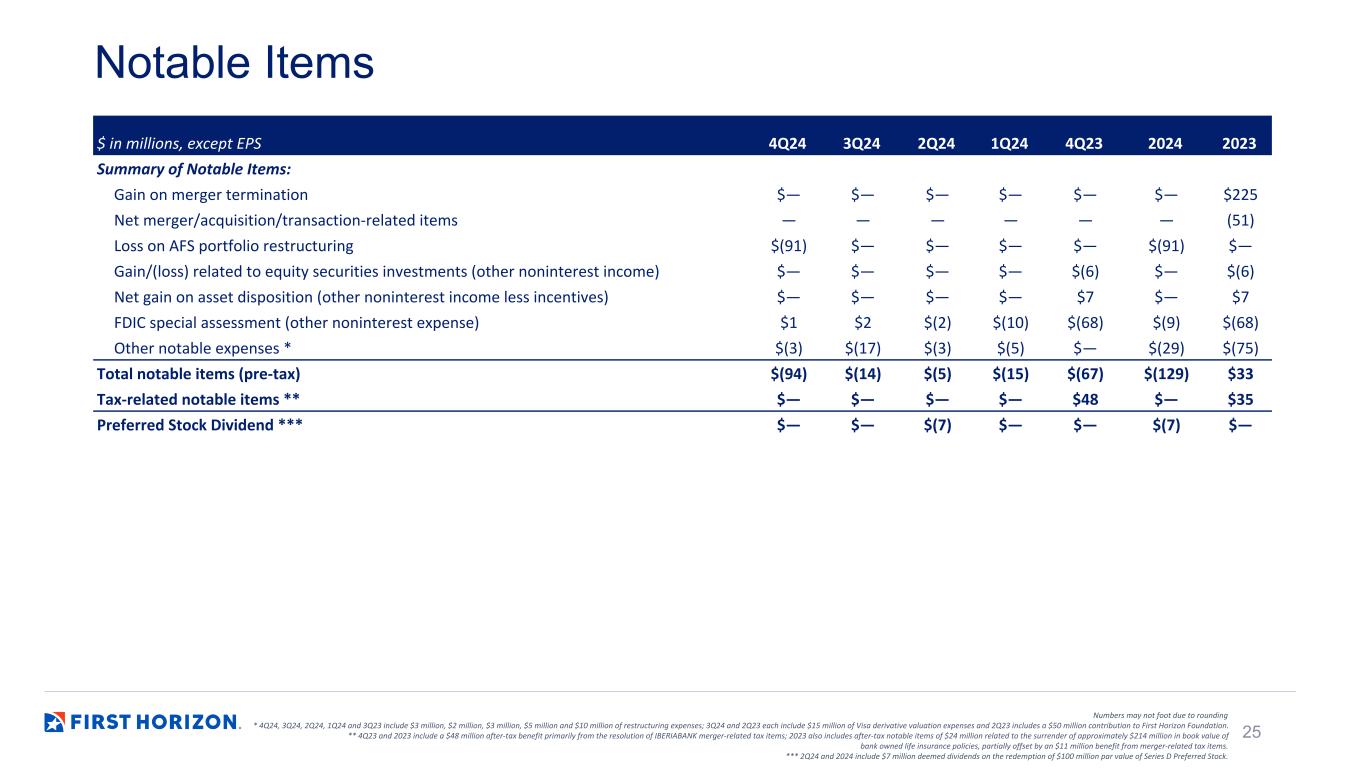
25 Notable Items Numbers may not foot due to rounding * 4Q24, 3Q24, 2Q24, 1Q24 and 3Q23 include $3 million, $2 million, $3 million, $5 million and $10 million of restructuring expenses; 3Q24 and 2Q23 each include $15 million of Visa derivative valuation expenses and 2Q23 includes a $50 million contribution to First Horizon Foundation. ** 4Q23 and 2023 include a $48 million after-tax benefit primarily from the resolution of IBERIABANK merger-related tax items; 2023 also includes after-tax notable items of $24 million related to the surrender of approximately $214 million in book value of bank owned life insurance policies, partially offset by an $11 million benefit from merger-related tax items. *** 2Q24 and 2024 include $7 million deemed dividends on the redemption of $100 million par value of Series D Preferred Stock. $ in millions, except EPS 4Q24 3Q24 2Q24 1Q24 4Q23 2024 2023 Summary of Notable Items: Gain on merger termination $— $— $— $— $— $— $225 Net merger/acquisition/transaction-related items — — — — — — (51) Loss on AFS portfolio restructuring $(91) $— $— $— $— $(91) $— Gain/(loss) related to equity securities investments (other noninterest income) $— $— $— $— $(6) $— $(6) Net gain on asset disposition (other noninterest income less incentives) $— $— $— $— $7 $— $7 FDIC special assessment (other noninterest expense) $1 $2 $(2) $(10) $(68) $(9) $(68) Other notable expenses * $(3) $(17) $(3) $(5) $— $(29) $(75) Total notable items (pre-tax) $(94) $(14) $(5) $(15) $(67) $(129) $33 Tax-related notable items ** $— $— $— $— $48 $— $35 Preferred Stock Dividend *** $— $— $(7) $— $— $(7) $—

26 Reconciliation to GAAP financials Slides in this presentation use non-GAAP information. That information is not presented according to generally accepted accounting principles (GAAP) and is reconciled to GAAP information below. (a) Adjusted for notable items as detailed on page 25. (b) Includes goodwill and other intangible assets, net of amortization. Numbers may not foot due to rounding. $s in millions, except per share data Quarterly, Unaudited 4Q24 3Q24 2Q24 1Q24 4Q23 2024 2023 Tangible Common Equity (non-GAAP) (A) Total equity (GAAP) $9,111 $9,316 $8,955 $9,173 $9,291 $9,111 $9,291 Less: Noncontrolling interest (a) 295 295 295 295 295 295 295 Less: Preferred stock (a) 426 426 426 520 520 426 520 (B) Total common equity $8,389 $8,595 $8,234 $8,358 $8,476 $8,389 $8,476 Less: Intangible assets (GAAP) (b) 1,653 1,663 1,674 1,685 1,696 1,653 1,696 (C) Tangible common equity (non-GAAP) $6,737 $6,931 $6,560 $6,673 $6,779 $6,737 $6,779 Tangible Assets (non-GAAP) (D) Total assets (GAAP) $82,152 $82,635 $82,230 $81,799 $81,661 $82,152 $81,661 Less: Intangible assets (GAAP) (b) 1,653 1,663 1,674 1,685 1,696 1,653 1,696 (E) Tangible assets (non-GAAP) $80,499 $80,971 $80,556 $80,114 $79,965 $80,499 $79,965 Period end Shares Outstanding (F) Period end shares outstanding 524 532 537 549 559 524 559 Ratios (A)/(D) Total equity to total assets (GAAP) 11.09% 11.27% 10.89% 11.21% 11.38% 11.09% 11.38% (C)/(E) Tangible common equity to tangible assets (“TCE/TA”) (non-GAAP) 8.37% 8.56% 8.14% 8.33% 8.48% 8.37% 8.48% (B)/(F) Book value per common share (GAAP) $16.00 $16.15 $15.34 $15.23 $15.17 $16.00 $15.17 (C)/(F) Tangible book value per common share (non-GAAP) $12.85 $13.02 $12.22 $12.16 $12.13 $12.85 $12.13

27 Reconciliation to GAAP financials Slides in this presentation use non-GAAP information. That information is not presented according to generally accepted accounting principles (GAAP) and is reconciled to GAAP information below. $s in millions Quarterly, Unaudited 4Q24 3Q24 2Q24 1Q24 4Q23 2024 2023 Adjusted Diluted EPS Net income available to common shareholders ("NIAC") (GAAP) a $158 $213 $184 $184 $175 $738 $865 Plus Total notable items (after-tax) (non-GAAP) (a) 71 11 11 12 3 105 (59) Adjusted net income available to common shareholders (non-GAAP) b $228 $224 $195 $196 $178 $843 $806 Diluted Shares (GAAP) c 534 538 547 558 561 544 562 Diluted EPS (GAAP) a/c $0.29 $0.40 $0.34 $0.33 $0.31 $1.36 $1.54 Adjusted diluted EPS (non-GAAP) b/c $0.43 $0.42 $0.36 $0.35 $0.32 $1.55 $1.43 Adjusted Net Income ("NI") and Adjusted Return on Assets ("ROA") Net Income ("NI") (GAAP) $170 $223 $204 $197 $188 $794 $915 Plus Relevant notable items (after-tax) (Non-GAAP) (a) $71 $11 $4 $12 $3 $97 $(59) Adjusted NI (Non-GAAP) $240 $234 $208 $209 $191 $891 $856 NI (annualized) (GAAP) d $675 $889 $820 $791 $746 $794 $915 Adjusted NI (annualized) (Non-GAAP) e $956 $932 $836 $838 $757 $891 $856 Average assets (GAAP) f $81,950 $82,366 $81,721 $81,243 $82,313 $81,822 $81,683 ROA (GAAP) d/f 0.82% 1.08% 1.00% 0.97% 0.91% 0.97% 1.12% Adjusted ROA (Non-GAAP) e/f 1.17% 1.13% 1.02% 1.03% 0.92% 1.09% 1.05% Return on Average Common Equity ("ROCE")/ Return on Average Tangible Common Equity ("ROTCE")/ Adjusted ROTCE NIAC (annualized) (GAAP) g $627 $849 $739 $739 $695 $738 $865 Adjusted NIAC (annualized) (Non-GAAP) h $907 $892 $785 $787 $706 $843 $806 Average Common Equity (GAAP) i $8,494 $8,407 $8,228 $8,436 $8,090 $8,391 $7,852 Intangible Assets (GAAP) (b) $1,658 $1,669 $1,680 $1,691 $1,702 1,674 $1,720 Average Tangible Common Equity (Non-GAAP) j $6,836 $6,738 $6,548 $6,745 $6,388 $6,717 $6,132 Equity Adjustment (Non-GAAP) — — — — — 20 (68) Adjusted Average Tangible Common Equity (Non-GAAP) k $6,836 $6,738 $6,548 $6,745 $6,388 $6,737 $6,064 ROCE (GAAP) g/i 7.38% 10.10% 8.98% 8.76% 8.60% 8.80% 11.01% ROTCE (Non-GAAP) g/j 9.17% 12.60% 11.29% 10.95% 10.89% 10.99% 14.10% Adjusted ROTCE (Non-GAAP) h/k 13.27% 13.24% 11.99% 11.65% 11.05% 12.51% 13.28% (a) Adjusted for notable items as detailed on page 25. (b) Includes goodwill and other intangible assets, net of amortization. Numbers may not foot due to rounding.

28 Reconciliation to GAAP financials Slides in this presentation use non-GAAP information. That information is not presented according to generally accepted accounting principles (GAAP) and is reconciled to GAAP information below. $s in millions Quarterly, Unaudited 4Q24 3Q24 2Q24 1Q24 4Q23 2024 2023 Adjusted Noninterest Income as a % of Total Revenue Noninterest income (GAAP) l $99 $200 $186 $194 $183 $679 $927 Plus notable items (pretax) (GAAP) (a) $91 $— $— $— $(4) $91 $(229) Adjusted noninterest income (Non-GAAP) m $190 $200 $186 $194 $179 $771 $699 Revenue (GAAP) n $729 $828 $815 $819 $800 $3,190 $3,467 Taxable-equivalent adjustment $4 $4 $4 $4 $4 $16 $16 Revenue- Taxable-equivalent (Non-GAAP) $732 $832 $819 $823 $804 $3,206 $3,483 Plus notable items (pretax) (GAAP) (a) $91 $— $— $— $(4) $91 $(229) Adjusted revenue (Non-GAAP) o $824 $832 $819 $823 $800 $3,297 $3,254 Securities gains/(losses) (GAAP) p $(91) $1 $1 $— $(5) $(89) $(4) Noninterest income as a % of total revenue (GAAP) (l-p)/ (n-p) 23.20% 24.06% 22.75% 23.72% 23.33% 23.44% 26.83% Adjusted noninterest income as a % of total revenue (Non-GAAP) m/o 23.10% 23.95% 22.64% 23.61% 22.32% 23.33% 21.43% Adjusted Efficiency Ratio Noninterest expense (GAAP) q $508 $511 $500 $515 $572 $2,035 $2,080 Plus notable items (pretax) (GAAP) (a) (2) (14) (5) (15) (70) (37) (196) Adjusted noninterest expense (Non-GAAP) r $506 $497 $495 $500 $502 $1,998 $1,884 Revenue (GAAP) s $729 $828 $815 $819 $800 $3,190 $3,467 Taxable-equivalent adjustment 4 4 4 4 4 16 16 Revenue- Taxable-equivalent (Non-GAAP) 732 832 819 823 804 3,206 3,483 Plus notable items (pretax) (GAAP) (a) 91 — — — (4) 91 (229) Adjusted revenue (Non-GAAP) t $824 $832 $819 $823 $800 $3,297 $3,254 Securities gains/(losses) (GAAP) u $(91) $1 $1 $— $(5) $(89) $(4) Efficiency ratio (GAAP) q/(s-u) 61.98% 61.89% 61.44% 62.92% 71.14% 62.06% 59.91% Adjusted efficiency ratio (Non-GAAP) r/t 61.43% 59.86% 60.47% 60.78% 62.84% 60.64% 57.93% (a) Adjusted for notable items as detailed on page 25. Numbers may not foot due to rounding.
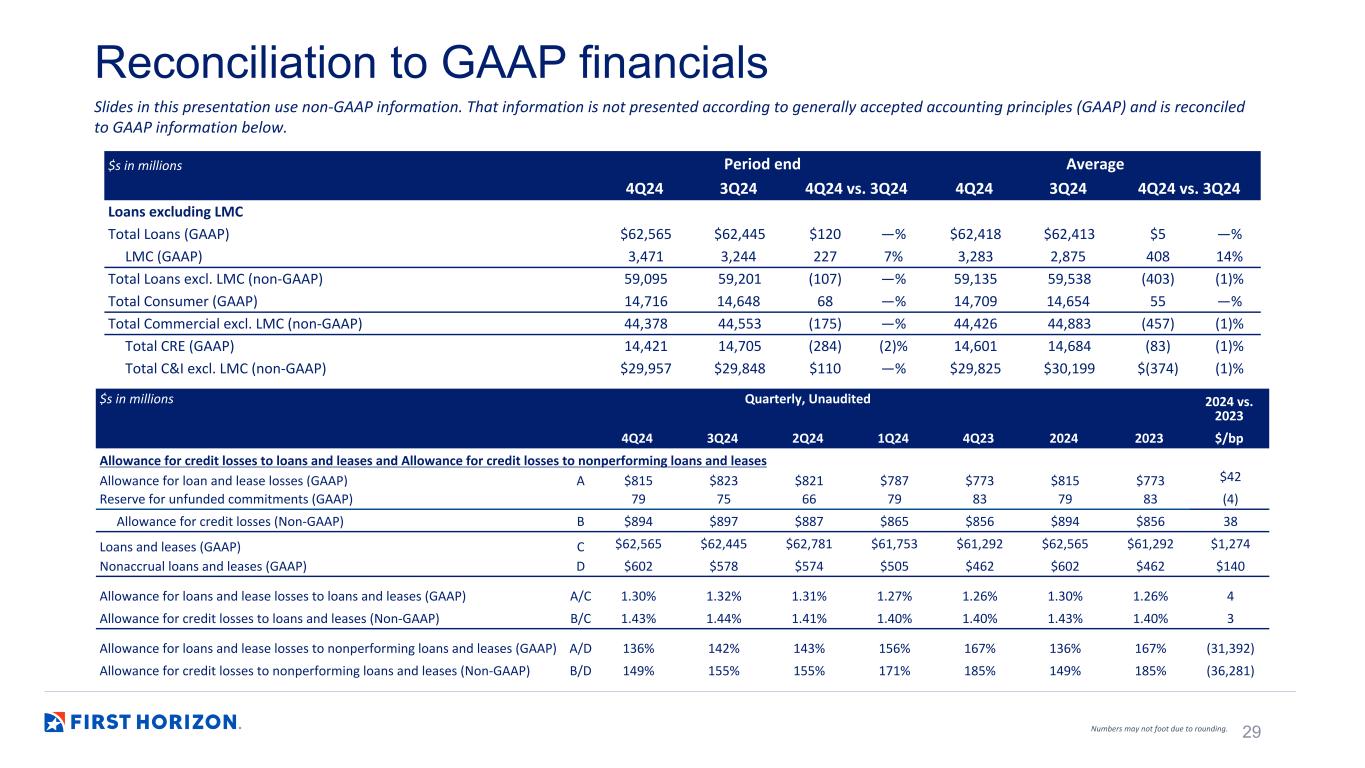
29 Reconciliation to GAAP financials Slides in this presentation use non-GAAP information. That information is not presented according to generally accepted accounting principles (GAAP) and is reconciled to GAAP information below. $s in millions Period end Average 4Q24 3Q24 4Q24 vs. 3Q24 4Q24 3Q24 4Q24 vs. 3Q24 Loans excluding LMC Total Loans (GAAP) $62,565 $62,445 $120 —% $62,418 $62,413 $5 —% LMC (GAAP) 3,471 3,244 227 7% 3,283 2,875 408 14% Total Loans excl. LMC (non-GAAP) 59,095 59,201 (107) —% 59,135 59,538 (403) (1)% Total Consumer (GAAP) 14,716 14,648 68 —% 14,709 14,654 55 —% Total Commercial excl. LMC (non-GAAP) 44,378 44,553 (175) —% 44,426 44,883 (457) (1)% Total CRE (GAAP) 14,421 14,705 (284) (2)% 14,601 14,684 (83) (1)% Total C&I excl. LMC (non-GAAP) $29,957 $29,848 $110 —% $29,825 $30,199 $(374) (1)% $s in millions Quarterly, Unaudited 2024 vs. 2023 4Q24 3Q24 2Q24 1Q24 4Q23 2024 2023 $/bp Allowance for credit losses to loans and leases and Allowance for credit losses to nonperforming loans and leases Allowance for loan and lease losses (GAAP) A $815 $823 $821 $787 $773 $815 $773 $42 Reserve for unfunded commitments (GAAP) 79 75 66 79 83 79 83 (4) Allowance for credit losses (Non-GAAP) B $894 $897 $887 $865 $856 $894 $856 38 Loans and leases (GAAP) C $62,565 $62,445 $62,781 $61,753 $61,292 $62,565 $61,292 $1,274 Nonaccrual loans and leases (GAAP) D $602 $578 $574 $505 $462 $602 $462 $140 Allowance for loans and lease losses to loans and leases (GAAP) A/C 1.30% 1.32% 1.31% 1.27% 1.26% 1.30% 1.26% 4 Allowance for credit losses to loans and leases (Non-GAAP) B/C 1.43% 1.44% 1.41% 1.40% 1.40% 1.43% 1.40% 3 Allowance for loans and lease losses to nonperforming loans and leases (GAAP) A/D 136% 142% 143% 156% 167% 136% 167% (31,392) Allowance for credit losses to nonperforming loans and leases (Non-GAAP) B/D 149% 155% 155% 171% 185% 149% 185% (36,281) Numbers may not foot due to rounding.
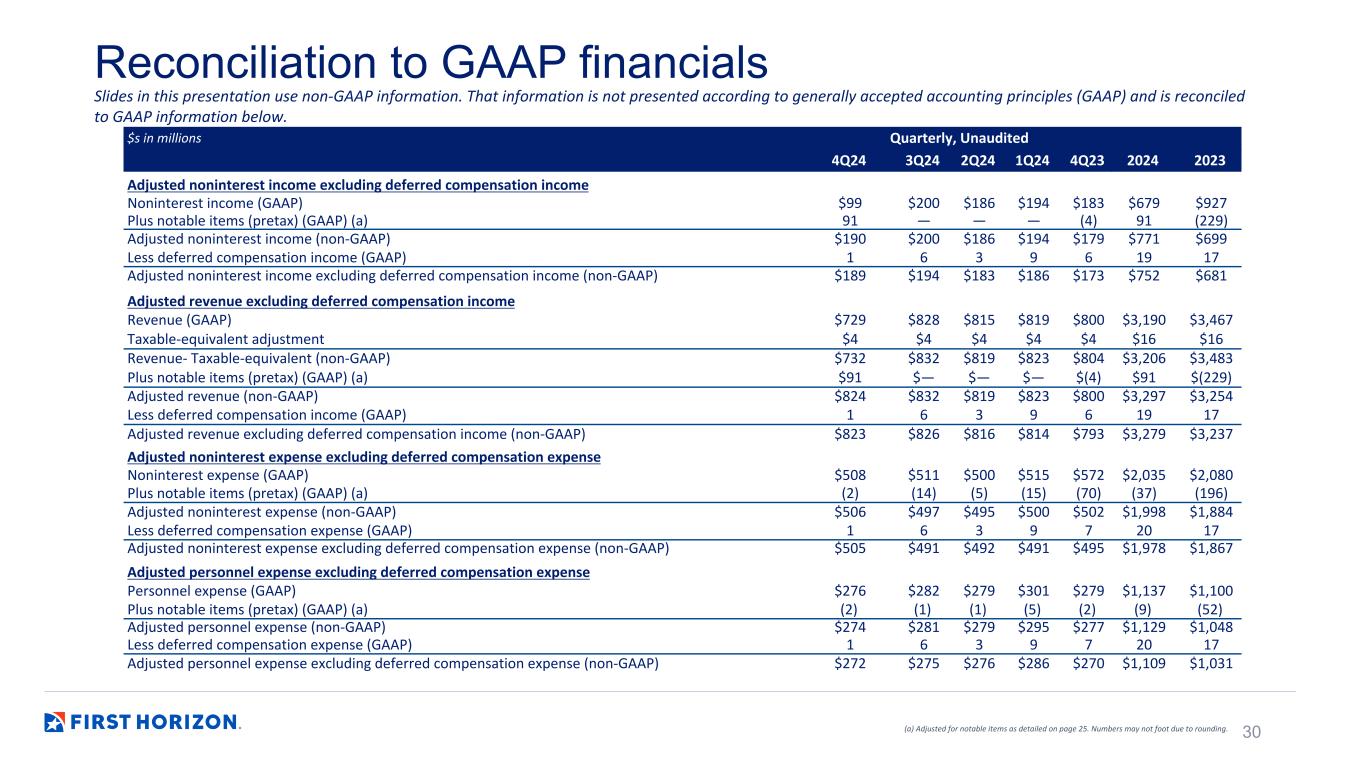
30 Reconciliation to GAAP financials Slides in this presentation use non-GAAP information. That information is not presented according to generally accepted accounting principles (GAAP) and is reconciled to GAAP information below. (a) Adjusted for notable items as detailed on page 25. Numbers may not foot due to rounding. $s in millions Quarterly, Unaudited 4Q24 3Q24 2Q24 1Q24 4Q23 2024 2023 Adjusted noninterest income excluding deferred compensation income Noninterest income (GAAP) $99 $200 $186 $194 $183 $679 $927 Plus notable items (pretax) (GAAP) (a) 91 — — — (4) 91 (229) Adjusted noninterest income (non-GAAP) $190 $200 $186 $194 $179 $771 $699 Less deferred compensation income (GAAP) 1 6 3 9 6 19 17 Adjusted noninterest income excluding deferred compensation income (non-GAAP) $189 $194 $183 $186 $173 $752 $681 Adjusted revenue excluding deferred compensation income Revenue (GAAP) $729 $828 $815 $819 $800 $3,190 $3,467 Taxable-equivalent adjustment $4 $4 $4 $4 $4 $16 $16 Revenue- Taxable-equivalent (non-GAAP) $732 $832 $819 $823 $804 $3,206 $3,483 Plus notable items (pretax) (GAAP) (a) $91 $— $— $— $(4) $91 $(229) Adjusted revenue (non-GAAP) $824 $832 $819 $823 $800 $3,297 $3,254 Less deferred compensation income (GAAP) 1 6 3 9 6 19 17 Adjusted revenue excluding deferred compensation income (non-GAAP) $823 $826 $816 $814 $793 $3,279 $3,237 Adjusted noninterest expense excluding deferred compensation expense Noninterest expense (GAAP) $508 $511 $500 $515 $572 $2,035 $2,080 Plus notable items (pretax) (GAAP) (a) (2) (14) (5) (15) (70) (37) (196) Adjusted noninterest expense (non-GAAP) $506 $497 $495 $500 $502 $1,998 $1,884 Less deferred compensation expense (GAAP) 1 6 3 9 7 20 17 Adjusted noninterest expense excluding deferred compensation expense (non-GAAP) $505 $491 $492 $491 $495 $1,978 $1,867 Adjusted personnel expense excluding deferred compensation expense Personnel expense (GAAP) $276 $282 $279 $301 $279 $1,137 $1,100 Plus notable items (pretax) (GAAP) (a) (2) (1) (1) (5) (2) (9) (52) Adjusted personnel expense (non-GAAP) $274 $281 $279 $295 $277 $1,129 $1,048 Less deferred compensation expense (GAAP) 1 6 3 9 7 20 17 Adjusted personnel expense excluding deferred compensation expense (non-GAAP) $272 $275 $276 $286 $270 $1,109 $1,031

31 Reconciliation to GAAP financials Slides in this presentation use non-GAAP information. That information is not presented according to generally accepted accounting principles (GAAP) and is reconciled to GAAP information below. $s in millions 20242019 2020 2021 2022 2023 Adjusted Pre-provision Net Revenue (PPNR) Pre-tax Income (GAAP) $586 $933 $1,284 $1,159 $1,128 $1,005 Provision Expense (GAAP) 45 503 (310) 95 260 150 Total PPNR (non-GAAP) $631 $1,436 $974 $1,254 $1,388 $1,155 Taxable-equivalent adjustment (9) (11) (12) (13) (16) (16) Notable Items (GAAP) (a) (114) 363 (235) (107) 33 (129) Adjusted PPNR (non-GAAP) $754 $1,084 $1,222 $1,374 $1,370 $1,299 (a) Adjusted for notable items as detailed on page 25. Numbers may not foot due to rounding. Notable items can be found in the appendices of earnings releases in previously furnished 8-K filings related to the periods shown. $s in millions Quarterly, Unaudited 4Q24 3Q24 2Q24 1Q24 4Q23 Adjusted Pre-provision Net Revenue (PPNR) Pre-tax income (GAAP) $ 210 $ 281 $ 260 $ 254 $ 177 Plus notable items (pretax) (GAAP) (a) 94 14 5 15 67 Adjusted Pre-tax income (non-GAAP) $ 304 $ 296 $ 265 $ 269 $ 244 Plus provision expense (GAAP) 10 35 55 50 50 Adjusted Pre-provision net revenue (PPNR) (non-GAAP) $ 314 $ 331 $ 320 $ 319 $ 294 Taxable-equivalent adjustment 4 4 4 4 4 Pre-provision net revenue-Taxable-equivalent (non-GAAP) $ 318 $ 335 $ 324 $ 323 $ 298


