EXHIBIT 13
FINANCIAL INFORMATION AND DISCUSSION
TABLE OF CONTENTS
FIRST HORIZON NATIONAL CORPORATION
SELECTED FINANCIAL AND OPERATING DATA
| | | | | | | | | | | | |
(Dollars in millions except per share data) | | 2008 | | 2007 | | 2006 | | 2005 | | 2004 | | 2003 |
|
Income/(loss) from continuing operations | | | $ | | (192.9 | ) | | | | $ | | (174.9 | ) | | | | $ | | 250.8 | | | | $ | | 410.7 | | | | $ | | 430.1 | | | | $ | | 445.2 | |
Income from discontinued operations, net of tax | | | | 0.9 | | | | | 4.8 | | | | | 210.8 | | | | | 17.1 | | | | | 15.6 | | | | | 7.4 | |
Income/(loss) before cumulative effect of changes in
accounting principle | | | | (192.0 | ) | | | | | (170.1 | ) | | | | | 461.6 | | | | | 427.8 | | | | | 445.7 | | | | | 452.6 | |
Cumulative effect of changes in accounting principle, net of tax | | | | - | | | | | - | | | | | 1.3 | | | | | (3.1 | ) | | | | | - | | | | | - | |
Net income/(loss) | | | | (192.0 | ) | | | | | (170.1 | ) | | | | | 462.9 | | | | | 424.7 | | | | | 445.7 | | | | | 452.6 | |
Income/(loss) available to common shareholders | | | | (199.4 | ) | | | | | (170.1 | ) | | | | | 462.9 | | | | | 424.7 | | | | | 445.7 | | | | | 452.6 | |
|
Common Stock Data | | | | | | | | | | | | |
Earnings/(loss) per common share from continuing operations | | | $ | | (1.11 | ) | | | | $ | | (1.32 | ) | | | | $ | | 1.92 | | | | $ | | 3.12 | | | | $ | | 3.29 | | | | $ | | 3.35 | |
Earnings/(loss) per common share | | | | (1.10 | ) | | | | | (1.29 | ) | | | | | 3.54 | | | | | 3.22 | | | | | 3.40 | | | | | 3.40 | |
Diluted earnings/(loss) per common share from continuing operations | | | | (1.11 | ) | | | | | (1.32 | ) | | | | | 1.87 | | | | | 3.02 | | | | | 3.19 | | | | | 3.24 | |
Diluted earnings/(loss) per common share | | | | (1.10 | ) | | | | | (1.29 | ) | | | | | 3.45 | | | | | 3.12 | | | | | 3.31 | | | | | 3.29 | |
Cash dividends declared per common share | | | | .38 | | | | | 1.72 | | | | | 1.72 | | | | | 1.66 | | | | | 1.55 | | | | | 1.24 | |
Year-end book value per common share | | | | 12.13 | | | | | 16.03 | | | | | 18.68 | | | | | 17.59 | | | | | 15.87 | | | | | 14.54 | |
Closing price of common stock per share: | | | | | | | | | | | | |
High | | | | 21.07 | | | | | 43.00 | | | | | 40.74 | | | | | 42.45 | | | | | 45.74 | | | | | 45.71 | |
Low | | | | 4.80 | | | | | 17.15 | | | | | 35.44 | | | | | 33.47 | | | | | 39.63 | | | | | 34.43 | |
Year-end | | | | 10.57 | | | | | 17.29 | | | | | 39.81 | | | | | 36.63 | | | | | 41.07 | | | | | 42.02 | |
Cash dividends per common share/year-end closing price | | | | 3.6 | % | | | | | 9.9 | % | | | | | 4.3 | % | | | | | 4.5 | % | | | | | 3.8 | % | | | | | 2.9 | % | |
Cash dividends per common share/diluted earnings per common share | | | | NM | | | | | NM | | | | | 49.7 | % | | | | | 53.1 | % | | | | | 46.9 | % | | | | | 37.6 | % | |
Price/earnings ratio | | | | NM | | | | | NM | | | | | 11.5 | x | | | | | 11.7 | x | | | | | 12.4 | x | | | | | 12.7 | x | |
Market capitalization | | | $ | | 2,175.5 | | | | $ | | 2,303.8 | | | | $ | | 5,246.4 | | | | $ | | 4,888.7 | | | | $ | | 5,368.0 | | | | $ | | 5,552.0 | |
Average shares (thousands) | | | | 180,711 | | | | | 132,078 | | | | | 130,619 | | | | | 131,692 | | | | | 130,911 | | | | | 133,046 | |
Average diluted shares (thousands) | | | | 180,711 | | | | | 132,078 | | | | | 134,321 | | | | | 136,134 | | | | | 134,818 | | | | | 137,361 | |
Period-end shares outstanding (thousands) | | | | 205,283 | | | | | 132,627 | | | | | 131,053 | | | | | 132,476 | | | | | 129,653 | | | | | 131,019 | |
Volume of shares traded (thousands) | | | | 1,394,389 | | | | | 486,219 | | | | | 184,886 | | | | | 170,258 | | | | | 181,757 | | | | | 185,274 | |
|
Selected Average Balances | | | | | | | | | | | | |
Total assets | | | $ | | 34,422.7 | | | | $ | | 38,175.4 | | | | $ | | 38,764.6 | | | | $ | | 36,560.4 | | | | $ | �� | 27,305.8 | | | | $ | | 25,133.6 | |
Total assets – divestiture | | | | 182.3 | | | | | 123.1 | | | | | - | | | | | - | | | | | - | | | | | - | |
Total loans, net of unearned income | | | | 21,660.7 | | | | | 22,106.7 | | | | | 21,504.2 | | | | | 18,334.7 | | | | | 15,440.5 | | | | | 12,679.8 | |
Total loans held for sale – divestiture | | | | 110.4 | | | | | 117.8 | | | | | - | | | | | - | | | | | - | | | | | - | |
Investment securities | | | | 2,964.0 | | | | | 3,380.2 | | | | | 3,481.5 | | | | | 2,906.2 | | | | | 2,471.1 | | | | | 2,563.5 | |
Earning assets | | | | 30,426.2 | | | | | 33,405.4 | | | | | 34,042.3 | | | | | 31,976.2 | | | | | 23,740.3 | | | | | 21,347.5 | |
Deposits | | | | 14,920.9 | | | | | 20,313.8 | | | | | 22,751.7 | | | | | 23,015.8 | | | | | 17,635.5 | | | | | 16,111.6 | |
Total deposits – divestiture | | | | 48.8 | | | | | 95.3 | | | | | - | | | | | - | | | | | - | | | | | - | |
Long-term debt | | | | 6,108.6 | | | | | 6,567.7 | | | | | 5,062.4 | | | | | 2,560.1 | | | | | 2,248.0 | | | | | 1,342.9 | |
Shareholders’ equity | | | | 2,635.4 | | | | | 2,423.5 | | | | | 2,423.0 | | | | | 2,177.0 | | | | | 1,937.7 | | | | | 1,829.4 | |
|
Selected Period-End Balances | | | | | | | | | | | | |
Total assets | | | $ | | 31,022.0 | | | | $ | | 37,015.5 | | | | $ | | 37,918.3 | | | | $ | | 36,579.1 | | | | $ | | 29,771.7 | | | | $ | | 24,506.7 | |
Total assets – divestiture | | | | - | | | | | 305.7 | | | | | - | | | | | - | | | | | - | | | | | - | |
Total loans, net of unearned income | | | | 21,278.2 | | | | | 22,103.5 | | | | | 22,104.9 | | | | | 20,612.0 | | | | | 16,441.9 | | | | | 14,021.3 | |
Total loans held for sale – divestiture | | | | - | | | | | 289.9 | | | | | - | | | | | - | | | | | - | | | | | - | |
Investment securities | | | | 3,125.2 | | | | | 3,032.8 | | | | | 3,923.5 | | | | | 2,941.2 | | | | | 2,704.6 | | | | | 2,491.1 | |
Earning assets | | | | 26,895.9 | | | | | 31,785.6 | | | | | 32,353.3 | | | | | 31,606.7 | | | | | 25,975.9 | | | | | 20,641.8 | |
Deposits | | | | 14,241.8 | | | | | 17,032.3 | | | | | 20,213.2 | | | | | 23,317.6 | | | | | 19,757.0 | | | | | 15,855.4 | |
Total deposits – divestiture | | | | - | | | | | 230.4 | | | | | - | | | | | - | | | | | - | | | | | - | |
Long-term debt | | | | 4,767.7 | | | | | 6,828.4 | | | | | 5,836.4 | | | | | 3,437.6 | | | | | 2,616.4 | | | | | 1,726.8 | |
Shareholders’ equity | | | | 3,279.5 | | | | | 2,135.6 | | | | | 2,462.4 | | | | | 2,347.5 | | | | | 2,074.1 | | | | | 1,921.6 | |
|
Selected Ratios | | | | | | | | | | | | |
Return on average common shareholders’ equity from continuing operations | | | | (7.90 | )% | | | | | (7.22 | )% | | | | | 10.35 | % | | | | | 18.87 | % | | | | | 22.19 | % | | | | | 24.34 | % | |
Return on average common shareholders’ equity before cumulative effect of changes in accounting principle | | | | (7.87 | ) | | | | | (7.02 | ) | | | | | 19.05 | | | | | 19.65 | | | | | 23.00 | | | | | 24.74 | |
Return on average common shareholders’ equity | | | | (7.87 | ) | | | | | (7.02 | ) | | | | | 19.11 | | | | | 19.51 | | | | | 23.00 | | | | | 24.74 | |
Return on average assets from continuing operations | | | | (.56 | ) | | | | | (.46 | ) | | | | | .65 | | | | | 1.12 | | | | | 1.58 | | | | | 1.77 | |
Return on average assets before cumulative effect of changes in accounting principle | | | | (.56 | ) | | | | | (.45 | ) | | | | | 1.19 | | | | | 1.17 | | | | | 1.63 | | | | | 1.80 | |
Return on average assets | | | | (.56 | ) | | | | | (.45 | ) | | | | | 1.19 | | | | | 1.16 | | | | | 1.63 | | | | | 1.80 | |
Net interest margin | | | | 2.95 | | | | | 2.82 | | | | | 2.93 | | | | | 3.08 | | | | | 3.61 | | | | | 3.78 | |
Allowance for loan losses to loans | | | | 3.99 | | | | | 1.55 | | | | | .98 | | | | | .92 | | | | | .96 | | | | | 1.14 | |
Net charge-offs to average loans | | | | 2.64 | | | | | .60 | | | | | .26 | | | | | .20 | | | | | .27 | | | | | .54 | |
Period-end shareholders’ equity to period-end assets | | | | 10.57 | | | | | 5.77 | | | | | 6.49 | | | | | 6.42 | | | | | 6.97 | | | | | 7.84 | |
Average tangible equity to average tangible assets | | | | 7.00 | | | | | 5.56 | | | | | 5.39 | | | | | 4.97 | | | | | 6.36 | | | | | 6.48 | |
|
NM - not meaningful
See accompanying notes to consolidated financial statements.
Certain previously reported amounts have been reclassified to agree with current presentation.
2
FIRST HORIZON NATIONAL CORPORATION
FIRST HORIZON NATIONAL CORPORATION
MANAGEMENT’S DISCUSSION AND ANALYSIS OF RESULTS OF OPERATIONS AND FINANCIAL CONDITION
GENERAL INFORMATION
From a small community bank chartered in 1864, First Horizon National Corporation (FHN) has grown to be one of the 40 largest bank holding companies in the United States in terms of asset size.
FHN’s 6,000 employees provide financial services through more than 200 bank locations in and around Tennessee and 19 capital markets offices in the U.S. and abroad.
The corporation’s two major brands – First Tennessee and FTN Financial – provide customers with a broad range of products and services. First Tennessee has the leading combined deposit market share in the 17 Tennessee counties where it does business and one of the highest customer retention rates of any bank in the country. FTN Financial (FTNF) is an industry leader in fixed income sales, trading and strategies for institutional clients in the U.S. and abroad.
AARP and Working Mother magazine have recognized FHN as one of the nation’s best employers.
In first quarter 2008, FHN revised its business line segments to better align with its strategic direction, representing a focus on its regional banking franchise and capital markets business. To implement this change, the prior Retail/Commercial Banking segment was split into its major components with the national portions of consumer lending and construction lending assigned to a new National Specialty Lending segment that more appropriately reflects the ongoing wind down of these businesses. Additionally, correspondent banking was shifted from Retail/Commercial Banking to the Capital Markets segment to better represent the complementary nature of these businesses. To reflect its geographic focus, the remaining portions of the Retail/Commercial Banking segment now represent the new Regional Banking segment. All prior period information has been revised to conform to the current segment structure and the business line reviews below are based on the new segment presentation.
|
• | | | | Regional Banking offers financial products and services, including traditional lending and deposit-taking, to retail and commercial customers in Tennessee and surrounding markets. Additionally, Regional Banking provides investments, insurance, financial planning, trust services and asset management, credit card, cash management, and check clearing services. On March 1, 2006, FHN sold its national merchant processing business. The continuing effects of the divestiture, which is included in the Regional Banking segment, are being accounted for as a discontinued operation. |
|
• | | | | Capital Markets provides a broad spectrum of financial services for the investment and banking communities through the integration of traditional capital markets securities activities, equity research, loan sales, portfolio advisory services, structured finance and correspondent banking services. |
|
• | | | | National Specialty Lending consists of traditional consumer and construction lending activities outside the regional banking footprint. In January 2008, FHN announced the discontinuation of national home builder and commercial real estate lending through its First Horizon Construction Lending offices. |
|
• | | | | Mortgage Banking now consists of the origination of mortgage loans in and around the regional banking footprint and servicing activities related to the remaining portfolio. Historically, this division provided mortgage loans and servicing to consumers and operated in approximately 40 states. On August 31, 2008, FHN completed the sale of its servicing platform, origination offices outside Tennessee, and $19.1 billion in unpaid principal balance of the servicing portfolio to MetLife Bank, N.A., (MetLife). |
|
• | | | | Corporate consists of unallocated corporate expenses including restructuring, repositioning, and efficiency initiatives, gains and losses on repurchases of debt, expense on subordinated debt issuances and preferred stock, bank-owned life insurance, unallocated interest income associated with excess equity, net impact of raising incremental capital, revenue and expense associated with deferred compensation plans, funds management and venture capital. |
3
FIRST HORIZON NATIONAL CORPORATION
For the purpose of this management’s discussion and analysis (MD&A), earning assets have been expressed as averages, unless otherwise noted, and loans have been disclosed net of unearned income. The following financial discussion should be read with the accompanying consolidated financial statements and notes. A glossary is included at the end of the MD&A to assist with terminology.
FORWARD-LOOKING STATEMENTS
This MD&A contains forward-looking statements with respect to FHN’s beliefs, plans, goals, expectations, and estimates. Forward-looking statements are statements that are not a representation of historical information but rather are related to future operations, strategies, financial results or other developments. The words “believe,” “expect,” “anticipate,” “intend,” “estimate,” “should,” “is likely,” “will,” "going forward," and other expressions that indicate future events and trends identify forward-looking statements. Forward-looking statements are necessarily based upon estimates and assumptions that are inherently subject to significant business, operational, economic and competitive uncertainties and contingencies, many of which are beyond a company’s control, and many of which, with respect to future business decisions and actions (including acquisitions and divestitures), are subject to change. Examples of uncertainties and contingencies include, among other important factors, general and local economic and business conditions; recession or other economic downturns, expectations of and actual timing and amount of interest rate movements, including the slope of the yield curve (which can have a significant impact on a financial services institution); market and monetary fluctuations; inflation or deflation; customer and investor responses to these conditions; the financial condition of borrowers and other counterparties; competition within and outside the financial services industry; geopolitical developments including possible terrorist activity; recent and future legislative and regulatory developments; natural disasters; effectiveness of FHN’s hedging practices; technology; demand for FHN’s product offerings; new products and services in the industries in which FHN operates; and critical accounting estimates. Other factors are those inherent in originating, selling and servicing loans including prepayment risks, pricing concessions, fluctuation in U.S. housing prices, fluctuation of collateral values, and changes in customer profiles. Additionally, the actions of the Securities and Exchange Commission (SEC), the Financial Accounting Standards Board (FASB), the Office of the Comptroller of the Currency (OCC), the Board of Governors of the Federal Reserve System (Federal Reserve), Financial Industry Regulatory Authority (FINRA), U.S. Department of the Treasury (UST), and other regulators and agencies; regulatory and judicial proceedings and changes in laws and regulations applicable to FHN; and FHN’s success in executing its business plans and strategies and managing the risks involved in the foregoing, could cause actual results to differ. FHN assumes no obligation to update any forward-looking statements that are made from time to time. Actual results could differ because of several factors, including those presented in this Forward-Looking Statements section, in other sections of this MD&A, in Item 1A of FHN’s 2008 annual report on Form 10-K, and in other parts of that annual report.
FINANCIAL SUMMARY
For 2008 FHN reported a net loss available to common shareholders of $199.4 million, or $1.10 diluted loss per share compared to a loss of $170.1 million, or $1.29 diluted loss per share in 2007.
Comparisons between reported earnings are directly and significantly affected by a number of factors in both 2008 and 2007. Several significant items including increased provisioning, housing and credit market disruptions, and restructuring, repositioning and efficiency initiatives impacted FHN’s performance in 2008 and 2007.
The results of operations for 2008 were significantly impacted by real estate, credit market, and economic conditions which began during the latter half of 2007. The economic downturn was initially confined to the real estate and credit markets. Tightened credit and a large supply of available real estate negatively impacted collateral values. The impact on FHN was originally limited to high-risk portfolios in certain geographic regions. However, as general economic conditions also declined, credit issues began to surface in other portfolios. Commercial credits were impacted by the difficult business environment in 2008 and consumer portfolios were impacted by stressed consumer financial circumstances. With financial institutions’ reluctance to lend and increased difficulty of obtaining low cost funding, the U.S. Government, through the Treasury Department (UST), administered the Capital Purchase Program (CPP), among other programs, for the purpose of bolstering confidence in financial institutions
4
FIRST HORIZON NATIONAL CORPORATION
and reestablishing the availability of credit in the marketplace. While the lending and credit environment was extremely difficult in 2008, favorable interest rate movements positively impacted certain areas of FHN.
The deterioration in the loan portfolios affected all segments. The national construction lending and national home equity portfolios, for which originations were curtailed in late 2007, are included in the National Specialty Lending segment. The credit deterioration of these portfolios, specifically the construction portfolios significantly affected provisioning and net charge-offs during 2008. The Regional Banking and Capital Markets segments were also impacted as the economy’s problems broadened. Commercial loans in the Regional Banking segment began to show stress in 2008 as commercial credits deteriorated and the portfolio experienced downward credit grading. Commercial loans in the Capital Markets segment, which include loans to banks, showed deterioration due to current stress in the financial system. In 2008, provision expense exceeded net charge-offs building the allowance for loan loss reserve.
Due to the tightening credit market and economic stress, the Federal Reserve Bank reduced its target federal funds rate to historical lows. The interest rate movements resulted in increased Capital Markets’ fixed income business and Mortgage Banking income. Hedging gains on mortgage servicing rights (MSR) more than compensated for fair value declines of MSR. The interest rate movements created opportunity for Capital Markets as customers repositioned fixed income portfolios. Due to credit market disruptions, no pooled trust preferred securities transactions were executed in 2008, effectively eliminating structured finance transaction revenue for Capital Markets for the year. Additionally, a lower of cost or market (LOCOM) charge was taken on trust preferred loans before they were moved to the loan portfolio in the second quarter.
Aside from external market factors, other events affected FHN’s 2008 performance. FHN continued efforts to refocus on its core businesses – Regional Banking and Capital Markets. A component of this effort was completed in the third quarter when FHN sold its national mortgage servicing platform and origination offices outside Tennessee and $19.1 billion in unpaid principal balance of its servicing portfolio to MetLife. FHN continues to originate mortgage loans in and around the Regional Banking market and continues to service, through sub-servicing arrangements, the remaining servicing portfolio. In the second quarter, FHN completed the divestitures of the First Horizon Bank branches which were those branches that operated outside of the core Regional Banking footprint. Performance was also affected by charges related to restructuring, repositioning and efficiency initiatives.
In 2008, FHN committed to build and conserve capital. In the second quarter, FHN completed the issuance of 69 million common shares which generated approximately $660 million of net cash proceeds. FHN also increased capital through participation in the U.S. Treasury’s CPP mentioned above. Preferred shares and a common stock warrant were issued to the UST for $866.5 million in cash proceeds. In an effort to conserve capital, the quarterly cash dividend was replaced with a quarterly stock dividend. Capital ratio improvements were also positively affected by balance sheet contraction of $6 billion in total assets.
Beginning in 2007 and continuing throughout 2008, FHN conducted an ongoing, company-wide review of business practices with the goal of improving overall profitability and productivity. In order to redeploy capital to higher-return businesses, origination through national construction lending operations was discontinued; FHN sold the national mortgage origination and servicing platforms, including servicing on $19.1 billion of unpaid principal balance; and the sale of the remaining First Horizon Bank branches was completed. Total net charges of $91.4 million were recognized in 2008 related to restructuring, repositioning and efficiency initiatives. See Table 1 and Note 27 for further details.
In 2007, a $55.7 million charge related to FHN’s contingent share of certain Visa legal matters negatively impacted results. In 2008, $30.0 million of this charge was reversed due to Visa Inc.’s funding of the escrow account. See Note 18 for further details on this matter.
Return on average common equity and return on average assets for 2008 were (7.87) percent and (.56) percent, respectively, compared to (7.02) percent and (.45) percent in 2007. Tangible common equity to tangible common assets ratio improved to 7.34 percent in 2008 from 5.13 percent in 2007. Tier 1 capital ratio was 15.03 percent as of December 31, 2008 compared to 8.12 percent on December 31, 2007. Total assets were $31.0 billion and shareholders’ equity was $3.3 billion on December 31, 2008, compared to $37.0 billion and $2.1 billion, respectively, on December 31, 2007.
5
FIRST HORIZON NATIONAL CORPORATION
FHN’s performance in 2007 was impacted by credit market disruptions, provisioning, restructuring, repositioning, and efficiency initiatives (including goodwill impairments on divested FH Bank), and a Mortgage Banking segment goodwill impairment. In 2007, the industry experienced high levels of adjustable rate loan defaults and severely curtailed demand in the secondary markets.
In 2007, widening credit spreads generated lower gain on sale margins in Mortgage Banking and resulted in lower asset values for those assets measured at fair value. HELOC and second-lien loan sales and securitizations were limited and fair value adjustments on residual values of prior securitizations and LOCOM adjustments on loans held for sale were taken. Capital Markets’ fees from structured finance, including fees from pooled trust preferred transactions, began to decline as investor demand for credit products weakened.
Provision was lower in 2007 than in 2008 as housing market deterioration did not begin until the latter half of 2007 and was largely confined to discontinued product structures in higher risk markets. Restructuring, repositioning, and efficiency initiatives resulted in $98.7 million of net charges. Also impacting 2007 performance was a $71.1 million goodwill impairment associated with the Mortgage Banking business segment.
BUSINESS LINE REVIEW
Regional Banking
The Regional Banking segment had a pre-tax loss of $125.2 million in 2008 compared to pre-tax income of $220.6 million in 2007. Total revenues decreased 9 percent, or $83.7 million, in 2008. The provision for loan losses increased to $328.8 million in 2008 from $62.6 million in 2007. This increase primarily reflects deterioration and downward credit grading of the commercial loan portfolio.
Net interest income decreased 12 percent to $480.7 million in 2008 from $547.2 million in 2007. The decrease in net interest income was primarily attributable to increased nonaccrual loans and the effects of increased competition for deposits. Net interest margin in Regional Banking was 4.36 percent in 2008 compared to 4.90 percent in 2007. The decrease was primarily driven by increased commercial nonaccrual loans and lower deposit spreads due to Federal Reserve rate reductions.
Noninterest income declined 5 percent, or $17.3 million, in 2008 to $350.1 million. Trust revenue decreased by $6.6 million from 2007 as the value of assets under management declined consistent with 2008 market declines. Miscellaneous income declined $6.5 million from $83.6 million in 2007 as FHN discontinued the sale of U.S. Mint licensed products and positive market adjustments on customer derivatives decreased. Other service charges declined $2.9 million, primarily driven by a decrease in mutual fund sales, while insurance commissions decreased $2.2 million due to a soft property and casualty market. Bank card fees declined $1.5 million as consumer spending decreased and resulted in lower interchange fees in 2008. Partially offsetting the above declines were increased deposit related service charges primarily driven by higher cash management fees as lower balances reduced associated customer earnings credits.
Noninterest expense declined slightly to $627.3 million in 2008 compared to $631.4 million in 2007. Increased personnel, infrastructure, credit-related costs, public relations and foreclosed property losses were more than offset by expense declines from efficiency initiatives.
Capital Markets
Pre-tax income increased from $70.4 million in 2007 to $112.7 million in 2008. Total revenues were $611.7 million in 2008 compared to $406.5 million in 2007.
Net interest income was $77.3 million in 2008 compared to $54.4 million in 2007. This increase is primarily attributable to a steeper yield curve and the effect of increases in the average trust preferred loan balance.
Income from fixed income sales increased to $493.8 million in 2008 from $217.7 million in 2007, reflecting an increase in activity during 2008 as the Federal Reserve aggressively lowered rates resulting in a steeper yield curve as compared to 2007. Other product revenues decreased to $40.6 million in 2008 compared to $134.5 million in
6
FIRST HORIZON NATIONAL CORPORATION
2007 as no pooled trust preferred transactions were executed in 2008 and a $36.2 million LOCOM adjustment was taken on the trust preferred warehouse before the loans were transferred to the portfolio. Revenues from other products include fee income from activities such as equity research, loan sales, portfolio advisory, structured finance, and correspondent banking services.
Provision expense was $80.1 million in 2008 compared to $8.1 million in 2007, primarily as a result of deterioration of commercial loans, including loans to banks, as the housing market and general economic decline impacted financial institutions to which FHN extended credit.
Noninterest expense increased 28 percent, or $90.9 million, to $418.9 million in 2008, primarily due to increased personnel costs related to higher production levels in 2008 compared to 2007.
Mortgage Banking
Effective August 31, 2008, FHN completed the sale of Mortgage Banking’s servicing operations, origination offices outside of Tennessee and servicing on loans with an outstanding principal balance of $19.1 billion to MetLife. As a result of this transaction, components of origination activity and operating expenses for 2008 are significantly lower when compared to 2007.
Pre-tax income was $201.4 million in 2008 compared to a pre-tax loss of $313.3 million in 2007. Total revenues increased by $465.8 million to $655.7 million in 2008.
Net interest income decreased slightly to $95.3 million in 2008 from $98.8 million in 2007 primarily due to lower loan volumes combined with lower spreads on reduced custodial deposit balances. In 2007, net interest income was favorably impacted by $15.7 million due to the reclassification of $175 million from excess mortgage servicing rights to trading securities in second quarter. This reclassification was the outcome of capital management initiatives which resulted in modification of the Pooling and Servicing Agreements (PSA) for private (non-GSE) securitizations which were active as of March 31, 2007. The modifications separated master servicing from retained yield. Offsetting the increase in net interest income was a decline in servicing fees and a decline in the change of mortgage servicing rights (MSR) value due to runoff. Provision expense increased to $29.1 million in 2008 from deterioration in the permanent mortgage portfolio.
Noninterest income increased to $560.3 million in 2008 compared to $91.1 million in 2007. Noninterest income consists primarily of mortgage banking-related revenue, net of costs, from the origination and sale of mortgage loans, fees from mortgage servicing, and changes in the fair value of MSR net of hedge gains or losses.
Mortgage loan origination volumes decreased to $17.4 billion in 2008 from $27.4 billion in 2007, as home purchase-related originations declined due to the August 2008 divestiture of national origination offices to MetLife. Net revenue from origination activity increased to $223.6 million from $118.4 million in 2007 reflecting the $142.2 million positive impact of adopting new accounting standards in 2008. Loans delivered into the secondary market decreased 24 percent to $19.9 billion from $26.3 billion. Gain on loan sale deliveries increased to $78.4 million despite decreased volume as 2007 was negatively impacted by credit market disruptions which affected pricing and dealer concessions. Gains in 2008 were negatively impacted by a $15.5 million adjustment to reflect revised cash flow expectations for mortgage origination activity. 2008 origination income was negatively impacted by a $15.2 million fair value adjustment of the remaining mortgage warehouse in the fourth quarter.
Through various servicing portfolio sales executed in 2008, including the $19.1 billion sale to MetLife in the third quarter, the unpaid principal balance (UPB) of the servicing portfolio decreased to $63.7 billion on December 31, 2008 from $103.7 billion on December 31, 2007. The sales reduced servicing rights assets by $485.8 million. Consistent with the decline in the servicing portfolio, total fees associated with mortgage servicing decreased 26 percent to $231.9 million from $311.4 million. Changes in the balance of MSR due to runoff positively impacted servicing income in 2008 by $109.7 million as the size of the portfolio declined. Changes in MSR value other than runoff (valuation model inputs or assumptions) negatively impacted net servicing revenues by $384.2 million in 2008 compared to $239.3 million in 2007 as lower interest rates increased prepayment speed model assumptions. Lower interest rates positively impacted servicing hedge gains by $548.8 million in 2008 compared to $73.2 million
7
FIRST HORIZON NATIONAL CORPORATION
in 2007 resulting in net servicing income of $292.0 million compared to a net servicing loss of $68.9 million in 2007.
Noninterest expense was $425.1 million in 2008 compared to $503.2 million in 2007. Noninterest expense in 2008 was negatively impacted by the immediate recognition of $121.8 million of origination costs previously deferred due to accounting for the mortgage warehouse at elected fair value and also by a $6.5 million charge for minimum fee guarantees on prior servicing sales. Offsetting this increase in noninterest expense was a decline due to the divestiture of certain mortgage banking operations in the third quarter 2008. Noninterest expense in 2007 was impacted by a goodwill impairment of $71.1 million and $8.4 million of expense related to a legal settlement.
National Specialty Lending
National Specialty Lending had a pre-tax loss of $559.3 million in 2008 compared to a pre-tax loss of $67.3 million in 2007. The pre-tax loss in 2008 is primarily a result of an increase in the provision for loan losses to $642.0 million in 2008 compared to $194.4 million in 2007 due to deterioration in the national construction lending and home equity portfolios.
Net interest income declined to $190.0 million in 2008 as compared to $243.9 million in 2007 as a result of the increase in nonaccrual construction loans and the continued contraction of loan portfolios from the wind-down of operations. Noninterest income was a loss of $10.2 million in 2008 compared to a gain of $21.3 million in 2007. The decrease is primarily due to market disruptions that began in 2007 which resulted in no second-lien or HELOC loan sales in 2008, an increase in HELOC residual write-downs, and a decrease in servicing fees resulting from pay downs and a smaller servicing portfolio. Noninterest expense was $97.2 million in 2008 compared to $138.1 million in 2007. Noninterest expense declined principally due to lower personnel costs related to the business wind-down initiated during first quarter 2008.
Corporate
The Corporate segment’s results yielded pre-tax income of $20.8 million in 2008 compared to a pre-tax loss of $226.0 million in 2007. Net interest income was $51.7 million in 2008 compared to a negative $3.6 million in 2007 as the common stock issuance reduced the need for higher cost short term funding. Noninterest income was $56.6 million in 2008 compared to $28.0 million in 2007. 2008 was positively impacted by a $65.9 million securities gain resulting from the redemption of Visa Inc.’s shares in conjunction with its IPO and $33.8 million of gains related to bank note repurchases. These items were partially offset by $31.7 million of restructuring related charges and a $30.6 million decrease in deferred compensation income (partially offset by a corresponding decrease in deferred compensation expense). Noninterest income in 2007 included $9.3 million of net gains related to restructuring initiatives and net security losses of $1.2 million.
Noninterest expense decreased to $87.5 million in 2008 from $242.7 million in 2007. The decrease was primarily attributable to a reversal of $30.0 million related to the Visa contingent liability for certain Visa legal matters ($55.7 million was initially recorded in 2007), a $40.6 million decrease related to restructuring charges, and a $39.3 million decrease in deferred compensation expense. (See Note 18, Contingencies and Other Disclosures for a detailed discussion surrounding FHN’s contingent liability for certain Visa legal matters.) The decrease in deferred compensation expense is partially offset by a $30.6 million decrease in deferred compensation income. Partially offsetting these declines was a $14.2 million increase in legal and professional fees primarily due to consulting fees.
RESTRUCTURING, REPOSITIONING, AND EFFICIENCY INITIATIVES
Beginning in 2007, FHN conducted a company-wide review of business practices with the goal of improving its overall profitability and productivity. In addition, during 2007 management announced its intention to sell 34 full-service First Horizon Bank branches in its national banking markets. These sales were completed in second quarter 2008. In the second half of 2007, FHN also took actions to right size First Horizon Home Loans’ mortgage banking operations and to downsize FHN’s national lending operations, in order to redeploy capital to higher-return businesses. As part of its strategy to reduce its national real estate portfolio, FHN announced in January 2008 that it was discontinuing national homebuilder and commercial real estate lending through its First Horizon Construction
8
FIRST HORIZON NATIONAL CORPORATION
Lending offices. Additionally, FHN initiated the repositioning of First Horizon Home Loans’ mortgage banking operations, which included sales of MSR in fourth quarter 2007 and the first, second and third quarters of 2008.
In June 2008, FHN announced that it had reached a definitive agreement with MetLife for the sale of more than 230 retail and wholesale mortgage origination offices nationwide as well as its loan origination and servicing platform. Effective August 31, 2008, the parties completed the initial settlement for MetLife’s acquisition of substantially all of FHN’s mortgage origination pipeline, related hedges, certain fixed assets and other associated assets. MetLife did not acquire any portion of FHN’s mortgage loan warehouse. First Horizon retained its mortgage operations in and around Tennessee, continuing to originate home loans for customers in its banking market footprint. FHN also agreed with MetLife for the sale of servicing assets and related hedges on $19.1 billion of first lien mortgage loans and associated custodial deposits. Additionally, FHN has entered into a subservicing agreement with MetLife for the remainder of FHN’s servicing portfolio. MetLife generally paid book value for the assets and liabilities it acquired, less a purchase price reduction. The assets and liabilities related to the mortgage operations divested were included in the Mortgage Banking segment and were reflected as “divestiture” on the Consolidated Statements of Condition for the reporting period ending June 30, 2008. In third quarter 2008, FHN recognized a loss on divestiture of $17.5 million related to this transaction which is included in the noninterest income section of the Consolidated Statements of Income as losses on divestitures. In fourth quarter 2008, the parties completed a post-closing true up which resulted in FHN recognizing a gain on divestiture of $0.9 million within its Consolidated Statements of Income.
Net costs recognized by FHN in the year ended December 31, 2008 related to restructuring, repositioning, and efficiency activities were $91.4 million. Of this amount, $49.1 million represented exit costs that were accounted for in accordance with Statement of Financial Accounting Standards No. 146, “Accounting for Costs Associated with Exit or Disposal Activities” (SFAS No. 146).
Significant expenses recognized in 2008 resulted from the following actions:
|
• | | | | Expense of $49.1 million associated with organizational and compensation changes due to right sizing operating segments, the divestiture of certain First Horizon Bank branches, the divestiture of certain mortgage banking operations and consolidating functional areas. |
|
• | | | | Loss of $16.6 million on the divestiture of mortgage banking operations. |
|
• | | | | Loss of $2.4 million from the sales of certain First Horizon Bank branches. |
|
• | | | | Transaction costs of $12.7 million from the contracted sales of mortgage servicing rights. |
|
• | | | | Expense of $10.7 million for the write-down of certain premises and equipment, intangibles and other assets resulting from FHN’s divestiture of certain mortgage operations and from the change in FHN’s national banking strategy. |
Net costs recognized by FHN in the year ended December 31, 2007 related to restructuring, repositioning, and efficiency activities were $98.7 million. Of this amount, $47.9 million represented exit costs accounted for in accordance with SFAS No. 146.
Significant expenses recognized in 2007 resulted from the following actions:
|
• | | | | Expense of $20.4 million associated with organizational and compensation changes for right sizing operating segments and consolidating functional areas. |
|
• | | | | Non-core business repositioning costs of $17.4 million, including costs associated with the exit of the collectible coin merchandising business and the transition of the non-prime mortgage origination business to a broker model. |
|
• | | | | Expense of $17.2 million related to other restructuring, repositioning, and efficiency initiatives, including facilities consolidation, procurement centralization, multi-sourcing and the divestiture of certain loan portfolios. |
|
• | | | | Costs of $24.3 million related to the divestiture of 34 full-service First Horizon Bank locations in Virginia, Maryland, Georgia, and Texas, including $13.9 million for the write-down of goodwill and other intangibles; partially offset by $15.7 million of gains realized in 2007 from the disposition of 15 of these locations. |
9
FIRST HORIZON NATIONAL CORPORATION
|
• | | | | Expense of $11.3 million related to the restructuring of mortgage operations through office closures, associated sales force decreases, and the reduction of management and support staff and downsizing of national lending operations through the reduction of consumer and construction sales forces and decreasing management, support staff and back-office costs. |
|
• | | | | Expense of $17.4 million for asset impairments related to the discontinuance of technology projects. |
|
• | | | | Transaction costs of $6.4 million from sales of mortgage servicing rights. |
Provision for loan losses of $7.7 million was incurred during 2007 in relation to the divestiture of a non-strategic loan portfolio. Losses from the mortgage banking divestiture and gains and losses from the disposition of the First Horizon Bank branches are included in gains/(losses) on divestitures in the noninterest income section of the Consolidated Statements of Income. Transaction costs related to transfers of mortgage servicing rights are recorded as a reduction of mortgage banking income in the noninterest income section of the Consolidated Statements of Income. All other costs associated with the restructuring, repositioning, and efficiency initiatives implemented by management are included in the noninterest expense section of the Consolidated Statements of Income, including severance and other employee-related costs recognized in relation to such initiatives which are recorded in employee compensation, incentives, and benefits, facilities consolidation costs and related asset impairment costs which are included in occupancy, costs associated with the impairment of premises and equipment which are included in equipment rentals, depreciation, and maintenance, and other costs associated with such initiatives, including professional fees, intangible asset impairment costs, and asset impairment costs related to the discontinuance of technology projects, which are included in all other expense and goodwill impairment.
Settlement of the obligations arising from current initiatives will be funded from operating cash flows. The effect of suspending depreciation on assets held for sale was immaterial to FHN’s results of operations for all periods. As a result of the change in FHN’s national banking strategy, a write-down of other intangibles of $2.4 million was recognized in first quarter 2008 related to certain banking licenses. As part of the divestiture of certain mortgage banking assets, an impairment of $1.7 million was recognized in second quarter 2008 related to noncompete agreements. The recognition of these impairment losses will have no effect on FHN’s debt covenants. The impairment loss related to such intangible assets was recorded as an unallocated corporate charge within the Corporate segment and is included in all other expense on the Consolidated Statements of Income. As a result of the restructuring, repositioning, and efficiency initiatives implemented to date by management, the effects of $175 million in aggregate annual pre-tax improvements were experienced by FHN beginning in its first quarter 2008 run-rate. An additional $70 million in pre-tax annual profitability improvements was experienced by the end of 2008 in relation to the First Horizon Bank branch divestitures and the restructuring of mortgage operations and national lending operations. Due to the broad nature of the actions being taken, all components of income and expense will be affected from the efficiency benefits.
Charges related to restructuring, repositioning, and efficiency initiatives for the twelve months ended December 31, 2008, and 2007 are presented in the following table based on the income statement line item affected. See Note 27 – Restructuring, Repositioning, and Efficiency Charges and Note 2 – Acquisitions/Divestitures for additional information.
10
FIRST HORIZON NATIONAL CORPORATION
Table 1 - Restructuring, Repositioning, and Efficiency Initiatives
| | | | |
(Dollars in thousands) | | 2008 | | 2007 |
|
Provision for loan losses related to divestiture of a loan portfolio | | | $ | | - | | | | $ | | 7,672 | |
Noninterest income: | | | | |
Mortgage banking | | | | (12,667 | ) | | | | | (6,428 | ) | |
Gains/(losses) on divestitures | | | | (19,019 | ) | | | | | 15,695 | |
|
Total noninterest income | | | | (31,686 | ) | | | | | 9,267 | |
|
Adjusted gross income after provision for loan losses | | | | (31,686 | ) | | | | | 1,595 | |
|
Noninterest expense: | | | | |
Employee compensation, incentives and benefits | | | | 24,418 | | | | | 25,665 | |
Occupancy | | | | 8,111 | | | | | 14,312 | |
Equipment rentals, depreciation and maintenance | | | | 4,340 | | | | | 6,524 | |
Legal and professional fees | | | | 4,342 | | | | | 9,977 | |
Operations services | | | | 1 | | | | | 359 | |
Communications and courier | | | | 42 | | | | | 28 | |
Goodwill impairment | | | | - | | | | | 13,010 | |
All other expense | | | | 18,473 | | | | | 30,438 | |
|
Total noninterest expense | | | | 59,727 | | | | | 100,313 | |
|
Loss before income taxes | | | $ | | 91,413 | | | | $ | | 98,718 | |
|
Activity in the restructuring and repositioning liability for the twelve months ended December 31, 2008 is presented in the following table:
| | |
(Dollars in thousands) | | Liability |
|
Beginning Balance: January 1, 2008 | | | $ | | 19,675 | |
Severance and other employee related costs | | | | 24,400 | |
Facility consolidation costs | | | | 16,751 | |
Other exit costs, professional fees and other | | | | 7,902 | |
|
Total Accrued | | | | 68,728 | |
Payments* | | | | 38,016 | |
Accrual Reversals | | | | 6,545 | |
|
Restructuring and Repositioning Reserve Balance: December 31, 2008 | | | $ | | 24,167 | |
|
| | |
* Includes payments related to: | | Twelve Months Ended
December 31, 2008 |
Severance and other employee related costs | | | $ | | 16,235 | |
Facility consolidation costs | | | | 14,223 | |
Other exit costs, professional fees and other | | | | 7,558 | |
| | |
| | | $ | | 38,016 | |
| | |
INCOME STATEMENT REVIEW – 2008 COMPARED TO 2007
Total consolidated revenue increased 33 percent to $2.4 billion from $1.8 billion in 2007, primarily from increased mortgage banking and capital markets revenue. A more detailed discussion of the major line items follows.
NET INTEREST INCOME
Net interest income declined to $895.1 million in 2008 compared to $940.6 million in 2007 as average earning assets declined 9 percent to $30.4 billion and average interest-bearing liabilities declined 10 percent to $26.0 billion in 2008. See also the Consolidated Average Balance Sheet and Related Yields and Rates table.
11
FIRST HORIZON NATIONAL CORPORATION
The activity levels and related funding for FHN’s mortgage production and servicing and capital markets activities affect the net interest margin. These activities typically produce different margins than traditional banking activities. Mortgage production and servicing activities can affect the overall margin based on a number of factors, including the shape of the yield curve, the size of the mortgage warehouse, the time it takes to deliver loans into the secondary market, the amount of custodial balances, and the level of MSR. Due to the August 2008 divestiture of certain mortgage banking operations to MetLife, origination activities and the size of the mortgage warehouse have significantly decreased and therefore had less of an impact on net interest margin during the second half of the year. Capital Markets’ activities tend to compress the margin because of the strategy to reduce market risk by economically hedging a portion of its inventory on the balance sheet. As a result of these impacts, FHN’s consolidated margin cannot be readily compared to that of other bank holding companies. Table 2 details the computation of the net interest margin for FHN for the last three years.
The consolidated net interest margin was 2.95 percent for 2008 compared to 2.82 percent for 2007. The widening in the margin occurred as the net interest spread increased to 2.55 percent from 2.19 percent in 2007 while the impact of free funding decreased from 63 basis points to 40 basis points. The increase in the margin is attributable to a decrease in interest-bearing assets, increased spreads on capital markets’ trading inventory and the mortgage warehouse, and a reduced need for higher cost short-term funding because of the common stock issuance in the second quarter 2008. The positive effects more than offset the negative impact of an increase in nonaccrual loans.
Table 2 - Net Interest Margin
| | | | | | |
| | 2008 | | 2007 | | 2006 |
|
Consolidated yields and rates: | | | | | | |
Loans, net of unearned income | | | | 5.33 | % | | | | | 7.34 | % | | | | | 7.40 | % | |
Loans held for sale | | | | 5.86 | | | | | 6.54 | | | | | 6.64 | |
Investment securities | | | | 5.49 | | | | | 5.59 | | | | | 5.42 | |
Capital markets securities inventory | | | | 4.57 | | | | | 5.29 | | | | | 5.33 | |
Mortgage banking trading securities | | | | 12.98 | | | | | 12.28 | | | | | 10.84 | |
Other earning assets | | | | 1.84 | | | | | 4.88 | | | | | 4.72 | |
|
Yields on earning assets | | | | 5.29 | | | | | 6.91 | | | | | 6.85 | |
|
Interest-bearing core deposits | | | | 2.26 | | | | | 3.34 | | | | | 2.98 | |
Certificates of deposit $100,000 and more | | | | 3.79 | | | | | 5.36 | | | | | 5.06 | |
Federal funds purchased and securities sold under agreements to repurchase | | | | 2.04 | | | | | 4.72 | | | | | 4.58 | |
Capital markets trading liabilities | | | | 4.73 | | | | | 5.42 | | | | | 5.68 | |
Commercial paper and other short-term borrowings | | | | 2.33 | | | | | 4.83 | | | | | 5.04 | |
Long-term debt | | | | 3.56 | | | | | 5.67 | | | | | 5.55 | |
|
Rates paid on interest-bearing liabilities | | | | 2.74 | | | | | 4.72 | | | | | 4.54 | |
|
Net interest spread | | | | 2.55 | | | | | 2.19 | | | | | 2.31 | |
Effect of interest-free sources | | | | .40 | | | | | .63 | | | | | .62 | |
|
FHN – NIM | | | | 2.95 | % | | | | | 2.82 | % | | | | | 2.93 | % | |
|
Certain previously reported amounts have been reclassified to agree with current presentation.
In the short term, the net interest margin is expected to remain under pressure as deposit pricing remains challenging. In the longer term, net interest margin should be positively influenced by the reduction of lower margin national businesses.
Table 3 shows how the changes in yields or rates and average balances compared to the prior year affected net interest income.
12
FIRST HORIZON NATIONAL CORPORATION
Table 3 - Analysis of Changes in Net Interest Income
| | | | | | | | | | | | |
(Fully taxable equivalent)
(Dollars in thousands) | | 2008 Compared to 2007
Increase/(Decrease) Due to* | | 2007 Compared to 2006
Increase/(Decrease) Due to* |
| | Rate** | | Volume** | | Total | | Rate** | | Volume** | | Total |
|
Interest income – FTE: | | | | | | | | | | | | |
Loans | | | $ | | (436,294 | ) | | | | $ | | (31,897 | ) | | | | $ | | (468,191 | ) | | | | $ | | (13,408 | ) | | | | $ | | 44,300 | | | | $ | | 30,892 | |
Loans held for sale | | | | (24,906 | ) | | | | | (77,126 | ) | | | | | (102,032 | ) | | | | | (4,394 | ) | | | | | (30,181 | ) | | | | | (34,575 | ) | |
Investment securities: | | | | | | | | | | | | |
U.S. Treasury | | | | (1,848 | ) | | | | | (1,859 | ) | | | | | (3,707 | ) | | | | | 62 | | | | | 2,033 | | | | | 2,095 | |
U.S. government agencies | | | | (3,297 | ) | | | | | (22,740 | ) | | | | | (26,037 | ) | | | | | 5,919 | | | | | (7,161 | ) | | | | | (1,242 | ) | |
States and municipalities | | | | 328 | | | | | 1,517 | | | | | 1,845 | | | | | (6 | ) | | | | | (1 | ) | | | | | (7 | ) | |
Other | | | | 1,092 | | | | | 741 | | | | | 1,833 | | | | | (48 | ) | | | | | (739 | ) | | | | | (787 | ) | |
| | | | | | | | |
Total investment securities | | | | (3,591 | ) | | | | | (22,475 | ) | | | | | (26,066 | ) | | | | | 5,635 | | | | | (5,576 | ) | | | | | 59 | |
| | | | | | | | |
Capital markets securities inventory | | | | (14,318 | ) | | | | | (31,176 | ) | | | | | (45,494 | ) | | | | | (881 | ) | | | | | (11,708 | ) | | | | | (12,589 | ) | |
Mortgage banking trading securities | | | | 3,118 | | | | | (17,029 | ) | | | | | (13,911 | ) | | | | | 6,251 | | | | | 9,478 | | | | | 15,729 | |
Other earning assets: | | | | | | | | | | | | |
Federal funds sold and securities purchased under agreements to resell | | | | (34,953 | ) | | | | | (7,747 | ) | | | | | (42,700 | ) | | | | | 2,559 | | | | | (26,012 | ) | | | | | (23,453 | ) | |
Interest-bearing deposits with other financial institutions | | | | (2,608 | ) | | | | | 2,432 | | | | | (176 | ) | | | | | 291 | | | | | 2 | | | | | 293 | |
| | | | | | | | |
Total other earning assets | | | | (40,893 | ) | | | | | (1,983 | ) | | | | | (42,876 | ) | | | | | 2,961 | | | | | (26,121 | ) | | | | | (23,160 | ) | |
| | | | | | | | |
Total earning assets/total interest income – FTE | | | | (507,383 | ) | | | | | (191,188 | ) | | | | $ | | (698,570 | ) | | | | | 20,218 | | | | | (43,862 | ) | | | | $ | | (23,644 | ) | |
| | |
Interest expense: | | | | | | | | | | | | |
Interest-bearing deposits: | | | | | | | | | | | | |
Savings | | | $ | | (56,064 | ) | | | | $ | | 20,031 | | | | $ | | (36,033 | ) | | | | $ | | 16,279 | | | | $ | | 11,165 | | | | $ | | 27,444 | |
Time deposits | | | | (19,764 | ) | | | | | (15,582 | ) | | | | | (35,346 | ) | | | | | 11,268 | | | | | 5,027 | | | | | 16,295 | |
Other interest-bearing deposits | | | | (11,594 | ) | | | | | (396 | ) | | | | | (11,990 | ) | | | | | 1,407 | | | | | (33 | ) | | | | | 1,374 | |
| | | | | | | | |
Total interest-bearing core deposits | | | | (93,785 | ) | | | | | 10,417 | | | | | (83,369 | ) | | | | | 30,000 | | | | | 15,113 | | | | | 45,113 | |
| | | | | | | | |
Certificates of deposit $100,000 and more | | | | (86,029 | ) | | | | | (206,992 | ) | | | | | (293,021 | ) | | | | | 27,709 | | | | | (151,572 | ) | | | | | (123,863 | ) | |
Federal funds purchased and securities sold under agreements to repurchase | | | | (104,633 | ) | | | | | (54,624 | ) | | | | | (159,257 | ) | | | | | 6,600 | | | | | 13,581 | | | | | 20,181 | |
Capital markets trading liabilities | | | | (6,102 | ) | | | | | (12,219 | ) | | | | | (18,321 | ) | | | | | (3,363 | ) | | | | | (21,184 | ) | | | | | (24,547 | ) | |
Other short term borrowings and commercial paper | | | | (48,641 | ) | | | | | 103,392 | | | | | 54,751 | | | | | (1,696 | ) | | | | | 26,674 | | | | | 24,978 | |
Long-term debt | | | | (130,088 | ) | | | | | (24,369 | ) | | | | | (154,457 | ) | | | | | 6,058 | | | | | 85,225 | | | | | 91,283 | |
| | | | | | | | |
Total interest-bearing liabilities/total interest expense | | | | (527,686 | ) | | | | | (125,987 | ) | | | | $ | | (653,674 | ) | | | | | 51,931 | | | | | (18,786 | ) | | | | $ | | 33,145 | |
| | |
Net interest income – FTE | | | | | | | $ | | (44,896 | ) | | | | | | | | $ | | (56,789 | ) | |
|
|
* | | | | The changes in interest due to both rate and volume have been allocated to change due to rate and change due to volume in proportion to the absolute amounts of the changes in each. |
|
** | | | | Variances are computed on a line-by-line basis and are non-additive. |
NONINTEREST INCOME
Noninterest income contributed 62 percent to total revenue in 2008 compared to 48 percent in 2007 and increased $631.4 million to $1.5 billion in 2008. Impacting this increase were mortgage banking and capital markets noninterest income and securities gains which were partially offset by declines in loan sale and securitization income and loss on divestitures related to restructuring, repositioning and efficiency initiatives. Table 4 provides six years of detailed information concerning FHN’s noninterest income. The following discussion provides additional information about various line items reported in the table.
13
FIRST HORIZON NATIONAL CORPORATION
Table 4 - Noninterest Income
| | | | | | | | | | | | | | | | |
(Dollars in thousands) | | 2008 | | 2007 | | 2006 | | 2005 | | 2004 | | 2003 | | Compound
Annual Growth
Rates (%) |
| | 08/07 | | 08/03 |
|
Noninterest income: | | | | | | | | | | | | | | | | |
Capital markets | | | $ | | 524,420 | | | | $ | | 334,371 | | | | $ | | 383,047 | | | | $ | | 353,005 | | | | $ | | 376,558 | | | | $ | | 538,919 | | | | | 56.8 | + | | | | | * | |
Deposit transactions and cash management | | | | 179,034 | | | | | 175,271 | | | | | 168,599 | | | | | 156,190 | | | | | 148,511 | | | | | 146,696 | | | | | 2.1 | + | | | | | 4.1 | + | |
Mortgage banking | | | | 518,034 | | | | | 69,454 | | | | | 370,613 | | | | | 479,619 | | | | | 444,758 | | | | | 649,496 | | | | | 645.9 | + | | | | | 4.4 | - | |
Trust services and investment management | | | | 33,821 | | | | | 40,335 | | | | | 41,514 | | | | | 44,614 | | | | | 47,274 | | | | | 45,873 | | | | | 16.1 | - | | | | | 5.9 | - | |
Insurance commissions | | | | 29,104 | | | | | 31,739 | | | | | 46,632 | | | | | 54,091 | | | | | 56,109 | | | | | 57,811 | | | | | 8.3 | - | | | | | 12.8 | - | |
Gains/(losses) from loan sales and securitizations | | | | (8,625 | ) | | | | | 23,881 | | | | | 51,675 | | | | | 47,575 | | | | | 23,115 | | | | | - | | | | | 136.1 | - | | | | | NM | |
Equity securities gains/(losses), net | | | | 65,349 | | | | | (7,475 | ) | | | | | 10,271 | | | | | (579 | ) | | | | | 2,040 | | | | | 8,491 | | | | | 974.2 | + | | | | | 50.4 | + | |
Debt securities gains/(losses), net | | | | 761 | | | | | 6,292 | | | | | (75,900 | ) | | | | | 1 | | | | | 18,708 | | | | | (6,113 | ) | | | | | 87.9 | - | | | | | 165.9 | + | |
Gains/(losses) on divestitures | | | | (19,019 | ) | | | | | 15,695 | | | | | - | | | | | 7,029 | | | | | 1,200 | | | | | 12,498 | | | | | 221.2 | - | | | | | 208.8 | - | |
All other income and commissions: | | | | | | | | | | | | | | | | |
Brokerage management fees and commissions | | | | 32,234 | | | | | 37,830 | | | | | 37,182 | | | | | 30,865 | | | | | 28,590 | | | | | 23,215 | | | | | 14.8 | - | | | | | 6.8 | + | |
Bank-owned life insurance | | | | 25,143 | | | | | 25,172 | | | | | 19,064 | | | | | 16,335 | | | | | 12,842 | | | | | 13,763 | | | | | * | | | | | 12.8 | + | |
Bankcard income | | | | 22,081 | | | | | 24,874 | | | | | 26,105 | | | | | 27,136 | | | | | 24,993 | | | | | 22,587 | | | | | 11.2 | - | | | | | * | |
Other service charges | | | | 12,630 | | | | | 14,296 | | | | | 14,561 | | | | | 14,330 | | | | | 11,498 | | | | | 11,720 | | | | | 11.7 | - | | | | | 1.5 | + | |
Remittance processing | | | | 12,953 | | | | | 13,451 | | | | | 14,737 | | | | | 15,411 | | | | | 19,515 | | | | | 23,666 | | | | | 3.7 | - | | | | | 11.4 | - | |
Reinsurance fees | | | | 11,919 | | | | | 9,052 | | | | | 6,792 | | | | | 5,850 | | | | | 5,913 | | | | | 6,224 | | | | | 31.7 | + | | | | | 13.9 | + | |
ATM interchange fees | | | | 9,224 | | | | | 8,472 | | | | | 7,091 | | | | | 5,995 | | | | | 4,973 | | | | | 4,113 | | | | | 8.9 | + | | | | | 17.5 | + | |
Deferred compensation (a) | | | | (22,901 | ) | | | | | 7,727 | | | | | 14,647 | | | | | 7,721 | | | | | 8,633 | | | | | 4,575 | | | | | 396.4 | - | | | | | 238.0 | - | |
Letter of credit fees | | | | 5,657 | | | | | 6,738 | | | | | 7,271 | | | | | 7,883 | | | | | 6,793 | | | | | 4,944 | | | | | 16.0 | - | | | | | 2.7 | + | |
Electronic banking fees | | | | 6,217 | | | | | 6,561 | | | | | 5,975 | | | | | 5,977 | | | | | 6,071 | | | | | 6,311 | | | | | 5.2 | - | | | | | * | |
Check clearing fees | | | | 3,125 | | | | | 4,896 | | | | | 6,385 | | | | | 7,333 | | | | | 10,052 | | | | | 11,839 | | | | | 36.2 | - | | | | | 23.4 | - | |
Federal flood certifications | | | | 3,645 | | | | | 4,797 | | | | | 4,996 | | | | | 9,359 | | | | | 5,375 | | | | | 4,161 | | | | | 24.0 | - | | | | | 2.6 | - | |
Gain on early extinguishment
of debt | | | | 33,845 | | | | | - | | | | | - | | | | | - | | | | | - | | | | | - | | | | | NM | | | | | NM | |
Other | | | | 12,662 | | | | | 6,520 | | | | | 5,636 | | | | | 11,516 | | | | | 18,310 | | | | | 8,608 | | | | | 94.2 | + | | | | | 8.0 | + | |
| | |
Total all other income and commissions | | | | 168,434 | | | | | 170,386 | | | | | 170,442 | | | | | 165,711 | | | | | 163,558 | | | | | 145,726 | | | | | 1.1 | - | | | | | 2.9 | + | |
| | |
Total noninterest income | | | $ | | 1,491,313 | | | | $ | | 859,949 | | | | $ | | 1,166,893 | | | | $ | | 1,307,256 | | | | $ | | 1,281,831 | | | | $ | | 1,599,397 | | | | | 73.4 | + | | | | | 1.4 | - | |
| | |
NM – not meaningful
* Amount is less than one percent.
(a) Deferred compensation market value adjustments are offset by a reduction to noninterest other expense.
Capital Markets Noninterest Income
The major component of revenue in the Capital Markets segment is generated from the purchase and sale of securities as both principal and agent, and from other fee sources including equity research, loan sales, portfolio advisory activities and structured finance. Securities inventory positions are generally procured for distribution to customers by the sales staff. A portion of the inventory is hedged to protect against movements in fair value due to changes in interest rates.
Capital markets noninterest income increased to $524.4 million in 2008 from $334.4 million in 2007. Revenues from other products represented only 6 percent of total noninterest income in 2008 compared to 35 percent in 2007. These revenues decreased $86.1 million primarily due to decreased fees from structured finance activities. Revenues from fixed income sales increased $276.1 million from 2007 due primarily to a steepened yield curve, market volatility and other factors.
14
FIRST HORIZON NATIONAL CORPORATION
Table 5 - Capital Markets Noninterest Income
| | | | | | | | | | |
(Dollars in thousands) | | 2008 | | 2007 | | 2006 | | Compound Annual
Growth Rates (%) |
| | 08/07 | | 08/06 |
|
Noninterest income: | | | | | | | | | | |
Fixed income | | | $ | | 493,836 | | | | $ | | 217,700 | | | | $ | | 180,183 | | | | | 126.8 | + | | | | | 65.6 | + | |
Other product revenue | | | | 30,584 | | | | | 116,671 | | | | | 202,864 | | | | | 73.8 | - | | | | | 61.2 | - | |
| | |
Total capital markets noninterest income | | | $ | | 524,420 | | | | $ | | 334,371 | | | | $ | | 383,047 | | | | | 56.8 | + | | | | | 17.0 | + | |
| | |
Mortgage Banking Noninterest Income
Effective August 31, 2008, FHN completed the sale of Mortgage Banking’s servicing operations, origination offices outside of Tennessee and $19.1 billion of servicing to MetLife. As a result of this transaction, origination activity for 2008 is significantly lower when compared to 2007. Prior to the third quarter 2008 sale of the national origination offices, First Horizon Home Loans, a former division of FTBNA, offered residential mortgage banking products and services to customers, which consisted primarily of the origination or purchase of single-family residential mortgage loans. First Horizon Home Loans originated mortgage loans through its retail and wholesale operations for sale to secondary market investors and subsequently serviced the majority of those loans. Although origination activity has declined substantially since the sale of the national mortgage offices, FHN continues to service, through a sub-servicing arrangement, the remaining portfolio. Table 6 provides a summary of First Horizon Home Loans’ production/origination of mortgage loans through December 31, 2008, 2007 and 2006.
Table 6 - Production/Origination of Mortgage Loans
| | | | | | |
| | 2008 | | 2007 | | 2006 |
|
Retail channel | | | | 44 | % | | | | | 53 | % | | | | | 57 | % | |
Wholesale channel | | | | 53 | | | | | 47 | | | | | 40 | |
Correspondent brokers | | | | 3 | | | | | - | | | | | 3 | |
|
Mortgage banking noninterest income increased by $448.5 million in 2008 to $518.0 million from $69.5 million in 2007 as shown in Table 7.
Prior to adoption of new accounting standards in 2008, origination income included origination fees, net of costs, gains/(losses) recognized on loans sold including the capitalized fair value of MSR, and the value recognized on loans in process including results from hedging. Origination fees, net of costs (including incentives and other direct costs), were deferred and included in the basis of the loans in calculating gains and losses upon sale. Gain or loss was recognized due to changes in fair value of an interest rate lock commitment made to the customer. Gains or losses from the sale of loans were recognized at the time a mortgage loan was sold into the secondary market. See Critical Accounting Policies and Note 1 – Summary of Significant Accounting Policies for more discussion of the effects of adopting the new accounting standards.
Upon adoption of the new accounting standards, origination income includes origination fees, fair value and LOCOM adjustments of the warehouse, gains/(losses) recognized on loans sold including the capitalized fair value of MSR, and the value recognized on loans in process including results from hedging. Upon election of fair value accounting for substantially all warehouse loans, the value recognized on these loans includes changes in investor prices, MSR and concessions. The related origination fees are no longer deferred but recognized in origination income upon closing of a loan.
Net revenue from origination activity increased 89 percent to $223.6 million in 2008 from $118.4 million in 2007 as 2007 was negatively impacted by secondary market disruptions since credit and liquidity risk in the pipeline and warehouse were not hedged. Gain on sale margins were impacted as a result of significant spread widening on ARM and nonagency eligible production. Origination income in 2008 was impacted by several factors. The
15
FIRST HORIZON NATIONAL CORPORATION
adoption of accounting standards in the first quarter, including the fair value election for substantially all mortgage warehouse loans, positively impacted gross origination income by $142.2 million. The third quarter 2008 sale of national origination offices to MetLife significantly reduced origination volumes as compared to 2007 with originations continuing only within FHN’s regional banking footprint. Also in third quarter, origination income was negatively impacted by a $15.5 million charge related to amounts owed to private mortgage insurers on loans previously sold. 2008 origination income was also negatively impacted by a $15.2 million valuation adjustment of the remaining mortgage warehouse in the fourth quarter.
Servicing income includes servicing fees and net gains or losses from hedging MSR. Mortgage servicing noninterest income reflects the change in the fair value of the MSR asset combined with net economic hedging results. FHN employs hedging strategies intended to counter changes in the value of MSR and other retained interests due to changing interest rate environments (refer to discussion of MSR under Critical Accounting Policies). Net servicing income increased $360.8 million in 2008 from a net servicing loss of $68.9 million in 2007.
Through various servicing portfolio sales executed in 2008, including the $19.1 billion sale to MetLife in the third quarter, the servicing portfolio decreased to $63.7 billion compared to $103.7 billion on December 31, 2007. The sales reduced servicing assets by $485.8 million. Consistent with the decline in the servicing portfolio, total fees associated with mortgage servicing decreased 26 percent to $231.9 million from $311.4 million. Changes in MSR due to runoff positively impacted servicing income in 2008 compared to 2007 by $109.7 million as the size of the portfolio declined. Changes in MSR value other than runoff (valuation model inputs or assumptions) negatively impacted net servicing revenues by $384.2 million in 2008 compared to $235.0 million in 2007 as lower interest rates increased prepayment speeds. However, lower interest rates positively impacted servicing hedge gains by $548.8 million in 2008 compared to $73.2 million in 2007 increasing 2008 net servicing income to $292.0 million compared to a net servicing loss of $68.9 million in 2007.
Table 7 - Mortgage Banking Noninterest Income
| | | | | | | | | | |
| | 2008 | | 2007 | | 2006 | | Compound Annual
Growth Rates (%) |
| | 08/07 | | 08/06 |
|
Noninterest income(thousands): | | | | | | | | | | |
Origination income | | | $ | | 223,596 | | | | $ | | 118,436 | | | | $ | | 308,099 | | | | | 88.8 | + | | | | | 14.8 | - | |
Servicing (expense)/income | | | | 291,962 | | | | | (68,857 | ) | | | | | 37,517 | | | | | 524.0 | + | | | | | 179.0 | + | |
Other | | | | 2,477 | | | | | 19,875 | | | | | 24,997 | | | | | 87.5 | - | | | | | 68.5 | - | |
| | |
Total mortgage banking noninterest income | | | $ | | 518,035 | | | | $ | | 69,454 | | | | $ | | 370,613 | | | | | 645.9 | + | | | | | 18.2 | + | |
| | |
Mortgage banking statistics(millions): | | | | | | | | | | |
Refinance originations | | | $ | | 8,975.9 | | | | $ | | 10,872.2 | | | | $ | | 10,226.7 | | | | | 17.4 | - | | | | | 6.3 | - | |
Home-purchase originations | | | | 8,465.9 | | | | | 16,502.9 | | | | | 16,887.6 | | | | | 48.7 | - | | | | | 29.2 | - | |
| | |
Mortgage loan originations | | | $ | | 17,441.8 | | | | $ | | 27,375.1 | | | | $ | | 27,114.3 | | | | | 36.3 | - | | | | | 19.8 | - | |
| | |
Servicing portfolio - owned | | | $ | | 63,660.7 | | | | $ | | 103,708.7 | | | | $ | | 101,369.2 | | | | | 38.6 | - | | | | | 20.8 | - | |
| | |
Other income includes FHN’s share of earnings from nonconsolidated subsidiaries accounted for under the equity method, which provided ancillary activities to mortgage banking, and fees from retail construction lending. FHN’s interests in these nonconsolidated subsidiaries were transferred to MetLife in the third quarter 2008. In the fourth quarter 2008, other mortgage banking income was negatively impacted by the recognition of a $6.5 million liability for minimum fee guarantees on prior servicing sales.
Management continues to explore additional opportunities for balance sheet repositioning and the redeployment of capital which includes a reduction of the servicing portfolio and associated MSR. Generally, revenues from mortgage originations and mortgage servicing are principally impacted by interest rates. Specifically, an increase in interest rates should reduce origination income but increase servicing revenues due to reduced overall originations and the slow down of prepayments, respectively. Weakening of the housing market should decrease origination income but a resulting decrease in payoffs could increase servicing income. Due to the sale of the national
16
FIRST HORIZON NATIONAL CORPORATION
origination offices to MetLife, interest rate exposure on origination income will be less significant. In future periods, actual results could differ because of several factors, including those presented in the Forward-Looking Statements section of the MD&A discussion.
Deposit Transactions and Cash Management
Deposit transactions include services related to retail deposit products (such as service charges on checking accounts), cash management products and services such as electronic transaction processing (automated clearing house and Electronic Data Interchange), account reconciliation services, cash vault services, lockbox processing, and information reporting to large corporate clients. Noninterest income from deposit transactions and cash management increased to $179.0 million in 2008 from $175.3 million in 2007, reflecting increased corporate cash management fees from lower customer earnings credits.
Gains/(Losses) from Loan Sales and Securitizations
Gains/(losses) from loan sales and securitizations include net gains recognized on HELOC and second-lien mortgage loans sold, including changes in the fair value of MSR, servicing fees, and gains or losses related to fair value adjustments on retained interests classified as mortgage trading securities. Noninterest income from loan sales and securitizations decreased to a loss of $8.6 million in 2008 compared to gains of $23.9 million in 2007. The decrease is primarily due to market disruptions beginning in 2007 which resulted in no second-lien or HELOC loan sales in 2008, an increase in HELOC residual write-downs, and a decrease in servicing fees resulting from run off and a smaller servicing portfolio.
Insurance Commissions
Insurance commissions are derived from the sale of insurance products, including acting as an independent agent to provide commercial and personal property and casualty, life, long-term care, and disability insurance. Noninterest income from insurance commissions decreased to $29.1 million in 2008 from $31.7 million in 2007 primarily due to a soft property and casualty market and a decline in mortgage related insurance sales.
Trust Services and Investment Management
Trust services and investment management fees include investment management, personal trust, employee benefits, and custodial trust services and are influenced by equity and fixed income market activity. Noninterest income from trust services and investment management was $33.8 million in 2008 compared to $40.3 million in 2007 due to market related declines in trust asset values.
Gains/(Losses) on Divestitures
In 2008, losses from divestitures were $19.0 million and were related to the sale of mortgage banking operations and certain First Horizon Bank branches. Gains from divestitures in 2007 were $15.7 million and were related to the sale of certain First Horizon Bank branches. See the discussion of Restructuring, Repositioning and Efficiency Initiatives for further details.
Securities Gains/(Losses)
Net securities gains in 2008 were $66.1 million and primarily related to the redemption of FHN’s Class B shares in connection with Visa Inc.’s IPO which resulted in a gain of $65.9 million. Net securities losses of $1.2 million in 2007 primarily related to changes in the investment portfolio that were made to compensate for loan growth in first quarter which were offset by impairment charges related to securities that, in the opinion of management, have been other-than-temporarily impaired.
All Other Income and Commissions
All other income, which includes brokerage management fees and commissions, bankcard fees, revenue from bank-owned life insurance, remittance processing income, revenue related to deferred compensation plans (which
17
FIRST HORIZON NATIONAL CORPORATION
are principally offset by a related item in noninterest expense), other service charges, and various other fees (see Table 4 for additional detail) was $168.4 million in 2008 compared to $170.4 million in 2007. Other income was positively impacted by $33.8 million of debt repurchase gains and an increase in reinsurance fees. Offsetting these increases was a $30.6 million decrease in income related to deferred compensation plans and a $5.6 million decline in brokerage fees and commissions which were impacted by market conditions. All other components decreased slightly. In 2007, other income was negatively impacted by $16.8 million related to LOCOM and other consumer lending (HELOC and second-lien) adjustments.
NONINTEREST EXPENSE
Total noninterest expense for 2008 decreased 10 percent to $1.7 billion from $1.8 billion in 2007. Table 8 provides detail by segment. Table 9 provides detail by category for the past six years with growth rates.
Employee compensation, incentives and benefits (personnel expense), the largest component of noninterest expense, decreased $7.2 million from $968.1 million in 2007. Personnel expense was impacted by restructuring, repositioning, and efficiency initiatives previously discussed and increased costs related to higher capital markets production. These results also reflect reductions in personnel expense in Mortgage Banking and National Specialty Lending directly related to the contraction in revenue. Included in personnel expense is the net periodic benefit cost for FHN’s pension plan of $1.7 million in 2008, as compared to $10.9 million in 2007. Based on current conditions, FHN anticipates that net periodic benefit cost for the Pension Plan will increase by $9.1 million in 2009 from losses experienced on assets in the qualified pension plan and a decrease in the discount rate.
Occupancy costs decreased 20 percent or $26.2 million primarily due to the sale of certain Mortgage Banking operations to MetLife in 2008. Restructuring related charges included in occupancy expense decreased $6.2 million from 2007. Equipment rentals, depreciation and maintenance, communications and courier, intangible amortization, and all other expense experienced declines consistent with FHN’s focus on restructuring and efficiency initiatives. In 2007, goodwill impairments totaled $84.1 million; including a $71.1 million impairment related to the Mortgage Banking segment goodwill and $13.0 million related to First Horizon Bank branches. There were no goodwill impairments in 2008.
All other noninterest expense decreased $57.4 million in 2008 despite a $25.4 million increase in loan closing costs related to the fair value election for substantially all mortgage warehouse loans. As a result of this election, such costs are immediately recognized compared to previously being deferred and included in mortgage banking income. Losses and expenses related to foreclosed real estate increased by $17.0 million consistent with declines in the real estate market and increased defaults on insured mortgages resulted in a $16.5 million increase in reinsurance reserves. Contract employment expenses increased by $12.0 million largely due to higher outsourcing costs in 2008. Deposit insurance premiums increased $11.3 million from 2007. In 2007, a $55.7 million charge was taken to reflect FHN’s proportionate share of Visa, Inc.’s various legal matters while $30.0 million of the charge was reversed in 2008. All other expense categories decreased consistent with FHN’s focus on efficiency initiatives and reduction of non-core businesses.
Table 8 - Noninterest Expense Composition
| | | | | | |
(Dollars in thousands) | | 2008 | | 2007 | | 2006 |
|
Regional Banking | | | $ | | 627,273 | | | | $ | | 631,356 | | | | $ | | 659,790 | |
Capital Markets | | | | 418,916 | | | | | 328,062 | | | | | 358,901 | |
National Specialty Lending | | | | 97,181 | | | | | 138,077 | | | | | 161,335 | |
Mortgage Banking | | | | 425,148 | | | | | 503,207 | | | | | 476,862 | |
Corporate | | | | 87,534 | | | | | 242,731 | | | | | 85,733 | |
|
Total noninterest expense | | | $ | | 1,656,052 | | | | $ | | 1,843,433 | | | | $ | | 1,742,621 | |
|
Certain previously reported amounts have been reclassified to agree with current presentation.
18
FIRST HORIZON NATIONAL CORPORATION
Table 9 - Noninterest Expense
| | | | | | | | | | | | | | | | |
(Dollars in thousands) | | 2008 | | 2007 | | 2006 | | 2005 | | 2004 | | 2003 | | Compound Annual
Growth Rates (%) |
| | 08/07 | | 08/03 |
|
Noninterest expense: | | | | | | | | | | | | | | | | |
Employee compensation, incentives and benefits | | | $ | | 960,917 | | | | $ | | 968,122 | | | | $ | | 1,023,685 | | | | $ | | 988,946 | | | | $ | | 899,803 | | | | $ | | 1,004,754 | | | | | * | | | | | * | |
Occupancy | | | | 104,968 | | | | | 131,173 | | | | | 116,670 | | | | | 104,161 | | | | | 87,570 | | | | | 81,832 | | | | | 20.0 | - | | | | | 5.1 | + | |
Operations services | | | | 77,474 | | | | | 74,200 | | | | | 70,041 | | | | | 71,949 | | | | | 59,642 | | | | | 59,210 | | | | | 4.4 | + | | | | | 5.5 | + | |
Legal and professional fees | | | | 63,718 | | | | | 56,882 | | | | | 43,012 | | | | | 43,734 | | | | | 36,730 | | | | | 58,967 | | | | | 12.0 | + | | | | | 1.6 | + | |
Equipment rentals, depreciation and maintenance | | | | 57,069 | | | | | 72,926 | | | | | 73,882 | | | | | 74,367 | | | | | 70,400 | | | | | 67,019 | | | | | 21.7 | - | | | | | 3.2 | - | |
Communications and courier | | | | 39,863 | | | | | 43,909 | | | | | 53,249 | | | | | 54,388 | | | | | 47,930 | | | | | 49,122 | | | | | 9.2 | - | | | | | 4.1 | - | |
Amortization of intangible assets | | | | 8,229 | | | | | 10,959 | | | | | 11,462 | | | | | 10,700 | | | | | 6,157 | | | | | 5,256 | | | | | 24.9 | - | | | | | 9.4 | + | |
Goodwill Impairment | | | | - | | | | | 84,084 | | | | | - | | | | | - | | | | | - | | | | | - | | | | | NM | | | | | NM | |
All other expense: | | | | | | | | | | | | | | | | |
Computer software | | | | 30,389 | | | | | 53,942 | | | | | 34,381 | | | | | 28,542 | | | | | 26,719 | | | | | 27,107 | | | | | 43.7 | - | | | | | 2.3 | + | |
Advertising and public relations | | | | 33,014 | | | | | 42,346 | | | | | 47,427 | | | | | 46,321 | | | | | 39,846 | | | | | 43,836 | | | | | 22.0 | - | | | | | 5.5 | - | |
Travel and entertainment | | | | 17,371 | | | | | 26,099 | | | | | 32,306 | | | | | 31,022 | | | | | 29,914 | | | | | 36,348 | | | | | 33.4 | - | | | | | 13.7 | - | |
Low income housing expense | | | | 18,734 | | | | | 20,922 | | | | | 17,027 | | | | | 12,987 | | | | | 13,662 | | | | | 12,132 | | | | | 10.5 | - | | | | | 9.1 | + | |
Contract employment | | | | 33,545 | | | | | 21,543 | | | | | 27,420 | | | | | 30,344 | | | | | 23,722 | | | | | 34,389 | | | | | 55.7 | + | | | | | 0.5 | - | |
Distributions on preferred stock of subsidiary | | | | 13,989 | | | | | 18,799 | | | | | 18,146 | | | | | 10,757 | | | | | - | | | | | 2,282 | | | | | 25.6 | - | | | | | 43.7 | + | |
Foreclosed real estate | | | | 33,002 | | | | | 16,048 | | | | | 4,384 | | | | | 3,933 | | | | | 5,834 | | | | | 13,137 | | | | | 105.6 | + | | | | | 20.2 | + | |
Supplies | | | | 10,740 | | | | | 13,909 | | | | | 15,072 | | | | | 17,290 | | | | | 17,185 | | | | | 18,541 | | | | | 22.8 | - | | | | | 10.3 | - | |
Loan closing costs | | | | 38,221 | | | | | 12,783 | | | | | 12,095 | | | | | 7,969 | | | | | 18,623 | | | | | 3,691 | | | | | 199.0 | + | | | | | 59.6 | + | |
Customer relations | | | | 8,875 | | | | | 9,801 | | | | | 8,688 | | | | | 9,868 | | | | | 9,167 | | | | | 7,602 | | | | | 9.4 | - | | | | | 3.1 | + | |
Other insurance and taxes | | | | 6,848 | | | | | 8,841 | | | | | 8,615 | | | | | 9,349 | | | | | 8,744 | | | | | 10,122 | | | | | 22.5 | - | | | | | 7.5 | - | |
Employee training and dues | | | | 6,286 | | | | | 6,562 | | | | | 6,917 | | | | | 6,268 | | | | | 5,956 | | | | | 5,559 | | | | | 4.2 | - | | | | | 2.5 | + | |
Fed service fees | | | | 7,053 | | | | | 6,047 | | | | | 6,543 | | | | | 7,568 | | | | | 8,838 | | | | | 9,195 | | | | | 16.6 | + | | | | | 5.2 | - | |
Complimentary check expense | | | | 4,776 | | | | | 5,058 | | | | | 5,371 | | | | | 4,621 | | | | | 3,482 | | | | | 3,168 | | | | | 5.6 | - | | | | | 8.6 | + | |
Loan insurance expense | | | | 5,270 | | | | | 4,610 | | | | | 6,577 | | | | | 7,970 | | | | | 8,070 | | | | | 6,710 | | | | | 14.3 | + | | | | | 4.7 | - | |
Bank examinations costs | | | | 4,144 | | | | | 4,504 | | | | | 4,367 | | | | | 3,958 | | | | | 3,128 | | | | | 3,150 | | | | | 8.0 | - | | | | | 5.6 | + | |
Deposit insurance premium | | | | 14,664 | | | | | 3,327 | | | | | 3,198 | | | | | 3,012 | | | | | 3,024 | | | | | 2,703 | | | | | 340.8 | + | | | | | 40.2 | + | |
Distributions on guaranteed preferred securities | | | | - | | | | | - | | | | | - | | | | | - | | | | | - | | | | | 8,070 | | | | | NM | | | | | NM | |
Other | | | | 56,893 | | | | | 126,037 | | | | | 92,086 | | | | | 36,870 | | | | | 27,662 | | | | | 70,062 | | | | | 54.9 | - | | | | | 4.1 | - | |
| | |
Total all other expense | | | | 343,814 | | | | | 401,178 | | | | | 350,620 | | | | | 278,649 | | | | | 253,576 | | | | | 317,804 | | | | | 14.3 | - | | | | | 1.6 | + | |
| | |
Total noninterest expense | | | $ | | 1,656,052 | | | | $ | | 1,843,433 | | | | $ | | 1,742,621 | | | | $ | | 1,626,894 | | | | $ | | 1,461,808 | | | | $ | | 1,643,964 | | | | | 10.2 | - | | | | | * | |
| | |
NM – not meaningful
* Amount is less than one percent.
19
FIRST HORIZON NATIONAL CORPORATION
PROVISION FOR LOAN LOSSES
The provision for loan losses is the charge to earnings that management determines to be necessary to maintain the allowance for loan and lease losses (ALLL) at a sufficient level reflecting management’s estimate of probable incurred losses in the loan portfolio. Analytical models based on loss experience adjusted for current events, trends, and economic conditions are used by management to determine the amount of provision to be recognized and to assess the adequacy of the loan loss allowance. In response to economic conditions beginning in 2007, FHN conducted focused portfolio management activities to identify problem credits and to reach appropriate provisioning and reserve levels. The provision for loan losses increased 296 percent to $1.1 billion in 2008 from $272.8 million in 2007. While all portfolios were affected by the weakening real estate markets and the general decline in economic conditions in 2008, the increase primarily reflects deterioration in the national residential and commercial real estate construction portfolios (one-time close retail real estate construction loans extended to consumers and loans to homebuilders, including condominium construction loans). See Credit Risk Management and Allowance for Loan Losses and Charge-offs for further details.
Going forward, the level of provision for loan losses will fluctuate based upon the level of performance in the loan portfolios and will be affected by economic conditions.
INCOME TAXES
The effective tax rate for 2008 and 2007 was 45 percent, reflecting the tax rate effect of the reported loss in 2008. The effective tax rate for 2007 was negatively impacted by the impairment of goodwill related to Mortgage Banking and First Horizon Bank branches. The effective tax rates for both years were favorably impacted by affordable housing tax credits, settlements of certain prior year’s tax examinations and the tax effects of increases in the cash surrender value of life insurance. Tax rates were negatively affected by the tax effects of preferred stock dividends.
FHN and its subsidiaries file income tax returns in the U.S. federal jurisdiction and various states’ jurisdictions. With few exceptions, FHN is no longer subject to U.S. federal or state and local income tax examinations by tax authorities for years 2004 and prior. The Internal Revenue Service (IRS) has completed its examination of all U.S. federal returns through 2004 which are closed under the statute. All proposed adjustments with respect to examinations of federal returns filed for 2004 and prior years have been settled.
FHN adopted the provisions of FASB Interpretation No. 48, “Accounting for Uncertainty in Income Taxes” (FIN 48), on January 1, 2007. As a result of the implementation of FIN 48, FHN recognized a $.9 million increase in the liability for unrecognized tax benefits, which was accounted for as a reduction to the January 1, 2007, balance of undivided profits. The total balance of unrecognized tax benefits at December 31, 2007, was $31.6 million and has decreased to $31.1 million as of December 31, 2008. First Horizon does not expect that unrecognized tax benefits will significantly increase or decrease during 2009.
On December 31, 2008, there were no tax positions included in the balance of unrecognized tax benefits for which the ultimate deductibility is highly certain but for which there is uncertainty about the timing of such deductibility.
FHN’s FIN 48 policy is to recognize accrued interest and penalties related to unrecognized tax benefits as a component of tax expense. Interest accrued as of December 31, 2008 was approximately $6 million. The total amount of interest and penalties recognized in the Consolidated Statements of Income during 2008 was $1.7 million. See also Note 16 – Income Taxes for additional information.
DISCONTINUED OPERATIONS
Performance in 2008 was favorably impacted by $.9 million related to an earn-out associated with the merchant processing divestiture. On March 1, 2006, FHN sold its national merchant processing business for an after-tax gain of $209.0 million. This divestiture was accounted for as a discontinued operation, and accordingly, current and prior periods were adjusted to exclude the impact of merchant operations from the results of continuing operations.
20
FIRST HORIZON NATIONAL CORPORATION
STATEMENT OF CONDITION REVIEW – 2008 COMPARED TO 2007
Total assets were $31.0 billion on December 31, 2008, compared to $37.0 billion on December 31, 2007. Average assets decreased to $34.4 billion in 2008 from $38.2 billion in 2007 due to continued efforts to reduce balance sheet risk.
Effective January 1, 2008, upon adoption of Statement of Financial Accounting Standards No. 159, “The Fair Value Option for Financial Assets and Financial Liabilities” (SFAS No. 159), FHN elected the fair value option on a prospective basis for almost all types of mortgage loans originated for sale purposes. Such loans are carried at fair value, with changes in the fair value of these loans recognized in the mortgage banking noninterest income section of the Consolidated Statements of Income. After adoption of SFAS No. 159, FHN continued to account for all mortgage loans held for sale which were originated prior to 2008 and for mortgage loans held for sale for which fair value accounting was not elected at the lower of cost or market value. For such loans, net origination fees and costs were deferred and included in the basis of the loans in calculating gains and losses upon sale. Also included in the basis of first-lien mortgage loans was the value accreted during the time that the loan was a locked commitment. The cost basis of loans qualifying for fair value hedge accounting under Statement of Financial Accounting Standards No. 133, “Accounting for Derivative Instruments and Hedging Activities” (SFAS No. 133), was adjusted to reflect changes in fair value. Gains and losses realized from the sale of these assets were included in noninterest income. Interests retained from the sale of such loans are included as a component of trading securities on the Consolidated Statements of Condition.
Effective January 1, 2008, FHN adopted SEC Staff Accounting Bulletin No. 109, “Written Loan Commitments Recorded at Fair Value Through Earnings” (SAB No. 109) prospectively for derivative loan commitments issued or modified after that date. SAB No. 109 rescinds SAB No. 105’s prohibition on inclusion of expected net future cash flows related to loan servicing activities in the fair value measurement of a written loan commitment. SAB No. 109 also applies to any loan commitments for which fair value accounting is elected under SFAS No. 159. FHN did not elect fair value accounting for any other loan commitments under SFAS No. 159. The prospective application of SAB No. 109 and the prospective election to recognize substantially all new mortgage loan originations at fair value under SFAS No. 159 resulted in a positive net impact of $1.0 million on 2008 pre-tax earnings.
Effective January 1, 2008, FHN adopted SFAS No. 157, “Fair Value Measurements” (SFAS No. 157) for existing fair value measurement requirements related to financial assets and liabilities as well as to non-financial assets and liabilities which are remeasured at least annually. In February 2008, the FASB staff issued FASB Staff Position No. FAS 157-2, “Effective Date of FASB Statement No. 157” (FSP FAS 157-2), which delayed the effective date of SFAS No. 157 until fiscal years beginning after November 15, 2008, for non-financial assets and liabilities which are recognized at fair value on a non-recurring basis. SFAS No. 157 establishes a hierarchy to be used in performing measurements of fair value. Additionally, SFAS No. 157 emphasizes that fair value should be determined from the perspective of a market participant while also indicating that valuation methodologies should first reference available market data before using internally developed assumptions. SFAS No. 157 also provides expanded disclosure requirements regarding the effects of fair value measurements on the financial statements. Upon the adoption of the provisions of SFAS No. 157 for financial assets and liabilities as well as non-financial assets and liabilities remeasured at least annually on January 1, 2008, a negative after-tax cumulative-effect adjustment of $12.5 million was made to the opening balance of undivided profits for interest rate lock commitments which FHN previously measured under the guidance of EITF 02-3, “Issues Involved in Accounting for Derivative Contracts Held for Trading Purposes and Contracts Involved in Energy Trading and Risk Management Activities” (EITF 02-3). The effect of the change in accounting for these interest rate lock commitments produced a positive effect of $19.4 million on 2008 pre-tax earnings as existing commitments were delivered as loans and additional commitments that would have been deferred under EITF 02-3 were made. Substantially all commitments existing at August 31, 2008 were sold to MetLife. Application of SFAS No. 157 to non-financial assets and liabilities which are recognized at fair value on a non-recurring basis is not expected to be significant to FHN.
Effective January 1, 2008, FHN adopted EITF Issue No. 06-4, “Accounting for Deferred Compensation and Postretirement Benefit Aspects of Endorsement Split-Dollar Life Insurance Arrangements” (EITF 06-4). EITF 06-4 requires that a liability be recognized for contracts written to employees which provide future postretirement benefits that are covered by endorsement split-dollar life insurance arrangements because such obligations are not considered to be effectively settled upon entering into the related insurance arrangements. FHN recognized a decrease to undivided profits of $8.5 million, net of tax, upon adoption of EITF 06-4.
21
FIRST HORIZON NATIONAL CORPORATION
EARNING ASSETS
Earning assets consist of loans, loans held for sale, investment securities, trading securities and other earning assets. Earning assets averaged $30.4 billion and $33.4 billion for 2008 and 2007, respectively. A more detailed discussion of the major line items follows.
Loans
Average loans decreased 2 percent to $21.7 billion during 2008 driven by elevated charge-offs and declines in both commercial and consumer construction portfolios as FHN discontinued loan origination through its national construction lending channel. Average loans were $22.1 billion during 2007. Average loans represented 71 percent of average earning assets in 2008 and 66 percent in 2007. Additional loan information is provided in Table 10 and Note 4 – Loans.
Table 10 - Average Loans
| | | | | | | | | | | | | | | | |
(Dollars in millions) | | 2008 | | Percent
of Total | | 2008
Growth
Rate | | 2007 | | Percent
of Total | | 2007
Growth
Rate | | 2006 | | Percent
of Total |
|
Commercial: | | | | | | | | | | | | | | | | |
Commercial, financial and industrial | | | $ | | 7,346.4 | | | | | 34 | % | | | | | 3.3 % | | | | $ | | 7,109.9 | | | | | 32 | % | | | | | 6.5 % | | | | $ | | 6,674.9 | | | | | 31 | % | |
Real estate commercial (a) | | | | 1,431.8 | | | | | 6 | | | | | 12.6 | | | | | 1,271.4 | | | | | 6 | | | | | 3.9 | | | | | 1,223.2 | | | | | 6 | |
Real estate construction (b) | | | | 2,317.3 | | | | | 11 | | | | | (19.1) | | | | | 2,865.8 | | | | | 13 | | | | | 15.8 | | | | | 2,475.5 | | | | | 11 | |
| | | | | | | | |
Total commercial | | | | 11,095.5 | | | | | 51 | | | | | (1.3) | | | | | 11,247.1 | | | | | 51 | | | | | 8.4 | | | | | 10,373.6 | | | | | 48 | |
| | | | | | | | |
Retail: | | | | | | | | | | | | | | | | |
Real estate residential (c) | | | | 7,998.9 | | | | | 37 | | | | | 3.3 | | | | | 7,741.2 | | | | | 35 | | | | | (8.7) | | | | | 8,481.2 | | | | | 39 | |
Real estate construction (d) | | | | 1,501.7 | | | | | 7 | | | | | (28.4) | | | | | 2,095.9 | | | | | 9 | | | | | 3.0 | | | | | 2,034.9 | | | | | 10 | |
Other retail | | | | 139.1 | | | | | 1 | | | | | (6.8) | | | | | 149.3 | | | | | 1 | | | | | (7.8) | | | | | 162.0 | | | | | 1 | |
Credit card receivables | | | | 193.2 | | | | | 1 | | | | | (1.6) | | | | | 196.4 | | | | | 1 | | | | | (6.2) | | | | | 209.4 | | | | | 1 | |
Real estate loans pledged against other collateralized borrowings (e) | | | | 732.3 | | | | | 3 | | | | | 8.2 | | | | | 676.8 | | | | | 3 | | | NM | | | | 243.1 | | | | | 1 | |
| | | | | | | | |
Total retail | | | | 10,565.2 | | | | | 49 | | | | | (2.7) | | | | | 10,859.6 | | | | | 49 | | | | | (2.4) | | | | | 11,130.6 | | | | | 52 | |
| | | | | | | | |
Total loans, net of unearned | | | $ | | 21,660.7 | | | | | 100 | % | | | | | (2.0)% | | | | $ | | 22,106.7 | | | | | 100 | % | | | | | 2.8 % | | | | $ | | 21,504.2 | | | | | 100 | % | |
| | | | | | | | |
|
(a) | | | | Includes nonconstruction income property loans and land loans not involving development. |
|
(b) | | | | Includes homebuilder, condominium, income property construction and land development loans. |
|
(c) | | | | Includes primarily home equity loans and lines of credit (average for 2008, 2007, and 2006 $3.7 billion, $3.9 billion and $4.9 billion, respectively). |
|
(d) | | | | Includes one-time close product. |
|
(e) | | | | Includes on-balance sheet securitizations of home equity loans. |
Commercial, financial and industrial (C&I) loans comprised 66 percent of total commercial loans in 2008 as compared to 63 percent in 2007. The C&I portfolio was primarily generated by the Regional Bank and is diversified across industry types. This portfolio grew $236.5 million or 3 percent in 2008 primarily as a result of approximately $340 million, net of LOCOM, of smaller issuer trust preferred loans that were moved to the loan portfolio in the second quarter of 2008.
Income commercial real estate (Income CRE) includes loans for the construction and mini-permanent financing of traditional commercial real estate property types, including office, multi-family, industrial and retail space. Residential commercial real estate (Residential CRE) includes loans to homebuilders and condominium developers. Both are included in the commercial real estate commercial and commercial real estate construction line items in Table 10 above. In 2008, Income CRE and Residential CRE averaged $3.7 billion as compared to $4.1 billion in 2007.
Income CRE loans increased $133.5 million or 7 percent which was the result of loan growth in the first half of 2008 and comprised 19 percent of total commercial loans. Average loan growth in 2008 was largely generated within the Regional Bank.
22
FIRST HORIZON NATIONAL CORPORATION
Residential CRE consists of loans to developers to finance land, land acquisition and development, and vertical construction of attached and detached single family residences (including condominiums). Residential CRE comprised 15 percent of commercial loans in 2008. Approximately two-thirds of the Residential CRE portfolio was generated by the national construction lending platform, with the remaining through the Regional Bank. Residential CRE loans decreased 24 percent or $541.2 million from 2007 due to the wind-down of national construction lending products and higher charge-offs since 2007. Additional commercial loan information is provided in Table 11.
Residential real estate loans (inclusive of real estate loans pledged against other collateralized borrowings) comprised 83 percent of the retail loan portfolio in 2008 and 78 percent in 2007. This category of loans includes first and second-lien home equity lines and loans and residential first mortgages. This portfolio increased 4 percent or $313.2 million as a result of approximately $600 million of permanent mortgages that were transferred from held for sale to the loan portfolio throughout 2008. The one time close (OTC) portfolio comprised 14 percent of the retail portfolio in 2008 compared to 19 percent in 2007 and contracted by $594.2 million consistent with the discontinuation of national construction lending. These loans were provided for construction and permanent mortgage financing to individuals for the purpose of constructing a home.
The credit card and other retail portfolios (automobile and other retail installment loans requiring periodic payments of principal and interest) are relatively modest in size and declined 4 percent in 2008.
The commercial and retail construction and home equity portfolios are expected to continue to contract in 2009 due to conditions in the housing market and FHN’s strategic goal to reduce real estate concentrations in general. This contraction will likely more than offset new loan production.
Table 11 - Contractual Maturities of Commercial Loans on December 31, 2008
| | | | | | | | |
(Dollars in thousands) | | Within 1 Year | | After 1 Year
Within 5 Years | | After 5 Years | | Total |
|
Commercial, financial and industrial | | | $ | | 3,824,664 | | | | $ | | 2,931,638 | | | | $ | | 1,107,425 | | | | $ | | 7,863,727 | |
Real estate commercial | | | | 595,840 | | | | | 687,174 | | | | | 171,026 | | | | | 1,454,040 | |
Real estate construction | | | | 1,443,699 | | | | | 334,441 | | | | | - | | | | | 1,778,140 | |
|
Total commercial loans, net of unearned income | | | $ | | 5,864,203 | | | | $ | | 3,953,253 | | | | $ | | 1,278,451 | | | | $ | | 11,095,907 | |
|
For maturities over one year: | | | | | | | | |
Interest rates – floating | | | | | $ | | 2,817,344 | | | | $ | | 647,299 | | | | $ | | 3,464,643 | |
Interest rates – fixed | | | | | | 1,135,909 | | | | | 631,152 | | | | | 1,767,061 | |
|
Total | | | | | $ | | 3,953,253 | | | | $ | | 1,278,451 | | | | $ | | 5,231,704 | |
|
Investment Securities
The investment portfolio of FHN consists principally of debt securities used as a source of income, liquidity and collateral for repurchase agreements or public fund deposits. Additionally, the investment portfolio is used as a tool to manage risk from movements in interest rates. As of December 31, 2008, all securities in the portfolio were classified as available-for-sale (AFS). Table 12 shows information pertaining to the composition, yields and contractual maturities of the investment securities portfolio.
Investment securities averaged $3.0 billion in 2008 compared to $3.4 billion in 2007 and represented 10 percent of earning assets in both 2008 and 2007.
On December 31, 2008, AFS securities totaled $3.1 billion and consisted of government agency issued mortgage-backed securities (MBS), government agency issued collateralized mortgage obligations (CMO), U.S. Treasuries, U.S. government agencies, municipal bonds, and equity securities. On December 31, 2008, these securities had $69.2 million of net unrealized gains that resulted in an increase in book equity of $42.8 million, net of $26.4 million of deferred income taxes. See Note 3 – Investment Securities for additional detail. On December 31, 2007, AFS securities totaled $3.0 billion and had $33.5 million of net unrealized gains that resulted in an increase in book equity of $20.5 million, net of $13.0 million of deferred income taxes.
23
FIRST HORIZON NATIONAL CORPORATION
Table 12 - Contractual Maturities of Investment Securities on December 31, 2008 (Amortized Cost)
| | | | | | | | | | | | | | | | |
(Dollars in thousands) | | Within 1 Year | | After 1 Year
Within 5 Years | | After 5 Years
Within 10 Years | | After 10 Years |
| | Amount | | Yield | | Amount | | Yield | | Amount | | Yield | | Amount | | Yield |
|
Total securities held to maturity | | | $ | | - | | | | | - | % | | | | $ | | - | | | | | - | % | | | | $ | | - | | | | | - | % | | | | $ | | - | | | | | - | % | |
|
Securities available for sale (AFS): | | | | | | | | | | | | | | | | |
Government agency issued MBS
and CMO** | | | $ | | - | | | | | - | % | | | | $ | | - | | | | | - | % | | | | $ | | 135,913 | | | | | 6.16 | % | | | | $ | | 2,385,073 | | | | | 6.04 | % | |
U.S. Treasuries | | | | 7,995 | | | | | 0.73 | | | | | 39,916 | | | | | 2.18 | | | | | - | | | | | - | | | | | - | | | | | - | |
Other U.S. government agencies | | | | - | | | | | - | | | | | 22,567 | | | | | 4.45 | | | | | 108,649 | | | | | 5.67 | | | | | - | | | | | - | |
States and municipalities* | | | | - | | | | | - | | | | | 1,650 | | | | | 2.55 | | | | | 6,890 | | | | | 3.61 | | | | | 57,375 | | | | | 3.22 | |
Other | | | | 1,366 | | | | | 10.00 | | | | | 848 | | | | | 4.93 | % | | | | | - | | | | | - | | | | | 287,663 | *** | | | | | 4.88 | |
|
Total | | | $ | | 9,361 | | | | | 2.08 | % | | | | $ | | 64,981 | | | | | 2.95 | % | | | | $ | | 251,452 | | | | | 5.88 | % | | | | $ | | 2,730,111 | | | | | 5.86 | % | |
|
|
* | | | | Weighted average yields on tax-exempt obligations have been computed by adjusting allowable tax-exempt income to a fully taxable equivalent basis. |
|
** | | | | Represents government agency-issued mortgage-backed securities and collateralized mortgage obligations which, when adjusted for early paydowns, have an estimated average life of 1.41 years. |
|
*** | | | | Represents equity securities with no stated maturity. |
Loans Held for Sale/Loans Held for Sale – Divestiture
Loans held for sale consists of the mortgage warehouse, student loans, small business loans, and home equity loans. Small issuer trust preferred loans were included in average loans held for sale through the third quarter 2008. The mortgage warehouse accounted for the majority of loans held for sale during 2008, but declined in the latter half of 2008 as a result of the sale of national mortgage origination offices to MetLife. Loans held for sale represented 9 percent of total earning assets in 2008 compared with 12 percent in 2007. During 2008 loans held for sale averaged $2.6 billion, a decrease of 33 percent, or $1.3 billion from 2007. This decline is primarily related to a smaller warehouse as the national mortgage origination platform was sold in August 2008 and the remaining warehouse is contracting. Also impacting the decrease were moves of first and second-lien mortgages and small issuer trust preferred loans to the loan portfolio throughout 2008. Since mortgage warehouse loans and other loans held for sale are generally held in inventory for a short period of time, there may be significant differences between average and period-end balances. On December 31, 2008, there were no loans classified as held for sale – divestiture although these loans averaged $110.4 million as FHN completed the final First Horizon Bank branch sale in the second quarter 2008.
Trading Securities/Other Earning Assets
Trading securities decreased 30 percent to $1.9 billion in 2008 from $2.7 billion in 2007 primarily as a result of trading inventory management initiatives beginning in 2007. Other earning assets, which are comprised of securities purchased under agreements to resell, federal funds sold and interest-bearing deposits with other financial institutions, decreased slightly by 3 percent to $1.3 billion in 2008 from $1.4 billion in 2007 due to lower levels of securities purchased under agreements to resell in Capital Markets. Offsetting this decline was an increase in interest bearing cash as the Federal Reserve began paying interest on these deposits in the fourth quarter 2008.
CORE DEPOSITS
During 2008, core deposits decreased 4 percent, or $512.6 million and averaged $12.9 billion. Interest-bearing core deposits increased 4 percent or $319.2 million to an average balance of $8.6 billion in 2008. Growth in interest-bearing core deposits is primarily due to growth in savings deposits. Noninterest- bearing core deposits averaged $4.3 billion in 2008 and $5.1 billion in 2007 as custodial deposits were transferred when the related serviced loans were sold in 2008 and competition for deposits increased in 2008.
SHORT-TERM PURCHASED FUNDS/LONG-TERM DEBT
Short-term purchased funds (certificates of deposit greater than $100,000, federal funds purchased, securities sold under agreements to repurchase, trading liabilities, commercial paper, and other short-term borrowings), averaged
24
FIRST HORIZON NATIONAL CORPORATION
$11.3 billion for 2008, down 20 percent from $14.0 billion in 2007. The decrease was primarily driven by a decline in purchased CD’s as FHN focused on lower cost more stable funding sources such as the Federal Reserve term-auction facility and Federal Home Loan Bank borrowings. Purchased federal funds also decreased as lending among financial institutions tightened in 2008. Short-term purchased funds accounted for 37 percent of FHN’s funding (core deposits plus purchased funds and term borrowings) in 2008, and 41 percent in 2007. See Note 9 – Short-Term Borrowings for additional information.
Long-term debt includes senior and subordinated borrowings and advances with original maturities greater than one year. Average long-term debt decreased 7 percent, or $459.1 million, and averaged $6.1 billion in 2008. As of December 31, 2008, long-term debt was $4.8 billion, a decrease of 30 percent, or $2.1 billion from 2007 year-end. The decrease was the result of bank note maturities and repurchases as funding needs decreased due to asset contraction. See Note 10 – Long-Term Debt for additional information.
INCOME STATEMENT REVIEW – 2007 COMPARED TO 2006
A net loss was reported for 2007 of $170.1 million, or $1.29 diluted earnings per share. Earnings for 2006 were $462.9 million, or $3.45 diluted earnings per share. Return on average shareholders’ equity and return on average assets for 2007 were (7.02) percent and (.45) percent, respectively, compared to 19.1 percent and 1.19 percent in 2006.
There was no cumulative effect of a change in accounting principle adjustment that impacted results in 2007. Earnings in 2006 included a favorable impact of $1.3 million (net of tax) or $.01 per diluted share from the cumulative effect of a change in accounting principle. FHN adopted SFAS No. 123 (revised 2004), “Share-Based Payment” (SFAS No. 123-R) in 2006 and retroactively applied the provisions of the standard. A cumulative effect adjustment of $1.1 million was recognized, reflecting the change in accounting for share-based compensation expense based on estimated forfeitures rather than actual forfeitures. In 2006, FHN also adopted SFAS No. 156, “Accounting for Servicing of Financial Assets,” which allows servicing assets to be measured at fair value with changes in fair value reported in current earnings. The adoption of this standard was applied on a prospective basis and resulted in a cumulative effect adjustment of $.2 million, representing the excess of the fair value of the servicing asset over the recorded value on January 1, 2006.
Comparisons between reported earnings are directly and significantly affected by a number of factors in both 2007 and 2006. Several significant items including housing and credit market disruptions, increased provisioning, restructuring, repositioning and efficiency initiatives, and goodwill impairment impacted FHN’s performance in 2007. The sale of FHN’s national merchant processing business and related transactions had a significant impact on 2006 results. Further details on these and other items of significance impacting 2006 are presented below.
Following an updated valuation based on strategic cash flow projections and market-to-book values, FHN incurred a fourth quarter 2007 non-cash pre-tax impairment charge of $71.1 million for the write-down of goodwill associated with the Mortgage Banking business segment. FHN engaged an independent valuation firm to assist in computing the fair value estimate for the impairment assessment by utilizing two separate valuation methodologies and applying a weighted average to each methodology in order to determine fair value for the Mortgage Banking business segment. The valuation methodologies utilized included a discounted cash flow valuation technique and a comparison of the average price to book value of comparable businesses.
Throughout 2007, FHN conducted an ongoing, company-wide review of business practices with the goal of improving overall profitability and productivity. Management announced its intention to sell 34 full-service First Horizon Bank branches in its national banking markets, as well as plans to right size First Horizon Home Loans’ mortgage banking operations and balance sheet utilization and to downsize national lending operations, in order to redeploy capital to higher-return businesses. Total net charges of $98.7 million were recognized in 2007 related to restructuring, repositioning and efficiency initiatives. See Table 1 for further details.
Also impacting results in 2007 were $55.7 million of expenses associated with the recognition of a contingent guarantee related to Visa’s litigation matters.
25
FIRST HORIZON NATIONAL CORPORATION
Net interest income declined to $940.6 million in 2007 compared to $996.9 million in 2006 as earning assets declined 2 percent to $33.4 billion and interest-bearing liabilities declined 1 percent to $28.9 billion in 2007. Net interest margin was 2.82 percent for 2007 compared to 2.93 in 2006. The decline in the margin was primarily attributable to competitive pricing pressure in a contracting national housing market, additional non-accrual construction loans, and higher deposit rates in Tennessee markets.
Noninterest income contributed 48 percent to total revenue in 2007 compared to 54 percent in 2006. Capital markets noninterest income decreased to $334.4 million in 2007 from $383.0 million in 2006. Revenues from fixed income sales increased $37.5 million from 2006 while revenues from other products decreased $86.2 million.
Mortgage banking noninterest income decreased 81 percent in 2007 to $69.5 million from $370.6 million in 2006. Net revenue from origination activity decreased 62 percent to $118.4 million in 2007 from $308.1 million in 2006 reflecting declines in gain on sales margins experienced in 2007 as a result of secondary market disruptions causing significant spread-widening on ARM and nonagency eligible production throughout the second half of the year. Net servicing income decreased $106.4 million or 284 percent in 2007. Total fees associated with mortgage servicing decreased 5 percent in 2007 to $311.4 million as the change in PSA reduced income by $36.2 million offset by an increase in the average portfolio. Servicing hedging activities and changes in MSR value other than runoff negatively impacted net servicing revenues by $133.5 million in 2007 as compared to 2006. In 2007, there was a reduction of approximately $135 million in the carrying value of servicing assets primarily associated with increased weighting of broker quotes and observable trading data. Additionally, the change in the value of MSR due to runoff increased net revenues by $43.9 million in 2007 as compared to 2006 of which $19.7 million is attributable to the change in PSA mentioned above.
Noninterest income from deposit transactions and cash management increased to $175.3 million in 2007 from $168.6 million in 2006, reflecting increased NSF charges and corporate cash management fees. Noninterest income from loans sales and securitizations decreased to $23.9 million in 2007 from $51.7 million in 2006 primarily due to market disruptions experienced during the second half of 2007 which resulted in reduced volume delivered into the secondary market and valuation adjustments on related servicing assets. Results for 2006 included the loss of $12.7 million from the sale of no-balance HELOC. Noninterest income from insurance commissions decreased to $31.7 million in 2007 from $46.6 million in 2006 due to the sale of two insurance subsidiaries in 2006. Gains on divestitures of $15.7 million were recognized in 2007 related to the sale of certain First Horizon bank branches. Net securities losses of $1.2 million were recognized in 2007 primarily related to changes in the investment portfolio. In 2006, $65.6 million of net securities losses were principally related to restructuring the investment portfolio in first quarter as well as net securities gains from the sale of MasterCard Inc. securities and venture capital investments. All other income remained flat at $170.4 million in 2007 compared to $170.5 million in 2006. Other income was negatively impacted incrementally by $16.8 million related to LOCOM and other consumer lending adjustments.
Total noninterest expense for 2007 increased 6 percent to $1.8 billion from $1.7 billion in 2006. Personnel expense decreased 5 percent to $968.1 million from $1.0 billion in 2006 primarily due to restructuring, repositioning, and efficiency initiatives and reductions in personnel expense in Regional Banking, Mortgage Banking, and Capital Markets directly related to revenue contraction. Occupancy costs increased 12 percent or $14.5 million primarily due to restructuring initiatives. In 2007, FHN recognized goodwill impairments of $13.0 million related to certain First Horizon bank branches and $71.1 million for the Mortgage Banking segment. All other noninterest expense, which includes advertising and public relations costs, computer software expense, travel and entertainment, contract employment, and various other expense items (see Table 9 for additional detail) increased 36 percent, or $33.9 million in 2007. This increase included the $55.7 million related to FHN’s proportionate share of Visa’s various legal matters. Computer software, legal and professional fees, and other expenses in 2007 were incurred in FHN’s restructuring, repositioning, and efficiency initiatives.
The provision for loan losses increased 228 percent to $272.8 million in 2007 from $83.1 million in 2006. The increase primarily reflects deterioration in the national residential real estate construction portfolios (one-time close retail real estate construction loans extended to consumers and loans to homebuilders, including condominium construction loans).
26
FIRST HORIZON NATIONAL CORPORATION
STATEMENT OF CONDITION REVIEW – 2007 COMPARED TO 2006
During 2007, earning assets averaged $33.4 billion compared with $34.0 billion for 2006. Average earning assets were 88 percent of total average assets in 2007 and 2006. Average loans increased 3 percent to $22.1 billion during 2007 as retail loans decreased by 2 percent which was more than offset by growth in commercial loans of 8 percent. Average loans represented 66 percent of average earning assets in 2007 compared to 63 percent in 2006.
Commercial, financial and industrial loans increased 7 percent in 2007, or $435.0 million, reflecting growth in the regional middle market portfolio. Income commercial real estate (Income CRE) and residential commercial real estate (Residential CRE) averaged $4.1 billion in 2007 as compared to $3.7 billion in 2006. The Income CRE portfolio increased $260.1 million or 16 percent in 2007. Residential CRE grew $149.9 million or 7 percent in 2007. The residential real estate loan portfolio (including real estate loans pledged against other collateralized borrowings) decreased by 4 percent, or $306.3 million in 2007 as a result of the strategic plan to sell a significant portion of new production through the first half of 2007, and a decrease in production related to policy and strategic changes restricting production beginning in third quarter 2007. The retail real estate construction portfolio increased 3 percent or $61.0 million in 2007.
Investment securities averaged $3.4 billion in 2007 and $3.5 billion in 2006. Investment securities represented 10 percent of earning assets in 2007 and 2006.
Loans held for sale represented 12 percent of total earning assets in 2007 compared with 13 percent in 2006. During 2007 loans held for sale averaged $3.9 billion, a decrease of 11 percent, or $.5 billion from 2006. This decline was related to lower levels of HELOC, second lien, small issuer trust preferred and mortgage warehouse loans held for sale.
Trading securities decreased 5 percent to $2.7 billion in 2007 from $2.8 billion in 2006. Other earning assets decreased 28 percent to $1.4 billion in 2007 from $1.9 billion in 2006 due to lower levels of securities purchased under agreements to resell in Capital Markets.
During 2007, core deposits increased 3 percent, or $417.5 million, and averaged $13.4 billion. Interest-bearing core deposits increased 6 percent or $487.4 million to an average balance of $8.3 billion in 2007. Growth in interest-bearing core deposits was primarily due to growth in savings deposits. Average noninterest-bearing core deposits decreased slightly from $5.2 billion in 2006 to $5.1 billion in 2007.
Short-term purchased funds averaged $14.0 billion for 2007, down 15 percent from $16.4 billion in the previous year. Long-term borrowings increased 30 percent, or $1.5 billion, and averaged $5.6 billion in 2007. The increase in term borrowings was utilized to fund loan growth.
CAPITAL
Management’s objectives are to provide capital sufficient to cover the risks inherent in FHN’s businesses, to maintain excess capital to well-capitalized standards, and to assure ready access to the capital markets. In the second quarter of 2008, FHN completed a public offering of 69 million shares of common stock. In the fourth quarter 2008, FHN completed the issuance and sale of preferred stock and a common stock warrant under the U.S. Treasury Capital Purchase Program which generated $866.5 million of proceeds. To conserve FHN’s capital, the quarterly cash dividend was replaced with a quarterly stock dividend at a rate to be determined quarterly.
Average shareholders’ equity increased to $2.6 billion in 2008 from $2.4 billion in 2007 which was flat compared to 2006. Shareholders’ equity was $3.3 billion at year-end 2008, an increase of 54 percent from 2007, which decreased 13 percent from year-end 2006. The increase in shareholders’ equity during 2008 was a result of the second quarter stock issuance that generated approximately $660 million of net proceeds and the proceeds from the CPP preferred issuance. As a result of these equity issuances, shareholder’s equity increased despite a reported net loss and cash dividends paid in 2008. Pursuant to board authority, FHN may repurchase shares from time to time and will evaluate the level of capital and take action designed to generate or use capital, as
27
FIRST HORIZON NATIONAL CORPORATION
appropriate, for the interests of the shareholders, subject to legal, regulatory, and CPP constraints. In order to maintain FHN’s well-capitalized status while sustaining strong balance sheet growth, FTBNA issued approximately $250 million of subordinated notes which qualify as Tier 2 capital under the risk-based capital guidelines in 2006. FHN also repurchased 4 million shares of its common stock in 2006 through an accelerated share repurchase program under an existing share repurchase authorization. This share repurchase program was concluded for an adjusted purchase price of $165.1 million. The share repurchase was funded with a portion of the proceeds from the merchant processing sale.
Table 13 - Capital Ratios
| | | | | | |
| | 2008 | | 2007 | | 2006 |
|
Average shareholders’ equity to average assets | | | | 7.66 | % | | | | | 6.35 | % | | | | | 6.25 | % | |
Period-end shareholders’ equity to assets | | | | 10.57 | | | | | 5.77 | | | | | 6.49 | |
FHN’s tier 1 risk-based capital | | | | 15.03 | | | | | 8.12 | | | | | 8.87 | |
FHN’s total risk-based capital | | | | 20.19 | | | | | 12.75 | | | | | 13.21 | |
FHN’s leverage ratio | | | | 12.22 | | | | | 6.64 | | | | | 6.94 | |
Tangible common equity to risk weighted assets ratio | | | | 8.80 | | | | | 6.16 | | | | | 6.96 | |
Tangible common equity to tangible assets ratio | | | | 7.34 | | | | | 5.13 | | | | | 5.65 | |
|
Banking regulators define minimum capital ratios for bank holding companies and their bank subsidiaries. Based on the capital rules and definitions prescribed by the banking regulators, should any depository institution’s capital ratios decline below predetermined levels, it would become subject to a series of increasingly restrictive regulatory actions. The system categorizes a depository institution’s capital position into one of five categories ranging from well-capitalized to critically under-capitalized. For an institution to qualify as well-capitalized, Tier 1 Capital, Total Capital and Leverage capital ratios must be at least 6 percent, 10 percent and 5 percent, respectively. As of December 31, 2008, FHN and FTBNA had sufficient capital to qualify as well-capitalized institutions as shown in Note 13 – Regulatory Capital. In 2009, capital ratios are expected to remain strong and significantly above well-capitalized standards despite a difficult operating environment.
Table 14 - Issuer Purchases of Equity Securities
| | | | | | | | |
(Volume in thousands) | | Total Number
of Shares
Purchased | | Average Price
Paid per Share | | Total Number of
Shares Purchased
as Part of Publicly
Announced Programs | | Maximum Number
of Shares that May
Yet Be Purchased
Under the Programs |
|
2008 | | | | | | | | |
October 1 to October 31 | | | | - | | | | | NA | | | | | - | | | | | 37,417 | |
November 1 to November 30 | | | | * | | | | | 8.39 | | | | | * | | | | | 37,417 | |
December 1 to December 31 | | | | 4 | | | | | 10.33 | | | | | 4 | | | | | 37,413 | |
| | |
Total | | | | 4 | | | | $ | | 10.33 | | | | | 4 | | | |
| | |
* Amount is less than 500 shares
Compensation Plan Programs:
|
– | | | | A consolidated compensation plan share purchase program was announced on August 6, 2004. This plan consolidated into a single share purchase program all of the previously authorized compensation plan share programs as well as the renewal of the authorization to purchase shares for use in connection with two compensation plans for which the share purchase authority had expired. The total amount originally authorized under this consolidated compensation plan share purchase program is 25.1 million shares. On April 24, 2006, an increase to the authority under this purchase program of 4.5 million shares was announced for a new total authorization of 29.6 million shares. Effective October 1, 2008, the authority was increased to reflect the 3.0615% stock dividend distributed effective October 1, 2008. The shares may be purchased over the option exercise period of the various compensation plans on or before December 31, 2023. Stock options granted after January 2, 2004, must be exercised no later than the tenth anniversary of the grant date. On December 31, 2008, the maximum number of shares that may be purchased under the program was 29.7 million shares. |
Other Programs:
| | | On October 16, 2007, the board of directors approved a 7.5 million share purchase authority that will expire on December 31, 2010. Effective October 1, 2008, the authority was increased to reflect the 3.0615% stock dividend distributed effective October 1, 2008. Purchases will be made in the open market or through privately negotiated transactions and will be subject to market conditions, accumulation of excess | 28
FIRST HORIZON NATIONAL CORPORATION
| | | | equity, prudent capital management, and legal and regulatory constraints. Until the third anniversary of the sale of the preferred shares issued in the CPP, FHN may not repurchase common or other equity shares (subject to certain limited exceptions) without the UST’s approval. This authority is not tied to any compensation plan, and replaces an older non-plan share purchase authority which was terminated. On December 31, 2008, the maximum number of shares that may be purchased under the program was 7.7 million shares. |
On December 31, 2008, book value per common share was $12.13 compared to $16.03 for 2007 and $18.68 for 2006. Average shares for the three-year period were 180.7 million in 2008, 132.1 million in 2007 and 130.6 million in 2006. Period-end shares outstanding for this same three-year period were 205.3 million, 132.6 million and 131.1 million, respectively. FHN’s shares are traded on The New York Stock Exchange under the symbol FHN. The sales price ranges, net income/(loss) available to common shareholders per share and dividends declared by quarter, for each of the last two years, are presented in Table 27. All per share information has been adjusted for the stock dividends declared in July and October 2008.
RISK MANAGEMENT
FHN has an enterprise-wide approach to risk governance, measurement, management, and reporting including an economic capital allocation process that is tied to risk profiles used to measure risk-adjusted returns. The Enterprise-wide Risk/Return Management Committee oversees risk management governance. Committee membership includes the CEO and other executive officers of FHN. The Chief Risk Officer oversees reporting for the committee. Risk management objectives include evaluating risks inherent in business strategies, monitoring proper balance of risks and returns, and managing risks to minimize the probability of future negative outcomes. The Enterprise-wide Risk/Return Management Committee oversees and receives regular reports from the Credit Risk Management Committee, Asset/Liability Committee (ALCO), Capital Management Committee, Compliance Risk Committee, Operational Risk Committee, and the Executive Program Governance Forum. The Chief Credit Officer, EVP Funds Management and Corporate Treasurer, Chief Financial Officer, SVP Corporate Compliance, Chief Risk Officer, and EVP and Chief Information Officer chair these committees respectively. Reports regarding Credit, Asset/Liability Management, Market Risk, Capital Management, Compliance, and Operational Risks are provided to the Credit Policy and Executive and/or Audit Committee of the Board and to the full Board. In response to FHN’s participation in the U.S. Treasury’s Troubled Asset Relief Program (TARP), the Compensation Committee, Chief Risk Officer, and Chief Credit Officer convene annually to review and assess key business risks and the relation of those risks to compensation and incentives plans in which named executives participate. The first of such meetings occurred in January 2009.
Risk management practices include key elements such as independent checks and balances, formal authority limits, policies and procedures, and portfolio management all executed through experienced personnel. The Internal Audit Department, Credit Risk Assurance Group, Credit Policy and Regulations Group, and Credit Portfolio Management Group also evaluate risk management activities. These evaluations are reviewed with management and the Audit Committee, as appropriate.
MARKET UNCERTAINTIES AND PROSPECTIVE TRENDS
Given the significant current uncertainties that exist within the housing and credit markets, it is anticipated that 2009 will continue to be challenging for FHN. While the reduction of mortgage banking operations is expected to significantly decrease sensitivity to market pricing uncertainty, FHN will continue to be affected by market factors as it disposes of the remaining mortgage loan warehouse and attempts to reduce the remaining servicing portfolio. In addition, current volatility and reduced liquidity in the capital markets may adversely impact market execution putting continued pressure on revenues. As difficulties in the credit markets persist, FHN will continue to adapt its liquidity management strategies. Further deterioration of general economic conditions could result in increased credit costs depending on the length and depth of this market cycle.
INTEREST RATE RISK MANAGEMENT
Interest rate risk is the risk that changes in prevailing interest rates will adversely affect assets, liabilities, capital, income and/or expense at different times or in different amounts. ALCO, a committee consisting of senior management that meets regularly, is responsible for coordinating the financial management of interest rate risk.
29
FIRST HORIZON NATIONAL CORPORATION
FHN primarily manages interest rate risk by structuring the balance sheet to attempt to maintain the desired level of associated earnings while operating within prudent risk limits and thereby preserving the value of FHN’s capital.
Net interest income and the financial condition of FHN are affected by changes in the level of market interest rates as the repricing characteristics of loans and other assets do not necessarily match those of deposits, other borrowings and capital. When earning assets reprice more quickly than liabilities, net interest income will benefit in a rising interest rate environment and will be negatively impacted when interest rates decline. In the case of floating rate assets and liabilities with similar repricing frequencies, FHN may also be exposed to basis risk which results from changing spreads between earning and borrowing rates. Generally, when interest rates decline, Mortgage Banking faces increased prepayment risk associated with MSR.
FHN uses simulation analysis as its primary tool to evaluate interest rate risk exposure. This type of analysis computes net interest income at risk under a variety of market interest rate scenarios to dynamically identify interest rate risk exposures. This simulation, which considers forecasted balance sheet changes, prepayment speeds, deposit mix, pricing impacts, and other changes in the net interest spread, provides an estimate of the annual net interest income at risk for given changes in interest rates. The results help FHN develop strategies for managing exposure to interest rate risk. Like any forecasting technique, interest rate simulation modeling is based on a number of assumptions and judgments. In this case, the assumptions relate primarily to loan and deposit growth, asset and liability prepayments, interest rates, and on- and off-balance sheet hedging strategies. Management believes the assumptions used in its simulations are reasonable. Nevertheless, simulation modeling provides only a sophisticated estimate, not a precise calculation of exposure to changes in interest rates.
The simulation models used to analyze the regional bank’s net interest income create various at-risk scenarios looking at increases and/or decreases in interest rates from an instantaneous movement or a staggered movement over a certain time period. In addition, the risk of changes in the yield curve is estimated by flattening and steepening the yield curve to historical levels. These hypothetical rate moves are used to simulate net interest income exposure to historically extreme movements in interest rates. Management reviews these different scenarios to determine alternative strategies and executes based on that evaluation. The models are regularly updated to incorporate management action. Any scenarios that indicate a change in net interest income of three percent or more from a base NII are presented to the Board quarterly. At December 31, 2008 the interest rate environment was at an unprecedented low level. Under these market conditions, traditional scenarios forecasting declining rates are no longer meaningful. Accordingly, declining rate shock scenarios (including minus 25 basis points and minus 200 basis points) that had been modeled in prior periods were not performed. The remaining scenarios performed attempt to capture risk to NII from rising rates and changes in the shape of the yield curve. Based on the rate sensitivity position on December 31, 2008, net interest income exposure over the next 12 months to a rate shock of plus 200 basis points is estimated to be a favorable variance of approximately 7 percent of base net interest income. A flattening yield curve scenario results in a favorable variance in net interest income of approximately 2 percent. Both of these are hypothetical rate scenarios. These scenarios are used as one estimate of risk, and do not necessarily represent management’s current view of future interest rates or market developments. Actual results will differ from simulated results due to timing, magnitude and frequency of interest rate changes and changes in market conditions, and management’s strategies, among other factors, including those presented in the Forward-Looking Statements section of this MD&A.
The simulation models used to analyze Regional Banking’s net interest income exclude the potential impacts to certain elements of Mortgage Banking’s net interest income. Net interest income earned on swaps and similar derivative instruments used to protect the value of MSR increases when the yield curve steepens and decreases when the yield curve flattens. Other than the impact related to the immediate change in market value of balance sheet accounts, such as MSR, these simulation models and related hedging strategies exclude the dynamics related to how fee income and noninterest expense may be affected by actual changes in interest rates or expectations of changes. Due to the third quarter 2008 sale of certain mortgage banking operations, Mortgage Banking revenue mix was significantly impacted. In 2006, 2007 and through August 2008, Mortgage Banking revenue was primarily generated from originating, selling and servicing residential mortgage loans and was highly sensitive to changes in interest rates due to the direct effect changes in interest rates have on loan demand. After the third quarter divestiture, Mortgage Banking income was primarily composed of servicing residential mortgage loans and fair value adjustments to the remaining warehouse. In general, low or declining interest rates typically lead to increased origination fees and profit from the sale of loans but potentially lower servicing-related income
30
FIRST HORIZON NATIONAL CORPORATION
due to the impact of higher loan prepayments on the value of mortgage servicing assets. Conversely, high or rising interest rates typically reduce mortgage loan demand and hence income from originations and sales of loans while servicing-related income may rise due to lower prepayments. Net interest income earned on warehouse loans held for sale and on swaps and similar derivative instruments used to protect the value of MSR increases when the yield curve steepens and decreases when the yield curve flattens or inverts. Prior to the sale of certain mortgage banking operations to MetLife, the earnings impact from originations and sales of loans on total earnings was more significant than servicing-related income. Given the repositioning of mortgage banking operations in third quarter 2008, the origination activity has been significantly reduced thereby reducing interest rate risk exposure.
Lastly, a steepening yield curve positively impacts the demand for fixed income securities and, therefore, Capital Markets’ revenue.
Generally, the effects of a steepening yield curve on FHN’s consolidated pre-tax income are positive, especially when driven by falling short term rates, benefiting Capital Markets’ and Mortgage Banking’s results.
As a result of the MetLife transaction, mortgage banking origination activity was significantly reduced in periods after third quarter 2008 as FHN focuses on origination within its regional banking footprint. Accordingly, the following discussion of pipeline and warehouse related derivatives is primarily applicable to reporting periods occurring through the third quarter 2008.
To determine the amount of interest rate risk and exposure to changes in fair value of loan commitments, warehouse loans and MSR, Mortgage Banking uses multiple scenario rate shock analysis, including the magnitude and direction of interest rate changes, prepayment speeds, and other factors that could affect mortgage banking. In certain cases, derivative financial instruments are used to aid in managing the exposure of the balance sheet and related net interest income and noninterest income to changes in interest rates. As discussed in Critical Accounting Policies, derivative financial instruments are used by mortgage banking for two purposes. First, forward sales contracts and futures contracts are used to protect against changes in fair value of the pipeline and mortgage warehouse, primarily used from the time an interest rate is committed to the customer until the mortgage is sold into the secondary market due to increases in interest rates. Second, interest rate contracts are utilized to protect against MSR prepayment risk that generally accompanies declining interest rates. As interest rates fall, the value of MSR should decrease and the value of the servicing hedge should increase. The converse is also true. Prior to the January 1, 2006, adoption of SFAS No. 156, ineffectiveness in these hedging strategies (when changes in the value of the derivative instruments did not match changes in the value of the hedged portion of MSR for any given change in long-term interest rates) was reflected in noninterest income. Subsequent to the adoption of SFAS No. 156, mortgage servicing noninterest income reflects the change in fair value of the MSR asset combined with net economic hedging results.
Derivative instruments are also used to protect against the risk of loss arising from adverse changes in the fair value of a portion of Capital Markets’ securities inventory due to changes in interest rates. FHN does not use derivative instruments to protect against changes in fair value of loans or loans held for sale other than the mortgage pipeline, warehouse and certain small issuer trust preferred loans.
Management uses the results of interest rate exposure models to formulate strategies to improve balance sheet positioning, earnings, or both, within FHN’s interest rate risk, liquidity and capital guidelines.
Table 15 details the interest rate sensitivity profile on December 31, 2008, on capital markets trading securities based on projected cash flows categorized by anticipated settlement date and mortgage banking trading securities categorized by expected maturity dates. Also provided are the average rates earned on these trading securities. Table 15 also provides both the notional and fair values of derivative financial instruments held for trading. The information provided in this section, including the discussion regarding simulation analysis and rate shock analysis, is forward-looking. Actual results could differ because of interest rate movements, the ability of management to execute its business plans and other factors, including those presented in the Forward-Looking Statements section of this MD&A.
31
FIRST HORIZON NATIONAL CORPORATION
Table 15 - Risk Sensitivity Analysis
| | | | | | | | | | | | | | | | |
Held for Trading
(Dollars in millions) | | 2009 | | 2010 | | 2011 | | 2012 | | 2013 | | 2014+ | | Total | | Fair
Value |
|
Assets: | | | | | | | | | | | | | | | | |
Trading securities | | | $ | | 781 | | | | | - | | | | | - | | | | | - | | | | | - | | | | $ | | 165 | | | | $ | | 946 | | | | $ | | 946 | |
Average interest rate | | | | 4.03 | % | | | | | - | | | | | - | | | | | - | | | | | - | | | | | 13.99 | % | | | | | 5.77 | % | | | |
|
Interest Rate Derivatives (notional value): | | | | | | | | | | | | | | | | |
Capital Markets: | | | | | | | | | | | | | | | | |
Forward contracts: | | | | | | | | | | | | | | | | |
Commitments to buy | | | $ | | 4,567 | | | | | - | | | | | - | | | | | - | | | | | - | | | | | - | | | | $ | | 4,567 | | | | $ | | (28 | ) | |
Weighted average settlement price | | | | 101.24 | % | | | | | - | | | | | - | | | | | - | | | | | - | | | | | - | | | | | 101.24 | % | | | |
Commitments to sell | | | $ | | 4,750 | | | | | - | | | | | - | | | | | - | | | | | - | | | | | - | | | | $ | | 4,750 | | | | $ | | 28 | |
Weighted average settlement price | | | | 101.18 | % | | | | | - | | | | | - | | | | | - | | | | | - | | | | | - | | | | | 101.18 | % | | | |
Caps purchased | | | $ | | 10 | | | | $ | | 20 | | | | | - | | | | | - | | | | | - | | | | $ | | 16 | | | | $ | | 46 | | | | | * | |
Weighted average strike price | | | | 5.75 | % | | | | | 4.25 | % | | | | | - | | | | | - | | | | | - | | | | | 7.16 | % | | | | | 5.59 | % | | | |
Caps written | | | $ | | (10 | ) | | | | $ | | (20 | ) | | | | | - | | | | | - | | | | | - | | | | $ | | (16 | ) | | | | $ | | (46 | ) | | | | | * | |
Weighted average strike price | | | | 5.75 | % | | | | | 4.25 | % | | | | | - | | | | | - | | | | | - | | | | | 7.16 | % | | | | | 5.59 | % | | | |
Floors purchased | | | $ | | 20 | | | | $ | | 50 | | | | $ | | 150 | | | | $ | | 10 | | | | | - | | | | | - | | | | $ | | 230 | | | | $ | | 11 | |
Weighted average strike price | | | | 7.75 | % | | | | | 6.20 | % | | | | | 6.50 | % | | | | | 5.50 | % | | | | | - | | | | | - | | | | | 6.50 | % | | | |
Floors written | | | $ | | (20 | ) | | | | $ | | (50 | ) | | | | $ | | (150 | ) | | | | $ | | (10 | ) | | | | | - | | | | | - | | | | $ | | (230 | ) | | | | $ | | (11 | ) | |
Weighted average strike price | | | | 7.75 | % | | | | | 6.20 | % | | | | | 6.50 | % | | | | | 5.50 | % | | | | | - | | | | | - | | | | | 6.50 | % | | | |
Swap contracts purchased | | | $ | | 43 | | | | $ | | 107 | | | | $ | | 282 | | | | $ | | 336 | | | | $ | | 215 | | | | $ | | 170 | | | | $ | | 1,153 | | | | $ | | (89 | ) | |
Average pay rate (fixed) | | | | 6.70 | % | | | | | 6.23 | % | | | | | 5.72 | % | | | | | 5.21 | % | | | | | 5.51 | % | | | | | 5.28 | % | | | | | 5.55 | % | | | |
Average receive rate (floating) | | | | 4.89 | % | | | | | 3.60 | % | | | | | 3.78 | % | | | | | 2.72 | % | | | | | 3.03 | % | | | | | 3.21 | % | | | | | 3.27 | % | | | |
Swap contracts purchased | | | $ | | 270 | | | | $ | | 45 | | | | $ | | 75 | | | | | - | | | | | - | | | | | - | | | | $ | | 390 | | | | $ | | 12 | |
Average pay rate (floating) | | | | 4.03 | % | | | | | 3.66 | % | | | | | 3.82 | % | | | | | - | | | | | - | | | | | - | | | | | 3.95 | % | | | |
Average receive rate (fixed) | | | | 7.60 | % | | | | | 4.89 | % | | | | | 6.12 | % | | | | | - | | | | | - | | | | | - | | | | | 7.00 | % | | | |
Swap contracts sold | | | $ | | (43 | ) | | | | $ | | (107 | ) | | | | $ | | (282 | ) | | | | $ | | (155 | ) | | | | $ | | (165 | ) | | | | $ | | (157 | ) | | | | $ | | (909 | ) | | | | $ | | 61 | |
Average pay rate (floating) | | | | 4.89 | % | | | | | 3.60 | % | | | | | 3.78 | % | | | | | 3.58 | % | | | | | 3.39 | % | | | | | 3.47 | % | | | | | 3.65 | % | | | |
Average receive rate (fixed) | | | | 6.70 | % | | | | | 6.23 | % | | | | | 5.72 | % | | | | | 5.48 | % | | | | | 5.99 | % | | | | | 5.71 | % | | | | | 5.83 | % | | | |
Swap contracts sold | | | $ | | (270 | ) | | | | $ | | (45 | ) | | | | $ | | (75 | ) | | | | | - | | | | | - | | | | | - | | | | $ | | (390 | ) | | | | $ | | (12 | ) | |
Average pay rate (fixed) | | | | 7.60 | % | | | | | 4.89 | % | | | | | 6.12 | % | | | | | - | | | | | - | | | | | - | | | | | 7.00 | % | | | |
Average receive rate (floating) | | | | 4.03 | % | | | | | 3.66 | % | | | | | 3.82 | % | | | | | - | | | | | - | | | | | - | | | | | 3.95 | % | | | |
Futures contracts: | | | | | | | | | | | | | | | | |
Commitments to sell | | | $ | | 4 | | | | $ | | 4 | | | | | - | | | | | - | | | | | - | | | | | - | | | | $ | | 8 | | | | | * | |
Weighted average settlement price | | | | 98.79 | % | | | | | 98.17 | % | | | | | - | | | | | - | | | | | - | | | | | - | | | | | 98.48 | % | | | |
|
* Amount is less than $500,000
LIQUIDITY MANAGEMENT
ALCO focuses on the funding of assets with liabilities of the appropriate duration, while mitigating the risk of not meeting unexpected cash needs. The objective of liquidity management is to ensure the continuous availability of funds to meet the demands of depositors, other creditors and borrowers, and the requirements of ongoing operations. This objective is met by maintaining liquid assets in the form of trading securities and securities available for sale, growing core deposits, and the repayment of loans. ALCO is responsible for managing these needs by taking into account the marketability of assets; the sources, stability and availability of funding; and the level of unfunded commitments. See Note 26 – Derivatives and Off-Balance Sheet Arrangements for additional information. Subject to market conditions and compliance with applicable regulatory requirements from time to time, funds are available from a number of sources, including core deposits, the securities available for sale portfolio, the Federal Home Loan Bank (FHLB), the Federal Reserve Banks, access to Federal Reserve Bank programs such as the Term Auction Facility (TAF), availability to the overnight and term Federal Funds markets, and dealer and commercial customer repurchase agreements.
Core deposits are a significant source of funding and have been a stable source of liquidity for banks. The Federal Deposit Insurance Corporation insures these deposits to the extent authorized by law. Total loans, excluding loans held for sale and real estate loans pledged against other collateralized borrowings, to core deposits ratio was 160 percent in 2008, 156 percent in 2007, and 157 percent in 2006. Should loan growth exceed core deposit growth, alternative sources of funding loan growth may be necessary in order to maintain an adequate liquidity position. The ratio is expected to continue to decline as the national construction loan portfolios decrease.
In 2005, FTBNA established a bank note program providing additional liquidity of $5.0 billion. On December 31, 2008, $2.5 billion was outstanding through the bank note program with $1.6 billion scheduled to mature in 2009.
32
FIRST HORIZON NATIONAL CORPORATION
During 2008 and continuing into early 2009, market and other conditions have been such that FTBNA has not been able to utilize the bank note program, and instead has obtained less credit sensitive sources of funding including secured sources such as FHLB borrowings and Federal Reserve Term Auction Facility (TAF). FTBNA expects that its inability to use the bank note program will continue for some time to come, and cannot predict when that inability will end.
FHN and FTBNA have the ability to generate liquidity by issuing preferred or common equity or incurring other debt subject to market conditions and compliance with applicable regulatory requirements from time to time. In 2008, FHN issued 69 million shares of common stock which generated approximately $660 million in net proceeds. Additionally, in 2008, FHN issued and sold perpetual preferred stock and a common stock warrant to the UST under the CPP which generated $866.5 million in proceeds. Further, liquidity has been obtained through FTBNA’s issuance of approximately $250 million of subordinated notes in 2006. In addition, liquidity has been obtained through issuance of $300 million of guaranteed preferred beneficial interests in FHN’s junior subordinated debentures through two Delaware business trusts, wholly owned by FHN. See Note 10 – Long-Term Debt, Note 11 – Guaranteed Preferred Beneficial Interests in First Horizon’s Junior Subordinated Debentures and Note 12 – Preferred Stock and Other Capital for additional information. FHN also evaluates alternative sources of funding, including loan sales, syndications, and FHLB borrowings in its management of liquidity.
Parent company liquidity is maintained by cash flows stemming from dividends and interest payments collected from subsidiaries along with net proceeds from stock sales through employee plans, which represent the primary sources of funds to pay cash dividends to shareholders and interest to debt holders. The amount paid to the parent company through FTBNA common dividends is managed as part of FHN’s overall cash management process, subject to applicable regulatory restrictions described in the next paragraph. As discussed above, the parent company also has the ability to enhance its liquidity position by raising equity or incurring debt subject to market conditions and compliance with applicable regulatory requirements from time to time.
Certain regulatory restrictions exist regarding the ability of FTBNA to transfer funds to FHN in the form of cash, common dividends, loans or advances. At any given time, the pertinent portions of those regulatory restrictions allow FTBNA to declare preferred or common dividends without prior regulatory approval in an amount equal to FTBNA’s retained net income for the two most recent completed years plus the current year to date. For any period, FTBNA’s ‘retained net income’ generally is equal to FTBNA’s regulatory net income reduced by the preferred and common dividends declared by FTBNA. Excess dividends in either of the two most recent completed years may be offset with available retained net income in the two years immediately preceding it. Applying the applicable rules, FTBNA’s total amount available for dividends was ($222.1) million at December 31, 2008 and at January 1, 2009. Earnings (or losses) and dividends declared during 2009 will change the amount available during 2009 until December 31.
FTBNA has requested approval from the OCC to declare and pay dividends on its preferred stock outstanding payable in April 2009. FTBNA has not requested approval to pay common dividends to its sole common stockholder, FHN. Although FHN has funds available for dividends even without FTBNA dividends, availability of funds is not the sole factor considered by FHN’s Board in deciding whether or not to declare a dividend of any particular size; the Board also must consider FHN’s current and prospective capital, liquidity and other needs. Under the terms of the CPP FHN is not permitted to increase its cash common dividend rate for a period of three years without permission of the Treasury. At the time of the preferred share and common stock warrant issuance, FHN did not pay a common cash dividend.
On April 27, 2008, FHN’s Board of Directors determined to cease paying cash dividends following the cash dividend of 20 cents per share paid on July 1, 2008. Instead, the Board began declaring a dividend in shares of common stock. Quarterly stock dividends were distributed on October 1, 2008 and January 1, 2009. The Board has approved the stock dividend to be distributed in April 2009. The Board has also approved and FHN paid the 5% dividend on the CPP preferred on February 15, 2009. The Board currently intends to reinstate a cash dividend at an appropriate and prudent level once earnings and other conditions improve sufficiently, consistent with legal, regulatory, CPP, and other constraints.
The Consolidated Statements of Cash Flows provide information on cash flows from operating, investing and financing activities for each of the three years ended December 31, 2008, 2007, and 2006. In 2008, liquidity was
33
FIRST HORIZON NATIONAL CORPORATION
predominantly provided by a contracting balance sheet and common and preferred equity issuances. Net cash provided by operating activities was the primary contributor of liquidity during 2008. Net cash provided by operating activities was $4.3 billion and was primarily the result of balance sheet reductions that occurred in 2008 as well as the impact of cash-related operating income items. Loans held for sale decreased by $2.9 billion as the mortgage warehouse was significantly reduced due to the national mortgage origination platform sale in third quarter of 2008. While the mortgage warehouse was not sold to MetLife, a majority of the loans were sold after the transaction. Cash flows were not used to originate new loans through this channel. Trading securities decreased by $.8 billion and the decline was principally from trading inventory management initiatives at capital markets. Net positive cash flows from MSR sales and an increase in capital markets payables were offset by increases of capital markets receivables and other assets. Operating activities in 2007 and 2006 were also the primary contributor of net positive cash flows.
Investing activities provided $.2 billion of net cash in 2008 primarily from a $.4 billion decrease in loans. The net decrease in loans occurred as pay downs and charge-offs more than offset new loan growth. Cash provided through the available for sale securities portfolio was minimal in 2008 as sales and maturities were slightly higher than securities purchased. In 2007, investing activities had a negligible effect on cash flows while liquidity in 2006 was negatively impacted due to loan growth and restructuring within the investment portfolio.
In 2008, FHN’s primary use of cash related to financing activities. Cash provided by deposits and short-term borrowings decreased by $2.3 billion and $2.2 billion, respectively. The decline in deposits is primarily due to a decrease in certificates of deposit greater than $100,000 of $1.7 billion as FHN focused on lower cost funding. Purchased fed funds declined due to tightened credit markets and were replaced by funding from the Federal Reserve’s TAF. Bank and extendable notes matured or were repurchased, consistent with balance sheet contraction. Cash proceeds were generated through the issuance of 69 million common shares and through participation in the U.S. Treasury CPP. The common stock issuance provided approximately $660 million net proceeds while the issuance of preferred CPP and common stock warrant to the U.S. Treasury provided $866.5 million. In 2007, liquidity from financing activities was negatively impacted from deposit declines while cash flow in 2006 was positively impacted by long-term debt issuances and increased short-term borrowings.
Off-balance Sheet Arrangements and Other Contractual Obligations
First Horizon Home Loans, the former mortgage banking division of FHN, originated conventional conforming and federally insured single-family residential mortgage loans. Likewise, FTN Financial Capital Assets Corporation purchases the same types of loans from customers. Substantially all of these mortgage loans are exchanged for securities, which are issued through investors, including government sponsored enterprises (GSE), such as Government National Mortgage Association (GNMA) for federally insured loans and Federal National Mortgage Association (FNMA) and Federal Home Loan Mortgage Corporation (FHLMC) for conventional loans, and then sold in the secondary markets. Each GSE has specific guidelines and criteria for sellers and servicers of loans backing their respective securities. Many private investors were also active in the secondary market as issuers and investors. The risk of credit loss with regard to the principal amount of the loans sold was generally transferred to investors upon sale to the secondary market. To the extent that transferred loans were subsequently determined not to meet the agreed upon qualifications or criteria, the purchaser had the right to return those loans to FHN. In addition, certain mortgage loans were sold to investors with limited or full recourse in the event of mortgage foreclosure (refer to discussion of foreclosure reserves under Critical Accounting Policies). After sale, these loans were not reflected on the Consolidated Statements of Condition. See also Note 18 – Restrictions, Contingencies and Other Disclosures.
FHN’s use of government agencies as an efficient outlet for mortgage loan production was an essential source of liquidity for FHN and other participants in the housing industry in recent years. During 2008 and 2007, approximately $15.6 billion and $18.3 billion, respectively, of conventional and federally insured mortgage loans were securitized and sold by FHN through these investors.
Historically, certain of FHN’s originated loans, including non-conforming first-lien mortgages, second-lien mortgages and HELOC originated primarily through FTBNA, did not conform to the requirements for sale or securitization through government agencies. FHN pooled and securitized these non-conforming loans in proprietary transactions. After securitization and sale, these loans were not reflected on the Consolidated Statements of Condition, except as
34
FIRST HORIZON NATIONAL CORPORATION
described hereafter (see Credit Risk Management – Mortgage Banking). These transactions, which were conducted through single-purpose business trusts, were an efficient way for FHN to monetize these assets. On December 31, 2008 and 2007, the outstanding principal amount of loans in these off-balance sheet business trusts was $22.8 billion and $25.6 billion, respectively. FHN has substantially reduced its origination of these loans in response to disruptions in the credit markets and did not execute a securitization of these loans during 2008. Given the historical significance of FHN’s origination of non-conforming loans, the use of single-purpose business trusts to securitize these loans was an important source of liquidity to FHN. See Note 24 – Loan Sales and Securitizations for additional information.
Pension obligations are funded by FHN to provide current and future benefit to participants in FHN’s noncontributory, defined benefit pension plan. On December 31, 2008, the annual measurement date, pension obligations were $472.1 million with $378.5 million of assets in the trust to fund those obligations. FHN made a contribution of $30.0 million to the qualified pension plan in fourth quarter 2008. A second contribution may be made in 2009 attributable to the 2008 plan year. This decision will be based upon pension funding requirements under the Pension Protection Act, the maximum deductible under the Internal Revenue Code, and the actual performance of plan assets during 2009. Given these uncertainties, we cannot estimate the amount of a future contribution at this time. The nonqualified pension plans and other postretirement benefit plans are unfunded. FHN contributed $6.2 million in 2008 to the unfunded plans to cover all benefits paid under the nonqualified plans and anticipates the 2009 contribution to be $5.6 million. The discount rate for 2008 of 6.85 percent for the qualified pension plan and 6.90 percent for the nonqualified supplemental executive retirement plan was determined by using a hypothetical AA yield curve represented by a series of annualized individual discount rates from one-half to thirty years. The discount rates for the pension and nonqualified supplemental executive retirement plans are selected based on data specific to FHN’s plans and employee population. See Note 20 – Savings, Pension and Other Employee Benefits for additional information.
FHN has various other financial obligations, which may require future cash payments. Table 16 sets forth contractual obligations representing required and potential cash outflows as of December 31, 2008. Purchase obligations represent obligations under agreements to purchase goods or services that are enforceable and legally binding on FHN and that specify all significant terms, including fixed or minimum quantities to be purchased, fixed, minimum or variable price provisions, and the approximate timing of the transaction. In addition, FHN enters into commitments to extend credit to borrowers, including loan commitments, standby letters of credit, and commercial letters of credit. These commitments do not necessarily represent future cash requirements, in that these commitments often expire without being drawn upon. See Note 26 – Derivatives and Off-Balance Sheet Arrangements for additional information.
Table 16 - Contractual Obligations
| | | | | | | | | | |
(Dollars in thousands) | | Payments due by period (a) |
| | Less than
1 year | | 1-3
years | | 4-5
years | | After 5
years | | Total |
|
Contractual obligations: | | | | | | | | | | |
Time deposit maturities (b) | | | $ | | 2,613,829 | | | | $ | | 577,307 | | | | $ | | 279,033 | | | | $ | | 206,710 | | | | $ | | 3,676,879 | |
Long-term debt (c) | | | | 1,560,608 | | | | | 911,246 | | | | | 350,296 | | | | | 1,784,574 | | | | | 4,606,724 | |
Annual rental commitments under noncancelable leases (d) | | | | 35,064 | | | | | 47,302 | | | | | 24,749 | | | | | 30,280 | | | | | 137,395 | |
Purchase obligations | | | | 49,732 | | | | | 68,605 | | | | | 30,149 | | | | | 15,233 | | | | | 163,719 | |
|
Total contractual obligations | | | $ | | 4,259,233 | | | | $ | | 1,604,460 | | | | $ | | 684,227 | | | | $ | | 2,036,797 | | | | $ | | 8,584,717 | |
|
(a) | | | | On December 31, 2008, a liability for unrecognized tax benefits of $31.1 million has been excluded from this table as the timing of payment cannot be reasonably estimated. |
(b) | | | | See Note 8 – Time Deposit Maturities for further details. |
(c) | | | | See Note 10 – Long-Term Debt for further details. |
(d) | | | | See Note 5 – Premises, Equipment and Leases for further details. |
35
FIRST HORIZON NATIONAL CORPORATION
Credit Ratings
Maintaining adequate credit ratings on debt issues is critical to liquidity because it affects the ability of FHN to attract funds from various sources, such as brokered deposits or wholesale borrowings of which FHN had $1.5 billion and $1.9 billion on December 31, 2008 and 2007, respectively, on a cost-competitive basis (see also Liquidity Management). The various credit ratings are detailed in Table 17. The availability and cost of funds other than core deposits is also dependent upon marketplace perceptions of the financial soundness of FHN, which include such issues as capital levels, asset quality and reputation. The availability of core deposit funding is dependent upon federal deposit insurance, which can be removed only in extraordinary circumstances, but may also be influenced to some extent by the same factors that affect other funding sources.
Table 17 - Credit Ratings
| | | | | | |
| | Standard & Poor’s (a) | | Moody’s (b) | | Fitch (c) |
|
First Horizon National Corporation | | | | | | |
Overall credit rating: Long-term/Outlook | | BBB/Stable | | Baa1/Negative | | BBB+/Negative |
Subordinated debt | | BBB– | | Baa2 | | BBB |
Cumulative perpetual preferred stock (issued to US Treasury) | | | | | | BBB– |
Capital securities* | | BB– | | Baa2 | | BBB– |
|
First Tennessee Bank National Association | | | | | | |
Overall credit rating: Long-term/Short-term/Outlook | | BBB+/A-2/Stable | | A3/P-2/Negative | | BBB+/F2/Negative |
Non-cumulative perpetual preferred stock | | BB | | Baa2 | | BBB |
Long-term/short-term deposits | | BBB+/A-2 | | A3/P-2 | | A–/F1 |
Other long-term/short-term funding** | | BBB+/A-2 | | A3/P-2 | | BBB+/F2 |
Subordinated debt | | BBB | | Baa1 | | BBB |
|
FT Real Estate Securities Company, Inc. | | | | | | |
Preferred stock | | BB | | Baa2 | | |
|
* | | Guaranteed preferred beneficial interests in First Horizon’s junior subordinated debentures issued through a wholly-owned unconsolidated business trust. |
** | | Other funding includes senior bank notes. |
A rating is not a recommendation to buy, sell or hold securities and is subject to revision or withdrawal at any time and should be evaluated independently of any other rating.
(a) | | Last change in rating was on February 24, 2009. |
(b) | | Last change in rating was on January 24, 2008. |
(c) | | Last change in rating was on December 3, 2008. |
MARKET RISK MANAGEMENT
Capital markets buys and sells various types of securities for its customers. When these securities settle on a delayed basis, they are considered forward contracts. Securities inventory positions are generally procured for distribution to customers by the sales staff, and ALCO policies and guidelines have been established with the objective of limiting the risk in managing this inventory.
CAPITAL MANAGEMENT
The capital management objectives of FHN are to provide capital sufficient to cover the risks inherent in FHN’s businesses, to maintain excess capital to well-capitalized standards and to assure ready access to the capital markets. Management has a Capital Management committee that is responsible for capital management oversight and provides a forum for addressing management issues related to capital adequacy. The committee reviews sources and uses of capital, key capital ratios, segment economic capital allocation methodologies, and other factors in monitoring and managing current capital levels, as well as potential future sources and uses of capital. The committee also recommends capital management policies, which are submitted for approval to the Enterprise-wide Risk/Return Management Committee and the Board.
36
FIRST HORIZON NATIONAL CORPORATION
OPERATIONAL RISK MANAGEMENT
Operational risk is the risk of loss from inadequate or failed internal processes, people, and systems or from external events. This risk is inherent in all businesses. Management, measurement, and reporting of operational risk are overseen by the Operational Risk Committee, which is chaired by the Chief Risk Officer. Key representatives from the business segments, legal, risk management, information technology risk, corporate real estate, employee services, records management, bank operations, funds management, and insurance are represented on the committee. Subcommittees manage and report on business continuity planning, information technology risk, insurance, compliance, records management, customer complaint, and reputation risks. Summary reports of the committee’s activities and decisions are provided to the Enterprise-wide Risk/Return Management Committee. Emphasis is dedicated to refinement of processes and tools to aid in measuring and managing material operational risks and providing for a culture of awareness and accountability.
COMPLIANCE RISK MANAGEMENT
Compliance risk is the risk of legal or regulatory sanctions, material financial loss, or loss to reputation as a result of failure to comply with laws, regulations, rules, related self-regulatory organization standards, and codes of conduct applicable to banking activities. Management, measurement, and reporting of compliance risk are overseen by the Compliance Risk Committee, which is chaired by the SVP of Corporate Compliance. Key executives from the business segments, legal, risk management, and service functions are represented on the committee. Summary reports of the committee’s activities and decisions are provided to the Enterprise-wide Risk/Return Management Committee, and to the Audit Committee of the Board, as applicable. Reports include the status of regulatory activities, internal compliance program initiatives, and evaluation of emerging compliance risk areas.
CREDIT RISK MANAGEMENT
Credit risk is the risk of loss due to adverse changes in a borrower’s ability to meet its financial obligations under agreed upon terms. FHN is subject to credit risk in lending, trading, investing, liquidity/funding and asset management activities. The nature and amount of credit risk depends on the types of transactions, the structure of those transactions and the parties involved. In general, credit risk is incidental to trading, liquidity/funding and asset management activities, while it is central to the profit strategy in lending. As a result, the majority of credit risk is associated with lending activities.
FHN has policies and guidelines, and processes and management committees in place that are designed to assess and monitor credit risks. The Credit Risk Management Committee is responsible for enterprise-wide credit risk oversight and provides a forum for addressing management issues. The committee approves and recommends credit policies, which are submitted for final approval to the Credit Policy and Executive Committee of the Board, and underwriting guidelines to manage the level and composition of credit risk in its loan portfolio and review performance relative to these policies. In addition, the Financial Counterparty Credit Committee, composed of senior managers, assesses the credit risk of financial counterparties and sets limits for exposure based upon the credit quality of the counterparty.
A series of regularly scheduled portfolio review meetings are in place to provide oversight regarding the accuracy of credit risk grading and the adequacy of commercial credit servicing. A series of watch list meetings are in place to oversee the management of emerging potential problem commercial assets. The Credit Risk Management function assesses the portfolio trends and the results of these meetings and utilizes this information to inform management regarding the current state of credit quality as part of the estimation process for determining the allowance for loan losses.
All of the above activities are subject to independent review by FHN’s Credit Risk Assurance Group, which encompasses both Credit Review and Credit Quality Control functions. The EVP of Credit Risk Assurance is appointed by and reports to the Credit Policy & Executive Committee of the Board. Credit Risk Assurance is charged with providing the Board and executive management with independent, objective, and timely assessments of FHN’s portfolio quality, adequacy of credit policies, and credit risk management processes.
37
FIRST HORIZON NATIONAL CORPORATION
FHN’s goal is to manage risk and price loan products based on risk management decisions and strategies. Management strives to identify potential problem loans and nonperforming loans early enough to correct the deficiencies and prevent further credit deterioration. It is management’s objective that both charge- offs and asset write-downs are recorded promptly, based on management’s assessments of current collateral values and the borrower’s ability to repay.
FHN has a significant concentration of loans secured by residential real estate (52 percent of total loans) primarily in three portfolios. The retail real estate residential portfolio including real estate loans pledged against other collateralized borrowings (41 percent of total loans) was comprised of primarily home equity lines and loans. While this portfolio has been stressed by the downturn in the housing market and rising unemployment, it contains loans extended to strong borrowers with high credit scores and is geographically diversified. The OTC portfolio (5 percent of total loans) has been negatively impacted by the downturn in the housing industry, certain discontinued product types, and the decreased availability of permanent mortgage financing. The Residential CRE portfolio (6 percent of total loans) has also been negatively impacted by the housing industry downturn, as builder liquidity has been severely stressed.
As of December 31, 2008, loans to banks and bank holding companies, trust preferred loans, and loans participating with downstream correspondents totaling $1.7 billion (8 percent of total loans) are included within the Commercial, Financial and Industrial portfolio. Due to the higher credit losses experienced throughout the financial services industry and the limited availability of market liquidity, these loans experienced increased stress throughout 2008.
On December 31, 2008, FHN did not have any concentrations of 10 percent or more of total commercial, financial and industrial loans in any single industry.
Allowance for Loan Losses and Charge-offs
Management’s policy is to maintain the ALLL at a level sufficient to absorb estimated probable incurred losses in the loan portfolio. The allowance for loan losses is increased by the provision for loan losses and recoveries and is decreased by charged-off loans. The adequacy of the allowance for loan losses is analyzed quarterly. The Chief Credit Officer has the responsibility for performing a comprehensive review of the allowance for loan losses and reviewing that analysis with the Credit Policy and Executive Committee of the Board each quarterly reporting period. Analytical models, based on loss experience adjusted for current events, trends and economic conditions, are used to assess the adequacy of the allowance for loan losses. This methodology determines an estimated loss percentage (reserve rate), which is applied against the balance of loans in each segment of the loan portfolio at the evaluation date. The nature of the process by which FHN determines the appropriate allowance for loan losses requires the exercise of considerable judgment. After review of all relevant factors, management believes the allowance for loan losses is adequate and reflects its best estimate of probable incurred losses. See Critical Accounting Policies for more detail.
Table 18 summarizes, by category, loans charged-off and recoveries of loans previously charged-off, net charge off ratios, and additions to the ALLL through provision. The total allowance for loan losses increased to $849.2 million on December 31, 2008, from $342.3 million at December 31, 2007. Period-end loans decreased in 2008 after remaining flat in 2007. The ratio of allowance for loan losses to loans, net of unearned income, was 3.99 percent on December 31, 2008, compared to 1.55 percent on December 31, 2007, and .98 percent on December 31, 2006. Provision for loan losses increased by 296 percent to $1.1 billion in 2008 compared to $272.8 million in 2007. Deterioration in FHN’s portfolios began with real estate related portfolios; especially those related to high-risk products and were generally confined to high risk geographic locations. However, as broader economic conditions continued to decline in 2008, deterioration occurred in all portfolios.
Net charge-offs increased to $572.8 million for the year ended December 31, 2008, an increase from $131.8 million in 2007 and $55.1 million in 2006. The increase in the 2008 level of net charge-offs was primarily due to increased net charge-offs in the national construction (Res CRE and OTC), commercial (C&I), and HELOC portfolios. Commercial, financial and industrial (C&I) net charge-offs were $101.1 million in 2008 compared to $35.5 million in 2007, as the weakening economy impacted commercial credits. Commercial real estate
38
FIRST HORIZON NATIONAL CORPORATION
construction and real estate commercial net charge-offs increased to $191.1 million in 2008 from $28.6 million in 2007 due to the significant deterioration in the residential housing market.
The retail real estate portfolios, which includes HELOC, home equity installment loans, construction (OTC), and permanent mortgages, also experienced deterioration and higher net charge offs in 2008. OTC net charge-offs increased to $141.3 million in 2008 compared to $23.5 million in 2007 as deterioration that began in 2007 continued into 2008. HELOC net charge-offs increased to $77.4 million in 2008 from $25.9 million in 2007 and home equity installment loans net charge offs increased to $39.4 million in 2008 from $6.7 million in 2007. Credit card receivable net charge-offs increased to $9.3 million in 2008 from $6.1 million in 2007 as the decline in the economy impacted consumers’ financial condition.
While charge-offs increased due to deteriorating economic conditions, FHN’s methodology of charging down collateral dependent commercial loans to net realizable value (NRV) also impacted charge-off trends, especially in comparison to applicable ALLL. Generally, classified nonaccrual loans over $1 million are deemed to be impaired in accordance with Statement of Financial Accounting Standards, No. 114, “Accounting by Creditors for Impairment of a Loan” (SFAS No. 114) and are assessed for impairment measurement. A majority of these SFAS No. 114 loans (generally commercial loans over $1 million that are not expected to pay all contractually due principal and interest) are included in the Residential CRE (Homebuilder and Condominium Construction) portfolio. Once impairment is detected, loans are then written down to the fair value of the underlying collateral, less costs to sell (net realizable value). Fair value is based on recent appraisals of collateral. Collateral values are monitored and further charge-offs are taken if it is determined that the collateral values have continued to decline. Historically, as problem loans had been identified, estimated probable losses were reserved for in the ALLL and these loans were subsequently charged-off as appropriate. Given the deterioration in the real estate markets and the growing number of loans determined to be collateral dependent under SFAS No. 114, charge-offs of these loans have been accelerated to the time when the impairments are initially detected as opposed to historical trends which reflected additions to the ALLL for probable inherent losses.
Also impacting increased charge-offs related to SFAS No. 114 loans are the dramatic declines in collateral values experienced due to the prevailing real estate market conditions. Therefore, charge-offs are not only higher due to the increased credit deterioration related to these loans throughout 2008, but also due to the increased rate at which loans are charged down to net realizable value because of rapidly declining collateral values.
As of December 31, 2008, the total value of SFAS No. 114 commercial loans considered collateral dependent carried at net realizable value (NRV) was $414.9 million, while net charge-offs related to these loans were $198.5 million or 35 percent of total net charge-offs during 2008. Because of the accelerated recognition of impairment of these loans, the elevated charge-offs decrease the ALLL. Compression occurs in the ALLL to net charge-offs ratio as the ALLL is generally not replenished for charge-offs related to SFAS No.114 collateral dependent loans because reserves are not carried for these loans. The OTC portfolio of the winding-down National Specialty Lending Segment has experienced significant deterioration in 2008. Generally, OTC loans are written down to appraised value if, when the loan becomes 90 days past due or is considered substandard, recently obtained appraisals indicate a decline in fair value. Subsequent charge downs are taken thereafter in accordance with regulatory guidelines. During 2008, net charge-offs related to OTC loans were $141.3 million, approximately 25 percent of total net charge-offs.
Asset quality is expected to remain stressed in 2009 due to the expectation that the housing industry and broader economic conditions may continue to deteriorate. Actual results could differ because of several factors, including those presented in the Forward-Looking Statements section of this MD&A discussion.
39
FIRST HORIZON NATIONAL CORPORATION
Table 18 - Analysis of Allowance for Loan Losses
| | | | | | | | | | | | |
(Dollars in thousands) | | 2008 | | 2007 | | 2006 | | 2005 | | 2004 | | 2003 |
|
Allowance for loan losses: | | | | | | | | | | | | |
Beginning balance | | | $ | | 342,341 | | | | $ | | 216,285 | | | | $ | | 189,705 | | | | $ | | 158,159 | | | | $ | | 160,333 | | | | $ | | 144,298 | |
Provision for loan losses | | | | 1,080,000 | | | | | 272,765 | | | | | 83,129 | | | | | 67,678 | | | | | 48,348 | | | | | 86,698 | |
Loans transferred to held for
sale | | | | - | | | | | 2,655 | | | | | - | | | | | - | | | | | (8,382 | ) | | | | | - | |
Acquisitions/(divestitures), net | | | | (370 | ) | | | | | (17,598 | ) | | | | | (1,470 | ) | | | | | 1,386 | | | | | - | | | | | (2,652 | ) | |
Charge-offs: | | | | | | | | | | | | |
Commercial: | | | | | | | | | | | | |
Commercial, financial and
industrial | | | | 105,626 | | | | | 42,639 | | | | | 28,095 | | | | | 12,789 | | | | | 11,925 | | | | | 12,460 | |
Real estate commercial | | | | 22,518 | | | | | 2,504 | | | | | 2,070 | | | | | 498 | | | | | 2,690 | | | | | 3,067 | |
Real estate construction | | | | 170,995 | | | | | 26,272 | | | | | 115 | | | | | 2,805 | | | | | 779 | | | | | 7,642 | |
Retail: | | | | | | | | | | | | |
Real estate residential | | | | 131,015 | | | | | 37,345 | | | | | 23,405 | | | | | 18,744 | | | | | 21,271 | | | | | 35,809 | |
Real estate construction | | | | 143,541 | | | | | 23,806 | | | | | 1,962 | | | | | 374 | | | | | - | | | | | - | |
Other retail | | | | 8,991 | | | | | 7,490 | | | | | 6,753 | | | | | 6,101 | | | | | 7,094 | | | | | 9,920 | |
Credit card receivables | | | | 9,742 | | | | | 6,851 | | | | | 6,226 | | | | | 10,839 | | | | | 12,870 | | | | | 13,538 | |
|
Total charge-offs | | | | 592,428 | | | | | 146,907 | | | | | 68,626 | | | | | 52,150 | | | | | 56,629 | | | | | 82,436 | |
|
Recoveries: | | | | | | | | | | | | |
Commercial: | | | | | | | | | | | | |
Commercial, financial and
industrial | | | | 4,495 | | | | | 7,169 | | | | | 4,725 | | | | | 3,328 | | | | | 3,473 | | | | | 2,438 | |
Real estate commercial | | | | 81 | | | | | 223 | | | | | 296 | | | | | 1,173 | | | | | 51 | | | | | 166 | |
Real estate construction | | | | 2,305 | | | | | 2 | | | | | - | | | | | - | | | | | 10 | | | | | 1 | |
Retail: | | | | | | | | | | | | |
Real estate residential | | | | 7,815 | | | | | 4,256 | | | | | 4,307 | | | | | 5,300 | | | | | 4,517 | | | | | 4,820 | |
Real estate construction | | | | 2,253 | | | | | 280 | | | | | - | | | | | - | | | | | - | | | | | - | |
Other retail | | | | 2,309 | | | | | 2,458 | | | | | 3,090 | | | | | 3,697 | | | | | 4,211 | | | | | 5,653 | |
Credit card receivables | | | | 409 | | | | | 753 | | | | | 1,129 | | | | | 1,134 | | | | | 2,227 | | | | | 1,347 | |
|
Total recoveries | | | | 19,667 | | | | | 15,141 | | | | | 13,547 | | | | | 14,632 | | | | | 14,489 | | | | | 14,425 | |
|
Net charge-offs | | | | 572,761 | | | | | 131,766 | | | | | 55,079 | | | | | 37,518 | | | | | 42,140 | | | | | 68,011 | |
|
Ending balance | | | $ | | 849,210 | | | | $ | | 342,341 | | | | $ | | 216,285 | | | | $ | | 189,705 | | | | $ | | 158,159 | | | | $ | | 160,333 | |
|
Reserve for off-balance sheet
commitments | | | $ | | 18,752 | | | | $ | | 10,726 | | | | $ | | 9,378 | | | | $ | | 10,650 | | | | $ | | 7,904 | | | | $ | | 7,804 | |
Total of allowance for loan
losses and reserve for off-
balance sheet commitments | | | $ | | 867,962 | | | | $ | | 353,067 | | | | $ | | 225,663 | | | | $ | | 200,355 | | | | $ | | 166,063 | | | | $ | | 168,137 | |
|
Loans and commitments: | | | | | | | | | | | | |
Period end loans, net of
unearned | | | $ | | 21,278,190 | | | | $ | | 22,103,516 | | | | $ | | 22,104,905 | | | | $ | | 20,611,998 | | | | $ | | 16,441,928 | | | | $ | | 14,021,318 | |
Insured retail residential and
construction loans (a) | | | | 591,116 | | | | | 913,164 | | | | | 729,842 | | | | | 826,904 | | | | | 665,909 | | | | | 862,675 | |
|
Loans excluding insured loans | | | $ | | 20,687,074 | | | | $ | | 21,190,352 | | | | $ | | 21,375,063 | | | | $ | | 19,785,094 | | | | $ | | 15,776,019 | | | | $ | | 13,158,643 | |
|
Off-balance sheet
commitments (b) | | | $ | | 6,441,854 | | | | $ | | 6,929,299 | | | | $ | | 7,587,028 | | | | $ | | 9,090,618 | | | | $ | | 6,226,245 | | | | $ | | 5,464,097 | |
|
Average loans, net of unearned | | | $ | | 21,660,704 | | | | $ | | 22,106,682 | | | | $ | | 21,504,175 | | | | $ | | 18,334,684 | | | | $ | | 15,440,501 | | | | $ | | 12,679,804 | |
|
Allowance and net charge off
Ratios (c): | | | | | | | | | | | | |
Allowance to total loans | | | | 3.99 | % | | | | | 1.55 | % | | | | | .98 | % | | | | | .92 | % | | | | | .96 | % | | | | | 1.14 | % | |
Allowance to total loans
excluding insured loans | | | | 4.11 | | | | | 1.62 | | | | | 1.01 | | | | | .96 | | | | | 1.00 | | | | | 1.22 | |
Allowance to net charge-offs | | | | 1.48 | x | | | | | 2.60 | x | | | | | 3.93 | x | | | | | 5.06 | x | | | | | 3.75 | x | | | | | 2.36 | x | |
Total commercial net
charge-offs | | | | 2.63 | | | | | .57 | | | | | .24 | | | | | .13 | | | | | .18 | | | | | .34 | |
Retail real estate net charge-offs | | | | 2.58 | | | | | .54 | | | | | .20 | | | | | .15 | | | | | .20 | | | | | .50 | |
Other retail net charge-offs | | | | 4.81 | | | | | 3.37 | | | | | 2.26 | | | | | 1.46 | | | | | 1.55 | | | | | 1.64 | |
Credit card receivables net
charge-offs | | | | 4.83 | | | | | 3.11 | | | | | 2.43 | | | | | 4.03 | | | | | 4.25 | | | | | 4.65 | |
Total net charge-offs to average
loans | | | | 2.64 | | | | | .60 | | | | | .26 | | | | | .20 | | | | | .27 | | | | | .54 | |
|
|
(a) | | | | Whole-loan insurance is obtained on certain retail residential and construction loans. Insuring these loans absorbs credit risk and results in lower allowance for loan losses. |
|
(b) | | | | Amount of off-balance sheet commitments for which a reserve has been provided. See Note 26 – Derivatives and Off-Balance Sheet Arrangements for further details on off-balance sheet commitments. |
|
(c) | | | | Loans net of unearned income. Net charge-off ratios are calculated based on average loans. Table 10 provides information on the relative size of each loan portfolio. |
40
FIRST HORIZON NATIONAL CORPORATION
Components of the Allowance for Loan Losses
The allowance for loan losses includes the following components: reserves for commercial loans evaluated based on pools of credit graded loans and reserves for pools of smaller-balance homogeneous retail and commercial loans, both determined in accordance with SFAS No. 5, “Accounting for Contingencies.” Also included are reserves, determined in accordance with SFAS No. 114, “Accounting by Creditors for Impairment of a Loan,” related to loans determined by management to be individually impaired. The reserve factors applied to these pools are an estimate of probable incurred losses based on management’s evaluation of historical losses from loans with similar characteristics, adjusted for current economic factors and trends. Table 19 gives a breakdown of the allowance allocation by major loan types and commercial loan grades on December 31, 2008, compared with December 31, 2007.
To assess the quality of individual commercial loans, all commercial loans are internally assigned a credit grade. During 2006, a new credit grading system was implemented that assigns credit grades ranging from 1 to 16. However, the allowance for loan losses continues to be based on historical losses which had assigned grades of 1 to 10. Therefore, to maintain the integrity and accuracy of the allowance methodology, at each reporting period the new assigned loan grades are back-converted to the old grades for proper assignment of reserves. The credit grading system is intended to identify and measure the credit quality of lending relationships by analyzing the migration of loans between grading categories. It is also integral to the estimation methodology utilized in determining the allowance for loan losses since an allowance is established for pools of commercial loans based on the credit grade assigned. The appropriate relationship manager performs the process of classifying commercial loans into the appropriate credit grades initially as a component of the approval of the loan and has responsibility for insuring that the loan is properly graded throughout the life of the loan. The proper loan grade for all commercial loans in excess of $1 million is confirmed by a senior credit officer in the approval process. To determine the most appropriate credit grade for each loan, FHN utilizes a credit risk grading system that employs scorecards to particular categories of loans. The scorecards consist of a number of objective and subjective measures that are weighted in a manner that produces a rank ordering of risk within pass-graded credits. Loan grades are frequently reviewed by commercial loan review to determine if any changes in the circumstances of the loan require a different risk grade.
A reserve rate is established for each loan grade based on a historical three-year moving average of actual charge-offs. The reserve rate is then adjusted for current events, trends, and economic conditions that affect the asset quality of the loan portfolio. Some of the factors considered in making these adjustments include: levels of and trends in delinquencies; classified loans and nonaccrual loans; trends in outstandings and maturities; effects of changes in lending policies and underwriting guidelines; introduction of new loan products with different risk characteristics; experience, ability and depth of lending management and staff; migration trends of loan grades; and charge-off trends that may skew the historical three-year moving average. Finally, the reserve rates for each loan grade are reviewed quarterly to reflect local, regional and national economic trends; concentrations of cyclical industries; and the economic prospects for industry concentrations. To supplement management’s process in setting these additional adjustments, an economic model is used that evaluates the correlation between historical charge-offs and a number of state and national economic indicators.
The allowance for loan losses for smaller-balance homogenous loans (retail loans) is determined based on pools of similar loan types that have similar credit risk characteristics, which is consistent with industry practice. FHN manages retail loan credit risk on a portfolio basis. Reserves by portfolio are determined using analytical models that incorporate various factors including, but not limited to, historical delinquency trends, experienced loss frequencies, and experienced loss severities. Generally, reserves for retail loans reflect inherent losses in the portfolio that are expected to be recognized over the following twelve months.
41
FIRST HORIZON NATIONAL CORPORATION
Table 19 - Loans and Allowance for Loan Loss on December 31
| | | | | | | | | | | | | | | | | | |
(Dollars in millions) | | 2008 | | 2007 |
| | C&I
and
Other | | Income
CRE | | Residential
CRE | | Total | | %
of
Total | | Allowance
for Loan
Losses | | Total | | %
of
Total | | Allowance
for Loan
Losses |
|
Internal grades: | | | | | | | | | | | | | | | | | | |
1 | | | $ | | 135 | | | | $ | | - | | | | $ | | - | | | | $ | | 135 | | | | | - | % | | | | $ | | 1 | | | | $ | | 15 | | | | | - | % | | | | $ | | - | |
2 | | | | 8 | | | | | 2 | | | | | - | | | | | 10 | | | | | - | | | | | - | | | | | 78 | | | | | - | | | | | - | |
3 | | | | 155 | | | | | 6 | | | | | - | | | | | 161 | | | | | 1 | | | | | 1 | | | | | 262 | | | | | 1 | | | | | 2 | |
4 | | | | 296 | | | | | 10 | | | | | - | | | | | 306 | | | | | 1 | | | | | 3 | | | | | 476 | | | | | 2 | | | | | 3 | |
5 | | | | 523 | | | | | 23 | | | | | 3 | | | | | 549 | | | | | 3 | | | | | 6 | | | | | 721 | | | | | 3 | | | | | 6 | |
6 | | | | 645 | | | | | 96 | | | | | 7 | | | | | 748 | | | | | 4 | | | | | 8 | | | | | 1,036 | | | | | 5 | | | | | 10 | |
7 | | | | 969 | | | | | 200 | | | | | 6 | | | | | 1,175 | | | | | 6 | | | | | 12 | | | | | 1,565 | | | | | 7 | | | | | 16 | |
8 | | | | 1,156 | | | | | 302 | | | | | 18 | | | | | 1,476 | | | | | 7 | | | | | 16 | | | | | 2,499 | | | | | 11 | | | | | 30 | |
9 | | | | 924 | | | | | 261 | | | | | 24 | | | | | 1,209 | | | | | 6 | | | | | 13 | | | | | 1,611 | | | | | 7 | | | | | 22 | |
10 | | | | 648 | | | | | 94 | | | | | 23 | | | | | 765 | | | | | 4 | | | | | 9 | | | | | 1,028 | | | | | 5 | | | | | 21 | |
11 | | | | 741 | | | | | 261 | | | | | 129 | | | | | 1,131 | | | | | 5 | | | | | 21 | | | | | 999 | | | | | 5 | | | | | 32 | |
12 | | | | 280 | | | | | 86 | | | | | 73 | | | | | 439 | | | | | 2 | | | | | 15 | | | | | 421 | | | | | 2 | | | | | 25 | |
13 | | | | 912 | | | | | 312 | | | | | 242 | | | | | 1,466 | | | | | 7 | | | | | 96 | | | | | 204 | | | | | 1 | | | | | 22 | |
14, 15, 16 (Classifieds) | | | | 384 | | | | | 241 | | | | | 427 | | | | | 1,052 | | | | | 5 | | | | | 179 | | | | | 147 | | | | | 1 | | | | | 19 | |
|
| | | | 7,776 | | | | | 1,894 | | | | | 952 | | | | | 10,622 | | | | | 50 | | | | | 380 | | | | | 11,062 | | | | | 50 | | | | | 208 | |
SFAS 114 Impaired Loans | | | | 44 | | | | | 94 | | | | | 336 | | | | | 474 | | | | | 2 | | | | | 12 | | | | | 127 | | | | | 1 | | | | | 16 | |
|
Total commercial loans | | | $ | | 7,820 | | | | $ | | 1,988 | | | | $ | | 1,288 | | | | $ | | 11,096 | | | | | 52 | | | | $ | | 392 | | | | $ | | 11,189 | | | | | 51 | | | | $ | | 224 | |
|
Consumer: | | | | | | | | | | | | | | | | | | |
Consumer real estate (Home Equity Installment and HELOC)* | | | | 7,749 | | | | | 36 | | | | | 182 | | | | | 8,048 | | | | | 36 | | | | | 45 | |
OTC (Consumer Residential Construction Loans) | | | | 981 | | | | | 5 | | | | | 200 | | | | | 2,008 | | | | | 9 | | | | | 60 | |
Permanent mortgage | | | | 1,127 | | | | | 5 | | | | | 54 | | | | | 510 | | | | | 2 | | | | | 1 | |
Credit card and other | | | | 325 | | | | | 2 | | | | | 21 | | | | | 349 | | | | | 2 | | | | | 12 | |
|
Total consumer loans | | | | 10,182 | | | | | 48 | | | | | 457 | | | | | 10,915 | | | | | 49 | | | | | 118 | |
|
Total loans | | | $ | | 21,278 | | | | | 100 | % | | | | $ | | 849 | | | | $ | | 22,104 | | | | | 100 | % | | | | $ | | 342 | |
|
|
* | | | | Includes real estate loans pledged against other collateralized borrowings. |
Loans are expressed net of unearned income. All data is based on internal loan classifications.
FHN employs a dual grade commercial risk grading methodology to assign a probability of default estimate to individual credits. The methodology utilizes multiple scorecards that have been developed using a combination of objective and subjective factors specific to various portfolio segments that result in a rank-ordering of risk in the “pass grades” of 1-11. Each grade corresponds to an estimated one-year default probability percentage; a PD 1 has the lowest expected default probability, and probabilities increase as grades progress down the scale. PD 12 is referred to as the “pass-watch” grade and is situationally assigned when a credit is judged to need additional attention. PD 13-16 correspond to the regulatorily-defined categories of special mention (13), substandard (14), doubtful (15) and loss (16).
Impaired: A loan for which it is probable that all amounts due, according to the contractual terms of the loan agreement, will not be collected and the loan is placed on non-accrual status. Reserves for impaired loans are based on the value of the collateral or the cash flow of the entity compared to the outstanding balance.
Table 20 - Average Reserve Rates
| | | | | | | | | | | | | | | | | | | | |
| | 2008 | | Loans
% of
Total | | 2007 | | Loans
% of
Total | | 2006 | | Loans
% of
Total | | 2005 | | Loans
% of
Total | | 2004 | | Loans
% of
Total |
|
Commercial, commercial real estate and commercial construction* | | | | 2.96 | % | | | | | 49.5 | | | | | 1.85 | % | | | | | 50.5 | | | | | 1.30 | % | | | | | 48.1 | | | | | 1.28 | % | | | | | 47.9 | | | | | 1.30 | % | | | | | 46.8 | |
Impaired | | | | 2.72 | | | | | 1.7 | | | | | 17.40 | | | | | .3 | | | | | 23.71 | | | | | .1 | | | | | 28.13 | | | | | .2 | | | | | 28.57 | | | | | .2 | |
Retail real estate including loans pledged against other collateralized borrowings | | | | 3.15 | | | | | 47.2 | | | | | 1.32 | | | | | 47.6 | | | | | .49 | | | | | 50.0 | | | | | .40 | | | | | 49.9 | | | | | .40 | | | | | 50.5 | |
Other retail | | | | 5.99 | | | | | .7 | | | | | 3.47 | | | | | .7 | | | | | 2.48 | | | | | .8 | | | | | 2.38 | | | | | .8 | | | | | 2.96 | | | | | 1.0 | |
Credit card receivables | | | | 4.68 | | | | | .9 | | | | | 3.41 | | | | | .9 | | | | | 3.45 | | | | | 1.0 | | | | | 3.98 | | | | | 1.2 | | | | | 4.02 | | | | | 1.5 | |
|
Certain previously reported amounts have been reclassified to agree with current presentation.
* Excludes impaired loans.
The average reserve rate for commercial loans increased to 2.96 percent from 1.85 percent reflecting downward credit grading of the entire commercial portfolio, including deterioration of national commercial construction loans. Average reserve rates for impaired loans declined in 2008 as FHN began charging down SFAS No. 114 collateral dependent loans to NRV and reserves are not carried for a majority of these loans. The average reserve rate for retail real estate loans was 3.15 percent for 2008 compared to 1.32 percent for 2007. This increase was primarily
42
FIRST HORIZON NATIONAL CORPORATION
driven by deterioration in real estate construction loans and increase in home equity reserves. The average reserve rate for other retail loans, which represented less than one percent of total loans in 2008, was 5.99 percent for 2008 compared to 3.47 percent for 2007. The average reserve rate for credit card receivables, also less than one percent of total loans, increased to 4.68 percent for 2008 from 3.41 in 2007.
Nonperforming Assets
Nonperforming loans (NPLs) consist of impaired, other nonaccrual and restructured loans. These, along with foreclosed real estate (excluding foreclosed real estate from GNMA loans), represent nonperforming assets (NPAs). Impaired loans are those loans for which it is probable that all amounts due, according to the contractual terms of the loan agreement, will not be collected and for which recognition of interest income has been discontinued. Other nonaccrual loans are residential and other retail loans on which recognition of interest income has been discontinued.
Nonperforming assets increased to $1.2 billion on December 31, 2008, from $392.4 million on December 31, 2007. The nonperforming assets ratio increased to 5.38 percent in 2008 from 1.66 percent in 2007. Nonperforming loans in the loan portfolio were $1.0 billion on December 31, 2008, compared to $283.3 million on December 31, 2007. The ratio of NPLs in the loan portfolio to total loans was 4.91 percent on December 31, 2008, compared to 1.28 percent on December 31, 2007. This increase in NPLs and NPAs was primarily attributable to continued deterioration in the OTC and homebuilder/condominium construction portfolios which was driven by the severe downturn in the housing markets and construction business. OTC loans are included in the Retail Real Estate Construction line of Table 10 and are included in the National Specialty Lending segment. Nonperforming OTC loans increased to $422.0 million on December 31, 2008 from $115.7 million on December 31, 2007. Nonperforming homebuilder/condominium construction (Res CRE) loans, (included in the Commercial Real Estate Construction line of Table 10) increased to $395.7 million on December 31, 2008 from $128.1 million on December 31, 2007. Also impacting higher NPLs in 2008 was the commercial and industrial portfolio (C&I) primarily due to the decline in general economic conditions that affected nearly all businesses. C&I nonperformers increased approximately $56 million to $80.2 million in 2008.
In addition, National Specialty Lending foreclosed assets increased $18.6 million in 2008, which is primarily attributed to the deterioration in the construction portfolios. The nonperforming held for sale loans, which were $8.5 million on December 31, 2008, are written down to lower of cost or market, while foreclosed assets are either charged-off or written down to net realizable value at foreclosure. The nonperforming asset ratio is expected to remain under pressure throughout the balance of the negative housing and broader economic cycle.
The ALLL to non-performing loans in the loan portfolio (“NPL ratio”) decreased to .81 times in 2008 compared to 1.21 times in 2007. While non-performing loans increased from the same period last year, a portion of these loans do not carry reserves. The SFAS No. 114 loans mentioned above that are charged down to NRV represent 40 percent of NPLs in the loan portfolio as of December 31, 2008. This approach compresses the ALLL to non-performing loans ratio because collateral dependent SFAS No. 114 loans are included in NPLs, but reserves for these loans are not carried in the ALLL. Residential CRE (Homebuilder and Condominium Construction) loans were $336.4 million or 71 percent of all SFAS No. 114 loans while the remainder is included in the C&I and Income CRE (Income-producing Commercial Real Estate) portfolios. Additionally, OTC loans that are 90 days past due are generally charged down to current appraised value (and over time, further reductions may be taken) and are included in non-performing loans. As of December 31, 2008, charged-down OTC loans accounted for 16 percent of non-performing loans. The ALLL related to OTC loans was $200.5 million which provides a coverage ratio of 20 percent for inherent losses in the portfolio. Because of the methodologies described above, the ALLL to NPL ratio is negatively impacted. NPLs for which reserves are actually carried were approximately $465.1 million as of December 31, 2008.
Table 21 gives additional information related to changes in nonperforming assets for 2006 through 2008 and nonperforming assets by segment. Information regarding nonperforming assets and past-due loans is presented in Table 22.
43
FIRST HORIZON NATIONAL CORPORATION
Table 21 - Nonperforming Assets
| | | | | | |
Change in Nonperforming Assets | | | | | | |
|
(Dollars in thousands) | | 2008 | | 2007 | | 2006 |
|
Beginning balance | | | $ | | 392,427 | | | | $ | | 139,028 | | | | $ | | 79,669 | |
Additional nonperforming assets | | | | 1,677,830 | | | | | 442,524 | | | | | 192,187 | |
Payments, sales and other dispositions | | | | (524,684 | ) | | | | | (95,864 | ) | | | | | (114,202 | ) | |
Charge-offs | | | | (387,616 | ) | | | | | (93,261 | ) | | | | | (18,626 | ) | |
|
Ending balance | | | $ | | 1,157,957 | | | | $ | | 392,427 | | | | $ | | 139,028 | |
|
Nonperforming Assets by Segment | | | | | | |
|
Regional Banking: | | | | | | |
Nonperforming loans | | | $ | | 163,933 | | | | $ | | 30,608 | | | | $ | | 40,924 | |
Foreclosed real estate | | | | 31,665 | | | | | 35,026 | | | | | 24,211 | |
|
Total Regional Banking | | | | 195,598 | | | | | 65,634 | | | | | 65,135 | |
|
Capital Markets: | | | | | | |
Nonperforming loans | | | | 27,339 | | | | | 8,970 | | | | | 4,453 | |
Foreclosed real estate | | | | 600 | | | | | 810 | | | | | - | |
|
Total Capital Markets | | | | 27,939 | | | | | 9,780 | | | | | 4,453 | |
|
National Specialty Lending: | | | | | | |
Nonperforming loans | | | | 834,042 | | | | | 243,711 | | | | | 37,461 | |
Foreclosed real estate | | | | 52,725 | | | | | 34,120 | | | | | 12,124 | |
|
Total National Specialty Lending | | | | 886,767 | | | | | 277,831 | | | | | 49,585 | |
|
Mortgage Banking: | | | | | | |
Nonperforming loans – including held for sale (a) | | | | 28,335 | | | | | 23,797 | | | | | 10,793 | |
Foreclosed real estate | | | | 19,318 | | | | | 15,385 | | | | | 9,062 | |
|
Total Mortgage Banking | | | | 47,653 | | | | | 39,182 | | | | | 19,855 | |
|
Total nonperforming loans | | | | 1,053,649 | | | | | 307,086 | | | | | 93,631 | |
|
Total foreclosed real estate & other assets | | | | 104,308 | | | | | 85,341 | | | | | 45,397 | |
|
Total nonperforming assets (a) (b) | | | $ | | 1,157,957 | | | | $ | | 392,427 | | | | $ | | 139,028 | |
|
|
(a) | | | | Includes $19,867 of loans held to maturity as of December 31, 2008. |
|
(b) | | | | Total impaired loans included in nonperforming loans were $474.1 million, $126.6 million and $29.7 million for the years 2008, 2007 and 2006, respectively. |
44
FIRST HORIZON NATIONAL CORPORATION
Table 22 - Nonperforming Assets and Delinquencies on December 31
| | | | | | | | | | | | |
(Dollars in thousands) | | 2008 | | 2007 | | 2006 | | 2005 | | 2004 | | 2003 |
|
Total nonperforming loans | | | $ | | 1,053,649 | | | | $ | | 307,086 | | | | $ | | 93,631 | | | | $ | | 52,259 | | | | $ | | 49,560 | | | | $ | | 51,784 | |
|
Total foreclosed real estate & other assets | | | | 104,308 | | | | | 85,341 | | | | | 45,397 | | | | | 27,410 | | | | | 27,778 | | | | | 24,411 | |
|
Total nonperforming assets (a) | | | $ | | 1,157,957 | | | | $ | | 392,427 | | | | $ | | 139,028 | | | | $ | | 79,669 | | | | $ | | 77,338 | | | | $ | | 76,195 | |
|
Total loans, net of unearned income | | | $ | | 21,278,190 | | | | $ | | 22,103,516 | | | | $ | | 22,104,905 | | | | $ | | 20,611,998 | | | | $ | | 16,441,928 | | | | $ | | 14,021,318 | |
Insured loans | | | | 591,116 | | | | | 913,164 | | | | | 729,842 | | | | | 826,904 | | | | | 665,909 | | | | | 862,675 | |
|
Loans excluding insured loans | | | $ | | 20,687,074 | | | | $ | | 21,190,352 | | | | $ | | 21,375,063 | | | | $ | | 19,785,094 | | | | $ | | 15,776,019 | | | | $ | | 13,158,643 | |
|
Foreclosed real estate from GNMA loans (b) | | | $ | | 21,230 | | | | $ | | 18,642 | | | | $ | | 18,121 | | | | $ | | - | | | | $ | | - | | | | $ | | - | |
Potential problem assets (c) | | | | 1,180,942 | | | | | 222,471 | | | | | 161,727 | | | | | 187,208 | | | | | 98,926 | | | | | 118,142 | |
Loans 30 to 89 days past due | | | | 360,735 | | | | | 287,949 | | | | | 131,211 | | | | | 97,980 | | | | | 69,593 | | | | | 88,874 | |
Loans 30 to 89 days past due – guaranteed portion (d) | | | | 94 | | | | | 92 | | | | | 161 | | | | | 1,021 | | | | | 873 | | | | | 2,404 | |
Loans 90 days past due | | | | 85,364 | | | | | 56,755 | | | | | 35,248 | | | | | 37,067 | | | | | 33,343 | | | | | 27,240 | |
Loans 90 days past due – guaranteed portion (d) | | | | 228 | | | | | 178 | | | | | 242 | | | | | 5,348 | | | | | 5,561 | | | | | 5,620 | |
Loans held for sale 30 to 89 days past due | | | | 45,307 | | | | | 57,317 | | | | | 31,264 | | | | | 45,788 | | | | | 56,379 | | | | | 73,458 | |
Loans held for sale 30 to 89 days past due – guaranteed portion (d) | | | | 45,296 | | | | | 57,317 | | | | | 24,586 | | | | | 30,868 | | | | | 43,542 | | | | | 60,551 | |
Loans held for sale 90 days past due | | | | 47,704 | | | | | 194,754 | | | | | 131,944 | | | | | 176,591 | | | | | 180,617 | | | | | 198,955 | |
Loans held for sale 90 days past due – guaranteed portion (d) | | | | 42,250 | | | | | 190,721 | | | | | 128,627 | | | | | 173,357 | | | | | 179,792 | | | | | 198,955 | |
|
Ratios: | | | | | | | | | | | | |
Allowance to nonperforming loans in the loan portfolio | | | | 0.81 | x | | | | | 1.21 | x | | | | | 2.61 | x | | | | | 4.65 | x | | | | | 3.85 | x | | | | | 3.71 | x | |
NPL % (e) | | | | 4.91 | % | | | | | 1.28 | % | | | | | 0.37 | % | | | | | 0.25 | % | | | | | 0.30 | % | | | | | 0.37 | % | |
NPA % (f) | | | | 5.38 | % | | | | | 1.59 | % | | | | | 0.54 | % | | | | | 0.29 | % | | | | | 0.37 | % | | | | | 0.41 | % | |
|
Certain previously reported amounts have been reclassified to agree with current presentation.
|
(a) | | | | Includes $19,867 of loans held to maturity as of December 31, 2008. |
|
(b) | | | | Prior to 2006, properties acquired by foreclosure through GNMA’s repurchase program were classified as receivables in “Other Assets” on the Consolidated Statements of Condition. |
|
(c) | | | | Includes past due loans. |
|
(d) | | | | Guaranteed loans include FHA, VA, student and GNMA loans repurchased through the GNMA repurchase program. |
|
(e) | | | | Nonperforming loans in the loan portfolio to total period end loans. |
|
(f) | | | | Nonperforming assets related to the loan portfolio to total loans plus foreclosed real estate and other assets. |
Past Due Loans and Potential Problem Assets
Past due loans are loans contractually past due 90 days or more as to interest or principal payments, but which have not yet been put on nonaccrual status. Past due loans in the loan portfolio increased to $85.3 million on December 31, 2008, compared to $56.8 million on December 31, 2007, with a ratio of past due loans in the loan portfolio to total loans of .40 percent on December 31, 2008, compared to .26 percent on December 31, 2007. Loans 30 to 89 days past due increased $72.8 million to $360.7 million while the ratio of portfolio loans 30 to 89 days past due to total loans increased to 1.70 percent on December 31, 2008, compared to 1.30 percent on December 31, 2007. This increase is primarily due to the severe housing market and declining general economic conditions and its impact on both commercial and retail real estate portfolios. Additional historical past due loan information can be found in Table 22.
Potential problem assets represent those assets where information about possible credit problems of borrowers has caused management to have serious doubts about the borrower’s ability to comply with present repayment terms. This definition is believed to be substantially consistent with the standards established by the Office of the Comptroller of the Currency for loans classified substandard. Potential problem assets in the loan portfolio, which includes loans past due 90 days or more but excludes nonperforming assets, increased to $1.2 billion, or 6 percent of total loans, on December 31, 2008, from $222.5 million, or 1 percent of total loans, on December 31, 2007. The current expectation of losses from potential problem assets has been included in management’s analysis for assessing the adequacy of the allowance for loan losses.
45
FIRST HORIZON NATIONAL CORPORATION
The following table provides additional asset quality data by loan portfolio:
Table 23 - Asset Quality by Portfolio
| | | | |
| | 2008 | | 2007 |
|
Commercial (C&I & Other) | | | | |
Period-end loans ($ millions) | | | $ | | 7,820 | | | | $ | | 7,120 | |
|
30+ Delinq. % | | | | .52 | % | | | | | .50 | % | |
NPL % | | | | 1.03 | | | | | .34 | |
Charge-offs % | | | | 1.36 | | | | | .49 | |
|
Allowance / Loans % | | | | 2.45 | % | | | | | * | |
Allowance / Charge-offs | | | | 1.92 | x | | | | | * | |
|
Income CRE (Income-producing Commercial Real Estate) | | | | |
Period-end loans ($ millions) | | | $ | | 1,988 | | | | $ | | 1,977 | |
|
30+ Delinq. % | | | | 2.42 | % | | | | | 1.96 | % | |
NPL % | | | | 5.02 | | | | | .26 | |
Charge-offs % | | | | 1.43 | | | | | .02 | |
|
Allowance / Loans % | | | | 4.71 | % | | | | | * | |
Allowance / Charge-offs | | | | 3.26 | x | | | | | * | |
|
Residential CRE (Homebuilder and Condominium Construction) | | | | |
Period-end loans ($ millions) | | | $ | | 1,288 | | | | $ | | 2,092 | |
|
30+ Delinq. % | | | | 3.74 | % | | | | | 3.56 | % | |
NPL % | | | | 30.71 | | | | | 6.12 | |
Charge-offs % | | | | 9.57 | | | | | 1.30 | |
|
Allowance / Loans % | | | | 8.25 | % | | | | | * | |
Allowance / Charge-offs | | | | .65 | x | | | | | * | |
|
Consumer Real Estate (Home Equity Installment and HELOC) | | | | |
Period-end loans ($ millions) | | | $ | | 7,749 | | | | $ | | 8,048 | |
|
30+ Delinq. % | | | | 1.97 | % | | | | | 1.43 | % | |
NPL % | | | | .07 | | | | | .09 | |
Charge-offs % | | | | 1.48 | | | | | .41 | |
|
Allowance / Loans % | | | | 2.35 | % | | | | | .56 | % | |
Allowance / Charge-offs | | | | 1.55 | x | | | | | 1.38 | x | |
|
OTC (Consumer Residential Construction Loans) | | | | |
Period-end loans ($ millions) | | | $ | | 981 | | | | $ | | 2,008 | |
|
30+ Delinq. % | | | | 4.43 | % | | | | | 2.50 | % | |
NPL % | | | | 43.03 | | | | | 5.76 | |
Charge-offs % | | | | 9.41 | | | | | 1.12 | |
|
Allowance / Loans % | | | | 20.44 | % | | | | | 2.99 | % | |
Allowance / Charge-offs | | | | 1.42 | x | | | | | 2.55 | x | |
|
Permanent Mortgage | | | | |
Period-end loans ($ millions) | | | $ | | 1,127 | | | | $ | | 510 | |
|
30+ Delinq. % | | | | 6.94 | % | | | | | 5.59 | % | |
NPL % | | | | 3.73 | | | | | .36 | |
Charge-offs % | | | | .74 | | | | | .09 | |
|
Allowance / Loans % | | | | 4.76 | % | | | | | .20 | % | |
Allowance / Charge-offs | | | | 8.60 | x | | | | | - | |
|
Credit Card and Other | | | | |
Period-end loans ($ millions) | | | $ | | 325 | | | | $ | | 342 | |
|
30+ Delinq. % | | | | 2.57 | % | | | | | 2.17 | % | |
NPL % | | | | - | | | | | - | |
Charge-offs % | | | | 4.82 | | | | | 3.22 | |
|
Allowance / Loans % | | | | 6.60 | % | | | | | 3.44 | % | |
Allowance / Charge-offs | | | | 1.34 | x | | | | | 1.08 | x | |
|
|
* | | | | Prior period information by commercial loan portfolio is unavailable. These ratios for the total commercial portfolio are provided below. |
|
| | | | The allowance to loans ratio was 3.53% and 2.00% for 2008 and 2007, respectively. |
|
| | | | The allowance to charge-offs ratio was 1.34x and 3.50x for 2008 and 2007, respectively. |
|
| | | | Loans are expressed net of unearned income. All data is based on internal loan classification. |
46
FIRST HORIZON NATIONAL CORPORATION
Mortgage Banking
First Horizon Home Loans, the former mortgage banking division of FHN, originated mortgage loans through its retail and wholesale operations and also purchased mortgage loans from third-party mortgage bankers (known as correspondent brokers) for sale to secondary market investors and subsequently serviced the majority of those loans. The secondary market for mortgages allowed First Horizon Home Loans to sell mortgage loans to investors, including GSE, such as FNMA, FHLMC and GNMA. Private investors participate in the secondary market as issuers and investors. The majority of First Horizon Home Loans’ mortgage loans were sold through transactions with government agencies. The risk of credit loss with regard to the principal amount of the loans sold was generally transferred to investors upon sale to the secondary market. To the extent that transferred mortgage loans are subsequently determined not to meet the agreed-upon qualifications or criteria, or to the extent that transferred mortgages default shortly after the sale, the purchaser has the right to return those loans to FHN. In addition, certain mortgage loans were sold to investors with limited or full recourse in the event of mortgage foreclosure (refer to discussion of foreclosure reserves under Critical Accounting Policies).
CRITICAL ACCOUNTING POLICIES
APPLICATION OF CRITICAL ACCOUNTING POLICIES AND ESTIMATES
FHN’s accounting policies are fundamental to understanding management’s discussion and analysis of results of operations and financial condition. The consolidated financial statements of FHN are prepared in conformity with accounting principles generally accepted in the United States of America and follow general practices within the industries in which it operates. The preparation of the financial statements requires management to make certain judgments and assumptions in determining accounting estimates. Accounting estimates are considered critical if (a) the estimate requires management to make assumptions about matters that were highly uncertain at the time the accounting estimate was made, and (b) different estimates reasonably could have been used in the current period, or changes in the accounting estimate are reasonably likely to occur from period to period, that would have a material impact on the presentation of FHN’s financial condition, changes in financial condition or results of operations.
It is management’s practice to discuss critical accounting policies with the Board of Directors’ Audit Committee including the development, selection and disclosure of the critical accounting estimates. Management believes the following critical accounting policies are both important to the portrayal of the company’s financial condition and results of operations and require subjective or complex judgments. These judgments about critical accounting estimates are based on information available as of the date of the financial statements.
ALLOWANCE FOR LOAN LOSSES
Management’s policy is to maintain the ALLL at a level sufficient to absorb estimated probable incurred losses in the loan portfolio. Management performs periodic and systematic detailed reviews of its loan portfolio to identify trends and to assess the overall collectibility of the loan portfolio. Accounting standards require that loan losses be recorded when management determines it is probable that a loss has been incurred and the amount of the loss can be reasonably estimated. Management believes the accounting estimate related to the ALLL is a “critical accounting estimate” because: changes in it can materially affect the provision for loan losses and net income, it requires management to predict borrowers’ likelihood or capacity to repay, and it requires management to distinguish between losses incurred as of a balance sheet date and losses expected to be incurred in the future. Accordingly, this is a highly subjective process and requires significant judgment since it is often difficult to determine when specific loss events may actually occur. The ALLL is increased by the provision for loan losses and recoveries and is decreased by charged-off loans. This critical accounting estimate applies to all of FHN’s business line segments. The Credit Policy and Executive Committee of FHN’s board of directors reviews quarterly the level of the ALLL.
FHN’s methodology for estimating the ALLL is not only critical to the accounting estimate, but to the credit risk management function as well. Key components of the estimation process are as follows: (1) commercial loans determined by management to be individually impaired loans are evaluated individually and specific reserves are determined based on the difference between the outstanding loan amount and the estimated net realizable value of the collateral (if collateral dependent) or the present value of expected future cash flows; (2) individual commercial loans not considered to be individually impaired are segmented based on similar credit risk characteristics and
47
FIRST HORIZON NATIONAL CORPORATION
evaluated on a pool basis; (3) reserve rates for the commercial segment are calculated based on historical charge-offs and are adjusted by management to reflect current events, trends and conditions (including economic factors and trends); (4) management’s estimate of probable incurred losses reflects the reserve rate applied against the balance of loans in the commercial segment of the loan portfolio; (5) retail loans are segmented based on loan type; (6) reserve amounts for each retail portfolio segment are calculated using analytical models based on loss experience adjusted by management to reflect current events, trends and conditions (including economic factors and trends); and (7) the reserve amount for each retail portfolio segment reflects management’s estimate of probable incurred losses in the retail segment of the loan portfolio.
Principal loan amounts are charged off against the ALLL in the period in which the loan or any portion of the loan is deemed to be uncollectible.
Given the substantial instability in the current housing market and significant deterioration experienced in the commercial, OTC and home equity portfolios, FHN proactively reviews and analyzes these portfolios to more promptly identify and resolve problem loans.
For commercial loans, reserves are established using historical loss factors by grade level. Relationship managers risk rate each loan using grades that reflect both the probability of default and estimated loss severity in the event of default. Portfolio reviews are conducted quarterly to provide independent oversight of risk grading decisions for larger credits. Loans with emerging weaknesses receive increased oversight through our “Watch List” process. For new “Watch List” loans, senior credit management reviews risk grade appropriateness and action plans. After initial identification, relationship managers prepare monthly updates for review and discussion by more senior business line and credit officers. This oversight is intended to bring consistent grading and allow timely identification of loans that need to be further downgraded or placed on non-accrual status. When a loan becomes classified, the asset generally transfers to the specialists in our Loan Rehab and Recovery group where the accounts receive more detailed monitoring; at this time, new appraisals are typically ordered for real estate collateral dependent credits. Loans are placed on non-accrual if it becomes evident that full collection of principal and interest is at risk or if the loans become 90 days or more past due.
Generally, classified commercial nonaccrual loans over $1 million are deemed to be impaired in accordance with SFAS No. 114 “Accounting by Creditors for Impairment of a Loan” and are assessed for impairment measurement. For impaired assets viewed as collateral dependent, fair value estimates are obtained from a recently received and reviewed appraisal. Appraised values are adjusted down for costs associated with asset disposal and for our estimate of any further deterioration in values since the most recent appraisal. Upon the determination of impairment, FHN charges off the full difference between book value and our best estimate of the asset’s net realizable value.The total value of commercial SFAS No. 114 impaired loans considered collateral dependent and written down to NRV at December 31, 2008 was $414.9 million.
For OTC real estate construction loans, reserve levels are established based on portfolio modeling and monthly portfolio reviews conducted with business line managers and credit officers. The inherent risk in credits is examined and evaluated based on factors such as draw inactivity and borrower conditions, often recognizing problems prior to delinquency. In addition, OTC loans that reach 90 days past due are placed on non-accrual. A new appraisal is ordered for loans that reach 90 days past due or are classified as substandard during the monthly portfolio review. Loans are initially written down to current appraised value. Periodically, loans are assessed for further charge down.
For home equity loans and lines, reserve levels are established through the use of segmented roll-rate models. Loans are classified substandard at 90 days delinquent. Our collateral position is assessed prior to the asset becoming 180 days delinquent. If the value does not support foreclosure, balances are charged-off and other avenues of recovery are pursued. If the value supports foreclosure, the loan is charged down to net realizable value and is placed on non-accrual status. When collateral is taken to OREO, the asset is assessed for further write down to appraised value.
FHN believes that the critical assumptions underlying the accounting estimate made by management include: (1) the commercial loan portfolio has been properly risk graded based on information about borrowers in specific industries and specific issues with respect to single borrowers; (2) borrower specific information made
48
FIRST HORIZON NATIONAL CORPORATION
available to FHN is current and accurate; (3) the loan portfolio has been segmented properly and individual loans have similar credit risk characteristics and will behave similarly; (4) known significant loss events that have occurred were considered by management at the time of assessing the adequacy of the ALLL; (5) the economic factors utilized in the allowance for loan losses estimate are used as a measure of actual incurred losses; (6) the period of history used for historical loss factors is indicative of the current environment; and (7) the reserve rates, as well as other adjustments estimated by management for current events, trends, and conditions, utilized in the process reflect an estimate of losses that have been incurred as of the date of the financial statements.
While management uses the best information available to establish the ALLL, future adjustments to the ALLL and methodology may be necessary if economic or other conditions differ substantially from the assumptions used in making the estimates or, if required by regulators, based upon information at the time of their examinations. Such adjustments to original estimates, as necessary, are made in the period in which these factors and other relevant considerations indicate that loss levels vary from previous estimates.
Beginning in the later half of 2007 and throughout 2008, FHN continued to actively review its loan portfolios and apply additional review procedures to more promptly identify potential problem loans and to determine reserve sufficiency. These actions were necessary due to strongly adverse real estate market conditions, rapid material declines in collateral values in certain high risk geographic locations and a broader economic downturn. The extent to which supplementary procedures were applied was based on observable trends and risks within the portfolio. As a result of focused portfolio management activities, the C&I and commercial real estate portfolios experienced downward grade migration (especially in homebuilder finance and condominium construction loans) which increased the associated reserve levels. Furthermore, as a result of the current stress in the financial system, loans to financial institutions, which are primarily included in the C&I portfolio, were reviewed extensively and resulted in some downward grade migration and resultant reserve increase. Also, during 2007, management adjusted its loss recognition practices and in most cases instead of carrying an allowance for loan losses, impaired commercial loans considered collateral dependent were charged down to a net realizable value. A detailed review of the OTC loans resulted in a reserve which reflects the current observable inherent losses in that mature, winding-down portfolio. Additionally, enhanced analysis procedures were applied to the home equity portfolio resulting in the identification of increased loss severities and reserve increase. As a result of management’s existing processes coupled with the results of the additional review procedures, FHN recognized $1.1 billion of provision expense in 2008, increasing the allowance for loan losses to $849.2 million.
Mortgage Servicing Rights and Other Related Retained Interests
When FHN sold mortgage loans in the secondary market to investors, it generally retained the right to service the loans sold in exchange for a servicing fee that is collected over the life of the loan as the payments are received from the borrower. An amount was capitalized as MSR on the Consolidated Statements of Condition at current fair value. The changes in fair value of MSR are included as a component of Mortgage Banking – Noninterest Income on the Consolidated Statements of Income.
Effective January 1, 2006, FHN elected early adoption of SFAS No. 156. This amendment to Statement of Financial Accounting Standards No. 140, “Accounting for Transfers and Servicing of Financial Assets and Extinguishments of Liabilities” (SFAS No. 140) required servicing rights be initially measured at fair value. Subsequently, companies are permitted to elect, on a class-by-class basis, either fair value or amortized cost accounting for servicing rights. FHN elected fair value accounting for all classes of mortgage servicing rights. Accordingly, FHN recognized the cumulative effect of a change in accounting principle totaling $.2 million, net of tax, representing the excess of the fair value of the servicing asset over the recorded value on January 1, 2006.
MSR Estimated Fair Value
In accordance with Statement of Financial Accounting Standards No. 156, “Accounting for Servicing of Financial Assets – an Amendment of FASB Statement No. 140,” FHN has elected fair value accounting for all classes of mortgage servicing rights. The fair value of MSR typically rises as market interest rates increase and declines as market interest rates decrease; however, the extent to which this occurs depends in part on (1) the magnitude of changes in market interest rates, and (2) the differential between the then current market interest rates for mortgage loans and the mortgage interest rates included in the mortgage-servicing portfolio.
49
FIRST HORIZON NATIONAL CORPORATION
Since sales of MSR tend to occur in private transactions and the precise terms and conditions of the sales are typically not readily available, there is a limited market to refer to in determining the fair value of MSR. As such, like other participants in the mortgage banking business, FHN relies primarily on a discounted cash flow model to estimate the fair value of its MSR. This model calculates estimated fair value of the MSR using predominant risk characteristics of MSR, such as interest rates, type of product (fixed vs. variable), age (new, seasoned, moderate), agency type and other factors. FHN uses assumptions in the model that it believes are comparable to those used by other participants in the mortgage banking business and reviews estimated fair values and assumptions with third-party brokers and other service providers on a quarterly basis. FHN also compares its estimates of fair value and assumptions to recent market activity and against its own experience.
Estimating the cash flow components of net servicing income from the loan and the resultant fair value of the MSR requires FHN to make several critical assumptions based upon current market and loan production data.
Prepayment Speeds: Generally, when market interest rates decline and other factors favorable to prepayments occur, there is a corresponding increase in prepayments as customers refinance existing mortgages under more favorable interest rate terms. When a mortgage loan is prepaid the anticipated cash flows associated with servicing that loan are terminated, resulting in a reduction of the fair value of the capitalized MSR. To the extent that actual borrower prepayments do not react as anticipated by the prepayment model (i.e., the historical data observed in the model does not correspond to actual market activity), it is possible that the prepayment model could fail to accurately predict mortgage prepayments and could result in significant earnings volatility. To estimate prepayment speeds, FHN utilizes a third-party prepayment model, which is based upon statistically derived data linked to certain key principal indicators involving historical borrower prepayment activity associated with mortgage loans in the secondary market, current market interest rates and other factors. For purposes of model valuation, estimates are made for each product type within the MSR portfolio on a monthly basis.
Table 24 - Mortgage Banking Prepayment Assumptions
| | | | | | |
| | 2008 | | 2007 | | 2006 |
|
Prepayment speeds | | | | | | |
Actual | | | | 13.1 | % | | | | | 15.4 | % | | | | | 17.4 | % | |
Estimated* | | | | 25.3 | | | | | 15.2 | | | | | 13.9 | |
|
|
* | | | | Estimated prepayment speeds represent monthly average prepayment speed estimates for each of the years presented. |
Discount Rate: Represents the rate at which expected cash flows are discounted to arrive at the net present value of servicing income. Discount rates will change with market conditions (i.e., supply vs. demand) and be reflective of the yields expected to be earned by market participants investing in MSR.
Cost to Service: Expected costs to service are estimated based upon the incremental costs that a market participant would use in evaluating the potential acquisition of MSR.
Float Income: Estimated float income is driven by expected float balances (principal, interest and escrow payments that are held pending remittance to the investor or other third party) and current market interest rates, including the thirty-day London Inter-Bank Offered Rate (LIBOR) and five-year swap interest rates, which are updated on a monthly basis for purposes of estimating the fair value of MSR.
FHN engages in a process referred to as “price discovery” on a quarterly basis to assess the reasonableness of the estimated fair value of MSR. Price discovery is conducted through a process of obtaining the following information: (a) quarterly informal (and an annual formal) valuation of the servicing portfolio by prominent independent mortgage-servicing brokers, and (b) a collection of surveys and benchmarking data made available by independent third parties that include peer participants in the mortgage banking business. Although there is no single source of market information that can be relied upon to assess the fair value of MSR, FHN reviews all information obtained during price discovery to determine whether the estimated fair value of MSR is reasonable when compared to market information. On December 31, 2008 and 2007, FHN determined that its MSR valuations and assumptions were reasonable based on the price discovery process.
50
FIRST HORIZON NATIONAL CORPORATION
The First Horizon Risk Management Committee (FHRMC) reviews the overall assessment of the estimated fair value of MSR monthly. The FHRMC is responsible for approving the critical assumptions used by management to determine the estimated fair value of First Horizon’s MSR. In addition, FHN’s MSR Committee reviews the initial capitalization rates for newly originated MSR, the assessment of the fair value of MSR and the source of significant changes to the MSR carrying value each quarter.
Hedging the Fair Value of MSR
FHN enters into financial agreements to hedge MSR in order to minimize the effects of loss in value of MSR associated with increased prepayment activity that generally results from declining interest rates. In a rising interest rate environment, the value of the MSR generally will increase while the value of the hedge instruments will decline. Specifically, FHN enters into interest rate contracts (including swaps, swaptions and mortgage forward sales contracts) to hedge against the effects of changes in fair value of its MSR. Substantially all capitalized MSR are hedged. The hedges are economic hedges only, and are terminated and reestablished as needed to respond to changes in market conditions. Changes in the value of the hedges are recognized as a component of net servicing income in mortgage banking noninterest income. Successful economic hedging will help minimize earnings volatility that may result from carrying MSR at fair value. Subsequent to the sale of certain mortgage banking operations to MetLife, FHN determines the fair value of the derivatives used to hedge MSR (and excess interests as discussed below) using inputs observed in active markets for similar instruments with typical inputs including the LIBOR curve, option volatility and option skew. Prior to the MetLife transaction, fair values of these derivatives were obtained through proprietary pricing models which were compared to market value quotes received from third party broker-dealers in the derivative markets.
In conjunction with the repositioning of its mortgage banking operations, FHN no longer retains servicing on the loans it sells. In prior periods, FHN generally experienced increased loan origination and production in periods of low interest rates which resulted in the capitalization of new MSR associated with new production. This provided for a “natural hedge” in the mortgage-banking business cycle. New production and origination did not prevent FHN from recognizing losses due to reduction in carrying value of existing servicing rights as a result of prepayments; rather, the new production volume resulted in loan origination fees and the capitalization of MSR as a component of realized gains related to the sale of such loans in the secondary market, thus the natural hedge, which tended to offset a portion of the reduction in MSR carrying value during a period of low interest rates. In a period of increased borrower prepayments, these losses could have been significantly offset by a strong replenishment rate and strong net margins on new loan originations. To the extent that First Horizon Home Loans was unable to maintain a strong replenishment rate, or in the event that the net margin on new loan originations declined from historical experience, the value of the natural hedge might have diminished, thereby significantly impacting the results of operations in a period of increased borrower prepayments.
FHN does not specifically hedge the change in fair value of MSR attributed to other risks, including unanticipated prepayments (representing the difference between actual prepayment experience and estimated prepayments derived from the model, as described above), discount rates, cost to service and other factors. To the extent that these other factors result in changes to the fair value of MSR, FHN experiences volatility in current earnings due to the fact that these risks are not currently hedged.
Excess Interest (Interest-Only Strips) Fair Value – Residential Mortgage Loans
In certain cases, when FHN sold mortgage loans in the secondary market, it retained an interest in the mortgage loans sold primarily through excess interest. These financial assets represent rights to receive earnings from serviced assets that exceed contractually specified servicing fees and are legally separable from the base servicing rights. Consistent with MSR, the fair value of excess interest typically rises as market interest rates increase and declines as market interest rates decrease. Additionally, similar to MSR, the market for excess interest is limited, and the precise terms of transactions involving excess interest are not typically readily available. Accordingly, FHN relies primarily on a discounted cash flow model to estimate the fair value of its excess interest.
Estimating the cash flow components and the resultant fair value of the excess interest requires FHN to make certain critical assumptions based upon current market and loan production data. The primary critical assumptions used by FHN to estimate the fair value of excess interest include prepayment speeds and discount rates, as discussed above. FHN’s excess interest is included as a component of trading securities on the Consolidated
51
FIRST HORIZON NATIONAL CORPORATION
Statements of Condition, with realized and unrealized gains and losses included in current earnings as a component of mortgage banking income on the Consolidated Statements of Income.
Hedging the Fair Value of Excess Interest
FHN utilizes derivatives (including swaps, swaptions and mortgage forward sales contracts) that change in value inversely to the movement of interest rates to protect the value of its excess interest as an economic hedge. Realized and unrealized gains and losses associated with the change in fair value of derivatives used in the economic hedge of excess interest are included in current earnings in mortgage banking noninterest income as a component of servicing income. Excess interest is included in trading securities with changes in fair value recognized currently in earnings in mortgage banking noninterest income as a component of servicing income.
The extent to which the change in fair value of excess interest is offset by the change in fair value of the derivatives used to hedge this asset depends primarily on the hedge coverage ratio maintained by FHN. Also, as noted above, to the extent that actual borrower prepayments do not react as anticipated by the prepayment model (i.e., the historical data observed in the model does not correspond to actual market activity), it is possible that the prepayment model could fail to accurately predict mortgage prepayments, which could significantly impact FHN’s ability to effectively hedge certain components of the change in fair value of excess interest and could result in significant earnings volatility.
Principal Only and Subordinated Bond Certificates
In some instances, FHN retained interests in the loans it securitized by retaining certificated principal only strips or subordinated bonds. Subsequent to the MetLife transaction, FHN uses observable inputs such as trades of similar instruments, yield curves, credit spreads and consensus prepayment speeds to determine the fair value of principal only strips. Prior to the MetLife transaction, FHN used the market prices from comparable assets such as publicly traded FNMA trust principal only strips that were adjusted to reflect the relative risk difference between readily marketable securities and privately issued securities in valuing the principal only strips. The fair value of subordinated bonds is determined using the best available market information, which may include trades of comparable securities, independently provided spreads to other marketable securities, and published market research. Where no market information is available, the company utilizes an internal valuation model. As of December 31, 2008, no market information was available, and the subordinated bonds were valued using an internal model which includes assumptions about timing, frequency and severity of loss, prepayment speeds of the underlying collateral, and the yield that a market participant would require. The assumptions were consistent with those embedded in the December 31, 2007 values, when there was more market information available, except that loss frequency and loss severity assumptions were worsened consistent with published industry cumulative historical loss information and published market projections of future deteriorations in real estate values. As of December 31, 2007, the subordinated bonds were valued using trades of comparable market securities and independently provided spreads. Both the principal only strips and the subordinated bonds are collateralized by prime or Alt-A jumbo loans which FHN originated and sold into private label securitizations, primarily in 2006 and 2007. FHN does not utilize derivatives to hedge against changes in the fair value of these certificates.
Residual-Interest Certificates Fair Value – HELOC and Second-lien Mortgages
In certain cases, when FHN sold HELOC or second-lien mortgages in the secondary market, it retained an interest in the loans sold primarily through a residual-interest certificate. Residual-interest certificates are financial assets which represent rights to receive earnings to the extent of excess income generated by the underlying loan collateral of certain mortgage-backed securities, which is not needed to meet contractual obligations of senior security holders. The fair value of a residual-interest certificate typically changes based on the differences between modeled prepayment speeds and credit losses and actual experience. Additionally, similar to MSR and interest-only certificates, the market for residual-interest certificates is limited, and the precise terms of transactions involving residual-interest certificates are not typically readily available. Accordingly, FHN relies primarily on a discounted cash flow model, which is prepared monthly, to estimate the fair value of its residual-interest certificates.
Estimating the cash flow components and the resultant fair value of the residual-interest certificates requires FHN to make certain critical assumptions based upon current market and loan production data. The primary critical assumptions used by FHN to estimate the fair value of residual-interest certificates include prepayment speeds, credit losses and discount rates, as discussed above. FHN’s residual-interest certificates are included as a component of trading securities on the Consolidated Statements of Condition, with realized and unrealized gains
52
FIRST HORIZON NATIONAL CORPORATION
and losses included in current earnings as a component of other income on the Consolidated Statements of Income. FHN does not utilize derivatives to hedge against changes in the fair value of residual-interest certificates.
Pipeline and Warehouse
As a result of the MetLife transaction, mortgage banking origination activity will be significantly reduced in periods after third quarter 2008 as FHN focuses on origination within its regional banking footprint. Accordingly, the following discussion of pipeline and warehouse related derivatives is primarily applicable to reporting periods occurring through the third quarter 2008.
During the period of loan origination and prior to the sale of mortgage loans in the secondary market, FHN has exposure to mortgage loans that are in the “mortgage pipeline” and the “mortgage warehouse”. The mortgage pipeline consists of loan applications that have been received, but have not yet closed as loans. Pipeline loans are either “floating” or “locked”. A floating pipeline loan is one on which an interest rate has not been locked by the borrower. A locked pipeline loan is one on which the potential borrower has set the interest rate for the loan by entering into an interest rate lock commitment. Once a mortgage loan is closed and funded, it is included within the mortgage warehouse, or the “inventory” of mortgage loans that are awaiting sale and delivery into the secondary market.
Interest rate lock commitments are derivatives pursuant to SFAS 133 and are therefore recorded at estimates of fair value. Effective January 1, 2008, FHN applied the provisions of Staff Accounting Bulletin No. 109, “Written Loan Commitments Recorded at Fair Value Through Earnings” (SAB No. 109) prospectively for derivative loan commitments issued or modified after that date. SAB No. 109 requires inclusion of expected net future cash flows related to loan servicing activities in the fair value measurement of a written loan commitment. Also on January 1, 2008, FHN adopted Statement of Financial Accounting Standards No. 157, “Fair Value Measurements” (SFAS No. 157), which affected the valuation of interest rate lock commitments previously measured under the guidance of EITF 02-3, “Issues Involved in Accounting for Derivative Contracts Held for Trading Purposes and Contracts Involved in Energy Trading and Risk Management Activities”.
FHN adopted Statement of Financial Accounting Standards No. 159, “The Fair Value Option for Financial Assets and Financial Liabilities – Including an Amendment of FASB Statement No. 115” (SFAS No. 159) on January 1, 2008. Prior to adoption of SFAS No. 159, all warehouse loans were carried at the lower of cost or market, where carrying value was adjusted for successful hedging under SFAS No. 133 and the comparison of carrying value to market was performed for aggregate loan pools. Upon adoption of SFAS No. 159, FHN elected to prospectively account for substantially all of its mortgage loan warehouse products at fair value upon origination and correspondingly discontinued the application of SFAS No. 133 hedging relationships for these new originations.
The fair value of interest rate lock commitments and the fair value of warehouse loans are impacted principally by changes in interest rates, but also by changes in borrower’s credit, and changes in profit margins required by investors for perceived risks (i.e., liquidity). FHN does not hedge against credit and liquidity risk in the pipeline or warehouse. Third party models are used to manage the interest rate risk.
The fair value of loans whose principal market is the securitization market is based on recent security trade prices for similar product with a similar delivery date, with necessary pricing adjustments to convert the security price to a loan price. Loans whose principal market is the whole loan market are priced based on recent observable whole loan trade prices or published third party bid prices for similar product, with necessary pricing adjustments to reflect differences in loan characteristics. Typical adjustments to security prices for whole loan prices include adding the value of MSR to the security price or to the whole loan price if the price is servicing retained, adjusting for interest in excess of (or less than) the required coupon or note rate, adjustments to reflect differences in the characteristics of the loans being valued as compared to the collateral of the security or the loan characteristics in the benchmark whole loan trade, adding interest carry, reflecting the recourse obligation that will remain after sale, and adjusting for changes in market liquidity or interest rates if the benchmark security or loan price is not current. Additionally, loans that are delinquent or otherwise significantly aged are discounted to reflect the less marketable nature of these loans.
The fair value of FHN’s warehouse (first-lien mortgage loans held for sale) changes with fluctuations in interest rates from the loan closing date through the date of sale of the loan into the secondary market. Typically, the fair
53
FIRST HORIZON NATIONAL CORPORATION
value of the warehouse declines in value when interest rates increase and rises in value when interest rates decrease. To mitigate this risk, FHN entered into forward sales contracts and futures contracts to provide an economic hedge against those changes in fair value on a significant portion of the warehouse. These derivatives are recorded at fair value with changes in fair value recorded in current earnings as a component of the gain or loss on the sale of loans in mortgage banking noninterest income.
Prior to the adoption of SFAS No. 159, to the extent that these interest rate derivatives were designated to hedge specific similar assets in the warehouse and prospective analyses indicated that high correlation is expected, the hedged loans were considered for hedge accounting under SFAS No. 133. Anticipated correlation was determined by projecting a dollar offset relationship for each tranche based on anticipated changes in the fair value of the hedged mortgage loans and the related derivatives, in response to various interest rate shock scenarios. Hedges were reset daily and the statistical correlation was calculated using these daily data points. Retrospective hedge effectiveness was measured using the regression results. FHN generally maintained a coverage ratio (the ratio of expected change in the fair value of derivatives to expected change in the fair value of hedged assets) of approximately 100 percent on warehouse loans accounted for under SFAS No. 133.
Warehouse loans qualifying for SFAS No. 133 hedge accounting treatment totaled $2.6 billion on December 31, 2007. The balance sheet impacts of the related derivatives were net liabilities of $18.8 million on December 31, 2007. Net losses of $15.5 million representing the ineffective portion of these fair value hedges were recognized as a component of gain or loss on sale of loans for the year ended December 30, 2007.
Interest rate lock commitments generally have a term of up to 60 days before the closing of the loan. During this period, the value of the lock changes with changes in interest rates. The interest rate lock commitment does not bind the potential borrower to entering into the loan, nor does it guarantee that FHN will approve the potential borrower for the loan. Therefore, when determining fair value, FHN makes estimates of expected “fallout” (locked pipeline loans not expected to close), using models, which consider cumulative historical fallout rates and other factors. Fallout can occur for a variety of reasons including falling rate environments when a borrower will abandon an interest rate lock commitment at one lender and enter into a new lower interest rate lock commitment at another, when a borrower is not approved as an acceptable credit by the lender, or for a variety of other non-economic reasons. Changes in the fair value of interest rate lock commitments are recorded in current earnings as gain or loss on the sale of loans in mortgage banking noninterest income.
Because interest rate lock commitments are derivatives, they do not qualify for hedge accounting treatment under SFAS 133. However, FHN economically hedges the risk of changing interest rates by entering into forward sales and futures contracts. The extent to which FHN is able to economically hedge changes in the mortgage pipeline depended largely on the hedge coverage ratio that was maintained relative to mortgage loans in the pipeline. The hedge coverage ratio could change significantly due to changes in market interest rates and the associated forward commitment prices for sales of mortgage loans in the secondary market. Increases or decreases in the hedge coverage ratio could result in significant earnings volatility to FHN.
For the period ended December 31, 2008, the valuation model utilized to estimate the fair value of loan applications locked prospectively from January 1, 2008, recognizes the full fair value of the ultimate loan adjusted for estimated fallout and estimated cost assumptions a market participant would use to convert the lock into a loan. The fair value of interest rate lock commitments was $.2 million on December 31, 2008. For the period ended December 31, 2007, the valuation model utilized to estimate the fair value of interest rate lock commitments assumed a zero fair value on the date of the lock with the borrower. Subsequent to the lock date, the model calculated the change in value due solely to the change in interest rates and estimated fallout resulting in a net liability with an estimated fair value of $9.9 million on December 31, 2007.
Foreclosure Reserves
As discussed above, FHN originated mortgage loans with the intent to sell those loans to GSE and other private investors in the secondary market. Certain of the mortgage loans were sold with limited or full recourse in the event of foreclosure. On December 31, 2008 and 2007, the outstanding principal balance of mortgage loans sold with limited recourse arrangements where some portion of the principal is at risk and serviced by FHN was $3.5 billion and $3.3 billion, respectively. Additionally, on December 31, 2008 and 2007, $1.7 billion and $5.3 billion, respectively, of mortgage loans were outstanding which were sold under limited recourse arrangements where the
54
FIRST HORIZON NATIONAL CORPORATION
risk is limited to interest and servicing advances. On December 31, 2008 and 2007, $80.9 million and $102.8 million, respectively, of mortgage loans were outstanding which were serviced under full recourse arrangements.
Loans sold with limited recourse include loans sold under government guaranteed mortgage loan programs including the Federal Housing Administration (FHA) and Veterans Administration (VA). FHN continues to absorb losses due to uncollected interest and foreclosure costs and/or limited risk of credit losses in the event of foreclosure of the mortgage loan sold. Generally, the amount of recourse liability in the event of foreclosure is determined based upon the respective government program and/or the sale or disposal of the foreclosed property collateralizing the mortgage loan. Another instance of limited recourse is the VA/No bid. In this case, the VA guarantee is limited and FHN may be required to fund any deficiency in excess of the VA guarantee if the loan goes to foreclosure.
Loans sold with full recourse generally include mortgage loans sold to investors in the secondary market which are uninsurable under government guaranteed mortgage loan programs, due to issues associated with underwriting activities, documentation or other concerns.
Management closely monitors historical experience, borrower payment activity, current economic trends and other risk factors, and establishes a reserve for foreclosure losses for loans sold with limited recourse, loans serviced with full recourse, and loans sold with general representations and warranties, including early payment defaults. Management believes the foreclosure reserve is sufficient to cover incurred foreclosure losses relating to loans being serviced as well as loans sold where the servicing was not retained. The reserve for foreclosure losses is based upon a historical progression model using a rolling 12-month average, which predicts the probability or frequency of a mortgage loan entering foreclosure. In addition, other factors are considered, including qualitative and quantitative factors (e.g., current economic conditions, past collection experience, risk characteristics of the current portfolio and other factors), which are not defined by historical loss trends or severity of losses. On December 31, 2008 and 2007, the foreclosure reserve was $37.0 million and $16.2 million, respectively. Table 25 provides a summary of reserves for foreclosure losses for the periods ended December 31, 2008 and 2007. The servicing portfolio has decreased from $103.7 billion on December 30, 2007, to $63.7 billion on December 31, 2008 as FHN has reduced its servicing portfolio through sales through the end of 2008, while the foreclosure reserve has experienced increases primarily due to increases in both frequency and severity of projected losses.
Table 25 - Reserves for Foreclosure Losses
| | | | | | (Dollars in thousands) | | 2008 | | 2007 | | 2006 |
|
Beginning balance | | | $ | | 16,160 | | | | $ | | 14,036 | | | | $ | | 16,372 | |
Provision for foreclosure losses | | | | 33,578 | | | | | 11,488 | | | | | 13,897 | |
Charge-offs | | | | (13,612 | ) | | | | | (11,848 | ) | | | | | (18,363 | ) | |
Recoveries | | | | 830 | | | | | 2,484 | | | | | 2,130 | |
|
Ending balance | | | $ | | 36,956 | | | | $ | | 16,160 | | | | $ | | 14,036 | |
|
Goodwill and Assessment of Impairment
FHN’s policy is to assess goodwill for impairment at the reporting unit level on an annual basis or between annual assessments if an event occurs or circumstances change that would more likely than not reduce the fair value of a reporting unit below its carrying amount. Impairment is the condition that exists when the carrying amount of goodwill exceeds its implied fair value. Accounting standards require management to estimate the fair value of each reporting unit in making the assessment of impairment at least annually. As of October 1, 2008 and 2007, FHN engaged an independent valuation firm to assist in the computation of the fair value estimates of each reporting unit as part of its annual impairment assessment. The valuation utilized three separate methodologies and applied a weighted average to each in order to determine fair value for each reporting unit. The valuation as of October 1, 2008 indicated no goodwill impairment in any of the reporting units. The valuation as of October 1, 2007, indicated goodwill impairment for the Mortgage Banking segment.
Management believes the accounting estimates associated with determining fair value as part of the goodwill impairment test is a “critical accounting estimate” because estimates and assumptions are made about FHN’s future performance and cash flows, as well as other prevailing market factors (interest rates, economic trends, etc.). FHN’s policy allows management to make the determination of fair value using internal cash flow models or
55
FIRST HORIZON NATIONAL CORPORATION
by engaging independent third parties. If a charge to operations for impairment results, this amount would be reported separately as a component of noninterest expense. This critical accounting estimate applies to the Regional Banking and Capital Markets business segments. National Specialty Lending and Mortgage Banking have no goodwill. Reporting units have been defined as the same level as the operating business segments.
The impairment testing process conducted by FHN begins by assigning net assets and goodwill to each reporting unit. FHN then completes “step one” of the impairment test by comparing the fair value of each reporting unit (as determined based on the discussion below) with the recorded book value (or “carrying amount”) of its net assets, with goodwill included in the computation of the carrying amount. If the fair value of a reporting unit exceeds its carrying amount, goodwill of that reporting unit is not considered impaired, and “step two” of the impairment test is not necessary. If the carrying amount of a reporting unit exceeds its fair value, step two of the impairment test is performed to determine the amount of impairment. Step two of the impairment test compares the carrying amount of the reporting unit’s goodwill to the “implied fair value” of that goodwill. The implied fair value of goodwill is computed by assuming all assets and liabilities of the reporting unit would be adjusted to the current fair value, with the offset as an adjustment to goodwill. This adjusted goodwill balance is the implied fair value used in step two. An impairment charge is recognized for the amount by which the carrying amount of goodwill exceeds its implied fair value.
In connection with obtaining the independent valuation, management provided certain data and information that was utilized in the estimation of fair value. This information included budgeted and forecasted earnings of FHN at the reporting unit level. Management believes that this information is a critical assumption underlying the estimate of fair value. Other assumptions critical to the process were also made, including discount rates, asset and liability growth rates, and other income and expense estimates.
While management uses the best information available to estimate future performance for each reporting unit, future adjustments to management’s projections may be necessary if conditions differ substantially from the assumptions used in making the estimates.
Contingent Liabilities
A liability is contingent if the amount or outcome is not presently known, but may become known in the future as a result of the occurrence of some uncertain future event. FHN estimates its contingent liabilities based on management’s estimates about the probability of outcomes and their ability to estimate the range of exposure. Accounting standards require that a liability be recorded if management determines that it is probable that a loss has occurred and the loss can be reasonably estimated. In addition, it must be probable that the loss will be confirmed by some future event. As part of the estimation process, management is required to make assumptions about matters that are by their nature highly uncertain.
The assessment of contingent liabilities, including legal contingencies and income tax liabilities, involves the use of critical estimates, assumptions and judgments. Management’s estimates are based on their belief that future events will validate the current assumptions regarding the ultimate outcome of these exposures. However, there can be no assurance that future events, such as court decisions or I.R.S. positions, will not differ from management’s assessments. Whenever practicable, management consults with third party experts (attorneys, accountants, claims administrators, etc.) to assist with the gathering and evaluation of information related to contingent liabilities. Based on internally and/or externally prepared evaluations, management makes a determination whether the potential exposure requires accrual in the financial statements.
OTHER ITEMS
FAIR VALUE MEASUREMENTS
As a financial services institution, fair value measurements are applied to a significant portion of FHN’s Consolidated Statement of Condition. A summary of line items significantly affected by fair value measurements, a brief description of current accounting practices and a description of current valuation methodologies are presented in Table 26 below. As of December 31, 2008, the total amount of assets and liabilities measured at fair value using significant unobservable inputs was 21 percent and 4 percent, respectively, in relation to the total amount of assets and liabilities measured at fair value. See Note 23 – Fair Values of Assets and Liabilities–for additional information.
56
FIRST HORIZON NATIONAL CORPORATION
Table 26 - Application of Fair Value Measurements
| | | | |
Line Item | | Description of Accounting | | Valuation Discussion |
| | | | |
Mortgage trading securities | Retained interests in securitizations and associated financing liabilities, as applicable, are recognized at fair value through current earnings. | See Critical Accounting Policies. |
| | | | |
Capital markets trading securities and trading liabilities | Capital Markets trading positions are recognized at fair value through current earnings. | Long positions are valued at bid price in bid-ask spread. Short positions are valued at ask price. Positions are valued using observable inputs including current market transactions, LIBOR and U.S. treasury curves, credit spreads and consensus prepayment speeds. |
| | | | |
Loans held for sale | Substantially all mortgage loans held for sale are recognized at elected fair value with changes in fair value recognized currently in earnings. | See Critical Accounting Policies. |
| | | | |
| The warehouse of trust preferred loans was measured at the lower of cost or market prior to its transfer to the loan portfolio in second quarter 2008. | See discussion in Note 23. |
| | | | |
Securities available for sale | Securities are recognized at fair value with changes in fair value recorded, net of tax, within other comprehensive income. Other than temporary impairments are recognized by reducing the value of the investment to fair value through earnings. | Valuations are performed using observable inputs obtained from market transactions in similar securities, when available. Typical inputs include LIBOR and U.S. treasury curves, consensus prepayment estimates and credit spreads. When available, broker quotes are used to support valuations. |
| | | | |
Allowance for loan losses | The appropriate reserve for collateral dependent loans is determined by estimating the fair value of the collateral and reducing this amount by estimated costs to sell. | See Critical Accounting Policies. |
| | | | |
Mortgage servicing rights and associated financing liabilities | MSR and associated financing liabilities, as applicable, are recognized at fair value upon inception. Both are subsequently recognized at elected fair value with changes in fair value recognized through current earnings. | See Critical Accounting Policies. |
| | | | |
Other assets and other liabilities | Interest rate lock commitments qualifying as derivatives are recognized at fair value with changes in fair value recognized through current earnings. | See Critical Accounting Policies. |
| | | | |
| | Freestanding derivatives and derivatives used for fair value hedging relationships (whether economic or qualified under SFAS No. 133) are recognized at fair value with changes in fair value included in earnings. Cash flow hedges qualifying under SFAS No. 133 are recognized at fair value with changes in fair value included in other comprehensive income, to the extent the hedge is effective, until the hedge transaction occurs. Ineffectiveness attributable to cash flow hedges is recognized in current earnings. | Valuations for forwards and futures contracts are based on current transactions involving identical securities. Valuations of other derivatives are based on inputs observed in active markets for similar instruments. Typical inputs include the LIBOR curve, option volatility and option skew. See Critical Accounting policies for discussion of the valuation procedures for derivatives used to hedge MSR and excess interest. |
| | | | |
| | Deferred compensation assets are measured at fair value with changes in fair value recognized in current earnings. | Valuations of applicable deferred compensation assets are based on quoted prices in active markets. |
57
FIRST HORIZON NATIONAL CORPORATION
QUARTERLY FINANCIAL INFORMATION
Table 27 - Summary of Quarterly Financial Information
| | | | | | | | | | | | | | | | |
(Dollars in millions except
per share data) | | 2008 | | 2007 |
| | Fourth
Quarter | | Third
Quarter | | Second
Quarter | | First
Quarter | | Fourth
Quarter | | Third
Quarter | | Second
Quarter | | First
Quarter |
|
Summary income information: | | | | | | | | | | | | | | | | |
Interest income | | | $ | | 331.6 | | | | $ | | 383.2 | | | | $ | | 415.5 | | | | $ | | 476.4 | | | | $ | | 545.1 | | | | $ | | 582.7 | | | | $ | | 594.9 | | | | $ | | 583.2 | |
Interest expense | | | | 126.6 | | | | | 160.1 | | | | | 176.6 | | | | | 248.4 | | | | | 319.2 | | | | | 344.9 | | | | | 355.5 | | | | | 345.8 | |
Provision for loan losses | | | | 280.0 | | | | | 340.0 | | | | | 220.0 | | | | | 240.0 | | | | | 156.6 | | | | | 43.3 | | | | | 44.4 | | | | | 28.5 | |
Noninterest income | | | | 338.0 | | | | | 305.2 | | | | | 399.0 | | | | | 449.1 | | | | | 93.1 | | | | | 203.4 | | | | | 280.3 | | | | | 283.2 | |
Noninterest expense | | | | 349.7 | | | | | 402.3 | | | | | 465.8 | | | | | 438.3 | | | | | 561.5 | | | | | 421.6 | | | | | 457.3 | | | | | 403.0 | |
Income/(loss) from continuing operations | | | | (55.7 | ) | | | | | (125.1 | ) | | | | | (19.1 | ) | | | | | 7.0 | | | | | (252.8 | ) | | | | | (14.4 | ) | | | | | 22.0 | | | | | 70.3 | |
Income from discontinued operations, net of tax | | | | - | | | | | - | | | | | - | | | | | .9 | | | | | 4.2 | | | | | .2 | | | | | .2 | | | | | .2 | |
Net income/(loss) | | | | (55.7 | ) | | | | | (125.1 | ) | | | | | (19.1 | ) | | | | | 7.9 | | | | | (248.6 | ) | | | | | (14.2 | ) | | | | | 22.2 | | | | | 70.5 | |
Income/(loss) available to common shareholders | | | | (63.1 | ) | | | | | (125.1 | ) | | | | | (19.1 | ) | | | | | 7.9 | | | | | (248.6 | ) | | | | | (14.2 | ) | | | | | 22.2 | | | | | 70.5 | |
|
Earnings/(loss) per common share | | | | | | | | | | | | | | | | |
from continuing operations | | | $ | | (.31 | ) | | | | $ | | (.61 | ) | | | | $ | | (.11 | ) | | | | $ | | .05 | | | | $ | | (1.91 | ) | | | | $ | | (.11 | ) | | | | $ | | .18 | | | | $ | | .53 | |
Earnings/(loss) per common share | | | | (.31 | ) | | | | | (.61 | ) | | | | | (.11 | ) | | | | | .06 | | | | | (1.88 | ) | | | | | (.11 | ) | | | | | .17 | | | | | .54 | |
Diluted earnings/(loss) per common | | | | | | | | | | | | | | | | |
share from continuing operations | | | | (.31 | ) | | | | | (.61 | ) | | | | | (.11 | ) | | | | | .05 | | | | | (1.91 | ) | | | | | (.11 | ) | | | | | .16 | | | | | .52 | |
Diluted earnings/(loss) per common share | | | | (.31 | ) | | | | | (.61 | ) | | | | | (.11 | ) | | | | | .06 | | | | | (1.88 | ) | | | | | (.11 | ) | | | | | .16 | | | | | .52 | |
|
Common stock information: | | | | | | | | | | | | | | | | |
Closing price per share: | | | | | | | | | | | | | | | | |
High (a) | | | $ | | 11.88 | | | | $ | | 14.24 | | | | $ | | 14.24 | | | | $ | | 21.07 | | | | $ | | 26.89 | | | | $ | | 37.34 | | | | $ | | 39.26 | | | | $ | | 43.00 | |
Low (a) | | | | 7.43 | | | | | 4.80 | | | | | 7.08 | | | | | 13.35 | | | | | 17.15 | | | | | 25.40 | | | | | 36.62 | | | | | 38.04 | |
Period-end (a) | | | | 10.57 | | | | | 9.19 | | | | | 7.08 | | | | | 13.35 | | | | | 17.29 | | | | | 25.40 | | | | | 37.16 | | | | | 39.57 | |
Dividends declared per share (b) | | | | NM | (c) | | | | | NM | (d) | | | | | 0.19 | (e) | | | | | 0.19 | (e) | | | | | 0.43 | (e) | | | | | 0.43 | (e) | | | | | 0.43 | (e) | | | | | 0.43 | (e) | |
|
|
(a) | | | | Per share data restated for October 1, 2008 and January 1, 2009 stock dividends. |
|
(b) | | | | Third and fourth quarter 2008 dividend declared paid in shares. |
|
(c) | | | | Stock dividend rate of 1.837% per share. |
|
(d) | | | | Stock dividend rate of 3.0615% per share. |
|
(e) | | | | Cash dividends per share restated for October 1, 2008 and January 1, 2009 stock dividends. |
ACCOUNTING CHANGES
In December 2008, FASB Staff Position No. FAS 132(R)-1, “Employers’ Disclosures about Postretirement Benefit Plan Assets” (FSP FAS 132(R)-1), was issued. FSP FAS 132(R)-1 provides detailed disclosure requirements to enhance the disclosures about an employer’s plan assets currently required by Statement of Financial Accounting Standards No. 132(R), “Employers’ Disclosures about Pensions and Other Postretirement Benefits” (SFAS No. 132(R)). FSP FAS 132(R)-1 is effective prospectively for annual periods ending after December 15, 2009. FHN is currently assessing the effects of adopting FSP FAS 132(R)-1.
In May 2008, the FASB issued Statement of Financial Accounting Standards No. 162, “The Hierarchy of Generally Accepted Accounting Principles” (SFAS No. 162). SFAS No. 162 identifies the sources of accounting principles and the framework for selecting the principles used in the preparation of financial statements of nongovernmental entities that are presented in conformity with generally accepted accounting principles (GAAP) in the United States. As the GAAP hierarchy will reside in accounting literature established by the FASB upon adoption of SFAS No. 162, it will become applicable to preparers of financial statements. SFAS No. 162 is effective 60 days following the SEC’s approval of the Public Company Accounting Oversight Board’s amendments to AU Section 411, “The Meaning of Present Fairly in Conformity With Generally Accepted Accounting Principles”. The adoption of SFAS No. 162 will have no effect on FHN’s statement of condition or results of operations.
In March 2008, the FASB issued Statement of Financial Accounting Standards No. 161, “Disclosures about Derivative Instruments and Hedging Activities – an amendment of FASB Statement No. 133” (SFAS No. 161).
58
FIRST HORIZON NATIONAL CORPORATION
SFAS No. 161 requires enhanced disclosures related to derivatives accounted for in accordance with SFAS No. 133 and reconsiders existing disclosure requirements for such derivatives and any related hedging items. The disclosures provided in SFAS No. 161 will be required for both interim and annual reporting periods. SFAS No. 161 is effective prospectively for quarterly interim periods beginning after November 15, 2008. FHN is currently assessing the effects of adopting SFAS No. 161.
In February 2008, FASB Staff Position No. FAS 140-3, “Accounting for Transfers of Financial Assets and Repurchase Financing Transactions” (FSP FAS 140-3), was issued. FSP FAS 140-3 permits a transferor and transferee to separately account for an initial transfer of a financial asset and a related repurchase financing that are entered into contemporaneously with, or in contemplation of, one another if certain specified conditions are met at the inception of the transaction. FSP FAS 140-3 requires that the two transactions have a valid and distinct business or economic purpose for being entered into separately and that the repurchase financing not result in the initial transferor regaining control over the previously transferred financial asset. FSP FAS 140-3 is effective prospectively for initial transfers executed in reporting periods beginning on or after November 15, 2008. The effect of adopting FSP FAS 140-3 will not be material to FHN.
In December 2007, the FASB issued SFAS No. 141-R and Statement of Financial Accounting Standards No. 160, “Noncontrolling Interests in Consolidated Financial Statements – an Amendment of ARB No. 51” (SFAS No. 160). SFAS No. 141-R requires that an acquirer recognize the assets acquired and liabilities assumed in a business combination, as well as any noncontrolling interest in the acquiree, at their fair values as of the acquisition date, with limited exceptions. Additionally, SFAS No. 141-R provides that an acquirer cannot specify an effective date for a business combination that is separate from the acquisition date. SFAS No. 141-R also provides that acquisition-related costs which an acquirer incurs should be expensed in the period in which the costs are incurred and the services are received. SFAS No. 160 requires that acquired assets and liabilities be measured at full fair value without consideration to ownership percentage. Under SFAS No. 160, any non-controlling interests in an acquiree should be presented as a separate component of equity rather than on a mezzanine level. Additionally, SFAS No. 160 provides that net income or loss should be reported in the consolidated income statement at its consolidated amount, with disclosure on the face of the consolidated income statement of the amount of consolidated net income which is attributable to the parent and noncontrolling interests, respectively. SFAS No. 141-R and SFAS No. 160 are effective prospectively for periods beginning on or after December 15, 2008, with the exception of SFAS No. 160’s presentation and disclosure requirements which should be retrospectively applied to all periods presented. While earnings per share for prior periods will not be effected by the adoption SFAS No. 160, the retrospective application of SFAS No. 160’s presentation and disclosure requirements will result in an increase to consolidated net income of approximately $14, $19, and $18, respectively, for 2008, 2007, and 2006. FHN expects to recognize an increase of total shareholders’ equity approximating $298 million upon adoption of SFAS No. 160 as a result of reclassifying the noncontrolling interest previously recognized on the Consolidated Statements of Condition as “Preferred stock of subsidiary” as a separate component of equity.
In June 2007, the American Institute of Certified Public Accountants (AICPA) issued Statement of Position 07-1, “Clarification of the Scope of the Audit and Accounting Guide Investment Companies and Accounting by Parent Companies and Equity Method Investors for Investments in Investment Companies” (SOP 07-1), which provides guidance for determining whether an entity is within the scope of the AICPA’s Investment Companies Guide. Additionally, SOP 07-1 provides certain criteria that must be met in order for investment company accounting applied by a subsidiary or equity method investee to be retained in the financial statements of the parent company or an equity method investor. SOP 07-1 also provides expanded disclosure requirements regarding the retention of such investment company accounting in the consolidated financial statements. In May 2007, FASB Staff Position No. FIN 46(R)-7, “Application of FASB Interpretation No. 46(R) to Investment Companies” (FSP FIN 46(R)-7) was issued. FSP FIN 46(R)-7 amends FIN 46(R) to provide a permanent exception to its scope for companies within the scope of the revised Investment Companies Guide under SOP 07-1. In February 2008, the FASB issued FASB Staff Position No. SOP 07-1-1, “The Effective Date of AICPA Statement of Position 07-1” which indefinitely defers the effective date of SOP 07-1 and FSP FIN 46(R)-7.
59
FIRST HORIZON NATIONAL CORPORATION
GLOSSARY OF SELECTED FINANCIAL TERMS
Allowance for Loan Losses – Valuation reserve representing the amount considered by management to be adequate to cover estimated probable incurred losses in the loan portfolio.
Basis Point – The equivalent of one-hundredth of one percent. One hundred basis points equals one percent. This unit is generally used to measure movements in interest yields and rates.
Book Value Per Common Share – A ratio determined by dividing shareholders’ equity at the end of a period by the number of common shares outstanding at the end of that period.
Commercial Paper – A short-term unsecured debt obligation of the parent company with maturities typically of less than 90 days.
Commercial and Standby Letters of Credit – Commercial letters of credit are issued or confirmed by an entity to ensure the payment of its customers’ payables and receivables. Standby letters of credit are issued by an entity to ensure its customers’ performance in dealing with others.
Commitment to Extend Credit – Agreements to make or acquire a loan or lease as long as agreed-upon terms (e.g., expiration date, covenants, or notice) are met. Generally these commitments have fixed expiration dates or other termination clauses and may require payment of a fee.
Core Deposits – Core deposits consist of all interest-bearing and noninterest-bearing deposits, except certificates of deposit over $100,000. They include checking interest deposits, money market deposit accounts, time and other savings, plus demand deposits.
Derivative Financial Instrument – A contract or agreement whose value is derived from changes in interest rates, foreign exchange rates, prices of securities or commodities, or financial or commodity indices.
Diluted Earnings Per Common Share – Net income, divided by weighted average shares outstanding plus the effect of common stock equivalents that have the potential to be converted into common shares.
Earning Assets – Assets that generate interest or dividend income or yield-related fee income, such as loans and investment securities.
Earnings Per Common Share – Net income, divided by the weighted average number of common shares.
Excess Interest-Only Strip – Financial asset representing the right to receive earnings from serviced assets that exceeds contractually specified servicing fees and are legally separable from the base servicing rights.
Fully Taxable Equivalent (FTE) – Reflects the rate of tax-exempt income adjusted to a level that would yield the same after-tax income had that income been subject to taxation.
Interest-Only Strip – Mortgage security consisting of the interest rate portion of a stripped mortgage backed security.
Interest Rate Caps and Floors – Contracts with notional principal amounts that require the seller, in exchange for a fee, to make payments to the purchaser if a specified market interest rate exceeds a fixed upper “capped” level or falls below a fixed lower “floor” level on specified future dates.
Interest Rate Forward Contracts – Contracts representing commitments either to purchase or sell at a specified future date a specified security or financial instrument at a specified price, and may be settled in cash or through delivery.
Interest Rate Option – A contract that grants the holder (purchaser), for a fee, the right to either purchase or sell a financial instrument at a specified price within a specified period of time or on a specified date from or to the writer (seller) of the option.
60
FIRST HORIZON NATIONAL CORPORATION
GLOSSARY OF SELECTED FINANCIAL TERMS (continued)
Interest Rate Swap – An agreement in which two entities agree to exchange, at specified intervals, interest payment streams calculated on an agreed-upon notional principal amount with at least one stream based on a floating rate index.
Interest Rate Swaptions – Are options on interest rate swaps that give the purchaser the right, but not the obligation, to enter into an interest rate swap agreement during a specified period of time.
Leverage Ratio – Ratio consisting of Tier 1 capital divided by quarterly average assets adjusted for certain unrealized gains/(losses) on available for sale securities, goodwill, certain other intangible assets, the disallowable portion of mortgage servicing rights and other disallowed assets.
Lower of Cost or Market (LOCOM) – A method of accounting for certain assets by recording them at the lower of their historical cost or their current market value.
Market Capitalization – Market value of a company computed by multiplying the number of shares outstanding by the current stock price.
Marketing G/L (Trading Gains) – The net result of hedging activities.
Mortgage Backed Securities – Investment securities backed by a pool of mortgages or trust deeds. Principal and interest payments on the underlying mortgages are used to pay principal and interest on the securities.
Mortgage Pipeline – Interest rate commitments made to customers on mortgage loans that have not yet been closed and funded.
Mortgage Warehouse – A mortgage loan that has been closed and funded and is awaiting sale and delivery into the secondary market.
Mortgage Servicing Rights (MSR) – The right to service mortgage loans, generally owned by someone else, for a fee. Loan servicing includes collecting payments; remitting funds to investors, insurance companies, and taxing authorities; collecting delinquent payments; and foreclosing on properties when necessary.
Net Interest Income (NII) – Interest income less interest expense.
Net Interest Margin (NIM) – Expressed as a percentage, net interest margin is a ratio computed by dividing fully taxable equivalent net interest income by average earning assets.
Net Interest Spread – The difference between the average yield earned on earning assets on a fully taxable equivalent basis and the average rate paid for interest-bearing liabilities.
Nonaccrual Loans – Loans on which interest accruals have been discontinued due to the borrower’s financial difficulties. Interest income on these loans is reported on a cash basis as it is collected after recovery of principal.
Nonperforming Assets – Interest-earning assets on which interest income is not being accrued, real estate properties acquired through foreclosure and repossessed assets.
Origination Fees – A fee charged to the borrower by the lender to originate a loan. Usually stated as a percentage of the face value of the loan.
Provision for Loan Losses – The periodic charge to earnings for potential losses in the loan portfolio.
Purchase Obligation – An agreement to purchase goods or services that is enforceable and legally binding and that specifies all significant terms, including fixed or minimum quantities to be purchased; fixed, minimum or variable price provisions; and the approximate timing of the transaction.
61
FIRST HORIZON NATIONAL CORPORATION
GLOSSARY OF SELECTED FINANCIAL TERMS (continued)
Purchased Funds – The combination of certificates of deposit greater than $100,000, federal funds purchased, securities sold under agreement to repurchase, bank notes, commercial paper, and other short-term borrowings.
Repurchase Agreement – A method of short-term financing where one party agrees to buy back, at a future date (generally overnight) and an agreed-upon price, a security it sells to another party.
Residual-Interest Certificates – Financial assets which represent rights to receive earnings to the extent of excess income generated by the underlying loan collateral of certain mortgage-backed securities, which is not needed to meet contractual obligations of senior security holders.
Return on Average Assets (ROA) – A measure of profitability that is calculated by dividing net income by total average assets.
Return on Average Equity (ROE) – A measure of profitability that indicates what an institution earned on its shareholders’ investment. ROE is calculated by dividing net income by total average shareholders’ equity.
Risk-Adjusted Assets – A regulatory risk-based calculation that takes into account the broad differences in risks among a banking organization’s assets and off-balance sheet financial instruments.
SFAS No. 114 Loans – Commercial loans over $1 million that are not expected to pay all contractually due principal and interest and consumer loans that have experienced a troubled debt restructuring. These loans are generally written down to an estimate of collateral value less cost to sell.
Tier 1 Capital Ratio – Ratio consisting of shareholders’ equity adjusted for certain unrealized gains/(losses) on available for sale securities, reduced by goodwill, certain other intangible assets, the disallowable portion of mortgage servicing rights and other disallowed assets divided by risk-adjusted assets.
Total Capital Ratio – Ratio consisting of Tier 1 capital plus the allowable portion of the allowance for loan losses and qualifying subordinated debt divided by risk-adjusted assets.
62
FIRST HORIZON NATIONAL CORPORATION
REPORT OF MANAGEMENT
ON INTERNAL CONTROL OVER FINANCIAL REPORTING
Management of First Horizon National Corporation is responsible for establishing and maintaining adequate internal control over financial reporting as defined in Rules 13a-15(f) and 15d-15(f) under the Securities Exchange Act of 1934. First Horizon National Corporation’s internal control over financial reporting is a process designed to provide reasonable assurance regarding the reliability of financial reporting and the preparation of financial statements for external purposes in accordance with generally accepted accounting principles.
Even effective internal controls, no matter how well designed, have inherent limitations such as the possibility of human error or of circumvention or overriding of controls, and consideration of cost in relation to benefit of a control. Moreover, effectiveness must necessarily be considered according to the existing state of the art of internal control. Further, because of changes in conditions, the effectiveness of internal controls may diminish over time.
Management assessed the effectiveness of First Horizon National Corporation’s internal control over financial reporting as of December 31, 2008. In making this assessment, management used the criteria set forth by the Committee of Sponsoring Organizations of the Treadway Commission (COSO) inInternal Control-Integrated Framework.
Based on our assessment and those criteria, management believes that First Horizon National Corporation maintained effective internal control over financial reporting as of December 31, 2008.
First Horizon National Corporation’s independent auditors have issued an attestation report on First Horizon National Corporation’s internal control over financial reporting. That report appears on the following page.
63
FIRST HORIZON NATIONAL CORPORATION
Report of Independent Registered Public Accounting Firm
The Board of Directors and Shareholders
First Horizon National Corporation:
We have audited First Horizon National Corporation’s (the Company) internal control over financial reporting as of December 31, 2008, based on criteria established inInternal Control – Integrated Framework issued by the Committee of Sponsoring Organizations of the Treadway Commission (COSO). The Company’s management is responsible for maintaining effective internal control over financial reporting and for its assessment of the effectiveness of internal control over financial reporting. Our responsibility is to express an opinion on the Company’s internal control over financial reporting based on our audit.
We conducted our audit in accordance with the standards of the Public Company Accounting Oversight Board (United States). Those standards require that we plan and perform the audit to obtain reasonable assurance about whether effective internal control over financial reporting was maintained in all material respects. Our audit included obtaining an understanding of internal control over financial reporting, assessing the risk that a material weakness exists, and testing and evaluating the design and operating effectiveness of internal control based on the assessed risk. Our audit also included performing such other procedures as we considered necessary in the circumstances. We believe that our audit provides a reasonable basis for our opinion.
A company’s internal control over financial reporting is a process designed to provide reasonable assurance regarding the reliability of financial reporting and the preparation of financial statements for external purposes in accordance with generally accepted accounting principles. A company’s internal control over financial reporting includes those policies and procedures that (1) pertain to the maintenance of records that, in reasonable detail, accurately and fairly reflect the transactions and dispositions of the assets of the company; (2) provide reasonable assurance that transactions are recorded as necessary to permit preparation of financial statements in accordance with generally accepted accounting principles, and that receipts and expenditures of the company are being made only in accordance with authorizations of management and directors of the company; and (3) provide reasonable assurance regarding prevention or timely detection of unauthorized acquisition, use, or disposition of the company’s assets that could have a material effect on the financial statements.
Because of its inherent limitations, internal control over financial reporting may not prevent or detect misstatements. Also, projections of any evaluation of effectiveness to future periods are subject to the risk that controls may become inadequate because of changes in conditions, or that the degree of compliance with the policies or procedures may deteriorate.
In our opinion, First Horizon National Corporation maintained, in all material respects, effective internal control over financial reporting as of December 31, 2008, based on criteria established inInternal Control – Integrated Framework issued by the Committee of Sponsoring Organizations of the Treadway Commission.
We also have audited, in accordance with the standards of the Public Company Accounting Oversight Board (United States), the consolidated statements of condition of First Horizon National Corporation as of December 31, 2008 and 2007, and the related consolidated statements of income, shareholders’ equity and cash flows for each of the years in the three-year period ended December 31, 2008, and our report dated February 26, 2009 expressed an unqualified opinion on those consolidated financial statements.
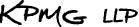
Memphis, Tennessee
February 26, 2009
64
FIRST HORIZON NATIONAL CORPORATION
Report of Independent Registered Public Accounting Firm
The Board of Directors and Shareholders
First Horizon National Corporation:
We have audited the accompanying consolidated statements of condition of First Horizon National Corporation and subsidiaries (the Company) as of December 31, 2008 and 2007, and the related consolidated statements of income, shareholders’ equity and cash flows for each of the years in the three-year period ended December 31, 2008. These consolidated financial statements are the responsibility of the Company’s management. Our responsibility is to express an opinion on these consolidated financial statements based on our audits.
We conducted our audits in accordance with the standards of the Public Company Accounting Oversight Board (United States). Those standards require that we plan and perform the audit to obtain reasonable assurance about whether the financial statements are free of material misstatement. An audit includes examining, on a test basis, evidence supporting the amounts and disclosures in the financial statements. An audit also includes assessing the accounting principles used and significant estimates made by management, as well as evaluating the overall financial statement presentation. We believe that our audits provide a reasonable basis for our opinion.
In our opinion, the consolidated financial statements referred to above present fairly, in all material respects, the financial position of First Horizon National Corporation as of December 31, 2008 and 2007, and the results of its operations and its cash flows for each of the years in the three-year period ended December 31, 2008, in conformity with U.S. generally accepted accounting principles.
We also have audited, in accordance with the standards of the Public Company Accounting Oversight Board (United States), the Company’s internal control over financial reporting as of December 31, 2008, based on criteria established inInternal Control – Integrated Framework issued by the Committee of Sponsoring Organizations of the Treadway Commission (COSO), and our report dated February 26, 2009 expressed an unqualified opinion on the effectiveness of the Company’s internal control over financial reporting.
Memphis, Tennessee
February 26, 2009
65
FIRST HORIZON NATIONAL CORPORATION
CONSOLIDATED STATEMENTS OF CONDITION
| | | | |
(Dollars in thousands) | | December 31 |
| | 2008 | | 2007 |
|
Assets: | | | | |
Cash and due from banks (Note 18) | | | $ | | 552,423 | | | | $ | | 1,170,220 | |
Federal funds sold and securities purchased under agreements to resell | | | | 772,357 | | | | | 1,089,495 | |
|
Total cash and cash equivalents | | | | 1,324,780 | | | | | 2,259,715 | |
|
Interest-bearing cash | | | | 207,792 | | | | | 39,422 | |
Trading securities | | | | 945,766 | | | | | 1,768,763 | |
Loans held for sale | | | | 566,654 | | | | | 3,461,712 | |
Loans held for sale – divestiture | | | | - | | | | | 289,878 | |
Securities available for sale (Note 3) | | | | 3,125,153 | | | | | 3,032,551 | |
Securities held to maturity (fair value of $242 on December 31, 2007) (Note 3) | | | | - | | | | | 240 | |
Loans, net of unearned income (Note 4) | | | | 21,278,190 | | | | | 22,103,516 | |
Less: Allowance for loan losses | | | | 849,210 | | | | | 342,341 | |
|
Total net loans | | | | 20,428,980 | | | | | 21,761,175 | |
|
Mortgage servicing rights, net (Note 6) | | | | 376,844 | | | | | 1,159,820 | |
Goodwill (Note 7) | | | | 192,408 | | | | | 192,408 | |
Other intangible assets, net (Note 7) | | | | 45,082 | | | | | 56,907 | |
Capital markets receivables | | | | 1,178,932 | | | | | 524,419 | |
Premises and equipment, net (Note 5) | | | | 333,931 | | | | | 399,305 | |
Real estate acquired by foreclosure | | | | 125,538 | | | | | 103,982 | |
Other assets | | | | 2,170,120 | | | | | 1,949,308 | |
Other assets – divestiture | | | | - | | | | | 15,856 | |
|
Total assets | | | $ | | 31,021,980 | | | | $ | | 37,015,461 | |
|
Liabilities and shareholders’ equity: | | | | |
Deposits: | | | | |
Savings | | | $ | | 4,824,939 | | | | $ | | 3,872,684 | |
Time deposits | | | | 2,294,644 | | | | | 2,826,301 | |
Other interest-bearing deposits | | | | 1,783,362 | | | | | 1,946,933 | |
Interest-bearing deposits – divestiture | | | | - | | | | | 189,051 | |
Certificates of deposit $100,000 and more | | | | 1,382,236 | | | | | 3,129,532 | |
Certificates of deposit $100,000 and more – divestiture | | | | - | | | | | 12,617 | |
|
Interest-bearing | | | | 10,285,181 | | | | | 11,977,118 | |
Noninterest-bearing | | | | 3,956,633 | | | | | 5,026,417 | |
Deposits – divestiture | | | | - | | | | | 28,750 | |
|
Total deposits | | | | 14,241,814 | | | | | 17,032,285 | |
|
Federal funds purchased and securities sold under agreements to repurchase (Note 9) | | | | 1,751,079 | | | | | 4,829,597 | |
Federal funds purchased and securities sold under agreements to repurchase – divestiture | | | | - | | | | | 20,999 | |
Trading liabilities (Note 9) | | | | 359,502 | | | | | 556,144 | |
Other short-term borrowings and commercial paper (Note 9) | | | | 4,279,689 | | | | | 3,422,995 | |
Term borrowings | | | | 4,022,297 | | | | | 6,027,967 | |
Other collateralized borrowings | | | | 745,363 | | | | | 800,450 | |
|
Total long-term debt (Note 10) | | | | 4,767,660 | | | | | 6,828,417 | |
|
Capital markets payables | | | | 1,115,428 | | | | | 586,358 | |
Other liabilities | | | | 932,176 | | | | | 1,305,868 | |
Other liabilities – divestiture | | | | - | | | | | 1,925 | |
|
Total liabilities | | | | 27,447,348 | | | | | 34,584,588 | |
|
Preferred stock of subsidiary (Note 12) | | | | 295,165 | | | | | 295,277 | |
|
Shareholders’ equity: | | | | |
Preferred stock – no par value (5,000,000 shares authorized, but unissued) | | | | - | | | | | - | |
Preferred stock series CPP – no par value (866,540 shares authorized and issued on December 31, 2008) | | | | 782,680 | | | | | - | |
Common stock – $.625 par value (shares authorized – 400,000,000; shares issued – 205,282,811 on December 31, 2008 and 132,627,292 on December 31, 2007)* | | | | 128,302 | | | | | 78,979 | |
Capital surplus | | | | 1,048,602 | | | | | 361,826 | |
Capital surplus common stock warrant – CPP | | | | 83,860 | | | | | - | |
Undivided profits | | | | 1,387,854 | | | | | 1,742,892 | |
Accumulated other comprehensive (loss), net (Note 15) | | | | (151,831 | ) | | | | | (48,101 | ) | |
|
Total shareholders’ equity | | | | 3,279,467 | | | | | 2,135,596 | |
|
Total liabilities and shareholders’ equity | | | $ | | 31,021,980 | | | | $ | | 37,015,461 | |
|
See accompanying notes to consolidated financial statements.
Certain previously reported amounts have been reclassified to agree with current presentation.
|
* | | | | Outstanding shares have been restated to reflect stock dividends declared through December 31, 2008. |
66
FIRST HORIZON NATIONAL CORPORATION
CONSOLIDATED STATEMENTS OF INCOME
| | | | | | (Dollars in thousands except per share data) | | Year Ended December 31 |
| | 2008 | | 2007 | | 2006 |
|
Interest income: | | | | | | |
Interest and fees on loans | | | $ | | 1,153,546 | | | | $ | | 1,621,881 | | | | $ | | 1,591,006 | |
Interest on investment securities | | | | 162,306 | | | | | 188,733 | | | | | 188,151 | |
Interest on loans held for sale | | | | 151,554 | | | | | 253,587 | | | | | 288,161 | |
Interest on trading securities | | | | 114,625 | | | | | 174,188 | | | | | 171,063 | |
Interest on other earning assets | | | | 24,694 | | | | | 67,570 | | | | | 90,730 | |
|
Total interest income | | | | 1,606,725 | | | | | 2,305,959 | | | | | 2,329,111 | |
|
Interest expense: | | | | | | |
Interest on deposits: | | | | | | |
Savings | | | | 79,921 | | | | | 115,954 | | | | | 88,510 | |
Time deposits | | | | 101,225 | | | | | 136,571 | | | | | 120,276 | |
Other interest-bearing deposits | | | | 13,863 | | | | | 25,852 | | | | | 24,479 | |
Certificates of deposit $100,000 and more | | | | 76,293 | | | | | 369,313 | | | | | 493,177 | |
Interest on trading liabilities | | | | 33,195 | | | | | 51,516 | | | | | 76,064 | |
Interest on short-term borrowings | | | | 189,568 | | | | | 294,074 | | | | | 248,915 | |
Interest on long-term debt | | | | 217,578 | | | | | 372,037 | | | | | 280,753 | |
|
Total interest expense | | | | 711,643 | | | | | 1,365,317 | | | | | 1,332,174 | |
|
Net interest income | | | | 895,082 | | | | | 940,642 | | | | | 996,937 | |
Provision for loan losses | | | | 1,080,000 | | | | | 272,765 | | | | | 83,129 | |
|
Net interest income/(loss) after provision for loan losses | | | | (184,918 | ) | | | | | 667,877 | | | | | 913,808 | |
|
Noninterest income: | | | | | | |
Capital markets | | | | 524,420 | | | | | 334,371 | | | | | 383,047 | |
Deposit transactions and cash management | | | | 179,034 | | | | | 175,271 | | | | | 168,599 | |
Mortgage banking | | | | 518,034 | | | | | 69,454 | | | | | 370,613 | |
Trust services and investment management | | | | 33,821 | | | | | 40,335 | | | | | 41,514 | |
Insurance commissions | | | | 29,104 | | | | | 31,739 | | | | | 46,632 | |
Gains/(losses) from loan sales and securitizations | | | | (8,625 | ) | | | | | 23,881 | | | | | 51,675 | |
Equity securities gains/(losses), net | | | | 65,349 | | | | | (7,475 | ) | | | | | 10,271 | |
Debt securities gains/(losses), net | | | | 761 | | | | | 6,292 | | | | | (75,900 | ) | |
Gains/(losses) on divestitures | | | | (19,019 | ) | | | | | 15,695 | | | | | - | |
All other income and commissions (Note 14) | | | | 168,434 | | | | | 170,386 | | | | | 170,442 | |
|
Total noninterest income | | | | 1,491,313 | | | | | 859,949 | | | | | 1,166,893 | |
|
Adjusted gross income after provision for loan losses | | | | 1,306,395 | | | | | 1,527,826 | | | | | 2,080,701 | |
|
Noninterest expense: | | | | | | |
Employee compensation, incentives and benefits | | | | 960,917 | | | | | 968,122 | | | | | 1,023,685 | |
Occupancy | | | | 104,968 | | | | | 131,173 | | | | | 116,670 | |
Equipment rentals, depreciation and maintenance | | | | 57,069 | | | | | 72,926 | | | | | 73,882 | |
Legal and professional fees | | | | 63,718 | | | | | 56,882 | | | | | 43,012 | |
Operations services | | | | 77,474 | | | | | 74,200 | | | | | 70,041 | |
Communications and courier | | | | 39,863 | | | | | 43,909 | | | | | 53,249 | |
Amortization of intangible assets | | | | 8,229 | | | | | 10,959 | | | | | 11,462 | |
Goodwill impairment | | | | - | | | | | 84,084 | | | | | - | |
All other expense (Note 14) | | | | 343,814 | | | | | 401,178 | | | | | 350,620 | |
|
Total noninterest expense | | | | 1,656,052 | | | | | 1,843,433 | | | | | 1,742,621 | |
|
Income/(loss) before income taxes | | | | (349,657 | ) | | | | | (315,607 | ) | | | | | 338,080 | |
Provision/(benefit) for income taxes (Note 16) | | | | (156,814 | ) | | | | | (140,731 | ) | | | | | 87,278 | |
|
Income/(loss) from continuing operations | | | | (192,843 | ) | | | | | (174,876 | ) | | | | | 250,802 | |
Income from discontinued operations, net of tax | | | | 883 | | | | | 4,765 | | | | | 210,767 | |
|
Income/(loss) before cumulative effect of changes in accounting principle | | | | (191,960 | ) | | | | | (170,111 | ) | | | | | 461,569 | |
Cumulative effect of changes in accounting principle, net of tax | | | | - | | | | | - | | | | | 1,345 | |
|
Net income/(loss) | | | $ | | (191,960 | ) | | | | $ | | (170,111 | ) | | | | $ | | 462,914 | |
|
Preferred stock dividends | | | | 7,413 | | | | | - | | | | | - | |
Net income/(loss) available to common shareholders | | | $ | | (199,373 | ) | | | | $ | | (170,111 | ) | | | | $ | | 462,914 | |
|
Earnings/(loss) per share from continuing operations (Note 17) | | | $ | | (1.11 | ) | | | | $ | | (1.32 | ) | | | | $ | | 1.92 | |
|
Diluted earnings/(loss) per share from continuing operations (Note 17) | | | $ | | (1.11 | ) | | | | $ | | (1.32 | ) | | | | $ | | 1.87 | |
|
Earnings/(loss) per share available to common shareholders (Note 17) | | | $ | | (1.10 | ) | | | | $ | | (1.29 | ) | | | | $ | | 3.54 | |
|
Diluted earnings/(loss) per share available to common shareholders (Note 17) | | | $ | | (1.10 | ) | | | | $ | | (1.29 | ) | | | | $ | | 3.45 | |
|
Weighted average common shares (Note 17) | | | | 180,711 | | | | | 132,078 | | | | | 130,619 | |
|
Diluted average common shares (Note 17) | | | | 180,711 | | | | | 132,078 | | | | | 134,321 | |
|
See accompanying notes to consolidated financial statements.
Certain previously reported amounts have been reclassified to agree with current presentation.
67
FIRST HORIZON NATIONAL CORPORATION
CONSOLIDATED STATEMENTS OF SHAREHOLDERS’ EQUITY
| | | | | | | | | | | | | | | | |
(Amounts in thousands) | | Common
Shares | | Total | | Preferred
Stock –
Capital
Surplus | | Common
Stock | | Capital
Surplus | | Capital
Surplus –
Warrants | | Undivided
Profits | | Accumulated
Other
Comprehensive
Income/(Loss) |
|
Balance, December 31, 2005 | | | | 126,222 | | | | $ | | 2,347,539 | | | | $ | | - | | | | $ | | 78,889 | | | | $ | | 404,964 | | | | $ | | - | | | | $ | | 1,905,930 | | | | $ | | (42,244 | ) | |
Net income | | | | - | | | | | 462,914 | | | | | - | | | | | - | | | | | - | | | | | - | | | | | 462,914 | | | | | - | |
Other comprehensive income: | | | | | | | | | | | | | | | | |
Unrealized fair value adjustments, net of tax: | | | | | | | | | | | | | | | | |
Cash flow hedges | | | | - | | | | | 427 | | | | | - | | | | | - | | | | | - | | | | | - | | | | | - | | | | | 427 | |
Securities available for sale | | | | - | | | | | 46,224 | | | | | - | | | | | - | | | | | - | | | | | - | | | | | - | | | | | 46,224 | |
Minimum pension liability, net of tax | | | | - | | | | | (197 | ) | | | | | - | | | | | - | | | | | - | | | | | - | | | | | - | | | | | (197 | ) | |
| | |
Comprehensive income | | | | - | | | | | 509,368 | | | | | - | | | | | - | | | | | - | | | | | - | | | | | 462,914 | | | | | 46,454 | |
| | |
Cash dividends declared ($1.72/share)* | | | | - | | | | | (224,532 | ) | | | | | - | | | | | - | | | | | - | | | | | - | | | | | (224,532 | ) | | | | | - | |
Common stock repurchased | | | | (4,088 | ) | | | | | (168,654 | ) | | | | | - | | | | | (2,555 | ) | | | | | (166,099 | ) | | | | | - | | | | | - | | | | | - | |
Common stock issued for: | | | | | | | | | | | | | | | | |
Stock options and restricted stock | | | | 2,469 | | | | | 57,174 | | | | | - | | | | | 1,543 | | | | | 55,631 | | | | | - | | | | | - | | | | | - | |
Acquisitions | | | | 13 | | | | | 486 | | | | | - | | | | | 8 | | | | | 478 | | | | | - | | | | | - | | | | | - | |
Tax benefit from incentive plans | | | | - | | | | | 3,592 | | | | | - | | | | | - | | | | | 3,592 | | | | | - | | | | | - | | | | | - | |
Stock-based compensation expense | | | | - | | | | | 15,891 | | | | | - | | | | | - | | | | | 15,891 | | | | | - | | | | | - | | | | | - | |
Adjustment to reflect change in accounting for employee stock option forfeitures | | | | - | | | | | (1,780 | ) | | | | | - | | | | | - | | | | | (1,780 | ) | | | | | - | | | | | - | | | | | - | |
Adjustment to initially apply SFAS No. 158, net of tax | | | | - | | | | | (76,658 | ) | | | | | - | | | | | - | | | | | - | | | | | - | | | | | - | | | | | (76,658 | ) | |
Other | | | | 250 | | | | | (36 | ) | | | | | - | | | | | 156 | | | | | (156 | ) | | | | | - | | | | | (36 | ) | | | | | - | |
|
Balance, December 31, 2006 | | | | 124,866 | | | | | 2,462,390 | | | | | - | | | | | 78,041 | | | | | 312,521 | | | | | - | | | | | 2,144,276 | | | | | (72,448 | ) | |
Adjustment to reflect change in accounting for tax benefits (FIN 48) | | | | - | | | | | (862 | ) | | | | | - | | | | | - | | | | | - | | | | | - | | | | | (862 | ) | | | | | - | |
Adjustment to reflect change in accounting for purchases of life insurance (EITF Issue No. 06-5) | | | | - | | | | | (548 | ) | | | | | - | | | | | - | | | | | - | | | | | - | | | | | (548 | ) | | | | | - | |
Effects of changing pension and postretirement plans measurement dates pursuant to SFAS No. 158: | | | | | | | | | | | | | | | | |
Service cost, interest cost, and expected return on plan assets for October 1 – December 31, net of tax | | | | - | | | | | (711 | ) | | | | | - | | | | | - | | | | | - | | | | | - | | | | | (711 | ) | | | | | - | |
Amortization of prior service cost, transition asset/obligation, and net actuarial gain/loss for October 1 – December 31, net of tax | | | | - | | | | | - | | | | | - | | | | | - | | | | | - | | | | | - | | | | | (1,366 | ) | | | | | 1,366 | |
Additional gain for October 1 – December 31, net of tax | | | | - | | | | | 6,944 | | | | | - | | | | | - | | | | | - | | | | | - | | | | | - | | | | | 6,944 | |
|
Beginning balance, as adjusted | | | | 124,866 | | | | | 2,467,213 | | | | | - | | | | | 78,041 | | | | | 312,521 | | | | | - | | | | | 2,140,789 | | | | | (64,138 | ) | |
Net income/(loss) | | | | - | | | | | (170,111 | ) | | | | | - | | | | | - | | | | | - | | | | | - | | | | | (170,111 | ) | | | | | - | |
Other comprehensive income: | | | | | | | | | | | | | | | | |
Unrealized fair value adjustments, net of tax: | | | | | | | | | | | | | | | | |
Cash flow hedges | | | | - | | | | | (344 | ) | | | | | - | | | | | - | | | | | - | | | | | - | | | | | - | | | | | (344 | ) | |
Securities available for sale | | | | - | | | | | 13,700 | | | | | - | | | | | - | | | | | - | | | | | - | | | | | - | | | | | 13,700 | |
Pension and postretirement plans: | | | | | | | | | | | | | | | | |
Prior service cost arising during period | | | | - | | | | | (95 | ) | | | | | - | | | | | - | | | | | - | | | | | - | | | | | - | | | | | (95 | ) | |
Net actuarial gain/(loss) arising during period | | | | - | | | | | (2,284 | ) | | | | | - | | | | | - | | | | | - | | | | | - | | | | | - | | | | | (2,284 | ) | |
Amortization of prior service cost, transition asset/obligation, and net actuarial gain/loss included in net periodic benefit cost | | | | - | | | | | 5,060 | | | | | - | | | | | - | | | | | - | | | | | - | | | | | - | | | | | 5,060 | |
| | |
Comprehensive income/(loss) | | | | - | | | | | (154,074 | ) | | | | | - | | | | | - | | | | | - | | | | | - | | | | | (170,111 | ) | | | | | 16,037 | |
| | |
Cash dividends declared ($1.72/share)* | | | | - | | | | | (227,757 | ) | | | | | - | | | | | - | | | | | - | | | | | - | | | | | (227,757 | ) | | | | | - | |
Common stock repurchased | | | | (27 | ) | | | | | (1,114 | ) | | | | | - | | | | | (17 | ) | | | | | (1,097 | ) | | | | | - | | | | | - | | | | | - | |
Common stock issued for: | | | | | | | | | | | | | | | | |
Stock options and restricted stock | | | | 1,384 | | | | | 33,736 | | | | | - | | | | | 865 | | | | | 32,871 | | | | | - | | | | | - | | | | | - | |
Tax benefit from incentive plans | | | | - | | | | | 6,258 | | | | | - | | | | | - | | | | | 6,258 | | | | | - | | | | | - | | | | | - | |
Stock-based compensation expense | | | | - | | | | | 11,338 | | | | | - | | | | | - | | | | | 11,338 | | | | | - | | | | | - | | | | | - | |
Other | | | | 143 | | | | | (4 | ) | | | | | - | | | | | 90 | | | | | (65 | ) | | | | | - | | | | | (29 | ) | | | | | - | |
|
Balance, December 31, 2007 | | | | 126,366 | | | | | 2,135,596 | | | | | - | | | | | 78,979 | | | | | 361,826 | | | | | - | | | | | 1,742,892 | | | | | (48,101 | ) | |
Adjustment to reflect change in accounting for split dollar life insurance (EITF Issue No. 06-4) | | | | - | | | | | (8,530 | ) | | | | | - | | | | | - | | | | | - | | | | | - | | | | | (8,530 | ) | | | | | - | |
Adjustment to reflect change in accounting for fair value of interest rate lock commitments (SFAS No. 157) | | | | - | | | | | (12,502 | ) | | | | | - | | | | | - | | | | | - | | | | | - | | | | | (12,502 | ) | | | | | - | |
|
Beginning balance, as adjusted | | | | 126,366 | | | | | 2,114,564 | | | | | - | | | | | 78,979 | | | | | 361,826 | | | | | - | | | | | 1,721,860 | | | | | (48,101 | ) | |
Net (loss) | | | | - | | | | | (191,960 | ) | | | | | - | | | | | - | | | | | - | | | | | - | | | | | (191,960 | ) | | | | | - | |
Other comprehensive income/(loss): | | | | | | | | | | | | | | | | |
Unrealized fair value adjustments, net of tax: | | | | | | | | | | | | | | | | |
Cash flow hedges | | | | - | | | | | (6 | ) | | | | | - | | | | | - | | | | | - | | | | | - | | | | | - | | | | | (6 | ) | |
Securities available for sale | | | | - | | | | | 21,852 | | | | | - | | | | | - | | | | | - | | | | | - | | | | | - | | | | | 21,852 | |
Pension and postretirement plans: | | | | | | | | | | | | | | | | |
Prior service cost arising during period | | | | - | | | | | (37 | ) | | | | | - | | | | | - | | | | | - | | | | | - | | | | | - | | | | | (37 | ) | |
Net actuarial (loss) arising during period | | | | - | | | | | (127,960 | ) | | | | | - | | | | | - | | | | | - | | | | | - | | | | | - | | | | | (127,960 | ) | |
Amortization of prior service cost, transition asset/obligation, and net actuarial gain/loss included in net periodic benefit cost | | | | - | | | | | 2,421 | | | | | - | | | | | - | | | | | - | | | | | - | | | | | - | | | | | 2,421 | |
| | |
Comprehensive (loss) | | | | - | | | | | (295,690 | ) | | | | | - | | | | | - | | | | | - | | | | | - | | | | | (191,960 | ) | | | | | (103,730 | ) | |
| | |
Preferred stock and common stock warrant issuance – CPP | | | | - | | | | | 866,540 | | | | | 782,680 | | | | | - | | | | | - | | | | | 83,860 | | | | | - | | | | | - | |
Cash dividends declared ($.19/share)* | | | | - | | | | | (64,428 | ) | | | | | - | | | | | - | | | | | - | | | | | - | | | | | (64,428 | ) | | | | | - | |
Stock dividends declared | | | | 9,689 | | | | | - | | | | | - | | | | | 6,056 | | | | | 71,525 | | | | | - | | | | | (77,581 | ) | | | | | - | |
Common stock issuance (69 million shares issued at $10 per share net of offering costs) | | | | 69,000 | | | | | 659,656 | | | | | - | | | | | 43,125 | | | | | 616,531 | | | | | - | | | | | - | | | | | - | |
Common stock repurchased | | | | - | | | | | (306 | ) | | | | | - | | | | | (19 | ) | | | | | (287 | ) | | | | | - | | | | | - | | | | | - | |
Common stock issued for: | | | | | | | | | | | | | | | | |
Stock options and restricted stock – equity awards | | | | 258 | | | | | (1,956 | ) | | | | | - | | | | | 128 | | | | | (2,084 | ) | | | | | - | | | | | - | | | | | - | |
Tax benefit from incentive plans | | | | - | | | | | (7,910 | ) | | | | | - | | | | | - | | | | | (7,910 | ) | | | | | - | | | | | - | | | | | - | |
Stock-based compensation expense | | | | - | | | | | 9,034 | | | | | - | | | | | - | | | | | 9,034 | | | | | - | | | | | - | | | | | - | |
Other | | | | (30 | ) | | | | | (37 | ) | | | | | - | | | | | 33 | | | | | (33 | ) | | | | | - | | | | | (37 | ) | | | | | - | |
|
Balance, December 31, 2008 | | | | 205,283 | | | | $ | | 3,279,467 | | | | $ | | 782,680 | | | | $ | | 128,302 | | | | $ | | 1,048,602 | | | | $ | | 83,860 | | | | $ | | 1,387,854 | | | | $ | | (151,831 | ) | |
|
See accompanying notes to consolidated financial statements.
|
* | | | | Per share data restated to reflect the effect of stock dividends declared through December 31, 2008. |
68
FIRST HORIZON NATIONAL CORPORATION
CONSOLIDATED STATEMENTS OF CASH FLOWS
| | | | | | | | (Dollars in thousands) | | Year Ended December 31 |
| | 2008 | | 2007 | | 2006 |
|
Operating | | Net (loss)/income | | | $ | | (191,960 | ) | | | | $ | | (170,111 | ) | | | | $ | | 462,914 | |
Activities | | Adjustments to reconcile net (loss)/income to net cash provided/(used) by operating activities: | | | | | | |
| | Provision for loan losses | | | | 1,080,000 | | | | | 272,765 | | | | | 83,129 | |
| | Provision/(benefit) for deferred income tax | | | | (411,429 | ) | | | | | (215,294 | ) | | | | | 102,738 | |
| | Depreciation and amortization of premises and equipment | | | | 41,278 | | | | | 57,125 | | | | | 53,550 | |
| | Amortization of intangible assets | | | | 8,229 | | | | | 10,959 | | | | | 11,687 | |
| | Net other amortization and accretion | | | | 47,941 | | | | | 63,550 | | | | | 79,569 | |
| | Decrease/(increase) in derivatives, net | | | | (110,044 | ) | | | | | 62,278 | | | | | (126,440 | ) | |
| | Market value adjustment on mortgage servicing rights | | | | 422,561 | | | | | 238,236 | | | | | (50,204 | ) | |
| | Provision for foreclosure reserve | | | | 15,924 | | | | | 10,567 | | | | | 12,903 | |
| | Goodwill impairment | | | | - | | | | | 84,084 | | | | | - | |
| | Impairment of other intangible assets | | | | 4,034 | | | | | 990 | | | | | - | |
| | Cumulative effect of changes in accounting principle, net of tax | | | | - | | | | | - | | | | | (1,345 | ) | |
| | (Gain)/loss on divestitures | | | | 19,020 | | | | | (15,695 | ) | | | | | (211,172 | ) | |
| | Stock-based compensation expense | | | | 9,034 | | | | | 11,338 | | | | | 15,891 | |
| | Excess tax benefit/(provision) from stock-based compensation arrangements | | | | 7,910 | | | | | (6,258 | ) | | | | | (3,592 | ) | |
| | Equity securities (gains)/losses, net | | | | (65,349 | ) | | | | | 7,475 | | | | | (10,271 | ) | |
| | Debt securities (gains)/losses, net | | | | (761 | ) | | | | | (6,292 | ) | | | | | 75,900 | |
| | Gains on repurchases of debt | | | | (33,845 | ) | | | | | - | | | | | - | |
| | Net losses on disposal of fixed assets | | | | 3,218 | | | | | 1,753 | | | | | 2,928 | |
| | Net (increase)/decrease in: | | | | | | |
| | Trading securities | | | | 782,470 | | | | | 461,982 | | | | | (97,317 | ) | |
| | Loans held for sale | | | | 2,926,558 | | | | | (588,135 | ) | | | | | 1,550,690 | |
| | Capital markets receivables | | | | (654,513 | ) | | | | | 207,863 | | | | | (220,774 | ) | |
| | Interest receivable | | | | 46,314 | | | | | 18,678 | | | | | (23,125 | ) | |
| | Net decrease in MSR due to sale | | | | 256,323 | | | | | 90,074 | | | | | - | |
| | Other assets | | | | (224,416 | ) | | | | | (189,834 | ) | | | | | (361,868 | ) | |
| | Net increase/(decrease) in: | | | | | | |
| | Capital markets payables | | | | 529,070 | | | | | (213,131 | ) | | | | | 208,162 | |
| | Interest payable | | | | (51,765 | ) | | | | | (8,739 | ) | | | | | 33,988 | |
| | Other liabilities | | | | 1,484 | | | | | 160,787 | | | | | 41,824 | |
| | Trading liabilities | | | | (196,642 | ) | | | | | (233,813 | ) | | | | | (3,681 | ) | |
|
| | Total adjustments | | | | 4,452,604 | | | | | 283,313 | | | | | 1,163,170 | |
|
| | Net cash provided by operating activities | | | | 4,260,644 | | | | | 113,202 | | | | | 1,626,084 | |
|
Investing | | Held to maturity securities: | | | | | | |
Activities | | Maturities | | | | 240 | | | | | 29 | | | | | 115 | |
| | Available for sale securities: | | | | | | |
| | Sales | | | | 157,984 | | | | | 653,627 | | | | | 2,968,277 | |
| | Maturities | | | | 592,776 | | | | | 847,174 | | | | | 679,456 | |
| | Purchases | | | | (729,984 | ) | | | | | (573,426 | ) | | | | | (4,597,779 | ) | |
| | Premises and equipment: | | | | | | |
| | Sales | | | | - | | | | | - | | | | | 50 | |
| | Purchases | | | | (23,666 | ) | | | | | (33,539 | ) | | | | | (100,263 | ) | |
| | Net increase in securitization retained interests classified as trading securities | | | | (47,336 | ) | | | | | - | | | | | - | |
| | Net (increase)/decrease in loans | | | | 418,985 | | | | | (754,806 | ) | | | | | (1,639,761 | ) | |
| | Net (increase)/decrease in interest-bearing cash | | | | (168,370 | ) | | | | | (21,381 | ) | | | | | (7,350 | ) | |
| | Cash (payments)/receipts related to divestitures | | | | (40,608 | ) | | | | | 23,318 | | | | | 293,358 | |
|
| | Net cash provided/(used) by investing activities | | | | 160,021 | | | | | 140,996 | | | | | (2,403,897 | ) | |
|
Financing | | Common stock: | | | | | | |
Activities | | Exercise of stock options | | | | 511 | | | | | 34,542 | | | | | 57,082 | |
| | Cash dividends paid | | | | (120,575 | ) | | | | | (225,011 | ) | | | | | (223,386 | ) | |
| | Repurchase of shares | | | | (303 | ) | | | | | (1,104 | ) | | | | | (165,572 | ) | |
| | Issuance of common shares | | | | 659,656 | | | | | - | | | | | - | |
| | Issuance of preferred equity and common stock warrant - CPP | | | | 866,540 | | | | | - | | | | | - | |
| | Excess tax benefit from stock-based compensation arrangements | | | | (7,910 | ) | | | | | 6,258 | | | | | 3,592 | |
| | Long-term debt: | | | | | | |
| | Issuance | | | | 25,002 | | | | | 1,230,171 | | | | | 2,804,057 | |
| | Payments | | | | (1,969,207 | ) | | | | | (292,288 | ) | | | | | (412,769 | ) | |
| | Cash paid for repurchase of debt | | | | (244,928 | ) | | | | | - | | | | | - | |
| | Issuance of preferred stock of subsidiary | | | | - | | | | | 8 | | | | | - | |
| | Repurchase of preferred stock of subsidiary | | | | (112 | ) | | | | | (1 | ) | | | | | - | |
| | Net increase/(decrease) in: | | | | | | |
| | Deposits | | | | (2,321,483 | ) | | | | | (2,956,271 | ) | | | | | (3,224,535 | ) | |
| | Short-term borrowings | | | | (2,242,791 | ) | | | | | 2,063,121 | | | | | 1,682,553 | |
|
| | Net cash provided/(used) by financing activities | | | | (5,355,600 | ) | | | | | (140,575 | ) | | | | | 521,022 | |
|
| | Net increase/(decrease) in cash and cash equivalents | | | | (934,935 | ) | | | | | 113,623 | | | | | (256,791 | ) | |
|
| | Cash and cash equivalents at beginning of period | | | | 2,259,715 | | | | | 2,146,092 | | | | | 2,402,883 | |
|
| | Cash and cash equivalents at end of period | | | $ | | 1,324,780 | | | | $ | | 2,259,715 | | | | $ | | 2,146,092 | |
|
| | Cash and cash equivalents from discontinued operations at beginning of period, included above | | | $ | | - | | | | $ | | - | | | | $ | | 874 | |
| | Total interest paid | | | | 761,130 | | | | | 1,374,583 | | | | | 1,296,324 | |
| | Total income taxes paid | | | | 336,681 | | | | | 13,052 | | | | | 115,930 | |
|
See accompanying notes to consolidated condensed financial statements.
Certain previously reported amounts have been reclassified to agree with current presentation.
69
FIRST HORIZON NATIONAL CORPORATION
Notes to Consolidated Financial Statements
Note 1 q Summary of Significant Accounting Policies
Basis of Accounting.The consolidated financial statements of First Horizon National Corporation (FHN), including its subsidiaries, have been prepared in conformity with accounting principles generally accepted in the United States of America and follow general practices within the industries in which it operates. This preparation requires management to make estimates and assumptions that affect the amounts reported in the financial statements and accompanying notes. These estimates and assumptions are based on information available as of the date of the financial statements and could differ from actual results.
Principles of Consolidation and Basis of Presentation.The consolidated financial statements include the accounts of FHN and other entities in which it has a controlling financial interest. Variable Interest Entities (VIE) for which FHN or a subsidiary has been determined to be the primary beneficiary are also consolidated. Affiliates for which FHN is not considered the primary beneficiary and that FHN does not have a controlling financial interest in are accounted for by the equity method. These investments are included in other assets, and FHN’s proportionate share of income or loss is included in noninterest income. All significant intercompany transactions and balances have been eliminated. For purposes of comparability, certain prior period amounts have been reclassified to conform to current year presentation. Business combinations accounted for as purchases are included in the financial statements from the respective dates of acquisition.
Revenue Recognition.FHN derives a significant portion of its revenues from fee based services. Noninterest income from transaction based fees is generally recognized when the transactions are completed. Noninterest income from service based fees is generally recognized over the period in which FHN provides the service.
Deposit Transactions and Cash Management.Deposit transactions include services related to retail deposit products (such as service charges on checking accounts), cash management products and services such as electronic transaction processing (automated clearing house and Electronic Data Interchange), account reconciliation services, cash vault services, lockbox processing, and information reporting to large corporate clients.
Insurance Commissions.Insurance commissions are derived from the sale of insurance products, including acting as an independent agent to provide commercial and personal property and casualty, life, long-term care, and disability insurance.
Trust Services and Investment Management.Trust services and investment management fees include investment management, personal trust, employee benefits, and custodial trust services.
Statements of Cash Flows.For purposes of these statements, cash and due from banks, federal funds sold, and securities purchased under agreements to resell are considered cash and cash equivalents. Federal funds are usually sold for one-day periods, and securities purchased under agreements to resell are short-term, highly liquid investments.
Trading Activities.Securities purchased in connection with underwriting or dealer activities (long positions) are carried at market value as trading securities. Gains and losses, both realized and unrealized, on these securities are reflected in capital markets noninterest income. Trading liabilities include securities that FHN has sold to other parties but does not own (short positions). FHN is obligated to purchase securities at a future date to cover the short positions. Assets and liabilities for unsettled trades are recorded on the Consolidated Statements of Condition as “Capital markets receivables” or “Capital markets payables”. Retained interests, in the form of excess interest, interest-only and principal-only strips, and subordinated securities from sales and securitizations of first-lien mortgages are recognized at fair value as trading securities with gains and losses, both realized and unrealized, recognized in mortgage banking income. Retained interests, in the form of certificated residual interests from the securitization of second-lien mortgages and home equity lines of credit (HELOC) are recognized at fair value as trading securities with gains and losses, both realized and unrealized, recognized in gains/(losses) from loans sales and securitizations.
70
FIRST HORIZON NATIONAL CORPORATION
Note 1 q Summary of Significant Accounting Policies (continued)
Investment Securities.Securities that FHN has the ability and positive intent to hold to maturity are classified as securities held to maturity and are carried at amortized cost. The amortized cost of all securities is adjusted for amortization of premium and accretion of discount to maturity, or earlier call date if appropriate, using the level yield method. Such amortization and accretion is included in interest income from securities. Investment securities are reviewed quarterly for possible other-than-temporary impairment. The review includes an analysis of the facts and circumstances of each individual investment such as the degree of loss, the length of time the fair value has been below cost, the expectation for that security’s performance, the creditworthiness of the issuer and FHN’s intent and ability to hold the security. Realized gains and losses and declines in value judged to be other-than-temporary are determined by the specific identification method and reported in noninterest income.
Securities that may be sold prior to maturity and equity securities are classified as securities available for sale and are carried at fair value. The unrealized gains and losses on securities available for sale are excluded from earnings and are reported, net of tax, as a component of other comprehensive income within shareholders’ equity. Venture capital investments are classified as securities available for sale and are carried at fair value. Upon adoption of Statement of Financial Accounting Standards No. 157, “Fair Value Measurements” (SFAS No. 157) on January 1, 2008, unrealized gains and losses on such securities are recognized prospectively in noninterest income. Prior to FHN’s adoption of SFAS No. 157, venture capital investments were initially valued at cost based on their unmarketable nature. Subsequently, these investments were adjusted to reflect changes in valuation as a result of public offerings or other-than-temporary declines in value.
Securities Purchased under Resale Agreements and Securities Sold under Repurchase Agreements.FHN enters into short-term purchases of securities under agreements to resell which are accounted for as collateralized financings except where FHN does not have an agreement to sell the same or substantially the same securities before maturity at a fixed or determinable price. Securities delivered under these transactions are delivered to either the dealer custody account at the Federal Reserve Bank or to the applicable counterparty. Collateral is valued daily and FHN may require counterparties to deposit additional collateral or FHN may return collateral pledged when appropriate to maintain full collateralization for these transactions.
Securities sold under agreements to repurchase are offered to cash management customers as an automated, collateralized investment account. Securities sold are also used by the retail/commercial bank to obtain favorable borrowing rates on its purchased funds. As of December 31, 2008 and 2007, FHN had pledged $1.2 billion and $1.5 billion, respectively, of available for sale securities as collateral for these arrangements.
Loans Held for Sale and Securitization and Residual Interests.Prior to fourth quarter 2008, FHN originated first-lien mortgage loans (the warehouse) for the purpose of selling them in the secondary market, through sales to agencies for securitization, proprietary securitizations, and to a lesser extent through other loan sales. In addition, FHN evaluated its liquidity position in conjunction with determining its ability and intent to hold loans for the foreseeable future and sold certain of the second-lien mortgages and HELOC it produced in the secondary market through securitizations and loan sales through third quarter 2007. Loan securitizations involve the transfer of the loans to qualifying special purposes entities (QSPE) that are not subject to consolidation in accordance with Statement of Financial Accounting Standards No. 140, “Accounting for Transfers and Servicing of Financial Assets and Extinguishments of Liabilities” (SFAS No. 140). FHN generally retained the right to service the transferred loans. As a result of the sale of its national mortgage origination offices to MetLife Bank, N.A., mortgage banking origination activity will be significantly reduced in periods after third quarter 2008 as FHN focuses on origination within its regional banking footprint.
Loans originated or purchased for resale, together with mortgage loans previously sold which may be unilaterally called by FHN, are included in loans held for sale inthe consolidated statements of condition. Effective January 1, 2008, upon adoption of Statement of Financial Accounting Standards No. 159, “The Fair Value Option for Financial Assets and Financial Liabilities” (SFAS No. 159), FHN elected the fair value option on a prospective basis for almost all types of mortgage loans originated for sale purposes. Such loans are carried at fair value, with changes in the fair value of these loans recognized in the mortgage banking noninterest income section of the Consolidated Statements of Income. For mortgage loans originated for sale for which the fair value option is elected, loan origination fees are recorded by FHN when earned and related direct loan origination costs are recognized when incurred. Interests retained from the sale or securitization of such loans are included as a
71
FIRST HORIZON NATIONAL CORPORATION
Note 1 q Summary of Significant Accounting Policies (continued)
component of trading securities on the Consolidated Statements of Condition, with related cash receipts and payments classified prospectively in investing activities on the Consolidated Statements of Cash Flows based on the purpose for which such financial assets were retained. See Note 23 – Fair Values of Assets and Liabilities for additional information.
After adoption of SFAS No. 159, FHN continued to account for all mortgage loans held for sale which were originated prior to 2008 and for mortgage loans held for sale for which fair value accounting was not elected at the lower of cost or market value. For such loans, net origination fees and costs were deferred and included in the basis of the loans in calculating gains and losses upon sale. Also included in the basis of first-lien mortgage loans was the value accreted during the time that the loan was a locked commitment. The cost basis of loans qualifying for fair value hedge accounting under Statement of Financial Accounting Standards No. 133, “Accounting for Derivative Instruments and Hedging Activities” (SFAS No. 133), was adjusted to reflect changes in fair value. Gains and losses realized from the sale of these assets were included in noninterest income. Interests retained from the sale of such loans are included as a component of trading securities on the Consolidated Statements of Condition.
Mortgage loans insured by the Federal Housing Administration (FHA) and mortgage loans guaranteed by the Veterans Administration (VA) are generally securitized through the Government National Mortgage Association (GNMA). Conforming conventional loans are generally securitized through government- sponsored enterprises (GSE) such as the Federal National Mortgage Association (FNMA) and the Federal Home Loan Mortgage Corporation (FHLMC). In addition, FHN has completed proprietary securitizations of nonconforming first-lien and second-lien mortgages and HELOC, which do not conform to the requirements for sale or securitization through government agencies or GSE. Most of these securitizations are accounted for as sales; those that do not qualify for sale treatment are accounted for as financing arrangements.
Interests retained from loan sales, including agency securitizations, include MSR and excess interest. Interests retained from proprietary securitizations include MSR and various financial assets. MSR are initially valued at fair value, and the remaining retained interests are initially valued by allocating the remaining cost basis of the loan between the security or loan sold and the remaining retained interests based on their relative fair values at the time of securitization or sale. All retained interests, including MSR, are carried at fair value.
Financial assets retained in a proprietary or agency securitization may include certificated residual interests, excess interest (structured as interest-only strips), interest-only strips, principal-only strips, or subordinated bonds. Residual interests represent rights to receive earnings to the extent of excess income generated by the underlying loans. Excess interest represents rights to receive interest from serviced assets that exceed contractually specified rates. Principal-only strips are principal cash flow tranches, and interest-only strips are interest cash flow tranches. Subordinated bonds are bonds with junior priority. All financial assets retained from a securitization are recognized on the Consolidated Statements of Condition in trading securities at fair value with realized and unrealized gains and losses included in current earnings as a component of noninterest income on the Consolidated Statements of Income.
The fair values of the certificated residual interests and the excess interest are determined using market prices from closely comparable assets such as MSR that are tested against prices determined using a valuation model that calculates the present value of estimated future cash flows. The fair value of these retained interests typically changes based on changes in the discount rate and differences between modeled prepayment speeds and credit losses and actual experience. In some instances, FHN retains interests in the loans it securitized by retaining certificated principal only strips or subordinated bonds. Subsequent to the MetLife transaction, FHN uses observable inputs such as trades of similar instruments, yield curves, credit spreads and consensus prepayment speeds to determine the fair value of principal only strips. Prior to the MetLife transaction, FHN used the market prices from comparable assets such as publicly traded FNMA trust principal only strips that are adjusted to reflect the relative risk difference between readily marketable securities and privately issued securities in valuing the principal only strips. The fair value of subordinated bonds is determined using the best available market information, which may include trades of comparable securities, independently provided spreads to other marketable securities, and published market research. Where no market information is available, the company utilizes an internal valuation model. As of December 31, 2008, no market information
72
FIRST HORIZON NATIONAL CORPORATION
Note 1 q Summary of Significant Accounting Policies (continued)
was available, and the subordinated bonds were valued using an internal model which includes assumptions about timing, frequency and severity of loss, prepayment speeds of the underlying collateral, and the yield that a market participant would require. The assumptions were consistent with those embedded in the December 31, 2007 values, when there was more market information available, except that loss frequency and loss severity assumptions were worsened consistent with published industry cumulative historical loss information and published market projections of future deteriorations in real estate values. As of December 31, 2007, the subordinated bonds were valued using trades of comparable market securities and independently provided spreads.
FHN recognizes all its classes of MSR at fair value. Classes of MSR are determined in accordance with FHN’s risk management practices and market inputs used in determining the fair value of the servicing asset. Since sales of MSR tend to occur in private transactions and the precise terms and conditions of the sales are typically not readily available, there is a limited market to refer to in determining the fair value of MSR. As such, like other participants in the mortgage banking business, FHN relies primarily on a discounted cash flow model to estimate the fair value of its MSR. This model calculates estimated fair value of the MSR using predominant risk characteristics of MSR such as interest rates, type of product (fixed vs. variable), age (new, seasoned, or moderate), agency type and other factors. FHN uses assumptions in the model that it believes are comparable to those used by brokers and other service providers. FHN also periodically compares its estimates of fair value and assumptions with brokers, service providers, and recent market activity and against its own experience. Due to ongoing disruptions in the mortgage market, more emphasis has been placed on third party broker price discovery and, when available, observable market trades in valuing MSR.
Loans.Loans are stated at principal amounts outstanding, net of unearned income. Interest on loans is recognized on an accrual basis at the applicable interest rate on the principal amount outstanding. Loan origination fees and direct costs as well as premiums and discounts are amortized as level yield adjustments over the respective loan terms. Unamortized net fees or costs are recognized upon early repayment of the loans. Loan commitment fees are generally deferred and amortized on a straight-line basis over the commitment period. Impaired loans are generally carried on a nonaccrual status. Loans are ordinarily placed on nonaccrual status when, in management’s opinion, the collection of principal or interest is unlikely. Accrued but uncollected interest is reversed and charged against interest income when the loan is placed on nonaccrual status. On retail loans, accrued but uncollected interest is reversed when the loan is fully or partially charged off. Management may elect to continue the accrual of interest when the estimated net realizable value of collateral is sufficient to recover the principal balance and accrued interest. Interest payments received on nonaccrual and impaired loans are normally applied to principal. Once all principal has been received, additional interest payments are recognized on a cash basis as interest income.
Allowance for Loan Losses.The allowance for loan losses is maintained at a level that management determines is sufficient to absorb estimated probable incurred losses in the loan portfolio. Management’s evaluation process to determine the adequacy of the allowance utilizes analytical models based on loss experience adjusted for current events, trends and economic conditions. In response to economic conditions, in 2008 and fourth quarter 2007, FHN conducted focused portfolio management activities to identify problem credits and to ensure appropriate provisioning and reserve levels. The actual amounts realized could differ in the near term from the amounts assumed in arriving at the allowance for loan losses reported in the financial statements.
All losses of principal are charged to the allowance for loan losses in the period in which the loan is deemed to be uncollectible. Additions are made to the allowance through periodic provisions charged to current operations and recovery of principal on loans previously charged off.
Premises and Equipment.Premises and equipment are carried at cost less accumulated depreciation and amortization and include additions that materially extend the useful lives of existing premises and equipment. All other maintenance and repair expenditures are expensed as incurred. Gains and losses on dispositions are reflected in noninterest income and expense.
Depreciation and amortization are computed on the straight-line method over the estimated useful lives of the assets and are recorded as noninterest expense. Leasehold improvements are amortized over the lesser of the
73
FIRST HORIZON NATIONAL CORPORATION
Note 1 q Summary of Significant Accounting Policies (continued)
lease periods or the estimated useful lives using the straight-line method. Useful lives utilized in determining depreciation for furniture, fixtures and equipment and buildings are three to fifteen and seven to forty-five years, respectively.
Real Estate Acquired by Foreclosure.Properties acquired by foreclosure in compliance with HUD servicing guidelines are included in “Real estate acquired by foreclosure” and are carried at the estimated amount of the underlying government insurance or guarantee. On December 31, 2008, FHN had $21.2 million in these foreclosed properties. All other real estate acquired by foreclosure consists of properties that have been acquired in satisfaction of debt. These properties are carried at the lower of the outstanding loan amount or estimated fair value less estimated cost to sell the real estate. Losses arising at foreclosure are charged to the appropriate reserve. Required developmental costs associated with foreclosed property under construction are capitalized and included in determining the estimated net realizable value of the property, which is reviewed periodically, and any write-downs are charged against current earnings.
Intangible Assets.Intangible assets consist of “Other intangible assets” and “Goodwill.” The “Other intangible assets” represents identified intangible assets, including customer lists, acquired contracts, covenants not to compete and premium on purchased deposits, which are amortized over their estimated useful lives, except for those assets related to deposit bases that are primarily amortized over 10 years. Management evaluates whether events or circumstances have occurred that indicate the remaining useful life or carrying value of amortizing intangibles should be revised. Goodwill represents the excess of cost over net assets of acquired subsidiaries less identifiable intangible assets. On an annual basis, FHN tests goodwill for impairment. For the year ended December 31, 2006, impairment of “Other intangible assets” or “Goodwill” recognized was immaterial to FHN. However, as a result of impairment assessments completed in relation to two full-service First Horizon Bank branches sold as part of FHN’s restructuring, repositioning, and efficiency initiatives, a goodwill writedown of $13.0 million and writedowns of other intangible assets of $.9 million were recognized during 2007. Additionally, in fourth quarter 2007, FHN incurred a noncash impairment charge of $71.1 million for the writedown of goodwill associated with the Mortgage Banking business segment. While impairment of “Goodwill” recognized was immaterial to FHN for the year ended December 31, 2008, writedowns of other intangible assets of $4.0 million were recognized during 2008 in relation to FHN’s divestiture of certain mortgage operations and from the change in FHN’s national banking strategy. See Note 27 – Restructuring, Repositioning, and Efficiency Initiatives for additional information regarding the writedown of other intangible assets during 2008 and the writedown of goodwill and other intangible assets during 2007 in relation to FHN’s restructuring, repositioning, and efficiency initiatives. See Note 7 – Intangible Assets for additional information regarding the goodwill impairment charge recognized by the Mortgage Banking business segment in 2007.
Derivative Financial Instruments.FHN accounts for derivative financial instruments in accordance with SFAS No. 133 which requires recognition of all derivative instruments on the balance sheet as either an asset or liability measured at fair value through adjustments to either accumulated other comprehensive income within shareholders’ equity or current earnings. Fair value is defined as the price that would be received to sell a derivative asset or paid to transfer a derivative liability in an orderly transaction between market participants on the transaction date. Fair value is determined using available market information and appropriate valuation methodologies.
FHN prepares written hedge documentation, identifying the risk management objective and designating the derivative instrument as a fair value hedge, cash flow hedge or free-standing derivative instrument entered into as an economic hedge or to meet customers’ needs. All transactions designated as SFAS No. 133 hedges must be assessed at inception and on an ongoing basis as to the effectiveness of the derivative instrument in offsetting changes in fair value or cash flows of the hedged item. For a fair value hedge, changes in the fair value of the derivative instrument and changes in the fair value of the hedged asset or liability are recognized currently in earnings. For a cash flow hedge, changes in the fair value of the derivative instrument, to the extent that it is effective, are recorded in accumulated other comprehensive income and subsequently reclassified to earnings as the hedged transaction impacts net income. Any ineffective portion of a cash flow hedge is recognized currently in earnings. For free-standing derivative instruments, changes in fair values are recognized currently in earnings. See Note 26 – Derivatives and Off-Balance Sheet Arrangements for additional information.
74
FIRST HORIZON NATIONAL CORPORATION
Note 1 q Summary of Significant Accounting Policies (continued)
Cash flows from derivative contracts are reported as operating activities on the Consolidated Statements of Cash Flows.
Advertising and Public Relations.Advertising and public relations costs are generally expensed as incurred.
Income Taxes.FHN accounts for income taxes using the liability method pursuant to Statement of Financial Accounting Standards No. 109, “Accounting for Income Taxes” (SFAS No. 109). Under this method, FHN’s deferred tax assets and liabilities are determined by applying the applicable federal and state income tax rates to its cumulative temporary differences. These temporary differences represent differences between financial statement carrying amounts and the corresponding tax bases of certain assets and liabilities. Deferred taxes are provided as a result of such temporary differences.
FHN and its eligible subsidiaries are included in a consolidated federal income tax return. FHN files separate returns for subsidiaries that are not eligible to be included in a consolidated federal income tax return. Based on the laws of the applicable state where it conducts business operations, FHN either files consolidated, combined or separate returns. With few exceptions, FHN is no longer subject to U.S. federal or state and local tax examinations by tax authorities for years before 2005. The Internal Revenue Servide (IRS) has completed its examination of all U.S. federal returns through 2004. All proposed adjustments with respect to examinations of federal returns filed for 2004 and prior years have been settled.
FHN adopted the provisions of FASB Interpretation No. 48, “Accounting for Uncertainty in Income Taxes” (FIN 48) on January 1, 2007. As a result of the implementation of FIN 48, FHN recognized a $.9 million increase in the liability for unrecognized tax benefits, which was accounted for as a reduction to the January 1, 2007 balance of undivided profits. The total balance of unrecognized tax benefits at December 31, 2008 and December 31, 2007, respectively, were $31.1 and $31.6 million. FHN does not expect that unrecognized tax benefits will significantly increase or decrease within the next twelve months. FHN recognizes accrued interest and penalties related to unrecognized tax benefits as a component of tax expense. FHN had approximately $6.0 and $4.2 million accrued for the payment of interest at December 31, 2008 and December 31, 2007, respectively.
Earnings per Share.Earnings per share is computed by dividing net income or loss available to common shareholders by the weighted average number of common shares outstanding for each period. Diluted earnings per share in net income periods is computed by dividing net income available to common shareholders by the weighted average number of common shares adjusted to include the number of additional common shares that would have been outstanding if the dilutive potential common shares resulting from options granted under FHN’s stock option plans and deferred compensation arrangements had been issued. FHN utilizes the treasury stock method in this calculation. Diluted earnings per share does not reflect an adjustment for potentially dilutive shares in net loss periods. As a result of the stock dividends declared in 2008, weighted average basic and diluted shares were restated to reflect the effect of the stock dividends.
Equity Compensation.FHN accounts for its employee stock-based compensation plans using the grant date fair value of an award to determine the expense to be recognized over the life of the award. For awards with service vesting criteria, expense is recognized using the straight-line method over the requisite service period (generally the vesting period) and is adjusted for anticipated forfeitures. For awards vesting based on a performance measure, anticipated performance is projected to determine the number of awards expected to vest, and the corresponding aggregate expense is adjusted to reflect the elapsed portion of the performance period. The fair value of equity awards with cash payout requirements, as well as awards for which fair value cannot be estimated at grant date, is remeasured each reporting period through vesting date.
For all stock option awards granted prior to adoption of Statement of Financial Accounting Standards No. 123 (revised 2004), “Share-Based Payment” (SFAS No. 123-R), FHN permits vesting of the option to continue after retirement. To account for these stock option awards, FHN uses the nominal vesting period approach. Under the nominal vesting period approach, awards granted to employees near retirement eligibility are expensed over the option’s normal vesting period until an employee’s actual retirement date, at which point all remaining unamortized compensation expense is immediately accelerated. Awards granted after the adoption of SFAS No. 123-R are amortized using the nonsubstantive vesting methodology. The nonsubstantive vesting methodology requires that
75
FIRST HORIZON NATIONAL CORPORATION
Note 1 q Summary of Significant Accounting Policies (continued)
expense associated with options that continue vesting after retirement be recognized over a period ending no later than an employee’s retirement eligibility date. Had FHN followed the nonsubstantive vesting period method for all awards previously granted, the effect of the change in expense attribution on earnings and per share amounts would have been negligible.
Accounting Changes.Effective December 31, 2008, FHN adopted FASB Staff Position No. EITF 99-20-1, “Amendments to the Impairment Guidance of EITF Issue No. 99-20” (FSP EITF 99-20-1). FSP EITF 99-20-1 amends EITF Issue No. 99-20, “Recognition of Interest Income and Impairment on Purchased Beneficial Interests and Beneficial Interests That Continue to Be Held by a Transferor in Securitized Financial Assets” (EITF 99-20) to align its impairment model with the impairment model in Statement of Financial Accounting Standards No. 115, “Accounting for Certain Investments in Debt and Equity Securities” (SFAS No. 115), resulting in a consistent determination of whether other-than-temporary impairments of available for sale or held to maturity debt securities have occurred. Since FHN recognizes all retained interests from securitization transactions at fair value as trading securities and as all of its beneficial interests classified as available for sale securities are outside the scope of EITF 99-20, the effect of adopting FSP EITF 99-20-1 was immaterial to FHN.
In December 2008 the FASB issued FASB Staff Position No. FAS 140-4 and FIN 46(R)-8, “Disclosures by Public Entities about Transfers of Financial Assets and Interests in Variable Interest Entities” (FSP FAS 140-4) which requires additional disclosures related to transfers of financial assets as well as FHN’s involvement with variable interest entities and qualifying special purpose entities. FSP FAS 140-4 was effective for fiscal year ended after December 15, 2008 and FHN has revised its disclosures accordingly.
Effective December 31, 2008, FHN adopted FASB Staff Position No. FAS 133-1 and FIN 45-4, “Disclosures about Credit Derivatives and Certain Guarantees: An Amendment of FASB Statement No. 133 and FASB Interpretation No. 45; and Clarification of the Effective Date of FASB Statement No. 161” (FSP FAS 133-1). FSP FAS 133-1 requires sellers of credit derivatives and similar guarantee contracts to make disclosures regarding the nature, term, fair value, potential losses and recourse provisions for those contracts. Since FHN is not a seller of credit derivatives or similar financial guarantees, the effect of adopting FSP FAS 133-1 was immaterial to FHN.
Effective January 1, 2008, FHN adopted SFAS No. 159 which allows an irrevocable election to measure certain financial assets and liabilities at fair value on an instrument-by-instrument basis, with unrealized gains and losses recognized currently in earnings. Under SFAS No. 159, the fair value option may only be elected at the time of initial recognition of a financial asset or liability or upon the occurrence of certain specified events. Additionally, SFAS No. 159 provides that application of the fair value option must be based on the fair value of an entire financial asset or liability and not selected risks inherent in those assets or liabilities. SFAS No. 159 requires that assets and liabilities which are measured at fair value pursuant to the fair value option be reported in the financial statements in a manner that separates those fair values from the carrying amounts of similar assets and liabilities which are measured using another measurement attribute. SFAS No. 159 also provides expanded disclosure requirements regarding the effects of electing the fair value option on the financial statements. Upon adoption of SFAS No. 159, FHN elected the fair value option on a prospective basis for almost all types of mortgage loans originated for sale purposes. Additionally, in accordance with SFAS No. 159’s amendment of SFAS No. 115, FHN began prospectively classifying cash flows associated with its retained interests in securitizations recognized as trading securities within investing activities in the Consolidated Statements of Cash Flows.
Effective January 1, 2008, FHN adopted SEC Staff Accounting Bulletin No. 109, “Written Loan Commitments Recorded at Fair ValueThrough Earnings” (SAB No. 109) prospectively for derivative loan commitments issued or modified after that date. SAB No. 109 rescinds SAB No. 105’s prohibition on inclusion of expected net future cash flows related to loan servicing activities in the fair value measurement of a written loan commitment. SAB No. 109 also applies to any loan commitments for which fair value accounting is elected under SFAS No. 159. FHN did not elect fair value accounting for any other loan commitments under SFAS No. 159. The prospective application of SAB No. 109 and the prospective election to recognize substantially all new mortgage loan originations at fair value under SFAS No. 159 resulted in a positive net impact of $1.0 million on 2008 pre-tax earnings.
Effective January 1, 2008, FHN adopted SFAS No. 157 for existing fair value measurement requirements related to financial assets and liabilities as well as to non-financial assets and liabilities which are remeasured at least
76
FIRST HORIZON NATIONAL CORPORATION
Note 1 q Summary of Significant Accounting Policies (continued)
annually. In February 2008, the FASB staff issued FASB Staff Position No. FAS 157-2, “Effective Date of FASB Statement No. 157” (FSP FAS 157-2), which delayed the effective date of SFAS No. 157 until fiscal years beginning after November 15, 2008, for non-financial assets and liabilities which are recognized at fair value on a non-recurring basis. SFAS No. 157 establishes a hierarchy to be used in performing measurements of fair value. Additionally, SFAS No. 157 emphasizes that fair value should be determined from the perspective of a market participant while also indicating that valuation methodologies should first reference available market data before using internally developed assumptions. SFAS No. 157 also provides expanded disclosure requirements regarding the effects of fair value measurements on the financial statements. Upon the adoption of the provisions of SFAS No. 157 for financial assets and liabilities as well as non-financial assets and liabilities remeasured at least annually on January 1, 2008, a negative after-tax cumulative-effect adjustment of $12.5 million was made to the opening balance of undivided profits for interest rate lock commitments which FHN previously measured under the guidance of EITF 02-3, “Issues Involved in Accounting for Derivative Contracts Held for Trading Purposes and Contracts Involved in Energy Trading and Risk Management Activities” (EITF 02-3). The effect of the change in accounting for these interest rate lock commitments produced a positive effect of $19.4 million on 2008 pre-tax earnings as existing commitments were delivered as loans and additional commitments that would have been deferred under EITF 02-3 were made. Substantially all commitments existing at August 31, 2008 were sold to MetLife Bank, N.A. Application of SFAS No. 157 to non-financial assets and liabilities which are recognized at fair value on a non-recurring basis is not expected to be significant to FHN.
In October 2008, the FASB issued FASB Staff Position No. FAS 157-3, “Determining the Fair Value of a Financial Asset When the Market for That Asset is Not Active” (FSP FAS 157-3). FSP FAS 157-3 clarifies the application of SFAS No. 157 in a market that is not active and provides an example to illustrate key considerations in determining the fair value of a financial asset when the market for that asset is not active. FSP FAS 157-3 was effective upon issuance, including prior periods for which financial statements had not been issued. FHN applied the guidance of FSP FAS 157-3 in its fair value measurements as of September 30, 2008 and the effects of adoption were not material.
Effective January 1, 2008, FHN adopted FASB Staff Position No. FAS 157-1, “Application of FASB Statement No. 157 to FASB Statement No. 13 and Other Accounting Pronouncements That Address Fair Value Measurements for Purposes of Lease Classification or Measurement under Statement 13” (FSP FAS 157-1), which amends SFAS No. 157 to exclude Statement of Financial Accounting Standards No. 13, “Accounting for Leases” (SFAS No. 13), and other accounting pronouncements that address fair value measurements for purposes of lease classification or measurement under SFAS No. 13 from its scope. The adoption of FSP FAS 157-1 had no effect on FHN’s statement of condition or results of operations.
Effective January 1, 2008, FHN adopted EITF Issue No. 06-4, “Accounting for Deferred Compensation and Postretirement Benefit Aspects of Endorsement Split-Dollar Life Insurance Arrangements” (EITF 06-4). EITF 06-4 requires that a liability be recognized for contracts written to employees which provide future postretirement benefits that are covered by endorsement split-dollar life insurance arrangements because such obligations are not considered to be effectively settled upon entering into the related insurance arrangements. FHN recognized a decrease to undivided profits of $8.5 million, net of tax, upon adoption of EITF 06-4.
Effective January 1, 2008, FHN adopted FASB Staff Position No. FIN 39-1, “Amendment of FASB Interpretation No. 39” (FSP FIN 39-1). FSP FIN 39-1 permits the offsetting of fair value amounts recognized for the right to reclaim cash collateral or the obligation to return cash collateral against fair value amounts recognized for derivative instruments executed with the same counterparty under the same master netting arrangement. Upon adoption of FSP FIN 39-1, entities were permitted to change their previous accounting policy election to offset or not offset fair value amounts recognized for derivative instruments under master netting arrangements. FSP FIN 39-1 requires additional disclosures for derivatives and collateral associated with master netting arrangements, including the separate disclosure of amounts recognized for the right to reclaim cash collateral or the obligation to return cash collateral under master netting arrangements as of the end of each reporting period for entities that made an accounting policy decision to not offset fair value amounts. FHN retained its previous accounting policy election to not offset fair value amounts recognized for derivative instruments under master netting arrangements upon adoption of FSP FIN 39-1.
77
FIRST HORIZON NATIONAL CORPORATION
Note 1 q Summary of Significant Accounting Policies (continued)
FHN also adopted FASB Statement 133 Implementation Issue No. E23, “Issues Involving the Application of the Shortcut Method under Paragraph 68” (DIG E23) as of January 1, 2008, for hedging relationships designated on or after such date. DIG E23 amends SFAS No. 133 to explicitly permit use of the shortcut method for hedging relationships in which an interest rate swap has a nonzero fair value at inception of the hedging relationship which is attributable solely to the existence of a bid-ask spread in the entity’s principal market under SFAS No. 157. Additionally, DIG E23 allows an entity to apply the shortcut method to a qualifying fair value hedge when the hedged item has a trade date that differs from its settlement date because of generally established conventions in the marketplace in which the transaction to acquire or issue the hedged item is executed. Preexisting shortcut hedging relationships were analyzed as of DIG E23’s adoption date to determine whether they complied with the revised shortcut criteria at their inception or should be dedesignated prospectively. The adoption of DIG E23 had no effect on FHN’s financial position or results of operations as all of FHN’s preexisting hedging relationships met the requirements of DIG E23 at their inception.
Effective January 1, 2007, FHN adopted Statement of Financial Accounting Standards No. 155, “Accounting for Certain Hybrid Financial Instruments” (SFAS No. 155), which permits fair value remeasurement for hybrid financial instruments that contain an embedded derivative that otherwise would require bifurcation. Additionally, SFAS No. 155 clarifies the accounting guidance for beneficial interests in securitizations. Under SFAS No. 155, all beneficial interests in a securitization require an assessment in accordance with SFAS No. 133 to determine if an embedded derivative exists within the instrument. In addition, effective January 1, 2007, FHN adopted Derivatives Implementation Group Issue B40, “Application of Paragraph 13(b) to Securitized Interests in Prepayable Financial Assets” (DIG B40). DIG B40 provides an exemption from the embedded derivative test of paragraph 13(b) of SFAS No. 133 for instruments that would otherwise require bifurcation if the test is met solely because of a prepayment feature included within the securitized interest and prepayment is not controlled by the security holder. Since FHN presents all retained interests in its proprietary securitizations as trading securities and due to the clarifying guidance of DIG B40, the impact of adopting SFAS No. 155 was immaterial to the results of operations.
Effective January 1, 2007, FHN adopted FIN 48 which provides guidance for the financial statement recognition and measurement of a tax position taken or expected to be taken in a tax return. FIN 48 also provides guidance on the classification and disclosure of uncertain tax positions in the financial statements. Upon adoption of FIN 48, FHN recognized a cumulative effect adjustment to the beginning balance of undivided profits in the amount of $.9 million for differences between the tax benefits recognized in the statements of condition prior to the adoption of FIN 48 and the amounts reported after adoption.
Effective January 1, 2007, FHN adopted EITF Issue No. 06-5, “Accounting for Purchases of Life Insurance—Determining the Amount That Could Be Realized in Accordance with FASB Technical Bulletin No. 85-4, Accounting for Purchases of Life Insurance” (EITF 06-5). EITF 06-5 provides that in addition to cash surrender value, the asset recognized for a life insurance contract should consider certain other provisions included in a policy’s contractual terms with additional amounts being discounted if receivable beyond one year. Additionally, EITF 06-5 requires that the determination of the amount that could be realized under an insurance contract be performed at the individual policy level. FHN recognized a reduction of undivided profits in the amount of $.5 million as a result of adopting EITF 06-5.
Effective January 1, 2007, FHN elected early adoption of the final provisions of Statement of Financial Accounting Standards No. 158, “Employers’ Accounting for Defined Benefit Pension and Other Postretirement Plans – an amendment of FASB Statements No. 87, 88, 106, and 132(R)” (SFAS No. 158), which required that the annual measurement date of a plan’s assets and liabilities be as of the date of the financial statements. As a result of adopting the measurement date provisions of SFAS No. 158, total equity was increased by $6.2 million on January 1, 2007, consisting of a reduction to undivided profits of $2.1 million and a credit to accumulated other comprehensive income of $8.3 million. Effective December 31, 2006, FHN adopted the provisions of SFAS No. 158 related to the requirements to recognize the overfunded or underfunded status of a defined benefit postretirement plan as an asset or liability in the statements of condition. SFAS No. 158 did not change measurement or recognition requirements for periodic pension and postretirement costs. SFAS No. 158 also provides that changes in the funded status of a defined benefit postretirement plan should be recognized in the year such changes occur through comprehensive income. As a result of adopting the recognition provisions of SFAS No. 158, unrecognized transition assets and obligations, unrecognized actuarial gains and losses, and
78
FIRST HORIZON NATIONAL CORPORATION
Note 1 q Summary of Significant Accounting Policies (continued)
unrecognized prior service costs and credits were recognized as a component of accumulated other comprehensive income resulting in a reduction in equity of $76.7 million, net of tax, on December 31, 2006.
In fiscal 2006, FHN adopted SEC Staff Accounting Bulletin No. 108 (SAB No. 108). SAB No. 108 requires that registrants assess the impact on both the statement of condition and the statement of income when quantifying and evaluating the materiality of a misstatement. Under SAB No. 108, adjustment of financial statements is required when either approach results in quantifying a misstatement that is material to a reporting period presented within the financial statements, after considering all relevant quantitative and qualitative factors. The adoption of SAB No. 108 had no effect on FHN’s statement of condition or results of operations.
Effective January 1, 2006, FHN elected early adoption of Statement of Financial Accounting Standards No. 156, “Accounting for Servicing of Financial Assets – an amendment of FASB Statement No. 140” (SFAS No. 156). This amendment to SFAS No. 140 requires servicing rights be initially measured at fair value. Subsequently, companies are permitted to elect, on a class-by-class basis, either fair value or amortized cost accounting for their servicing rights. FHN elected fair value accounting for its MSR. Accordingly, FHN recognized the cumulative effect of a change in accounting principle totaling $.2 million, net of tax, representing the excess of the fair value of the servicing asset over the recorded value on January 1, 2006.
FHN also adopted Statement of Financial Accounting Standards No. 154, “Accounting Changes and Error Corrections” (SFAS No. 154), as of January 1, 2006. SFAS No. 154 requires retrospective application of voluntary changes in accounting principle. A change in accounting principle mandated by new accounting pronouncements should follow the transition method specified by the new guidance. However, if transition guidance is not otherwise specified, retrospective application will be required. SFAS No. 154 does not alter the accounting requirement for changes in estimates (prospective) and error corrections (restatement). The adoption of SFAS No. 154 did not affect FHN’s reported results of operations.
FHN adopted SFAS No. 123-R as of January 1, 2006. SFAS No. 123-R requires recognition of expense over the requisite service period for awards of share-based compensation to employees. The grant date fair value of an award is used to measure the compensation expense to be recognized over the life of the award. For unvested awards granted prior to the adoption of SFAS No. 123-R, the fair values utilized equal the values developed in preparation of the disclosures required under the original SFAS No. 123. Compensation expense recognized after adoption of SFAS No. 123-R incorporates an estimate of awards expected to ultimately vest, which requires estimation of forfeitures as well as projections related to the satisfaction of performance conditions that determine vesting. As permitted by SFAS No. 123-R, FHN retroactively applied the provisions of SFAS No. 123-R to its prior period financial statements. The Consolidated Statements of Income were revised to incorporate expenses previously presented in the footnote disclosures. The Consolidated Statements of Condition were revised to reflect the effects of including equity compensation expense in those prior periods. Additionally, all deferred compensation balances were reclassified within equity to capital surplus. Since FHN’s prior disclosures included forfeitures as they occurred, a cumulative effect adjustment, as required by SFAS No. 123-R, of $1.1 million net of tax, was made for unvested awards that were not expected to vest due to anticipated forfeiture.
Accounting Changes Issued but Not Currently Effective.In December 2008, FASB Staff Position No. FAS 132(R)-1, “Employers’ Disclosures about Postretirement Benefit Plan Assets” (FSP FAS 132(R)-1), was issued. FSP FAS 132(R)-1 provides detailed disclosure requirements to enhance the disclosures about an employer’s plan assets currently required by Statement of Financial Accounting Standards No. 132(R), “Employers’ Disclosures about Pensions and Other Postretirement Benefits” (SFAS No. 132(R)). FSP FAS 132(R)-1 is effective prospectively for annual periods ending after December 15, 2009. FHN is currently assessing the effects of adopting FSP FAS 132(R)-1. In May 2008, the FASB issued Statement of Financial Accounting Standards No. 162, “The Hierarchy of Generally Accepted Accounting Principles” (SFAS No. 162). SFAS No. 162 identifies the sources of accounting principles and the framework for selecting the principles used in the preparation of financial statements of nongovernmental entities that are presented in conformity with generally accepted accounting principles (GAAP) in the United States. As the GAAP hierarchy will reside in accounting literature established by the FASB upon adoption of SFAS No. 162, it will become applicable to preparers of financial statements. SFAS No. 162 is effective 60 days following the SEC’s approval of the Public Company Accounting Oversight Board’s amendments to AU
79
FIRST HORIZON NATIONAL CORPORATION
Note 1 q Summary of Significant Accounting Policies (continued)
Section 411, “The Meaning of Present Fairly in Conformity With Generally Accepted Accounting Principles”. The adoption of SFAS No. 162 will have no effect on FHN’s statement of condition or results of operations.
In March 2008, the FASB issued Statement of Financial Accounting Standards No. 161, “Disclosures about Derivative Instruments and Hedging Activities – an amendment of FASB Statement No. 133” (SFAS No. 161). SFAS No. 161 requires enhanced disclosures related to derivatives accounted for in accordance with SFAS No. 133 and reconsiders existing disclosure requirements for such derivatives and any related hedging items. The disclosures provided in SFAS No. 161 will be required for both interim and annual reporting periods. SFAS No. 161 is effective prospectively for quarterly interim periods beginning after November 15, 2008. FHN is currently assessing the effects of adopting SFAS No. 161.
In February 2008, FASB Staff Position No. FAS 140-3, “Accounting for Transfers of Financial Assets and Repurchase Financing Transactions” (FSP FAS 140-3), was issued. FSP FAS 140-3 permits a transferor and transferee to separately account for an initial transfer of a financial asset and a related repurchase financing that are entered into contemporaneously with, or in contemplation of, one another if certain specified conditions are met at the inception of the transaction. FSP FAS 140-3 requires that the two transactions have a valid and distinct business or economic purpose for being entered into separately and that the repurchase financing not result in the initial transferor regaining control over the previously transferred financial asset. FSP FAS 140-3 is effective prospectively for initial transfers executed in reporting periods beginning on or after November 15, 2008. The effect of adopting FSP FAS 140-3 will not be material to FHN.
In December 2007, the FASB issued SFAS No. 141-R and Statement of Financial Accounting Standards No. 160, “Noncontrolling Interests in Consolidated Financial Statements – an Amendment of ARB No. 51” (SFAS No. 160). SFAS No. 141-R requires that an acquirer recognize the assets acquired and liabilities assumed in a business combination, as well as any noncontrolling interest in the acquiree, at their fair values as of the acquisition date, with limited exceptions. Additionally, SFAS No. 141-R provides that an acquirer cannot specify an effective date for a business combination that is separate from the acquisition date. SFAS No. 141-R also provides that acquisition-related costs which an acquirer incurs should be expensed in the period in which the costs are incurred and the services are received. SFAS No. 160 requires that acquired assets and liabilities be measured at full fair value without consideration to ownership percentage. Under SFAS No. 160, any non-controlling interests in an acquiree should be presented as a separate component of equity rather than on a mezzanine level. Additionally, SFAS No. 160 provides that net income or loss should be reported in the consolidated income statement at its consolidated amount, with disclosure on the face of the consolidated income statement of the amount of consolidated net income which is attributable to the parent and noncontrolling interests, respectively. SFAS No. 141-R and SFAS No. 160 are effective prospectively for periods beginning on or after December 15, 2008, with the exception of SFAS No. 160’s presentation and disclosure requirements which should be retrospectively applied to all periods presented. While earnings per share for prior periods will not be effected by the adoption of SFAS No. 160, the retrospective application of SFAS No. 160’s presentation and disclosure requirements will result in an increase to consolidated net income of approximately $14 million, $19 million, and $18 million, respectively, for 2008, 2007, and 2006. FHN expects to recognize an increase of total shareholders’ equity approximating $295 million upon adoption of SFAS No. 160 as a result of reclassifying the noncontrolling interest previously recognized on the Consolidated Statements of Condition as “Preferred stock of subsidiary” as a separate component of equity.
In June 2007, the American Institute of Certified Public Accountants (AICPA) issued Statement of Position 07-1, “Clarification of the Scope of the Audit and Accounting Guide Investment Companies and Accounting by Parent Companies and Equity Method Investors for Investments in Investment Companies” (SOP 07-1), which provides guidance for determining whether an entity is within the scope of the AICPA’s Investment Companies Guide. Additionally, SOP 07-1 provides certain criteria that must be met in order for investment company accounting applied by a subsidiary or equity method investee to be retained in the financial statements of the parent company or an equity method investor. SOP 07-1 also provides expanded disclosure requirements regarding the retention of such investment company accounting in the consolidated financial statements. In May 2007, FASB Staff Position No. FIN 46(R)-7, “Application of FASB Interpretation No. 46(R) to Investment Companies” (FSP FIN 46(R)-7) was issued. FSP FIN 46(R)-7 amends FIN 46(R) to provide a permanent exception to its scope for companies within the scope of the revised Investment Companies Guide under SOP 07-1. In February 2008, the FASB issued FASB
80
FIRST HORIZON NATIONAL CORPORATION
Note 1 q Summary of Significant Accounting Policies (continued)
Staff Position No. SOP 07-1-1, “The Effective Date of AICPA Statement of Position 07-1” which indefinitely defers the effective date of SOP 07-1 and FSP FIN 46(R)-7.
Note 2 q Acquisitions/Divestitures
Effective August 31, 2008, FHN sold more than 230 retail and wholesale mortgage origination offices nationwide as well as its loan origination and servicing platforms. Additionally, as of that date, the parties completed the initial settlement for MetLife’s acquisition of substantially all of FHN’s mortgage origination pipeline, related hedges, certain fixed assets and other associated assets. MetLife did not acquire any portion of FHN’s mortgage loan warehouse. First Horizon retained its mortgage operations in and around Tennessee, continuing to originate home loans for customers in its banking market footprint. FHN also agreed with MetLife for the sale of servicing assets, and related hedges, on $19.1 billion of first lien mortgage loans and associated custodial deposits. Additionally, FHN has entered into a subservicing agreement with MetLife for the remainder of FHN’s servicing portfolio. MetLife generally paid book value for the assets and liabilities it acquired, less a purchase price reduction. The assets and liabilities related to the mortgage operations divested were included in the Mortgage Banking segment and were reflected as “divestiture” on the Consolidated Condensed Statements of Condition for the reporting period ending June 30, 2008. In third quarter 2008, FHN recognized a loss on divestiture of $17.5 million related to this transaction which is included in the noninterest income section of the Consolidated Statements of Income as losses on divestitures. In fourth quarter 2008, the parties completed a post-closing true up which resulted in FHN recognizing a gain on divestiture of $0.9 million within its Consolidated Statements of Income.
Due to efforts initiated by FHN in 2007 to improve profitability, in July 2007 management decided to pursue the sale, closure, or consolidation of 34 full-service First Horizon Bank branches in Atlanta, Baltimore, Dallas and Northern Virginia. In September 2007, it was announced that agreements for the sale of all 34 of the branches had been reached. Aggregate gains of $15.7 million were recognized in fourth quarter 2007 from the disposition of 15 of the branches. Additionally, losses of $1.0 million, $0.4 million and $1.0 million were recognized in the first second and fourth quarters of 2008, respectively, from the disposition of the remaining First Horizon Bank branches. These transactions resulted in the transfer of certain loans, certain fixed assets (including branch locations) and assumption of all the deposit relationships of the First Horizon Bank branches that were divested. The assets and liabilities related to the First Horizon Bank branches were included in the Regional Banking segment and were reflected as “divestiture” on the Consolidated Condensed Statements of Condition for reporting periods ending prior to June 30, 2008. The gains and losses realized on the disposition of First Horizon Bank branches are included in the noninterest income section of the Consolidated Statements of Income as gains and losses on divestitures.
On June 28, 2006, First Horizon Merchant Services, Inc. (FHMS) sold all of the outstanding capital stock of Global Card Services, Inc. (GCS), a wholly-owned subsidiary. As a result, tax benefits of $4.2 million were recognized associated with the difference between FHMS’ tax basis in the stock and net proceeds from the sale.
On March 1, 2006, FHN sold substantially all the assets of its national merchant processing business conducted primarily through FHMS and GCS. The sale was to NOVA Information Systems (NOVA), a wholly-owned subsidiary of U.S. Bancorp. This transaction resulted in a pre-tax gain of $351.5 million. During 2007, gains of $4.1 million resulted from an earn-out from the sale. This divestiture was accounted for as a discontinued operation, and prior periods were adjusted to exclude the impact of merchant operations from the results of continuing operations. In conjunction with the sale, FHN entered into a transitional service agreement with NOVA to provide or continue on-going services such as telecommunications, back-end processing and disaster recovery until NOVA converted the operations to their systems.
In addition to the divestitures mentioned above, FHN acquires or divests assets from time to time in transactions that are considered business combinations or divestitures but are not material to FHN individually or in the aggregate.
81
FIRST HORIZON NATIONAL CORPORATION
Note 3 q Investment Securities
The following tables summarize FHN’s securities held to maturity and available for sale on December 31, 2008 and 2007:
| | | | | | | | |
(Dollars in thousands) | | On December 31, 2008 |
| | Amortized
Cost | | Gross
Unrealized
Gains | | Gross
Unrealized
Losses | | Fair
Value |
|
Total securities held to maturity | | | $ | | - | | | | $ | | - | | | | $ | | - | | | | $ | | - | |
|
Securities available for sale: | | | | | | | | |
U.S. Treasuries | | | $ | | 47,911 | | | | $ | | 809 | | | | $ | | - | | | | $ | | 48,720 | |
Government agency issued MBS* | | | | 1,217,608 | | | | | 31,909 | | | | | - | | | | | 1,249,517 | |
Government agency issued CMO* | | | | 1,303,378 | | | | | 34,602 | | | | | - | | | | | 1,337,980 | |
Other U.S. government agencies* | | | | 131,216 | | | | | 2,485 | | | | | - | | | | | 133,701 | |
States and municipalities | | | | 65,915 | | | | | - | | | | | (555 | ) | | | | | 65,360 | |
Other | | | | 2,214 | | | | | - | | | | | (35 | ) | | | | | 2,179 | |
Equity** | | | | 287,663 | | | | | 33 | | | | | - | | | | | 287,696 | |
|
Total securities available for sale*** | | | $ | | 3,055,905 | | | | $ | | 69,838 | | | | $ | | (590 | ) | | | | $ | | 3,125,153 | |
|
|
* | | | | Includes securities issued by government sponsored entities. |
|
** | | | | Includes FHLB and FRB stock, venture capital, money market, and cost method investments. |
|
*** | | | | Includes $2.7 billion of securities pledged to secure public deposits, securities sold under agreements to repurchase and for other purposes. |
| | | | | | | | |
(Dollars in thousands) | | On December 31, 2007 |
| | Amortized
Cost | | Gross
Unrealized
Gains | | Gross
Unrealized
Losses | | Fair
Value |
|
Securities held to maturity: | | | | | | | | |
States and municipalities | | | $ | | 240 | | | | $ | | 2 | | | | $ | | - | | | | $ | | 242 | |
|
Total securities held to maturity | | | $ | | 240 | | | | $ | | 2 | | | | $ | | - | | | | $ | | 242 | |
|
Securities available for sale: | | | | | | | | |
U.S. Treasuries | | | $ | | 41,948 | | | | $ | | 67 | | | | $ | | - | | | | $ | | 42,015 | |
Government agency issued MBS* | | | | 1,311,349 | | | | | 11,048 | | | | | (176 | ) | | | | | 1,322,221 | |
Government agency issued CMO* | | | | 1,193,528 | | | | | 18,186 | | | | | (1,066 | ) | | | | | 1,210,648 | |
Other U.S. government agencies* | | | | 222,501 | | | | | 6,069 | | | | | (560 | ) | | | | | 228,010 | |
States and municipalities | | | | 1,500 | | | | | - | | | | | (19 | ) | | | | | 1,481 | |
Other | | | | 2,855 | | | | | 2 | | | | | (25 | ) | | | | | 2,832 | |
Equity** | | | | 225,389 | | | | | - | | | | | (45 | ) | | | | | 225,344 | |
|
Total securities available for sale*** | | | $ | | 2,999,070 | | | | $ | | 35,372 | | | | $ | | (1,891 | ) | | | | $ | | 3,032,551 | |
|
|
* | | | | Includes securities issued by government sponsored entities. |
|
** | | | | Includes FHLB and FRB stock, venture capital, money market, and cost method investments. |
|
*** | | | | Includes $2.7 billion of securities pledged to secure public deposits, securities sold under agreements to repurchase and for other purposes. |
82
FIRST HORIZON NATIONAL CORPORATION
Note 3 q Investment Securities (continued)
Provided below are the amortized cost and fair value by contractual maturity for the securities portfolios on December 31, 2008:
| | | | | | | | |
(Dollars in thousands) | | Held to Maturity | | Available for Sale |
| | Amortized
Cost | | Fair
Value | | Amortized
Cost | | Fair
Value |
|
Within 1 year | | | $ | | - | | | | $ | | - | | | | $ | | 9,362 | | | | $ | | 9,366 | |
After 1 year; within 5 years | | | | - | | | | | - | | | | | 64,980 | | | | | 65,989 | |
After 5 years; within 10 years | | | | - | | | | | - | | | | | 115,539 | | | | | 117,230 | |
After 10 years | | | | - | | | | | - | | | | | 57,375 | | | | | 57,375 | |
|
Subtotal | | | | - | | | | | - | | | | | 247,256 | | | | | 249,960 | |
|
Government agency issued MBS and CMO | | | | - | | | | | - | | | | | 2,520,986 | | | | | 2,587,497 | |
Equity securities | | | | - | | | | | - | | | | | 287,663 | | | | | 287,696 | |
|
Total | | | $ | | - | | | | $ | | - | | | | $ | | 3,055,905 | | | | $ | | 3,125,153 | |
|
Expected maturities will differ from contractual maturities because borrowers may have the right to call or prepay obligations with or without call or prepayment penalties.
The table below provides information on realized gross gains and realized gross losses on sales from the available for sale portfolio for the years ended December 31:
| | | | | | |
(Dollars in thousands) | | AFS Debt* | | AFS Equity* | | Total |
|
2008 | | | | | | |
Gross gains on sales | | | $ | | 919 | | | | $ | | 67,253 | | | | $ | | 68,171 | |
Gross losses on sales | | | | (157 | ) | | | | | (1,904 | ) | | | | | (2,061 | ) | |
|
2007 | | | | | | |
Gross gains on sales | | | $ | | 6,312 | | | | $ | | 4,099 | | | | $ | | 10,411 | |
Gross losses on sales | | | | (20 | ) | | | | | (1,087 | ) | | | | | (1,107 | ) | |
|
2006 | | | | | | |
Gross gains on sales | | | $ | | 3,132 | | | | $ | | 11,258 | | | | $ | | 14,390 | |
Gross losses on sales | | | | (79,209 | ) | | | | | (813 | ) | | | | | (80,022 | ) | |
|
*AFS – Available for sale
Losses totaling $1.5 million, $10.4 million and $.2 million for the years 2008, 2007 and 2006, respectively, were recognized in the Consolidated Statements of Income for securities that, in the opinion of management, have been other-than-temporarily impaired. During 2006, $.2 million of recoveries were realized as gains on debt securities that had previously been written down.
83
FIRST HORIZON NATIONAL CORPORATION
Note 3 q Investment Securities (continued)
The following tables provide information on investments within the available for sale portfolio that have unrealized losses on December 31, 2008 and 2007:
| | | | | | | | | | | | |
(Dollars in thousands) | | On December 31, 2008 |
| | Less than 12 months | | 12 Months or Longer | | Total |
| | Fair
Value | | Unrealized
Losses | | Fair
Value | | Unrealized
Losses | | Fair
Value | | Unrealized
Losses |
|
U.S. Treasuries | | | $ | | - | | | | $ | | - | | | | $ | | - | | | | $ | | - | | | | $ | | - | | | | $ | | - | |
Government agency issued MBS | | | | - | | | | | - | | | | | - | | | | | - | | | | | - | | | | | - | |
Government agency issued CMO | | | | - | | | | | - | | | | | - | | | | | - | | | | | - | | | | | - | |
Other U.S. government agencies | | | | - | | | | | - | | | | | - | | | | | - | | | | | - | | | | | - | |
States and municipalities | | | | 945 | | | | | (555 | ) | | | | | - | | | | | - | | | | | 945 | | | | | (555 | ) | |
Other | | | | - | | | | | - | | | | | 813 | | | | | (35 | ) | | | | | 813 | | | | | (35 | ) | |
|
Total debt securities | | | | 945 | | | | | (555 | ) | | | | | 813 | | | | | (35 | ) | | | | | 1,758 | | | | | (590 | ) | |
Equity | | | | - | | | | | - | | | | | - | | | | | - | | | | | - | | | | | - | |
|
Total temporarily impaired securities | | | $ | | 945 | | | | $ | | (555 | ) | | | | $ | | 813 | | | | $ | | (35 | ) | | | | $ | | 1,758 | | | | $ | | (590 | ) | |
|
The gross unrealized losses on December 31, 2008, were principally related to states and municipalities. FHN has reviewed these securities in accordance with its accounting policy for other-than-temporary impairment and does not consider them other-than-temporarily impaired. FHN has both the intent and ability to hold these securities for the time necessary to recover the amortized cost.
| | | | | | | | | | | | |
(Dollars in thousands) | | On December 31, 2007 |
| | Less than 12 months | | 12 Months or Longer | | Total |
| | Fair
Value | | Unrealized
Losses | | Fair
Value | | Unrealized
Losses | | Fair
Value | | Unrealized
Losses |
|
U.S. Treasuries | | | $ | | - | | | | $ | | - | | | | $ | | - | | | | $ | | - | | | | $ | | - | | | | $ | | - | |
Government agency issued MBS | | | | 130,366 | | | | | (176 | ) | | | | | - | | | | | - | | | | | 130,366 | | | | | (176 | ) | |
Government agency issued CMO | | | | - | | | | | - | | | | | 128,834 | | | | | (1,066 | ) | | | | | 128,834 | | | | | (1,066 | ) | |
Other U.S. government agencies | | | | - | | | | | - | | | | | 24,312 | | | | | (560 | ) | | | | | 24,312 | | | | | (560 | ) | |
Other | | | | 2,232 | | | | | (20 | ) | | | | | 822 | | | | | (24 | ) | | | | | 3,054 | | | | | (44 | ) | |
|
Total debt securities | | | | 132,598 | | | | | (196 | ) | | | | | 153,968 | | | | | (1,650 | ) | | | | | 286,566 | | | | | (1,846 | ) | |
Equity | | | | 186 | | | | | (45 | ) | | | | | - | | | | | - | | | | | 186 | | | | | (45 | ) | |
|
Total temporarily impaired securities | | | $ | | 132,784 | | | | $ | | (241 | ) | | | | $ | | 153,968 | | | | $ | | (1,650 | ) | | | | $ | | 286,752 | | | | $ | | (1,891 | ) | |
|
On December 31, 2008 and 2007, FHN had $193.0 million and $153.5 million, respectively, of cost method investments. These investments included Federal Reserve Bank and Federal Home Loan Bank stock of $169.9 million and $118.8 million on December 31, 2008 and 2007, respectively. These investments, which do not have a readily determinable market and for which it is not practicable to estimate a fair value, are evaluated for impairment only if there are identified events or changes in circumstances that may have had a significant adverse effect on the fair value of the investment.
84
FIRST HORIZON NATIONAL CORPORATION
Note 4 q Loans
A summary of the major categories of loans outstanding on December 31 is shown below:
| | | | |
(Dollars in thousands) | | 2008 | | 2007 |
|
Commercial: | | | | |
Commercial, financial and industrial | | | $ | | 7,863,727 | | | | $ | | 7,140,087 | |
Real estate commercial | | | | 1,454,040 | | | | | 1,294,922 | |
Real estate construction | | | | 1,778,140 | | | | | 2,753,475 | |
Retail: | | | | |
Real estate residential | | | | 8,161,435 | | | | | 7,791,885 | |
Real estate construction | | | | 980,798 | | | | | 2,008,289 | |
Other retail | | | | 135,779 | | | | | 144,019 | |
Credit card receivables | | | | 189,554 | | | | | 204,812 | |
Real estate loans pledged against other collateralized borrowings | | | | 714,717 | | | | | 766,027 | |
|
Loans, net of unearned income | | | | 21,278,190 | | | | | 22,103,516 | |
Allowance for loan losses | | | | 849,210 | | | | | 342,341 | |
|
Total net loans | | | $ | | 20,428,980 | | | | $ | | 21,761,175 | |
|
On December 31, 2008, $5.4 billion of commercial, financial and industrial loans were pledged to secure potential discount window borrowings from the Federal Reserve Bank.
FHN has a significant concentration of loans secured by residential real estate (52 percent of total loans) primarily in three portfolios. The retail real estate residential portfolio including real estate loans pledged against other collateralized borrowings (41 percent of total loans) was comprised of primarily home equity lines and loans. While this portfolio has been stressed by the downturn in the housing market and rising unemployment, it contains loans extended to strong borrowers with high credit scores and is geographically diversified. The OTC portfolio (5 percent of total loans) has been negatively impacted by the downturn in the housing industry, certain discontinued product types, and the decreased availability of permanent mortgage financing. The Residential CRE portfolio (6 percent of total loans) has also been negatively impacted by the housing industry downturn as builder liquidity has been severely stressed.
As of December 31, 2008, loans to banks and bank holding companies, trust preferred loans, and loans participating with downstream correspondents totaling $1.7 billion (8 percent of total loans) are included within the Commercial, Financial and Industrial portfolio. Due to the higher credit losses experienced throughout the financial services industry and the limited availability of market liquidity, these loans have experienced increased stress throughout 2008.
On December 31, 2008, FHN did not have any concentrations of 10 percent or more of total commercial, financial and industrial loans in any single industry.
Nonperforming loans consist of loans which management has identified as impaired, other nonaccrual loans and loans which have been restructured. On December 31, 2008 and 2007, there were no significant outstanding commitments to advance additional funds to customers whose loans had been restructured. The following table presents nonperforming loans on December 31:
| | | | |
(Dollars in thousands) | | 2008 | | 2007 |
|
Impaired loans | | | $ | | 474,090 | | | | $ | | 126,612 | |
Other nonaccrual loans* | | | | 579,558 | | | | | 180,475 | |
|
Total nonperforming loans | | | $ | | 1,053,648 | | | | $ | | 307,087 | |
|
|
* | | | | On December 31, 2008 and 2007, other nonaccrual loans included $8.5 million and $23.8 million, respectively, of loans held for sale. |
Interest income received during 2008 for impaired loans was $24.5 million and for other nonaccrual loans was $20.6 million. Under their original terms, interest income would have been approximately $32.4 million for the
85
FIRST HORIZON NATIONAL CORPORATION
Note 4 q Loans (continued)
impaired loans and $23.8 million for the other nonaccrual loans outstanding on December 31, 2008. Interest income received during 2007 for impaired loans was $5.1 million and for other nonaccrual loans was $8.1 million. Under their original terms, interest income would have been approximately $8.8 million for the impaired loans and $8.0 million for the other nonaccrual loans outstanding on December 31, 2007. Interest income received during 2006 for impaired loans was $.7 million and for other nonaccrual loans was $2.5 million. Under their original terms, interest income would have been approximately $2.5 million for the impaired loans and $6.2 million for the other nonaccrual loans outstanding on December 31, 2006. The average balance of impaired loans was approximately $379.0 million for 2008, $74.7 million for 2007 and $29.9 million for 2006. Generally, impaired commercial loans considered collateral dependent have been charged down to net realizable value and other impaired loans have an associated allowance for loan loss.
Activity in the allowance for loan losses related to non-impaired and impaired loans for years ended December 31 is summarized as follows:
| | | | | | (Dollars in thousands) | | Non-impaired | | Impaired | | Total |
|
Balance on December 31, 2005 | | | $ | | 185,334 | | | | $ | | 4,371 | | | | $ | | 189,705 | |
Provision for loan losses | | | | 66,523 | | | | | 16,606 | | | | | 83,129 | |
Adjustment due to divestiture, acquisition or transfer | | | | (1,470 | ) | | | | | - | | | | | (1,470 | ) | |
Charge-offs | | | | (57,061 | ) | | | | | (11,565 | ) | | | | | (68,626 | ) | |
Recoveries | | | | 12,966 | | | | | 581 | | | | | 13,547 | |
|
Net charge-offs | | | | (44,095 | ) | | | | | (10,984 | ) | | | | | (55,079 | ) | |
|
Balance on December 31, 2006 | | | | 206,292 | | | | | 9,993 | | | | | 216,285 | |
Provision for loan losses | | | | 221,253 | | | | | 51,512 | | | | | 272,765 | |
Adjustment due to divestiture, acquisition or transfer | | | | (14,943 | ) | | | | | - | | | | | (14,943 | ) | |
Charge-offs | | | | (99,625 | ) | | | | | (47,282 | ) | | | | | (146,907 | ) | |
Recoveries | | | | 12,906 | | | | | 2,235 | | | | | 15,141 | |
|
Net charge-offs | | | | (86,719 | ) | | | | | (45,047 | ) | | | | | (131,766 | ) | |
|
Balance on December 31, 2007 | | | | 325,883 | | | | | 16,458 | | | | | 342,341 | |
Provision for loan losses | | | | 828,963 | | | | | 251,037 | | | | | 1,080,000 | |
Adjustment due to divestiture, acquisition or transfer | | | | (370 | ) | | | | | - | | | | | (370 | ) | |
Charge-offs | | | | (333,462 | ) | | | | | (258,966 | ) | | | | | (592,428 | ) | |
Recoveries | | | | 15,893 | | | | | 3,774 | | | | | 19,667 | |
|
Net charge-offs | | | | (317,569 | ) | | | | | (255,192 | ) | | | | | (572,761 | ) | |
|
Balance on December 31, 2008 | | | $ | | 836,907 | | | | $ | | 12,303 | | | | $ | | 849,210 | |
|
Included in other assets and in other liabilities on the Consolidated Statements of Condition are amounts due from customers on acceptances and bank acceptances outstanding of $2.0 million, $3.4 million, and $7.7 million on December 31, 2008, 2007, and 2006, respectively. Retail real estate construction loans are a one-time close product where FHN provides construction and permanent mortgage financing to individuals for the purpose of constructing a home. Upon completion of construction, the permanent mortgage had historically been classified as held for sale and sold. Due to the market disruptions experienced in 2008, demand for many of these permanent mortgages decreased significantly. FHN currently transfers the loans to held for sale or retains them in the loan portfolio based upon management’s ability and intent at the time of conversion to permanent financing. FHN transferred approximately $.1 billion, $2.1 billion and $1.6 billion of OTC loans in 2008, 2007, and 2006, respectively, from the loan portfolio to held-for-sale. Additionally, FHN transferred approximately $.6 billion and $.1 billion of real estate residential loans from held for sale into the loan portfolio in 2008 and 2007, respectively.
86
FIRST HORIZON NATIONAL CORPORATION
Note 5 q Premises, Equipment and Leases
Premises and equipment on December 31 are summarized below:
| | | | |
(Dollars in thousands) | | 2008 | | 2007 |
|
Land | | | $ | | 64,201 | | | | $ | | 65,218 | |
Buildings | | | | 332,645 | | | | | 330,412 | |
Leasehold improvements | | | | 57,842 | | | | | 75,213 | |
Furniture, fixtures and equipment | | | | 221,894 | | | | | 321,539 | |
|
Premises and equipment, at cost | | | | 676,582 | | | | | 792,382 | |
Less accumulated depreciation and amortization | | | | 342,651 | | | | | 393,077 | |
|
Premises and equipment, net | | | $ | | 333,931 | | | | $ | | 399,305 | |
|
Excluded from the analysis were $11.6 million of Premises and equipment, net related to First Horizon Bank branches held for sale as of 2007. There were no premises and equipment included in held for sale as of December 31, 2008.
FHN is obligated under a number of noncancelable operating leases for premises and equipment with terms up to 30 years, which may include the payment of taxes, insurance and maintenance costs.
Minimum future lease payments for noncancelable operating leases on premises and equipment on December 31, 2008, are shown below:
| | |
(Dollars in thousands) | | |
|
2009 | | | $ | | 35,064 | |
2010 | | | | 28,020 | |
2011 | | | | 19,282 | |
2012 | | | | 14,091 | |
2013 | | | | 10,658 | |
2014 and after | | | | 30,280 | |
|
Total minimum lease payments | | | $ | | 137,395 | |
|
Payments required under capital leases are not material.
Aggregate minimum income under sublease agreements for these periods is $15.2 million.
Rent expense incurred under all operating lease obligations was as follows for the years ended December 31:
| | | | | | |
(Dollars in thousands) | | 2008 | | 2007 | | 2006 |
|
Rent expense, gross | | | $ | | 61,496 | | | | $ | | 84,130 | | | | $ | | 84,553 | |
Sublease income | | | | (4,043 | ) | | | | | (3,395 | ) | | | | | (3,556 | ) | |
|
Rent expense, net | | | $ | | 57,453 | | | | $ | | 80,735 | | | | $ | | 80,997 | |
|
Note 6 q Mortgage Servicing Rights
On January 1, 2006, FHN elected early adoption of SFAS No. 156, which requires servicing rights be initially measured at fair value. Subsequently, companies are permitted to elect, on a class-by-class basis, either fair value or amortized cost accounting for their servicing rights. Accordingly, FHN began initially recognizing all its classes of mortgage servicing rights (MSR) at fair value and elected to irrevocably continue application of fair value accounting to all its classes of MSR. Classes of MSR are determined in accordance with FHN’s risk management practices and market inputs used in determining the fair value of the servicing asset. FHN recognized the cumulative effect of a change in accounting principle totaling $.2 million, net of tax, representing the excess of the fair value of the servicing asset over the recorded value on January 1, 2006. The balance of MSR included on the Consolidated Statements of Condition represents the rights to service approximately $65.2 billion and $104.3 billion of mortgage loans on December 31, 2008 and 2007, respectively, for which a servicing right has been capitalized.
87
FIRST HORIZON NATIONAL CORPORATION
Note 6 q Mortgage Servicing Rights (continued)
Since sales of MSR tend to occur in private transactions and the precise terms and conditions of the sales are typically not readily available, there is a limited market to refer to in determining the fair value of MSR. As such, like other participants in the mortgage banking business, FHN relies primarily on a discounted cash flow model to estimate the fair value of its MSR. This model calculates estimated fair value of the MSR using predominant risk characteristics of MSR, such as interest rates, type of product (fixed vs. variable), age (new, seasoned, or moderate), agency type and other factors. FHN uses assumptions in the model that it believes are comparable to those used by brokers and other service providers. Due to ongoing disruptions in the mortgage market, more emphasis has been placed on third party broker price discovery and, when available, observable market trades in valuing MSR. FHN also periodically compares its estimates of fair value and assumptions with brokers, service providers, and recent market activity and against its own experience.
Following is a summary of changes in capitalized MSR related to proprietary securitization activities utilizing qualifying special purpose entities (QSPEs) as of December 31, 2008 and 2007:
| | | | | | |
(Dollars in thousands) | | First
Liens | | Second
Liens | | HELOC |
|
Fair value on January 1, 2007 | | | $ | | 448,915 | | | | $ | | 2,005 | | | | $ | | 3,348 | |
Addition of mortgage servicing rights | | | | 66,080 | | | | | 59 | | | | | 153 | |
Reductions due to loan payments | | | | (49,421 | ) | | | | | (575 | ) | | | | | (1,091 | ) | |
Changes in fair value due to: | | | | | | |
Changes in valuation model inputs or assumptions | | | | (60,356 | ) | | | | | (60 | ) | | | | | (174 | ) | |
Reclassification to trading assets | | | | (173,496 | ) | | | | | - | | | | | - | |
Other changes in fair value | | | | (1,411 | ) | | | | | - | | | | | 25 | |
|
Fair value on December 31, 2007 | | | | 230,311 | | | | | 1,429 | | | | | 2,261 | |
Addition of mortgage servicing rights | | | | - | | | | | - | | | | | 187 | |
Reductions due to loan payments | | | | (22,869 | ) | | | | | (259 | ) | | | | | (412 | ) | |
Changes in fair value due to: | | | | | | |
Changes in valuation model inputs or assumptions | | | | (104,449 | ) | | | | | (189 | ) | | | | | (579 | ) | |
Other changes in fair value | | | | - | | | | | - | | | | | 14 | |
|
Fair value on December 31, 2008 | | | $ | | 102,993 | | | | $ | | 981 | | | | $ | | 1,471 | |
|
Servicing, late and other ancillary fees recognized within mortgage banking income were $86.6 million, $85.2 million and $92.3 million for the years ended December 31, 2008, 2007 and 2006, respectively, related to securitization activity. Servicing, late and other ancillary fees recognized within revenue from loan sales and securitizations were $1.2 million, $1.5 million and $1.9 million for the years ended December 31, 2008, 2007 and 2006, respectively, related to securitization activity.
88
FIRST HORIZON NATIONAL CORPORATION
Note 6 q Mortgage Servicing Rights (continued)
Following is a summary of changes in capitalized MSR related to loan sale activity as of December 31, 2008 and 2007:
| | | | | | |
(Dollars in thousands) | | First
Liens | | Second
Liens | | HELOC |
|
Fair value on January 1, 2007 | | | $ | | 1,046,300 | | | | $ | | 22,086 | | | | $ | | 11,288 | |
Addition of mortgage servicing rights | | | | 283,561 | | | | | 11,523 | | | | | 1,940 | |
Reductions due to loan payments | | | | (164,832 | ) | | | | | (8,628 | ) | | | | | (3,606 | ) | |
Reductions due to sale | | | | (96,502 | ) | | | | | - | | | | | - | |
Changes in fair value due to: | | | | | | |
Changes in valuation model inputs or assumptions | | | | (176,726 | ) | | | | | (676 | ) | | | | | (327 | ) | |
Reclassification to trading assets | | | | (1,051 | ) | | | | | - | | | | | - | |
Other changes in fair value | | | | 1,354 | | | | | 98 | | | | | 17 | |
|
Fair value on December 31, 2007 | | | | 892,104 | | | | | 24,403 | | | | | 9,312 | |
Addition of mortgage servicing rights | | | | 241,750 | | | | | - | | | | | 1,001 | |
Reductions due to loan payments | | | | (86,127 | ) | | | | | (6,226 | ) | | | | | (1,701 | ) | |
Reductions due to sale | | | | (485,759 | ) | | | | | - | | | | | - | |
Changes in fair value due to: | | | | | | |
Changes in valuation model inputs or assumptions | | | | (311,353 | ) | | | | | (5,607 | ) | | | | | (2,987 | ) | |
Other changes in fair value | | | | 789 | | | | | 6 | | | | | 1,794 | |
|
Fair value on December 31, 2008 | | | $ | | 251,404 | | | | $ | | 12,576 | | | | $ | | 7,419 | |
|
Servicing, late and other ancillary fees recognized within mortgage banking income were $146.0 million, $227.6 million and $237.2 million for the years ended December 31, 2008, 2007 and 2006, respectively, related to loan sale activity. Servicing, late and other ancillary fees recognized within revenue from loan sales and securitizations were $15.7 million, $17.3 million and $11.1 million for the years ended December 31, 2008, 2007 and 2006, respectively, related to loan sale activity.
In 2008, FHN sold the rights to service $51.8 billion of loans which resulted in a $485.8 million reduction in MSR attributable to loan sales. Included in this change is the third quarter 2008 sale of $19.1 billion of servicing to MetLife. Changes in assumptions primarily reflect a decrease in MSR values as interest rate declines increased prepayment assumptions.
In 2007, FHN sold the rights to service $7.3 billion of loans which resulted in a $96.5 million reduction in MSR. Changes in assumptions include a $97.4 million decline in MSR due to ongoing disruptions in the mortgage market which resulted in more emphasis on third party broker price discovery and, when available, observable market trades in valuation modeling. This amount is attributable to MSR related to loan sales. In conjunction with capital management initiatives, FHN modified Pooling and Servicing Agreements (PSA) on its private securitizations during the second quarter of 2007 to segregate the retained yield component from the master servicing fee. The retained yield of $174.5 million, which primarily related to proprietary securitizations, was reclassified from mortgage servicing rights to trading securities on the Consolidated Statements of Condition.
The fair value of MSR typically rises as market interest rates increase and declines as market interest rates decrease; however, the extent to which this occurs depends in part on (1) the magnitude of changes in market interest rates, and (2) the differential between the then current market interest rates for mortgage loans and the mortgage interest rates included in the mortgage-servicing portfolio. FHN enters into financial agreements to hedge MSR in order to minimize the effects of loss in value of MSR associated with increased prepayment activity that generally results from declining interest rates. In a rising interest rate environment, the value of the MSR generally will increase while the value of the hedge instruments will decline. Specifically, FHN enters into interest rate contracts (including swaps, swaptions and mortgage forward sales contracts) to hedge against the effects of changes in fair value of its MSR. Substantially all capitalized MSR are hedged. The hedges are economic hedges only, and are terminated and reestablished as needed to respond to changes in market conditions. Changes in the value of the hedges are recognized as a component of net servicing income in mortgage banking noninterest
89
FIRST HORIZON NATIONAL CORPORATION
Note 6 q Mortgage Servicing Rights (continued)
income. Successful economic hedging will help minimize earnings volatility that may result from carrying MSR at fair value.
FHN services a portfolio of mortgage loans related to transfers performed by other parties utilizing QSPEs. FHN’s MSR represents its sole interest in these transactions. The total MSR recognized by FHN related to these transactions was $27.1 million and $88.5 million at December 31, 2008 and 2007, respectively. The aggregate principal balance serviced by FHN for these transactions was $3.3 billion and $6.0 billion as December 31, 2008 and 2007, respectively. FHN has no obligation to provide financial support and has not provided any form of support to the related trusts. The MSR recognized by FHN has been included in the first lien mortgage loans column within the rollforward of MSR resulting from loan sales activity.
As of December 31, 2008, FHN had transferred $28.0 million of MSR to third parties in transactions that did not qualify for sales treatment due to certain recourse provisions that were included within the sale agreements. These MSR are included within the first liens mortgage loans column within the rollforward of MSR resulting from loan sales activity. The proceeds from these transfers have been recognized within commercial paper and other short term borrowings in the Consolidated Statement of Position as of December 31, 2008. Since MSR are recognized at fair value and since changes in the fair value of related financing liabilities will exactly mirror the change in fair value of the associated servicing assets, management elected to account for the financing liabilities at fair value under SFAS No. 159.
90
FIRST HORIZON NATIONAL CORPORATION
Note 7 q Intangible Assets
The following is a summary of intangible assets, net of accumulated amortization, included in the Consolidated Statements of Condition:
| | | | |
(Dollars in thousands) | | Goodwill | | Other
Intangible
Assets* |
|
December 31, 2005 | | | $ | | 281,440 | | | | $ | | 76,647 | |
Amortization expense | | | | - | | | | | (11,462 | ) | |
Minimum pension liability adjustment | | | | - | | | | | (1,657 | ) | |
Adjustment to initially apply SFAS No. 158 | | | | - | | | | | (804 | ) | |
Divestitures | | | | (11,777 | ) | | | | | (4,318 | ) | |
Additions | | | | 5,919 | | | | | 6,124 | |
|
December 31, 2006 | | | | 275,582 | | | | | 64,530 | |
Amortization expense | | | | - | | | | | (10,959 | ) | |
Impairment | | | | (84,084 | ) | | | | | (990 | ) | |
Divestitures | | | | (3,924 | ) | | | | | (563 | ) | |
Additions** | | | | 4,834 | | | | | 4,889 | |
|
December 31, 2007 | | | | 192,408 | | | | | 56,907 | |
Amortization expense | | | | - | | | | | (8,229 | ) | |
Impairment | | | | - | | | | | (4,034 | ) | |
Divestitures | | | | - | | | | | (32 | ) | |
Additions | | | | - | | | | | 470 | |
|
December 31, 2008 | | | $ | | 192,408 | | | | $ | | 45,082 | |
|
|
* | | | | Represents customer lists, acquired contracts, premium on purchased deposits, and covenants not to compete. |
|
** | | | | Preliminary purchase price allocations on acquisitions are based upon estimates of fair value and are subject to change. |
The gross carrying amount of other intangible assets subject to amortization is $133.6 million on December 31, 2008, net of $88.6 million of accumulated amortization. Estimated aggregate amortization expense is expected to be $6.1 million, $5.9 million, $5.6 million, $4.2 million and $3.9 million for the twelve- month periods of 2009, 2010, 2011, 2012 and 2013, respectively.
In 2008, FHN recognized $4.0 million of intangible impairments. The impairments were related to noncompete agreements associated with the divestiture of certain mortgage banking operations and the write-off of state banking licenses due to FHN’s focus on the Tennessee regional banking market.
In 2007, FHN recorded $13.0 million of goodwill impairment and a write-down of $.9 million of core deposit intangibles primarily related to the sale of certain First Horizon Bank branches. Following an updated valuation based on strategic cash flow projections and market-to-book values, FHN incurred a fourth quarter 2007 non-cash pre-tax impairment charge of $71.1 million for the write-down of goodwill associated with the Mortgage Banking business segment. FHN engaged an independent valuation firm to assist in computing the fair value estimate for the impairment assessment by utilizing two separate valuation methodologies and applying a weighted average to each methodology in order to determine fair value for the Mortgage Banking business segment. The valuation methodologies utilized included a comparison of the average price to book value of comparable businesses and a discounted cash flow valuation technique.
91
FIRST HORIZON NATIONAL CORPORATION
Note 7 q Intangible Assets (continued)
The following is a summary of goodwill detailed by reportable segments for the three years ended December 31:
| | | | | | | | |
(Dollars in thousands) | | Regional
Banking | | Mortgage
Banking | | Capital
Markets | | Total |
|
December 31, 2005 | | | $ | | 104,781 | | | | $ | | 61,593 | | | | $ | | 115,066 | | | | $ | | 281,440 | |
Divestitures | | | | (11,777 | ) | | | | | - | | | | | - | | | | | (11,777 | ) | |
Additions | | | | 1,272 | | | | | 4,647 | | | | | - | | | | | 5,919 | |
|
December 31, 2006 | | | | 94,276 | | | | | 66,240 | | | | $ | | 115,066 | | | | | 275,582 | |
Divestitures | | | | (3,924 | ) | | | | | - | | | | | - | | | | | (3,924 | ) | |
Impairment | | | | (13,010 | ) | | | | | (71,074 | ) | | | | | - | | | | | (84,084 | ) | |
Additions* | | | | - | | | | | 4,834 | | | | | - | | | | | 4,834 | |
|
December 31, 2007 | | | | 77,342 | | | | | - | | | | | 115,066 | | | | | 192,408 | |
|
December 31, 2008 | | | $ | | 77,342 | | | | $ | | - | | | | $ | | 115,066 | | | | $ | | 192,408 | |
|
|
* | | | | Preliminary purchase price allocations on acquisitions are based upon estimates of fair value and are subject to change. |
|
** | | | | There is no associated goodwill with the National Specialty Lending segment. |
Note 8 q Time Deposit Maturities
Following is a table of maturities for time deposits outstanding on December 31, 2008, which include “Certificates of deposit under $100,000 and other time” and “Certificates of deposit $100,000 and more”. “Certificates of deposit $100,000 and more” totaled $1.4 billion on December 31, 2008. Time deposits are included in “Interest-bearing” deposits on the Consolidated Statements of Condition.
| | |
(Dollars in thousands) | | |
|
2009 | | | $ | | 2,613,830 | |
2010 | | | | 344,924 | |
2011 | | | | 232,383 | |
2012 | | | | 159,390 | |
2013 | | | | 119,643 | |
2014 and after | | | | 206,710 | |
|
Total | | | $ | | 3,676,880 | |
|
92
FIRST HORIZON NATIONAL CORPORATION
Note 9 q Short-Term Borrowings
Short-term borrowings include federal funds purchased and securities sold under agreements to repurchase, commercial paper, trading liabilities and other borrowed funds.
Federal funds purchased and securities sold under agreements to repurchase and commercial paper generally have maturities of less than 90 days. Trading liabilities, which represent short positions in securities, are generally held for less than 90 days. Other short-term borrowings have original maturities of one year or less. On December 31, 2008, capital markets trading securities with a fair value of $60.6 million were pledged to secure other short-term borrowings.
The detail of these borrowings for the years 2008, 2007 and 2006 is presented in the following table:
| | | | | | | | |
(Dollars in thousands) | | Federal Funds
Purchased and
Securities Sold
Under Agreements
to Repurchase | | Commercial
Paper | | Trading
Liabilities | | Other
Short-term
Borrowings |
|
2008 | | | | | | | | |
Average balance | | | $ | | 3,409,496 | | | | $ | | 2,325 | | | | $ | | 702,407 | | | | $ | | 5,136,144 | |
Year-end balance | | | | 1,751,079 | | | | | 3,130 | | | | | 359,502 | | | | | 4,276,559 | |
Maximum month-end outstanding | | | | 6,433,001 | | | | | 3,355 | | | | | 1,503,348 | | | | | 6,461,018 | |
Average rate for the year | | | | 2.04 | % | | | | | 2.79 | % | | | | | 4.73 | % | | | | | 2.33 | % | |
Average rate at year-end | | | | .25 | | | | | .51 | | | | | 4.82 | | | | | .79 | |
|
2007 | | | | | | | | |
Average balance | | | $ | | 4,853,599 | | | | $ | | 2,080 | | | | $ | | 950,555 | | | | $ | | 1,343,572 | |
Year-end balance | | | | 4,829,597 | | | | | 2,076 | | | | | 556,144 | | | | | 3,420,919 | |
Maximum month-end outstanding | | | | 6,167,114 | | | | | 2,659 | | | | | 1,360,764 | | | | | 3,420,919 | |
Average rate for the year | | | | 4.72 | % | | | | | 3.76 | % | | | | | 5.42 | % | | | | | 4.83 | % | |
Average rate at year-end | | | | 3.23 | | | | | 3.66 | | | | | 5.26 | | | | | 4.35 | |
|
2006 | | | | | | | | |
Average balance | | | $ | | 4,562,953 | | | | $ | | 2,704 | | | | $ | | 1,338,872 | | | | $ | | 792,280 | |
Year-end balance | | | | 4,961,799 | | | | | 5,619 | | | | | 789,957 | | | | | 1,252,894 | |
Maximum month-end outstanding | | | | 6,000,299 | | | | | 5,619 | | | | | 1,542,381 | | | | | 1,252,894 | |
Average rate for the year | | | | 4.58 | % | | | | | 2.29 | % | | | | | 5.68 | % | | | | | 5.05 | % | |
Average rate at year-end | | | | 4.67 | | | | | 3.99 | | | | | 5.87 | | | | | 5.01 | |
|
93
FIRST HORIZON NATIONAL CORPORATION
Note 10 q Long-Term Debt
The following table presents information pertaining to long-term debt (debt with original maturities greater than one year) for FHN and its subsidiaries on December 31:
| | | | |
(Dollars in thousands) | | 2008 | | 2007 |
|
First Tennessee Bank National Association: | | | | |
Subordinated notes (qualifies for total capital under the Risk-Based Capital guidelines): | | | | |
Matures on January 15, 2015 – 5.05% | | | $ | | 454,055 | | | | $ | | 405,553 | |
Matures on May 15, 2013 – 4.625% | | | | 280,801 | | | | | 258,745 | |
Matured on December 1, 2008 – 5.75% | | | | - | | | | | 140,836 | |
Matured on April 1, 2008 – 6.40% | | | | - | | | | | 89,982 | |
Matures on April 1, 2016 – 5.65% | | | | 297,652 | | | | | 261,890 | |
Bank notes (a) | | | | 2,471,164 | | | | | 3,144,764 | |
Extendible notes – 5.05% on December 31, 2007 | | | | - | | | | | 1,249,818 | |
Other collateralized borrowings – Matures on December 22, 2037 (b)
2.30% on December 31, 2008 and 5.29% on December 31, 2007 | | | | 48,855 | | | | | 42,997 | |
Federal Home Loan Bank borrowings (c) | | | | 3,354 | | | | | 3,700 | |
FIN 46 trust preferred debt (d)
6.53% on December 31, 2008 and 6.35% on December 31, 2007 | | | | 30,500 | | | | | 10,000 | |
First Horizon National Corporation: | | | | |
Subordinated capital notes (qualifies for total capital under the Risk-Based Capital guidelines): | | | | |
Matures on May 15, 2013 – 4.50% | | | | 112,243 | | | | | 103,524 | |
Subordinated notes (Note 11): | | | | |
Matures on January 6, 2027 – 8.07% | | | | 107,765 | | | | | 104,723 | |
Matures on April 15, 2034 – 6.30% | | | | 219,274 | | | | | 209,010 | |
FT Real Estate Securities Company, Inc. | | | | |
Cumulative preferred stock (qualifies for total capital under the Risk-Based Capital guidelines): | | | | |
Matures on March 31, 2031 – 9.50% | | | | 45,489 | | | | | 45,421 | |
First Horizon ABS Trust | | | | |
Other collateralized borrowings (e) | | | | |
Matures on October 25, 2034
0.60% on December 31, 2008 and 4.76% on December 31, 2007 | | | | 179,114 | | | | | 196,314 | |
Matures on October 26, 2026
0.57% on December 31, 2008 and 4.73% on December 31, 2007 | | | | 253,438 | | | | | 277,838 | |
Matures on September 25, 2029
0.57% on December 31, 2008 and 4.73% on December 31, 2007 | | | | 263,956 | | | | | 283,302 | |
|
Total | | | $ | | 4,767,660 | | | | $ | | 6,828,417 | |
|
|
(a) | | | | The bank notes were issued with variable interest rates and have remaining terms of 1 to 3 years. These bank notes had weighted average interest rates of 2.58 percent and 5.05 percent on December 31, 2008 and 2007, respectively. |
|
(b) | | | | Secured by $49.0 million of trust preferred loans. |
|
(c) | | | | The Federal Home Loan Bank (FHLB) borrowings were issued with fixed interest rates and have remaining terms of 1 to 21 years. These borrowings had weighted average interest rates of 2.70 percent and 2.98 percent on December 31, 2008 and 2007, respectively. |
|
(d) | | | | See Note 25 – Variable Interest Entities for further details. |
|
(e) | | | | Secured by $715.0 million of retail real estate residential loans. See Note 24 – Loan Sales and Securitizations for further details. |
Annual principal repayment requirements as of December 31, 2008, are as follows:
| | |
(Dollars in thousands) | | |
|
2009 | | | $ | | 1,560,608 | |
2010 | | | | 148,648 | |
2011 | | | | 762,598 | |
2012 | | | | 148 | |
2013 | | | | 350,148 | |
2014 and after | | | | 1,784,574 | |
|
94
FIRST HORIZON NATIONAL CORPORATION
Note 10 q Long-Term Debt (continued)
All subordinated notes are unsecured and are subordinate to other present and future senior indebtedness. FTBNA’s subordinated notes and FHN’s subordinated capital notes qualify as Tier 2 capital under the risk-based capital guidelines. Prior to February 2005, FTBNA had a bank note program under which the bank was able to borrow funds from time to time at maturities of 30 days to 30 years. This bank note program was terminated in connection with the establishment of a new program. That termination did not affect any previously issued notes outstanding. In February 2005, FTBNA established a new bank note program providing additional liquidity of $5.0 billion. This bank note program provides FTBNA with a facility under which it may continuously issue and offer short- and medium-term unsecured notes. On December 31, 2008, $1.6 billion was available under current conditions by the terms of the bank note program. During 2008 and continuing into early 2009, market and other conditions have been such that FTBNA has not been able to utilize the bank note program, and instead has obtained less credit sensitive sources of funding including secured sources such as Federal Home Loan Bank borrowings and the Federal Reserve Term Auction Facility. FTBNA expects that its inability to use the bank note program will continue for some time to come, and cannot predict when that inability will end.
Note 11 q Guaranteed Preferred Beneficial Interests in First Horizon’s Junior Subordinated Debentures
On December 30, 1996, FHN, through its underwriter, sold $100 million of capital securities. First Tennessee Capital I (Capital I), a Delaware business trust wholly owned by FHN, issued $100 million of Capital Securities, Series A at 8.07 percent. The proceeds were loaned to FHN as junior subordinated debt. FHN has, through various contractual arrangements, fully and unconditionally guaranteed all of Capital I’s obligations with respect to the capital securities. The sole asset of Capital I is $103 million of junior subordinated debentures issued by FHN. These junior subordinated debentures also carry an interest rate of 8.07 percent. Both the capital securities of Capital I and the junior subordinated debentures of FHN will mature on January 6, 2027; however, under certain circumstances, the maturity of both may be shortened to a date not earlier than January 6, 2017. The capital securities qualify as Tier 1 capital. The junior subordinated debentures are included in the Consolidated Statements of Condition in “Long-term debt” (see Note 10 – Long-Term Debt).
On March 29, 2004, FHN, through its underwriter, sold $200 million of capital securities. First Tennessee Capital II (Capital II), a Delaware business trust wholly owned by FHN, issued $200 million of Capital Securities, Series B at 6.30 percent. The proceeds were loaned to FHN as junior subordinated debt. FHN has, through various contractual arrangements, fully and unconditionally guaranteed all of Capital II’s obligations with respect to the capital securities. The sole asset of Capital II is $206 million of junior subordinated debentures issued by FHN. These junior subordinated debentures also carry an interest rate of 6.30 percent. Both the capital securities of Capital II and the junior subordinated debentures of FHN will mature on April 15, 2034; however, under certain circumstances, the maturity of both may be shortened to a date not earlier than April 15, 2009. The capital securities qualify as Tier 1 capital. The junior subordinated debentures are included in the Consolidated Statements of Condition in “Long-term debt” (see Note 10 – Long-Term Debt).
Note 12 q Preferred Stock and Other Capital
FHN Preferred Stock and Warrant
On November 14, 2008, FHN issued and sold 866,540 preferred shares of Fixed Rate Cumulative Perpetual Preferred Stock, Series CPP, along with a Warrant to purchase common stock. The issuance occurred in connection with, and is governed by, the Treasury Capital Purchase Program administered by the U.S. Treasury under the Troubled Asset Relief Program (“TARP”). The Preferred Shares have an annual 5% cumulative preferred dividend rate, payable quarterly. The dividend rate increases to 9% after five years. Dividends compound if they accrue in arrears. The Board has approved and FHN paid the 5% dividend on the CPP preferred on February 15, 2009. Preferred Shares have a liquidation preference of $1,000 per share plus accrued dividends. The Preferred Shares have no redemption date and are not subject to any sinking fund. The Preferred Shares carry certain restrictions. The Preferred Shares have a senior rank and also provides limitations on certain compensation arrangements of executive officers. During the first three years, FHN may not reinstate a cash dividend on its common shares nor purchase equity shares without the approval of the U.S. Treasury, subject to certain limited
95
FIRST HORIZON NATIONAL CORPORATION
Note 12 q Preferred Stock and Other Capital (continued)
exceptions. FHN may not reinstate a cash dividend on its common shares to the extent preferred dividends remain unpaid. Generally, the Preferred Shares are non-voting. However, should FHN fail to pay six quarterly dividends, the holder may elect two directors to FHN’s Board of Directors until such dividends are paid. In connection with the issuance of the Preferred Shares, a Warrant to purchase 12,743,235 common shares was issued with an exercise price of $10.20 per share. The Warrant is immediately exercisable and expires in ten years. The Warrant is subject to a proportionate anti-dilution adjustment in the event of stock dividends or splits, among other things. As a result of the 1.837% stock dividend distributed on January 1, 2009, the Warrant was adjusted to cover 12,977,328 common shares at a purchase price of $10.02 per share.
The Preferred Shares and Warrant qualify as Tier 1 capital and are presented in permanent equity on the Consolidated Statement of Condition in the amounts of $782.7 million and $83.9 million, respectively.
Subsidiary Preferred Stock
On September 14, 2000, FT Real Estate Securities Company, Inc. (FTRESC), an indirect subsidiary of FHN, issued 50 shares of 9.50% Cumulative Preferred Stock, Class B (Class B Preferred Shares), with a liquidation preference of $1.0 million per share. An aggregate total of 47 Class B Preferred Shares have been sold privately to nonaffiliates. These securities qualify as Tier 2 capital and are presented in the Consolidated Statements of Condition as “Long-term debt”. FTRESC is a real estate investment trust (REIT) established for the purpose of acquiring, holding and managing real estate mortgage assets. Dividends on the Class B Preferred Shares are cumulative and are payable semi-annually.
The Class B Preferred Shares are mandatorily redeemable on March 31, 2031, and redeemable at the discretion of FTRESC in the event that the Class B Preferred Shares cannot be accounted for as Tier 2 regulatory capital or there is more than an insubstantial risk that dividends paid with respect to the Class B Preferred Shares will not be fully deductible for tax purposes. They are not subject to any sinking fund and are not convertible into any other securities of FTRESC, FHN or any of its subsidiaries. The shares are, however, automatically exchanged at the direction of the Office of the Comptroller of the Currency for preferred stock of FTBNA, having substantially the same terms as the Class B Preferred Shares in the event FTBNA becomes undercapitalized, insolvent or in danger of becoming undercapitalized.
The following indirect, wholly-owned subsidiaries of FHN have also issued preferred stock. First Horizon Preferred Funding, LLC and First Horizon Preferred Funding II, LLC have each issued $1.0 million of Class B Preferred Units. Additionally, FHTRS, Inc. has issued $310.1 million of Class A Preferred Shares. On December 31, 2008 and 2007, the amount of Class B Preferred Shares and Units that are perpetual in nature that was recognized as “Preferred stock of subsidiary” on the Consolidated Statements of Condition was $.3 million and $.5 million, respectively. The remaining balance has been eliminated in consolidation.
On March 23, 2005, FTBNA issued 300,000 shares of Class A Non-Cumulative Perpetual Preferred Stock (Class A Preferred Stock) with a liquidation preference of $1,000 per share. These securities qualify as Tier 1 capital. On December 31, 2008 and 2007, $294.8 million of Class A Preferred Stock was recognized as “Preferred stock of subsidiary” on the Consolidated Statements of Condition.
Note 13 q Regulatory Capital
FHN is subject to various regulatory capital requirements administered by the federal banking agencies. Failure to meet minimum capital requirements can initiate certain mandatory, and possibly additional discretionary actions by regulators that, if undertaken, could have a direct material effect on FHN’s financial statements. Under capital adequacy guidelines and the regulatory framework for prompt corrective action, specific capital guidelines that involve quantitative measures of assets, liabilities and certain derivatives as calculated under regulatory accounting practices must be met. Capital amounts and classification are also subject to qualitative judgment by the regulators about components, risk weightings and other factors. Quantitative measures established by regulation to ensure capital adequacy require FHN to maintain minimum amounts and ratios of total and Tier 1 capital to risk-weighted
96
FIRST HORIZON NATIONAL CORPORATION
Note 13 q Regulatory Capital (continued)
assets, and of Tier 1 capital to average assets (leverage). Management believes, as of December 31, 2008, that FHN met all capital adequacy requirements to which it was subject.
The actual capital amounts and ratios of FHN and FTBNA are presented in the table below. In addition, FTBNA must also calculate its capital ratios after excluding financial subsidiaries as defined by the Gramm-Leach-Bliley Act of 1999. Based on this calculation FTBNA’s Total Capital, Tier 1 Capital and Leverage ratios were 18.21 percent, 13.87 percent and 11.42 percent, respectively, on December 31, 2008, and were 11.43 percent, 7.45 percent and 6.21 percent, respectively, on December 31, 2007.
| | | | | | | | |
(Dollars in thousands) | | First Horizon National
Corporation | | First Tennessee Bank
National Association |
| | Amount | | Ratio | | Amount | | Ratio |
|
On December 31, 2008: | | | | | | | | |
Actual: | | | | | | | | |
Total Capital | | | $ | | 5,083,609 | | | | | 20.18 | % | | | | $ | | 4,794,737 | | | | | 19.21 | % | |
Tier 1 Capital | | | | 3,784,152 | | | | | 15.03 | | | | | 3,578,078 | | | | | 14.34 | |
Leverage | | | | 3,784,152 | | | | | 12.22 | | | | | 3,578,078 | | | | | 11.64 | |
For Capital Adequacy Purposes: | | | | | | | | |
Total Capital | | | | 2,014,829 | ≥ | | | | | 8.00 | | | | | 1,996,781 | ≥ | | | | | 8.00 | |
Tier 1 Capital | | | | 1,007,415 | ≥ | | | | | 4.00 | | | | | 998,391 | ≥ | | | | | 4.00 | |
Leverage | | | | 1,238,942 | ≥ | | | | | 4.00 | | | | | 1,229,693 | ≥ | | | | | 4.00 | |
To Be Well Capitalized Under Prompt Corrective Action Provisions: | | | | | | | | |
Total Capital | | | | | | | | 2,495,976 | ≥ | | | | | 10.00 | |
Tier 1 Capital | | | | | | | | 1,497,586 | ≥ | | | | | 6.00 | |
Leverage | | | | | | | | 1,537,116 | ≥ | | | | | 5.00 | |
|
On December 31, 2007: | | | | | | | | |
Actual: | | | | | | | | |
Total Capital | | | $ | | 3,860,056 | | | | | 12.75 | % | | | | $ | | 3,634,308 | | | | | 12.10 | % | |
Tier 1 Capital | | | | 2,459,528 | | | | | 8.12 | | | | | 2,333,781 | | | | | 7.77 | |
Leverage | | | | 2,459,528 | | | | | 6.64 | | | | | 2,333,781 | | | | | 6.35 | |
For Capital Adequacy Purposes: | | | | | | | | |
Total Capital | | | | 2,421,751 | ≥ | | | | | 8.00 | | | | | 2,401,999 | ≥ | | | | | 8.00 | |
Tier 1 Capital | | | | 1,210,876 | ≥ | | | | | 4.00 | | | | | 1,201,000 | ≥ | | | | | 4.00 | |
Leverage | | | | 1,480,820 | ≥ | | | | | 4.00 | | | | | 1,468,946 | ≥ | | | | | 4.00 | |
To Be Well Capitalized Under Prompt Corrective Action Provisions: | | | | | | | | |
Total Capital | | | | | | | | 3,002,499 | ≥ | | | | | 10.00 | |
Tier 1 Capital | | | | | | | | 1,801,499 | ≥ | | | | | 6.00 | |
Leverage | | | | | | | | 1,836,182 | ≥ | | | | | 5.00 | |
|
97
FIRST HORIZON NATIONAL CORPORATION
Note 14 q Other Income and Other Expense
Following is detail concerning “All other income and commissions” and “All other expense” as presented in the Consolidated Statements of Income:
| | | | | | |
(Dollars in thousands) | | 2008 | | 2007 | | 2006 |
|
All other income and commissions: | | | | | | |
Brokerage management fees and commissions | | | $ | | 32,234 | | | | $ | | 37,830 | | | | $ | | 37,182 | |
Bank-owned life insurance | | | | 25,143 | | | | | 25,172 | | | | | 19,064 | |
Bankcard income | | | | 22,081 | | | | | 24,874 | | | | | 26,105 | |
Other service charges | | | | 12,630 | | | | | 14,296 | | | | | 14,561 | |
Remittance processing | | | | 12,953 | | | | | 13,451 | | | | | 14,737 | |
Reinsurance fees | | | | 11,919 | | | | | 9,052 | | | | | 6,792 | |
ATM interchange fees | | | | 9,224 | | | | | 8,472 | | | | | 7,091 | |
Deferred compensation (a) | | | | (22,901 | ) | | | | | 7,727 | | | | | 14,647 | |
Letter of credit fees | | | | 5,657 | | | | | 6,738 | | | | | 7,271 | |
Electronic banking fees | | | | 6,217 | | | | | 6,561 | | | | | 5,975 | |
Check clearing fees | | | | 3,125 | | | | | 4,896 | | | | | 6,385 | |
Federal flood certifications | | | | 3,645 | | | | | 4,797 | | | | | 4,996 | |
Gain on repurchases of debt | | | | 33,845 | | | | | - | | | | | - | |
Other | | | | 12,662 | | | | | 6,520 | | | | | 5,636 | |
|
Total | | | $ | | 168,434 | | | | $ | | 170,386 | | | | $ | | 170,442 | |
|
All other expense: | | | | | | |
Computer software | | | $ | | 30,389 | | | | $ | | 53,942 | | | | $ | | 34,381 | |
Advertising and public relations | | | | 33,014 | | | | | 42,346 | | | | | 47,427 | |
Travel and entertainment | | | | 17,371 | | | | | 26,099 | | | | | 32,306 | |
Contract employment | | | | 33,545 | | | | | 21,543 | | | | | 27,420 | |
Low income housing expense | | | | 18,734 | | | | | 20,922 | | | | | 17,027 | |
Distributions on preferred stock of subsidiary | | | | 13,989 | | | | | 18,799 | | | | | 18,146 | |
Foreclosed real estate | | | | 33,002 | | | | | 16,048 | | | | | 4,384 | |
Supplies | | | | 10,740 | | | | | 13,909 | | | | | 15,072 | |
Loan closing costs | | | | 38,221 | | | | | 12,783 | | | | | 12,095 | |
Customer relations | | | | 8,875 | | | | | 9,801 | | | | | 8,688 | |
Other insurance and taxes | | | | 6,848 | | | | | 8,841 | | | | | 8,615 | |
Employee training and dues | | | | 6,286 | | | | | 6,562 | | | | | 6,917 | |
Fed service fees | | | | 7,053 | | | | | 6,047 | | | | | 6,543 | |
Complimentary check expense | | | | 4,776 | | | | | 5,058 | | | | | 5,371 | |
Loan insurance expense | | | | 5,270 | | | | | 4,610 | | | | | 6,577 | |
Bank examinations costs | | | | 4,144 | | | | | 4,504 | | | | | 4,367 | |
Deposit insurance premium | | | | 14,664 | | | | | 3,327 | | | | | 3,198 | |
Other (b) (c) | | | | 56,893 | | | | | 126,037 | | | | | 92,086 | |
|
Total | | | $ | | 343,814 | | | | $ | | 401,178 | | | | $ | | 350,620 | |
|
Certain previously reported amounts have been reclassified to agree with current presentation.
|
(a) | | | | Deferred compensation market value adjustments are offset by a reduction to noninterest other expense. |
|
(b) | | | | Includes a portion of net charges for restructuring, repositioning, and efficiency initiatives (Note 27). |
|
(c) | | | | 2008 includes a net $30.0 million reversal of expense related to Visa litigation matters for which FHN is contingently liable. 2007 includes a $55.7 million charge related to this matter. |
98
FIRST HORIZON NATIONAL CORPORATION
Note 15 q Components of Other Comprehensive Income/(loss)
Following is detail of “Accumulated other comprehensive income/(loss)” as presented in the Consolidated Statements of Condition:
| | | | | | |
(Dollars in thousands) | | Before-
Tax
Amount | | Tax
Benefit/
(Expense) | | Accumulated
Other
Comprehensive
Income/(Loss) |
|
December 31, 2005 | | | $ | | (52,892 | ) | | | | $ | | 20,576 | | | | $ | | (42,244 | ) | |
Other comprehensive income: | | | | | | |
Unrealized market adjustments on cash flow hedge | | | | 684 | | | | | (257 | ) | | | | | 427 | |
Minimum pension liability | | | | (316 | ) | | | | | 119 | | | | | (197 | ) | |
Unrealized market adjustments on securities available for sale | | | | 10,021 | | | | | (3,898 | ) | | | | | 6,123 | |
Adjustment for net losses included in net income | | | | 65,629 | | | | | (25,528 | ) | | | | | 40,101 | |
| | |
Total other comprehensive income/(loss) | | | | 76,018 | | | | | (29,564 | ) | | | | $ | | 46,454 | |
Adjustment to initially apply SFAS No. 158 | | | | (122,587 | ) | | | | | 45,929 | | | | | (76,658 | ) | |
| | |
December 31, 2006 | | | $ | | (46,569 | ) | | | | $ | | 16,365 | | | | $ | | (72,448 | ) | |
| | |
Effects of changing pension plan measurement date pursuant to SFAS No. 158 | | | | | | |
Amortization of prior service cost, transition asset/obligation, and net actuarial gain/(loss) for October 1 – December 31 | | | $ | | 2,204 | | | | $ | | (838 | ) | | | | $ | | 1,366 | |
Additional actuarial gain/(loss) for October 1 – December 31 | | | | 11,419 | | | | | (4,475 | ) | | | | | 6,944 | |
| | |
Beginning balance, as adjusted | | | | 13,623 | | | | | (5,313 | ) | | | | | (64,138 | ) | |
Other comprehensive income: | | | | | | |
Unrealized market adjustments on cash flow hedge | | | | (551 | ) | | | | | 207 | | | | | (344 | ) | |
Unrealized market adjustments on securities available for sale | | | | 21,240 | | | | | (8,263 | ) | | | | | 12,977 | |
Adjustment for net gains/(losses) included in net income | | | | 1,183 | | | | | (460 | ) | | | | | 723 | |
Pension and postretirement plans: | | | | | | |
Prior service cost arising during period | | | | (152 | ) | | | | | 57 | | | | | (95 | ) | |
Net actuarial gain/(loss) arising during period | | | | (4,164 | ) | | | | | 1,880 | | | | | (2,284 | ) | |
Amortization of prior service cost, transition asset/obligation, and net actuarial gain/(loss) included in net periodic benefit cost | | | | 8,119 | | | | | (3,059 | ) | | | | | 5,060 | |
| | |
December 31, 2007 | | | $ | | 25,675 | | | | $ | | (9,638 | ) | | | | $ | | (48,101 | ) | |
| | |
Other comprehensive income: | | | | | | |
Unrealized market adjustments on cash flow hedge | | | | (10 | ) | | | | | 4 | | | | | (6 | ) | |
Unrealized market adjustments on securities available for sale | | | | 35,863 | | | | | (13,882 | ) | | | | | 21,981 | |
Adjustment for net gains/(losses) included in net income | | | | (210 | ) | | | | | 81 | | | | | (129 | ) | |
Pension and postretirement plans: | | | | | | |
Prior service cost arising during period | | | | (59 | ) | | | | | 22 | | | | | (37 | ) | |
Net actuarial gain/(loss) arising during period | | | | (208,158 | ) | | | | | 80,198 | | | | | (127,960 | ) | |
Amortization of prior service cost, transition asset/obligation, and net actuarial gain/(loss) included in net periodic benefit cost | | | | 3,913 | | | | | (1,492 | ) | | | | | 2,421 | |
| | |
December 31, 2008 | | | $ | | (168,661 | ) | | | | $ | | 64,931 | | | | $ | | (151,831 | ) | |
| | |
99
FIRST HORIZON NATIONAL CORPORATION
Note 16 q Income Taxes
The components of income tax expense/(benefit) are as follows:
| | | | | | |
(Dollars in thousands) | | 2008 | | 2007 | | 2006 |
|
Current: | | | | | | |
Federal | | | $ | | 237,894 | | | | $ | | 73,063 | | | | $ | | (3,965 | ) | |
State | | | | 16,722 | | | | | 1,500 | | | | | (11,495 | ) | |
Deferred: | | | | | | |
Federal | | | | (373,335 | ) | | | | | (178,879 | ) | | | | | 92,291 | |
State | | | | (38,095 | ) | | | | | (36,415 | ) | | | | | 10,447 | |
|
Total | | | $ | | (156,814 | ) | | | | $ | | (140,731 | ) | | | | $ | | 87,278 | |
|
The effective tax rates for 2008, 2007 and 2006 were 44.85 percent, 44.59 percent and 25.82 percent, respectively. Income tax expense was different than the amounts computed by applying the statutory federal income tax rate to income before income taxes because of the following:
| | | | | | |
(Dollars in thousands) | | 2008 | | 2007 | | 2006 |
|
Federal income tax rate | | 35% | | 35% | | 35% |
|
Tax computed at statutory rate | | | $ | | (122,380 | ) | | | | $ | | (110,463 | ) | | | | $ | | 118,328 | |
Increase/(decrease) resulting from: | | | | | | |
State income taxes | | | | (13,884 | ) | | | | | (22,278 | ) | | | | | (681 | ) | |
Tax credits | | | | (19,064 | ) | | | | | (20,332 | ) | | | | | (18,340 | ) | |
Goodwill | | | | - | | | | | 20,058 | | | | | - | |
Other | | | | (1,486 | ) | | | | | (7,716 | ) | | | | | (12,029 | ) | |
|
Total | | | $ | | (156,814 | ) | | | | $ | | (140,731 | ) | | | | $ | | 87,278 | |
|
A deferred tax asset or liability is recognized for the tax consequences of temporary differences between the financial statement carrying amounts and the tax bases of existing assets and liabilities. The tax consequence is calculated by applying enacted statutory tax rates, applicable to future years, to these temporary differences. The deferred tax assets above are net of an immaterial valuation allowance due to capital losses and a full valuation reserve against miscellaneous state net operating losses. Other than these items, no valuation allowance related to deferred tax assets has been recorded on December 31, 2008 and 2007, as management believes it is more likely than not that the remaining deferred tax assets will be fully realized because of future reversals of existing temporary differences, future taxable income exclusive of reversing temporary differences, and taxable income in prior carryback years. In 2008 and 2007, FHN paid in excess of $300 million in taxes. Additionally, FHN expects to utilize prior taxable income in the allowable two-year carryback period. Temporary differences which gave rise to deferred tax (assets)/liabilities on December 31, 2008 and 2007, were as follows:
| | | | |
(Dollars in thousands) | | 2008 | | 2007 |
|
Deferred tax assets: | | | | |
Loss reserves | | | $ | | (335,171 | ) | | | | $ | | (143,130 | ) | |
Employee benefits | | | | (115,292 | ) | | | | | (103,586 | ) | |
Accrued expenses | | | | (27,054 | ) | | | | | (33,796 | ) | |
Other | | | | (16,148 | ) | | | | | (19,188 | ) | |
|
Gross deferred tax assets | | | | (493,665 | ) | | | | | (299,700 | ) | |
|
Deferred tax liabilities: | | | | |
Capitalized mortgage servicing rights | | | | 134,210 | | | | | 427,298 | |
Asset securitizations | | | | 12,976 | | | | | 14,439 | |
Depreciation and amortization | | | | 20,817 | | | | | 32,695 | |
Federal Home Loan Bank stock | | | | 17,092 | | | | | 16,135 | |
Deferred fees and expenses | | | | 8,835 | | | | | 18,970 | |
Investment in debt securities (SFAS No. 115) | | | | 26,938 | | | | | 13,027 | |
Other intangible assets | | | | 21,870 | | | | | 5,365 | |
Other | | | | - | | | | | 8,835 | |
|
Gross deferred tax liabilities | | | | 242,738 | | | | | 536,764 | |
|
Net deferred tax (assets) liabilities | | | $ | | (250,927 | ) | | | | $ | | 237,064 | |
|
Certain previously reported amounts have been reclassified to agree with current presentation. | | | | |
100
FIRST HORIZON NATIONAL CORPORATION
Note 16 q Income Taxes (continued)
The total balance of unrecognized tax benefits at December 31, 2008, was $31.1 million. The rollforward of unrecognized tax benefits follows:
| | |
(Dollars in thousands) | | |
|
Balance at January 1, 2008 | | | $ | | 31,560 | |
Increases related to prior year tax positions | | | | - | |
Decreases related to prior year tax positions | | | | - | |
Increases related to current year tax positions | | | | 4,040 | |
Settlements | | | | (1,525 | ) | |
Lapse of statute | | | | (2,967 | ) | |
|
Balance at December 31, 2008 | | | $ | | 31,108 | |
|
Note 17 q Earnings per Share
The following table shows a reconciliation of the numerators used in calculating earnings per share:
| | | | | | |
(In thousands, except per share data) | | 2008 | | 2007 | | 2006 |
|
Net income/(loss) from continuing operations | | | $ | | (192,843 | ) | | | | $ | | (174,876 | ) | | | | $ | | 250,802 | |
Income from discontinued operations, net of tax | | | | 883 | | | | | 4,765 | | | | | 210,767 | |
Cumulative effect of changes in accounting principle, net of tax | | | | - | | | | | - | | | | | 1,345 | |
|
Net income/(loss) | | | $ | | (191,960 | ) | | | | $ | | (170,111 | ) | | | | $ | | 462,914 | |
|
Net income/(loss) from continuing operations | | | $ | | (192,843 | ) | | | | $ | | (174,876 | ) | | | | $ | | 250,802 | |
Preferred stock dividends | | | | 7,413 | | | | | - | | | | | - | |
|
Net income/(loss) from continuing operations available to common shareholders | | | $ | | (200,256 | ) | | | | $ | | (174,876 | ) | | | | $ | | 250,802 | |
|
Net income/(loss) | | | $ | | (191,960 | ) | | | | $ | | (170,111 | ) | | | | $ | | 462,914 | |
Preferred stock dividends | | | | 7,413 | | | | | - | | | | | - | |
|
Net income/(loss) available to common shareholders | | | $ | | (199,373 | ) | | | | $ | | (170,111 | ) | | | | $ | | 462,914 | |
|
The following table provides a reconciliation of weighted average common to diluted shares:
| | | | | | |
(In thousands, except per share data) | | 2008 | | 2007 | | 2006 |
|
Weighted average common shares | | | $ | | 180,711 | | | | $ | | 132,078 | | | | $ | | 130,619 | |
Effect of dilutive securities | | | | - | | | | | - | | | | | 3,702 | |
|
Diluted average common shares | | | $ | | 180,711 | | | | $ | | 132,078 | | | | $ | | 134,321 | |
|
The following tables provide a reconciliation of earnings per share from continuing operations: |
Earnings/(loss) per common share from continuing operations: | | | | | | |
Net income/(loss) from continuing operations | | | $ | | (1.07 | ) | | | | $ | | (1.32 | ) | | | | $ | | 1.92 | |
Preferred stock dividends | | | | (.04 | ) | | | | | - | | | | | - | |
|
Earnings/(loss) per common share from continuing operations | | | $ | | (1.11 | ) | | | | $ | | (1.32 | ) | | | | $ | | 1.92 | |
|
Diluted earnings/(loss) per common share from continuing operations: | | | | | | |
Net income/(loss) from continuing operations | | | $ | | (1.07 | ) | | | | $ | | (1.32 | ) | | | | $ | | 1.87 | |
Preferred stock dividends | | | | (.04 | ) | | | | | - | | | | | - | |
|
Diluted earnings/(loss) per common share from continuing operations | | | $ | | (1.11 | ) | | | | $ | | (1.32 | ) | | | | $ | | 1.87 | |
|
101
FIRST HORIZON NATIONAL CORPORATION
Note 17 q Earnings per Share (continued)
The following table provides a reconciliation of earnings per share from net income available to common shareholders:
| | | | | | |
(In thousands, except per share data) | | 2008 | | 2007 | | 2006 |
|
Earnings/(loss) per common share: | | | | | | |
Net income/(loss) from continuing operations | | | $ | | (1.07 | ) | | | | $ | | (1.32 | ) | | | | $ | | 1.92 | |
Income from discontinued operations, net of tax | | | | .01 | | | | | .03 | | | | | 1.61 | |
Cumulative effect of changes in accounting principle, net of tax | | | | - | | | | | - | | | | | .01 | |
|
Net income/(loss) | | | | (1.06 | ) | | | | | (1.29 | ) | | | | | 3.54 | |
Preferred stock dividends | | | | (.04 | ) | | | | | - | | | | | - | |
|
Earnings/(loss) per common share | | | $ | | (1.10 | ) | | | | $ | | (1.29 | ) | | | | $ | | 3.54 | |
|
Diluted earnings/(loss) per common share: | | | | | | |
Net income/(loss) from continuing operations | | | $ | | (1.07 | ) | | | | $ | | (1.32 | ) | | | | $ | | 1.87 | |
Income from discontinued operations, net of tax | | | | .01 | | | | | .03 | | | | | 1.57 | |
Cumulative effect of changes in accounting principle, net of tax | | | | - | | | | | - | | | | | .01 | |
|
Net income/(loss) | | | | (1.06 | ) | | | | | (1.29 | ) | | | | | 3.45 | |
Preferred stock dividends | | | | (.04 | ) | | | | | - | | | | | - | |
|
Diluted earnings/(loss) per common share | | | $ | | (1.10 | ) | | | | $ | | (1.29 | ) | | | | $ | | 3.45 | |
|
Due to the net loss attributable to common shareholders for the twelve months ended December 31, 2008 and December 31, 2007, no potentially dilutive shares were included in the loss per share calculations as including such shares would have been antidilutive. Stock options of 17.3 million and 18.6 million with weighted average exercise prices of $32.25 and $33.07 per share for the twelve months ended December 31, 2008 and 2007, respectively, were not included in the computation of diluted loss per common share because such shares would have had an antidilutive effect on earnings per common share. Other equity awards of 1.0 million and .9 million for the twelve months ended December 31, 2008 and 2007, respectively, and 1.7 million potentially dilutive shares related to the CPP common stock Warrant were excluded from the computation of diluted loss per common share because such shares would have had an antidilutive effect on loss per common share. Outstanding stock options of 6.1 million with a weighted average exercise price of $41.06 per share for the year ended December 31, 2006, were not included in the computation of diluted earnings per share because such shares would have had an antidilutive effect on earnings per common share.
Note 18 q Restrictions, Contingencies and Other Disclosures
Restrictions on cash and due from banks. The commercial banking subsidiaries of FHN are required to maintain average reserve and clearing balances with the Federal Reserve Bank under the Federal Reserve Act and Regulation D. The balances required on December 31, 2008 and 2007, were $244.3 million and $258.5 million, respectively. These reserves are included in “Cash and due from banks” on the Consolidated Statements of Condition.
Restrictions on dividends. Cash dividends are paid by FHN from its assets, which are mainly provided by dividends from its subsidiaries. Certain regulatory restrictions exist regarding the ability of FTBNA to transfer funds to FHN in the form of cash, dividends, loans or advances. As of December 31, 2008, FTBNA had undivided profits of $1,600.6 million, none of which was available for distribution to FHN as dividends without prior regulatory approval. At any given time, the pertinent portions of those regulatory restrictions allow FTBNA to declare preferred or common dividends without prior regulatory approval in an amount equal to FTBNA’s retained net income for the two most recent completed years plus the current year to date. For any period, FTBNA’s ‘retained net income’ generally is equal to FTBNA’s regulatory net income reduced by the preferred and common dividends declared by FTBNA. Excess dividends in either of the two most recent completed years may be offset with available retained net income in the two years immediately preceding it. Applying the applicable rules, FTBNA’s total amount
102
FIRST HORIZON NATIONAL CORPORATION
Note 18 q Restrictions, Contingencies and Other Disclosures (continued)
available for dividends was ($222.1) million at December 31, 2008 and at January 1, 2009. Earnings (or losses) and dividends declared during 2009 will change the amount available during 2009 until December 31.
In addition, in 2008 FHN issued and sold preferred stock and a common stock warrant under the Treasury’s CPP. Under the terms of that issuance, FHN is not permitted to increase its cash common dividend rate for a period of three years without permission of the Treasury. At the time of the preferred shares and common stock warrant issuance, FHN did not pay a common cash dividend.
FTBNA has requested approval from the OCC to declare and pay dividends on its preferred stock outstanding payable in April 2009. FTBNA has not requested approval to pay common dividends to its sole common stockholder, FHN. FHN estimates that it will have sufficient cash available to pay the 5% dividend on the CPP preferred issued to the U.S. Treasury as well as its other current obligations throughout 2009 even if FTBNA were unable to pay a common dividend to FHN during the year.
Restrictions on intercompany transactions. Under Federal banking law, banking subsidiaries may not extend credit to the parent company in excess of 10 percent of the bank’s capital stock and surplus, as defined, or $520.9 million on December 31, 2008. The parent company had covered transactions of $4.5 million from FTBNA on December 31, 2008. In addition, the aggregate amount of covered transactions with all affiliates, as defined, is limited to 20 percent of the bank’s capital stock and surplus, or $1 billion on December 31, 2008. FTBNA’s total covered transactions with all affiliates including the parent company on December 31, 2008 were $484.3 million. Certain loan agreements also define other restricted transactions related to additional borrowings.
Contingencies. Contingent liabilities arise in the ordinary course of business, including those related to litigation. Various claims and lawsuits are pending against FHN and its subsidiaries. In view of the inherent difficulty of predicting the outcome of legal matters, particularly where the claimants seek very large or indeterminate damages, or where the cases present novel legal theories or involve a large number of parties, FHN cannot state with confidence what the eventual outcome of the pending matters will be, what the timing of the ultimate resolution of these matters will be, or what the eventual loss or impact related to each pending matter may be. FHN establishes loss contingency reserves for litigation matters when estimated loss is both probable and estimable as prescribed by applicable financial accounting guidance. A reserve generally is not established when a loss contingency either is not probable or its amount is not estimable. If loss for a matter is probable and a range of possible loss outcomes is the best estimate available, accounting guidance generally requires a reserve to be established at the low end of the range. Based on current knowledge, and after consultation with counsel, management is of the opinion that loss contingencies related to pending matters should not have a material adverse effect on the consolidated financial condition of FHN, but may be material to FHN’s operating results for any particular reporting period.
Other disclosures – Company Owned Life Insurance. FHN has purchased life insurance on certain of its employees and is the beneficiary on these policies. On December 31, 2008, the cash surrender value of these policies, which is included in “Other assets” on the Consolidated Statements of Condition, was $746.3 million. There are restrictions on $61.4 million of the proceeds from these benefits which relate to certain compensation plans. FHN has not borrowed against the cash surrender value of these policies.
Other disclosures – Indemnification agreements and guarantees. In the ordinary course of business, FHN enters into indemnification agreements for legal proceedings against its directors and officers and standard representations and warranties for underwriting agreements, merger and acquisition agreements, loan sales, contractual commitments, and various other business transactions or arrangements. The extent of FHN’s obligations under these agreements depends upon the occurrence of future events; therefore, it is not possible to estimate a maximum potential amount of payouts that could be required with such agreements.
FHN is a member of the Visa USA network. On October 3, 2007, the Visa organization of affiliated entities completed a series of global restructuring transactions to combine its affiliated operating companies, including Visa USA, under a single holding company, Visa Inc. (Visa). Upon completion of the reorganization, the members of the Visa USA network remained contingently liable for certain Visa litigation matters. Based on its proportionate membership share of Visa USA, FHN recognized a contingent liability of $55.7 million within noninterest expense in fourth quarter 2007 related to this contingent obligation.
103
FIRST HORIZON NATIONAL CORPORATION
Note 18 q Restrictions, Contingencies and Other Disclosures (continued)
In March 2008, Visa completed its initial public offering (IPO). Visa funded an escrow account from IPO proceeds that will be used to make payments related to the Visa litigation matters. Upon funding of the escrow, FHN reversed $30.0 million of the contingent liability previously recognized with a corresponding credit to noninterest expense for its proportionate share of the escrow account. A portion of FHN’s Class B shares of Visa were redeemed as part of the IPO resulting in $65.9 million of equity securities gains in first quarter 2008.
In October 2008, Visa announced that it had agreed to settle litigation with Discover Financial Services (Discover) for $1.9 billion. $1.7 billion of this settlement amount will be paid from the escrow account established as part of Visa’s IPO. In connection with this settlement, FHN recognized additional expense of $11.0 million within noninterest expense in third quarter 2008. In December 2008, Visa deposited additional funds into the escrow account and FHN recognized a corresponding credit to noninterest expense of $11.0 million for its proportionate share of the amount funded. As of December 31, 2008, FHN’s contingent liability for Visa litigation matters was $25.7 million.
After the partial share redemption in conjunction with the IPO, FHN holds approximately 2.4 million Class B shares of Visa, which are included in the Consolidated Statement of Condition at their historical cost of $0. Conversion of these shares into Class A shares of Visa and, with limited exceptions, transfer of these shares are restricted until the later of the third anniversary of the IPO and the final resolution of the covered litigation. The final conversion ratio, which is currently estimated to approximate 63 percent, will fluctuate based on the ultimate settlement of the Visa litigation matters for which FHN has a proportionate contingent obligation. Future funding of the escrow will dilute this exchange rate by an amount that is yet to be determined.
FHN services a mortgage loan portfolio of approximately $63.7 billion on December 31, 2008; a significant portion of which is held by GNMA, FNMA, FHLMC or private security holders. In connection with its servicing activities, FHN guarantees the receipt of the scheduled principal and interest payments on the underlying loans. In the event of customer non-performance on the loan, FHN is obligated to make the payment to the security holder. Under the terms of the servicing agreements, FHN can utilize payments received from other prepaid loans in order to make the security holder whole. In the event payments are ultimately made by FHN to satisfy this obligation, for loans sold with no recourse, all funds are recoverable from the government agency at foreclosure sale. See Note 24 – Loan Sales and Securitizations for additional information on loans sold with recourse.
FHN is also subject to losses in its loan servicing portfolio due to loan foreclosures and other recourse obligations. Certain agencies have the authority to limit their repayment guarantees on foreclosed loans resulting in certain foreclosure costs being borne by servicers. In addition, FHN has exposure on all loans sold with recourse. FHN has various claims for reimbursement, repurchase obligations, and/or indemnification requests outstanding with government agencies or private investors. FHN has evaluated all of its exposure under recourse obligations based on factors, which include loan delinquency status, foreclosure expectancy rates and claims outstanding. Accordingly, FHN had an allowance for losses on the mortgage servicing portfolio of approximately $37.0 million and $16.2 million on December 31, 2008 and 2007, respectively. FHN has sold certain mortgage loans with an agreement to repurchase the loans upon default. For the single-family residential loans, in the event of borrower nonperformance, FHN would assume losses to the extent they exceed the value of the collateral and private mortgage insurance, FHA insurance or VA guarantees. On December 31, 2008 and 2007, FHN had single-family residential loans with outstanding balances of $80.9 million and $102.8 million, respectively, that were serviced on a full recourse basis. On December 31, 2008 and 2007, the outstanding principal balance of loans sold with limited recourse arrangements where some portion of the principal is at risk and serviced by FHN was $3.5 billion and $3.3 billion, respectively. Additionally, on December 31, 2008 and 2007, $1.7 billion and $5.3 billion, respectively, of mortgage loans were outstanding which were sold under limited recourse arrangements where the risk is limited to interest and servicing advances.
FHN has securitized and sold HELOC and second-lien mortgages which are held by private security holders, and on December 31, 2008, the outstanding principal balance of these loans was $210.6 million and $54.9 million, respectively. On December 31, 2007, the outstanding principal balance of securitized and sold HELOC and second-lien mortgages was $264.1 million and $72.2 million, respectively. In connection with its servicing activities, FTBNA does not guarantee the receipt of the scheduled principal and interest payments on the underlying loans but does have residual interests of $8.2 million and $18.6 million on December 31, 2008 and 2007, respectively,
104
FIRST HORIZON NATIONAL CORPORATION
Note 18 q Restrictions, Contingencies and Other Disclosures (continued)
which are available to make the security holder whole in the event of credit losses. FHN has projected expected credit losses in the valuation of the residual interest.
In conjunction with the sale of its servicing platform to MetLife, FHN entered into a three year subservicing arrangement with MetLife for the remaining portion of its servicing portfolio. As part of the subservicing agreement, FHN has agreed to a make-whole arrangement whereby if the number of loans subserviced by MetLife and the direct servicing cost per loan (determined using loans serviced on behalf of both FHN and MetLife) both fall below specified levels, FHN will make a payment to MetLife according to a contractually specified formula. The make-whole payment is subject to a cap, which is $19.4 million if determined in the four quarters immediately following the transaction, and which declines to $15.0 million if triggered in later periods. As part of the divestiture transaction with MetLife, FHN recognized a contingent liability of $1.2 million representing the estimated fair value of its performance obligation under the make-whole arrangement.
Note 19 q Shareholder Protection Rights Agreement
On October 20, 1998, FHN adopted a Shareholder Protection Rights Agreement (the “Agreement”) and declared a dividend of one right on each outstanding share of common stock held on November 2, 1998, or issued thereafter and prior to the time the rights separate and thereafter pursuant to options and convertible securities outstanding at the time the rights separate.
The Agreement provides that until the earlier of the tenth business day (subject to certain adjustments by the board of directors) after a person or group commences a tender or exchange offer that will, subject to certain exceptions, result in such person or group owning 10 percent or more of FHN’s common stock, or the tenth business day (subject to certain adjustments by the board) after the public announcement by FHN that a person or group owns 10 percent or more of FHN’s common stock, the rights will be evidenced by the common stock certificates, will automatically trade with the common stock, and will not be exercisable. Thereafter, separate rights certificates will be distributed, and each right will entitle its holder to purchase one one-hundredth of a share of participating preferred stock having economic and voting terms similar to those of one share of common stock for an exercise price of $150.
If any person or group acquires 10 percent or more of FHN’s common stock, then each right (other than rights beneficially owned by holders of 10 percent or more of the common stock or affiliates, associates or transferees thereof, which rights become void) will entitle its holder to purchase, for the exercise price, a number of shares of FHN common stock or participating preferred stock having a market value of twice the exercise price. Also, if there is a 10 percent shareholder and FHN is involved in certain significant transactions, each right will entitle its holder to purchase, for the exercise price, a number of shares of common stock of the other party having a market value of twice the exercise price. If any person or group acquires 10 percent or more (but not more than 50 percent) of FHN’s common stock, FHN’s board of directors may, at its option, exchange one share of FHN common stock or one one-hundredth of a share of participating preferred stock for each right (other than rights which have become void). The board of directors may amend the Agreement in any respect prior to the tenth business day after announcement by FHN that a person or group has acquired 10 percent or more of FHN’s common stock. The rights will expire on the earliest of the following times: the time of the exchange described in the second preceding sentence; December 31, 2009; or the date the rights are redeemed as described in the following sentence. The rights may be redeemed by the board of directors for $0.001 per right until 10 business days after FHN announces that any person or group owns 10 percent or more of FHN’s common stock.
105
FIRST HORIZON NATIONAL CORPORATION
Note 20 q Savings, Pension and Other Employee Benefits
Savings plan.FHN has a contributory, qualified defined contribution plan that covers substantially all employees. Under this plan, employees can invest their money in any of the available investment funds and receive a company match of $.50 for each $1.00 invested up to 6 percent of pre-tax contributions made by the employee, subject to Code limitations. The company match contribution is invested in company stock. The savings plan also allows employees to invest in a non-leveraged employee stock ownership plan (“ESOP”). Dividends on shares held by the ESOP are charged to retained earnings and the shares are considered outstanding in computing earnings per share. The number of allocated shares held by the ESOP totaled 10,397,890 on December 31, 2008.
FHN also provides “flexible dollars” to assist employees with the cost of annual benefits and/or allows the employee to contribute to his or her qualified savings plan. These “flexible dollars” are pre-tax contributions and are based upon the employees’ years of service and qualified compensation.
Contributions made by FHN through the flexible benefits plan and the company matches were $25.4 million for 2008, $30.4 million for 2007 and $31.3 million for 2006.
Effective January 1, 2008, the company added a new program to the savings plan that is provided only to employees who are not eligible for the pension plan. With the new program, FHN will generally make contributions to eligible employees’ savings plan accounts based upon company performance. Contribution amounts will be a percentage of each employee’s base salary (as defined in the savings plan) earned the prior year. FHN intends to make a contribution for this plan in 2009 related to the 2008 plan year.
Pension plan.FHN closed participation in the noncontributory, qualified defined benefit pension plan to employees hired or re-hired on September 1, 2007 or later. This did not impact the benefits of employees currently participating in the plan. Certain employees of FHN’s insurance subsidiaries are not covered by the pension plan. Pension benefits are based on years of service, average compensation near retirement, and estimated social security benefits at age 65. FHN contributions are based upon actuarially determined amounts necessary to fund the total benefit obligation.
FHN also maintains nonqualified plans including a supplemental retirement plan that covers certain employees whose benefits under the pension plan have been limited.
Other employee benefits.FHN provides postretirement medical insurance to retirement-eligible employees. The postretirement medical plan is contributory with retiree contributions adjusted annually and is based on criteria that are a combination of the employee’s age and years of service. For any employee retiring on or after January 1, 1995, FHN contributes a fixed amount based on years of service and age at the time of retirement. FHN’s post-retirement benefits include prescription drug benefits. The Medicare Prescription Drug, Improvement and Modernization Act of 2003 (the Act) introduced a prescription drug benefit under Medicare Part D as well as a federal subsidy to sponsors of retiree health care that provide a benefit that is actuarially equivalent to Medicare Part D. FHN anticipates receiving a prescription drug subsidy under the Act through 2012.
Actuarial assumptions.FHN’s process for developing the long-term expected rate of return is based on two primary sources of investment portfolio returns: capital market exposure and active management benefit. Capital market exposure refers to the Plan’s broad allocation of its assets to asset classes, such as Large Cap Equity and Fixed Income. Active management refers to hiring investment managers to select individual securities that are expected to outperform the market. Active management provides only a small measure of the plan’s overall return. FHN also considers expectations for inflation, real interest rates, and various risk premiums based primarily on the historical risk premium for each asset class. The expected return is based upon a twenty year time horizon. This resulted in the selection of an 8.42 percent assumption for 2009 for the defined benefit pension plan and 5.47 percent for postretirement medical plan assets dedicated to employees who retired prior to January 1, 1993.
The discount rates for the three years ended 2008 for pension and other benefits were determined by using a hypothetical AA yield curve represented by a series of annualized individual discount rates from one-half to thirty years. The discount rates are selected based upon data specific to FHN’s plan and employee population. The bonds used to create the hypothetical yield curve were subjected to several requirements to ensure that the
106
FIRST HORIZON NATIONAL CORPORATION
Note 20 q Savings, Pension and Other Employee Benefits (continued)
resulting rates were representative of the bonds that would be selected by management to fulfill the company’s funding obligations. In addition to the AA rating, only non-callable bonds were included. Each bond issue was required to have at least $150 million par outstanding so that each issue was sufficiently marketable. Finally, bonds more than two standard deviations from the average yield were removed.
The actuarial assumptions used in the defined benefit pension plan and the other employee benefit plans were as follows:
| | | | | | | | | | | | |
| | Benefit Obligations | | Net Periodic Benefit Cost |
| | 2008 | | 2007 | | 2006 | | 2008 | | 2007 | | 2006 |
|
Discount rate | | | | | | | | | | | | |
Qualified pension | | | | 6.85 | % | | | | | 7.00 | % | | | | | 6.06 | % | | | | | 7.00 | % | | | | | 5.97 | % | | | | | 5.87 | % | |
Nonqualified pension | | | | 6.90 | | | | | 6.70 | | | | | 5.88 | | | | | 6.70 | | | | | 6.12 | | | | | 5.87 | |
Other nonqualified pension | | | | 6.95 | | | | | 6.55 | | | | | N/A | | | | | 6.83 | | | | | N/A | | | | | N/A | |
Postretirement benefit | | | | 6.90 | | | | | 6.60 | | | | | 5.85 | | | | | 6.60 | | | | | 5.83 | | | | | 5.64 | |
|
Expected long-term rate of return | | | | | | | | | | | | |
Qualified pension/postretirement benefits | | | | 8.42 | | | | | 8.87 | | | | | 8.35 | | | | | 8.87 | | | | | 8.35 | | | | | 8.65 | |
Postretirement benefit (retirees prior to January 1, 1993) | | | | 5.47 | | | | | 5.77 | | | | | 5.43 | | | | | 5.77 | | | | | 5.43 | | | | | 5.62 | |
|
Rate of compensation increase | | | | 4.10 | | | | | 4.10 | | | | | 4.10 | | | | | 4.10 | | | | | 4.10 | | | | | 4.42 | |
|
Measurement date | | | | 12/31/2008 | | | | | 12/31/2007 | | | | | 9/30/2006 | | | | | 12/31/2008 | | | | | 12/31/2007 | | | | | 9/30/2006 | |
|
The assumed health care cost trend rates used in the defined benefit pension plan and the other employee benefit plan were as follows:
| | | | | | | | |
| | 2008 | | 2007 |
|
Assumed Health Care Cost Trend Rates on
December 31 | | Participants
under age 65 | | Participants 65
years and older | | Participants
under age 65 | | Participants 65
years and older |
| | |
| | | | | | | | |
Health care cost trend rate assumed for next year | | | | 8.50 | % | | | | | 10.50 | % | | | | | 9.00 | % | | | | | 11.00 | % | |
Rate to which the cost trend rate is assumed to decline (the ultimate trend rate) | | | | 6.00 | | | | | 6.00 | | | | | 6.00 | | | | | 6.00 | |
Year that the rate reaches the ultimate trend rate | | | | 2013 | | | | | 2017 | | | | | 2013 | | | | | 2017 | |
|
The health care cost trend rate assumption has a significant effect on the amounts reported. A one-percentage-point change in assumed health care cost trend rates would have the following effects:
| | | | |
(Dollars in thousands) | | 1% Increase | | 1% Decrease |
|
Adjusted total service and interest cost components | | | $ | | 1,816 | | | | $ | | 1,661 | |
Adjusted postretirement benefit obligation at end of plan year | | | | 23,822 | | | | | 21,490 | |
|
107
FIRST HORIZON NATIONAL CORPORATION
Note 20 q Savings, Pension and Other Employee Benefits (continued)
The components of net periodic benefit cost for the plan years 2008, 2007 and 2006 were as follows:
| | | | | | | | | | | | |
(Dollars in thousands) | | Total Pension Benefits | | Other Benefits |
| | 2008 | | 2007 | | 2006 | | 2008 | | 2007 | | 2006 |
|
Components of net periodic benefit cost | | | | | | | | | | | | |
Service cost | | | $ | | 15,809 | | | | $ | | 19,206 | | | | $ | | 18,081 | | | | $ | | 276 | | | | $ | | 298 | | | | $ | | 332 | |
Interest cost | | | | 29,516 | | | | | 26,250 | | | | | 21,942 | | | | | 2,339 | | | | | 1,112 | | | | | 1,116 | |
Expected return on plan assets | | | | (46,938 | ) | | | | | (42,549 | ) | | | | | (35,778 | ) | | | | | (1,749 | ) | | | | | (1,762 | ) | | | | | (1,683 | ) | |
Amortization of unrecognized: | | | | | | | | | | | | |
Transition (asset)/obligation | | | | - | | | | | - | | | | | - | | | | | 988 | | | | | 988 | | | | | 989 | |
Prior service cost/(credit) | | | | 864 | | | | | 880 | | | | | 844 | | | | | (176 | ) | | | | | (176 | ) | | | | | (176 | ) | |
Actuarial (gain)/loss | | | | 2,417 | | | | | 7,138 | | | | | 7,074 | | | | | (368 | ) | | | | | (711 | ) | | | | | (562 | ) | |
|
Net periodic benefit cost/(income) | | | $ | | 1,668 | | | | $ | | 10,925 | | | | $ | | 12,163 | | | | $ | | 1,310 | | | | $ | | (251 | ) | | | | $ | | 16 | |
|
SFAS 88 settlement expense/(income) | | | | 1,269 | | | | | 456 | | | | | - | | | | | - | | | | | - | | | | | - | |
|
Total SFAS 87 and SFAS 88 expense/(income) | | | $ | | 2,937 | | | | $ | | 11,381 | | | | $ | | 12,163 | | | | $ | | 1,310 | | | | $ | | (251 | ) | | | | $ | | 16 | |
|
In 2008 and 2007, lump sum payments from a nonqualified plan triggered settlement accounting. In accordance with its practice, FHN performed a remeasurement of the plan in conjunction with the settlement and recognized the SFAS No. 88 settlement expense reflected above.
Effective December 31, 2006, FHN adopted SFAS No. 158, which required the recognition of the overfunded or underfunded status of a defined benefit plan and postretirement plan as an asset or liability in the statements of condition. SFAS No. 158 did not change measurement or recognition requirements for periodic pension and postretirement costs. Effective January 1, 2007, FHN elected adoption of the final provisions of SFAS No. 158, which required that the annual measurement date of a plan’s assets and liabilities be as of the date of the financial statements.
108
FIRST HORIZON NATIONAL CORPORATION
Note 20 q Savings, Pension and Other Employee Benefits (continued)
The following tables set forth the plans’ benefit obligations and plan assets for 2008 and 2007:
| | | | | | | | |
(Dollars in thousands) | | Total Pension Benefits | | Other Benefits |
| | 2008 | | 2007 | | 2008 | | 2007 |
|
Change in benefit obligation | | | | | | | | |
Benefit obligation, beginning of year | | | $ | | 429,707 | | | | $ | | 406,999 | | | | $ | | 24,420 | | | | $ | | 19,540 | |
Benefit obligation, new plan | | | | - | | | | | 28,236 | | | | | - | | | | | - | |
Adoption of EITF 06-4 for Endorsement split dollar life insurance | | | | - | | | | | - | | | | | 13,725 | | | | | - | |
Service cost | | | | 15,809 | | | | | 19,206 | | | | | 276 | | | | | 298 | |
Interest cost | | | | 29,516 | | | | | 26,250 | | | | | 2,339 | | | | | 1,112 | |
Plan amendments | | | | 59 | | | | | 207 | | | | | - | | | | | - | |
Adjustment for measurement date change | | | | - | | | | | 10,359 | | | | | - | | | | | 351 | |
Actuarial (gain)/loss | | | | 16,063 | | | | | (39,291 | ) | | | | | (3,929 | ) | | | | | 3,590 | |
Actual benefits paid | | | | (18,077 | ) | | | | | (21,139 | ) | | | | | (1,422 | ) | | | | | (847 | ) | |
Liability (gain)/loss due to curtailment | | | | (1,829 | ) | | | | | (1,120 | ) | | | | | - | | | | | - | |
Expected Medicare Part D reimbursement | | | | - | | | | | - | | | | | 353 | | | | | 376 | |
Special termination benefits | | | | 826 | | | | | - | | | | | - | | | | | - | |
|
Benefit obligation, end of year | | | $ | | 472,074 | | | | $ | | 429,707 | | | | $ | | 35,762 | | | | $ | | 24,420 | |
|
Change in plan assets* | | | | | | | | |
Fair value of plan assets, beginning of year | | | $ | | 503,541 | | | | $ | | 421,428 | | | | $ | | 21,808 | | | | $ | | 21,660 | |
Actual return on plan assets | | | | (141,105 | ) | | | | | 23,864 | | | | | (6,487 | ) | | | | | 995 | |
Employer contributions | | | | 35,989 | | | | | 79,388 | | | | | 706 | | | | | - | |
Actual benefits paid – settlement payments | | | | (18,448 | ) | | | | | (21,139 | ) | | | | | (1,422 | ) | | | | | (847 | ) | |
Actual benefits paid – annuities | | | | (1,458 | ) | | | | | - | | | | | - | | | | | - | |
|
Fair value of plan assets, end of year | | | $ | | 378,519 | | | | $ | | 503,541 | | | | $ | | 14,605 | | | | $ | | 21,808 | |
|
Funded status of the plan | | | $ | | (93,555 | ) | | | | $ | | 73,834 | | | | $ | | (21,157 | ) | | | | $ | | (2,612 | ) | |
|
Additional Amounts Recognized in the Statement of Financial Position | | | | | | | | |
Other assets | | | $ | | - | | | | $ | | 121,495 | | | | $ | | - | | | | $ | | - | |
Other liabilities | | | | (93,555 | ) | | | | | (47,661 | ) | | | | | (21,157 | ) | | | | | (2,612 | ) | |
|
Net asset/(liability) at end of year | | | $ | | (93,555 | ) | | | | $ | | 73,834 | | | | $ | | (21,157 | ) | | | | $ | | (2,612 | ) | |
|
|
* | | | | For fiscal year 2008, the change in benefit obligation and plan assets are for the period beginning January 1, 2008 and ending December 31, 2008. |
Effective January 1, 2008, FHN adopted EITF Issue No. 06-4, “Accounting for Deferred Compensation and Postretirement Benefit Aspects of Endorsement Split-Dollar Life Insurance Arrangements” (EITF 06-4). EITF 06-4 requires that a liability be recognized for contracts written to employees which provide future postretirement benefits that are covered by endorsement split-dollar life insurance arrangements because such obligations are not considered to be effectively settled upon entering into the related insurance arrangements. FHN recognized a decrease to undivided profits of $8.5 million, net of tax, upon adoption of EITF 06-4.
In 2007, FHN determined that a previously existing unfunded deferred compensation plan met the requirements for recognition as a pension plan under Statement of Financial Accounting Standards No. 87, “Employers’ Accounting for Pensions”. Accordingly, FHN began accounting for the plan as a pension plan prospectively from January 1, 2007. The initial recognition of the pension liability for this plan is presented as a new pension plan in the reconciliation of pension benefit obligations for 2007.
The accumulated benefit obligation for the pension plan was $432.0 million as of December 31, 2008 and $392.1 million as of December 31, 2007. At December 31, 2008, both the projected benefit obligation and the accumulated benefit obligation are greater than the fair market value of plan assets. FHN made a $30.0 million contribution in December 2008 to the qualified pension plan. A second contribution may be made in 2009
109
FIRST HORIZON NATIONAL CORPORATION
Note 20 q Savings, Pension and Other Employee Benefits (continued)
attributable to the 2008 plan year. This decision will be based upon pension funding requirements under the Pension Protection Act, the maximum deductible under the Internal Revenue Code, and the actual performance of plan assets during 2009. Given these uncertainties, we cannot estimate the amount of a future contribution at this time. The nonqualified pension plans and other postretirement benefit plans are unfunded. Contributions to these plans cover all benefits paid under the nonqualified plans. This amount was $6.2 million for 2008 and $5.4 million for 2007. FHN anticipates this amount will be $5.6 million in 2009.
Upon adoption of SFAS No. 158, unrecognized transition assets and obligations, unrecognized actuarial gains and losses, and unrecognized prior service costs and credits were recognized as a component of accumulated other comprehensive income. Amounts recognized in accumulated other comprehensive income on a pre-tax basis for the years ended December 31, 2008 and 2007 consist of:
| | | | | | | | (Dollars in thousands) | | Total Pension Benefits | | Other Benefits |
| | 2008 | | 2007 | | 2008 | | 2007 |
|
Amounts Recognized in Accumulated Other Comprehensive Income | | | | | | | | |
Net transition (asset)/obligation | | | $ | | - | | | | $ | | - | | | | $ | | 3,703 | | | | $ | | 4,692 | |
Prior service cost/(credit) | | | | 5,051 | | | | | 5,856 | | | | | (848 | ) | | | | | (1,024 | ) | |
Net actuarial (gain)/loss | | | | 306,898 | | | | | 105,652 | | | | | (859 | ) | | | | | (5,430 | ) | |
|
Total | | | $ | | 311,949 | | | | $ | | 111,508 | | | | $ | | 1,996 | | | | $ | | (1,762 | ) | |
|
Other amounts recognized in other comprehensive income were as follows:
| | | | | | | | |
(Dollars in thousands) | | Total Pension Benefits | | Other Benefits |
| | 2008 | | 2007 | | 2008 | | 2007 |
|
Changes in plan assets and benefit obligation recognized in other
comprehensive income | | | | | | | | |
Net actuarial (gain)/loss arising during measurement period | | | $ | | 204,106 | | | | $ | | (11,647 | ) | | | | $ | | 4,052 | | | | $ | | 4,684 | |
Prior service cost arising during measurement period | | | | 59 | | | | | 207 | | | | | - | | | | | - | |
Items amortized during the measurement period: | | | | | | | | |
Transition (asset)/obligation | | | | - | | | | | - | | | | | (988 | ) | | | | | (1,235 | ) | |
Prior service (credit)/cost | | | | (864 | ) | | | | | (1,098 | ) | | | | | 176 | | | | | 220 | |
Net actuarial (gain)/loss | | | | (2,417 | ) | | | | | (9,087 | ) | | | | | 623 | | | | | 877 | |
Loss due to settlement | | | | (443 | ) | | | | | (456 | ) | | | | | - | | | | | - | |
|
Total recognized in other comprehensive income | | | $ | | 200,441 | | | | $ | | (22,081 | ) | | | | $ | | 3,863 | | | | $ | | 4,546 | |
|
The estimated net actuarial (gain)/loss, prior service cost/(credit), and transition (asset)/obligation for the plan that will be amortized from accumulated other comprehensive income into net periodic benefit cost during the following fiscal year are as follows:
| | | | | | | | |
(Dollars in thousands) | | Total Pension Benefits | | Other Benefits |
| | 2008 | | 2007 | | 2008 | | 2007 |
|
Net Transition (Asset)/Obligation | | | $ | | - | | | | $ | | - | | | | $ | | 987 | | | | $ | | 988 | |
Prior Service Cost/(Credit) | | | | 758 | | | | | 865 | | | | | (176 | ) | | | | | (176 | ) | |
Net Actuarial (Gain)/Loss | | | | 7,893 | | | | | 1,973 | | | | | - | | | | | (233 | ) | |
|
FHN expects no defined benefit pension plan’s and other employee benefit plan’s assets to be returned to FHN in 2009.
110
FIRST HORIZON NATIONAL CORPORATION
Note 20 q Savings, Pension and Other Employee Benefits (continued)
The following table provides detail on expected benefit payments, which reflect expected future service, as appropriate and projected Medicare reimbursements:
| | | | | | | | |
(Dollars in thousands) | | Pension
Benefits | | Other
Benefits | | Medicare
Reimbursements | | |
|
2009 | | | $ | | 19,746 | | | | $ | | 2,734 | | | | $ | | 491 | | | |
2010 | | | | 20,902 | | | | | 2,879 | | | | | 546 | | | |
2011 | | | | 22,227 | | | | | 3,007 | | | | | 608 | | | |
2012 | | | | 24,398 | | | | | 3,122 | | | | | 687 | | | |
2013 | | | | 26,526 | | | | | 3,217 | | | | | - | | | |
2014 – 2018 | | | | 167,530 | | | | | 16,672 | | | | | - | | | |
|
The following table sets forth FHN’s pension plan asset allocation on measurement dates for 2008 and 2007:
| | | | | | | | | | | | |
| | Targeted Allocation | | Percentage of
Plan Assets
on December 31 |
| | 2008 | | 2007 |
|
Equity securities | | | | 70 | % | | | | | | | 60.0 | % | | | | | | | 67.3 | % | | | |
Large capital equity | | | | | | 35 | % | | | | | | | 27.3 | % | | | | | | | 31.2 | % | |
Small capital equity | | | | | | 20 | | | | | | | 19.8 | | | | | | | 18.3 | |
International equity | | | | | | 15 | | | | | | | 12.9 | | | | | | | 17.8 | |
Other | | | | 30 | | | | | | | 40.0 | | | | | | | 32.7 | | | |
Fixed income | | | | | | | | | | 30.6 | | | | | | | 30.4 | |
Money market | | | | | | | | | | 9.4 | | | | | | | 2.3 | |
|
Total | | | | | | | | | | 100.0 | % | | | | | | | 100.0 | % | |
|
The $30.0 million contribution was made in December 2008 and was invested in a money market fund as of December 31, 2008. This amount will be allocated to alternative investments in 2009.
The primary investment objective is to ensure, over the long-term life of the pension plan, an adequate pool of sufficiently liquid assets to support the benefit obligations to participants, retirees, and beneficiaries. In meeting this objective, the pension plan seeks to achieve a high level of investment return consistent with a prudent level of portfolio risk. Investment objectives are long-term in nature covering typical market cycles of three to five years. Any shortfall of investment performance compared to investment objectives should be explainable in terms of general economic and capital market conditions.
The Retirement Investment Committee, comprised of senior managers within the organization, meets quarterly to review asset performance and the need for rebalancing. At a minimum, rebalancing occurs annually for the purpose of remaining within the established target asset allocation ranges and to maintain liquidity for benefit payments. Risk management is also reviewed and evaluated based upon the organization’s ability to assume investment risk.
111
FIRST HORIZON NATIONAL CORPORATION
Note 20 q Savings, Pension and Other Employee Benefits (continued)
The following table sets forth the asset allocation for FHN’s retiree medical plan with measurement dates for 2008 and 2007:
| | | | | | | | |
| | Percentage of
Plan Assets
on December 31 |
| | 2008 | | 2007 |
|
Equity securities | | | | 61.8 | % | | | | | | | 68.4 | % | | | |
Large capital equity | | | | | | 42.7 | % | | | | | | | 54.0 | % | |
Small capital equity | | | | | | 19.1 | | | | | | | 14.4 | |
Other | | | | 38.2 | | | | | | | 31.6 | | | |
Fixed income | | | | | | 35.1 | | | | | | | 27.2 | |
Cash equivalents and money market | | | | | | 3.1 | | | | | | | 4.4 | |
|
Total | | | | | | 100.0 | % | | | | | | | 100.0 | % | |
|
The primary investment objective is to ensure, over the long-term life of the retiree medical obligation, an adequate pool of sufficiently liquid assets to partially support the obligations to retirees and beneficiaries. The allocation utilizing a tactical blend of individual securities and registered funds across the broad asset classes is designed to capture a reasonable balance of risk and return based upon historical averages. In meeting this objective, the retiree medical plan seeks to achieve a high level of investment return consistent with a prudent level of portfolio risk. Investment objectives are long-term in nature (longer than 10 years).
Tactical allocation with the broad strategic objective of 70/30 equity to fixed blend is contemplated periodically with an attention to the likelihood of improving the return potential coupled with a reduction of the risk level.
The number of shares of FHN common stock held by the plan was 680,515 for 2008 and 660,300 for 2007. The increase is related to stock dividends received on common stock held in 2008.
112
FIRST HORIZON NATIONAL CORPORATION
Note 21 q Stock Option, Restricted Stock Incentive, and Dividend Reinvestment Plans
Stock option plans.FHN issues non-qualified stock options to employees under various plans, which provide for the issuance of FHN common stock at a price equal to the higher of the closing price or its fair market value at the date of grant. All options vest within 3 to 4 years and expire 7 years or 10 years from the date of grant. A deferral program, which was discontinued in 2005, allowed for foregone compensation plus the exercise price to equal the fair market value of the stock on the date of grant if the grantee agreed to receive the options in lieu of compensation. Any options issued below market on the date of grant during 2005 were related to 2004 salary deferrals for employees and 2004 board compensation for directors. Options that were part of compensation deferral prior to January 2, 2004, expire 20 years from the date of grant. Stock options granted after January 2, 2004, that are part of the compensation deferral expire 10 years from the date of grant. There were 4,225,736 shares available for option or share grants on December 31, 2008.
The stock option plan includes various antidilutive provisions in the event the value of awards become diminished from several factors. In 2008, FHN began paying quarterly stock dividends in lieu of quarterly cash dividends. Stock dividends increase the number of shares outstanding, thereby decreasing the compensation value of the equity award. Consequently, the shares and option prices reported in the following tables have been proportionately adjusted to reflect the estimated economic effect of dividends distributed in common stock effective October 1, 2008 and January 2, 2009. For administrative reasons, outstanding options have not been formally adjusted at this time; however, in most cases, awards will be adjusted to provide the economic and dilutive effect as an adjustment if and when affected options are exercised. The Black Scholes Fair Value of the stock options and compensation expense are not affected.
The summary of stock option plans activity during the year ended December 31, 2008, is shown below:
| | | | | | | | |
| | Options
Outstanding | | Weighted
Average
Exercise Price | | Weighted
Average
Remaining
Contractual Term
(years) | | Aggregate
Intrinsic Value
(thousands) |
|
January 1, 2008 | | | | 18,217,233 | | | | $ | | 33.02 | | | | | |
Options granted | | | | 822,753 | | | | | 13.17 | | | | | |
Options exercised | | | | (40,059 | ) | | | | | 12.26 | | | | | |
Options forfeited | | | | (1,353,434 | ) | | | | | 36.88 | | | | | |
Options expired | | | | (2,343,681 | ) | | | | | 35.61 | | | | | |
| | | | |
December 31, 2008 | | | | 15,302,812 | | | | | 31.27 | | | | | 4.75 | | | | $ | | 195 | |
|
Options exercisable | | | | 12,107,871 | | | | | 30.98 | | | | | 4.72 | | | | | 186 | |
Options expected to vest | | | | 2,028,745 | | | | | 32.43 | | | | | 4.89 | | | | | 6 | |
|
The total intrinsic value of options exercised during 2008, 2007 and 2006, was $.3 million, $18.6 million and $37.4 million, respectively. On December 31, 2008, there was $3.8 million of unrecognized compensation cost related to nonvested stock options. That cost is expected to be recognized over a weighted- average period of 1.10 years. The following data summarizes information about stock options granted during 2008, 2007 and 2006:
| | | | |
| | Number
Granted | | Weighted
Average Fair
Value per Option
at Grant Date |
|
2008: | | | | |
Options granted | | | | 822,753 | | | | $ | | 1.65 | |
|
2007: | | | | |
Options granted | | | | 2,009,149 | | | | $ | | 5.02 | |
|
2006: | | | | |
Options granted | | | | 1,720,758 | | | | $ | | 5.92 | |
|
113
FIRST HORIZON NATIONAL CORPORATION
Note 21 q Stock Option, Restricted Stock Incentive, and Dividend Reinvestment Plans (continued)
FHN used the Black-Scholes Option Pricing Model to estimate the fair value of stock options granted in 2008, 2007 and 2006, with the following assumptions:
| | | | | | |
| | 2008 | | 2007 | | 2006 |
|
Expected dividend yield | | 5.97% | | 4.99% | | 4.42% |
Expected weighted-average lives of options granted | | 5.07 years | | 5.44 years | | 5.27 years |
Expected weighted-average volatility | | 25.89% | | 17.45% | | 19.03% |
Expected volatility range | | 24.10% – 42.60% | | 16.50% – 23.30% | | 18.11% – 24.40% |
Risk-free interest rates range | | 2.80% – 3.32% | | 4.54% – 4.85% | | 4.78% – 5.00% |
|
Expected lives of options granted are determined based on the vesting period, historical exercise patterns and contractual term of the options. Expected volatility is estimated using average of daily high and low stock prices. Expected volatility assumptions are determined over the period of the expected lives of the options.
Restricted stock incentive plans.FHN has authorized the issuance of its common stock for awards to executive and other management employees who have a significant impact on the profitability of FHN. Under a performance accelerated restricted stock program, restricted shares can vest as early as 3 years instead of 10 years following the grant date if predetermined performance criteria are met. Under the long-term incentive and corporate performance programs, performance stock units vest only if predetermined performance measures are met. Units are forfeited if the performance criteria are not met. In 2006, restricted stock and stock options, which were to vest over 3 and 4 years if predetermined performance measures were met, were awarded to certain executive officers. These performance measures were not met and the awards were forfeited in 2007 and 2008. In 2008, executives were awarded performance restricted stock with 50% vesting in 2011 and 50% vesting in 2012 subject to certain performance criteria being met. If performance criteria are not met in 2011, that portion of the award is eligible for vesting in 2012. Additionally, retention awards were granted to certain employees with 50% of the award to be paid in cash in 2009 and 50% to be paid in shares in 2010, pending service conditions. Further, awards of restricted stock may be awarded to new executive level employees upon hiring from time to time. Restricted shares granted in 2008 are included in the table below. Historically, FHN granted restricted stock awards to management employees, which typically vest over 3 and 4 years. In 2008, FHN granted stock option and long term incentive cash units in lieu of restricted stock.
Additionally, one of the plans allows stock awards to be granted to non-employee directors upon approval by the board of directors. It has been the recent practice of the board to grant 8,396 shares of restricted stock to each new non-employee director upon election to the board, with restrictions lapsing at a rate of ten percent per year. In 2007, the old restricted stock program was discontinued. Each new non-employee director instead will receive an annual award of restricted stock units (“RSUs”) valued at $45,000 or a pro-rated portion amount depending on the director’s start date. Each RSU award will be scheduled to vest the following year and will be paid in common shares (including any shares earned as a result of the stock dividend) plus accrued cash dividends at vesting. In 2008, two new non-employee directors were granted RSUs under this plan. Existing non-employee directors also will participate in the new RSU program, but participation will be phased in as the old restricted stock awards vest. As a result, one existing non-employee received an RSU award in 2008. After 2007, each such director should have one of the following occur each year: 840 old restricted shares will vest; or, a full grant of new RSUs will vest; or, a combination of old restricted shares (less than 840) and new RSUs (less than 100%) will vest. In 2008 a majority of the existing non-employee directors who fulfilled the vesting requirements had at least 840 old restricted shares vest. In 2008, 2,519 restricted shares were immediately vested as a result of a director retirement while 4,198 shares were forfeited as a result of a director resignation.
114
FIRST HORIZON NATIONAL CORPORATION
Note 21 q Stock Option, Restricted Stock Incentive, and Dividend Reinvestment Plans (continued)
The summary of restricted and performance stock activity during the year ended December 31, 2008, is presented below:
| | | | |
| | Shares/
Units* | | Weighted
average
grant date
fair value |
|
Nonvested on January 1, 2008 | | | | 1,601,857 | | | | $ | | 38.31 | |
Shares/units granted | | | | 815,216 | | | | | 13.92 | |
Shares/units vested | | | | (202,944 | ) | | | | | 37.86 | |
Shares/units canceled | | | | (751,222 | ) | | | | | 37.15 | |
| | | | |
Nonvested on December 31, 2008 | | | | 1,462,907 | | | | $ | | 25.38 | |
|
|
* | | | | Stock units are paid in cash or shares only upon vesting. All units granted in 2008 and prior years were cancelled and no cash or shares were distributed. |
On December 31, 2008, there was $9.6 million of unrecognized compensation cost related to nonvested restricted stock plans. That cost is expected to be recognized over a weighted-average period of 3.04 years. The total grant date fair value of shares vested during 2008, 2007 and 2006, was $7.7 million, $2.8 million and $1.6 million, respectively.
The board of directors approved amendments to the restricted stock plan during 1998 permitting deferral by participants of the receipt of restricted stock prior to the lapse of restrictions. Due to deferred compensation legislation passed in 2004, participants are no longer allowed to make voluntary deferral elections under the stock programs.
The compensation cost that has been included in income from continuing operations pertaining to both stock option and restricted stock plans was $5.8 million, $10.8 million and $21.6 million for 2008, 2007 and 2006, respectively. The corresponding total income tax benefits recognized in the income statements were $2.2 million, $4.0 million and $8.2 million for 2008, 2007 and 2006, respectively.
Consistent with Tennessee state law, only new or authorized, but unissued, shares may be utilized in connection with any issuance of FHN common stock which may be required as a result of share based compensation awards. FHN historically obtains authorization from the Board of Directors to repurchase any shares that may be issued at the time a plan is approved or amended. These authorizations are automatically adjusted for stock splits and stock dividends. Repurchases are authorized to be made in the open market or through privately negotiated transactions and will be subject to market conditions, accumulation of excess equity, legal, regulatory, and U.S. Treasury requirements, and prudent capital management. FHN does not currently expect to repurchase a material number of shares related to the plans during the next annual period.
Run Rate.For the period 2006 through 2008, the average annual run rate was 1.93 percent using the Risk Metrics methodology for determining run rate. This met our commitment to shareholders made in 2006.
Dividend reinvestment plan.The Dividend Reinvestment and Stock Purchase Plan (the Plan) authorizes the sale of FHN’s common stock from shares acquired on the open market to shareholders who choose to invest all or a portion of their cash dividends or make optional cash payments of $25 to $10,000 per quarter without paying commissions. The price of shares purchased on the open market is the average price paid.
Note 22 q Business Segment Information
FHN has five business segments, Regional Banking, Capital Markets, National Specialty Lending, Mortgage Banking and Corporate. The Regional Banking segment offers financial products and services, including traditional lending and deposit taking, to retail and commercial customers in Tennessee and surrounding markets. Additionally, Regional Banking provides investments, insurance, financial planning, trust services and asset management, credit card, cash management, and check clearing services. The Capital Markets segment consists of traditional capital
115
FIRST HORIZON NATIONAL CORPORATION
Note 22 q Business Segment Information (continued)
markets securities activities, equity research, loan sales, portfolio advisory, structured finance and correspondent banking. The National Specialty Lending segment consists of traditional consumer and construction lending activities in other national markets. The Mortgage Banking segment consists of core mortgage banking elements including originations and servicing and the associated ancillary revenues related to these businesses. In August 2008, FHN completed the divestiture of certain mortgage banking operations to MetLife. FHN will continue to originate loans in and around the Tennessee banking footprint and service the remaining servicing portfolio. The Corporate segment consists of restructuring, repositioning and efficiency initiatives, gains and losses on repurchases of debt, unallocated corporate expenses, expense on subordinated debt issuances and preferred stock, bank- owned life insurance, unallocated interest income associated with excess equity, net impact of raising incremental capital, revenue and expense associated with deferred compensation plans, funds management, and venture capital. Periodically, FHN adapts its segments to reflect changes in expense allocations among segments. Previously reported amounts have been reclassified to agree with current presentation.
In first quarter 2008, FHN revised its business line segments to better align with its strategic direction, representing a focus on its regional banking franchise and capital markets business. To implement this change, the prior Retail/Commercial Banking segment was split into its major components with the national portions of consumer lending and construction lending assigned to a new National Specialty Lending segment that more appropriately reflects the ongoing wind down of these businesses. Additionally, correspondent banking was shifted from Retail/Commercial Banking to the Capital Markets segment to better represent the complementary nature of these businesses. To reflect its geographic focus, the remaining portions of the Retail/Commercial Banking segment now represent the new Regional Banking segment. All prior period information has been revised to conform to the current segment structure.
Total revenue, expense and asset levels reflect those which are specifically identifiable or which are allocated based on an internal allocation method. Because the allocations are based on internally developed assignments and allocations, they are to an extent subjective. This assignment and allocation has been consistently applied for all periods presented. The following table reflects the amounts of consolidated revenue, expense, tax, and assets for each segment for the years ended December 31:
| | | | | | | | (Dollars in thousands) | | 2008 | | 2007 | | 2006 |
|
Consolidated | | Net interest income | | | $ | | 895,082 | | | | $ | | 940,642 | | | | $ | | 996,937 | |
| | Provision for loan loss | | | | 1,080,000 | | | | | 272,765 | | | | | 83,129 | |
| | Noninterest income | | | | 1,491,313 | | | | | 859,949 | | | | | 1,166,893 | |
| | Noninterest expense | | | | 1,656,052 | | | | | 1,843,433 | | | | | 1,742,621 | |
| | |
| | Income/(loss) before income taxes | | | | (349,657 | ) | | | | | (315,607 | ) | | | | | 338,080 | |
| | Provision/(benefit) for income taxes | | | | (156,814 | ) | | | | | (140,731 | ) | | | | | 87,278 | |
| | |
| | Income/(loss) from continuing operations | | | | (192,843 | ) | | | | | (174,876 | ) | | | | | 250,802 | |
| | Income from discontinued operations, net of tax | | | | 883 | | | | | 4,765 | | | | | 210,767 | |
| | |
| | Income/(loss) before cumulative effect of changes in
accounting principle | | | | (191,960 | ) | | | | | (170,111 | ) | | | | | 461,569 | |
| | Cumulative effect of changes in accounting principle,
net of tax | | | | - | | | | | - | | | | | 1,345 | |
| | |
| | Net income/(loss) | | | $ | | (191,960 | ) | | | | $ | | (170,111 | ) | | | | $ | | 462,914 | |
| | |
| | Average assets | | | $ | | 34,422,678 | | | | $ | | 38,175,420 | | | | $ | | 38,764,568 | |
| | |
| | Depreciation, amortization and MSR impairment | | | $ | | 97,448 | | | | $ | | 131,634 | | | | $ | | 144,806 | |
| | Expenditures for long-lived assets | | | | 23,666 | | | | | 33,539 | | | | | 100,263 | |
|
Certain previously reported amounts have been reclassified to agree with current presentation.
116
FIRST HORIZON NATIONAL CORPORATION
Note 22 q Business Segment Information (continued)
| | | | | | | | |
(Dollars in thousands) | | 2008 | | 2007 | | 2006 |
|
Regional | | Net interest income | | | $ | | 480,684 | | | | $ | | 547,157 | | | | $ | | 552,442 | |
Banking | | Provision for loan loss | | | | 328,767 | | | | | 62,629 | | | | | 51,400 | |
| | Noninterest income | | | | 350,144 | | | | | 367,413 | | | | | 392,143 | |
| | Noninterest expense | | | | 627,273 | | | | | 631,356 | | | | | 659,790 | |
| | |
| | Income/(loss) before income taxes | | | | (125,212 | ) | | | | | 220,585 | | | | | 233,395 | |
| | Provision/(benefit) for income taxes | | | | (72,561 | ) | | | | | 73,273 | | | | | 52,620 | |
| | |
| | Income/(loss) from continuing operations | | | | (52,651 | ) | | | | | 147,312 | | | | | 180,775 | |
| | Income from discontinued operations, net of tax | | | | 883 | | | | | 4,765 | | | | | 210,767 | |
| | |
| | Income/(loss) before cumulative effect of changes in
accounting principle | | | | (51,768 | ) | | | | | 152,077 | | | | | 391,542 | |
| | Cumulative effect of changes in accounting principle,
net of tax | | | | - | | | | | - | | | | | 394 | |
| | |
| | Net income/(loss) | | | $ | | (51,768 | ) | | | | $ | | 152,077 | | | | $ | | 391,936 | |
| | |
| | Average assets | | | $ | | 12,031,137 | | | | $ | | 12,349,779 | | | | $ | | 11,940,263 | |
| | |
| | Depreciation, amortization and MSR impairment | | | $ | | 50,586 | | | | $ | | 60,028 | | | | $ | | 59,193 | |
| | Expenditures for long-lived assets | | | | 18,088 | | | | | 22,509 | | | | | 80,010 | |
|
Capital Markets | | Net interest income | | | $ | | 77,300 | | | | $ | | 54,386 | | | | $ | | 53,441 | |
| | Provision for loan loss | | | | 80,112 | | | | | 8,097 | | | | | 2,685 | |
| | Noninterest income | | | | 534,427 | | | | | 352,154 | | | | | 406,395 | |
| | Noninterest expense | | | | 418,916 | | | | | 328,062 | | | | | 358,901 | |
| | |
| | Income before income taxes | | | | 112,699 | | | | | 70,381 | | | | | 98,250 | |
| | Provision for income taxes | | | | 41,932 | | | | | 26,170 | | | | | 36,663 | |
| | |
| | Income before cumulative effect of changes in
accounting principle | | | | 70,767 | | | | | 44,211 | | | | | 61,587 | |
| | Cumulative effect of changes in accounting principle,
net of tax | | | | - | | | | | - | | | | | 192 | |
| | |
| | Net income | | | $ | | 70,767 | | | | $ | | 44,211 | | | | $ | | 61,779 | |
| | |
| | Average assets | | | $ | | 5,156,599 | | | | $ | | 5,746,595 | | | | $ | | 6,344,086 | |
| | |
| | Depreciation and amortization | | | $ | | 10,068 | | | | $ | | 12,268 | | | | $ | | 15,235 | |
| | Expenditures for long-lived assets | | | | 1,854 | | | | | 1,089 | | | | | 4,158 | |
|
National Specialty | | Net interest income | | | $ | | 190,028 | | | | $ | | 243,900 | | | | $ | | 288,215 | |
Lending | | Provision for loan loss | | | | 642,002 | | | | | 194,436 | | | | | 29,108 | |
| | Noninterest income/(loss) | | | | (10,180 | ) | | | | | 21,265 | | | | | 44,970 | |
| | Noninterest expense | | | | 97,181 | | | | | 138,077 | | | | | 161,335 | |
| | |
| | Income/(loss) before income taxes | | | | (559,335 | ) | | | | | (67,348 | ) | | | | | 142,742 | |
| | Provision/(benefit) for income taxes | | | | (208,205 | ) | | | | | (26,183 | ) | | | | | 51,774 | |
| | |
| | Income/(loss) before cumulative effect of changes in
accounting principle | | | | (351,130 | ) | | | | | (41,165 | ) | | | | | 90,968 | |
| | Cumulative effect of changes in accounting principle,
net of tax | | | | - | | | | | - | | | | | 115 | |
| | |
| | Net income/(loss) | | | $ | | (351,130 | ) | | | | $ | | (41,165 | ) | | | | $ | | 91,083 | |
| | |
| | Average assets | | | $ | | 8,516,023 | | | | $ | | 9,716,110 | | | | $ | | 9,891,340 | |
| | |
| | Depreciation and amortization | | | $ | | 34,971 | | | | $ | | 43,759 | | | | $ | | 48,432 | |
| | Expenditures for long-lived assets | | | | 840 | | | | | 643 | | | | | 1,041 | |
|
Certain previously reported amounts have been reclassified to agree with current presentation.
117
FIRST HORIZON NATIONAL CORPORATION
Note 22 q Business Segment Information (continued)
| | | | | | | | |
(Dollars in thousands) | | 2008 | | 2007 | | 2006 |
|
Mortgage | | Net interest income | | | $ | | 95,341 | | | | $ | | 98,769 | | | | $ | | 100,548 | |
Banking | | Provision/(benefit) for loan loss | | | | 29,119 | | | | | (69 | ) | | | | | (70 | ) | |
| | Noninterest income | | | | 560,326 | | | | | 91,096 | | | | | 385,231 | |
| | Noninterest expense | | | | 425,148 | | | | | 503,207 | | | | | 476,862 | |
| | |
| | Income/(loss) before income taxes | | | | 201,400 | | | | | (313,273 | ) | | | | | 8,987 | |
| | Provision/(benefit) for income taxes | | | | 70,675 | | | | | (130,456 | ) | | | | | 994 | |
| | |
| | Income/(loss) before cumulative effect of changes in
accounting principle | | | | 130,725 | | | | | (182,817 | ) | | | | | 7,993 | |
| | Cumulative effect of changes in accounting principle,
net of tax | | | | - | | | | | - | | | | | 414 | |
| | |
| | Net income/(loss) | | | $ | | 130,725 | | | | $ | | (182,817 | ) | | | | $ | | 8,407 | |
| | |
| | Average assets | | | $ | | 4,992,186 | | | | $ | | 6,377,477 | | | | $ | | 6,377,754 | |
| | |
| | Depreciation, amortization and MSR impairment* | | | $ | | 2,610 | | | | $ | | 14,821 | | | | $ | | 21,746 | |
| | Expenditures for long-lived assets | | | | 556 | | | | | 7,580 | | | | | 10,291 | |
|
Corporate | | Net interest income/(expense) | | | $ | | 51,729 | | | | $ | | (3,570 | ) | | | | $ | | 2,291 | |
| | Provision for loan loss | | | | - | | | | | 7,672 | | | | | 6 | |
| | Noninterest income/(loss) | | | | 56,596 | | | | | 28,021 | | | | | (61,846 | ) | |
| | Noninterest expense | | | | 87,534 | | | | | 242,731 | | | | | 85,733 | |
| | |
| | Income/(loss) before income taxes | | | | 20,791 | | | | | (225,952 | ) | | | | | (145,294 | ) | |
| | Provision/(benefit) for income taxes | | | | 11,345 | | | | | (83,535 | ) | | | | | (54,773 | ) | |
| | |
| | Income/(loss) before cumulative effect of changes in
accounting principle | | | | 9,446 | | | | | (142,417 | ) | | | | | (90,521 | ) | |
| | Cumulative effect of changes in accounting principle,
net of tax | | | | - | | | | | - | | | | | 230 | |
| | |
| | Net income/(loss) | | | $ | | 9,446 | | | | $ | | (142,417 | ) | | | | $ | | (90,291 | ) | |
| | |
| | Average assets | | | $ | | 3,726,734 | | | | $ | | 3,985,459 | | | | $ | | 4,211,125 | |
| | |
| | Depreciation and amortization | | | $ | | (787 | ) | | | | $ | | 758 | | | | $ | | 200 | |
| | Expenditures for long-lived assets | | | | 2,328 | | | | | 1,718 | | | | | 4,763 | |
|
|
* | | | | Effective January 1, 2006, FHN elected early adoption of SFAS No. 156 which requires MSR to be measured at fair value both initially and prospectively; thus, amortization and impairment are no longer recorded. |
Certain previously reported amounts have been reclassified to agree with current presentation.
118
FIRST HORIZON NATIONAL CORPORATION
Note 23 q Fair Value of Assets & Liabilities
Effective January 1, 2008, upon adoption of SFAS No. 159, FHN elected the fair value option on a prospective basis for almost all types of mortgage loans originated for sale purposes. FHN determined that the election reduced certain timing differences and better matched changes in the value of such loans with changes in the value of derivatives used as economic hedges for these assets. No transition adjustment was required upon adoption of SFAS No. 159 as FHN continued to account for mortgage loans held for sale which were originated prior to 2008 at the lower of cost or market value. Mortgage loans originated for sale are included in loans held for sale on the Consolidated Statements of Condition. Other interests retained in relation to residential loan sales and securitizations are included in trading securities on the Consolidated Statements of Condition. Additionally, effective January 1, 2008, FHN adopted SFAS No. 157 for existing fair value measurement requirements related to financial assets and liabilities as well as to non-financial assets and liabilities which are re-measured at least annually. FSP FAS 157-2 delays the effective date of SFAS No. 157 until fiscal years beginning after November 15, 2008, for non-financial assets and liabilities which are recognized at fair value on a non-recurring basis. Therefore, in 2008, FHN did not apply the provisions of SFAS No. 157 for non-recurring fair value measurements related to its non-financial long-lived assets under SFAS No. 144 (including real estate acquired by foreclosure) or its non-financial liabilities for exit or disposal activities initially measured at fair value under SFAS No. 146, as well as to goodwill and indefinite-lived intangible assets which are measured at fair value on a recurring basis for impairment assessment purposes but are not recognized in the financial statements at fair value.
In accordance with SFAS No. 157, FHN groups its assets and liabilities measured at fair value in three levels, based on the markets in which the assets and liabilities are traded and the reliability of the assumptions used to determine fair value. This hierarchy requires FHN to maximize the use of observable market data, when available, and to minimize the use of unobservable inputs when determining fair value. Each fair value measurement is placed into the proper level based on the lowest level of significant input. These levels are:
|
• | | | | Level 1 – Valuation is based upon quoted prices for identical instruments traded in active markets. |
|
• | | | | Level 2 – Valuation is based upon quoted prices for similar instruments in active markets, quoted prices for identical or similar instruments in markets that are not active, and model-based valuation techniques for which all significant assumptions are observable in the market. |
|
• | | | | Level 3 – Valuation is generated from model-based techniques that use significant assumptions not observable in the market. These unobservable assumptions reflect our own estimates of assumptions that market participants would use in pricing the asset or liability. Valuation techniques include use of option pricing models, discounted cash flow models, and similar techniques. |
For applicable periods, all divestiture-related line items in the Consolidated Statements of Condition have been combined with the related non-divestiture line items in preparation of the disclosure tables in this footnote. The table below presents the balances of assets and liabilities measured at fair value on a recurring basis. Derivatives in an asset position are included within Other assets while derivatives in a liability position are included within Other liabilities. Derivative positions constitute the only recurring Level 3 measurements within Other assets and Other liabilities.
119
FIRST HORIZON NATIONAL CORPORATION
Note 23 q Fair Value of Assets & Liabilities (continued)
| | | | | | | | |
(Dollars in thousands) | | December 31, 2008 |
| | Total | | Level 1 | | Level 2 | | Level 3 |
|
Trading securities | | | $ | | 945,766 | | | | $ | | 1,113 | | | | $ | | 791,111 | | | | $ | | 153,542 | |
Loans held for sale | | | | 268,952 | | | | | - | | | | | 257,622 | | | | | 11,330 | |
Securities available for sale | | | | 2,955,607 | | | | | 41,268 | | | | | 2,777,192 | | | | | 137,147 | |
Mortgage servicing rights, net | | | | 376,844 | | | | | - | | | | | - | | | | | 376,844 | |
Other assets (a) | | | | 603,096 | | | | | 27,012 | | | | | 575,839 | | | | | 245 | |
|
Total | | | $ | | 5,150,265 | | | | $ | | 69,393 | | | | $ | | 4,401,764 | | | | $ | | 679,108 | |
|
Trading liabilities | | | $ | | 359,502 | | | | $ | | 126 | | | | $ | | 359,376 | | | | $ | | - | |
Other short-term borrowings and commercial paper | | | | 27,957 | | | | | - | | | | | - | | | | | 27,957 | |
Other liabilities (a) | | | | 262,435 | | | | | 557 | | | | | 261,866 | | | | | 12 | |
|
Total | | | $ | | 649,894 | | | | $ | | 683 | | | | $ | | 621,242 | | | | $ | | 27,969 | |
|
|
(a) | | | | Derivatives are included in this category. |
In third quarter 2008, FHN revised its methodology for valuing hedges of MSR and excess interest that were retained from prior securitizations. FHN now determines the fair value of the derivatives used to hedge MSR and excess interests using inputs observed in active markets for similar instruments with typical inputs including the LIBOR curve, option volatility and option skew. Previously, fair values of these derivatives were obtained through proprietary pricing models which were compared to market value quotes received from third party broker-dealers in the derivative markets. Accordingly, the applicable amounts are presented as a transfer out of net derivative assets and liabilities in the following rollforward for the twelve month period ended December 31, 2008. The changes in Level 3 assets and liabilities measured at fair value on a recurring basis are summarized as follows:
| | | | | | | | | | | | (Dollars in thousands) | | Twelve Months Ended December 31, 2008 |
| | Trading
securities | | Loans held
for sale | | Securities
available
for sale | | Mortgage
servicing
rights, net | | Net derivative
assets and
liabilities | | Other short-term
borrowings and
commercial paper |
|
Balance, beginning of year | | | $ | | 476,404 | | | | $ | | - | | | | $ | | 159,301 | | | | $ | | 1,159,820 | | | | $ | | 81,517 | | | | $ | | - | |
Total net gains/(losses) for the period included in: | | | | | | | | | | | | |
Net income | | | | (109,232 | ) | | | | | (2,551 | ) | | | | | 303 | | | | | (429,854 | ) | | | | | 146,737 | | | | | (34,978 | ) | |
Other comprehensive income | | | | - | | | | | - | | | | | (3,641 | ) | | | | | - | | | | | - | | | | | - | |
Purchases, sales, issuances and settlements, net | | | | (235,569 | ) | | | | | (2,711 | ) | | | | | (18,816 | ) | | | | | (353,122 | ) | | | | | (119,926 | ) | | | | | 62,935 | |
Net transfers into/(out) of Level 3 | | | | 21,939 | | | | | 16,592 | | | | | - | | | | | - | | | | | (108,095 | ) | | | | | - | |
|
Balance, end of period | | | $ | | 153,542 | | | | $ | | 11,330 | | | | $ | | 137,147 | | | | $ | | 376,844 | | | | $ | | 233 | | | | $ | | 27,957 | |
|
Net unrealized gains/(losses) included in net income for the period relating to assets and liabilities held at December 31, 2008 | | | $ | | (172,366 | )(a) | | | | $ | | (10,742 | )(b) | | | | $ | | 303(c | ) | | | | $ | | (328,112 | )(d) | | | | $ | | 72(b | ) | | | | $ | | (19,974 | ) | |
|
|
(a) | | | | Twelve months ended December 31, 2008 includes $23.8 million included in Capital markets noninterest income, $138.5 million included in Mortgage banking noninterest income, and $10.1 million included in Revenue from loan sales and securitizations. |
|
(b) | | | | Included in Mortgage banking noninterest income. |
|
(c) | | | | Represents recognized gains and losses attributable to venture capital investments classified within securities available for sale that are included in Securities gains/(losses) in noninterest income. |
|
(d) | | | | Twelve months ended December 31, 2008 includes $312.9 million included in Mortgage banking noninterest income and $15.2 million included in revenue from loan sales and securitizations. |
Additionally, FHN may be required, from time to time, to measure certain other financial assets at fair value on a nonrecurring basis in accordance with GAAP. These adjustments to fair value usually result from the application of lower of cost or market accounting or write-downs of individual assets. For assets measured at fair value on a nonrecurring basis in 2008 which were still held in the balance sheet at December 31, 2008, the following table provides the level of valuation assumptions used to determine each adjustment and the carrying value of the related individual assets or portfolios at December 31, 2008.
120
FIRST HORIZON NATIONAL CORPORATION
Note 23 q Fair Value of Assets & Liabilities (continued)
| | | | | | | | | | |
(Dollars in thousands) | | Carrying value at December 31, 2008 | | Twelve Months
Ended
December 31,
2008 |
| | Total | | Level 1 | | Level 2 | | Level 3 | | Total losses |
|
Loans held for sale | | | $ | | 116,892 | | | | $ | | - | | | | $ | | 78,739 | | | | $ | | 38,153 | | | | $ | | 27,503 | |
Securities available for sale | | | | 1,117 | | | | | - | | | | | 1,117 | | | | | - | | | | | 1,897 | (a) | |
Loans, net of unearned income (b) | | | | 414,902 | | | | | - | | | | | - | | | | | 414,902 | | | | | 198,485 | |
Other assets | | | | 113,832 | | | | | - | | | | | - | | | | | 113,832 | | | | | 9,229 | |
| | | |
| | | | | | | | | | | $ | | 237,114 | |
|
|
(a) | | | | Represents recognition of other than temporary impairment for cost method investments classified within securities available for sale. |
|
(b) | | | | Represents carrying value of loans for which adjustments are based on the appraised value of the collateral. Writedowns on these loans are recognized as part of provision. |
In first quarter 2008, FHN recognized a lower of cost or market reduction in value of $36.2 million for its warehouse of trust preferred loans, which was classified within level 3 for loans held for sale at March 31, 2008. The determination of estimated market value for the warehouse was based on a hypothetical securitization transaction for the warehouse as a whole. FHN used observable data related to prior securitization transactions as well as changes in credit spreads in the collateralized debt obligation (CDO) market since the most recent transaction. FHN also incorporated significant internally developed assumptions within its valuation of the warehouse, including estimated prepayments and estimated defaults. In accordance with SFAS No. 157, FHN excluded transaction costs related to the hypothetical securitization in determining fair value.
In second quarter 2008, FHN designated its trust preferred warehouse as held to maturity. Accordingly, these loans were excluded from loans held for sale in the nonrecurring measurements table as of December 31, 2008. In conjunction with the transfer of these loans to held to maturity status, FHN performed a lower of cost or market analysis on the date of transfer. This analysis was based on the pricing of market transactions involving securities similar to those held in the trust preferred warehouse with consideration given, as applicable, to any differences in characteristics of the market transactions, including issuer credit quality, call features and term. As a result of the lower of cost or market analysis, FHN determined that its existing valuation of the trust preferred warehouse was appropriate.
In first quarter 2008, FHN recognized a lower of cost or market reduction in value of $17.0 million relating to mortgage warehouse loans. Approximately $10.5 million was attributable to increased delinquencies or aging of loans. The market values for these loans were estimated using historical sales prices for these type loans, adjusted for incremental price concessions that a third party investor is assumed to require due to tightening credit markets and deteriorating housing prices. These assumptions were based on published information about actual and projected deteriorations in the housing market as well as changes in credit spreads. The remaining reduction in value of $6.5 million was attributable to lower investor prices, due primarily to credit spread widening. This reduction was calculated by comparing the total fair value of loans (using the same methodology that is used for fair value option loans) to carrying value for the aggregate population of loans that were not delinquent or aged.
FHN also recognized a lower of cost or market reduction in value of $8.3 million relating to mortgage warehouse loans during second quarter of 2008. Approximately $7.1 million was attributable to increased repurchases and delinquencies or aging of warehouse loans; the remaining reduction in value was attributable to lower investor prices, due primarily to credit spread widening. The market values for these loans were estimated using historical sales prices for these types of loans, adjusted for incremental price concessions that a third party investor was assumed to require due to tightening credit markets and deteriorating housing prices. These assumptions were based on published information about actual and projected deteriorations in the housing market as well as changes in credit spreads.
FHN also recognized a lower of cost or market reduction in value of $1.3 million relating to mortgage warehouse loans during third quarter of 2008. This was primarily attributable to increased repurchases and delinquencies of
121
FIRST HORIZON NATIONAL CORPORATION
Note 23 q Fair Value of Assets & Liabilities (continued)
warehouse loans with some reduction in value attributable to lower investor prices, due primarily to credit spread widening. The market values for these loans were estimated using historical sales prices for similar type loans, adjusted for incremental price concessions that a third party investor was assumed to require due to tightening credit markets and deteriorating housing prices. These assumptions were based on published information about actual and projected deteriorations in the housing market as well as changes in credit spreads.
FHN also recognized a lower of cost or market reduction in value of $.2 million relating to mortgage warehouse loans during the fourth quarter of 2008. This was primarily attributable to increased levels and severity of repurchases and delinquencies of warehouse loans partially offset by higher investor prices, due primarily to lower overall market interest rate levels. The market values for these loans were estimated using historical sales prices for similar type loans, adjusted for incremental price concessions that a third party investor was assumed to require due to tightening credit markets and deteriorating housing prices. These assumptions were based on published information about actual and projected deteriorations in the housing market as well as changes in credit spreads.
Fair Value Option
As described above, upon adoption of SFAS No. 159, management elected fair value accounting for substantially all forms of mortgage loans originated for sale. In the second and third quarters of 2008, agreements were reached for the transfer of certain servicing assets and delivery of the servicing assets occurred. However, due to certain recourse provisions, these transactions did not qualify for sale treatment and the associated proceeds have been recognized within commercial paper and other short term borrowings in the Consolidated Statement of Position as of December 31, 2008. Since servicing assets are recognized at fair value and since changes in the fair value of related financing liabilities will exactly mirror the change in fair value of the associated servicing assets, management elected to account for the financing liabilities at fair value under SFAS No. 159. Additionally, as the servicing assets have already been delivered to the buyer, the fair value of the financing liabilities associated with the transaction does not reflect any instrument-specific credit risk.
The following table reflects the differences between the fair value carrying amount of mortgages held for sale measured at fair value under SFAS No. 159 and the aggregate unpaid principal amount FHN is contractually entitled to receive at maturity.
| | | | | | |
(Dollars in thousands) | | December 31, 2008 |
| | Fair value
carrying
amount | | Aggregate
unpaid
principal | | Fair value
carrying amount
less aggregate
unpaid principal |
|
Loans held for sale reported at fair value: | | | | | | |
Total loans | | | $ | | 268,952 | | | | $ | | 305,303 | | | | $ | | (36,351 | ) | |
Nonaccrual loans | | | | 2,098 | | | | | 4,785 | | | | | (2,687 | ) | |
Loans 90 days or more past due and still accruing | | | | 2,176 | | | | | 4,898 | | | | | (2,722 | ) | |
|
Assets and liabilities accounted for under SFAS No. 159 are initially measured at fair value. Gains and losses from initial measurement and subsequent changes in fair value are recognized in earnings. The change in fair value related to initial measurement and subsequent changes in fair value for mortgage loans held for sale and other short term borrowings for which FHN elected the fair value option are included in current period earnings with classification in the income statement line item shown below.
For the year ended December 31, 2008, the amounts for loans held for sale includes approximately $21.9 million of losses included in earnings that are attributable to changes in instrument-specific credit risk, which was determined based on both a quality adjustment for delinquencies and the full credit spread on the non-conforming loans.
122
FIRST HORIZON NATIONAL CORPORATION
Note 23 q Fair Value of Assets & Liabilities (continued)
| | | | | | |
(Dollars in thousands) | | Twelve Months Ended
December 31, 2008 | | | | |
|
Changes in fair value included in net income: | | | | | | |
Mortgage banking noninterest income | | | | | | |
Loans held for sale | | | $ | | (21,870 | ) | | | | | |
Commercial paper and other short-term borrowings | | | | (19,974 | ) | | | | | |
Estimated changes in fair value due to credit risk | | | | (21,865 | ) | | | | | |
|
Interest income on mortgage loans held for sale measured at fair value is calculated based on the note rate of the loan and is recorded in the interest income section of the Consolidated Statements of Income as interest on loans held for sale.
Determination of Fair Value
In accordance with SFAS No. 157, fair values are based on the price that would be received to sell an asset or paid to transfer a liability in an orderly transaction between market participants at the measurement date. The following describes the assumptions and methodologies used to estimate the fair value for financial instruments and MSR recorded at fair value in the Consolidated Statement of Condition and for estimating the fair value of financial instruments for which fair value is disclosed under Statement of Financial Accounting Standards No. 107, “Disclosure about Fair Value of Financial Instruments” (SFAS No. 107).
Short-term financial assets. Federal funds sold, securities purchased under agreements to resell and interest bearing deposits with other financial institutions are carried at historical cost. The carrying amount is a reasonable estimate of fair value because of the relatively short time between the origination of the instrument and its expected realization.
Trading securities and trading liabilities.Trading securities and trading liabilities are recognized at fair value through current earnings. Trading inventory held for broker-dealer operations is included in trading securities and trading liabilities. Broker-dealer long positions are valued at bid price in the bid-ask spread. Short positions are valued at the ask price. Inventory positions are valued using observable inputs including current market transactions, LIBOR and U.S. treasury curves, credit spreads and consensus prepayment speeds.
Trading securities also includes retained interests in prior securitizations that qualify as financial assets which may include certificated residual interests, excess interest (structured as interest-only strips), interest-only strips, principal-only strips, or subordinated bonds. Residual interests represent rights to receive earnings to the extent of excess income generated by the underlying loans. Excess interest represents rights to receive interest from serviced assets that exceed contractually specified rates. Principal-only strips are principal cash flow tranches, and interest-only strips are interest cash flow tranches. Subordinated bonds are bonds with junior priority. All financial assets retained from a securitization are recognized on the Consolidated Statements of Condition in trading securities at fair value with realized and unrealized gains and losses included in current earnings as a component of noninterest income on the Consolidated Statements of Income.
The fair values of the certificated residual interests and the excess interest are determined using market prices from closely comparable assets such as MSR that are tested against prices determined using a valuation model that calculates the present value of estimated future cash flows. The fair value of these retained interests typically changes based on changes in the discount rate and differences between modeled prepayment speeds and credit losses and actual experience. In some instances, FHN retains interests in the loans it securitized by retaining certificated principal only strips or subordinated bonds. Subsequent to the MetLife transaction, FHN uses observable inputs such as trades of similar instruments, yield curves, credit spreads and consensus prepayment speeds to determine the fair value of principal only strips. Prior to the MetLife transaction, FHN used the market prices from comparable assets such as publicly traded FNMA trust principal only strips that are adjusted to reflect the relative risk difference between readily marketable securities and privately issued securities in valuing the principal only strips. The fair value of subordinated bonds is determined using the best available market information, which may
123
FIRST HORIZON NATIONAL CORPORATION
Note 23 q Fair Value of Assets & Liabilities (continued)
include trades of comparable securities, independently provided spreads to other marketable securities, and published market research. Where no market information is available, the company utilizes an internal valuation model. As of December 31, 2008, no market information was available, and the subordinated bonds were valued using an internal model which includes assumptions about timing, frequency and severity of loss, prepayment speeds of the underlying collateral, and the yield that a market participant would require. The assumptions were consistent with those embedded in the December 31, 2007 values, when there was more market information available, except that loss frequency and loss severity assumptions were worsened consistent with published industry cumulative historical loss information and published market projections of future deteriorations in real estate values. As of December 31, 2007, the subordinated bonds were valued using trades of comparable market securities and independently provided spreads.
Securities available for sale. Securities available for sale includes the investment portfolio accounted for as available-for-sale under SFAS No. 115, federal bank stock holdings, short-term investments in mutual funds and venture capital investments. Valuations of available-for-sale securities are performed using observable inputs obtained from market transactions in similar securities. Typical inputs include LIBOR and U.S. treasury curves, consensus prepayment estimates and credit spreads. When available, broker quotes are used to support these valuations.
Stock held in the Federal Reserve Bank and Federal Home Loan Banks are recognized at historical cost in the Consolidated Statements of Condition which is considered to approximate fair value. Short-term investments in mutual funds are measured at the funds’ reported closing net asset values. Venture capital investments are typically measured using significant internally generated inputs including adjustments to referenced transaction values and discounted cash flows analysis.
Securities held to maturity. Valuations are performed using observable inputs obtained from market transactions in similar securities. Typical inputs include LIBOR and U.S. treasury curves, consensus prepayment estimates and credit spreads.
Loans held for sale. The fair value of mortgage loans whose principal market is the securitization market is based on recent security trade prices for similar product with a similar delivery date, with necessary pricing adjustments to convert the security price to a loan price. Loans whose principal market is the whole loan market are priced based on recent observable whole loan trade prices or published third party bid prices for similar product, with necessary pricing adjustments to reflect differences in loan characteristics. Typical adjustments to security prices for whole loan prices include adding the value of MSR to the security price or to the whole loan price if the price is servicing retained, adjusting for interest in excess of (or less than) the required coupon or note rate, adjustments to reflect differences in the characteristics of the loans being valued as compared to the collateral of the security or the loan characteristics in the benchmark whole loan trade, adding interest carry, reflecting the recourse obligation that will remain after sale, and adjusting for changes in market liquidity or interest rates if the benchmark security or loan price is not current. Additionally, loans that are delinquent or otherwise significantly aged are discounted to reflect the less marketable nature of these loans. The fair value of non-mortgage loans held for sale is approximated by their carrying values based on current transaction values.
Loans, net of unearned income.Loans, net of unearned income are recognized at the amount of funds advanced, less charge offs and an estimation of credit risk represented by the allowance for loan losses. The fair value estimates for SFAS No. 107 disclosure purposes differentiate loans based on their financial characteristics, such as product classification, loan category, pricing features and remaining maturity.
The fair value of floating rate loans is estimated through comparison to recent market activity in loans of similar product types, with adjustments made for differences in loan characteristics. In situations where market pricing inputs are not available, fair value is considered to approximate book value due to the monthly repricing for commercial and consumer loans, with the exception of floating rate 1-4 family residential mortgage loans which reprice annually and will lag movements in market rates. The fair value for floating rate 1-4 family mortgage loans is calculated by discounting future cash flows to their present value. Future cash flows are discounted to their present value by using the current rates at which similar loans would be made to borrowers with similar credit ratings and for the same time period. Prepayment assumptions based on historical prepayment speeds and industry speeds for similar loans have been applied to the floating rate 1-4 family residential mortgage portfolio.
124
FIRST HORIZON NATIONAL CORPORATION
Note 23 q Fair Value of Assets & Liabilities (continued)
The fair value of fixed rate loans is estimated through comparison to recent market activity in loans of similar product types, with adjustments made for differences in loan characteristics. In situations where market pricing inputs are not available, fair value is estimated by discounting future cash flows to their present value. Future cash flows are discounted to their present value by using the current rates at which similar loans would be made to borrowers with similar credit ratings and for the same time period. Prepayment assumptions based on historical prepayment speeds and industry speeds for similar loans have been applied to the fixed rate mortgage and installment loan portfolios.
Mortgage servicing rights.FHN recognizes all its classes of MSR at fair value. Since sales of MSR tend to occur in private transactions and the precise terms and conditions of the sales are typically not readily available, there is a limited market to refer to in determining the fair value of MSR. As such, like other participants in the mortgage banking business, FHN relies primarily on a discounted cash flow model to estimate the fair value of its MSR. This model calculates estimated fair value of the MSR using predominant risk characteristics of MSR such as interest rates, type of product (fixed vs. variable), age (new, seasoned, or moderate), agency type and other factors. FHN uses assumptions in the model that it believes are comparable to those used by brokers and other service providers. FHN also periodically compares its estimates of fair value and assumptions with brokers, service providers, and recent market activity and against its own experience. Due to ongoing disruptions in the mortgage market, more emphasis has been placed on third party broker price discovery and, when available, observable market trades in valuing MSR.
Derivative assets and liabilities.Derivatives include interest rate lock commitments from mortgage banking operations and other derivative instruments primarily used in risk management activities. Interest rate lock commitments are derivatives pursuant to SFAS No. 133 and are therefore recorded at estimates of fair value. Effective January 1, 2008, FHN applied the provisions of SAB No. 109 prospectively for derivative loan commitments issued or modified after that date. SAB No. 109 requires inclusion of expected net future cash flows related to loan servicing activities in the fair value measurement of a written loan commitment. Also on January 1, 2008, FHN adopted SFAS No. 157, which affected the valuation of interest rate lock commitments previously measured under the guidance of EITF 02-3. The interest rate lock commitment does not bind the potential borrower to entering into the loan, nor does it guarantee that FHN will approve the potential borrower for the loan. Therefore, when determining fair value, FHN makes estimates of expected "fallout” (locked pipeline loans not expected to close), using models, which consider cumulative historical fallout rates and other factors. Other valuation inputs associated with interest rate lock commitments are determined in a manner consistent with that used for mortgage loans held for sale described above.
Fair value for forwards and futures contracts used to hedge the mortgage pipeline and warehouse are based on current transactions involving identical securities. Valuations of other derivatives are based on inputs observed in active markets for similar instruments. Typical inputs include the LIBOR curve, option volatility and option skew.
Nonearning assets. For the purposes of SFAS No. 107 disclosures, nonearning assets include cash and due from banks, accrued interest receivable, and capital markets receivables. Due to the short-term nature of cash and due from banks, accrued interest receivable and capital markets receivables, the fair value is approximated by the book value.
Other assets. For purposes of SFAS No. 107 disclosures, other assets consists of investments in low income housing partnerships and deferred compensation assets that are considered financial assets. Investments in low income housing partnerships are written down to estimated fair value quarterly based on the estimated value of the associated tax credits. Deferred compensation assets are recognized at fair value, which is based on quoted prices in active markets.
Defined maturity deposits. The fair value is estimated by discounting future cash flows to their present value. Future cash flows are discounted by using the current market rates of similar instruments applicable to the remaining maturity. For the purpose of SFAS No. 107 disclosures, defined maturity deposits include all certificates of deposit and other time deposits.
125
FIRST HORIZON NATIONAL CORPORATION
Note 23 q Fair Value of Assets & Liabilities (continued)
Undefined maturity deposits. In accordance with SFAS No. 107, the fair value is approximated by the book value. For the purpose of this disclosure, undefined maturity deposits include demand deposits, checking interest accounts, savings accounts, and money market accounts.
Short-term financial liabilities. The fair value of federal funds purchased, securities sold under agreements to repurchase, commercial paper and other short-term borrowings is approximated by the book value. The carrying amount is a reasonable estimate of fair value because of the relatively short time between the origination of the instrument and its expected realization. Commercial paper and short-term borrowings includes a liability associated with transfers of mortgage servicing rights that did not qualify for sale accounting. This liability is accounted for at elected fair value, which is measured consistent with the related MSR, as described above.
Long-term debt. The fair value is approximated by the present value of the contractual cash flows discounted by the investor’s yield which considers FHN’s and FTBNA’s debt ratings.
Other noninterest-bearing liabilities. For the purpose of SFAS No. 107 disclosures, other noninterest-bearing liabilities include accrued interest payable and capital markets payables. Due to the short-term nature of these liabilities, the book value is considered to approximate fair value.
Loan Commitments.Fair values are based on fees charged to enter into similar agreements taking into account the remaining terms of the agreements and the counterparties’ credit standing.
Other Commitments.Fair values are based on fees charged to enter into similar agreements.
SFAS No. 107 requires the disclosure of estimated fair values of all asset, liability and off-balance sheet financial instruments. The following fair value estimates are determined as of a specific point in time utilizing various assumptions and estimates. The use of assumptions and various valuation techniques, as well as the absence of secondary markets for certain financial instruments, will likely reduce the comparability of fair value disclosures between financial institutions. Due to market illiquidity, the fair values for loans, net of unearned income, loans held for sale, and long-term debt as of December 31, 2008, involved the use of significant internally-developed pricing assumptions for certain components of these line items. These assumptions are considered to reflect inputs that market participants would use in transactions involving these instruments as of the measurement date. The following table summarizes the book value and estimated fair value of financial instruments recorded in the Consolidated Statements of Condition as well as off-balance sheet commitments as of December 31, 2008 and 2007. In accordance with SFAS No. 107, we have not included assets and liabilities that are not financial instruments (including MSR) in the table below. This includes the value of long-term relationships with deposit and trust customers, premises and equipment, goodwill and other intangibles, deferred taxes and certain other assets and other liabilities. Accordingly, the total of the fair value amounts does not represent, and should not be construed to represent, the underlying value of the company.
126
FIRST HORIZON NATIONAL CORPORATION
Note 23 q Fair Value of Assets & Liabilities (continued)
| | | | | | | | |
(Dollars in thousands) | | December 31, 2008 | | December 31, 2007 |
| | Book
Value | | Fair
Value | | Book
Value | | Fair
Value |
|
Assets: | | | | | | | | |
Loans, net of unearned income | | | $ | | 20,428,980 | | | | $ | | 18,787,501 | | | | $ | | 21,761,175 | | | | $ | | 21,770,188 | |
Short-term financial assets | | | | 980,150 | | | | | 980,150 | | | | | 1,128,917 | | | | | 1,128,917 | |
Trading securities | | | | 945,766 | | | | | 945,766 | | | | | 1,768,763 | | | | | 1,768,763 | |
Loans held for sale | | | | 566,654 | | | | | 566,654 | | | | | 3,751,590 | | | | | 3,789,845 | |
Securities available for sale | | | | 3,125,153 | | | | | 3,125,153 | | | | | 3,032,551 | | | | | 3,032,551 | |
Securities held to maturity | | | | - | | | | | - | | | | | 240 | | | | | 242 | |
Derivative assets | | | | 576,131 | | | | | 576,131 | | | | | 208,747 | | | | | 208,747 | |
Nonearning assets | | | | 1,839,227 | | | | | 1,839,227 | | | | | 1,846,879 | | | | | 1,846,879 | |
Other assets | | | | 140,797 | | | | | 140,797 | | | | | 197,396 | | | | | 197,396 | |
|
Liabilities: | | | | | | | | |
Deposits: | | | | | | | | |
Defined maturity | | | $ | | 3,676,880 | | | | $ | | 3,761,102 | | | | $ | | 6,012,551 | | | | $ | | 6,042,083 | |
Undefined maturity | | | | 10,564,934 | | | | | 10,564,934 | | | | | 11,019,734 | | | | | 11,019,734 | |
|
Total deposits | | | | 14,241,814 | | | | | 14,326,036 | | | | | 17,032,285 | | | | | 17,061,817 | |
Trading liabilities | | | | 359,502 | | | | | 359,502 | | | | | 556,144 | | | | | 556,144 | |
Short-term financial liabilities | | | | 6,030,768 | | | | | 6,030,768 | | | | | 8,273,591 | | | | | 8,273,591 | |
Long-term debt | | | | 4,767,660 | | | | | 3,842,696 | | | | | 6,828,417 | | | | | 6,636,214 | |
Derivative liabilities | | | | 262,434 | | | | | 262,434 | | | | | 123,580 | | | | | 123,580 | |
Other noninterest-bearing liabilities | | | | 1,191,758 | | | | | 1,191,758 | | | | | 713,538 | | | | | 713,538 | |
|
| | Contractual
Amount | | Fair
Value | | Contractual
Amount | | Fair
Value |
| | | | | | | | |
|
| | | | | | | | |
Off-Balance Sheet Commitments: | | | | | | | | |
Loan commitments | | | $ | | 9,600,616 | | | | $ | | 2,654 | | | | $ | | 14,099,224 | | | | $ | | 5,212 | |
Other commitments | | | | 631,716 | | | | | 6,166 | | | | | 809,133 | | | | | 7,671 | |
|
Certain previously reported amounts have been reclassified to agree with current presentation.
127
FIRST HORIZON NATIONAL CORPORATION
Note 24 q Loan Sales and Securitizations
FHN historically utilized loan sales and securitizations as a significant source of liquidity for its mortgage banking operations. With FHN’s current focus on origination of mortgages within its regional banking footprint and the related sale of national mortgage origination offices to MetLife, loan sale and securitization activity has decreased significantly since third quarter 2008. Additionally, subsequent to the MetLife transaction, FHN is no longer retaining financial interests in loans it transfers to third parties. In accordance with applicable accounting standards, loan sale and securitization activity for which FHN has retained an interest in the related transfers is included in this disclosure. For classification purposes, all loans transferred to GSE (e.g., FNMA, FHLMC and GNMA), including those subsequently securitized by an agency, are considered loan sales while transfers attributed to securitizations consist solely of proprietary securitizations executed by FHN.
During 2008, 2007 and 2006, FHN transferred $19.5 billion, $20.1 billion and $15.5 billion, respectively of single-family residential mortgage loans in sales that were not securitizations. These transactions primarily reflect sales to GSE. In 2008, 2007 and 2006, FHN recognized net pre-tax gains of $236.7 million, $111.9 million and $188.4 million, respectively, from the sale of single-family residential mortgage loans which includes gains recognized on the capitalization of MSR associated with these loans.
During 2007 and 2006, FHN transferred $1.1 billion and $2.6 billion, respectively, of home equity loans and HELOC in sales that were not securitizations. These transactions were executed with other financial institutions. In 2007 and 2006, FHN recognized net pre-tax gains of $20.3 million and $37.5 million, respectively, from these transactions, which includes gains recognized on the capitalization of MSR associated with these loans.
During 2007 and 2006, FHN securitized $5.2 billion and $8.6 billion, respectively, of single-family residential mortgage loans in proprietary securitization transactions, and the resulting securities were sold as senior and subordinate certificates. In 2007 and 2006, FHN recognized net pre-tax gains of $11.7 million and $124.1 million, respectively, from the sale of securitized single-family residential mortgage loans which includes gains recognized on the capitalization of MSR associated with these loans.
During 2008, 2007 and 2006, FHN transferred $19.9 million, $33.8 million and $69.4 million, respectively of HELOC related to proprietary securitization transactions. In 2008, 2007 and 2006, FHN recognized net pre-tax gains of $.4 million, $.9 million and $2.1 million, respectively related to HELOC securitizations which includes gains recognized on the capitalization of MSR associated with these loans.
In 2008 and 2007, FHN capitalized approximately $242.8 million and $297.0 million, respectively, in originated MSR related to loan sales. In 2008 and 2007, FHN capitalized approximately $.2 million and $66.3 million, respectively, in originated MSR related to securitizations. These MSR, as well as other MSR held by FHN, are discussed further in Note 6 – Mortgage Servicing Rights. In certain cases, FHN continues to service and receive servicing fees related to the transferred loans, and has also retained interests in loan sales and securitizations including residual interest certificates and financial assets including excess interest (structured as interest-only strips), principal-only strips, interest-only strips, or subordinated bonds. FHN received annual servicing fees approximating .27 percent in 2008, .28 percent in 2007 and .33 percent in 2006 of the outstanding balance of underlying single-family residential mortgage loans. FHN received annual servicing fees approximating .50 percent in 2008, 2007 and 2006 of the outstanding balance of underlying loans for HELOC and home equity loans transferred. The investors and the securitization trusts have no recourse to other assets of FHN for failure of debtors to pay when due. FHN is obligated to repurchase loans under standard representations and warranties provided to the buyers, which include evidence of borrower fraud and failure to adhere to underwriting guidelines.
Interests retained from loan sales, including agency securitizations, include MSR and excess interest. Interests retained from proprietary securitizations include MSR and various financial assets. MSR are initially valued at fair value, and the remaining retained interests are initially valued by allocating the remaining cost basis of the loan between the security or loan sold and the remaining retained interests based on their relative fair values at the time of sale or securitization. MSR are recognized at fair value in periods subsequent to the related sale or securitization with realized and unrealized gains and losses included in current earnings as a component of noninterest income on the Consolidated Statements of Income.
128
FIRST HORIZON NATIONAL CORPORATION
Note 24 q Loan Sales and Securitizations (continued)
Financial assets retained in a proprietary or GSE securitization may include certificated residual interests, excess interest (structured as interest-only strips), interest-only strips, principal-only strips, or subordinated bonds. Residual interests represent rights to receive earnings to the extent of excess income generated by the underlying loans. Excess interest represents rights to receive interest from serviced assets that exceed contractually specified rates. Principal-only strips are principal cash flow tranches, and interest-only strips are interest cash flow tranches. Subordinated bonds are bonds with junior priority. All financial assets retained from a securitization are recognized on the on the Consolidated Statements of Condition in trading securities at fair value with realized and unrealized gains and losses included in current earnings as a component of noninterest income on the Consolidated Statements of Income.
As of December 31, 2008 and 2007, $103.0 million and $230.3 million, respectively, of first lien MSR are associated with proprietary securitization transactions with the remainder associated with loan sales. As of December 31, 2008 and 2007, second lien MSR includes $1.0 million and $1.4 million, respectively, of MSR related to prior securitization activity with the remainder related to loan sales. As of December 31, 2008 and 2007, HELOC MSR included $1.5 million and $2.3 million, respectively, of MSR related to prior securitization activity with the remainder related to loan sales. As of December 31, 2008 and 2007, $57.0 million and $131.6 million, respectively, of excess interest IO are associated with proprietary securitization transactions with the remainder associated with loan sales. All other retained interests relate to securitization activity.
The sensitivity of the fair value of all retained or purchased interests for MSR to immediate 10 percent and 20 percent adverse changes in assumptions on December 31, 2008, are as follows:
| | | | | | |
(Dollars in thousands except for annual cost to service) | | First
Liens | | Second
Liens | | HELOC |
|
December 31, 2008 | | | | | | |
Fair value of retained interests | | | $ | | 354,397 | | | | $ | | 13,557 | | | | $ | | 8,890 | |
Weighted average life (in years) | | | | 2.6 | | | | | 2.1 | | | | | 2.4 | |
Annual prepayment rate | | | | 32.8 | % | | | | | 36.5 | % | | | | | 34.0 | % | |
Impact on fair value of 10% adverse change | | | $ | | (26,106 | ) | | | | $ | | (1,336 | ) | | | | $ | | (729 | ) | |
Impact on fair value of 20% adverse change | | | | (49,444 | ) | | | | | (2,540 | ) | | | | | (1,392 | ) | |
Annual discount rate on servicing cash flows | | | | 11.1 | % | | | | | 14.0 | % | | | | | 18.0 | % | |
Impact on fair value of 10% adverse change | | | $ | | (7,780 | ) | | | | $ | | (335 | ) | | | | $ | | (264 | ) | |
Impact on fair value of 20% adverse change | | | | (15,164 | ) | | | | | (653 | ) | | | | | (512 | ) | |
Annual cost to service (per loan)* | | | $ | | 54 | | | | $ | | 50 | | | | $ | | 50 | |
Impact on fair value of 10% adverse change | | | | (4,284 | ) | | | | | (331 | ) | | | | | (277 | ) | |
Impact on fair value of 20% adverse change | | | | (8,569 | ) | | | | | (663 | ) | | | | | (554 | ) | |
Annual earnings on escrow | | | | 1.6 | % | | | | | .4 | % | | | | | .4 | % | |
Impact on fair value of 10% adverse change | | | $ | | (6,318 | ) | | | | $ | | (58 | ) | | | | $ | | (28 | ) | |
Impact on fair value of 20% adverse change | | | | (12,635 | ) | | | | | (117 | ) | | | | | (55 | ) | |
|
|
* | | | | The annual cost to service includes an incremental cost to service delinquent loans. Historically, this fair value sensitivity disclosure has not included this incremental cost. The annual cost to service first-lien mortgage loans without the incremental cost to service delinquent loans was $44 as of December 31, 2008. |
129
FIRST HORIZON NATIONAL CORPORATION
Note 24 q Loan Sales and Securitizations (continued)
The sensitivity of the fair value of all retained or purchased interests for MSR to immediate 10 percent and 20 percent adverse changes in assumptions on December 31, 2007, are as follows:
| | | | | | (Dollars in thousands except for annual cost to service) | | First
Liens | | Second
Liens | | HELOC |
|
December 31, 2007 | | | | | | |
Fair value of retained interests | | | $ | | 1,122,415 | | | | $ | | 25,832 | | | | $ | | 11,573 | |
Weighted average life (in years) | | | | 5.4 | | | | | 2.6 | | | | | 2.9 | |
Annual prepayment rate | | | | 16.0 | % | | | | | 30.9 | % | | | | | 42.0 | % | |
Impact on fair value of 10% adverse change | | | $ | | (51,647 | ) | | | | $ | | (1,426 | ) | | | | $ | | (733 | ) | |
Impact on fair value of 20% adverse change | | | | (98,892 | ) | | | | | (2,707 | ) | | | | | (1,399 | ) | |
Annual discount rate on servicing cash flows | | | | 11.1 | % | | | | | 14.0 | % | | | | | 18.0 | % | |
Impact on fair value of 10% adverse change | | | $ | | (41,043 | ) | | | | $ | | (674 | ) | | | | $ | | (295 | ) | |
Impact on fair value of 20% adverse change | | | | (79,167 | ) | | | | | (1,313 | ) | | | | | (574 | ) | |
Annual cost to service (per loan)* | | | $ | | 56 | | | | $ | | 50 | | | | $ | | 50 | |
Impact on fair value of 10% adverse change | | | | (14,213 | ) | | | | | (465 | ) | | | | | (293 | ) | |
Impact on fair value of 20% adverse change | | | | (28,425 | ) | | | | | (929 | ) | | | | | (585 | ) | |
Annual earnings on escrow | | | | 3.8 | % | | | | | 4.3 | % | | | | | 4.4 | % | |
Impact on fair value of 10% adverse change | | | $ | | (26,170 | ) | | | | $ | | (697 | ) | | | | $ | | (412 | ) | |
Impact on fair value of 20% adverse change | | | | (54,942 | ) | | | | | (1,393 | ) | | | | | (825 | ) | |
|
|
* | | | | The annual cost to service includes an incremental cost to service delinquent loans. Historically, this fair value sensitivity disclosure has not included this incremental cost. The annual cost to service first-lien mortgage loans without the incremental cost to service delinquent loans was $50 as of December 31, 2007. |
The sensitivity of the fair value of retained interests for other residuals to immediate 10 percent and 20 percent adverse changes in assumptions on December 31, 2008, are as follows:
| | | | | | | | | | | | (Dollars in thousands except for
annual cost to service) | | Excess
Interest
IO | | Certificated
PO | | IO | | Subordinated
Bonds | | Residual
Interest
Certificates
2nd Liens | | Residual
Interest
Certificates
HELOC |
|
December 31, 2008 | | | | | | | | | | | | |
Fair value of retained interests | | | $ | | 102,657 | | | | $ | | 13,887 | | | | $ | | 406 | | | | $ | | 4,637 | | | | $ | | 3,504 | | | | $ | | 4,717 | |
Weighted average life (in years) | | | | 2.6 | | | | | 4.8 | | | | | 8.3 | | | | | 2.0 | | | | | 2.6 | | | | | 2.3 | |
Annual prepayment rate | | | | 32.1 | % | | | | | 49.4 | % | | | | | 12.7 | % | | | | | 7.1 | % | | | | | 29.6 | % | | | | | 27.0 | % | |
Impact on fair value of 10% adverse change | | | $ | | (11,019 | ) | | | | $ | | (498 | ) | | | | $ | | (12 | ) | | | | $ | | (211 | ) | | | | $ | | (37 | ) | | | | $ | | (397 | ) | |
Impact on fair value of 20% adverse change | | | | (20,934 | ) | | | | | (1,127 | ) | | | | | (22 | ) | | | | | (258 | ) | | | | | (70 | ) | | | | | (751 | ) | |
Annual discount rate on residual cash flows | | | | 12.2 | % | | | | | 30.6 | % | | | | | 19.3 | % | | | | | 26.3 | % | | | | | 34.9 | % | | | | | 33.0 | % | |
Impact on fair value of 10% adverse change | | | $ | | (3,543 | ) | | | | $ | | (370 | ) | | | | $ | | (21 | ) | | | | $ | | (163 | ) | | | | $ | | (137 | ) | | | | $ | | (443 | ) | |
Impact on fair value of 20% adverse change | | | | (6,897 | ) | | | | | (781 | ) | | | | | (40 | ) | | | | | (291 | ) | | | | | (259 | ) | | | | | (826 | ) | |
|
130
FIRST HORIZON NATIONAL CORPORATION
Note 24 q Loan Sales and Securitizations (continued)
The sensitivity of the fair value of retained interests for other residuals to immediate 10 percent and 20 percent adverse changes in assumptions on December 31, 2007, are as follows:
| | | | | | | | | | | | |
(Dollars in thousands except for
annual cost to service) | | Excess
Interest
IO | | Certificated
PO | | IO | | Subordinated
Bonds | | Residual
Interest
Certificates
2nd Liens | | Residual
Interest
Certificates
HELOC |
|
December 31, 2007 | | | | | | | | | | | | |
Fair value of retained interests | | | $ | | 396,701 | | | | $ | | 14,850 | | | | $ | | 526 | | | | $ | | 23,123 | | | | $ | | 5,036 | | | | $ | | 13,556 | |
Weighted average life (in years) | | | | 6.6 | | | | | 4.3 | | | | | 6.4 | | | | | 10.3 | | | | | 2.5 | | | | | 2.1 | |
Annual prepayment rate | | | | 12.8 | % | | | | | 18.5 | % | | | | | 14.8 | % | | | | | 14.9 | % | | | | | 29.0 | % | | | | | 35.0 | % | |
Impact on fair value of 10% adverse change | | | $ | | (19,006 | ) | | | | $ | | (626 | ) | | | | $ | | (26 | ) | | | | $ | | (268 | ) | | | | $ | | (53 | ) | | | | $ | | (493 | ) | |
Impact on fair value of 20% adverse change | | | | (36,546 | ) | | | | | (1,320 | ) | | | | | (50 | ) | | | | | (563 | ) | | | | | (96 | ) | | | | | (929 | ) | |
Annual discount rate on residual cash flows | | | | 12.1 | % | | | | | 13.9 | % | | | | | 12.7 | % | | | | | 33.3 | % | | | | | 33.0 | % | | | | | 31.0 | % | |
Impact on fair value of 10% adverse change | | | $ | | (15,855 | ) | | | | $ | | (537 | ) | | | | $ | | (22 | ) | | | | $ | | (1,492 | ) | | | | $ | | (196 | ) | | | | $ | | (558 | ) | |
Impact on fair value of 20% adverse change | | | | (30,505 | ) | | | | | (1,039 | ) | | | | | (43 | ) | | | | | (2,826 | ) | | | | | (369 | ) | | | | | (1,051 | ) | |
|
These sensitivities are hypothetical and should not be considered to be predictive of future performance. As the figures indicate, changes in fair value based on a 10 percent variation in assumptions generally cannot necessarily be extrapolated because the relationship of the change in assumption to the change in fair value may not be linear. Also, in this table, the effect of a variation in a particular assumption on the fair value of the retained interest is calculated independently from any change in another assumption. In reality, changes in one factor may result in changes in another, which might magnify or counteract the sensitivities. Furthermore, the estimated fair values as disclosed should not be considered indicative of future earnings on these assets.
FHN uses assumptions and estimates in determining the fair value allocated to retained interests at the time of initial securitization. The key economic assumptions used to measure the fair value of the MSR at the date of securitization or loan sale were as follows:
| | | | | | |
| | First
Liens | | Second
Liens | | HELOC |
|
2008 | | | | | | |
Weighted average life (in years) | | 2.4 – 7.0 | | 2.7 – 3.1 | | 1.7 – 1.8 |
Annual prepayment rate | | 11.7% – 34.7% | | 26% – 30% | | 43% – 44% |
Annual discount rate | | 9.36% – 11.7% | | 14.0% | | 18.0% |
Annual cost to service (per loan)* | | $52 – $69 | | $50 | | $50 |
Annual earnings on escrow | | 1.6% – 3.8% | | 3.80% – 5.32% | | 5.32% |
|
2007 | | | | | | |
Weighted average life (in years) | | 5.9 – 8.0 | | 2.7 – 3.1 | | 1.7 – 1.8 |
Annual prepayment rate | | 10.0% – 15.7% | | 26% – 30% | | 43% – 44% |
Annual discount rate | | 9.2% – 10.9% | | 14.0% | | 18.0% |
Annual cost to service (per loan)* | | $54 – $59 | | $50 | | $50 |
Annual earnings on escrow | | 3.8% – 5.0% | | 3.80% – 5.32% | | 5.32% |
|
|
* | | | | The annual cost to service includes an incremental cost to service delinquent loans. Historically, the disclosure of annual cost to service assumptions has not included this incremental cost. The range of annual cost to service loans without the incremental cost to service delinquent loans was $44 – $53 for MSR capitalized during the year ended December 31, 2008. |
131
FIRST HORIZON NATIONAL CORPORATION
Note 24 q Loan Sales and Securitizations (continued)
The key economic assumptions used to measure the fair value of other retained interests at the date of securitization were as follows:
| | | | | | | | Excess
Interest IO | | Certificated
PO | | Subordinated
Bond |
|
2008 | | | | | | |
Weighted average life (in years) | | 4.7 – 6.1 | | N/A | | N/A |
Annual prepayment rate | | 10.2% – 19.7% | | N/A | | N/A |
Annual discount rate | | 11.8% | | N/A | | N/A |
|
2007 | | | | | | |
Weighted average life (in years) | | 5.2 – 9.4 | | 3.1 – 5.8 | | 5.8 – 10.8 |
Annual prepayment rate | | 8.2% – 17.1% | | 14.6% – 23.8% | | 12.0% – 18.0% |
Annual discount rate | | 11.5% – 12.3% | | 6.1% – 14.9% | | 7.9% – 127.2% |
|
For the years ended December 31, 2008, 2007 and 2006, cash flows received and paid related to loan sales were as follows:
| | | | | | |
(Dollars in thousands) | | 2008 | | 2007 | | 2006 |
|
Proceeds from initial sales | | | $ | | 19,523,904 | | | | $ | | 21,282,957 | | | | $ | | 18,121,024 | |
Servicing fees retained* | | | | 161,336 | | | | | 244,901 | | | | | 248,274 | |
Purchases of GNMA guaranteed mortgages | | | | 103,436 | | | | | 160,928 | | | | | 159,666 | |
Purchases of delinquent or foreclosed assets | | | | 6,110 | | | | | 6,865 | | | | | 5,280 | |
Other cash flows received on retained interests | | | | 25,569 | | | | | 62,142 | | | | | 28,855 | |
|
|
* | | | | Includes servicing fees on MSR associated with loan sales and purchased MSR. |
Certain previously reported amounts have been reclassified to agree with current presentation.
For the years ended December 31, 2008, 2007 and 2006, cash flows received and paid related to securitizations were as follows:
| | | | | | (Dollars in thousands) | | 2008 | | 2007 | | 2006 |
|
Proceeds from initial securitizations | | | $ | | 19,925 | | | | $ | | 5,230,889 | | | | $ | | 8,630,289 | |
Servicing fees retained | | | | 87,786 | | | | | 86,740 | | | | | 94,242 | |
Purchases of delinquent or foreclosed assets | | | | 3,042 | | | | | 7,083 | | | | | 2,735 | |
Other cash flows received on retained interests | | | | 21,737 | | | | | 33,557 | | | | | 25,717 | |
|
Certain previously reported amounts have been reclassified to agree with current presentation.
132
FIRST HORIZON NATIONAL CORPORATION
Note 24 q Loan Sales and Securitizations (continued)
As of December 31, 2008, the principal amount of loans transferred through loan sales and securitizations and other loans managed with them, and the principal amount of delinquent loans, in addition to net credit losses during 2008 are as follows:
| | | | | | |
(Dollars in thousands) | | Total Principal
Amount of Loans | | Principal Amount
of Delinquent Loans (a) | | Net Credit
Losses (b) (c) |
|
| | On December 31, 2008 | | For the Year Ended
On December 31, 2008 |
Type of loan: | | | | | | |
Real estate residential | | | $ | | 50,602,981 | | | | $ | | 778,929 | | | | $ | | 283,862 | |
| | |
| | | | | | |
Total loans managed or transferred (d) | | | | 50,602,981 | | | | $ | | 778,929 | | | | $ | | 283,862 | |
| | | | | | |
Loans sold (e) | | | | (42,035,488 | ) | | | | | |
Loans held for sale (e) | | | | (406,058 | ) | | | | | |
| | |
Loans held in portfolio | | | $ | | 8,161,435 | | | | | |
| | |
|
(a) | | | | Loans 90 days or more past due include $42.2 million of GNMA guaranteed mortgages. $385.3 million of delinquent loans have been securitized while $127.6 million have been sold. |
|
(b) | | | | Principal amount of loans securitized and sold includes $37.1 billion of loans securitized through GNMA, FNMA or FHLMC. FHN retains interests other than servicing rights on a portion of these securitized loans. No delinquency or net credit loss data is included for the loans securitized through FNMA or FHMLC because these agencies retain credit risk. The remainder of loans securitized and sold were securitized through properietary trusts, where FHN retained interests other than servicing rights. |
|
(c) | | | | $142.9 million associated with loan sales and $17.7 million associated with securitizations. |
|
(d) | | | | Transferred loans are real estate residential loans in which FHN has a retained interest other than servicing rights. |
|
(e) | | | | $37.6 billion associated with loan sales and $4.9 billion associated with securitizations. |
As of December 31, 2007, the principal amount of loans transferred through loan sales and securitizations and other loans managed with them, and the principal amount of delinquent loans, in addition to net credit losses during 2007 are as follows:
| | | | | | |
(Dollars in thousands) | | Total Principal
Amount of Loans | | Principal Amount
of Delinquent Loans (a) | | Net Credit
Losses (b) (c) |
|
| | On December 31, 2007 | | For the Year Ended
December 31, 2007 |
Type of loan: | | | | | | |
Real estate residential | | | $ | | 90,021,060 | | | | $ | | 424,819 | | | | $ | | 75,661 | |
| | |
| | | | | | |
Total loans managed or transferred (d) | | | | 90,021,060 | | | | $ | | 424,819 | | | | $ | | 75,661 | |
| | | | | | |
Loans sold (e) | | | | (79,115,895 | ) | | | | | |
Loans held for sale (e) | | | | (3,113,280 | ) | | | | | |
| | |
Loans held in portfolio | | | $ | | 7,791,885 | | | | | |
| | |
|
(a) | | | | Loans 90 days or more past due include $190.7 million of GNMA guaranteed mortgages. $89.7 million of delinquent loans have been securitized and $86.3 million were sold. |
|
(b) | | | | Principal amount of loans securitized and sold includes $72.5 billion of loans securitized through GNMA, FNMA or FHLMC. FHN retains interests other than servicing rights on a portion of these securitized loans. No delinquency or net credit loss data is included for the loans securitized through FNMA or FHMLC because these agencies retain credit risk. The remainder of loans securitized and sold were securitized through properietary trusts, where FHN retained interests other than servicing rights. |
|
(c) | | | | $38.0 million associated with loan sales and $4.5 million associated with securitizations. |
|
(d) | | | | Transferred loans are real estate residential loans in which FHN has a retained interest other than servicing rights. |
|
(e) | | | | $76.7 billion associated with loan sales and $5.5 billion associated with securitizations. |
133
FIRST HORIZON NATIONAL CORPORATION
Note 24 q Loan Sales and Securitizations (continued)
Secured Borrowings.In 2007 and 2006, FTBNA executed several securitizations of retail real estate residential loans for the purpose of engaging in secondary market financing. Since the related trusts did not qualify as QSPE and since the cash flows on the loans are pledged to the holders of the trusts’ securities, FTBNA recognized the proceeds as secured borrowings in accordance with SFAS No. 140. As of December 31, 2008, FTBNA had recognized $714.7 million of loans net of unearned income and $696.5 million of other collateralized borrowings in its Consolidated Statement of Condition related to these transactions. As of December 31, 2007, FTBNA had recognized $766.0 million of loans net of unearned income and $757.5 million of other collateralized borrowings in its Consolidated Statement of Condition related to these transactions. See Note 25 – Variable Interest Entities for additional information.
In third quarter 2007, FTBNA executed a securitization of certain small issuer trust preferreds for which the underlying trust did not qualify as a QSPE under SFAS No. 140. Therefore, FTNBA has accounted for the funds received through the securitization as a secured borrowing. As of December 31, 2008, FTBNA had recognized $112.5 million of loans net of unearned income, $1.7 million of trading securities and $48.9 million of other collateralized borrowings in its Consolidated Statement of Condition related to this transaction. As of December 31, 2007, FTBNA had recognized $112.8 million of loans net of unearned income and $43.0 million of other collateralized borrowings in its Consolidated Statement of Condition related to this transaction. See Note 25 – Variable Interest Entities for additional information.
134
FIRST HORIZON NATIONAL CORPORATION
Note 25 q Variable Interest Entities
Under the provisions of FASB Interpretation No. 46, “Consolidation of Variable Interest Entities – revised December 2003” (FIN 46-R), FHN is deemed to be the primary beneficiary and required to consolidate a variable interest entity (VIE) if it has a variable interest that will absorb the majority of the VIE’s expected losses, receive the majority of expected residual returns, or both. A VIE exists when equity investors do not have the characteristics of a controlling financial interest or do not have sufficient equity at risk for the entity to finance its activities by itself. A variable interest is a contractual, ownership or other interest that changes with changes in the fair value of the VIE’s net assets or the VIE’s cash flows. Expected losses and expected residual returns are measures of variability in the expected cash flow of a VIE.
Consolidated Variable Interest Entities.In 2007 and 2006, FTBNA established several Delaware statutory trusts (Trusts), for the purpose of engaging in secondary market financing. Except for recourse due to breaches of standard representations and warranties made by FTBNA in connection with the sale of the retail real estate residential loans by FTBNA to the Trusts, the creditors of the Trusts hold no recourse to the assets of FTBNA. Additionally, FTBNA has no contractual requirements to provide financial support to the Trusts. Since the Trusts did not qualify as QSPE, FTBNA treated the proceeds as secured borrowings in accordance with SFAS No. 140. FTBNA determined that the Trusts were VIEs because the holders of the equity investment at risk did not have adequate decision making ability over the trusts’ activities. Thus, FTBNA assessed whether it was the primary beneficiary of the associated trusts. Since there was an overcollateralization of the Trusts, any excess of cash flows received on the transferred loans above the amounts passed through to the security holders would revert to FTBNA. Accordingly, FTBNA determined that it was the primary beneficiary of the Trusts because it absorbed a majority of the expected losses of the Trusts.
FTBNA holds variable interests in trusts which have issued mandatorily redeemable preferred capital securities (trust preferreds) for smaller banking and insurance enterprises. FTBNA has no voting rights for the trusts’ activities. The trusts’ only assets are junior subordinated debentures of the issuing enterprises. The creditors of the trusts hold no recourse to the assets of FTBNA. These trusts meet the definition of a VIE because the holders of the equity investment at risk do not have adequate decision making ability over the trusts’ activities. In situations where FTBNA holds a majority of the trust preferreds issued by a trust, it is considered the primary beneficiary of that trust because FTBNA will absorb a majority of the trust’s expected losses. FTBNA has no contractual requirements to provide financial support to the trusts. In situations where FTBNA holds a majority, but less than all, of the trust preferreds for a trust, consolidation of the trust results in recognition of amounts received from other parties as debt. See Note 10 – Long-Term Debt for further detail.
FHN has established certain rabbi trusts related to deferred compensation plans offered to its employees. FHN contributes employee cash compensation deferrals to the trusts and directs the underlying investments made by the trusts. The assets of these trusts are available to FHN’s creditors only in the event that FHN becomes insolvent. These trusts are considered VIEs because either there is no equity at risk in the trusts or because FHN provided the equity interest to its employees in exchange for services rendered. Given that the trusts were created in exchange for the employees’ services, FHN is considered the primary beneficiary of the rabbi trusts because it is most closely related to their purpose and design. FHN has the obligation to fund any liabilities to employees that are in excess of a rabbi trust’s assets.
The following table summarizes VIEs consolidated by FHN:
| | | | | | | | |
As of December 31, 2008
(Dollars in thousands) | | Assets | | Liabilities |
Type | | Carrying
Value | | Classification | | Carrying
Value | | Classification |
|
On balance sheet consumer loan securitizations | | | $ | | 714,717 | | | Loans, net of unearned income | | | $ | | 696,508 | | | Other collateralized borrowings |
Small issuer trust preferred holdings | | | | 465,350 | | | Loans, net of unearned income | | | | 30,500 | | | Term borrowings |
Rabbi trusts used for deferred compensation plans | | | | 88,356 | | | Other assets | | | | 57,661 | | | Other liabilities |
|
135
FIRST HORIZON NATIONAL CORPORATION
Note 25 q Variable Interest Entities (continued)
| | | | | | | | |
As of December 31, 2007
(Dollars in thousands) | | Assets | | Liabilities |
Type | | Carrying
Value | | Classification | | Carrying
Value | | Classification |
|
On balance sheet consumer loan securitizations | | | $ | | 766,027 | | | Loans, net of unearned income | | | $ | | 757,453 | | | Other collateralized borrowings |
Small issuer trust preferred holdings | | | | 61,900 | | | Loans, net of unearned income | | | | 10,000 | | | Term borrowings |
Rabbi trusts used for deferred compensation plans | | | | 158,724 | | | Other assets | | | | 160,818 | | | Other liabilities |
|
Nonconsolidated Variable Interest Entities.Since 1997, First Tennessee Housing Corporation (FTHC), a wholly-owned subsidiary, makes equity investments as a limited partner, in various partnerships that sponsor affordable housing projects utilizing the Low Income Housing Tax Credit (LIHTC) pursuant to Section 42 of the Internal Revenue Code. The purpose of these investments is to achieve a satisfactory return on capital and to support FHN’s community reinvestment initiatives. The activities of the limited partnerships include the identification, development, and operation of multi-family housing that is leased to qualifying residential tenants generally within FHN’s primary geographic region. LIHTC partnerships are considered VIEs because FTHC, as the holder of the equity investment at risk, does not have the ability to significantly affect the success of the entity through voting rights. FTHC is not considered the primary beneficiary of the LIHTC partnerships because an agent relationship exists between FTHC and the general partners, whereby the general partners cannot sell, transfer or otherwise encumber their ownership interest without the approval of FTHC. Because this results in a de facto agent relationship between the partners, the general partners are considered the primary beneficiaries because their operations are most closely associated with the LIHTC partnerships’ operations. FTHC has no contractual requirements to provide financial support to the LIHTC partnerships beyond its initial funding commitments.
FTBNA holds variable interests in trusts which have issued mandatorily redeemable trust preferreds for smaller banking and insurance enterprises. FTBNA has no voting rights for the trusts’ activities. The trusts’ only assets are junior subordinated debentures of the issuing enterprises. These trusts meet the definition of a VIE because the holders of the equity investment at risk do not have adequate decision making ability over the trusts’ activities. In situations where FTBNA did not intend to hold the trust preferreds for more than a brief period and situations where FTBNA did not hold a majority of the trust preferreds issued by a trust, it is not considered the primary beneficiary of that trust because FTBNA does not absorb a majority of the expected losses of the trust. FTBNA has no contractual requirements to provide financial support to the trusts.
In third quarter 2007, FTBNA executed a securitization of certain small issuer trust preferreds for which the underlying trust did not qualify as a QSPE under SFAS No. 140. This trust was determined to be a VIE because the holders of the equity investment at risk do not have adequate decision making ability over the trust’s activities. FTBNA determined that it was not the primary beneficiary of the trust due to the size and priority of the interests it retained in the securities issued by the trust. Accordingly, FTBNA has accounted for the funds received through the securitization as a collateralized borrowing in its Consolidated Statement of Condition. FTBNA has no contractual requirement to provide financial support to the trust.
As discussed in Note 11, FHN has issued junior subordinated debt to Capital I and Capital II totaling $309.0 million. Both Capital I and Capital II are considered VIEs because FHN’s capital contributions to these trusts are not considered “at risk” in evaluating whether the equity investments at risk in the trusts have adequate decision making ability over the trusts’ activities. Capital I and Capital II are not consolidated by FHN because the holders of the securities issued by the trusts absorb a majority of expected losses and residual returns.
Wholly-owned subsidiaries of FHN serve as investment advisor and administrator of certain “fund of funds” investment vehicles, whereby the subsidiaries receive fees for management of the funds’ operations and through revenue sharing agreements based on the funds’ performance. The funds are considered VIEs because the holders of the equity at risk do not have voting rights or the ability to control the funds’ operations. The subsidiaries have not made any investment in the funds. Further, the subsidiaries are not obligated to provide any financial support
136
FIRST HORIZON NATIONAL CORPORATION
Note 25 q Variable Interest Entities (continued)
to the funds. The funds are not consolidated by FHN because its subsidiaries do not absorb a majority of expected losses or residual returns.
The following table summarizes VIEs that are not consolidated by FHN:
| | | | | | |
As of December 31, 2008
(Dollars in thousands) | | Maximum
Loss Exposure | | Liability
Recognized | | Classification |
Type |
|
Low Income Housing Partnerships (a) (b) | | | $ | | 131,150 | | | | $ | | – | | | Other assets |
Small Issuer Trust Preferred Holdings | | | | 43,000 | | | | | – | | | Loans, net of unearned income |
On Balance Sheet Trust Preferred Securitization | | | | 65,318 | | | | | 48,855 | | | (c) |
Proprietary Trust Preferred Issuances | | | | N/A | | | | | 309,000 | | | Term borrowings |
Management of Fund of Funds | | | | N/A | | | | | N/A | | | N/A |
|
|
(a) | | | | Maximum loss exposure represents $113.8 million of current investments and $17.3 million of contractual funding commitments. Only the current investment amount is included in Other Assets. |
|
(b) | | | | A liability is not recognized because investments are written down over the life of the related tax credit. |
|
(c) | | | | $112.5 million was classified as Loans, net of unearned income and $1.7 million was classifed as Trading securities which are offset by $48.9 million classified as Other collateralized borrowings. |
| | | | | | |
As of December 31, 2007
(Dollars in thousands) | | Maximum
Loss Exposure | | Liability
Recognized | | Classification |
Type |
|
Low Income Housing Partnerships (a) (b) | | | $ | | 118,046 | | | | $ | | – | | | Other assets |
Small Issuer Trust Preferred Holdings | | | | 374,450 | | | | | – | | | (c) |
On Balance Sheet Trust Preferred Securitization | | | | 69,791 | | | | | 42,997 | | | (d) |
Proprietary Trust Preferred Issuances | | | | N/A | | | | | 309,000 | | | Term borrowings |
Management of Fund of Funds | | | | N/A | | | | | N/A | | | N/A |
|
|
(a) | | | | Maximum loss exposure represents $111.8 million of current investments and $6.3 million of contractual funding commitments. Only the current investment amount is included in Other Assets. |
|
(b) | | | | A liability is not recognized because investments are written down over the life of the related tax credit. |
|
(c) | | | | $331.5 million was classified as Loans held for sale and $43.0 million was classified as Loans, net of unearned income. |
|
(d) | | | | $112.8 million was classified as Loans, net of unearned income which is offset by $43.0 million classified as Other collateralized borrowings. |
137
FIRST HORIZON NATIONAL CORPORATION
Note 26 q Derivatives and Off-Balance Sheet Arrangements
In the normal course of business, FHN utilizes various financial instruments, through its mortgage banking, capital markets and risk management operations, which include derivative contracts and credit-related arrangements, as part of its risk management strategy and as a means to meet customers’ needs. These instruments are subject to credit and market risks in excess of the amount recorded on the balance sheet in accordance with generally accepted accounting principles. The contractual or notional amounts of these financial instruments do not necessarily represent credit or market risk. However, they can be used to measure the extent of involvement in various types of financial instruments. Controls and monitoring procedures for these instruments have been established and are routinely reevaluated. The Asset/Liability Committee (ALCO) monitors the usage and effectiveness of these financial instruments.
Credit risk represents the potential loss that may occur because a party to a transaction fails to perform according to the terms of the contract. The measure of credit exposure is the replacement cost of contracts with a positive fair value. FHN manages credit risk by entering into financial instrument transactions through national exchanges, primary dealers or approved counterparties, and using mutual margining agreements whenever possible to limit potential exposure. With exchange-traded contracts, the credit risk is limited to the clearinghouse used. For non-exchange traded instruments, credit risk may occur when there is a gain in the fair value of the financial instrument and the counterparty fails to perform according to the terms of the contract and/or when the collateral proves to be of insufficient value. Market risk represents the potential loss due to the decrease in the value of a financial instrument caused primarily by changes in interest rates, mortgage loan prepayment speeds or the prices of debt instruments. FHN manages market risk by establishing and monitoring limits on the types and degree of risk that may be undertaken. FHN continually measures this risk through the use of models that measure value-at-risk and earnings-at-risk.
Derivative Instruments. FHN enters into various derivative contracts both in a dealer capacity, to facilitate customer transactions, and also as a risk management tool. Where contracts have been created for customers, FHN enters into transactions with dealers to offset its risk exposure. Derivatives are also used as a risk management tool to hedge FHN’s exposure to changes in interest rates or other defined market risks.
Derivative instruments are recorded on the Consolidated Statements of Condition as other assets or other liabilities measured at fair value. Fair value is defined as the price that would be received to sell a derivative asset or paid to transfer a derivative liability in an orderly transaction between market participants on the transaction date. Fair value is determined using available market information and appropriate valuation methodologies. For a fair value hedge, changes in the fair value of the derivative instrument and changes in the fair value of the hedged asset or liability are recognized currently in earnings. For a cash flow hedge, changes in the fair value of the derivative instrument, to the extent that it is effective, are recorded in accumulated other comprehensive income and subsequently reclassified to earnings as the hedged transaction impacts net income. Any ineffective portion of a cash flow hedge is recognized currently in earnings. For freestanding derivative instruments, changes in fair value are recognized currently in earnings. Cash flows from derivative contracts are reported as operating activities on the Consolidated Statements of Cash Flows.
Interest rate forward contracts are over-the-counter contracts where two parties agree to purchase and sell a specific quantity of a financial instrument at a specified price, with delivery or settlement at a specified date. Futures contracts are exchange-traded contracts where two parties agree to purchase and sell a specific quantity of a financial instrument at a specific price, with delivery or settlement at a specified date. Interest rate option contracts give the purchaser the right, but not the obligation, to buy or sell a specified quantity of a financial instrument, at a specified price, during a specified period of time. Caps and floors are options that are linked to a notional principal amount and an underlying indexed interest rate. Interest rate swaps involve the exchange of interest payments at specified intervals between two parties without the exchange of any underlying principal. Swaptions are options on interest rate swaps that give the purchaser the right, but not the obligation, to enter into an interest rate swap agreement during a specified period of time.
On December 31, 2008 and 2007 respectively, FHN had approximately $62.8 million and $27.1 million of cash receivables and $196.2 million and $3.4 million of cash payables related to collateral posting under master netting arrangements with derivative counterparties.
138
FIRST HORIZON NATIONAL CORPORATION
Note 26 q Derivatives and Off-Balance Sheet Arrangements (continued)
Mortgage Banking
As a result of the MetLife transaction, mortgage banking origination activity was significantly reduced in the period after third quarter 2008 as FHN focuses on origination within its regional banking footprint. Accordingly, the following discussion of pipeline and warehouse related derivatives is primarily applicable to reporting periods occurring through the third quarter 2008.
Mortgage banking interest rate lock commitments are short-term commitments to fund mortgage loan applications in process (the pipeline) for a fixed term at a fixed price. During the term of an interest rate lock commitment, FHN has the risk that interest rates will change from the rate quoted to the borrower. FHN enters into forward sales contracts with respect to fixed rate loan commitments and futures contracts with respect to adjustable rate loan commitments as economic hedges designed to protect the value of the interest rate lock commitments from changes in value due to changes in interest rates. Under SFAS No. 133, interest rate lock commitments qualify as derivative financial instruments and as such do not qualify for hedge accounting treatment. As a result, the interest rate lock commitments are recorded at fair value, exclusive of the value of associated servicing rights, with changes in fair value recorded in current earnings as gain or loss on the sale of loans in mortgage banking noninterest income. Prior to the adoption of SAB No. 109 fair value excluded the value of associated servicing rights. Additionally, on January 1, 2008, FHN adopted SFAS No. 157 which affected the valuation of interest rate lock commitments previously measured under the guidance of EITF 02-03 by requiring recognition of concessions upon entry into the lock. Changes in the fair value of the derivatives that serve as economic hedges of interest rate lock commitments are also included in current earnings as a component of gain or loss on the sale of loans in mortgage banking noninterest income.
FHN’s’ warehouse (mortgage loans held for sale) is subject to changes in fair value, due to fluctuations in interest rates from the loan closing date through the date of sale of the loan into the secondary market. Typically, the fair value of the warehouse declines in value when interest rates increase and rises in value when interest rates decrease. To mitigate this risk, FHN enters into forward sales contracts and futures contracts to provide an economic hedge against those changes in fair value on a significant portion of the warehouse. These derivatives are recorded at fair value with changes in fair value recorded in current earnings as a component of the gain or loss on the sale of loans in mortgage banking noninterest income.
FHN adopted SFAS No. 159 on January 1, 2008. As discussed below, prior to adoption of SFAS No. 159, all warehouse loans were carried at the lower of cost or market, where carrying value was adjusted for successful hedging under SFAS No. 133 and the comparison of carrying value to market was performed for aggregate loan pools. To the extent that these interest rate derivatives were designated to hedge specific similar assets in the warehouse and prospective analyses indicate that high correlation was expected, the hedged loans were considered for hedge accounting under SFAS No. 133. Anticipated correlation was determined by projecting a dollar offset relationship for each tranche based on anticipated changes in the fair value of the hedged mortgage loans and the related derivatives, in response to various interest rate shock scenarios. Hedges were reset daily and the statistical correlation was calculated using these daily data points. Retrospective hedge effectiveness was measured using the regression correlation results. FHN generally maintained a coverage ratio (the ratio of expected change in the fair value of derivatives to expected change in the fair value of hedged assets) of approximately 100 percent on warehouse loans hedged under SFAS No. 133. Effective SFAS No. 133 hedging resulted in adjustments to the recorded value of the hedged loans. These basis adjustments, as well as the change in fair value of derivatives attributable to effective hedging, were included as a component of the gain or loss on the sale of loans in mortgage banking noninterest income. Warehouse loans qualifying for SFAS No. 133 hedge accounting treatment totaled $2.6 billion on December 31, 2007. There were no warehouse loans qualifying for SFAS No. 133 hedge accounting treatment at December 31, 2008. The balance sheet impact of the related derivatives was net liabilities of $18.8 million on December 31, 2007. Net losses of $15.5 million representing the ineffective portion of these fair value hedges were recognized as a component of gain or loss on sale of loans for the twelve months ended December 31, 2007.
Upon adoption of SFAS No. 159, FHN elected to prospectively account for substantially all of its mortgage loan warehouse products at fair value upon origination and correspondingly discontinued the application of SFAS No.
139
FIRST HORIZON NATIONAL CORPORATION
Note 26 q Derivatives and Off-Balance Sheet Arrangements (continued)
133 hedging relationships for all new originations. FHN enters into forward sales and futures contracts to provide an economic hedge against changes in fair value on a significant portion of the warehouse.
In accordance with SFAS No. 156, FHN revalues MSR to current fair value each month. Changes in fair value are included in servicing income in mortgage banking noninterest income. FHN also enters into economic hedges of the MSR to minimize the effects of loss in value of MSR associated with increased prepayment activity that generally results from declining interest rates. In a rising interest rate environment, the value of the MSR generally will increase while the value of the hedge instruments will decline. FHN enters into interest rate contracts (including swaps, swaptions, and mortgage forward sales contracts) to hedge against the effects of changes in fair value of its MSR. Substantially all capitalized MSR are hedged for economic purposes.
FHN utilizes derivatives (including swaps, swaptions, and mortgage forward sales contracts) that change in value inversely to the movement of interest rates to protect the value of its interest-only securities as an economic hedge. Changes in the fair value of these derivatives are recognized currently in earnings in mortgage banking noninterest income as a component of servicing income. Interest-only securities are included in trading securities with changes in fair value recognized currently in earnings in mortgage banking noninterest income as a component of servicing income.
Capital Markets
Capital Markets trades U.S. Treasury, U.S. Agency, mortgage-backed, corporate and municipal fixed income securities, and other securities principally for distribution to customers. When these securities settle on a delayed basis, they are considered forward contracts. Capital Markets also enters into interest rate contracts, including options, caps, swaps and floors for its customers. In addition, Capital Markets enters into futures contracts to economically hedge interest rate risk associated with a portion of its securities inventory. These transactions are measured at fair value, with changes in fair value recognized currently in capital markets noninterest income. Related assets and liabilities are recorded on the balance sheet as other assets and other liabilities. Credit risk related to these transactions is controlled through credit approvals, risk control limits and ongoing monitoring procedures through the Credit Risk Management Committee.
Capital Markets hedged $244.6 million and $47.5 million of held-to-maturity trust preferred loans in 2008 and 2007 respectively, which have an initial fixed rate term of five years before conversion to a floating rate. Capital Markets has entered into pay fixed, receive floating interest rate swaps to hedge the interest rate risk associated with this initial five year term. The balance sheet impact of those swaps was $27.7 million and $1.6 million in other liabilities on December 31, 2008 and 2007 respectively. Interest paid or received for these swaps was recognized as an adjustment of the interest income of the assets whose risk is being hedged.
Interest Rate Risk Management
FHN’s ALCO focuses on managing market risk by controlling and limiting earnings volatility attributable to changes in interest rates. Interest rate risk exists to the extent that interest-earning assets and liabilities have different maturity or repricing characteristics. FHN uses derivatives, including swaps, caps, options, and collars, that are designed to moderate the impact on earnings as interest rates change. FHN’s interest rate risk management policy is to use derivatives not to speculate but to hedge interest rate risk or market value of assets or liabilities. In addition, FHN has entered into certain interest rate swaps and caps as a part of a product offering to commercial customers with customer derivatives paired with offsetting market instruments that, when completed, are designed to eliminate market risk. These contracts do not qualify for hedge accounting and are measured at fair value with gains or losses included in current earnings in noninterest income.
FHN has entered into pay floating, receive fixed interest rate swaps to hedge the interest rate risk of certain large institutional certificates of deposit, totaling $62.5 million on December 31, 2007. These swaps matured in first quarter 2008 and had been accounted for as fair value hedges under the shortcut method. The balance sheet impact of these swaps was $43.5 thousand in other liabilities on December 31, 2007. Interest paid or received for these swaps was recognized as an adjustment of the interest expense of the liabilities whose risk is being managed.
140
FIRST HORIZON NATIONAL CORPORATION
Note 26 q Derivatives and Off-Balance Sheet Arrangements (continued)
FHN has entered into pay floating, receive fixed interest rate swaps to hedge the interest rate risk of certain long-term debt obligations, totaling $1.1 billion and $1.2 billion on December 31, 2008 and 2007, respectively. These swaps have been accounted for as fair value hedges under the shortcut method. The balance sheet impact of these swaps was $145.6 million in other assets on December 31, 2008 and was $30.7 million in other assets and $.7 million in other liabilities on December 31, 2007. Interest paid or received for these swaps was recognized as an adjustment of the interest expense of the liabilities whose risk is being managed.
FHN had utilized an interest rate swap as a cash flow hedge of the interest payment on floating-rate bank notes with a fair value of $100.0 million on December 31, 2007, and a maturity in first quarter 2009. The interest rate swap on these notes was terminated in the first quarter 2008. The balance sheet impact of this swap was $9.8 thousand in other assets and $6.1 thousand, net of tax, in other comprehensive income on December 31, 2007. There was no ineffectiveness related to this hedge.
In first quarter 2006, FHN determined that derivative transactions used in hedging strategies to manage interest rate risk on subordinated debt related to its trust preferred securities did not qualify for hedge accounting under the shortcut method. As a result, any fluctuations in the market value of the derivatives should have been recorded through the income statement with no corresponding offset to the hedged item. While management believed these hedges would have qualified for hedge accounting under the long haul method, that accounting could not be applied retroactively. FHN evaluated the impact to all quarterly and annual periods since the inception of the hedges and concluded that the impact was immaterial in each previous period. In first quarter 2006, FHN recorded an adjustment to recognize the cumulative impact of these transactions that resulted in a negative $15.6 million impact to noninterest income. FHN subsequently redesignated these hedge relationships under SFAS No. 133 using the long haul method. For the period of time during first quarter 2006 that these hedge relationships were not redesignated under SFAS No. 133, the swaps were measured at fair value with gains or losses included in current earnings. FHN has entered into pay floating, receive fixed interest rate swaps to hedge the interest rate risk of the subordinated debt totaling $.3 billion on December 31, 2008, and 2007. The balance sheet impact of these swaps was $1.4 million in other assets on December 31, 2008 and $11.9 million in other liabilities on December 31, 2007. There was no ineffectiveness related to these hedges. Interest paid or received for these swaps was recognized as an adjustment of the interest expense of the liabilities whose risk is being managed.
Off-Balance Sheet Arrangements
Credit-Related Commitments.FHN enters into fixed and variable interest rate loan commitments with customers. When these commitments have contract rate adjustments that lag changes in market rates, the financial instruments have characteristics similar to option contracts. FHN follows the same credit policies and underwriting practices in making commitments as it does for on-balance sheet instruments. Each counterparty’s creditworthiness is evaluated on a case-by-case basis. The amount of collateral obtained, if any, is based on management’s credit evaluation of the counterparty.
Commitments to extend credit are contractual obligations to lend to a customer as long as all established contractual conditions are met. These commitments generally have fixed expiration dates or other termination clauses and may require payment of a fee. The majority of FHN’s loan commitments have maturities less than one year and reflect the prevailing market rates at the time of the commitment. Since commitments may expire without being fully drawn upon, total contractual amounts do not necessarily represent future credit exposure or liquidity requirements.
Other commitments include standby and commercial letters of credit and other credit enhancements. Standby and commercial letters of credit and other credit enhancements are conditional commitments issued by FHN to guarantee the performance and/or payment of a customer to a third party in connection with specified transactions. The credit risk involved in issuing these commitments is essentially the same as that involved in extending loan facilities to customers, as performance under any of these facilities would result in a loan being funded to the customer.
141
FIRST HORIZON NATIONAL CORPORATION
Note 26 q Derivatives and Off-Balance Sheet Arrangements (continued)
FHN services loans for others, and, in some cases, provides guarantees or recourse on the serviced loans. See Note 18 – Restrictions, Contingencies and Other Disclosures for additional information.
The following is a summary of each class of credit-related commitments outstanding on December 31:
| | | | |
(Dollars in millions) | | 2008 | | 2007 |
|
Commitments to extend credit: | | | | |
Consumer credit card lines | | | $ | | 1,598.8 | | | | $ | | 1,711.8 | |
Consumer home equity | | | | 3,620.5 | | | | | 5,899.3 | |
Commercial real estate and construction and land development | | | | 929.5 | | | | | 2,731.1 | |
Commercial and other | | | | 3,451.8 | | | | | 3,757.0 | |
|
Total loan commitments | | | | 9,600.6 | | | | | 14,099.2 | |
Other commitments: | | | | |
Standby letters of credit | | | | 616.6 | | | | | 767.1 | |
Other | | | | 15.2 | | | | | 42.1 | |
|
Total loan and other commitments | | | $ | | 10,232.4 | | | | $ | | 14,908.4 | |
|
142
FIRST HORIZON NATIONAL CORPORATION
Note 27 q Restructuring, Repositioning, and Efficiency
Beginning in 2007, FHN conducted a company-wide review of business practices with the goal of improving its overall profitability and productivity. In addition, during 2007 management announced its intention to sell 34 full-service First Horizon Bank branches in its national banking markets. These sales were completed in second quarter 2008. In the second half of 2007, FHN also took actions to right size First Horizon Home Loans’ mortgage banking operations and to downsize FHN’s national lending operations, in order to redeploy capital to higher-return businesses. As part of its strategy to reduce its national real estate portfolio, FHN announced in January 2008 that it was discontinuing national homebuilder and commercial real estate lending through its First Horizon Construction Lending offices. Additionally, FHN initiated the repositioning of First Horizon Home Loans’ mortgage banking operations, which included sales of MSR in fourth quarter 2007 and the first, second and third quarters of 2008.
In June 2008, FHN announced that it had reached a definitive agreement with MetLife, for the sale of more than 230 retail and wholesale mortgage origination offices nationwide as well as its loan origination and servicing platform. Effective August 31, 2008, the parties completed the initial settlement for MetLife’s acquisition of substantially all of FHN’s mortgage origination pipeline, related hedges, certain fixed assets and other associated assets. MetLife did not acquire any portion of FHN’s mortgage loan warehouse. First Horizon retained its mortgage operations in and around Tennessee, continuing to originate home loans for customers in its banking market footprint. FHN also sold MetLife servicing assets, and related hedges, on $19.1 billion of first lien mortgage loans and associated custodial deposits. Additionally, FHN has entered into a subservicing agreement with MetLife for the remainder of FHN’s servicing portfolio. MetLife generally paid book value for the assets and liabilities it acquired, less a purchase price reduction. The assets and liabilities related to the mortgage operations divested were included in the Mortgage Banking segment and were reflected as “divestiture” on the Consolidated Statements of Condition for the reporting period ending June 30, 2008. In third quarter 2008, FHN recognized a loss on divestiture of $17.5 million related to this transaction which is included in the noninterest income section of the Consolidated Statements of Income as losses on divestitures. In fourth quarter 2008, the parties completed a post-closing true up which resulted in FHN recognizing a gain on divestiture of $0.9 million within its Consolidated Statements of Income.
Net costs recognized by FHN in the year ended December 31, 2008 related to restructuring, repositioning, and efficiency activities were $91.4 million. Of this amount, $49.1 million represents exit costs that have been accounted for in accordance with Statement of Financial Accounting Standards No. 146, “Accounting for Costs Associated with Exit or Disposal Activities” (SFAS No. 146).
Significant expenses recognized in 2008 resulted from the following actions:
|
• | | | | Expense of $49.1 million associated with organizational and compensation changes due to right sizing operating segments, the divestiture of certain First Horizon Bank branches, the divestiture of certain mortgage banking operations and consolidating functional areas. |
|
• | | | | Loss of $16.6 million on the divestiture of mortgage banking operations. |
|
• | | | | Loss of $2.4 million from the sales of certain First Horizon Bank branches. |
|
• | | | | Transaction costs of $12.7 million from the contracted sales of mortgage servicing rights. |
|
• | | | | Expense of $10.7 million for the writedown of certain premises and equipment, intangibles and other assets resulting from FHN’s divestiture of certain mortgage operations and from the change in FHN’s national banking strategy. |
Net costs recognized by FHN in the year ended December 31, 2007 related to restructuring, repositioning, and efficiency activities were $98.7 million. Of this amount, $47.9 million represents exit costs that have been accounted for in accordance with SFAS No. 146.
Significant expenses recognized in 2007 resulted from the following actions:
|
• | | | | Expense of $20.4 million associated with organizational and compensation changes for right sizing operating segments and consolidating functional areas. |
143
FIRST HORIZON NATIONAL CORPORATION
Note 27 q Restructuring, Repositioning, and Efficiency (continued)
|
• | | | | Non-core business repositioning costs of $17.4 million, including costs associated with the exit of the collectible coin merchandising business and the transition of the non-prime mortgage origination business to a broker model. |
|
• | | | | Expense of $17.2 million related to other restructuring, repositioning, and efficiency initiatives, including facilities consolidation, procurement centralization, multi-sourcing and the divestiture of certain loan portfolios. |
|
• | | | | Costs of $24.3 million related to the divestiture of 34 full-service First Horizon Bank locations in Virginia, Maryland, Georgia, and Texas, including $13.9 million for the writedown of goodwill and other intangibles; partially offset by $15.7 million of gains realized in 2007 from the disposition of 15 of these locations. |
|
• | | | | Expense of $11.3 million related to the restructuring of mortgage operations through office closures, associated sales force decreases, and the reduction of management and support staff and downsizing of national lending operations through the reduction of consumer and construction sales forces and decreasing management, support staff and back-office costs. |
|
• | | | | Expense of $17.4 million for asset impairments related to the discontinuance of technology projects. |
|
• | | | | Transaction costs of $6.4 million from sales of mortgage servicing rights. |
Provision for loan losses of $7.7 million was incurred during 2007 in relation to the divestiture of a non-strategic loan portfolio. Losses from the mortgage banking divestiture and gains and losses from disposition of the First Horizon Bank branches are included in losses/gains on divestitures in the noninterest income section of the Consolidated Statements of Income. Transaction costs related to transfers of mortgage servicing rights are recorded as a reduction of mortgage banking income in the noninterest income section of the Consolidated Statements of Income. All other costs associated with the restructuring, repositioning, and efficiency initiatives implemented by management are included in the noninterest expense section of the Consolidated Statements of Income, including severance and other employee-related costs recognized in relation to such initiatives which are recorded in employee compensation, incentives, and benefits, facilities consolidation costs and related asset impairment costs which are included in occupancy, costs associated with the impairment of premises and equipment which are included in equipment rentals, depreciation, and maintenance, and other costs associated with such initiatives, including professional fees, intangible asset impairment costs, and asset impairment costs related to the discontinuance of technology projects, which are included in all other expense and goodwill impairment.
Activity in the restructuring and repositioning liability for 2008 and 2007 is presented in the following table, along with other restructuring and repositioning expenses recognized. All costs associated with the restructuring, repositioning, and efficiency initiatives implemented in 2008 and 2007 are recorded as unallocated corporate charges within the Corporate segment.
144
FIRST HORIZON NATIONAL CORPORATION
Note 27 q Restructuring, Repositioning, and Efficiency (continued)
| | | | | | | | (Dollars in thousands) | | 2008 | | 2007 |
| | | | |
| | Charged to Expense | | Liability | | Charged to Expense | | Liability |
| | | | |
Beginning Balance | | | $ | | - | | | | $ | | 19,675 | | | | $ | | - | | | | $ | | - | |
Severance and other employee related costs* | | | | 24,400 | | | | | 24,400 | | | | | 25,532 | | | | | 25,532 | |
Facility consolidation costs | | | | 16,751 | | | | | 16,751 | | | | | 13,131 | | | | | 13,131 | |
Other exit costs, professional fees and other | | | | 7,902 | | | | | 7,902 | | | | | 9,255 | | | | | 9,255 | |
| | | | |
Total Accrued | | | | 49,053 | | | | | 68,728 | | | | | 47,918 | | | | | 47,918 | |
Payments** | | | | | | 38,016 | | | | | | | 27,081 | |
Accrual reversals | | | | | | 6,545 | | | | | | | 1,162 | |
| | | | |
Restructuring and Repositioning Reserve Balance | | | | | $ | | 24,167 | | | | | | $ | | 19,675 | |
| | | | |
Other Restructuring & Repositioning (Income) and Expense: | | | | | | | | |
Provision for loan portfolio divestiture | | | | - | | | | | | | 7,672 | | | |
Mortgage banking expense on servicing sales | | | | 12,667 | | | | | | | 6,428 | | | |
Loss/(gain) on divestitures | | | | 19,020 | | | | | | | (15,695 | ) | | | |
Impairment of premises and equipment | | | | 5,650 | | | | | | | 9,288 | | | |
Impairment of intangible assets | | | | 4,030 | | | | | | | 13,999 | | | |
Impairment of other assets | | | | 993 | | | | | | | 29,108 | | | |
| | | | | | | | |
Total Other Restructuring and Repositioning Income and Expense | | | | 42,360 | | | | | | | 50,800 | | | |
| | | | | | | | |
Total Restructuring, Repositioning Charges | | | $ | | 91,413 | | | | | | $ | | 98,718 | | | |
| | | | | | | | |
|
* | | | | Includes $1.2 million of deferred severance-related payments that will be paid after 2008. |
|
** | | | | Includes payments related to: |
| | | | |
| | 2008 | | 2007 |
Severance and other employee related costs | | | $ | | 16,235 | | | | $ | | 15,174 | |
Facility consolidation costs | | | | 14,223 | | | | | 3,992 | |
Other exit costs, professional fees and other | | | | 7,558 | | | | | 7,915 | |
| | |
| | | $ | | 38,016 | | | | $ | | 27,081 | |
| | |
Note 28 q Other Events
On January 30, 2009, FHN contracted to sell mortgage servicing rights related to approximately $14 billion of first lien mortgage loans owned or securitized by Fannie Mae or Freddie Mac. After the sale, the unpaid principal amount of FHN’s loan servicing portfolio will be reduced to approximately $48 billion and will reduce the associated capitalized MSR. This transaction reflects FHN’s continued efforts to reduce risk through balance sheet contraction.
145
FIRST HORIZON NATIONAL CORPORATION
Note 29 q Parent Company Financial Information
Following are condensed statements of the parent company:
| | | | |
Statements of Condition | | December 31 |
|
(Dollars in thousands) | | 2008 | | 2007 |
|
Assets: | | | | |
Cash | | | $ | | 11,549 | | | | $ | | - | |
Securities purchased from subsidiary bank under agreements to resell | | | | - | | | | | 20,025 | |
|
Total cash and cash equivalents | | | | 11,549 | | | | | 20,025 | |
Interest-bearing cash | | | | 240,963 | | | | | 206,054 | |
Securities available for sale | | | | 4,537 | | | | | 7,191 | |
Notes receivable | | | | 3,700 | | | | | 3,700 | |
Investments in subsidiaries: | | | | |
Bank | | | | 3,372,064 | | | | | 2,298,517 | |
Non-bank | | | | 20,814 | | | | | 28,155 | |
Other assets | | | | 215,337 | | | | | 302,207 | |
|
Total assets | | | $ | | 3,868,964 | | | | $ | | 2,865,849 | |
|
Liabilities and shareholders’ equity: | | | | |
Other short-term borrowings and commercial paper | | | $ | | 16,830 | | | | $ | | 2,076 | |
Accrued employee benefits and other liabilities | | | | 129,685 | | | | | 307,220 | |
Long-term debt | | | | 442,982 | | | | | 420,957 | |
|
Total liabilities | | | | 589,497 | | | | | 730,253 | |
Shareholders’ equity | | | | 3,279,467 | | | | | 2,135,596 | |
|
Total liabilities and shareholders’ equity | | | $ | | 3,868,964 | | | | $ | | 2,865,849 | |
|
| | | | | | |
Statements of Income | | Year Ended December 31 |
|
(Dollars in thousands) | | 2008 | | 2007 | | 2006 |
|
Dividend income: | | | | | | |
Bank | | | $ | | - | | | | $ | | 230,000 | | | | $ | | 415,000 | |
Non-bank | | | | 3,852 | | | | | 11,292 | | | | | 4,763 | |
|
Total dividend income | | | | 3,852 | | | | | 241,292 | | | | | 419,763 | |
Interest income | | | | 4,035 | | | | | 6,266 | | | | | 6,675 | |
Other income | | | | (1,724 | ) | | | | | (1,656 | ) | | | | | (12,569 | ) | |
|
Total income | | | | 6,163 | | | | | 245,902 | | | | | 413,869 | |
|
Interest expense: | | | | | | |
Short-term debt | | | | 285 | | | | | 395 | | | | | 365 | |
Long-term debt | | | | 18,940 | | | | | 26,935 | | | | | 27,001 | |
|
Total interest expense | | | | 19,225 | | | | | 27,330 | | | | | 27,366 | |
Compensation, employee benefits and other expense | | | | 49,290 | | | | | 39,041 | | | | | 33,452 | |
|
Total expense | | | | 68,515 | | | | | 66,371 | | | | | 60,818 | |
|
Income/(loss) before income taxes | | | | (62,352 | ) | | | | | 179,531 | | | | | 353,051 | |
Income tax benefit | | | | (20,884 | ) | | | | | (30,486 | ) | | | | | (36,844 | ) | |
|
Income/(loss) before cumulative effect of changes in accounting principle | | | | (41,468 | ) | | | | | 210,017 | | | | | 389,895 | |
Cumulative effect of changes in accounting principle, net of tax | | | | - | | | | | - | | | | | 127 | |
|
Income/(loss) before equity in undistributed net income of subsidiaries | | | | (41,468 | ) | | | | | 210,017 | | | | | 390,022 | |
Equity in undistributed net income/(loss) of subsidiaries: | | | | | | |
Bank | | | | (148,288 | ) | | | | | (372,265 | ) | | | | | 73,345 | |
Non-bank | | | | (2,204 | ) | | | | | (7,863 | ) | | | | | (453 | ) | |
|
Net income/(loss) | | | $ | | (191,960 | ) | | | | $ | | (170,111 | ) | | | | $ | | 462,914 | |
|
146
FIRST HORIZON NATIONAL CORPORATION
Note 29 q Parent Company Financial Information (continued)
| | | | | | |
Statements of Cash Flows | | Year Ended December 31 |
|
(Dollars in thousands) | | 2008 | | 2007 | | 2006 |
|
Operating activities: | | | | | | |
Net income/(loss) | | | $ | | (191,960 | ) | | | | $ | | (170,111 | ) | | | | $ | | 462,914 | |
Less undistributed net income of subsidiaries | | | | (150,492 | ) | | | | | (380,128 | ) | | | | | 72,892 | |
|
Income before undistributed net income of subsidiaries | | | | (41,468 | ) | | | | | 210,017 | | | | | 390,022 | |
Adjustments to reconcile income to net cash provided by operating activities: | | | | | | |
Deferred income tax benefit | | | | (1,160 | ) | | | | | (9,838 | ) | | | | | (928 | ) | |
Depreciation and amortization | | | | 5,990 | | | | | 5,239 | | | | | 2,716 | |
Cumulative effect of changes in accounting principle | | | | - | | | | | - | | | | | (127 | ) | |
Stock-based compensation expense | | | | 2,930 | | | | | 4,968 | | | | | 4,455 | |
Loss on sale of securities | | | | - | | | | | 3,641 | | | | | 174 | |
Net (increase)/decrease in interest receivable and other assets | | | | 92,001 | | | | | 14,617 | | | | | (39,641 | ) | |
Net increase/(decrease) in interest payable and other liabilities | | | | (110,378 | ) | | | | | (14,030 | ) | | | | | 30,249 | |
|
Total adjustments | | | | (10,617 | ) | | | | | 4,597 | | | | | (3,102 | ) | |
|
Net cash provided/(used) by operating activities | | | | (52,085 | ) | | | | | 214,614 | | | | | 386,920 | |
|
Investing activities: | | | | | | |
Securities: | | | | | | |
Sales and prepayments | | | | 2,714 | | | | | 30,606 | | | | | 38 | |
Purchases | | | | (1,528 | ) | | | | | (550 | ) | | | | | (3,475 | ) | |
Increase in interest-bearing cash | | | | (34,909 | ) | | | | | (185,477 | ) | | | | | (4,100 | ) | |
Advances to subsidiaries | | | | - | | | | | - | | | | | (30,000 | ) | |
Repayment of advances to subsidiaries | | | | - | | | | | - | | | | | 30,000 | |
Return on investment in subsidiary | | | | 2,918 | | | | | - | | | | | 127 | |
Cash investments in subsidiaries | | | | (1,346,169 | ) | | | | | 589 | | | | | (687 | ) | |
|
Net cash used by investing activities | | | | (1,376,974 | ) | | | | | (154,832 | ) | | | | | (8,097 | ) | |
|
Financing activities: | | | | | | |
Preferred stock: | | | | | | |
Proceeds from issuance of preferred stock and common stock warrant - CPP | | | | 866,540 | | | | | - | | | | | - | |
Common stock: | | | | | | |
Exercise of stock options | | | | 511 | | | | | 34,542 | | | | | 57,082 | |
Proceeds from issuance of common stock | | | | 659,656 | | | | | - | | | | | - | |
Cash dividends | | | | (120,575 | ) | | | | | (225,011 | ) | | | | | (223,386 | ) | |
Repurchase of shares | | | | (303 | ) | | | | | (1,104 | ) | | | | | (165,572 | ) | |
Long-term debt: | | | | | | |
Payment | | | | - | | | | | (30,000 | ) | | | | | - | |
Increase/(decrease) in short-term borrowings | | | | 14,754 | | | | | (3,544 | ) | | | | | (5,075 | ) | |
|
Net cash provided/(used) by financing activities | | | | 1,420,583 | | | | | (225,117 | ) | | | | | (336,951 | ) | |
|
Net increase/(decrease) in cash and cash equivalents | | | | (8,476 | ) | | | | | (165,335 | ) | | | | | 41,872 | |
|
Cash and cash equivalents at beginning of year | | | | 20,025 | | | | | 185,360 | | | | | 143,488 | |
|
Cash and cash equivalents at end of year | | | $ | | 11,549 | | | | $ | | 20,025 | | | | $ | | 185,360 | |
|
Total interest paid | | | $ | | 19,014 | | | | $ | | 27,426 | | | | $ | | 26,840 | |
Total income taxes paid | | | | 332,600 | | | | | 11,390 | | | | | 102,685 | |
|
Certain previously reports amounts have been reclassified to agree with current presentation.
147
FIRST HORIZON NATIONAL CORPORATION
CONSOLIDATED HISTORICAL STATEMENTS OF INCOME (Unaudited)
| | | | | | | | | | | | | | | | |
(Dollars in millions except per share data) | | 2008 | | 2007 | | 2006 | | 2005 | | 2004 | | 2003 | | Growth
Rates (%) |
| | 08/07 | | 08/03** |
|
Interest income: | | | | | | | | | | | | | | | | |
Interest and fees on loans | | | $ | | 1,153.5 | | | | $ | | 1,621.9 | | | | $ | | 1,591.0 | | | | $ | | 1,133.5 | | | | $ | | 774.7 | | | | $ | | 657.6 | | | | | 28.9 | - | | | | | 11.9 | + | |
Investment securities | | | | 162.3 | | | | | 188.7 | | | | | 188.1 | | | | | 125.2 | | | | | 104.4 | | | | | 111.3 | | | | | 14.0 | - | | | | | 7.8 | + | |
Loans held for sale | | | | 151.6 | | | | | 253.6 | | | | | 288.2 | | | | | 377.9 | | | | | 226.8 | | | | | 229.1 | | | | | 40.2 | - | | | | | 7.9 | - | |
Trading securities inventory | | | | 114.6 | | | | | 174.2 | | | | | 171.1 | | | | | 138.5 | | | | | 53.4 | | | | | 50.5 | | | | | 34.2 | - | | | | | 17.8 | + | |
Other earning assets | | | | 24.7 | | | | | 67.5 | | | | | 90.7 | | | | | 65.1 | | | | | 7.5 | | | | | 4.9 | | | | | 63.4 | - | | | | | 38.2 | + | |
| | |
Total interest income | | | | 1,606.7 | | | | | 2,305.9 | | | | | 2,329.1 | | | | | 1,840.2 | | | | | 1,166.8 | | | | | 1,053.4 | | | | | 30.3 | - | | | | | 8.8 | + | |
| | |
Interest expense: | | | | | | | | | | | | | | | | |
Deposits: | | | | | | | | | | | | | | | | |
Savings | | | | 79.9 | | | | | 115.9 | | | | | 88.5 | | | | | 44.4 | | | | | 19.6 | | | | | 19.8 | | | | | 31.1 | - | | | | | 32.2 | + | |
Time deposits | | | | 101.2 | | | | | 136.6 | | | | | 120.3 | | | | | 79.0 | | | | | 60.1 | | | | | 57.1 | | | | | 25.9 | - | | | | | 12.1 | + | |
Other interest-bearing deposits | | | | 13.8 | | | | | 25.9 | | | | | 24.5 | | | | | 15.5 | | | | | 4.8 | | | | | 3.8 | | | | | 46.7 | - | | | | | 29.4 | + | |
Certificates of deposit $100,000 and more | | | | 76.3 | | | | | 369.3 | | | | | 493.2 | | | | | 364.1 | | | | | 108.0 | | | | | 69.4 | | | | | 79.3 | - | | | | | 1.9 | + | |
Interest on trading liabilities | | | | 33.2 | | | | | 51.5 | | | | | 76.1 | | | | | 80.2 | | | | | 20.0 | | | | | 22.1 | | | | | 35.5 | - | | | | | 8.5 | + | |
Interest on short-term borrowings | | | | 189.6 | | | | | 294.1 | | | | | 248.9 | | | | | 171.9 | | | | | 47.8 | | | | | 40.0 | | | | | 35.5 | - | | | | | 36.5 | + | |
Interest on long-term debt | | | | 217.6 | | | | | 372.0 | | | | | 280.7 | | | | | 101.1 | | | | | 50.2 | | | | | 35.4 | | | | | 41.5 | - | | | | | 43.8 | + | |
| | |
Total interest expense | | | | 711.6 | | | | | 1,365.3 | | | | | 1,332.2 | | | | | 856.2 | | | | | 310.5 | | | | | 247.6 | | | | | 47.9 | - | | | | | 23.5 | + | |
| | |
Net interest income | | | | 895.1 | | | | | 940.6 | | | | | 996.9 | | | | | 984.0 | | | | | 856.3 | | | | | 805.8 | | | | | 4.8 | - | | | | | 2.1 | + | |
Provision for loan losses | | | | 1,080.0 | | | | | 272.8 | | | | | 83.1 | | | | | 67.7 | | | | | 48.3 | | | | | 86.7 | | | | | 295.9 | + | | | | | 65.6 | + | |
| | |
Net interest income/(loss) after provision | | | | (184.9 | ) | | | | | 667.8 | | | | | 913.8 | | | | | 916.3 | | | | | 808.0 | | | | | 719.1 | | | | | 127.7 | - | | | | | 176.2 | - | |
| | |
Noninterest income: | | | | | | | | | | | | | | | | |
Capital markets | | | | 524.4 | | | | | 334.4 | | | | | 383.0 | | | | | 353.0 | | | | | 376.5 | | | | | 538.9 | | | | | 56.8 | + | | | | | * | |
Deposit transactions and cash management | | | | 179.0 | | | | | 175.3 | | | | | 168.6 | | | | | 156.2 | | | | | 148.5 | | | | | 146.7 | | | | | 2.1 | + | | | | | 4.1 | + | |
Mortgage banking | | | | 518.0 | | | | | 69.5 | | | | | 370.6 | | | | | 479.6 | | | | | 444.8 | | | | | 649.5 | | | | | 645.3 | + | | | | | 4.4 | - | |
Trust services and investment management | | | | 33.8 | | | | | 40.3 | | | | | 41.5 | | | | | 44.6 | | | | | 47.3 | | | | | 45.9 | | | | | 16.1 | - | | | | | 5.9 | - | |
Insurance commissions | | | | 29.1 | | | | | 31.7 | | | | | 46.6 | | | | | 54.1 | | | | | 56.1 | | | | | 57.8 | | | | | 8.2 | - | | | | | 12.8 | - | |
Gains/(losses) from loan sales and securitizations | | | | (8.6 | ) | | | | | 23.9 | | | | | 51.7 | | | | | 47.6 | | | | | 23.1 | | | | | - | | | | | 136.0 | - | | | | | NM | |
Equity securities gains/(losses), net | | | | 65.3 | | | | | (7.5 | ) | | | | | 10.3 | | | | | (.5 | ) | | | | | 2.0 | | | | | 8.5 | | | | | NM | | | | | NM | |
Debt securities gains/(losses), net | | | | .8 | | | | | 6.3 | | | | | (75.9 | ) | | | | | - | | | | | 18.7 | | | | | (6.1 | ) | | | | | NM | | | | | NM | |
Gains/(losses) on divestitures | | | | (19.0 | ) | | | | | 15.7 | | | | | - | | | | | 7.0 | | | | | 1.2 | | | | | 12.5 | | | | | NM | | | | | NM | |
All other income and commissions | | | | 168.5 | | | | | 170.4 | | | | | 170.5 | | | | | 165.7 | | | | | 163.6 | | | | | 145.7 | | | | | 1.1 | - | | | | | 3.0 | + | |
| | |
Total noninterest income | | | | 1,491.3 | | | | | 860.0 | | | | | 1,166.9 | | | | | 1,307.3 | | | | | 1,281.8 | | | | | 1,599.4 | | | | | 73.4 | + | | | | | 1.4 | - | |
| | |
Adjusted gross income after provision | | | | 1,306.4 | | | | | 1,527.8 | | | | | 2,080.7 | | | | | 2,223.6 | | | | | 2,089.8 | | | | | 2,318.5 | | | | | 14.5 | - | | | | | 10.8 | - | |
| | |
Noninterest expense: | | | | | | | | | | | | | | | | |
Employee compensation, incentives and benefits | | | | 960.9 | | | | | 968.1 | | | | | 1,023.7 | | | | | 988.9 | | | | | 899.8 | | | | | 1,004.8 | | | | | * | | | | | * | |
Occupancy | | | | 105.0 | | | | | 131.2 | | | | | 116.7 | | | | | 104.2 | | | | | 87.6 | | | | | 81.8 | | | | | 20.0 | - | | | | | 5.1 | + | |
Equipment rentals, depreciation and maintenance | | | | 57.1 | | | | | 72.9 | | | | | 73.9 | | | | | 74.4 | | | | | 70.4 | | | | | 67.0 | | | | | 21.7 | - | | | | | 3.1 | - | |
Legal and Professional Fees | | | | 63.7 | | | | | 56.9 | | | | | 43.0 | | | | | 45.2 | | | | | 37.7 | | | | | 60.0 | | | | | 12.0 | + | | | | | 1.2 | + | |
Operations services | | | | 77.5 | | | | | 74.2 | | | | | 70.0 | | | | | 71.9 | | | | | 59.6 | | | | | 59.2 | | | | | 4.4 | + | | | | | 5.5 | + | |
Communications and courier | | | | 39.9 | | | | | 43.9 | | | | | 53.2 | | | | | 54.4 | | | | | 47.9 | | | | | 49.1 | | | | | 9.1 | - | | | | | 4.1 | - | |
Amortization of intangible assets | | | | 8.2 | | | | | 11.0 | | | | | 11.5 | | | | | 10.7 | | | | | 6.2 | | | | | 5.3 | | | | | 25.5 | - | | | | | 9.1 | + | |
Goodwill impairment | | | | - | | | | | 84.1 | | | | | - | | | | | - | | | | | - | | | | | - | | | | | NM | | | | | NM | |
All other expense | | | | 343.8 | | | | | 401.1 | | | | | 350.6 | | | | | 277.2 | | | | | 252.6 | | | | | 316.8 | | | | | 14.3 | - | | | | | 1.6 | + | |
| | |
Total noninterest expense | | | | 1,656.1 | | | | | 1,843.4 | | | | | 1,742.6 | | | | | 1,626.9 | | | | | 1,461.8 | | | | | 1,644.0 | | | | | 10.2 | - | | | | | 0.1 | + | |
| | |
Income/(loss) before income taxes | | | | (349.7 | ) | | | | | (315.6 | ) | | | | | 338.1 | | | | | 596.7 | | | | | 628.0 | | | | | 674.5 | | | | | NM | | | | | NM | |
Provision/(benefit) for income taxes | | | | (156.8 | ) | | | | | (140.7 | ) | | | | | 87.3 | | | | | 186.0 | | | | | 197.9 | | | | | 229.3 | | | | | NM | | | | | NM | |
| | |
Income/(loss) from continuing operations | | | | (192.9 | ) | | | | | (174.9 | ) | | | | | 250.8 | | | | | 410.7 | | | | | 430.1 | | | | | 445.2 | | | | | NM | | | | | NM | |
Income from discontinued operations, net of tax | | | | 0.9 | | | | | 4.8 | | | | | 210.8 | | | | | 17.1 | | | | | 15.6 | | | | | 7.4 | | | | | NM | | | | | NM | |
| | |
Income/(loss) before cumulative effect of changes in
accounting principle | | | | (192.0 | ) | | | | | (170.1 | ) | | | | | 461.6 | | | | | 427.8 | | | | | 445.7 | | | | | 452.6 | | | | | NM | | | | | NM | |
Cumulative effect of changes in accounting principle,
net of tax | | | | - | | | | | - | | | | | 1.3 | | | | | (3.1 | ) | | | | | - | | | | | - | | | | | NM | | | | | NM | |
| | |
Net income/(loss) | | | $ | | (192.0 | ) | | | | $ | | (170.1 | ) | | | | $ | | 462.9 | | | | $ | | 424.7 | | | | $ | | 445.7 | | | | $ | | 452.6 | | | | | NM | | | | | NM | |
| | |
Preferred stock dividends | | | | 7.4 | | | | | - | | | | | - | | | | | - | | | | | - | | | | | - | | | | | |
Net income/(loss) available to common shareholders | | | $ | | (199.4 | ) | | | | $ | | (170.1 | ) | | | | $ | | 462.9 | | | | $ | | 424.7 | | | | $ | | 445.7 | | | | $ | | 452.6 | | | | | |
| | |
Fully taxable equivalent adjustment | | | $ | | 1.4 | | | | $ | | .7 | | | | $ | | 1.2 | | | | $ | | 1.1 | | | | $ | | 1.1 | | | | $ | | 1.3 | | | | | 92.9 | + | | | | | * | |
| | |
Earnings/(loss) per common share from continuing
operations | | | $ | | (1.11 | ) | | | | $ | | (1.32 | ) | | | | $ | | 1.92 | | | | $ | | 3.12 | | | | $ | | 3.29 | | | | $ | | 3.35 | | | | | NM | | | | | NM | |
| | |
Diluted earnings/(loss) per common share from
continuing operations | | | $ | | (1.11 | ) | | | | $ | | (1.32 | ) | | | | $ | | 1.87 | | | | $ | | 3.02 | | | | $ | | 3.19 | | | | $ | | 3.24 | | | | | NM | | | | | NM | |
| | |
Earnings/(loss) per common share | | | $ | | (1.10 | ) | | | | $ | | (1.29 | ) | | | | $ | | 3.54 | | | | $ | | 3.22 | | | | $ | | 3.40 | | | | $ | | 3.40 | | | | | NM | | | | | NM | |
| | |
Diluted earnings/(loss) per common share | | | $ | | (1.10 | ) | | | | $ | | (1.29 | ) | | | | $ | | 3.45 | | | | $ | | 3.12 | | | | $ | | 3.31 | | | | $ | | 3.29 | | | | | NM | | | | | NM | |
| | |
Certain previously reported amounts have been reclassified to agree with current presentation.
NM – not meaningful
|
* | | | | Amount is less than one percent. |
|
** | | | | Compound annual growth rate. |
148
FIRST HORIZON NATIONAL CORPORATION
CONSOLIDATED AVERAGE BALANCE SHEETS AND RELATED YIELDS AND RATES (Unaudited)
| | | | | | | | | | | | | | |
|
(Fully taxable equivalent)
(Dollars in millions) | | 2008 | | 2007 | | Average
Balance
Growth(%) |
| | Average
Balance | | Interest
Income/
Expense | | Average
Yields/
Rates | | Average
Balance | | Interest
Income/
Expense | | Average
Yields/
Rates |
| | 08/07 |
|
Assets: | | | | | | | | | | | | | | |
Earning assets: | | | | | | | | | | | | | | |
Loans, net of unearned income** | | | $ | | 21,660.7 | | | | $ | | 1,154.1 | | | | | 5.33 | % | | | | $ | | 22,106.7 | | | | $ | | 1,622.3 | | | | | 7.34 | % | | | | | 2.0 | - | |
Loans held for sale | | | | 2,588.0 | | | | | 151.6 | | | | | 5.86 | | | | | 3,876.2 | | | | | 253.6 | | | | | 6.54 | | | | | 33.2 | - | |
Investment securities: | | | | | | | | | | | | | | |
U.S. Treasuries | | | | 46.7 | | | | | 1.1 | | | | | 2.30 | | | | | 99.0 | | | | | 4.8 | | | | | 4.83 | | | | | 52.8 | - | |
U.S. government agencies | | | | 2,618.9 | | | | | 146.0 | | | | | 5.57 | | | | | 3,033.2 | | | | | 172.0 | | | | | 5.67 | | | | | 13.7 | - | |
States and municipalities | | | | 37.8 | | | | | 1.8 | | | | | 4.92 | | | | | 1.8 | | | | | – | | | | | .90 | | | | | NM | |
Other | | | | 260.6 | | | | | 13.9 | | | | | 5.32 | | | | | 246.2 | | | | | 12.0 | | | | | 4.89 | | | | | 5.8 | + | |
| | |
Total investment securities | | | | 2,964.0 | | | | | 162.8 | | | | | 5.49 | | | | | 3,380.2 | | | | | 188.8 | | | | | 5.59 | | | | | 12.3 | - | |
| | |
Capital markets securities inventory | | | | 1,519.3 | | | | | 69.5 | | | | | 4.57 | | | | | 2,172.9 | | | | | 115.0 | | | | | 5.29 | | | | | 30.1 | - | |
Mortgage banking trading securities | | | | 350.5 | | | | | 45.5 | | | | | 12.98 | | | | | 483.9 | | | | | 59.4 | | | | | 12.28 | | | | | 27.6 | - | |
Other earning assets: | | | | | | | | | | | | | | |
Federal funds sold and securities purchased under agreements to resell | | | | 1,175.7 | | | | | 23.0 | | | | | 1.96 | | | | | 1,355.0 | | | | | 65.7 | | | | | 4.85 | | | | | 13.2 | - | |
Interest-bearing cash | | | | 168.0 | | | | | 1.6 | | | | | .98 | | | | | 30.5 | | | | | 1.8 | | | | | 5.97 | | | | | 450.8 | + | |
| | |
Total other earning assets | | | | 1,343.7 | | | | | 24.6 | | | | | 1.84 | | | | | 1,385.5 | | | | | 67.5 | | | | | 4.88 | | | | | 3.0 | - | |
| | |
Total earning assets | | | | 30,426.2 | | | | | 1,608.1 | | | | | 5.29 | | | | | 33,405.4 | | | | | 2,306.6 | | | | | 6.91 | | | | | 8.9 | - | |
Allowance for loan losses | | | | (563.1 | ) | | | | | | | | | | | | | | | (234.1 | ) | | | | | | | | | | | | | | | 140.5 | - | |
Cash and due from banks | | | | 653.9 | | | | | | | | | | | | | | | 821.5 | | | | | | | | | | | | | | | 20.4 | - | |
Capital markets receivables | | | | 294.7 | | | | | | | | | | | | | | | 156.8 | | | | | | | | | | | | | | | 87.9 | + | |
Premises and equipment, net | | | | 359.4 | | | | | | | | | | | | | | | 433.7 | | | | | | | | | | | | | | | 17.1 | - | |
Other assets | | | | 3,251.6 | | | | | | | | | | | | | | | 3,592.1 | | | | | | | | | | | | | | | 9.5 | - | |
| | |
Total assets/Interest income | | | $ | | 34,422.7 | | | | $ | | 1,608.1 | | | | | | | | | $ | | 38,175.4 | | | | $ | | 2,306.6 | | | | | | | | | | 9.8 | - | |
| | |
Liabilities and shareholders’ equity: | | | | | | | | | | | | | | |
Interest-bearing liabilities: | | | | | | | | | | | | | | |
Interest-bearing deposits: | | | | | | | | | | | | | | |
Savings | | | $ | | 4,274.9 | | | | $ | | 79.9 | | | | | 1.87 | % | | | | $ | | 3,567.6 | | | | $ | | 115.9 | | | | | 3.25 | % | | | | | 19.8 | + | |
Time deposits | | | | 2,549.7 | | | | | 101.2 | | | | | 3.97 | | | | | 2,909.0 | | | | | 136.6 | | | | | 4.69 | | | | | 12.4 | - | |
Other interest bearing deposits | | | | 1,816.8 | | | | | 13.9 | | | | | .76 | | | | | 1,845.6 | | | | | 25.9 | | | | | 1.40 | | | | | 1.6 | - | |
| | |
Total interest-bearing core deposits | | | | 8,641.4 | | | | | 195.0 | | | | | 2.26 | | | | | 8,322.2 | | | | | 278.4 | | | | | 3.34 | | | | | 3.8 | + | |
Certificates of deposit $100,000 and more | | | | 2,012.0 | | | | | 76.3 | | | | | 3.79 | | | | | 6,892.3 | | | | | 369.3 | | | | | 5.36 | | | | | 70.8 | - | |
Federal funds purchased and securities sold under agreements to repurchase | | | | 3,414.3 | | | | | 69.8 | | | | | 2.04 | | | | | 4,853.6 | | | | | 229.1 | | | | | 4.72 | | | | | 29.7 | - | |
Capital markets trading liabilities | | | | 702.4 | | | | | 33.2 | | | | | 4.73 | | | | | 950.6 | | | | | 51.5 | | | | | 5.42 | | | | | 26.1 | - | |
Other short-term borrowings and commercial paper | | | | 5,138.5 | | | | | 119.7 | | | | | 2.33 | | | | | 1,345.7 | | | | | 65.0 | | | | | 4.83 | | | | | 281.8 | + | |
Long-term debt | | | | 6,108.6 | | | | | 217.6 | | | | | 3.56 | | | | | 6,567.7 | | | | | 372.0 | | | | | 5.67 | | | | | 7.0 | - | |
| | |
Total interest-bearing liabilities | | | | 26,017.2 | | | | | 711.6 | | | | | 2.74 | | | | | 28,932.1 | | | | | 1,365.3 | | | | | 4.72 | | | | | 10.1 | - | |
Noninterest-bearing deposits | | | | 4,267.5 | | | | | | | | | | | | | | | 5,099.3 | | | | | | | | | | | | | | | 16.3 | - | |
Capital markets payables | | | | 269.5 | | | | | | | | | | | | | | | 179.3 | | | | | | | | | | | | | | | 50.3 | + | |
Other liabilities | | | | 937.9 | | | | | | | | | | | | | | | 1,245.9 | | | | | | | | | | | | | | | 24.7 | - | |
Guaranteed preferred beneficial interests in | | | | | | | | | | | | | | |
First Horizon’s junior subordinated debentures (Note 11) | | | | - | | | | | | | | | | | | | | | - | | | | | | | | | | | | | | | NM | |
Preferred stock of subsidiary (Note 12) | | | | 295.2 | | | | | | | | | | | | | | | 295.3 | | | | | | | | | | | | | | | NM | |
Shareholders’ equity | | | | 2,635.4 | | | | | | | | | | | | | | | 2,423.5 | | | | | | | | | | | | | | | 8.7 | + | |
| | |
Total liabilities and shareholders’ equity/Interest expense | | | $ | | 34,422.7 | | | | $ | | 711.6 | | | | | | | | | $ | | 38,175.4 | | | | $ | | 1,365.3 | | | | | | | | | | 9.8 | - | |
| | |
Net interest income-tax equivalent basis/Yield | | | | | $ | | 896.4 | | | | | 2.95 | % | | | | | | | | | $ | | 941.3 | | | | | 2.82 | % | | | |
Fully taxable equivalent adjustment | | | | | | (1.4 | ) | | | | | | | | | | | | | | | (.7 | ) | | | | | |
| | |
Net interest income | | | | | $ | | 895.0 | | | | | | | | $ | | 940.6 | | | | | |
| | |
Net interest spread | | | | | | | | | | | 2.55 | % | | | | | | | | | | | | | | | 2.19 | % | | | |
Effect of interest-free sources used to fund earning assets | | | | | | | | | | | .40 | | | | | | | | | | | | | | | .63 | | | |
| | |
Net interest margin | | | | | | | | | | | 2.95 | % | | | | | | | | | | | | | | | 2.82 | % | | | |
| | |
Certain previously reported amounts have been reclassified to agree with current presentation.
Yields and corresponding income amounts are adjusted to a fully taxable equivalent. Earning assets yields are expressed net of unearned income.
Rates are expressed net of unamortized debenture cost for long-term debt. Net interest margin is computed using total net interest income.
149
FIRST HORIZON NATIONAL CORPORATION
| | | | | | | | | | | | | | | | | | | | | | | | | | |
|
|
| | | | | | | | | | | | | | | | | | | | | | | | | |
| | 2006 | | 2005 | | 2004 | | 2003 | | Average
Balance
Growth(%) |
| | Average
Balance | | Interest
Income/
Expense | | Average
Yields/
Rates | | Average
Balance | | Interest
Income/
Expense | | Average
Yields/
Rates | | Average
Balance | | Interest
Income/
Expense | | Average
Yields/
Rates | | Average
Balance | | Interest
Income/
Expense | | Average
Yields/
Rates |
| | 08/03*** |
|
|
| | | | | | | | | | | | | | | | | | | | | | | | | |
| | | | | | | | | | | | | | | | | | | | | | | | | | |
| | | | | | | | | | | | | | | | | | | | | | | | | | |
| | | $ | | 21,504.2 | | | | $ | | 1,591.4 | | | | | 7.40 | % | | | | $ | | 18,334.7 | | | | $ | | 1,133.9 | | | | | 6.18 | % | | | | $ | | 15,440.5 | | | | $ | | 775.1 | | | | | 5.02 | % | | | | $ | | 12,679.8 | | | | $ | | 658.1 | | | | | 5.19 | % | | | | | 11.3 | + | |
| | | | 4,336.6 | | | | | 288.2 | | | | | 6.64 | | | | | 5,980.1 | | | | | 377.9 | | | | | 6.32 | | | | | 4,123.5 | | | | | 226.8 | | | | | 5.50 | | | | | 4,397.2 | | | | | 229.1 | | | | | 5.21 | | | | | 10.1 | - | |
| | | | | | | | | | | | | | | | | | | | | | | | | | |
| | | | 56.8 | | | | | 2.7 | | | | | 4.72 | | | | | 41.7 | | | | | 1.1 | | | | | 2.57 | | | | | 48.4 | | | | | .8 | | | | | 1.67 | | | | | 45.3 | | | | | .7 | | | | | 1.62 | | | | | * | |
| | | | 3,161.5 | | | | | 173.3 | | | | | 5.48 | | | | | 2,635.3 | | | | | 115.1 | | | | | 4.37 | | | | | 2,194.9 | | | | | 95.6 | | | | | 4.35 | | | | | 2,107.6 | | | | | 88.7 | | | | | 4.21 | | | | | 4.4 | + | |
| | | | 1.9 | | | | | - | | | | | 1.26 | | | | | 4.7 | | | | | .2 | | | | | 5.01 | | | | | 10.8 | | | | | .7 | | | | | 6.52 | | | | | 22.1 | | | | | 1.5 | | | | | 6.80 | | | | | 11.3 | + | |
| | | | 261.3 | | | | | 12.8 | | | | | 4.90 | | | | | 224.5 | | | | | 9.4 | | | | | 4.21 | | | | | 217.0 | | | | | 7.9 | | | | | 3.65 | | | | | 388.5 | | | | | 21.1 | | | | | 5.45 | | | | | 7.7 | - | |
| | |
| | | | 3,481.5 | | | | | 188.8 | | | | | 5.42 | | | | | 2,906.2 | | | | | 125.8 | | | | | 4.33 | | | | | 2,471.1 | | | | | 105.0 | | | | | 4.25 | | | | | 2,563.5 | | | | | 112.0 | | | | | 4.37 | | | | | 2.9 | + | |
| | |
| | | | 2,394.0 | | | | | 127.5 | | | | | 5.33 | | | | | 2,155.6 | | | | | 101.4 | | | | | 4.70 | | | | | 753.1 | | | | | 26.8 | | | | | 3.56 | | | | | 894.3 | | | | | 33.7 | | | | | 3.76 | | | | | 11.2 | + | |
| | | | 403.0 | | | | | 43.7 | | | | | 10.84 | | | | | 303.5 | | | | | 37.2 | | | | | 12.27 | | | | | 221.3 | | | | | 26.7 | | | | | 12.05 | | | | | 154.7 | | | | | 16.9 | | | | | 10.94 | | | | | 17.8 | + | |
| | | | | | | | | | | | | | | | | | | | | | | | | | |
| | | | | | | | | | | | | | | | | | | | | | | | | | |
| | | | 1,892.5 | | | | | 89.2 | | | | | 4.71 | | | | | 2,288.0 | | | | | 64.8 | | | | | 2.83 | | | | | 722.2 | | | | | 7.4 | | | | | 1.03 | | | | | 656.3 | | | | | 4.8 | | | | | .73 | | | | | 12.4 | + | |
| | | | 30.5 | | | | | 1.5 | | | | | 5.02 | | | | | 8.1 | | | | | .3 | | | | | 3.47 | | | | | 8.6 | | | | | .1 | | | | | 1.04 | | | | | 1.7 | | | | | .1 | | | | | .82 | | | | | 150.6 | + | |
| | |
| | | | 1,923.0 | | | | | 90.7 | | | | | 4.72 | | | | | 2,296.1 | | | | | 65.1 | | | | | 2.83 | | | | | 730.8 | | | | | 7.5 | | | | | 1.03 | | | | | 658.0 | | | | | 4.9 | | | | | .73 | | | | | 15.3 | + | |
| | |
| | | | 34,042.3 | | | | | 2,330.3 | | | | | 6.85 | | | | | 31,976.2 | | | | | 1,841.3 | | | | | 5.75 | | | | | 23,740.3 | | | | | 1,167.9 | | | | | 4.91 | | | | | 21,347.5 | | | | | 1,054.7 | | | | | 4.93 | | | | | 7.3 | + | |
| | | | (204.7 | ) | | | | | | | | | | | | | | | (175.3 | ) | | | | | | | | | | | | | | | (165.2 | ) | | | | | | | | | | | | | | | (160.3 | ) | | | | | | | | | | | | | | | 28.6 | - | |
| | | | 787.4 | | | | | | | | | | | | | | | 726.0 | | | | | | | | | | | | | | | 717.2 | | | | | | | | | | | | | | | 729.7 | | | | | | | | | | | | | | | 2.2 | - | |
| | | | 173.1 | | | | | | | | | | | | | | | 574.0 | | | | | | | | | | | | | | | 212.2 | | | | | | | | | | | | | | | 460.1 | | | | | | | | | | | | | | | 8.5 | - | |
| | | | 432.3 | | | | | | | | | | | | | | | 394.2 | | | | | | | | | | | | | | | 364.4 | | | | | | | | | | | | | | | 300.7 | | | | | | | | | | | | | | | 3.6 | + | |
| | | | 3,534.2 | | | | | | | | | | | | | | | 3,065.3 | | | | | | | | | | | | | | | 2,436.9 | | | | | | | | | | | | | | | 2,455.9 | | | | | | | | | | | | | | | 5.8 | + | |
| | |
| | | $ | | 38,764.6 | | | | $ | | 2,330.3 | | | | | | | | | $ | | 36,560.4 | | | | $ | | 1,841.3 | | | | | | | | | $ | | 27,305.8 | | | | $ | | 1,167.9 | | | | | | | | | $ | | 25,133.6 | | | | $ | | 1,054.7 | | | | | | | | | | 6.5 | + | |
| | |
| | | | | | | | | | | | | | | | | | | | | | | | | | |
| | | | | | | | | | | | | | | | | | | | | | | | | | |
| | | | | | | | | | | | | | | | | | | | | | | | | | |
| | | $ | | 3,191.4 | | | | $ | | 88.5 | | | | | 2.77 | % | | | | $ | | 2,843.1 | | | | $ | | 44.4 | | | | | 1.56 | % | | | | $ | | 2,614.4 | | | | $ | | 19.6 | | | | | .75 | % | | | | $ | | 2,532.7 | | | | $ | | 19.8 | | | | | .78 | % | | | | | 11.0 | + | |
| | | | 2,795.3 | | | | | 120.3 | | | | | 4.30 | | | | | 2,242.8 | | | | | 79.0 | | | | | 3.52 | | | | | 1,947.0 | | | | | 60.1 | | | | | 3.08 | | | | | 1,866.3 | | | | | 57.1 | | | | | 3.06 | | | | | 6.4 | + | |
| | | | 1,848.1 | | | | | 24.5 | | | | | 1.32 | | | | | 1,770.5 | | | | | 15.5 | | | | | .87 | | | | | 1,525.5 | | | | | 4.8 | | | | | .32 | | | | | 1,433.1 | | | | | 3.8 | | | | | .26 | | | | | 4.9 | + | |
| | |
| | | | 7,834.8 | | | | | 233.3 | | | | | 2.98 | | | | | 6,856.4 | | | | | 138.9 | | | | | 2.03 | | | | | 6,086.9 | | | | | 84.5 | | | | | 1.39 | | | | | 5,832.1 | | | | | 80.7 | | | | | 1.38 | | | | | 8.2 | + | |
| | | | 9,747.7 | | | | | 493.2 | | | | | 5.06 | | | | | 10,896.3 | | | | | 364.1 | | | | | 3.34 | | | | | 6,875.3 | | | | | 108.0 | | | | | 1.57 | | | | | 5,165.5 | | | | | 69.4 | | | | | 1.34 | | | | | 17.2 | - | |
| | | | | | | | | | | | | | | | | | | | | | | | | | |
| | | | 4,562.9 | | | | | 208.9 | | | | | 4.58 | | | | | 4,582.2 | | | | | 136.6 | | | | | 2.98 | | | | | 3,685.2 | | | | | 45.1 | | | | | 1.22 | | | | | 3,712.7 | | | | | 36.9 | | | | | .99 | | | | | 1.7 | - | |
| | | | 1,338.9 | | | | | 76.1 | | | | | 5.68 | | | | | 1,519.3 | | | | | 80.2 | | | | | 5.28 | | | | | 527.0 | | | | | 20.0 | | | | | 3.80 | | | | | 547.1 | | | | | 22.1 | | | | | 4.04 | | | | | 5.1 | + | |
| | | | | | | | | | | | | | | | | | | | | | | | | | |
| | | | 795.0 | | | | | 40.0 | | | | | 5.04 | | | | | 994.8 | | | | | 35.3 | | | | | 3.55 | | | | | 136.7 | | | | | 2.7 | | | | | 1.96 | | | | | 151.1 | | | | | 3.1 | | | | | 2.06 | | | | | 102.4 | + | |
| | | | 5,062.4 | | | | | 280.7 | | | | | 5.55 | | | | | 2,560.1 | | | | | 101.1 | | | | | 3.96 | | | | | 2,248.0 | | | | | 50.2 | | | | | 2.24 | | | | | 1,342.9 | | | | | 35.4 | | | | | 2.64 | | | | | 35.4 | + | |
| | |
| | | | 29,341.7 | | | | | 1,332.2 | | | | | 4.54 | | | | | 27,409.1 | | | | | 856.2 | | | | | 3.12 | | | | | 19,559.1 | | | | | 310.5 | | | | | 1.59 | | | | | 16,751.4 | | | | | 247.6 | | | | | 1.48 | | | | | 9.2 | + | |
| | | | 5,169.2 | | | | | | | | | | | | | | | 5,263.1 | | | | | | | | | | | | | | | 4,673.3 | | | | | | | | | | | | | | | 5,114.0 | | | | | | | | | | | | | | | 3.6 | - | |
| | | | 231.8 | | | | | | | | | | | | | | | 404.0 | | | | | | | | | | | | | | | 174.9 | | | | | | | | | | | | | | | 401.5 | | | | | | | | | | | | | | | 7.7 | - | |
| | | | 1,303.6 | | | | | | | | | | | | | | | 1,077.3 | | | | | | | | | | | | | | | 960.3 | | | | | | | | | | | | | | | 915.1 | | | | | | | | | | | | | | | * | |
| | | | | | | | | | | | | | | | | | | | | | | | | | |
| | | | | | | | | | | | | | | | | | | | | | | | | | |
| | | | - | | | | | | | | | | | | | | | - | | | | | | | | | | | | | | | - | | | | | | | | | | | | | | | 100.0 | | | | | | | | | | | | | | | NM | |
| | | | 295.3 | | | | | | | | | | | | | | | 229.9 | | | | | | | | | | | | | | | .5 | | | | | | | | | | | | | | | 22.2 | | | | | | | | | | | | | | | 67.8 | + | |
| | | | 2,423.0 | | | | | | | | | | | | | | | 2,177.0 | | | | | | | | | | | | | | | 1,937.7 | | | | | | | | | | | | | | | 1,829.4 | | | | | | | | | | | | | | | 7.6 | + | |
| | |
| | | | | | | | | | | | | | | | | | | | | | | | | | |
| | | $ | | 38,764.6 | | | | $ | | 1,332.2 | | | | | | | | | $ | | 36,560.4 | | | | $ | | 856.2 | | | | | | | | | $ | | 27,305.8 | | | | $ | | 310.5 | | | | | | | | | $ | | 25,133.6 | | | | $ | | 247.6 | | | | | | | | | | 6.5 | + | |
| | |
| | | | | | | | $ | | 998.1 | | | | | 2.93 | % | | | | | | | | | $ | | 985.1 | | | | | 3.08 | % | | | | | | | | | $ | | 857.4 | | | | | 3.61 | % | | | | | | | | | $ | | 807.1 | | | | | 3.78 | % | | | |
| | | | | | | | | (1.2 | ) | | | | | | | | | | | | | | | (1.1 | ) | | | | | | | | | | | | | | | (1.1 | ) | | | | | | | | | | | | | | | (1.3 | ) | | | | | |
| | |
| | | | | | | | $ | | 996.9 | | | | | | | | | | | | | | $ | | 984.0 | | | | | | | | | | | | | | $ | | 856.3 | | | | | | | | | | | | | | $ | | 805.8 | | | | | |
| | |
| | | | | | | | | | | | | | 2.31 | % | | | | | | | | | | | | | | | 2.63 | % | | | | | | | | | | | | | | | 3.32 | % | | | | | | | | | | | | | | | 3.45 | % | | | |
| | | | | | | | | | | | | | | | | | | | | | | | | | |
| | | | | | | | | | | | | | .62 | | | | | | | | | | | | | | | .45 | | | | | | | | | | | | | | | .29 | | | | | | | | | | | | | | | .33 | | | |
| | |
| | | | | | | | | | | | | | 2.93 | % | | | | | | | | | | | | | | | 3.08 | % | | | | | | | | | | | | | | | 3.61 | % | | | | | | | | | | | | | | | 3.78 | % | | | |
| | |
|
* | | | | Amount less than one percent. |
|
** | | | | Includes loans on nonaccrual status. |
|
*** | | | | Compound annual growth rate |
NM – not meaningful
150
FIRST HORIZON NATIONAL CORPORATION
Notwithstanding anything to the contrary set forth in any of our filings with the Securities and Exchange Commission under the Securities Act of 1933, as amended, or the Securities Exchange Act of 1934, as amended, that might incorporate future filings by reference, including the annual report on Form 10-K or the proxy statement, in whole or in part, the following “Information Concerning Certain Officer Certifications” is not a component of any such filings and shall not be incorporated by reference into any such filings. It is disclosed in our annual report to shareholders and accompanies our proxy statement in accordance with applicable rules of the New York Stock Exchange.
Information Concerning Certain Officer Certifications
Our chief executive officer and our chief financial officer each year make certain certifications that are included as Exhibits 31(a) and 31(b) to our annual report on Form 10-K which is filed with the Securities and Exchange Commission.
A copy of our most recent annual report on Form 10-K, including the financial statements and schedules thereto, is available free of charge to each shareholder of record upon written request to the treasurer, First Horizon National Corporation, P.O. Box 84, Memphis, Tennessee 38101. Each such written request must set forth a good faith representation that as of the record date specified in the notice of our 2009 annual shareholders meeting the person making the request was a beneficial owner of a security entitled to vote at the annual meeting of shareholders. The exhibits to the annual report on Form 10-K also will be supplied upon written request to the treasurer and payment to us of the cost of furnishing the requested exhibit or exhibits. That report (including Exhibits 31(a) and 31(b)) also is available to the public without charge through the U.S. Securities and Exchange Commission’s website at www.sec.gov.
In addition, shortly after our 2008 shareholders meeting, our chief executive officer submitted a certification to the New York Stock Exchange concerning our compliance with certain listing requirements related to corporate governance. That certification contained no qualifications.
151
FIRST HORIZON NATIONAL CORPORATION
Total Shareholder Return Performance Graph
Notwithstanding anything to the contrary set forth in any of our previous filings under the Securities Act of 1933, as amended, or the Securities Exchange Act of 1934, as amended, that might incorporate future filings by reference, including this proxy statement, in whole or in part, the following Total Shareholder Return Performance Graph shall not be incorporated by reference into any such filings.
The following graph compares the yearly percentage change in our cumulative total shareholder return with returns based on the Standard and Poor’s 500 index and a peer group consisting of the top 30 bank holding companies in the U.S. based on reported asset size as of December 31, 2008.
| | | | | | | | | | | | |
|
| | 2003 | | 2004 | | 2005 | | 2006 | | 2007 | | 2008 |
|
First Horizon National Corp | | | $ | | 100.00 | | | | $ | | 101.38 | | | | $ | | 94.45 | | | | $ | | 107.07 | | | | $ | | 51.13 | | | | $ | | 33.65 | |
Top 30 Banks | | | | 100.00 | | | | | 110.17 | | | | | 113.33 | | | | | 134.45 | | | | | 113.09 | | | | | 80.79 | |
S&P 500 Index | | | | 100.00 | | | | | 126.38 | | | | | 137.75 | | | | | 141.88 | | | | | 161.20 | | | | | 166.89 | |
|
Source: SNLThe preceding graph assumes $100 is invested on December 31, 2003 and dividends are reinvested. Returns are market-capitalization weighted.
The Top 30 consists of the following (with First Horizon excluded): JPMorgan Chase & Co., Citigroup Inc., Bank of America Corporation, Wells Fargo & Company, PNC Financial Services Group, Inc., U.S. Bancorp, Bank of New York Company, Inc., SunTrust Banks, Inc., State Street Corporation, Capital One Financial Corporation, BB&T Corporation, Regions Financial Corporation, Fifth Third Bancorp, KeyCorp, Northern Trust Corporation, Comerica Incorporated, M&T Bank Corporation, Marshall & Ilsley Corporation, Zions Bancorporation, Huntington Bancshares Incorporated, Popular, Inc., Synovus Financial Corp., Colonial BancGroup, Inc., Associated Banc-Corp, BOK Financial Corporation, First BanCorp., Webster Financial Corporation, Commerce Bancshares, Inc., and First Citizens BancShares, Inc.
152
FIRST HORIZON NATIONAL CORPORATION