
First Horizon National Corporation Debt Investor Presentation October 20, 2015
2 Certain measures are included in this presentation are “non - GAAP”, meaning (under U.S. financial reporting rules) they are not presented in accordance with generally accepted accounting principles (“GAAP”) in the U.S. and also are not codified in U.S. ban king regulations currently applicable to First Horizon National Corporation (“FHN”). All non - GAAP information is so noted, and a reco nciliation of that non - GAAP information to comparable GAAP information is provided in a footnote or in the appendix at the end of this presentation. Although other entities may use calculation methods that differ from those used by FHN for non - GAAP measures, FHN’ s management believes such measures are relevant to understanding the capital position or financial results of FHN. Non - GAAP measures are reported to FHN’s management and Board of Directors through various internal reports. Presentation of regulatory measures, even those which are not GAAP, provide a meaningful base for comparability to other financial institutions subject to the same regulations as FHN, as demonstrated by their use by banking regulators in reviewing capital adequacy of financial institution s. Although not GAAP terms, these regulatory measures are not considered “non - GAAP” under U.S. financial reporting rules as long as their presentation conforms to regulatory standards. This presentation contains forward - looking statements with respect to FHN’s beliefs, plans, goals, expectations, and estimates. Forward - looking statements are statements that are not a representation of historical information but rather are related to future op era tions, strategies, financial results, or other developments. The words “believe,” “expect,” “anticipate,” “intend,” “estimate,” “sho uld ,” “is likely,” “will,” “going forward,” and other expressions that indicate future events and trends identify forward - looking statements. Forwa rd - looking statements are necessarily based upon estimates and assumptions that are inherently subject to significant business, operatio nal , economic and competitive uncertainties and contingencies, many of which are beyond FHN’s control, and many of which, with res pec t to future business decisions and actions (including acquisitions and divestitures), are subject to change. A number of factors c oul d cause actual results to differ materially from those in the forward - looking information. These factors are outlined in our recent earn ings and other press releases and in more detail in the most current 10 - Q and 10 - K. Actual results could differ and expectations could ch ange, possibly materially, because of one or more factors, including those presented in this paragraph and in other sections of thi s presentation. FHN disclaims any obligation to update or revise any such forward - looking statements. Information is included in this presentation regarding the industries in which FHN operates, including trends in the market a nd the position of FHN and its competitors within these industries. This information is based on FHN's estimates, which have been de riv ed from management's knowledge and experience in the industry, and also is based on information obtained from customers, trade and bu sin ess organizations, internal research, publicly available information, industry publications and surveys and other contacts in the in dustry. FHN has also cited information compiled by industry publications, governmental agencies and publicly available sources. Although FHN believes these third - party sources to be reliable, it has not independently verified the data obtained from these sources and ca nnot assure the accuracy or completeness of the data. Similarly, estimates of market size and relative positions in a market are d iff icult to develop and inherently uncertain; FHN cannot assure their accuracy.
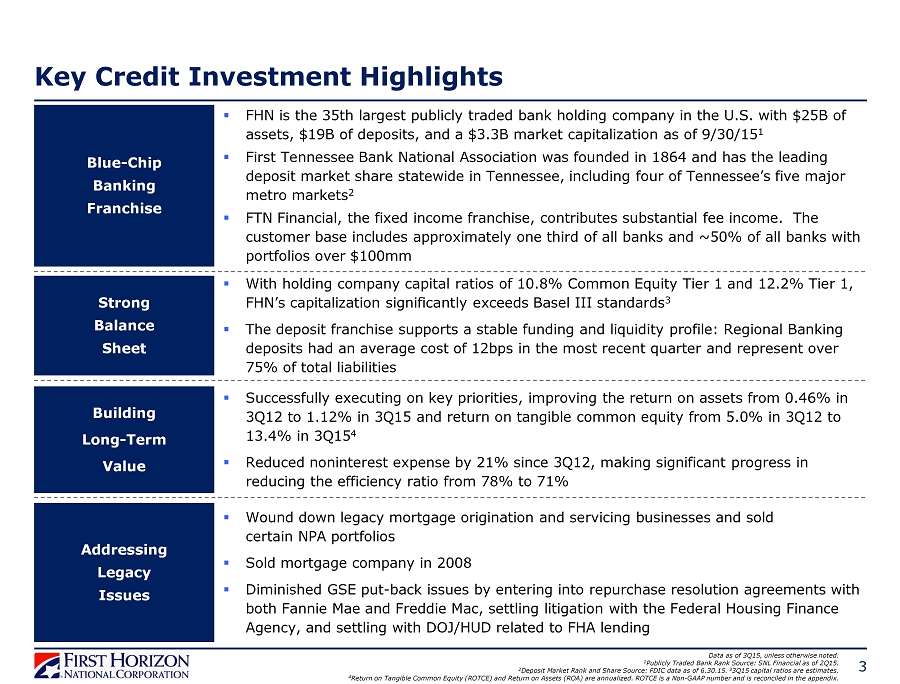
Key Credit Investment Highlights ▪ FHN is the 35th largest publicly traded bank holding company in the U.S. with $25B of assets, $19B of deposits, and a $3.3B market capitalization as of 9/30/15 1 ▪ First Tennessee Bank National Association was founded in 1864 and has the leading deposit market share statewide in Tennessee, including four of Tennessee’s five major metro markets 2 ▪ FTN Financial, the fixed income franchise, contributes substantial fee income. The customer base includes approximately one third of all banks and ~50% of all banks with portfolios over $100mm Strong Balance Sheet Building Long - Term Value Addressing Legacy Issues ▪ With holding company capital ratios of 10.8% Common Equity Tier 1 and 12.2% Tier 1, FHN’s capitalization significantly exceeds Basel III standards 3 ▪ The deposit franchise supports a stable funding and liquidity profile: Regional Banking deposits had an average cost of 12bps in the most recent quarter and represent over 75% of total liabilities ▪ Successfully executing on key priorities, improving the return on assets from 0.46% in 3Q12 to 1.12% in 3Q15 and return on tangible common equity from 5.0% in 3Q12 to 13.4% in 3Q15 4 ▪ Reduced noninterest expense by 21% since 3Q12, making significant progress in reducing the efficiency ratio from 78% to 71% ▪ Wound down legacy mortgage origination and servicing businesses and sold certain NPA portfolios ▪ Sold mortgage company in 2008 ▪ Diminished GSE put - back issues by entering into repurchase resolution agreements with both Fannie Mae and Freddie Mac, settling litigation with the Federal Housing Finance Agency, and settling with DOJ/HUD related to FHA lending 3 Blue - Chip Banking Franchise Data as of 3Q15, unless otherwise noted. 1 Publicly Traded Bank Rank Source: SNL Financial as of 2Q15. 2 Deposit Market Rank and Share Source: FDIC data as of 6.30.15. 3 3Q15 capital ratios are estimates. 4 Return on Tangible Common Equity (ROTCE) and Return on Assets (ROA) are annualized. ROTCE is a Non - GAAP number and is reconciled in the appendix.
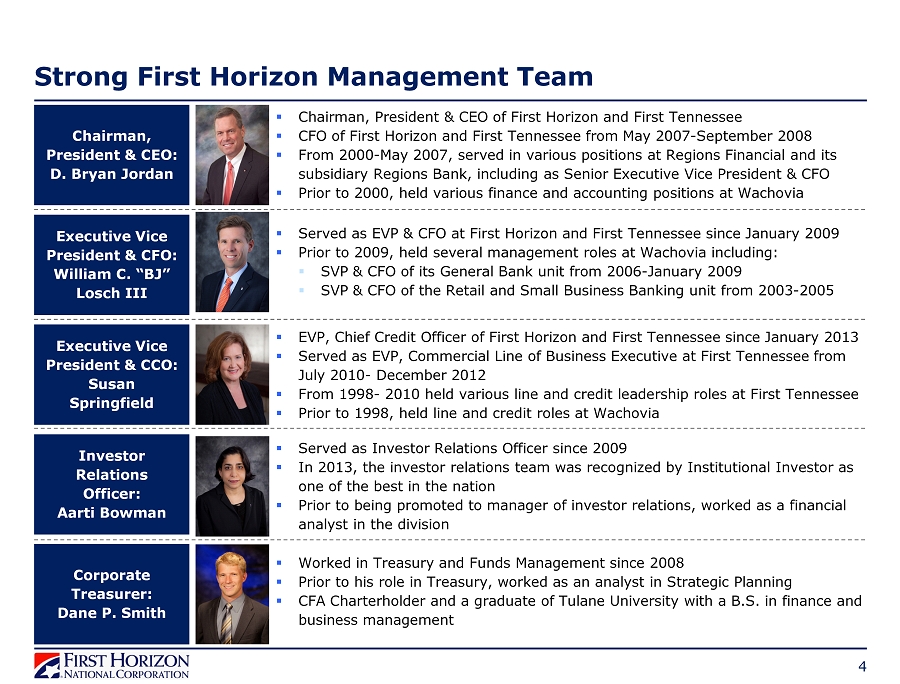
Strong First Horizon Management Team ▪ Chairman, President & CEO of First Horizon and First Tennessee ▪ CFO of First Horizon and First Tennessee from May 2007 - September 2008 ▪ From 2000 - May 2007, served in various positions at Regions Financial and its subsidiary Regions Bank, including as Senior Executive Vice President & CFO ▪ Prior to 2000, held various finance and accounting positions at Wachovia Chairman, President & CEO: D. Bryan Jordan Executive Vice President & CFO: William C. “BJ” Losch III Investor Relations Officer: Aarti Bowman Corporate Treasurer: Dane P. Smith ▪ Served as EVP & CFO at First Horizon and First Tennessee since January 2009 ▪ Prior to 2009, held several management roles at Wachovia including: ▪ SVP & CFO of its General Bank unit from 2006 - January 2009 ▪ SVP & CFO of the Retail and Small Business Banking unit from 2003 - 2005 ▪ Served as Investor Relations Officer since 2009 ▪ In 2013, the investor relations team was recognized by Institutional Investor as one of the best in the nation ▪ Prior to being promoted to manager of investor relations, worked as a financial analyst in the division ▪ Worked in Treasury and Funds Management since 2008 ▪ Prior to his role in Treasury, worked as an analyst in Strategic Planning ▪ CFA Charterholder and a graduate of Tulane University with a B.S. in finance and business management 4 Executive Vice President & CCO: Susan Springfield ▪ EVP, Chief Credit Officer of First Horizon and First Tennessee since January 2013 ▪ Served as EVP, Commercial Line of Business Executive at First Tennessee from July 2010 - December 2012 ▪ From 1998 - 2010 held various line and credit leadership roles at First Tennessee ▪ Prior to 1998, held line and credit roles at Wachovia
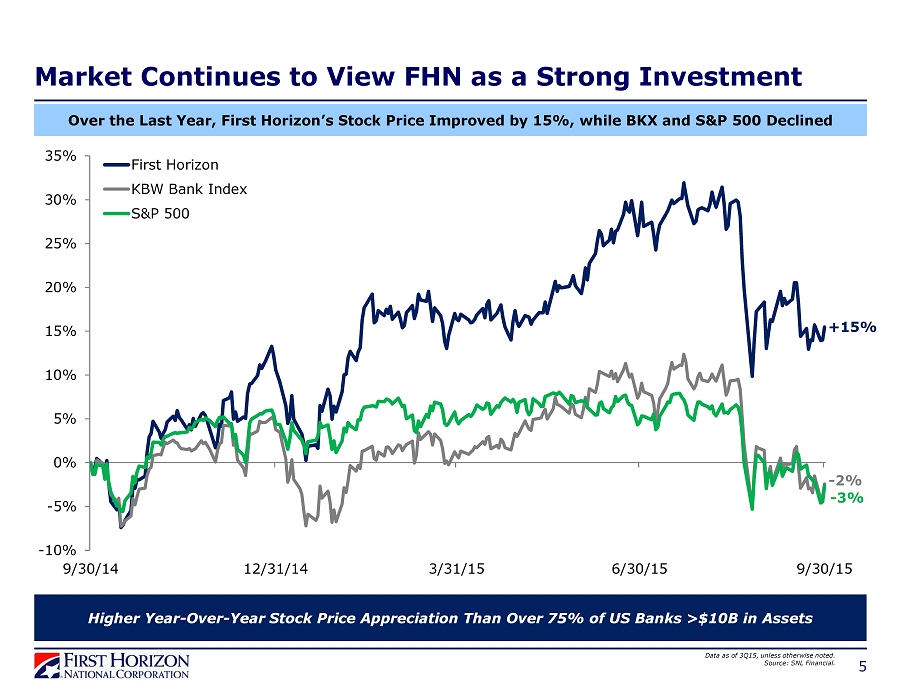
Higher Year - Over - Year Stock Price Appreciation Than Over 75% of US Banks >$10B in Assets Market Continues to View FHN as a Strong Investment -10% -5% 0% 5% 10% 15% 20% 25% 30% 35% 9/30/14 12/31/14 3/31/15 6/30/15 9/30/15 First Horizon KBW Bank Index S&P 500 5 +15% - 2% Data as of 3Q15, unless otherwise noted. Source: SNL Financial. - 3% Over the Last Year, First Horizon’s Stock Price Improved by 15%, while BKX and S&P 500 Declined
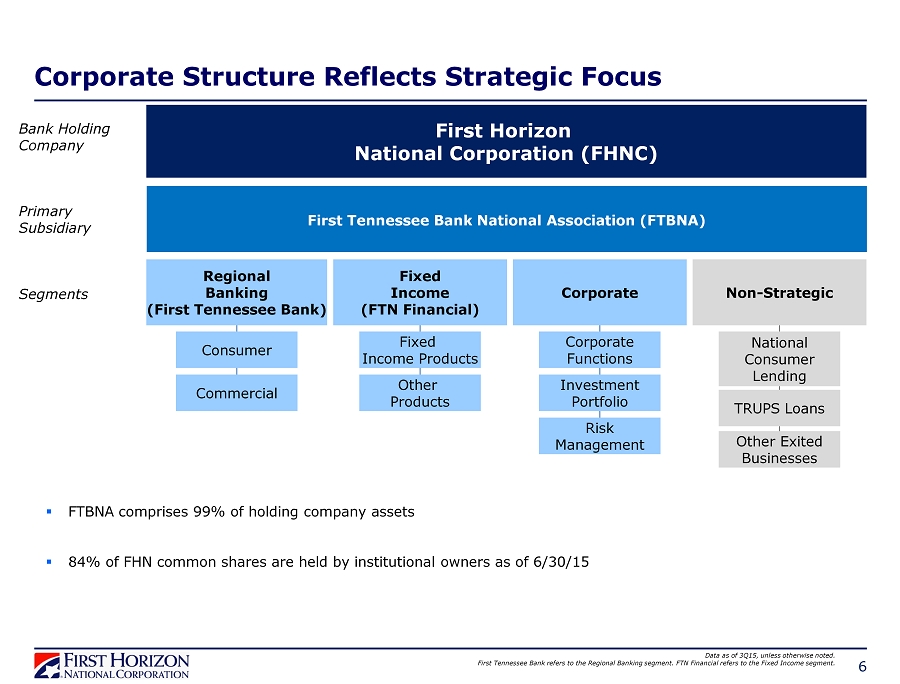
6 Corporate Structure Reflects Strategic Focus First Horizon National Corporation (FHNC) Fixed Income (FTN Financial) Regional Banking (First Tennessee Bank) Corporate Non - Strategic First Tennessee Bank National Association (FTBNA) Bank Holding Company Primary Subsidiary Segments ▪ FTBNA comprises 99 % of holding company assets ▪ 84 % of FHN common shares are held by institutional owners as of 6/30/15 Consumer Commercial Fixed Income Products Other Products Corporate Functions Investment Portfolio Risk Management National Consumer Lending TRUPS Loans Other Exited Businesses Data as of 3Q15, unless otherwise noted. First Tennessee Bank refers to the Regional Banking segment. FTN Financial refers to the Fixed Income segment.
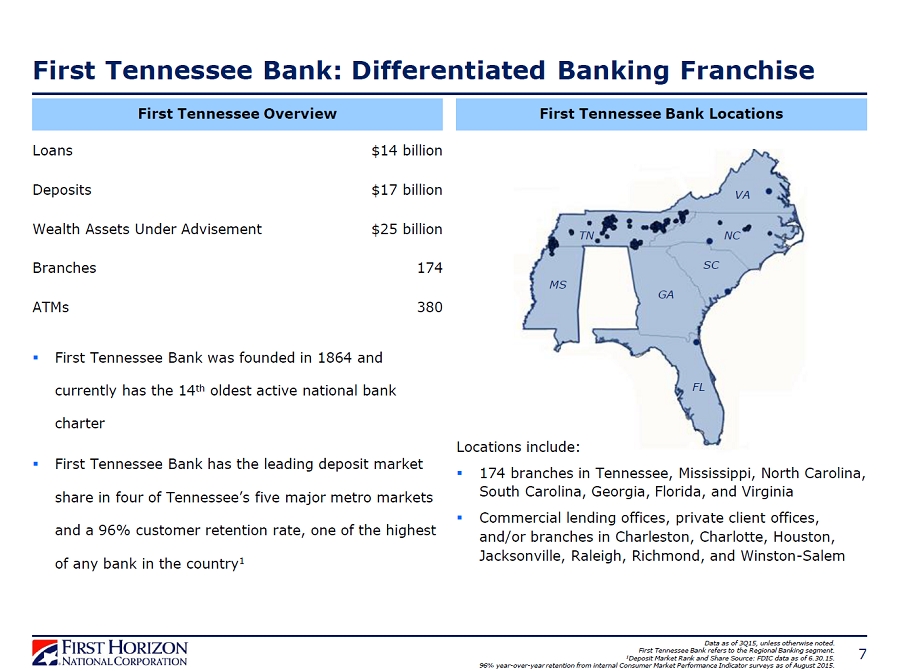
First Tennessee Bank: Differentiated Banking Franchise First Tennessee Overview Loans Deposits Wealth Assets Under Advisement Branches ATMs 7 $14 billion $17 billion $25 billion 174 380 ▪ First Tennessee Bank was founded in 1864 and currently has the 14 th oldest active national bank charter ▪ First Tennessee Bank has the leading deposit market share in four of Tennessee’s five major metro markets and a 96% customer retention rate, one of the highest of any bank in the country 1 First Tennessee Bank Locations TN MS GA SC NC VA FL Data as of 3Q15, unless otherwise noted. First Tennessee Bank refers to the Regional Banking segment. 1 Deposit Market Rank and Share Source: FDIC data as of 6.30.15. 96% year - over - year retention from internal Consumer Market Performance Indicator surveys as of August 2015. Locations include: ▪ 174 branches in Tennessee, Mississippi, North Carolina, South Carolina, Georgia, Florida, and Virginia ▪ Commercial lending offices, private client offices, and/or branches in Charleston, Charlotte, Houston, Jacksonville, Raleigh, Richmond, and Winston - Salem

FTN Financial: Unique Business Model with Strong Returns 8 Geographic Distribution of Domestic Clients $0mm $1mm $2mm $3mm $0mm $200mm $400mm $600mm $800mm 2008 2009 2010 2011¹ 2012 2013 2014¹ 3Q15 Annualized Revenue (left axis) Expense (left axis) ADR (right axis) FTN Financial Revenue and Expense ▪ Unique fixed income business model focused on sales and distribution ▪ Ancillary businesses provide additional sources of revenues and complement fixed income business ▪ Focused on investing in extensive fixed income distribution platform: FTN Financial refers to the Fixed Income segment. 1 2011 and 2014 exclude a legal expense and subsequent insurance recovery. These are Non - GAAP numbers and are reconciled in the ap pendix. ▪ Expansion of municipal products platform ▪ Continued development of public finance capability ▪ Fixed income business model highly adaptable to various market conditions
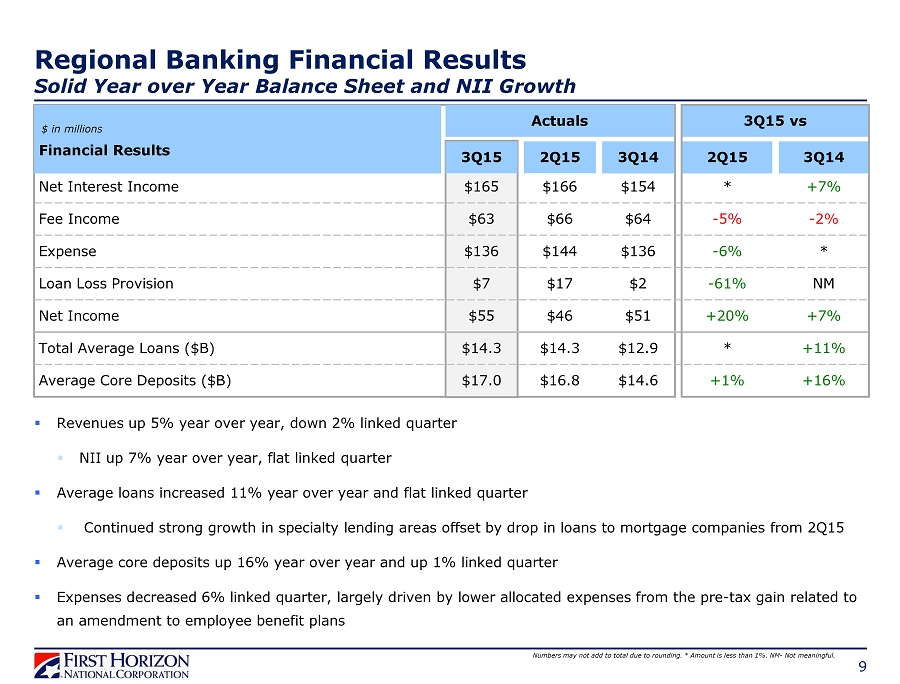
Regional Banking Financial Results Solid Year over Year Balance Sheet and NII Growth 9 Net Interest Income Fee Income Expense $ in millions Financial Results 3Q15 $165 Loan Loss Provision $63 $136 $7 3Q15 vs +7% - 2% * NM 2Q15 $166 $66 $144 $17 3Q14 $154 $64 $136 $2 2Q15 * - 5% - 6% - 61% 3Q14 Actuals ▪ Revenues up 5% year over year, down 2% linked quarter ▪ NII up 7% year over year, flat linked quarter ▪ Average loans increased 11% year over year and flat linked quarter ▪ Continued strong growth in specialty lending areas offset by drop in loans to mortgage companies from 2Q15 ▪ Average core deposits up 16% year over year and up 1% linked quarter ▪ Expenses decreased 6% linked quarter, largely driven by lower allocated expenses from the pre - tax gain related to an amendment to employee benefit plans Numbers may not add to total due to rounding. * Amount is less than 1%. NM - Not meaningful. Net Income $55 $46 $51 +7% +20% Total Average Loans ($B) Average Core Deposits ($B) $14.3 $14.3 $12.9 +11% * $17.0 $16.8 $14.6 +16% +1%
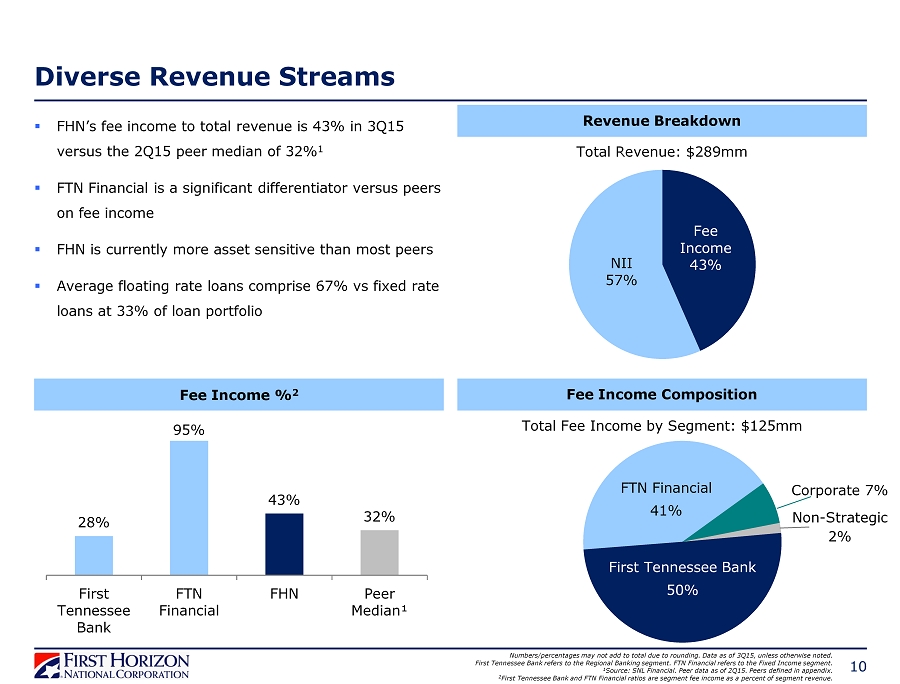
Diverse Revenue Streams Revenue Breakdown ▪ FHN’s fee income to total revenue is 43% in 3Q15 versus the 2Q15 peer median of 32% 1 ▪ FTN Financial is a significant differentiator versus peers on fee income ▪ FHN is currently more asset sensitive than most peers ▪ Average floating rate loans comprise 67% vs fixed rate loans at 33% of loan portfolio Fee Income 43% NII 57% 10 First Tennessee Bank 46% Fee Income Composition Fee Income % 2 Numbers/percentages may not add to total due to rounding. Data as of 3Q15, unless otherwise noted. First Tennessee Bank refers to the Regional Banking segment . FTN Financial refers to the Fixed Income segment. 1 Source: SNL Financial. Peer data as of 2Q15. Peers defined in appendix. 2 First Tennessee Bank and FTN Financial ratios are segment fee income as a percent of segment revenue. Total Revenue: $289mm Total Fee Income by Segment: $125mm 28% 95% 43% 32% First Tennessee Bank FTN Financial FHN Peer Median¹ FTN Financial 41% First Tennessee Bank 50% Corporate 7% Non - Strategic 2%
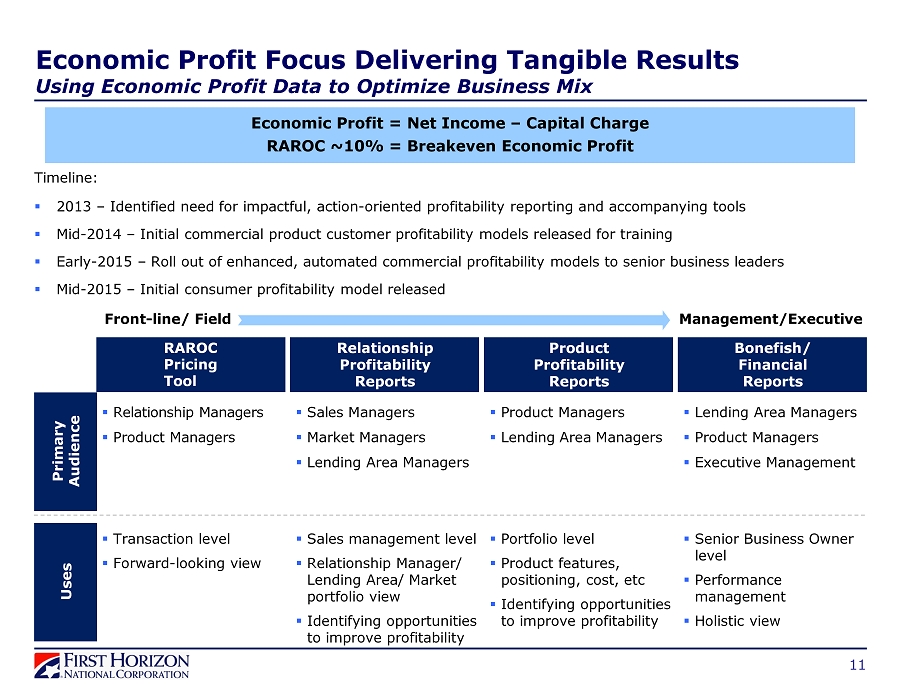
Front - li ne/ F i e l d M a n a g e m ent/Exe c ut i ve Economic Profit Focus Delivering Tangible Results Using Economic Profit Data to Optimize Business Mix Timeline: ▪ 2013 – Identified need for impactful, action - oriented profitability reporting and accompanying tools ▪ Mid - 2014 – Initial commercial product customer profitability models released for training ▪ Early - 2015 – Roll out of enhanced, automated commercial profitability models to senior business leaders ▪ Mid - 2015 – Initial consumer profitability model released Bonefish/ Financial Reports RAROC Pricing Tool Relationship Profitability Reports Product Profitability Reports Primary A ud i ence ▪ R elationship Managers ▪ P roduct Managers ▪ Sa l es M a n a g ers ▪ Ma r k et Ma na g e r s ▪ Lending Area Managers ▪ P r od u ct M a n a g ers ▪ L ending Area Managers ▪ Lending Area Managers ▪ Product Managers ▪ Executive Management U s e s ▪ Transaction level ▪ Forward - looking view ▪ Sales management level ▪ Relationship Manager/ Lending Area/ Market portfolio view ▪ Identifying opportunities to improve profitability ▪ Portfolio level ▪ Product features, positioning, cost, etc ▪ Identifying opportunities to improve profitability ▪ Senior Business Owner level ▪ Performance management ▪ Holistic view 11 Economic Profit = Net Income – Capital Charge RAROC ~10% = Breakeven Economic Profit

29% 5% 66% 12 Preparing for Rise in Interest Rates: Factors Leading to an Asset Sensitive Balance Sheet ▪ Loan portfolio comprised of 67% floating rate loans ▪ Approximately 8% of floating rate commercial loans have in - the - money floors 1 ▪ ~70% of floating rate loans are tied to LIBOR ▪ Securities portfolio comprises 14.5% of total assets with an estimated effective duration of 2.8 years ▪ Total period - end deposits increased 17% vs 3Q14 ▪ Strong DDA mix with emphasis on core deposit gathering ▪ Reduced reliance on interest rate sensitive wholesale funds Data as of 3Q15, unless otherwise noted. 1 Floors included in asset sensitivity modeling/disclosures. Excludes loans to mortgage companies. Asset Repricing Profile Levered to Short - Term Rate Increases Deposit Mix Trends 2008 3Q15 Time Deposits Noninterest Bearing Other Interest Bearing $0B $5B $10B $15B $20B $25B ≤ 12 Months > 12 Months Investment Securities Fixed Rate Loans Floating Rate Loans Other Assets 70% 30% ▪ Floating rate loans float with LIBOR or prime ▪ Liabilities more closely managed ▪ Short - term repricing gap of +$3.2B 28% 26% 46% ▪ Stable DDA mix ▪ Migration from Time Deposits to MMDA & Savings
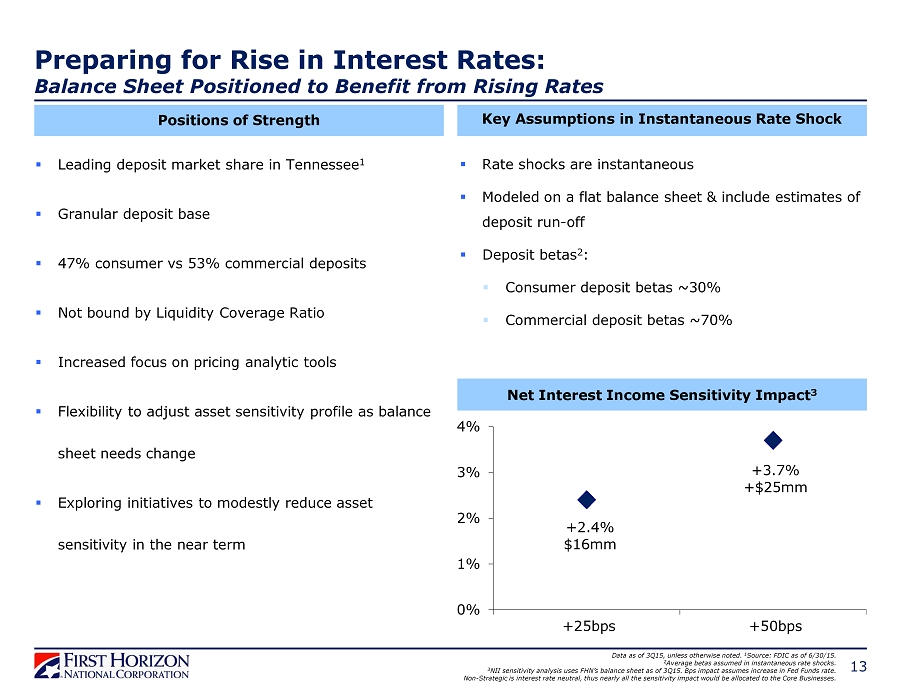
13 ▪ Leading deposit market share in Tennessee 1 ▪ Granular deposit base ▪ 47% consumer vs 53% commercial deposits ▪ Not bound by Liquidity Coverage Ratio ▪ Increased focus on pricing analytic tools ▪ Flexibility to adjust asset sensitivity profile as balance sheet needs change ▪ Exploring initiatives to modestly reduce asset sensitivity in the near term Preparing for Rise in Interest Rates: Balance Sheet Positioned to Benefit from Rising Rates Positions of Strength Key Assumptions in Instantaneous Rate Shock ▪ Rate shocks are instantaneous ▪ Modeled on a flat balance sheet & include estimates of deposit run - off ▪ Deposit betas 2 : ▪ Consumer deposit betas ~30% ▪ Commercial deposit betas ~70% Net Interest Income Sensitivity Impact 3 Data as of 3Q15, unless otherwise noted. 1 Source: FDIC as of 6/30/15. 2 Average betas assumed in instantaneous rate shocks. 3 NII sensitivity analysis uses FHN’s balance sheet as of 3Q15. Bps impact assumes increase in Fed Funds rate. Non - Strategic is interest rate neutral, thus nearly all the sensitivity impact would be allocated to the Core Businesses. +2.4% $16mm +3.7% +$25mm 0% 1% 2% 3% 4% +25bps +50bps
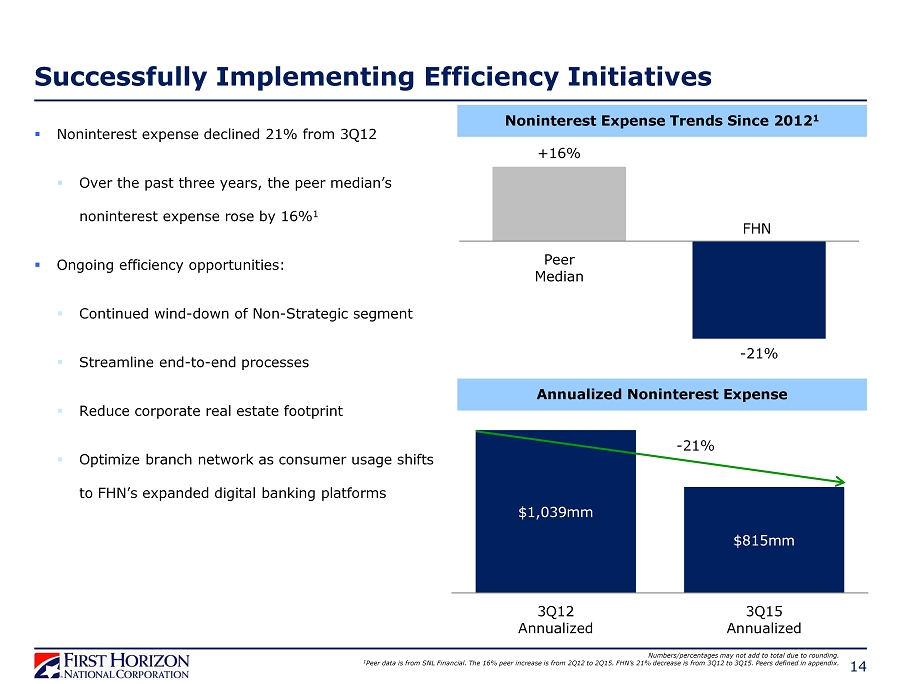
$1,039mm $815mm 3Q12 Annualized 3Q15 Annualized 14 Successfully Implementing Efficiency Initiatives Numbers/percentages may not add to total due to rounding. 1 Peer data is from SNL Financial. The 16% peer increase is from 2Q12 to 2Q15. FHN’s 21% decrease is from 3Q12 to 3Q15. Peers d efi ned in appendix. Annualized Noninterest Expense - 21% +16% - 21% Peer Median Noninterest Expense Trends Since 2012 1 FHN ▪ Noninterest expense declined 21% from 3Q12 ▪ Over the past three years, the peer median’s noninterest expense rose by 16% 1 ▪ Ongoing efficiency opportunities: ▪ Continued wind - down of Non - Strategic segment ▪ Streamline end - to - end processes ▪ Reduce corporate real estate footprint ▪ Optimize branch network as consumer usage shifts to FHN’s expanded digital banking platforms
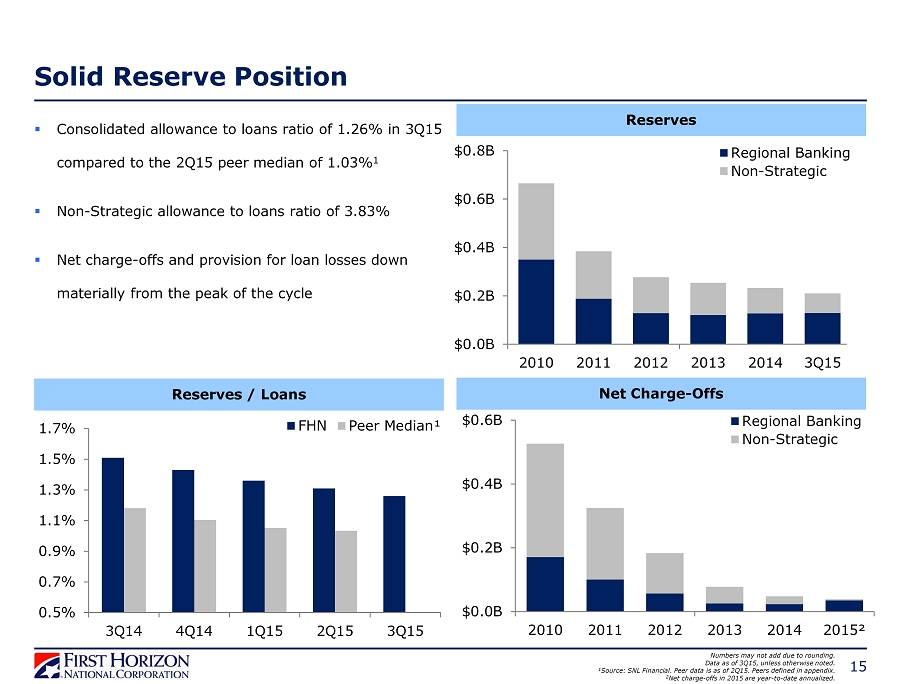
15 Solid Reserve Position Reserves / Loans 0.5% 0.7% 0.9% 1.1% 1.3% 1.5% 1.7% 3Q14 4Q14 1Q15 2Q15 3Q15 FHN Peer Median¹ ▪ Consolidated allowance to loans ratio of 1.26% in 3Q15 compared to the 2Q15 peer median of 1.03% 1 ▪ Non - Strategic allowance to loans ratio of 3.83% ▪ Net charge - offs and provision for loan losses down materially from the peak of the cycle Numbers may not add due to rounding. Data as of 3Q15, unless otherwise noted. 1 Source: SNL Financial. Peer data is as of 2Q15. Peers defined in appendix. 2 Net charge - offs in 2015 are year - to - date annualized. Reserves $0.0B $0.2B $0.4B $0.6B $0.8B 2010 2011 2012 2013 2014 3Q15 Regional Banking Non-Strategic Net Charge - Offs $0.0B $0.2B $0.4B $0.6B 2010 2011 2012 2013 2014 2015² Regional Banking Non-Strategic
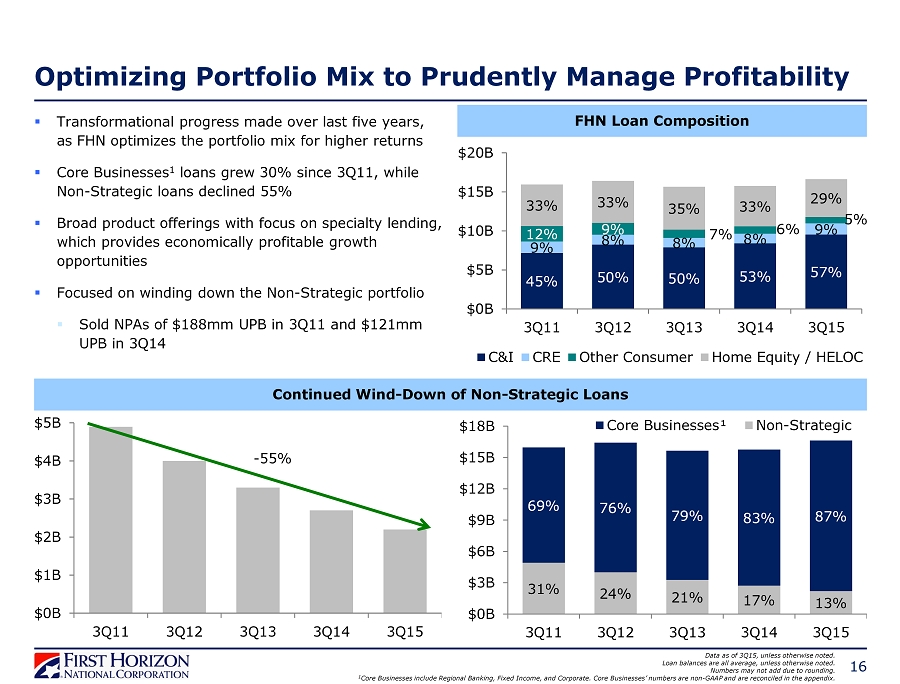
Optimizing Portfolio Mix to Prudently Manage Profitability FHN Loan Composition 31% 24% 21% 17% 13% 69% 76% 79% 83% 87% $0B $3B $6B $9B $12B $15B $18B 3Q11 3Q12 3Q13 3Q14 3Q15 Core Businesses¹ Non-Strategic 16 Continued Wind - Down of Non - Strategic Loans ▪ Transformational progress made over last five years, as FHN optimizes the portfolio mix for higher returns ▪ Core Businesses 1 loans grew 30% since 3Q11, while Non - Strategic loans declined 55% ▪ Broad product offerings with focus on specialty lending, which provides economically profitable growth opportunities ▪ Focused on winding down the Non - Strategic portfolio ▪ Sold NPAs of $188mm UPB in 3Q11 and $121mm UPB in 3Q14 $0B $1B $2B $3B $4B $5B 3Q11 3Q12 3Q13 3Q14 3Q15 - 55% Data as of 3Q15, unless otherwise noted. Loan balances are all average, unless otherwise noted. Numbers may not add due to rounding. 1 Core Businesses include Regional Banking, Fixed Income, and Corporate. Core Businesses’ numbers are non - GAAP and are reconciled in the appendix. 45% 50% 50% 53% 57% 9% 8% 8% 8% 9% 12% 9% 7% 6% 5% 33% 33% 35% 33% 29% $0B $5B $10B $15B $20B 3Q11 3Q12 3Q13 3Q14 3Q15 C&I CRE Other Consumer Home Equity / HELOC
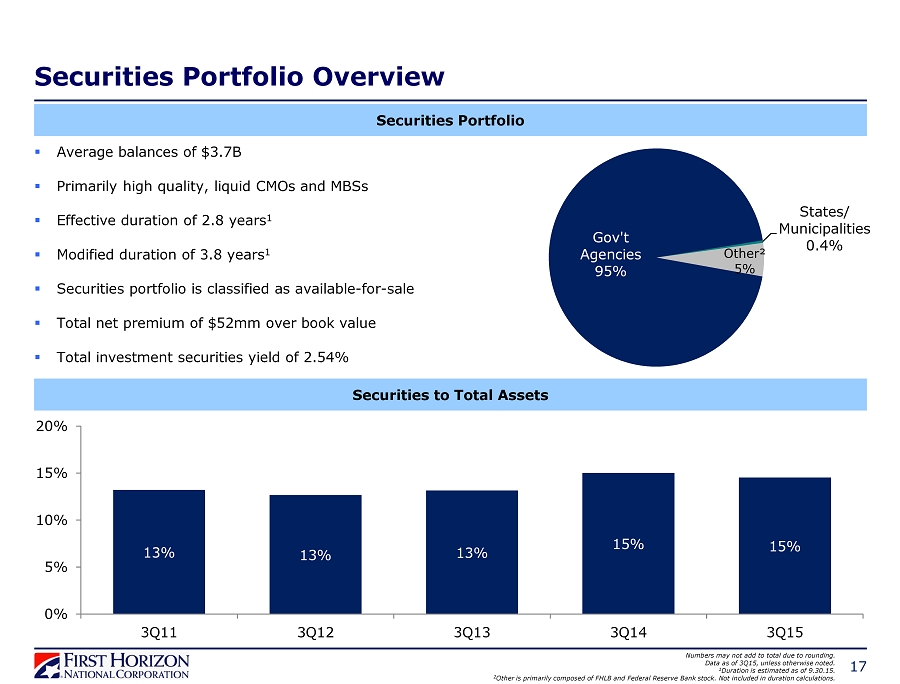
Gov't Agencies 95% States/ Municipalities 0.4% Other² 5% Securities to Total Assets 17 Numbers may not add to total due to rounding. Data as of 3Q15, unless otherwise noted. 1 Duration is estimated as of 9.30.15. 2 Other is primarily composed of FHLB and Federal Reserve Bank stock. Not included in duration calculations. Securities Portfolio Overview Securities Portfolio ▪ Average balances of $3.7B ▪ Primarily high quality, liquid CMOs and MBSs ▪ Effective duration of 2.8 years 1 ▪ Modified duration of 3.8 years 1 ▪ Securities portfolio is classified as available - for - sale ▪ Total net premium of $52mm over book value ▪ Total investment securities yield of 2.54% 13% 13% 13% 15% 15% 0% 5% 10% 15% 20% 3Q11 3Q12 3Q13 3Q14 3Q15
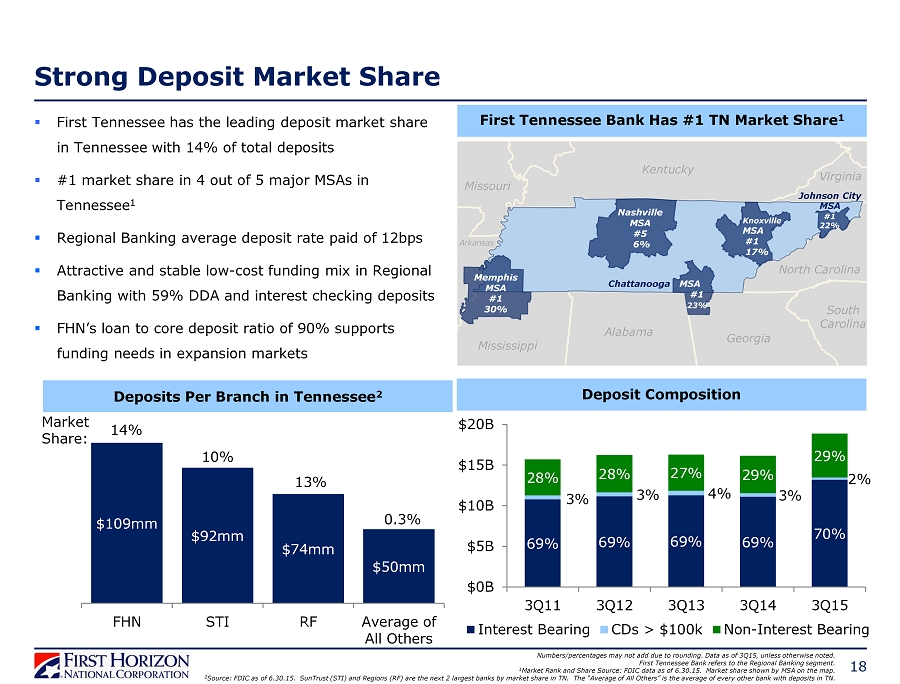
$109mm $92mm $74mm $50mm FHN STI RF Average of All Others Strong Deposit Market Share Deposit Composition 69% 69% 69% 69% 70% 3% 3% 4% 3% 2% 28% 28% 27% 29% 29% $0B $5B $10B $15B $20B 3Q11 3Q12 3Q13 3Q14 3Q15 Interest Bearing CDs > $100k Non-Interest Bearing 18 ▪ First Tennessee has the leading deposit market share in Tennessee with 14% of total deposits ▪ #1 market share in 4 out of 5 major MSAs in Tennessee 1 ▪ Regional Banking average deposit rate paid of 12bps ▪ Attractive and stable low - cost funding mix in Regional Banking with 59% DDA and interest checking deposits ▪ FHN’s loan to core deposit ratio of 90% supports funding needs in expansion markets Numbers/percentages may not add due to rounding. Data as of 3Q15, unless otherwise noted. First Tennessee Bank refers to the Regional Banking segment. 1 Market Rank and Share Source: FDIC data as of 6.30.15. M arket share shown by MSA on the map. 2 Source: FDIC as of 6.30.15. SunTrust (STI) and Regions (RF) are the next 2 largest banks by market share in TN. The “Average of All Othe rs ” is the average of every other bank with deposits in TN. Deposits Per Branch in Tennessee 2 Market Share: 14% 10% 13% 0.3% First Tennessee Bank Has #1 TN Market Share 1 Memphis MSA #1 30% Nashville MSA #5 6% MSA #1 23% Knoxville MSA # 1 17% Missouri Arkansas Kentucky Mississippi Alabama Georgia South Carolina North Carolina Virginia Johnson City MSA # 1 22% Chattanooga
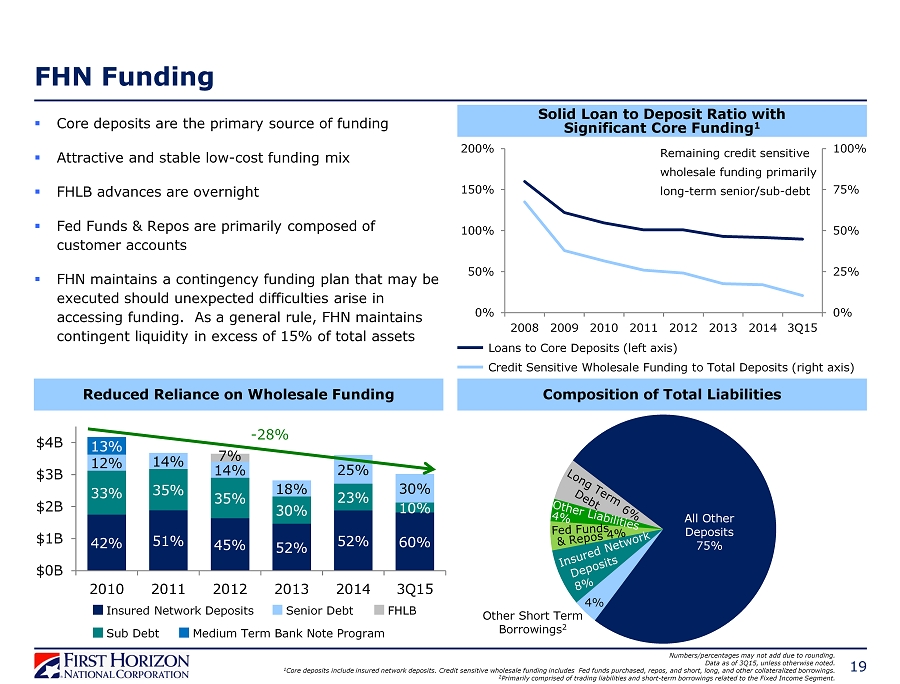
▪ Core deposits are the primary source of funding ▪ Attractive and stable low - cost funding mix ▪ FHLB advances are overnight ▪ Fed Funds & Repos are primarily composed of customer accounts ▪ FHN maintains a contingency funding plan that may be executed should unexpected difficulties arise in accessing funding. As a general rule, FHN maintains contingent liquidity in excess of 15% of total assets FHN Funding Reduced Reliance on Wholesale Funding 42% 51% 45% 52% 52% 60% 33% 35% 35% 30% 23% 10% 12% 14% 14% 18% 25% 30% 13% 7% $0B $1B $2B $3B $4B 2010 2011 2012 2013 2014 3Q15 19 - 28% Composition of Total Liabilities Numbers/percentages may not add due to rounding. Data as of 3Q15, unless otherwise noted. 1 Core deposits include insured network deposits. Credit sensitive wholesale funding includes Fed funds purchased, repos, and short, long, and other collateralized borrowings . 2 Primarily comprised of trading liabilities and short - term borrowings related to the Fixed Income Segment. 0% 25% 50% 75% 100% 0% 50% 100% 150% 200% 2008 2009 2010 2011 2012 2013 2014 3Q15 Remaining credit sensitive wholesale funding primarily long - term senior/sub - debt Solid Loan to Deposit Ratio with Significant Core Funding 1 Loans to Core Deposits (left axis) Credit Sensitive Wholesale Funding to Total Deposits (right axis) All Other Deposits 75% 4% Other Short Term Borrowings 2 Insured Network Deposits Senior Debt FHLB Sub Debt Medium Term Bank Note Program
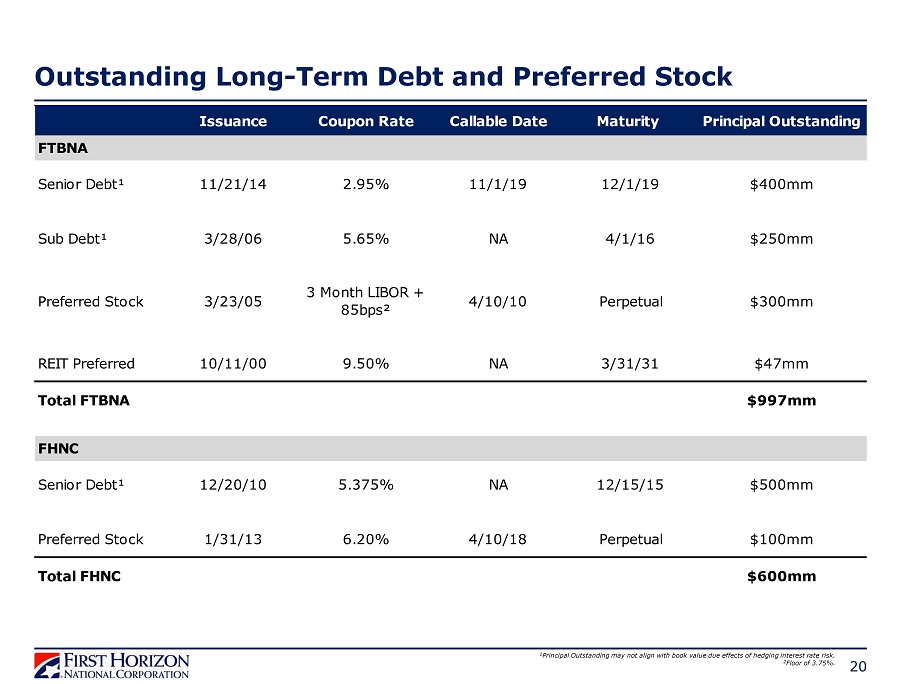
Outstanding Long - Term Debt and Preferred Stock 20 1 Principal Outstanding may not align with book value due effects of hedging interest rate risk. 2 Floor of 3.75%. Issuance Coupon Rate Callable Date Maturity Principal Outstanding FTBNA Senior Debt¹ 11/21/14 2.95% 11/1/19 12/1/19 $400mm Sub Debt¹ 3/28/06 5.65% NA 4/1/16 $250mm Preferred Stock 3/23/05 3 Month LIBOR + 85bps² 4/10/10 Perpetual $300mm REIT Preferred 10/11/00 9.50% NA 3/31/31 $47mm Total FTBNA $997mm FHNC Senior Debt¹ 12/20/10 5.375% NA 12/15/15 $500mm Preferred Stock 1/31/13 6.20% 4/10/18 Perpetual $100mm Total FHNC $600mm

Strong Capital Position Holding Company Capital 1 Bank Level Capital 1,2 10.8% 6.5% 12.2% 8.0% 13.4% 10.0% 3Q15 FHN Basel III Well- Capitalized 21 ▪ With 10.8% Common Equity Tier 1, 12.2% Tier 1, and 13.4% Total Capital, FHN’s capitalization significantly exceeds Basel III standards ▪ Similarly, FTBNA’s capital ratios exceed Basel III’s well - capitalized standards at 10.9% Common Equity Tier 1, 12.1% Tier 1, and 13.3% Total Capital 10.9% 6.5% 12.1% 8.0% 13.3% 10.0% 3Q15 FTBNA Basel III Well- Capitalized 1 The 3Q15 capital ratios are estimates. 2 Capital ratios are calculated excluding financial subsidiaries. Common Equity Tier 1 Tier 1 Total Capital
Successfully Executing on Key Priorities 22 Building a Foundation for Attractive Long - Term Earnings Power ▪ Proven execution capabilities ▪ Unique size, scope, and strengths ▪ Focused on efficiency, productivity, economic profitability, and growth opportunities ▪ Breadth and depth of talent that will be able to profitably run and grow the company ▪ Overarching emphasis on safety and soundness

APPENDIX 23

24 3Q15 Credit Quality Summary by Portfolio Numbers may not add to total due to rounding. Data as of 3Q15. NM: Not meaningful. 1 Credit card, Permanent Mortgage, and Other. 2 Credit card, OTC, and Other Consumer. 3 Net charge - offs are annualized. 4 Exercised clean - up calls on jumbo securitizations in 1Q13, 3Q12, 2Q11, and 4Q10, which are now on balance sheet in the Corporate segment. ($ in millions) CRE HE & HELOC Other 1 Total Permanent Mortgage Commercial (C&I & Other) CRE HE & HELOC Permanent Mortgage Other 2 Total Period End Loans $9,178 $1,488 $3,469 $348 $14,483 $107 $432 $0 $1,345 $348 $10 $16,725 30+ Delinquency 0.10% 0.43% 0.48% 1.33% 0.25% 2.95% 0.02% NM 2.07% 1.58% 1.77% 0.44% Dollars $9 $6 $17 $5 $36 $3 $0 $0 $28 $5 $0 $73 NPL % 0.18% 0.54% 0.75% 0.14% 0.35% 2.85% 3.08% 0.00% 6.36% 8.71% 7.09% 1.10% Dollars $16 $8 $26 $0 $51 $3 $13 $0 $86 $30 $1 $184 Net Charge-offs 3 % 0.33% NM 0.11% 2.49% 0.29% NM NM NM 0.37% 0.90% 10.22% 0.28% Dollars $7 $0 $1 $2 $10 NM -$1 $0 $1 $1 $0 $12 Allowance $66 $25 $28 $10 $129 NM $6 $0 $55 $20 $1 $211 Allowance / Loans % 0.72% 1.70% 0.79% 3.00% 0.89% NM 1.35% NM 4.09% 5.75% 10.34% 1.26% Allowance / Charge-offs 2.21x NM 7.62x 1.19x 3.10x NM NM NM 10.67x 6.23x 0.98x 4.61x FHNC Consol Regional Banking Corporate 4 Non-Strategic Commercial (C&I & Other)

Construction 29% Land 3% Mini - Perm/Non - Construction 67% 25 C&I and CRE Portfolio Detail $1.0 $1.2 $1.6 $1.8 $1.4 $0.9 $0.9 $1.0 $1.6 $1.4 $0.0 $0.5 $1.0 $1.5 $2.0 3Q14 4Q14 1Q15 2Q15 3Q15 Period End Average ▪ $9.6B C&I portfolio , diversified by industry, managed primarily in Regional Banking ▪ $1.5B CRE portfolio, comprising 9% of period - end consolidated loans ▪ Commercial (C&I and CRE) net charge - offs were $6mm for the quarter ▪ Charge - offs were $9.2mm with recoveries of $3.1mm Multi - Family 29% Retail 26% Hospitality 14% Office 12% CRE: Loan Type CRE: Collateral Type C&I: Loans to Mortgage Companies Data as of 3Q15. Numbers may not add to total due to rounding. $2.0B
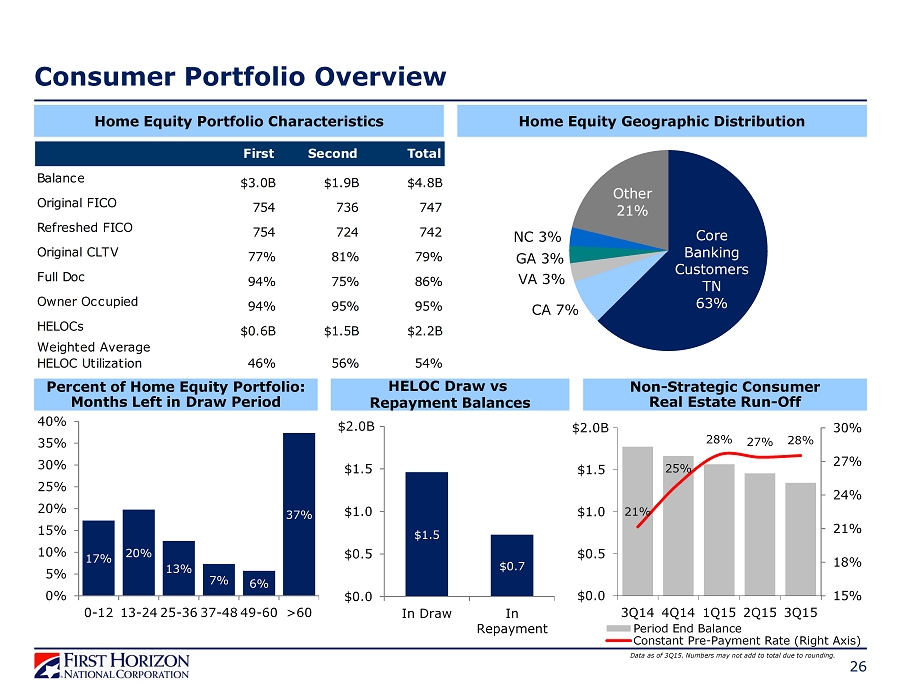
26 Core Banking Customers TN 63% CA 7% VA 3% GA 3% NC 3% Other 21% Consumer Portfolio Overview $1.5 $0.7 $0.0 $0.5 $1.0 $1.5 $2.0 In Draw In Repayment HELOC Draw vs Repayment Balances Percent of Home Equity Portfolio: Months Left in Draw Period 17% 20% 13% 7% 6% 37% 0% 5% 10% 15% 20% 25% 30% 35% 40% 0-12 13-24 25-36 37-48 49-60 >60 Home Equity Portfolio Characteristics Home Equity Geographic Distribution 21% 25% 28% 27% 28% 15% 18% 21% 24% 27% 30% $0.0 $0.5 $1.0 $1.5 $2.0 3Q14 4Q14 1Q15 2Q15 3Q15 Period End Balance Constant Pre-Payment Rate (Right Axis) Non - Strategic Consumer Real Estate Run - Off $2.0B $2.0B Data as of 3Q15. Numbers may not add to total due to rounding. First Second Total Balance $3.0B $1.9B $4.8B Original FICO 754 736 747 Refreshed FICO 754 724 742 Original CLTV 77% 81% 79% Full Doc 94% 75% 86% Owner Occupied 94% 95% 95% HELOCs $0.6B $1.5B $2.2B Weighted Average HELOC Utilization 46% 56% 54%
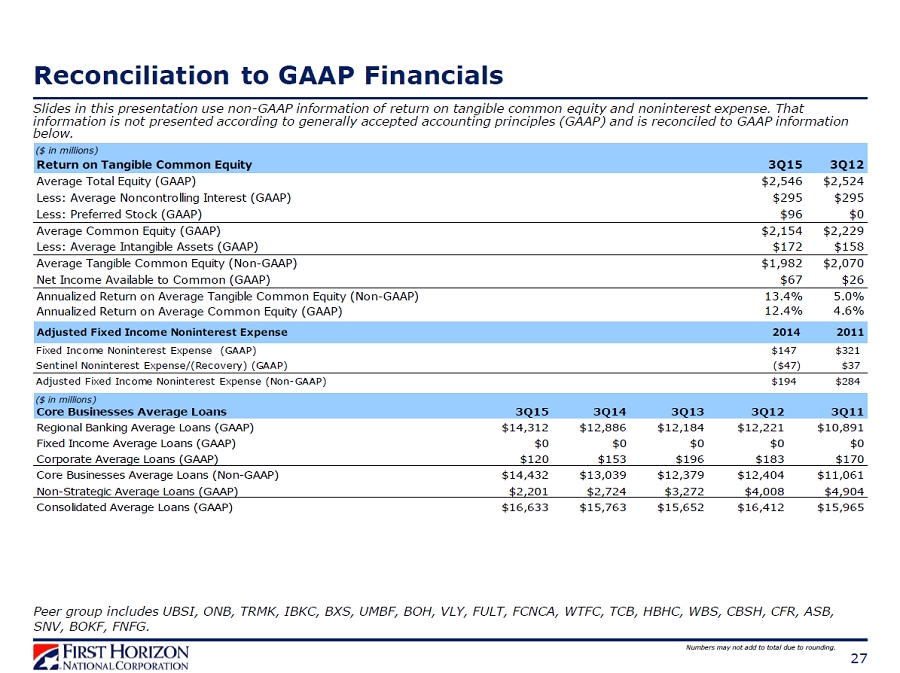
Reconciliation to GAAP Financials 27 Slides in this presentation use non - GAAP information of return on tangible common equity and noninterest expense. That information is not presented according to generally accepted accounting principles (GAAP ) and is reconciled to GAAP information below. Numbers may not add to total due to rounding. Adjusted Consolidated Noninterest Expense 2Q15 2Q12 $ % $218 $524 ($305) -58% $0 $250 ($250) -100% $0 $22 ($22) -100% $218 $252 ($33) -13% $874 $1,006 ($133) -13% 2014 2011 Fixed Income Noninterest Expense (GAAP) $147 $321 Sentinel Noninterest Expense/(Recovery) (GAAP) ($47) $37 Adjusted Fixed Income Noninterest Expense (Non-GAAP) $194 $284 2Q15 0.28% NM 0.81% 0.29% Non-Strategic NCO % (GAAP) -0.23% Consolidated NCO % (GAAP) 0.21% Change in: Less: Litigation Charge (GAAP) Consolidated Noninterest Expense (GAAP) Less: Repurchase and Foreclosure Provision (GAAP) Adjusted Consolidated Noninterest Expense (Non-GAAP) Adjusted Annualized Noninterest Expense (Non-GAAP) Adjusted Fixed Income Noninterest Expense Regional Banking NCO % (GAAP) Capital Markets NCO % (GAAP) Corporate NCO % (GAAP) Core Businesses NCO % (Non-GAAP) Core Businsess Net Charge-Off % Peer group includes UBSI, ONB, TRMK, IBKC, BXS, UMBF, BOH, VLY, FULT, FCNCA, WTFC, TCB, HBHC, WBS, CBSH, CFR, ASB, SNV, BOKF, FNFG. ($ in millions) Return on Tangible Common Equity 3Q15 3Q12 Average Total Equity (GAAP) $2,546 $2,524 Less: Average Noncontrolling Interest (GAAP) $295 $295 Less: Preferred Stock (GAAP) $96 $0 Average Common Equity (GAAP) $2,154 $2,229 Less: Average Intangible Assets (GAAP) $172 $158 Average Tangible Common Equity (Non-GAAP) $1,982 $2,070 Net Income Available to Common (GAAP) $67 $26 Annualized Return on Average Tangible Common Equity (Non-GAAP) 13.4% 5.0% Annualized Return on Average Common Equity (GAAP) 12.4% 4.6% ($ in millions) Core Businesses Average Loans 3Q15 3Q14 3Q13 3Q12 3Q11 Regional Banking Average Loans (GAAP) $14,312 $12,886 $12,184 $12,221 $10,891 Fixed Income Average Loans (GAAP) $0 $0 $0 $0 $0 Corporate Average Loans (GAAP) $120 $153 $196 $183 $170 Core Businesses Average Loans (Non-GAAP) $14,432 $13,039 $12,379 $12,404 $11,061 Non-Strategic Average Loans (GAAP) $2,201 $2,724 $3,272 $4,008 $4,904 Consolidated Average Loans (GAAP) $16,633 $15,763 $15,652 $16,412 $15,965