Exhibit 99.1

FOURTH QUARTER 2015
FINANCIAL SUPPLEMENT
If you need further information, please contact:
Aarti Bowman, Investor Relations
901-523-4017
aagoorha@firsthorizon.com
FHN TABLE OF CONTENTS
| | |
| | |
| | Page |
| | |
| First Horizon National Corporation Segment Structure | 3 |
| | |
| Performance Highlights | 4 |
| | |
| Consolidated Results | |
| Income Statement | |
| Income Statement | 6 |
| Other Income and Other Expense | 7 |
| Balance Sheet | |
| Period End Balance Sheet | 8 |
| Average Balance Sheet | 9 |
| Net Interest Income | 10 |
| Average Balance Sheet: Yields and Rates | 11 |
| | |
| Capital Highlights | 12 |
| | |
| Business Segment Detail | |
| Segment Highlights | 13 |
| Regional Banking | 14 |
| Fixed Income and Corporate | 15 |
| Non-Strategic | 16 |
| | |
| Asset Quality | |
| Asset Quality: Consolidated | 17 |
| Asset Quality: Regional Banking and Corporate | 19 |
| Asset Quality: Non-Strategic | 20 |
| Portfolio Metrics | 21 |
| | |
| Non-GAAP to GAAP Reconciliation | 22 |
| | |
| Glossary of Terms | 23 |
Other Information
This financial supplement contains forward-looking statements involving significant risks and uncertainties. A number of important factors could cause actual results to differ materially from those in the forward-looking information. Those factors include general economic and financial market conditions, including expectations of and actual timing and amount of interest rate movements including the slope of the yield curve, competition, customer and investor responses to these conditions, ability to execute business plans, geopolitical developments, recent and future legislative and regulatory developments, natural disasters, and items mentioned in this financial supplement and in First Horizon National Corporation’s (“FHN”) most recent press release, as well as critical accounting estimates and other factors described in FHN’s recent filings with the SEC. FHN disclaims any obligation to update any such forward-looking statements or to publicly announce the result of any revisions to any of the forward-looking statements to reflect future events or developments.
Use of Non-GAAP Measures and Regulatory Measures that are not GAAP
Certain measures are included in this financial supplement that are “non-GAAP,” meaning (under U.S. financial reporting rules) they are not presented in accordance with generally accepted accounting principles (“GAAP”) in the U.S. and also are not codified in U.S. banking regulations currently applicable to FHN. Although other entities may use calculation methods that differ from those used by FHN for non-GAAP measures, FHN’s management believes such measures are relevant to understanding the capital position or financial results of FHN. Non-GAAP measures are reported to FHN’s management and Board of Directors through various internal reports.
Presentation of regulatory measures, even those which are not GAAP, provides a meaningful base for comparability to other financial institutions subject to the same regulations as FHN, as demonstrated by their use by the various banking regulators in reviewing the capital adequacy of financial institutions. Although not GAAP terms, these regulatory measures are not considered “non-GAAP” under U.S. financial reporting rules as long as their presentation conforms to regulatory standards. Regulatory measures used in this financial supplement include: tier 1 capital, generally defined as the sum of core capital (including common equity and instruments that cannot be redeemed at the option of the holder) adjusted for certain items under risk based capital regulations; common equity tier 1 capital (for periods after fourth quarter 2014), generally defined as common equity less goodwill, other intangibles, and certain other required regulatory deductions; risk weighted assets (“RWA”), which is a measure of total on- and off-balance sheet assets adjusted for credit and market risk, used to determine regulatory capital ratios; and pre-provision net revenue (“PPNR”), calculated by adding the provision/(provision credit) for loan losses to income before income taxes. The regulatory common equity tier 1 capital used in 2015 and later periods is not the same as the non-regulatory, non-GAAP tier 1 common capital commonly used prior to 2015; comparisons between the two are not meaningful.
The non-GAAP measures presented in this financial supplement are return on average tangible common equity (“ROTCE”), tangible common equity (“TCE”) to tangible assets (“TA”), tangible book value per common share, and tier 1 common to RWA (for periods prior to first quarter 2015).
Refer to the tabular reconciliation of non-GAAP to GAAP measures and presentation of the most comparable GAAP items on page 22 of this financial supplement.
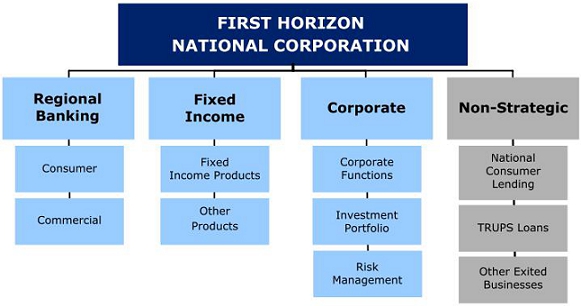
| FIRST HORIZON NATIONAL CORPORATION SEGMENT STRUCTURE |  |
| | |
| FHN PERFORMANCE HIGHLIGHTS | | |
| | |
| | | | | | | | | | | | |
| Summary of Fourth Quarter 2015 Notable Items | | |
| | Segment | | Item | | Income Statement | | Amount | | Comments | | |
| | | | | | | | | | | | |
| · | Non-Strategic | | Litigation expense | | Litigation and regulatory matters | | $14.2 million | | Pre-tax loss accruals related to legal matters | | |
| | | | | | | | | | | | |
| | | | | | | | | | | | |
| Consolidated Results for Fiscal Year 2015 vs. 2014 | | |
| | | | | | | | | | | | |
| · | Net income available to common shareholders was $79.7 million, or $.34 per diluted share in 2015, compared to $216.3 million, or $.91 per diluted share in 2014 |
| · | Net interest income (“NII”) increased 4 percent in 2015 to $653.7 million from $627.7 million in 2014; Net interest margin (“NIM”) decreased to 2.83 percent from 2.92 percent |
| · | The increase in NII was the result of loan growth within the regional bank’s commercial and consumer real estate installment portfolios, higher average balances of loans to mortgage companies and an increase in cash basis interest income and loan fees relative to the prior year, partially offset by the continued run-off of the non-strategic loan portfolios |
| · | Run-off of the non-strategic loan portfolios, a decline in yields on fixed rate loan portfolios, and an increase in average excess cash held at the Fed during the year contributed to the decline in NIM, but were somewhat mitigated by an increase in cash basis interest income and loan fees relative to 2014 |
| · | Noninterest income (including securities gains) was $517.3 million in 2015 compared to $550.0 million in 2014 |
| · | The decrease in noninterest income was primarily due to a decline in mortgage banking income as a result of gains on loan sales and previously unrecognized servicing fees associated with servicing sales which were recognized in 2014, partially offset by higher fixed income sales revenue in 2015 |
| · | Provision expense was $9.0 million in 2015 compared to $27.0 million in 2014 |
| · | Noninterest expense was $1.1 billion in 2015 compared to $.8 billion in 2014 |
| · | The increase in expense was primarily driven by larger net loss accruals recognized in 2015 related to legal matters |
| · | Period-end loans increased 9 percent to $17.7 billion; average loans were $16.6 billion in 2015 compared to $15.5 billion in 2014 |
| · | The increase in period-end and average loans was driven by loan growth in the commercial and consumer portfolios of the regional bank and loans added through the TrustAtlantic acquisition in fourth quarter 2015, somewhat offset by run-off of the non-strategic loan portfolios |
| · | Period-end core deposits increased 11 percent to $19.5 billion; average core deposits were $18.4 billion in 2015 compared to $15.9 billion in 2014 |
| · | Increase in period-end and average core deposits was driven by an increase in customer deposits, timing of a new product offering in correspondent banking in late 2014, the TrustAtlantic acquisition, and an increase in insured network deposits |
| · | The acquisition of bank branches in fourth quarter 2014 also contributed to the increase in average core deposits relative to 2014 |
| Fourth Quarter 2015 vs. Third Quarter 2015 | |
| | | | | | | | | | | |
Consolidated
| · | Net income available to common shareholders was $47.0 million, or $.20 per diluted share in fourth quarter, compared to $58.8 million, or $.25 per diluted share in third quarter |
| · | NII increased to $166.7 million in fourth quarter from $163.6 million in third quarter; NIM was 2.82 percent in fourth quarter compared to 2.85 percent in prior quarter |
| · | The increase in NII was primarily driven by loan growth within the regional bank, somewhat offset by the continuing wind down of the non-strategic loan portfolios |
| · | The decrease in NIM was largely the result of lower average balances of loans to mortgage companies, a decrease in cash basis interest income, an increase in average excess cash held at the Fed during the quarter, and run-off of the non-strategic loan portfolios |
| · | Noninterest income (including securities gains) increased to $132.2 million in fourth quarter from $125.1 million in prior quarter |
| · | The increase was primarily driven by increased Fixed income revenue partially offset by gains on extinguishment of debt recognized in third quarter |
| · | Noninterest expense was $243.7 million in fourth quarter compared to $215.4 million in third quarter largely driven by higher personnel expenses |
| · | An increase in litigation accruals, an impairment of a tax credit investment, and acquisition-related expenses also contributed to the increase in expense in fourth quarter relative to third quarter |
| · | Period-end loans were $17.7 billion and $16.7 billion in fourth quarter and third quarter, respectively; average loans increased 2 percent to $16.9 billion in fourth quarter |
| · | Period-end core deposits were $19.5 billion and $18.6 billion in fourth and third quarter, respectively; average core deposits increased 2 percent linked quarter to $19.0 billion in fourth quarter |
Regional Banking
| · | Pre-tax income was $78.6 million in fourth quarter compared to $85.6 million in third quarter; pre-provision net revenue was $84.5 million and $92.3 million in fourth and third quarters, respectively |
| · | Period-end loans increased 8 percent to $15.6 billion in fourth quarter primarily driven by increases in loans to mortgage companies and other commercial loans, as well as the TrustAtlantic acquisition in fourth quarter |
| · | Average loans were $14.8 billion and $14.3 billion in fourth and third quarters, respectively, as the increase in other commercial loans and loans acquired from TrustAtlantic more than offset a decline in the average balance of loans to mortgage companies |
| · | Average core deposits increased 2 percent to $17.4 billion in fourth quarter from $17.0 billion in third quarter; period-end core deposits increased 4 percent to $17.7 million in fourth quarter |
| · | Increase in average and period-end core deposits was driven by an increase in customer deposits and the TrustAtlantic acquisition |
| · | NII increased to $169.6 million in fourth quarter from $165.3 million in third quarter; NIM deceased 2 basis points to 4.61 percent in fourth quarter |
| · | The increase in NII was the result of higher average balances of commercial and consumer loans coupled with higher earnings credit as a result of an increase in average deposits, partially offset by a decline in average loans to mortgage companies |
| · | Provision expense declined to $5.9 million in fourth quarter compared to $6.7 million in the prior quarter |
| · | Noninterest income was relatively flat in fourth quarter at $62.7 million |
| · | Noninterest expense increased to $147.8 million in fourth quarter from $135.8 million in third quarter primarily due to an increase in personnel expenses |
| · | Third quarter expense was favorably impacted due in large part to gains related to an employee benefit plan amendment |
| · | Fourth quarter includes an increase in headcount related to the TrustAtlantic acquisition |
| FHN PERFORMANCE HIGHLIGHTS (continued) | |
| | | | | |
| | | | | |
| Fourth Quarter 2015 vs. Third Quarter 2015 (continued) | |
| | | | | |
Fixed Income
| · | Pre-tax income was $11.4 million in fourth quarter compared to a pre-tax loss of $5.0 million in third quarter |
| · | Fixed income product revenue was $52.7 million in fourth quarter up from $43.0 million in prior quarter |
| · | Fixed income product average daily revenue ("ADR") was $850 thousand and $671 thousand in fourth quarter and third quarter, respectively |
| · | Noninterest expense decreased to $54.5 million in fourth quarter from $59.8 million in the prior quarter |
| · | Fourth quarter decline was driven by lower litigation expenses related to the third quarter resolution of a legal matter, somewhat offset by higher variable compensation costs |
Corporate
| · | Pre-tax loss was $31.2 million in fourth quarter compared to pre-tax loss of $22.0 million in prior quarter |
| · | NII was negative $19.2 million and negative $19.0 million in fourth and third quarter, respectively |
| · | Duration extension within the investment portfolio, a function of higher interest rates and initiatives to moderate overall asset sensitivity profile |
| · | Estimated effective duration of the securities portfolio was 3.8 years in fourth quarter compared to 2.8 years in third quarter |
| · | Estimated modified duration of the securities portfolio was 4.5 years in fourth quarter compared to 3.8 years in prior quarter |
| · | Noninterest income (including securities gains) was $5.5 million in fourth quarter compared to $8.6 million in third quarter |
| · | Decrease primarily relates to a $5.8 million gain on the extinguishment of debt recognized in third quarter, partially offset by higher deferred compensation income driven by market conditions in fourth quarter and a $1.8 million gain from an exchange of available-for-sale debt securities; changes in deferred compensation income are mirrored by changes in deferred compensation expense |
| · | Noninterest expense was $17.4 million in fourth quarter compared to $11.5 million in third quarter |
| · | The expense increase was attributable to a $2.8 million impairment of a tax credit investment recognized in fourth quarter, a $2.7 million increase in deferred compensation expense, and $2.7 million of acquisition costs related to TrustAtlantic |
Non-Strategic
| · | Pre-tax loss was $4.7 million in fourth quarter compared to pre-tax income of $13.7 million in third quarter |
| · | NII was $12.4 million in fourth quarter compared to $14.3 million in prior quarter |
| · | The non-strategic segment had a provision credit of $4.9 million in fourth quarter compared to a provision credit of $5.7 million in third quarter |
| · | Noninterest expense increased to $24.0 million in fourth quarter from $8.4 million in prior quarter primarily driven by a $15.0 million net increase in litigation accruals related to legal matters |
Asset Quality
· Allowance for loan losses declined to $210.2 million in fourth quarter from $210.8 million in third quarter; the allowance to loans ratio was 119 basis points in fourth quarter compared to 126 basis points in third quarter
| · | Net charge-offs ("NCOs") were $1.6 million in fourth quarter compared to $11.5 million in third quarter; annualized net charge-offs decreased to 4 basis points of average loans in fourth quarter from 28 basis points in prior quarter |
| · | The regional bank had a net recovery of $2.8 million in fourth quarter which was driven by a decline in commercial charge-offs combined with the impact of a large recovery from one C&I borrower; net charge-offs in third quarter were $10.5 million |
| · | Net charge-offs within non-strategic increased $3.3 million to $4.4 million; the increase was driven by a charge-off associated with the sale of an insurance TRUP that was on interest deferral |
| · | Nonperforming loans ("NPLs") in the portfolio decreased to $179.1 million in the fourth quarter from $184.0 million in the third quarter |
| · | Nonperforming assets ("NPAs"), including loans held-for-sale, decreased to $211.9 million in fourth quarter from $217.2 million in the prior quarter |
| · | The decrease in NPAs largely corresponded to the decrease in NPLs |
| · | Total 30+ delinquencies increased to $74.2 million in fourth quarter compared to $73.1 million in prior quarter |
| · | The increase was primarily driven by consumer real estate loans |
| · | Troubled debt restructurings ("TDRs") decreased to $367.7 million in fourth quarter from $377.3 million in prior quarter |
Taxes
| · | The effective tax rates (“ETR”) for fourth quarter and third quarter were 5.01 percent and 12.32 percent, respectively. The fourth and third quarter rates were favorably affected by $3.1 million and $3.3 million in discrete items, respectively. The decrease in the effective tax rate from third quarter was primarily related to the decrease in pre-tax income during the quarter |
| · | The effective tax rate for 2015 is 10.11 percent, while the effective tax rate for 2014 was 26.45 percent. The decrease in the effective tax rate from 2014 was due to the decrease in pre-tax income during 2015. The 2015 and 2014 rates were favorably affected by $3.6 million and $4.2 million in discrete items, respectively |
| · | The rates reflect the favorable effect from permanent benefits. Permanent benefits primarily consist of tax credit investments, life insurance, tax-exempt interest, and the utilization of the capital loss carryover |
Capital and Liquidity
| · | Paid $0.06 per common share quarterly dividend ($14.2 million) on January 4, 2016 |
| · | Paid aggregate preferred quarterly dividend of $1.6 million on January 11, 2016 |
| · | Issued 5.1 million common shares in connection with the TrustAtlantic acquisition in fourth quarter |
| · | Repurchased shares costing $12.6 million in fourth quarter; $133.1 million remaining authorization under the current share repurchase program |
| · | Cumulative shares repurchased since October 2011 are $329.6 million with a volume weighted average price of $9.83 per share (before $.02 per share broker commission) |
| · | Capital ratios (regulatory capital ratios based on period-end balances under the Basel III risk-based capital rules as phased-in) (current quarter is an estimate) |
| · | Tangible common equity to tangible assets of 7.82 percent in fourth quarter compared to 8.00 percent in prior quarter |
| · | Common Equity Tier 1 of 10.45 percent in fourth quarter compared to 10.71 percent in prior quarter |
| · | Tier 1 of 11.80 percent in fourth quarter compared to 12.11 percent in prior quarter |
| · | Total Capital of 13.01 percent in fourth quarter compared to 13.38 percent in prior quarter |
| · | Leverage of 9.85 percent in fourth quarter compared to 9.95 percent in prior quarter` |
FHN CONSOLIDATED INCOME STATEMENT
Quarterly/Annually, Unaudited
| | | | | | | | | | | | | | | | | | | | | | | | | | | | | | | |
| | | | | | | | | | | | | | | | | | 4Q15 Changes vs. | | Twelve months ended | | 2015 vs. |
| (Dollars in thousands, except per share data) | | 4Q15 | | | 3Q15 | | | 2Q15 | | | 1Q15 | | | 4Q14 | | | 3Q15 | | | 4Q14 | | | 2015 | | | 2014 | | | 2014 |
| | | | | | | | | | | | | | | | | | | | | | | | | | | | | | | | | | | | | | | | | |
| Interest income | | $ | 187,620 | | | $ | 183,687 | | | $ | 187,030 | | | $ | 178,068 | | | $ | 179,448 | | | | 2 | % | | | 5 | % | | $ | 736,405 | | | $ | 709,249 | | | | 4 | % |
| Less: interest expense | | | 20,968 | | | | 20,125 | | | | 20,390 | | | | 21,202 | | | | 20,398 | | | | 4 | % | | | 3 | % | | | 82,685 | | | | 81,531 | | | | 1 | % |
| Net interest income | | | 166,652 | | | | 163,562 | | | | 166,640 | | | | 156,866 | | | | 159,050 | | | | 2 | % | | | 5 | % | | | 653,720 | | | | 627,718 | | | | 4 | % |
| Provision for loan losses | | | 1,000 | | | | 1,000 | | | | 2,000 | | | | 5,000 | | | | 6,000 | | | | * | | | | (83 | )% | | | 9,000 | | | | 27,000 | | | | (67 | )% |
| Net interest income after provision for loan losses | | | 165,652 | | | | 162,562 | | | | 164,640 | | | | 151,866 | | | | 153,050 | | | | 2 | % | | | 8 | % | | | 644,720 | | | | 600,718 | | | | 7 | % |
| Noninterest income: | | | | | | | | | | | | | | | | | | | | | | | | | | | | | | | | | | | | | | | | |
| Fixed income | | | 61,673 | | | | 51,804 | | | | 56,241 | | | | 61,619 | | | | 48,486 | | | | 19 | % | | | 27 | % | | | 231,337 | | | | 200,595 | | | | 15 | % |
| Deposit transactions and cash management | | | 28,951 | | | | 28,911 | | | | 28,430 | | | | 26,551 | | | | 29,038 | | | | * | | | | * | | | | 112,843 | | | | 111,951 | | | | 1 | % |
| Brokerage, management fees and commissions | | | 11,021 | | | | 11,620 | | | | 12,456 | | | | 11,399 | | | | 11,647 | | | | (5 | )% | | | (5 | )% | | | 46,496 | | | | 49,099 | | | | (5 | )% |
| Mortgage banking (a) | | | 1,149 | | | | 761 | | | | 376 | | | | 1,584 | | | | 1,808 | | | | 51 | % | | | (36 | )% | | | 3,870 | | | | 71,257 | | | | (95 | )% |
| Trust services and investment management | | | 6,873 | | | | 6,590 | | | | 7,416 | | | | 6,698 | | | | 6,945 | | | | 4 | % | | | (1 | )% | | | 27,577 | | | | 27,777 | | | | (1 | )% |
| Bankcard income | | | 5,607 | | | | 5,561 | | | | 5,884 | | | | 5,186 | | | | 5,737 | | | | 1 | % | | | (2 | )% | | | 22,238 | | | | 23,697 | | | | (6 | )% |
| Bank-owned life insurance | | | 3,738 | | | | 4,135 | | | | 3,391 | | | | 3,462 | | | | 3,503 | | | | (10 | )% | | | 7 | % | | | 14,726 | | | | 16,394 | | | | (10 | )% |
| Other service charges | | | 2,751 | | | | 2,968 | | | | 3,043 | | | | 2,848 | | | | 2,830 | | | | (7 | )% | | | (3 | )% | | | 11,610 | | | | 11,882 | | | | (2 | )% |
| Insurance commissions | | | 769 | | | | 608 | | | | 654 | | | | 596 | | | | 616 | | | | 26 | % | | | 25 | % | | | 2,627 | | | | 2,257 | | | | 16 | % |
| Securities gains/(losses), net | | | 1,439 | | | | (345 | ) | | | 8 | | | | 276 | | | | — | | | | NM | | | | NM | | | | 1,378 | | | | 2,872 | | | | (52 | )% |
| Other (b) | | | 8,261 | | | | 12,490 | | | | 12,402 | | | | 9,470 | | | | 8,988 | | | | (34 | )% | | | (8 | )% | | | 42,623 | | | | 32,263 | | | | 32 | % |
| Total noninterest income | | | 132,232 | | | | 125,103 | | | | 130,301 | | | | 129,689 | | | | 119,598 | | | | 6 | % | | | 11 | % | | | 517,325 | | | | 550,044 | | | | (6 | )% |
| Adjusted gross income after provision for loan losses | | | 297,884 | | | | 287,665 | | | | 294,941 | | | | 281,555 | | | | 272,648 | | | | 4 | % | | | 9 | % | | | 1,162,045 | | | | 1,150,762 | | | | 1 | % |
| Noninterest expense: | | | | | | | | | | | | | | | | | | | | | | | | | | | | | | | | | | | | | | | | |
| Employee compensation, incentives, and benefits (c) | | | 136,000 | | | | 116,219 | | | | 127,970 | | | | 131,444 | | | | 118,529 | | | | 17 | % | | | 15 | % | | | 511,633 | | | | 478,159 | | | | 7 | % |
| Repurchase and foreclosure provision (d) | | | — | | | | — | | | | — | | | | — | | | | — | | | | NM | | | | NM | | | | — | | | | (4,300 | ) | | | NM | |
| Legal fees (e) | | | 4,601 | | | | 3,626 | | | | 4,509 | | | | 3,551 | | | | 5,633 | | | | 27 | % | | | (18 | )% | | | 16,287 | | | | 20,907 | | | | (22 | )% |
| Professional fees | | | 4,859 | | | | 5,139 | | | | 5,218 | | | | 3,706 | | | | 6,919 | | | | (5 | )% | | | (30 | )% | | | 18,922 | | | | 23,298 | | | | (19 | )% |
| Occupancy (f) | | | 13,853 | | | | 13,282 | | | | 11,764 | | | | 12,218 | | | | 12,077 | | | | 4 | % | | | 15 | % | | | 51,117 | | | | 54,018 | | | | (5 | )% |
| Computer software | | | 11,432 | | | | 11,010 | | | | 11,340 | | | | 10,942 | | | | 10,574 | | | | 4 | % | | | 8 | % | | | 44,724 | | | | 42,931 | | | | 4 | % |
| Contract employment and outsourcing | | | 3,159 | | | | 3,414 | | | | 3,337 | | | | 4,584 | | | | 4,578 | | | | (7 | )% | | | (31 | )% | | | 14,494 | | | | 19,420 | | | | (25 | )% |
| Operations services | | | 9,761 | | | | 10,130 | | | | 10,033 | | | | 9,337 | | | | 8,417 | | | | (4 | )% | | | 16 | % | | | 39,261 | | | | 35,247 | | | | 11 | % |
| Equipment rentals, depreciation, and maintenance | | | 8,568 | | | | 7,093 | | | | 7,983 | | | | 7,220 | | | | 7,523 | | | | 21 | % | | | 14 | % | | | 30,864 | | | | 29,964 | | | | 3 | % |
| FDIC premium expense (g) | | | 5,098 | | | | 4,529 | | | | 4,952 | | | | 3,448 | | | | 2,881 | | | | 13 | % | | | 77 | % | | | 18,027 | | | | 11,464 | | | | 57 | % |
| Advertising and public relations | | | 5,273 | | | | 4,832 | | | | 4,349 | | | | 4,733 | | | | 4,077 | | | | 9 | % | | | 29 | % | | | 19,187 | | | | 18,683 | | | | 3 | % |
| Communications and courier | | | 4,089 | | | | 4,054 | | | | 3,801 | | | | 3,876 | | | | 4,274 | | | | 1 | % | | | (4 | )% | | | 15,820 | | | | 16,074 | | | | (2 | )% |
| Other insurance and taxes | | | 2,874 | | | | 3,283 | | | | 3,455 | | | | 3,329 | | | | 2,722 | | | | (12 | )% | | | 6 | % | | | 12,941 | | | | 12,900 | | | | * | |
| Foreclosed real estate | | | 475 | | | | 431 | | | | 1,329 | | | | (131 | ) | | | 492 | | | | 10 | % | | | (3 | )% | | | 2,104 | | | | 2,503 | | | | (16 | )% |
| Amortization of intangible assets | | | 1,359 | | | | 1,298 | | | | 1,298 | | | | 1,298 | | | | 1,225 | | | | 5 | % | | | 11 | % | | | 5,253 | | | | 4,170 | | | | 26 | % |
| Other (b) | | | 32,339 | | | | 27,096 | | | | 17,056 | | | | 176,666 | | | | 17,388 | | | | 19 | % | | | 86 | % | | | 253,157 | | | | 67,093 | | | | NM | |
| Total noninterest expense | | | 243,740 | | | | 215,436 | | | | 218,394 | | | | 376,221 | | | | 207,309 | | | | 13 | % | | | 18 | % | | | 1,053,791 | | | | 832,531 | | | | 27 | % |
| Income/(loss) before income taxes | | | 54,144 | | | | 72,229 | | | | 76,547 | | | | (94,666 | ) | | | 65,339 | | | | (25 | )% | | | (17 | )% | | | 108,254 | | | | 318,231 | | | | (66 | )% |
| Provision/(benefit) for income taxes | | | 2,715 | | | | 8,897 | | | | 21,590 | | | | (22,261 | ) | | | 13,699 | | | | (69 | )% | | | (80 | )% | | | 10,941 | | | | 84,185 | | | | (87 | )% |
| Net income/(loss) | | | 51,429 | | | | 63,332 | | | | 54,957 | | | | (72,405 | ) | | | 51,640 | | | | (19 | )% | | | * | | | | 97,313 | | | | 234,046 | | | | (58 | )% |
| Net income attributable to noncontrolling interest | | | 2,848 | | | | 2,977 | | | | 2,851 | | | | 2,758 | | | | 2,980 | | | | (4 | )% | | | (4 | )% | | | 11,434 | | | | 11,527 | | | | (1 | )% |
| Net income/(loss) attributable to controlling interest | | | 48,581 | | | | 60,355 | | | | 52,106 | | | | (75,163 | ) | | | 48,660 | | | | (20 | )% | | | * | | | | 85,879 | | | | 222,519 | | | | (61 | )% |
| Preferred stock dividends | | | 1,550 | | | | 1,550 | | | | 1,550 | | | | 1,550 | | | | 1,550 | | | | * | | | | * | | | | 6,200 | | | | 6,200 | | | | * | |
| Net income/(loss) available to common shareholders | | $ | 47,031 | | | $ | 58,805 | | | $ | 50,556 | | | $ | (76,713 | ) | | $ | 47,110 | | | | (20 | )% | | | * | | | $ | 79,679 | | | $ | 216,319 | | | | (63 | )% |
| Common Stock Data | | | | | | | | | | | | | | | | | | | | | | | | | | | | | | | | | | | | | | | | |
| EPS | | $ | 0.20 | | | $ | 0.25 | | | $ | 0.22 | | | $ | (0.33 | ) | | $ | 0.20 | | | | (20 | )% | | | * | | | $ | 0.34 | | | $ | 0.92 | | | | (63 | )% |
| Basic Shares (thousands) (h) | | | 237,983 | | | | 233,111 | | | | 232,800 | | | | 232,816 | | | | 233,693 | | | | 2 | % | | | 2 | % | | | 234,189 | | | | 234,997 | | | | * | |
| Diluted EPS | | $ | 0.20 | | | $ | 0.25 | | | $ | 0.22 | | | $ | (0.33 | ) | | $ | 0.20 | | | | (20 | )% | | | * | | | $ | 0.34 | | | $ | 0.91 | | | | (63 | )% |
| Diluted shares (thousands) (h) | | | 240,072 | | | | 235,058 | | | | 234,669 | | | | 232,816 | | | | 235,448 | | | | 2 | % | | | 2 | % | | | 236,266 | | | | 236,735 | | | | * | |
| Key Ratios & Other | | | | | | | | | | | | | | | | | | | | | | | | | | | | | | | | | | | | | | | | |
| Return on average assets (annualized) (i) | | | 0.78 | % | | | 0.99 | % | | | 0.87 | % | | | (1.15 | )% | | | 0.83 | % | | | | | | | | | | | | | | | | | | | | |
| Return on average common equity (annualized) (i) | | | 8.23 | % | | | 10.83 | % | | | 9.56 | % | | | (14.04 | )% | | | 8.27 | % | | | | | | | | | | | | | | | | | | | | |
| Return on average tangible common equity (annualized) (i) (j) | | | 9.07 | % | | | 11.77 | % | | | 10.41 | % | | | (15.24 | )% | | | 8.92 | % | | | | | | | | | | | | | | | | | | | | |
| Fee income to total revenue (i) | | | 43.97 | % | | | 43.41 | % | | | 43.88 | % | | | 45.21 | % | | | 42.92 | % | | | | | | | | | | | | | | | | | | | | |
| Efficiency ratio (i) | | | 81.94 | % | | | 74.54 | % | | | 73.55 | % | | | NM | | | | 74.40 | % | | | | | | | | | | | | | | | | | | | | |
| Full time equivalent employees (k) | | | 4,260 | | | | 4,202 | | | | 4,212 | | | | 4,226 | | | | 4,250 | | | | | | | | | | | | | | | | | | | | | |
Certain previously reported amounts have been reclassified to agree with current presentation.
NM - Not meaningful
* Amount is less than one percent.
| (a) | 2014 includes a $39.7 million gain on the sales of mortgage loans HFS, an $8.2 million positive fair value adjustment to the held-for-sale portfolio, and the receipt of previously unrecognized servicing fees in conjunction with transfers of servicing during the year. |
| (b) | Refer to the Other Income and Other Expense table on page 7 for additional information. |
| (c) | 3Q15 includes $8.3 million of gains associated with an employee benefit plan amendment. |
| (d) | 2014 includes an expense reversal associated with the settlement of certain repurchase claims. |
| (e) | 2014 includes an $8.5 million expense reversal related to agreements with insurance companies for the recovery of Sentinel legal expenses. |
| (f) | 2014 includes $4.6 million of lease abandonment expense. |
| (g) | 2014 includes the effect of $3.3 million of FDIC premium refunds. |
| (h) | 4Q15 increase related to shares issued in connection with the TrustAtlantic acquisition, partially offset by shares purchased under share repurchase programs; 1Q15 decrease related to shares repurchased under share repurchase programs. |
| (i) | See Glossary of Terms for definitions of Key Ratios. |
| (j) | Refer to the Non-GAAP to GAAP reconciliation on page 22 of this financial supplement. |
| (k) | 4Q15 increase driven by TrustAtlantic acquisition. |
FHN OTHER INCOME AND OTHER EXPENSE
Quarterly/Annually, Unaudited
| | | | | | | | | | | | | | | | | | | | | | | | | | | | | | | |
| | | | | | | | | | | | | | | | | | 4Q15 Changes vs. | | Twelve months ended | | 2015 vs. |
| (Thousands) | | 4Q15 | | | 3Q15 | | | 2Q15 | | | 1Q15 | | | 4Q14 | | | 3Q15 | | | 4Q14 | | | 2015 | | | 2014 | | | 2014 |
| | | | | | | | | | | | | | | | | | | | | | | | | | | | | | | | | | | | | | | | | |
| Other Income | | | | | | | | | | | | | | | | | | | | | | | | | | | | | | | | | | | | | | | | |
| ATM and interchange fees | | $ | 3,133 | | | $ | 2,998 | | | $ | 3,025 | | | $ | 2,761 | | | $ | 2,961 | | | | 5 | % | | | 6 | % | | $ | 11,917 | | | $ | 10,943 | | | | 9 | % |
| Electronic banking fees | | | 1,474 | | | | 1,479 | | | | 1,459 | | | | 1,428 | | | | 1,561 | | | | * | | | | (6 | )% | | | 5,840 | | | | 6,190 | | | | (6 | )% |
| Letter of credit fees | | | 988 | | | | 978 | | | | 1,532 | | | | 1,123 | | | | 1,111 | | | | 1 | % | | | (11 | )% | | | 4,621 | | | | 4,864 | | | | (5 | )% |
| Deferred compensation (a) | | | (58 | ) | | | (2,309 | ) | | | (35 | ) | | | 1,033 | | | | 242 | | | | 97 | % | | | NM | | | | (1,369 | ) | | | 2,042 | | | | NM | |
| Gain/(loss) on extinguishment of debt (b) | | | (1 | ) | | | 5,794 | | | | — | | | | — | | | | 184 | | | | NM | | | | NM | | | | 5,793 | | | | (4,166 | ) | | | NM | |
| Other (c) | | | 2,725 | | | | 3,550 | | | | 6,421 | | | | 3,125 | | | | 2,929 | | | | (23 | )% | | | (7 | )% | | | 15,821 | | | | 12,390 | | | | 28 | % |
| Total | | $ | 8,261 | | | $ | 12,490 | | | $ | 12,402 | | | $ | 9,470 | | | $ | 8,988 | | | | (34 | )% | | | (8 | )% | | $ | 42,623 | | | $ | 32,263 | | | | 32 | % |
| | | | | | | | | | | | | | | | | | | | | | | | | | | | | | | | | | | | | | | | | |
| Other Expense | | | | | | | | | | | | | | | | | | | | | | | | | | | | | | | | | | | | | | | | |
| Litigation and regulatory matters (d) | | $ | 14,185 | | | $ | 10,922 | | | $ | — | | | $ | 162,500 | | | $ | — | | | | 30 | % | | | NM | | | $ | 187,607 | | | $ | (2,720 | ) | | | NM | |
| Tax credit investments (e) | | | 3,199 | | | | 439 | | | | 549 | | | | 395 | | | | 589 | | | | NM | | | | NM | | | | 4,582 | | | | 2,087 | | | | NM | |
| Travel and entertainment | | | 2,893 | | | | 2,451 | | | | 2,632 | | | | 1,614 | | | | 2,462 | | | | 18 | % | | | 18 | % | | | 9,590 | | | | 9,095 | | | | 5 | % |
| Employee training and dues | | | 1,537 | | | | 1,272 | | | | 1,449 | | | | 1,132 | | | | 1,258 | | | | 21 | % | | | 22 | % | | | 5,390 | | | | 4,518 | | | | 19 | % |
| Customer relations | | | 1,086 | | | | 1,477 | | | | 1,505 | | | | 1,314 | | | | 1,397 | | | | (26 | )% | | | (22 | )% | | | 5,382 | | | | 5,726 | | | | (6 | )% |
| Miscellaneous loan costs | | | 835 | | | | 726 | | | | 734 | | | | 361 | | | | 540 | | | | 15 | % | | | 55 | % | | | 2,656 | | | | 2,690 | | | | (1 | )% |
| Supplies | | | 1,046 | | | | 974 | | | | 880 | | | | 927 | | | | 1,046 | | | | 7 | % | | | * | | | | 3,827 | | | | 3,745 | | | | 2 | % |
| Other (f) | | | 7,558 | | | | 8,835 | | | | 9,307 | | | | 8,423 | | | | 10,096 | | | | (14 | )% | | | (25 | )% | | | 34,123 | | | | 41,952 | | | | (19 | )% |
| Total | | $ | 32,339 | | | $ | 27,096 | | | $ | 17,056 | | | $ | 176,666 | | | $ | 17,388 | | | | 19 | % | | | 86 | % | | $ | 253,157 | | | $ | 67,093 | | | | NM | |
Certain previously reported amounts have been reclassified to agree with current presentation.
NM - Not meaningful
* Amount is less than one percent
| (a) | Amounts driven by market conditions and are mirrored by changes in deferred compensation expense which is included in employee compensation expense. |
| (b) | 3Q15 gain related to the extinguishment of $206 million of junior subordinated notes underlying $200 million of trust preferred debt; 2014 loss associated with the collapse of two HELOC securitization trusts. |
| (c) | 2Q15 includes $2.9 million of pre-tax gains on the sale of properties. |
| (d) | 1Q15 loss accruals relate to the settlement of potential claims related to FHN’s underwriting and origination of FHA-insured mortgage loans; 2014 includes $113.6 million of expense reversals associated with agreements with insurance companies for the recovery of expenses FHN incurred related to litigation losses in previous periods, which more than offset $110.9 million of loss accruals related to legal matters. |
| (e) | 4Q15 includes $2.8 million of impairment related to a tax credit investment accounted for under the equity method. |
| (f) | 2014 includes $5.9 million of negative valuation adjustments associated with derivatives related to prior sales of Visa Class B shares. |
FHN CONSOLIDATED PERIOD-END BALANCE SHEET
Quarterly, Unaudited
| | | | | | | | | | | | | | | | | | 4Q15 Changes vs. |
| (Thousands) | | 4Q15 | | | 3Q15 | | | 2Q15 | | | 1Q15 | | | 4Q14 | | | 3Q15 | | | 4Q14 | |
| | | | | | | | | | | | | | | | | | | | | | | | | | | | | |
| Assets: | | | | | | | | | | | | | | | | | | | | | | | | | | | | |
| Investment securities | | $ | 3,944,166 | | | $ | 3,677,954 | | | $ | 3,653,166 | | | $ | 3,676,630 | | | $ | 3,560,905 | | | | 7 | % | | | 11 | % |
| Loans held-for-sale | | | 126,342 | | | | 124,308 | | | | 127,196 | | | | 133,958 | | | | 141,285 | | | | 2 | % | | | (11 | )% |
| Loans, net of unearned income | | | 17,686,502 | | | | 16,725,492 | | | | 16,936,772 | | | | 16,732,123 | | | | 16,230,166 | | | | 6 | % | | | 9 | % |
| Federal funds sold | | | 114,479 | | | | 64,438 | | | | 77,039 | | | | 43,052 | | | | 63,080 | | | | 78 | % | | | 81 | % |
| Securities purchased under agreements to resell | | | 615,773 | | | | 793,098 | | | | 816,991 | | | | 831,541 | | | | 659,154 | | | | (22 | )% | | | (7 | )% |
| Interest-bearing cash (a) | | | 602,836 | | | | 596,689 | | | | 344,944 | | | | 438,633 | | | | 1,621,967 | | | | 1 | % | | | (63 | )% |
| Trading securities | | | 881,450 | | | | 1,229,180 | | | | 1,133,490 | | | | 1,532,463 | | | | 1,194,391 | | | | (28 | )% | | | (26 | )% |
| Total earning assets | | | 23,971,548 | | | | 23,211,159 | | | | 23,089,598 | | | | 23,388,400 | | | | 23,470,948 | | | | 3 | % | | | 2 | % |
| Cash and due from banks | | | 300,811 | | | | 256,342 | | | | 274,256 | | | | 282,800 | | | | 349,171 | | | | 17 | % | | | (14 | )% |
| Fixed income receivables (b) | | | 63,660 | | | | 83,547 | | | | 91,069 | | | | 190,662 | | | | 42,488 | | | | (24 | )% | | | 50 | % |
| Goodwill (c) | | | 191,307 | | | | 145,932 | | | | 145,932 | | | | 145,932 | | | | 145,932 | | | | 31 | % | | | 31 | % |
| Other intangible assets, net (c) | | | 26,215 | | | | 25,624 | | | | 26,922 | | | | 28,220 | | | | 29,518 | | | | 2 | % | | | (11 | )% |
| Premises and equipment, net (d) | | | 275,619 | | | | 269,332 | | | | 269,507 | | | | 301,069 | | | | 302,996 | | | | 2 | % | | | (9 | )% |
| Real estate acquired by foreclosure | | | 33,063 | | | | 35,332 | | | | 40,268 | | | | 39,776 | | | | 39,922 | | | | (6 | )% | | | (17 | )% |
| Allowance for loan losses | | | (210,242 | ) | | | (210,814 | ) | | | (221,351 | ) | | | (228,328 | ) | | | (232,448 | ) | | | * | | | | (10 | )% |
| Derivative assets | | | 104,365 | | | | 152,548 | | | | 115,230 | | | | 148,153 | | | | 134,088 | | | | (32 | )% | | | (22 | )% |
| Other assets | | | 1,438,790 | | | | 1,418,317 | | | | 1,408,336 | | | | 1,419,204 | | | | 1,385,572 | | | | 1 | % | | | 4 | % |
| Total assets | | $ | 26,195,136 | | | $ | 25,387,319 | | | $ | 25,239,767 | | | $ | 25,715,888 | | | $ | 25,668,187 | | | | 3 | % | | | 2 | % |
| | | | | | | | | | | | | | | | | | | | | | | | | | | | | |
| Liabilities and Equity: | | | | | | | | | | | | | | | | | | | | | | | | | | | | |
| Deposits: | | | | | | | | | | | | | | | | | | | | | | | | | | | | |
| Savings | | $ | 7,811,191 | | | $ | 7,554,338 | | | $ | 7,462,642 | | | $ | 7,428,000 | | | $ | 7,455,354 | | | | 3 | % | | | 5 | % |
| Other interest-bearing deposits | | | 5,388,526 | | | | 4,885,601 | | | | 4,675,742 | | | | 4,939,240 | | | | 4,140,991 | | | | 10 | % | | | 30 | % |
| Time deposits | | | 788,487 | | | | 743,158 | | | | 769,132 | | | | 792,914 | | | | 831,666 | | | | 6 | % | | | (5 | )% |
| Total interest-bearing core deposits | | | 13,988,204 | | | | 13,183,097 | | | | 12,907,516 | | | | 13,160,154 | | | | 12,428,011 | | | | 6 | % | | | 13 | % |
| Noninterest-bearing deposits | | | 5,535,885 | | | | 5,391,385 | | | | 5,366,936 | | | | 5,060,897 | | | | 5,195,656 | | | | 3 | % | | | 7 | % |
| Total core deposits (e) | | | 19,524,089 | | | | 18,574,482 | | | | 18,274,452 | | | | 18,221,051 | | | | 17,623,667 | | | | 5 | % | | | 11 | % |
| Certificates of deposit $100,000 and more | | | 443,389 | | | | 290,738 | | | | 400,021 | | | | 417,503 | | | | 445,272 | | | | 53 | % | | | * | |
| Total deposits | | | 19,967,478 | | | | 18,865,220 | | | | 18,674,473 | | | | 18,638,554 | | | | 18,068,939 | | | | 6 | % | | | 11 | % |
| Federal funds purchased | | | 464,166 | | | | 520,992 | | | | 556,862 | | | | 703,352 | | | | 1,037,052 | | | | (11 | )% | | | (55 | )% |
| Securities sold under agreements to repurchase | | | 338,133 | | | | 332,329 | | | | 311,760 | | | | 309,297 | | | | 562,214 | | | | 2 | % | | | (40 | )% |
| Trading liabilities | | | 566,019 | | | | 788,563 | | | | 732,564 | | | | 813,141 | | | | 594,314 | | | | (28 | )% | | | (5 | )% |
| Other short-term borrowings | | | 137,861 | | | | 99,887 | | | | 150,350 | | | | 158,745 | | | | 157,218 | | | | 38 | % | | | (12 | )% |
| Term borrowings (f) | | | 1,315,176 | | | | 1,341,186 | | | | 1,557,647 | | | | 1,573,215 | | | | 1,880,105 | | | | (2 | )% | | | (30 | )% |
| Fixed income payables (b) | | | 23,072 | | | | 95,346 | | | | 54,301 | | | | 91,176 | | | | 18,157 | | | | (76 | )% | | | 27 | % |
| Derivative liabilities | | | 108,339 | | | | 140,965 | | | | 109,815 | | | | 133,273 | | | | 119,239 | | | | (23 | )% | | | (9 | )% |
| Other liabilities | | | 635,306 | | | | 622,586 | | | | 574,090 | | | | 795,878 | | | | 649,359 | | | | 2 | % | | | (2 | )% |
| Total liabilities | | | 23,555,550 | | | | 22,807,074 | | | | 22,721,862 | | | | 23,216,631 | | | | 23,086,597 | | | | 3 | % | | | 2 | % |
| Equity: | | | | | | | | | | | | | | | | | | | | | | | | | | | | |
| Common stock (g) | | | 149,117 | | | | 146,398 | | | | 146,263 | | | | 145,937 | | | | 146,387 | | | | 2 | % | | | 2 | % |
| Capital surplus (g) | | | 1,439,303 | | | | 1,377,731 | | | | 1,371,712 | | | | 1,370,711 | | | | 1,380,809 | | | | 4 | % | | | 4 | % |
| Undivided profits | | | 874,303 | | | | 841,737 | | | | 797,123 | | | | 760,713 | | | | 851,585 | | | | 4 | % | | | 3 | % |
| Accumulated other comprehensive loss, net | | | (214,192 | ) | | | (176,676 | ) | | | (188,248 | ) | | | (169,159 | ) | | | (188,246 | ) | | | 21 | % | | | 14 | % |
| Preferred stock | | | 95,624 | | | | 95,624 | | | | 95,624 | | | | 95,624 | | | | 95,624 | | | | * | | | | * | |
| Noncontrolling interest (h) | | | 295,431 | | | | 295,431 | | | | 295,431 | | | | 295,431 | | | | 295,431 | | | | * | | | | * | |
| Total equity | | | 2,639,586 | | | | 2,580,245 | | | | 2,517,905 | | | | 2,499,257 | | | | 2,581,590 | | | | 2 | % | | | 2 | % |
| Total liabilities and equity | | $ | 26,195,136 | | | $ | 25,387,319 | | | $ | 25,239,767 | | | $ | 25,715,888 | | | $ | 25,668,187 | | | | 3 | % | | | 2 | % |
Certain previously reported amounts have been reclassified to agree with current presentation.
* Amount is less than one percent.
| (a) | Includes excess balances held at Fed. 4Q14 balance driven by inflow of customer deposits and proceeds from the issuance of senior notes. |
| (b) | Period-end balances fluctuate based on the level of pending unsettled trades. |
| (c) | 4Q15 increase related to TrustAtlantic acquisition. |
| (d) | 2Q15 decrease related to sale of property. |
| (e) | 4Q15 average core deposits were $19.0 billion. |
| (f) | In 3Q15 FHN called $206 million of junior subordinated notes underlying $200 million of trust preferred debt. In 1Q15 $304 million of FTBNA subordinated notes matured. |
| (g) | 4Q15 increase related to shares issued in connection with the TrustAtlantic acquisition, partially offset by shares purchased under share repurchase programs; 1Q15 decrease related to shares repurchased under share repurchase programs. |
| (h) | Consists of preferred stock of subsidiaries. |
FHN CONSOLIDATED AVERAGE BALANCE SHEET
Quarterly/Annually, Unaudited
| | | | | | | | | | | | | | | | | | 4Q15 Changes vs. | | Twelve months ended | | 2015 vs. |
| (Thousands) | | 4Q15 | | | 3Q15 | | | 2Q15 | | | 1Q15 | | | 4Q14 | | | 3Q15 | | | 4Q14 | | | 2015 | | | 2014 | | | 2014 |
| | | | | | | | | | | | | | | | | | | | | | | | | | | | | | | | | | | | | | | | | |
| Assets: | | | | | | | | | | | | | | | | | | | | | | | | | | | | | | | | | | | | | | | | |
| Earning assets: | | | | | | | | | | | | | | | | | | | | | | | | | | | | | | | | | | | | | | | | |
| Loans, net of unearned income: | | | | | | | | | | | | | | | | | | | | | | | | | | | | | | | | | | | | | | | | |
| Commercial, financial, and industrial (C&I) | | $ | 9,720,115 | | | $ | 9,539,650 | | | $ | 9,675,107 | | | $ | 8,965,657 | | | $ | 8,584,065 | | | | 2 | % | | | 13 | % | | $ | 9,477,376 | | | $ | 8,156,750 | | | | 16 | % |
| Commercial real estate | | | 1,612,730 | | | | 1,425,528 | | | | 1,371,207 | | | | 1,290,246 | | | | 1,287,816 | | | | 13 | % | | | 25 | % | | | 1,425,813 | | | | 1,223,487 | | | | 17 | % |
| Consumer real estate | | | 4,798,067 | | | | 4,838,984 | | | | 4,893,285 | | | | 4,988,532 | | | | 5,087,104 | | | | (1 | )% | | | (6 | )% | | | 4,879,083 | | | | 5,198,304 | | | | (6 | )% |
| Permanent mortgage | | | 455,299 | | | | 475,684 | | | | 500,093 | | | | 526,616 | | | | 552,065 | | | | (4 | )% | | | (18 | )% | | | 489,190 | | | | 594,450 | | | | (18 | )% |
| Credit card and other | | | 356,948 | | | | 353,148 | | | | 350,247 | | | | 351,503 | | | | 357,321 | | | | 1 | % | | | * | | | | 352,977 | | | | 347,981 | | | | 1 | % |
| Total loans, net of unearned income (a) | | | 16,943,159 | | | | 16,632,994 | | | | 16,789,939 | | | | 16,122,554 | | | | 15,868,371 | | | | 2 | % | | | 7 | % | | | 16,624,439 | | | | 15,520,972 | | | | 7 | % |
| Loans held-for-sale (b) | | | 122,046 | | | | 126,072 | | | | 129,519 | | | | 138,373 | | | | 144,061 | | | | (3 | )% | | | (15 | )% | | | 128,950 | | | | 296,079 | | | | (56 | )% |
| Investment securities: | | | | | | | | | | | | | | | | | | | | | | | | | | | | | | | | | | | | | | | | |
| U.S. treasuries | | | 100 | | | | 100 | | | | 100 | | | | 100 | | | | 100 | | | | * | | | | * | | | | 100 | | | | 27,057 | | | | NM | |
| U.S. government agencies | | | 3,619,334 | | | | 3,482,658 | | | | 3,505,033 | | | | 3,391,297 | | | | 3,363,053 | | | | 4 | % | | | 8 | % | | | 3,500,159 | | | | 3,315,975 | | | | 6 | % |
| States and municipalities | | | 10,403 | | | | 13,673 | | | | 14,074 | | | | 14,410 | | | | 14,493 | | | | (24 | )% | | | (28 | )% | | | 13,131 | | | | 17,688 | | | | (26 | )% |
| Other | | | 188,813 | | | | 181,817 | | | | 181,749 | | | | 181,858 | | | | 181,806 | | | | 4 | % | | | 4 | % | | | 183,573 | | | | 191,918 | | | | (4 | )% |
| Total investment securities | | | 3,818,650 | | | | 3,678,248 | | | | 3,700,956 | | | | 3,587,665 | | | | 3,559,452 | | | | 4 | % | | | 7 | % | | | 3,696,963 | | | | 3,552,638 | | | | 4 | % |
| Trading securities | | | 1,307,102 | | | | 1,137,877 | | | | 1,363,165 | | | | 1,371,514 | | | | 1,182,762 | | | | 15 | % | | | 11 | % | | | 1,294,308 | | | | 1,117,560 | | | | 16 | % |
| Other earning assets: | | | | | | | | | | | | | | | | | | | | | | | | | | | | | | | | | | | | | | | | |
| Federal funds sold | | | 19,832 | | | | 35,191 | | | | 31,765 | | | | 23,710 | | | | 26,543 | | | | (44 | )% | | | (25 | )% | | | 27,635 | | | | 28,767 | | | | (4 | )% |
| Securities purchased under agreements to resell | | | 804,000 | | | | 762,744 | | | | 760,338 | | | | 777,989 | | | | 672,764 | | | | 5 | % | | | 20 | % | | | 776,302 | | | | 650,980 | | | | 19 | % |
| Interest-bearing cash (c) | | | 913,432 | | | | 806,648 | | | | 465,596 | | | | 1,451,826 | | | | 1,011,983 | | | | 13 | % | | | (10 | )% | | | 907,619 | | | | 658,189 | | | | 38 | % |
| Total other earning assets | | | 1,737,264 | | | | 1,604,583 | | | | 1,257,699 | | | | 2,253,525 | | | | 1,711,290 | | | | 8 | % | | | 2 | % | | | 1,711,556 | | | | 1,337,936 | | | | 28 | % |
| Total earning assets | | | 23,928,221 | | | | 23,179,774 | | | | 23,241,278 | | | | 23,473,631 | | | | 22,465,936 | | | | 3 | % | | | 7 | % | | | 23,456,216 | | | | 21,825,185 | | | | 7 | % |
| Allowance for loan losses | | | (208,804 | ) | | | (216,833 | ) | | | (227,765 | ) | | | (232,655 | ) | | | (238,850 | ) | | | (4 | )% | | | (13 | )% | | | (221,436 | ) | | | (243,909 | ) | | | (9 | )% |
| Cash and due from banks | | | 320,147 | | | | 308,409 | | | | 315,730 | | | | 342,512 | | | | 341,338 | | | | 4 | % | | | (6 | )% | | | 321,602 | | | | 327,047 | | | | (2 | )% |
| Fixed income receivables | | | 91,510 | | | | 59,470 | | | | 51,913 | | | | 48,937 | | | | 63,384 | | | | 54 | % | | | 44 | % | | | 63,064 | | | | 55,236 | | | | 14 | % |
| Premises and equipment, net (d) | | | 273,365 | | | | 268,061 | | | | 292,874 | | | | 301,989 | | | | 301,512 | | | | 2 | % | | | (9 | )% | | | 283,950 | | | | 300,023 | | | | (5 | )% |
| Derivative assets | | | 131,479 | | | | 113,927 | | | | 138,935 | | | | 139,086 | | | | 141,146 | | | | 15 | % | | | (7 | )% | | | 130,790 | | | | 160,724 | | | | (19 | )% |
| Other assets | | | 1,641,431 | | | | 1,601,953 | | | | 1,601,083 | | | | 1,571,104 | | | | 1,538,791 | | | | 2 | % | | | 7 | % | | | 1,604,079 | | | | 1,570,530 | | | | 2 | % |
| Total assets | | $ | 26,177,349 | | | $ | 25,314,761 | | | $ | 25,414,048 | | | $ | 25,644,604 | | | $ | 24,613,257 | | | | 3 | % | | | 6 | % | | $ | 25,638,265 | | | $ | 23,994,836 | | | | 7 | % |
| | | | | | | | | | | | | | | | | | | | | | | | | | | | | | | | | | | | | | | | | |
| Liabilities and equity: | | | | | | | | | | | | | | | | | | | | | | | | | | | | | | | | | | | | | | | | |
| Interest-bearing liabilities: | | | | | | | | | | | | | | | | | | | | | | | | | | | | | | | | | | | | | | | | |
| Interest-bearing deposits: | | | | | | | | | | | | | | | | | | | | | | | | | | | | | | | | | | | | | | | | |
| Savings | | $ | 7,589,314 | | | $ | 7,578,288 | | | $ | 7,437,016 | | | $ | 7,377,045 | | | $ | 6,929,750 | | | | * | | | | 10 | % | | $ | 7,496,225 | | | $ | 6,592,029 | | | | 14 | % |
| Other interest-bearing deposits | | | 4,956,451 | | | | 4,806,813 | | | | 4,741,920 | | | | 4,483,907 | | | | 3,895,022 | | | | 3 | % | | | 27 | % | | | 4,748,731 | | | | 3,800,646 | | | | 25 | % |
| Time deposits | | | 798,661 | | | | 756,397 | | | | 780,355 | | | | 812,749 | | | | 830,412 | | | | 6 | % | | | (4 | )% | | | 786,918 | | | | 849,352 | | | | (7 | )% |
| Total interest-bearing core deposits | | | 13,344,426 | | | | 13,141,498 | | | | 12,959,291 | | | | 12,673,701 | | | | 11,655,184 | | | | 2 | % | | | 14 | % | | | 13,031,874 | | | | 11,242,027 | | | | 16 | % |
| Certificates of deposit $100,000 and more | | | 389,682 | | | | 354,376 | | | | 405,696 | | | | 423,480 | | | | 451,669 | | | | 10 | % | | | (14 | )% | | | 393,109 | | | | 493,371 | | | | (20 | )% |
| Federal funds purchased | | | 569,603 | | | | 529,156 | | | | 649,464 | | | | 1,079,531 | | | | 1,137,909 | | | | 8 | % | | | (50 | )% | | | 705,054 | | | | 1,101,910 | | | | (36 | )% |
| Securities sold under agreements to repurchase | | | 337,893 | | | | 330,114 | | | | 339,874 | | | | 474,448 | | | | 471,712 | | | | 2 | % | | | (28 | )% | | | 370,097 | | | | 447,801 | | | | (17 | )% |
| Trading liabilities | | | 768,721 | | | | 722,031 | | | | 713,133 | | | | 728,553 | | | | 634,375 | | | | 6 | % | | | 21 | % | | | 733,189 | | | | 633,867 | | | | 16 | % |
| Other short-term borrowings | | | 128,740 | | | | 138,698 | | | | 227,650 | | | | 165,408 | | | | 302,353 | | | | (7 | )% | | | (57 | )% | | | 164,951 | | | | 531,984 | | | | (69 | )% |
| Term borrowings (e) | | | 1,585,388 | | | | 1,461,173 | | | | 1,570,953 | | | | 1,621,983 | | | | 1,664,924 | | | | 9 | % | | | (5 | )% | | | 1,559,503 | | | | 1,592,855 | | | | (2 | )% |
| Total interest-bearing liabilities | | | 17,124,453 | | | | 16,677,046 | | | | 16,866,061 | | | | 17,167,104 | | | | 16,318,126 | | | | 3 | % | | | 5 | % | | | 16,957,777 | | | | 16,043,815 | | | | 6 | % |
| Noninterest-bearing deposits | | | 5,627,935 | | | | 5,392,294 | | | | 5,189,939 | | | | 5,098,361 | | | | 4,974,748 | | | | 4 | % | | | 13 | % | | | 5,328,762 | | | | 4,666,268 | | | | 14 | % |
| Fixed income payables | | | 52,034 | | | | 26,220 | | | | 27,608 | | | | 34,800 | | | | 40,273 | | | | 98 | % | | | 29 | % | | | 35,188 | | | | 36,139 | | | | (3 | )% |
| Derivative liabilities | | | 120,728 | | | | 105,644 | | | | 123,397 | | | | 124,305 | | | | 124,530 | | | | 14 | % | | | (3 | )% | | | 118,473 | | | | 136,509 | | | | (13 | )% |
| Other liabilities | | | 592,624 | | | | 568,013 | | | | 695,114 | | | | 612,513 | | | | 503,851 | | | | 4 | % | | | 18 | % | | | 616,878 | | | | 520,138 | | | | 19 | % |
| Total liabilities | | | 23,517,774 | | | | 22,769,217 | | | | 22,902,119 | | | | 23,037,083 | | | | 21,961,528 | | | | 3 | % | | | 7 | % | | | 23,057,078 | | | | 21,402,869 | | | | 8 | % |
| Equity: | | | | | | | | | | | | | | | | | | | | | | | | | | | | | | | | | | | | | | | | |
| Common stock (f) | | | 149,401 | | | | 146,324 | | | | 146,146 | | | | 146,225 | | | | 146,789 | | | | 2 | % | | | 2 | % | | | 147,031 | | | | 147,609 | | | | * | |
| Capital surplus (f) | | | 1,443,988 | | | | 1,374,195 | | | | 1,370,653 | | | | 1,377,178 | | | | 1,387,116 | | | | 5 | % | | | 4 | % | | | 1,391,639 | | | | 1,407,482 | | | | (1 | )% |
| Undivided profits | | | 860,778 | | | | 818,909 | | | | 775,881 | | | | 868,605 | | | | 846,656 | | | | 5 | % | | | 2 | % | | | 830,989 | | | | 773,752 | | | | 7 | % |
| Accumulated other comprehensive loss, net | | | (185,647 | ) | | | (184,939 | ) | | | (171,806 | ) | | | (175,542 | ) | | | (119,887 | ) | | | * | | | | 55 | % | | | (179,527 | ) | | | (127,931 | ) | | | 40 | % |
| Preferred stock | | | 95,624 | | | | 95,624 | | | | 95,624 | | | | 95,624 | | | | 95,624 | | | | * | | | | * | | | | 95,624 | | | | 95,624 | | | | * | |
| Noncontrolling interest (g) | | | 295,431 | | | | 295,431 | | | | 295,431 | | | | 295,431 | | | | 295,431 | | | | * | | | | * | | | | 295,431 | | | | 295,431 | | | | * | |
| Total equity | | | 2,659,575 | | | | 2,545,544 | | | | 2,511,929 | | | | 2,607,521 | | | | 2,651,729 | | | | 4 | % | | | * | | | | 2,581,187 | | | | 2,591,967 | | | | * | |
| Total liabilities and equity | | $ | 26,177,349 | | | $ | 25,314,761 | | | $ | 25,414,048 | | | $ | 25,644,604 | | | $ | 24,613,257 | | | | 3 | % | | | 6 | % | | $ | 25,638,265 | | | $ | 23,994,836 | | | | 7 | % |
NM - Not meaningful
* Amount is less than one percent.
| (a) | Includes loans on nonaccrual status. |
| (b) | 2015 decline reflects the result of the average impact of the sale of mortgage loans HFS in 3Q14. |
| (c) | Includes excess balances held at Fed. 1Q15 and 4Q14 driven by inflow of customer deposits and proceeds from the issuance of senior notes in fourth quarter. |
| (d) | 2Q15 and 3Q15 decreases related to sale of property in second quarter. |
| (e) | In 3Q15 FHN called $206 million of junior subordinated notes underlying $200 million of trust preferred debt. In 1Q15 $304 million of FTBNA subordinated notes matured. |
| (f) | 4Q15 increase related to shares issued in connection with the TrustAtlantic acquisition, partially offset by shares purchased under share repurchase programs; 2Q15 and 1Q15 decrease related to shares repurchased under share repurchase programs. |
| (g) | Consists of preferred stock of subsidiaries. |
FHN CONSOLIDATED NET INTEREST INCOME (a)
Quarterly, Unaudited
| | | | | | | | | | | | | | | | | | 4Q15 Changes vs. |
| (Thousands) | | 4Q15 | | | 3Q15 | | | 2Q15 | | | 1Q15 | | | 4Q14 | | | 3Q15 | | | 4Q14 | |
| | | | | | | | | | | | | | | | | | | | | | | | | | | | | |
| Interest Income: | | | | | | | | | | | | | | | | | | | | | | | | | | | | |
| Loans, net of unearned income (b) | | $ | 154,959 | | | $ | 152,795 | | | $ | 155,565 | | | $ | 146,192 | | | $ | 148,078 | | | | 1 | % | | | 5 | % |
| Loans held-for-sale | | | 1,305 | | | | 1,311 | | | | 1,350 | | | | 1,491 | | | | 1,483 | | | | * | | | | (12 | )% |
| Investment securities: | | | | | | | | | | | | | | | | | | | | | | | | | | | | |
| U.S. government agencies | | | 22,349 | | | | 21,366 | | | | 21,432 | | | | 20,955 | | | | 21,317 | | | | 5 | % | | | 5 | % |
| States and municipalities | | | 148 | | | | 97 | | | | 97 | | | | 125 | | | | 159 | | | | 53 | % | | | (7 | )% |
| Other | | | 1,906 | | | | 1,864 | | | | 1,853 | | | | 1,876 | | | | 1,875 | | | | 2 | % | | | 2 | % |
| Total investment securities | | | 24,403 | | | | 23,327 | | | | 23,382 | | | | 22,956 | | | | 23,351 | | | | 5 | % | | | 5 | % |
| Trading securities | | | 9,360 | | | | 8,476 | | | | 9,289 | | | | 9,281 | | | | 8,701 | | | | 10 | % | | | 8 | % |
| Other earning assets: | | | | | | | | | | | | | | | | | | | | | | | | | | | | |
| Federal funds sold | | | 56 | | | | 88 | | | | 79 | | | | 57 | | | | 69 | | | | (36 | )% | | | (19 | )% |
| Securities purchased under agreements to resell (c) | | | (277 | ) | | | (112 | ) | | | (254 | ) | | | (252 | ) | | | (217 | ) | | | NM | | | | (28 | )% |
| Interest-bearing cash | | | 636 | | | | 490 | | | | 267 | | | | 874 | | | | 611 | | | | 30 | % | | | 4 | % |
| Total other earning assets | | | 415 | | | | 466 | | | | 92 | | | | 679 | | | | 463 | | | | (11 | )% | | | (10 | )% |
| Interest income | | $ | 190,442 | | | $ | 186,375 | | | $ | 189,678 | | | $ | 180,599 | | | $ | 182,076 | | | | 2 | % | | | 5 | % |
| | | | | | | | | | | | | | | | | | | | | | | | | | | | | |
| Interest Expense: | | | | | | | | | | | | | | | | | | | | | | | | | | | | |
| Interest-bearing deposits: | | | | | | | | | | | | | | | | | | | | | | | | | | | | |
| Savings | | $ | 2,930 | | | $ | 2,785 | | | $ | 2,970 | | | $ | 3,307 | | | $ | 3,087 | | | | 5 | % | | | (5 | )% |
| Other interest-bearing deposits | | | 1,312 | | | | 1,118 | | | | 1,104 | | | | 957 | | | | 760 | | | | 17 | % | | | 73 | % |
| Time deposits | | | 1,200 | | | | 1,230 | | | | 1,324 | | | | 1,432 | | | | 1,742 | | | | (2 | )% | | | (31 | )% |
| Total interest-bearing core deposits | | | 5,442 | | | | 5,133 | | | | 5,398 | | | | 5,696 | | | | 5,589 | | | | 6 | % | | | (3 | )% |
| Certificates of deposit $100,000 and more | | | 1,013 | | | �� | 756 | | | | 830 | | | | 882 | | | | 513 | | | | 34 | % | | | 97 | % |
| Federal funds purchased | | | 428 | | | | 338 | | | | 408 | | | | 673 | | | | 729 | | | | 27 | % | | | (41 | )% |
| Securities sold under agreements to repurchase | | | 46 | | | | 32 | | | | 42 | | | | 95 | | | | 83 | | | | 44 | % | | | (45 | )% |
| Trading liabilities | | | 4,034 | | | | 4,258 | | | | 3,770 | | | | 3,914 | | | | 3,950 | | | | (5 | )% | | | 2 | % |
| Other short-term borrowings | | | 262 | | | | 294 | | | | 276 | | | | 278 | | | | 388 | | | | (11 | )% | | | (32 | )% |
| Term borrowings | | | 9,743 | | | | 9,314 | | | | 9,666 | | | | 9,664 | | | | 9,146 | | | | 5 | % | | | 7 | % |
| Interest expense | | | 20,968 | | | | 20,125 | | | | 20,390 | | | | 21,202 | | | | 20,398 | | | | 4 | % | | | 3 | % |
| Net interest income - tax equivalent basis | | | 169,474 | | | | 166,250 | | | | 169,288 | | | | 159,397 | | | | 161,678 | | | | 2 | % | | | 5 | % |
| Fully taxable equivalent adjustment | | | (2,822 | ) | | | (2,688 | ) | | | (2,648 | ) | | | (2,531 | ) | | | (2,628 | ) | | | (5 | )% | | | (7 | )% |
| Net interest income | | $ | 166,652 | | | $ | 163,562 | | | $ | 166,640 | | | $ | 156,866 | | | $ | 159,050 | | | | 2 | % | | | 5 | % |
NM - Not meaningful
* Amount is less than one percent.
| (a) | Net interest income adjusted to a fully taxable equivalent (“FTE”) basis assuming a statutory federal income tax of 35 percent and, where applicable, state income taxes. |
| (b) | Includes interest on loans in nonaccrual status. |
| (c) | Driven by negative market rates on reverse repurchase agreements. |
FHN CONSOLIDATED AVERAGE BALANCE SHEET: YIELDS AND RATES
Quarterly, Unaudited
| | | | | | | | | | | | | | | | | | | | | |
| | | | 4Q15 | | | | 3Q15 | | | | 2Q15 | | | | 1Q15 | | | | 4Q14 | |
| | | | | | | | | | | | | | | | | | | | | |
| Assets: | | | | | | | | | | | | | | | | | | | | |
| Earning assets (a): | | | | | | | | | | | | | | | | | | | | |
| Loans, net of unearned income (b): | | | | | | | | | | | | | | | | | | | | |
| Commercial loans | | | 3.46 | % | | | 3.50 | % | | | 3.60 | % | | | 3.50 | % | | | 3.55 | % |
| Retail loans | | | 3.98 | | | | 3.94 | | | | 3.94 | | | | 3.96 | | | | 3.97 | |
| Total loans, net of unearned income (c) | | | 3.63 | | | | 3.65 | | | | 3.71 | | | | 3.67 | | | | 3.71 | |
| Loans held-for-sale | | | 4.28 | | | | 4.16 | | | | 4.17 | | | | 4.31 | | | | 4.12 | |
| Investment securities: | | | | | | | | | | | | | | | | | | | | |
| U.S. government agencies | | | 2.47 | | | | 2.45 | | | | 2.45 | | | | 2.47 | | | | 2.54 | |
| States and municipalities | | | NM | | | | 2.84 | | | | 2.77 | | | | 3.46 | | | | 4.38 | |
| Other | | | 4.04 | | | | 4.10 | | | | 4.08 | | | | 4.13 | | | | 4.13 | |
| Total investment securities | | | 2.56 | | | | 2.54 | | | | 2.53 | | | | 2.56 | | | | 2.62 | |
| Trading securities | | | 2.86 | | | | 2.98 | | | | 2.73 | | | | 2.71 | | | | 2.94 | |
| Other earning assets: | | | | | | | | | | | | | | | | | | | | |
| Federal funds sold | | | 1.12 | | | | 1.00 | | | | 1.00 | | | | 0.97 | | | | 1.02 | |
| Securities purchased under agreements to resell (d) | | | (0.14 | ) | | | (0.06 | ) | | | (0.13 | ) | | | (0.13 | ) | | | (0.13 | ) |
| Interest-bearing cash | | | 0.28 | | | | 0.24 | | | | 0.23 | | | | 0.24 | | | | 0.24 | |
| Total other earning assets | | | 0.09 | | | | 0.12 | | | | 0.03 | | | | 0.12 | | | | 0.11 | |
| Interest income/total earning assets | | | 3.17 | % | | | 3.20 | % | | | 3.27 | % | | | 3.11 | % | | | 3.22 | % |
| | | | | | | | | | | | | | | | | | | | | |
| Liabilities: | | | | | | | | | | | | | | | | | | | | |
| Interest-bearing liabilities: | | | | | | | | | | | | | | | | | | | | |
| Interest-bearing deposits: | | | | | | | | | | | | | | | | | | | | |
| Savings | | | 0.15 | % | | | 0.15 | % | | | 0.16 | % | | | 0.18 | % | | | 0.18 | % |
| Other interest-bearing deposits | | | 0.10 | | | | 0.09 | | | | 0.09 | | | | 0.09 | | | | 0.08 | |
| Time deposits | | | 0.60 | | | | 0.65 | | | | 0.68 | | | | 0.71 | | | | 0.83 | |
| Total interest-bearing core deposits | | | 0.16 | | | | 0.15 | | | | 0.17 | | | | 0.18 | | | | 0.19 | |
| Certificates of deposit $100,000 and more | | | 1.03 | | | | 0.85 | | | | 0.82 | | | | 0.84 | | | | 0.45 | |
| Federal funds purchased | | | 0.30 | | | | 0.25 | | | | 0.25 | | | | 0.25 | | | | 0.25 | |
| Securities sold under agreements to repurchase | | | 0.05 | | | | 0.04 | | | | 0.05 | | | | 0.08 | | | | 0.07 | |
| Trading liabilities | | | 2.08 | | | | 2.34 | | | | 2.12 | | | | 2.18 | | | | 2.47 | |
| Other short-term borrowings | | | 0.81 | | | | 0.84 | | | | 0.49 | | | | 0.68 | | | | 0.51 | |
| Term borrowings (e) | | | 2.46 | | | | 2.55 | | | | 2.47 | | | | 2.39 | | | | 2.20 | |
| Interest expense/total interest-bearing liabilities | | | 0.49 | | | | 0.48 | | | | 0.48 | | | | 0.50 | | | | 0.50 | |
| Net interest spread | | | 2.68 | % | | | 2.72 | % | | | 2.79 | % | | | 2.61 | % | | | 2.72 | % |
| Effect of interest-free sources used to fund earning assets | | | 0.14 | | | | 0.13 | | | | 0.13 | | | | 0.13 | | | | 0.14 | |
| Net interest margin | | | 2.82 | % | | | 2.85 | % | | | 2.92 | % | | | 2.74 | % | | | 2.86 | % |
Yields are adjusted to a FTE basis assuming a statutory federal income tax rate of 35 percent and, where applicable, state income taxes.
NM - Not meaningful
| (a) | Earning assets yields are expressed net of unearned income. |
| (b) | Includes loan fees and cash basis interest income. |
| (c) | Includes loans on nonaccrual status. |
| (d) | Driven by negative market rates on reverse repurchase agreements. |
| (e) | Rates are expressed net of unamortized debenture cost for term borrowings. |
FHN CAPITAL HIGHLIGHTS
Quarterly, Unaudited
| | | | | | | | | | | | | | | | | | 4Q15 Changes vs. |
| (Dollars and shares in thousands) | | 4Q15 | | | 3Q15 | | | 2Q15 | | | 1Q15 | | | 4Q14 | | | 3Q15 | | | 4Q14 | |
| | | | | | | | | | | | | | | | | | | | | | | | | | | | | |
| Common equity tier 1 capital (a) (c) | | $ | 2,278,580 | | | $ | 2,226,189 | | | $ | 2,172,768 | | | $ | 2,133,554 | | | | N/A | | | | 2 | % | | | NM | |
| Tier 1 capital (a) (b) (c) | | $ | 2,572,117 | | | $ | 2,516,194 | | | $ | 2,500,612 | | | $ | 2,452,297 | | | $ | 2,813,503 | | | | 2 | % | | | (9 | )% |
| Total capital (a) (d) | | $ | 2,836,676 | | | $ | 2,781,354 | | | $ | 2,922,582 | | | $ | 2,912,671 | | | $ | 3,148,336 | | | | 2 | % | | | (10 | )% |
| | | | | | | | | | | | | | | | | | | | | | | | | | | | | |
| Risk-weighted assets (“RWA”) (a) | | $ | 21,803,700 | | | $ | 20,783,031 | | | $ | 20,869,862 | | | $ | 20,707,078 | | | $ | 19,452,656 | | | | 5 | % | | | 12 | % |
| Average assets for leverage (a) (c) | | $ | 26,106,830 | | | $ | 25,280,856 | | | $ | 25,347,048 | | | $ | 25,570,905 | | | $ | 24,625,820 | | | | 3 | % | | | 6 | % |
| | | | | | | | | | | | | | | | | | | | | | | | | | | | | |
| Common equity tier 1 ratio (a) (c) | | | 10.45 | % | | | 10.71 | % | | | 10.41 | % | | | 10.30 | % | | | N/A | | | | | | | | | |
| Tier 1 ratio (a) (c) | | | 11.80 | % | | | 12.11 | % | | | 11.98 | % | | | 11.84 | % | | | 14.46 | % | | | | | | | | |
| Total capital ratio (a) | | | 13.01 | % | | | 13.38 | % | | | 14.00 | % | | | 14.07 | % | | | 16.18 | % | | | | | | | | |
| Leverage ratio (a) (c) | | | 9.85 | % | | | 9.95 | % | | | 9.87 | % | | | 9.59 | % | | | 11.43 | % | | | | | | | | |
| | | | | | | | | | | | | | | | | | | | | | | | | | | | | |
| Tier 1 common to risk-weighted assets (c) (e) | | | N/A | | | | N/A | | | | N/A | | | | N/A | | | | 11.43 | % | | | | | | | | |
| Total equity to total assets | | | 10.08 | % | | | 10.16 | % | | | 9.98 | % | | | 9.72 | % | | | 10.06 | % | | | | | | | | |
| Tangible common equity/tangible assets (“TCE/TA”) (e) | | | 7.82 | % | | | 8.00 | % | | | 7.80 | % | | | 7.57 | % | | | 7.90 | % | | | | | | | | |
| Period-end shares outstanding (f) | | | 238,587 | | | | 234,237 | | | | 234,021 | | | | 233,499 | | | | 234,220 | | | | 2 | % | | | 2 | % |
| Cash dividends declared per common share | | $ | 0.06 | | | $ | 0.06 | | | $ | 0.06 | | | $ | 0.06 | | | $ | 0.05 | | | | * | | | | 20 | % |
| Book value per common share | | $ | 9.42 | | | $ | 9.35 | | | $ | 9.09 | | | $ | 9.03 | | | $ | 9.35 | | | | | | | | | |
| Tangible book value per common share (e) | | $ | 8.51 | | | $ | 8.61 | | | $ | 8.35 | | | $ | 8.28 | | | $ | 8.60 | | | | | | | | | |
| Market capitalization (millions) | | $ | 3,464.3 | | | $ | 3,321.5 | | | $ | 3,667.1 | | | $ | 3,336.7 | | | $ | 3,180.7 | | | | | | | | | |
Certain previously reported amounts have been reclassified to agree with current presentation.
NM - Not Meaningful
* Amount is less than one percent.
| (a) | Current quarter is an estimate. All quarters in 2015 reflect revisions to regulatory capital definitions under the Basel III risk-based capital rules as phased-in. |
| (b) | FHN’s outstanding trust preferred securities were redeemed in 3Q15. 2Q15 and 1Q15 include $50 million of Tier 1 qualifying trust preferred securities. 4Q14 includes $200 million of Tier 1 qualifying trust preferred securities. |
| (c) | See Glossary of Terms for definition. |
| (d) | FHN’s outstanding trust preferred securities were redeemed in 3Q15. 2Q15 and 1Q15 include $150 million of Tier 2 qualifying trust preferred which are excluded from Tier 1 under Basel III. |
| (e) | Refer to the Non-GAAP to GAAP reconciliation on page 22 of this financial supplement. |
| (f) | 4Q15 increase related to shares issued in connection with the TrustAtlantic acquisition, partially offset by shares purchased under share repurchase programs; 1Q15 decrease related to shares repurchased under share repurchase programs. |
FHN BUSINESS SEGMENT HIGHLIGHTS
Quarterly/Annually, Unaudited
| | | | | | | | | | | | | | | | | | 4Q15 Changes vs. | | Twelve Months Ended | | 2015 vs. |
| (Thousands) | | 4Q15 | | | 3Q15 | | | 2Q15 | | | 1Q15 | | | 4Q14 | | | 3Q15 | | | 4Q14 | | | 2015 | | | 2014 | | | 2014 |
| | | | | | | | | | | | | | | | | | | | | | | | | | | | | | | | | | | | | | | | | |
| Regional Banking | | | | | | | | | | | | | | | | | | | | | | | | | | | | | | | | | | | | | | | | |
| Net interest income | | $ | 169,605 | | | $ | 165,258 | | | $ | 165,908 | | | $ | 154,409 | | | $ | 157,557 | | | | 3 | % | | | 8 | % | | $ | 655,180 | | | $ | 602,126 | | | | 9 | % |
| Noninterest income | | | 62,650 | | | | 62,773 | | | | 65,989 | | | | 60,204 | | | | 64,331 | | | | * | | | | (3 | )% | | | 251,616 | | | | 254,705 | | | | (1 | )% |
| Total revenues | | | 232,255 | | | | 228,031 | | | | 231,897 | | | | 214,613 | | | | 221,888 | | | | 2 | % | | | 5 | % | | | 906,796 | | | | 856,831 | | | | 6 | % |
| Provision for loan losses | | | 5,856 | | | | 6,696 | | | | 17,078 | | | | 4,915 | | | | 5,568 | | | | (13 | )% | | | 5 | % | | | 34,545 | | | | 29,187 | | | | 18 | % |
| Noninterest expense | | | 147,776 | | | | 135,776 | | | | 144,203 | | | | 135,780 | | | | 137,546 | | | | 9 | % | | | 7 | % | | | 563,535 | | | | 538,988 | | | | 5 | % |
| Income before income taxes | | | 78,623 | | | | 85,559 | | | | 70,616 | | | | 73,918 | | | | 78,774 | | | | (8 | )% | | | * | | | | 308,716 | | | | 288,656 | | | | 7 | % |
| Provision for income taxes | | | 28,046 | | | | 30,809 | | | | 24,996 | | | | 26,381 | | | | 28,057 | | | | (9 | )% | | | * | | | | 110,232 | | | | 102,771 | | | | 7 | % |
| Net income | | $ | 50,577 | | | $ | 54,750 | | | $ | 45,620 | | | $ | 47,537 | | | $ | 50,717 | | | | (8 | )% | | | * | | | $ | 198,484 | | | $ | 185,885 | | | | 7 | % |
| | | | | | | | | | | | | | | | | | | | | | | | | | | | | | | | | | | | | | | | | |
| Fixed Income | | | | | | | | | | | | | | | | | | | | | | | | | | | | | | | | | | | | | | | | |
| Net interest income | | $ | 3,906 | | | $ | 3,008 | | | $ | 4,297 | | | $ | 4,323 | | | $ | 3,675 | | | | 30 | % | | | 6 | % | | $ | 15,534 | | | $ | 12,688 | | | | 22 | % |
| Noninterest income | | | 61,989 | | | | 51,756 | | | | 56,001 | | | | 61,565 | | | | 48,506 | | | | 20 | % | | | 28 | % | | | 231,311 | | | | 202,725 | | | | 14 | % |
| Total revenues | | | 65,895 | | | | 54,764 | | | | 60,298 | | | | 65,888 | | | | 52,181 | | | | 20 | % | | | 26 | % | | | 246,845 | | | | 215,413 | | | | 15 | % |
| Noninterest expense (a) | | | 54,530 | | | | 59,783 | | | | 51,214 | | | | 54,683 | | | | 46,218 | | | | (9 | )% | | | 18 | % | | | 220,210 | | | | 146,847 | | | | 50 | % |
| Income/(loss) before income taxes | | | 11,365 | | | | (5,019 | ) | | | 9,084 | | | | 11,205 | | | | 5,963 | | | | NM | | | | 91 | % | | | 26,635 | | | | 68,566 | | | | (61 | )% |
| Provision/(benefit) for income taxes | | | 4,002 | | | | (2,359 | ) | | | 3,171 | | | | 4,167 | | | | 2,059 | | | | NM | | | | 94 | % | | | 8,981 | | | | 25,741 | | | | (65 | )% |
| Net income/(loss) | | $ | 7,363 | | | $ | (2,660 | ) | | $ | 5,913 | | | $ | 7,038 | | | $ | 3,904 | | | | NM | | | | 89 | % | | $ | 17,654 | | | $ | 42,825 | | | | (59 | )% |
| | | | | | | | | | | | | | | | | | | | | | | | | | | | | | | | | | | | | | | | | |
| Corporate | | | | | | | | | | | | | | | | | | | | | | | | | | | | | | | | | | | | | | | | |
| Net interest income/(expense) | | $ | (19,230 | ) | | $ | (19,037 | ) | | $ | (17,376 | ) | | $ | (16,084 | ) | | $ | (18,038 | ) | | | (1 | )% | | | (7 | )% | | $ | (71,727 | ) | | $ | (54,175 | ) | | | (32 | )% |
| Noninterest income | | | 5,485 | | | | 8,559 | | | | 3,901 | | | | 5,385 | | | | 4,400 | | | | (36 | )% | | | 25 | % | | | 23,330 | | | | 26,969 | | | | (13 | )% |
| Total revenues | | | (13,745 | ) | | | (10,478 | ) | | | (13,475 | ) | | | (10,699 | ) | | | (13,638 | ) | | | (31 | )% | | | (1 | )% | | | (48,397 | ) | | | (27,206 | ) | | | (78 | )% |
| Noninterest expense | | | 17,446 | | | | 11,521 | | | | 13,770 | | | | 14,169 | | | | 14,017 | | | | 51 | % | | | 24 | % | | | 56,906 | | | | 61,387 | | | | (7 | )% |
| Loss before income taxes | | | (31,191 | ) | | | (21,999 | ) | | | (27,245 | ) | | | (24,868 | ) | | | (27,655 | ) | | | (42 | )% | | | (13 | )% | | | (105,303 | ) | | | (88,593 | ) | | | (19 | )% |
| Benefit for income taxes | | | (27,528 | ) | | | (24,841 | ) | | | (15,882 | ) | | | (11,640 | ) | | | (19,601 | ) | | | (11 | )% | | | (40 | )% | | | (79,891 | ) | | | (63,526 | ) | | | (26 | )% |
| Net income/(loss) | | $ | (3,663 | ) | | $ | 2,842 | | | $ | (11,363 | ) | | $ | (13,228 | ) | | $ | (8,054 | ) | | | NM | | | | 55 | % | | $ | (25,412 | ) | | $ | (25,067 | ) | | | (1 | )% |
| | | | | | | | | | | | | | | | | | | | | | | | | | | | | | | | | | | | | | | | | |
| Non-Strategic | | | | | | | | | | | | | | | | | | | | | | | | | | | | | | | | | | | | | | | | |
| Net interest income | | $ | 12,371 | | | $ | 14,333 | | | $ | 13,811 | | | $ | 14,218 | | | $ | 15,856 | | | | (14 | )% | | | (22 | )% | | $ | 54,733 | | | $ | 67,079 | | | | (18 | )% |
| Noninterest income (b) | | | 2,108 | | | | 2,015 | | | | 4,410 | | | | 2,535 | | | | 2,361 | | | | 5 | % | | | (11 | )% | | | 11,068 | | | | 65,645 | | | | (83 | )% |
| Total revenues | | | 14,479 | | | | 16,348 | | | | 18,221 | | | | 16,753 | | | | 18,217 | | | | (11 | )% | | | (21 | )% | | | 65,801 | | | | 132,724 | | | | (50 | )% |
| Provision/(provision credit) for loan losses | | | (4,856 | ) | | | (5,696 | ) | | | (15,078 | ) | | | 85 | | | | 432 | | | | 15 | % | | | NM | | | | (25,545 | ) | | | (2,187 | ) | | | NM | |
| Noninterest expense (c) | | | 23,988 | | | | 8,356 | | | | 9,207 | | | | 171,589 | | | | 9,528 | | | | NM | | | | NM | | | | 213,140 | | | | 85,309 | | | | NM | |
| Income/(loss) before income taxes | | | (4,653 | ) | | | 13,688 | | | | 24,092 | | | | (154,921 | ) | | | 8,257 | | | | NM | | | | NM | | | | (121,794 | ) | | | 49,602 | | | | NM | |
| Provision/(benefit) for income taxes | | | (1,805 | ) | | | 5,288 | | | | 9,305 | | | | (41,169 | ) | | | 3,184 | | | | NM | | | | NM | | | | (28,381 | ) | | | 19,199 | | | | NM | |
| Net income/(loss) | | $ | (2,848 | ) | | $ | 8,400 | | | $ | 14,787 | | | $ | (113,752 | ) | | $ | 5,073 | | | | NM | | | | NM | | | $ | (93,413 | ) | | $ | 30,403 | | | | NM | |
| | | | | | | | | | | | | | | | | | | | | | | | | | | | | | | | | | | | | | | | | |
| Total Consolidated | | | | | | | | | | | | | | | | | | | | | | | | | | | | | | | | | | | | | | | | |
| Net interest income | | $ | 166,652 | | | $ | 163,562 | | | $ | 166,640 | | | $ | 156,866 | | | $ | 159,050 | | | | 2 | % | | | 5 | % | | $ | 653,720 | | | $ | 627,718 | | | | 4 | % |
| Noninterest income | | | 132,232 | | | | 125,103 | | | | 130,301 | | | | 129,689 | | | | 119,598 | | | | 6 | % | | | 11 | % | | | 517,325 | | | | 550,044 | | | | (6 | )% |
| Total revenues | | | 298,884 | | | | 288,665 | | | | 296,941 | | | | 286,555 | | | | 278,648 | | | | 4 | % | | | 7 | % | | | 1,171,045 | | | | 1,177,762 | | | | (1 | )% |
| Provision for loan losses | | | 1,000 | | | | 1,000 | | | | 2,000 | | | | 5,000 | | | | 6,000 | | | | * | | | | (83 | )% | | | 9,000 | | | | 27,000 | | | | (67 | )% |
| Noninterest expense | | | 243,740 | | | | 215,436 | | | | 218,394 | | | | 376,221 | | | | 207,309 | | | | 13 | % | | | 18 | % | | | 1,053,791 | | | | 832,531 | | | | 27 | % |
| Income/(loss) before income taxes | | | 54,144 | | | | 72,229 | | | | 76,547 | | | | (94,666 | ) | | | 65,339 | | | | (25 | )% | | | (17 | )% | | | 108,254 | | | | 318,231 | | | | (66 | )% |
| Provision/(benefit) for income taxes | | | 2,715 | | | | 8,897 | | | | 21,590 | | | | (22,261 | ) | | | 13,699 | | | | (69 | )% | | | (80 | )% | | | 10,941 | | | | 84,185 | | | | (87 | )% |
| Net income/(loss) | | $ | 51,429 | | | $ | 63,332 | | | $ | 54,957 | | | $ | (72,405 | ) | | $ | 51,640 | | | | (19 | )% | | | * | | | $ | 97,313 | | | $ | 234,046 | | | | (58 | )% |
Certain previously reported amounts have been reclassified to agree with current presentation.
NM - Not meaningful
* Amount is less than one percent.
| (a) | 3Q15 includes an $11.6 million charge to litigation and regulatory matters related to the resolution of a legal matter; 2014 includes $47.1 million related to agreements with insurance companies for the recovery of expenses FHN incurred in connection with litigation losses in previous periods. |
| (b) | 2014 includes $39.7 million of gains on the sale of HFS mortgage loans and $12.1 million of favorable valuation adjustments on loans primarily because of the loan sales. |
| (c) | 4Q15 includes $14.2 million of loss accruals related to legal matters; 1Q15 includes $162.5 million of loss accruals related to the settlement of potential claims related to FHN’s underwriting and origination of FHA-insured mortgage loans; 2014 includes $110.4 million of loss accruals related to legal matters, partially offset by $75.0 million of expense reversals related to agreements with insurance companies for the recovery of expenses FHN incurred related to litigation losses in previous periods. |
FHN REGIONAL BANKING
Quarterly, Unaudited
| | | | | | | | | | | | | | | | | | 4Q15 Changes vs. |
| | | 4Q15 | | | 3Q15 | | | 2Q15 | | | 1Q15 | | | 4Q14 | | | 3Q15 | | | 4Q14 | |
| | | | | | | | | | | | | | | | | | | | | | | | | | | | | |
| Income Statement (thousands) | | | | | | | | | | | | | | | | | | | | | | | | | | | | |
| Net interest income | | $ | 169,605 | | | $ | 165,258 | | | $ | 165,908 | | | $ | 154,409 | | | $ | 157,557 | | | | 3 | % | | | 8 | % |
| Provision for loan losses | | | 5,856 | | | | 6,696 | | | | 17,078 | | | | 4,915 | | | | 5,568 | | | | (13 | )% | | | 5 | % |
| Noninterest income: | | | | | | | | | | | | | | | | | | | | | | | | | | | | |
| NSF / Overdraft fees (a) | | | 11,630 | | | | 11,678 | | | | 10,664 | | | | 9,144 | | | | 11,619 | | | | * | | | | * | |
| Cash management fees | | | 8,637 | | | | 8,482 | | | | 8,884 | | | | 8,878 | | | | 8,719 | | | | 2 | % | | | (1 | )% |
| Debit card income | | | 3,302 | | | | 3,313 | | | | 3,323 | | | | 3,060 | | | | 3,113 | | | | * | | | | 6 | % |
| Other | | | 4,382 | | | | 4,398 | | | | 4,538 | | | | 4,537 | | | | 4,654 | | | | * | | | | (6 | )% |
| Total deposit transactions and cash management | | | 27,951 | | | | 27,871 | | | | 27,409 | | | | 25,619 | | | | 28,105 | | | | * | | | | (1 | )% |
| Brokerage, management fees and commissions | | | 11,021 | | | | 11,620 | | | | 12,456 | | | | 11,399 | | | | 11,647 | | | | (5 | )% | | | (5 | )% |
| Trust services and investment management | | | 6,889 | | | | 6,605 | | | | 7,432 | | | | 6,713 | | | | 6,960 | | | | 4 | % | | | (1 | )% |
| Bankcard income | | | 5,423 | | | | 5,257 | | | | 5,587 | | | | 4,977 | | | | 5,537 | | | | 3 | % | | | (2 | )% |
| Other service charges | | | 2,358 | | | | 2,562 | | | | 2,637 | | | | 2,422 | | | | 2,395 | | | | (8 | )% | | | (2 | )% |
| Miscellaneous revenue | | | 9,008 | | | | 8,858 | | | | 10,468 | | | | 9,074 | | | | 9,687 | | | | 2 | % | | | (7 | )% |
| Total noninterest income | | | 62,650 | | | | 62,773 | | | | 65,989 | | | | 60,204 | | | | 64,331 | | | | * | | | | (3 | )% |
| Noninterest expense: | | | | | | | | | | | | | | | | | | | | | | | | | | | | |
| Employee compensation, incentives, and benefits | | | 51,481 | | | | 49,078 | | | | 49,692 | | | | 48,272 | | | | 46,175 | | | | 5 | % | | | 11 | % |
| Other (b) | | | 96,295 | | | | 86,698 | | | | 94,511 | | | | 87,508 | | | | 91,371 | | | | 11 | % | | | 5 | % |
| Total noninterest expense | | | 147,776 | | | | 135,776 | | | | 144,203 | | | | 135,780 | | | | 137,546 | | | | 9 | % | | | 7 | % |
| Income before income taxes | | $ | 78,623 | | | $ | 85,559 | | | $ | 70,616 | | | $ | 73,918 | | | $ | 78,774 | | | | (8 | )% | | | * | |
| PPNR (c) | | | 84,479 | | | | 92,255 | | | | 87,694 | | | | 78,833 | | | | 84,342 | | | | (8 | )% | | | * | |
| Efficiency ratio (d) | | | 63.63 | % | | | 59.54 | % | | | 62.18 | % | | | 63.27 | % | | | 61.99 | % | | | | | | | | |
| | | | | | | | | | | | | | | | | | | | | | | | | | | | | |
| Balance Sheet (millions) | | | | | | | | | | | | | | | | | | | | | | | | | | | | |
| Average loans | | $ | 14,760 | | | $ | 14,312 | | | $ | 14,326 | | | $ | 13,513 | | | $ | 13,129 | | | | 3 | % | | | 12 | % |
| Average other earning assets | | | 42 | | | | 58 | | | | 55 | | | | 48 | | | | 52 | | | | (28 | )% | | | (19 | )% |
| Total average earning assets | | | 14,802 | | | | 14,370 | | | | 14,381 | | | | 13,561 | | | | 13,181 | | | | 3 | % | | | 12 | % |
| Average core deposits | | | 17,351 | | | | 16,976 | | | | 16,752 | | | | 16,263 | | | | 15,335 | | | | 2 | % | | | 13 | % |
| Average other deposits | | | 338 | | | | 354 | | | | 406 | | | | 423 | | | | 452 | | | | (5 | )% | | | (25 | )% |
| Total average deposits | | | 17,689 | | | | 17,330 | | | | 17,158 | | | | 16,686 | | | | 15,787 | | | | 2 | % | | | 12 | % |
| Total period-end deposits | | | 18,077 | | | | 17,287 | | | | 17,226 | | | | 17,240 | | | | 16,373 | | | | 5 | % | | | 10 | % |
| Total period-end assets | | | 16,394 | | | | 15,163 | | | | 15,264 | | | | 14,894 | | | | 14,350 | | | | 8 | % | | | 14 | % |
| Net interest margin (e) | | | 4.61 | % | | | 4.63 | % | | | 4.69 | % | | | 4.68 | % | | | 4.78 | % | | | | | | | | |
| Net interest spread | | | 3.36 | | | | 3.33 | | | | 3.35 | | | | 3.37 | | | | 3.36 | | | | | | | | | |
| Loan yield | | | 3.48 | | | | 3.45 | | | | 3.48 | | | | 3.51 | | | | 3.50 | | | | | | | | | |
| Deposit average yield | | | 0.12 | | | | 0.12 | | | | 0.13 | | | | 0.14 | | | | 0.14 | | | | | | | | | |
| | | | | | | | | | | | | | | | | | | | | | | | | | | | | |
| Key Statistics | | | | | | | | | | | | | | | | | | | | | | | | | | | | |
| Financial center locations (f) | | | 177 | | | | 174 | | | | 175 | | | | 178 | | | | 178 | | | | 2 | % | | | (1 | )% |
Certain previously reported amounts have been reclassified to agree with current presentation
* Amount is less than one percent.
| (a) | 1Q15 levels primarily attributable to seasonality in NSF fees. |
| (b) | 3Q15 decrease primarily driven by lower allocated personnel expenses due in large part to gains recognized in third quarter related to an employee benefit plan amendment. |
| (c) | Pre-provision net revenue is not a GAAP number but is used in regulatory stress test reporting. The presentation of PPNR in this Financial Supplement follows the regulatory definition. |
| (d) | Noninterest expense divided by total revenue. |
| (e) | Net interest margin is computed using total net interest income adjusted for FTE assuming a statutory federal income tax rate of 35 percent and, where applicable, state income taxes. |
| (f) | 4Q15 increase related to the TrustAtlantic acquisition. |
FHN FIXED INCOME
Quarterly, Unaudited
| | | | | | | | | | | | | | | | | | 4Q15 Changes vs. |
| | | 4Q15 | | | 3Q15 | | | 2Q15 | | | 1Q15 | | | 4Q14 | | | 3Q15 | | | 4Q14 | |
| | | | | | | | | | | | | | | | | | | | | | | | | | | | | |
| Income Statement (thousands) | | | | | | | | | | | | | | | | | | | | | | | | | | | | |
| Net interest income | | $ | 3,906 | | | $ | 3,008 | | | $ | 4,297 | | | $ | 4,323 | | | $ | 3,675 | | | | 30 | % | | | 6 | % |
| Noninterest income: | | | | | | | | | | | | | | | | | | | | | | | | | | | | |
| Fixed income product revenue | | | 52,713 | | | | 42,969 | | | | 46,685 | | | | 53,510 | | | | 39,030 | | | | 23 | % | | | 35 | % |
| Other | | | 9,276 | | | | 8,787 | | | | 9,316 | | | | 8,055 | | | | 9,476 | | | | 6 | % | | | (2 | )% |
| Total noninterest income | | | 61,989 | | | | 51,756 | | | | 56,001 | | | | 61,565 | | | | 48,506 | | | | 20 | % | | | 28 | % |
| Noninterest expense (a) | | | 54,530 | | | | 59,783 | | | | 51,214 | | | | 54,683 | | | | 46,218 | | | | (9 | )% | | | 18 | % |
| Income/(loss) before income taxes | | $ | 11,365 | | | $ | (5,019 | ) | | $ | 9,084 | | | $ | 11,205 | | | $ | 5,963 | | | | NM | | | | 91 | % |
| | | | | | | | | | | | | | | | | | | | | | | | | | | | | |
| Efficiency ratio (b) | | | 82.75 | % | | | NM | | | | 84.93 | % | | | 82.99 | % | | | 88.57 | % | | | | | | | | |
| Fixed income product average daily revenue | | $ | 850 | | | $ | 671 | | | $ | 729 | | | $ | 877 | | | $ | 630 | | | | 27 | % | | | 35 | % |
| | | | | | | | | | | | | | | | | | | | | | | | | | | | | |
| Balance Sheet (millions) | | | | | | | | | | | | | | | | | | | | | | | | | | | | |
| Average trading inventory | | $ | 1,303 | | | $ | 1,133 | | | $ | 1,358 | | | $ | 1,366 | | | $ | 1,177 | | | | 15 | % | | | 11 | % |
| Average other earning assets | | | 805 | | | | 763 | | | | 761 | | | | 781 | | | | 677 | | | | 6 | % | | | 19 | % |
| Total average earning assets | | | 2,108 | | | | 1,896 | | | | 2,119 | | | | 2,147 | | | | 1,854 | | | | 11 | % | | | 14 | % |
| Total period-end assets | | | 1,778 | | | | 2,361 | | | | 2,273 | | | | 2,808 | | | | 2,138 | | | | (25 | )% | | | (17 | )% |
| Net interest margin (c) | | | 0.82 | % | | | 0.73 | % | | | 0.87 | % | | | 0.83 | % | | | 0.85 | % | | | | | | | | |
Certain previously reported amounts have been reclassified to agree with current presentation.
NM - Not meaningful
| (a) | 3Q15 includes an $11.6 million charge to litigation and regulatory matters related to the resolution of a legal matter. |
| (b) | Noninterest expense divided by total revenue. |
| (c) | Net interest margin is computed using total net interest income adjusted for FTE assuming a statutory federal income tax rate of 35 percent and, where applicable, state income taxes. |
FHN CORPORATE
Quarterly, Unaudited
| | | | | | | | | | | | | | | | | | 4Q15 Changes vs. |
| | | 4Q15 | | | 3Q15 | | | 2Q15 | | | 1Q15 | | | 4Q14 | | | 3Q15 | | | 4Q14 | |
| | | | | | | | | | | | | | | | | | | | | | | | | | | | | |
| Income Statement (thousands) | | | | | | | | | | | | | | | | | | | | | | | | | | | | |
| Net interest income/(expense) | | $ | (19,230 | ) | | $ | (19,037 | ) | | $ | (17,376 | ) | | $ | (16,084 | ) | | $ | (18,038 | ) | | | (1 | )% | | | (7 | )% |
| Noninterest income excluding securities gains/(losses) (a) | | | 4,046 | | | | 8,904 | | | | 3,893 | | | | 5,109 | | | | 4,400 | | | | (55 | )% | | | (8 | )% |
| Securities gains/(losses), net | | | 1,439 | | | | (345 | ) | | | 8 | | | | 276 | | | | — | | | | NM | | | | NM | |
| Noninterest expense (b) | | | 17,446 | | | | 11,521 | | | | 13,770 | | | | 14,169 | | | | 14,017 | | | | 51 | % | | | 24 | % |
| Loss before income taxes | | $ | (31,191 | ) | | $ | (21,999 | ) | | $ | (27,245 | ) | | $ | (24,868 | ) | | $ | (27,655 | ) | | | (42 | )% | | | (13 | )% |
| | | | | | | | | | | | | | | | | | | | | | | | | | | | | |
| Average Balance Sheet (millions) | | | | | | | | | | | | | | | | | | | | | | | | | | | | |
| Average loans | | $ | 110 | | | $ | 120 | | | $ | 128 | | | $ | 138 | | | $ | 148 | | | | (8 | )% | | | (26 | )% |
| Total earning assets | | $ | 4,830 | | | $ | 4,592 | | | $ | 4,282 | | | $ | 5,162 | | | $ | 4,703 | | | | 5 | % | | | 3 | % |
| Net interest margin (c) | | | (1.56 | )% | | | (1.63 | )% | | | (1.63 | )% | | | (1.28 | )% | | | (1.40 | )% | | | | | | | | |
NM - Not meaningful
| (a) | 3Q15 includes a $5.8 million gain related to the extinguishment of debt. |
| (b) | 4Q15 includes $2.8 million of impairment related to a tax credit investment accounted for under the equity method and $2.7 million of costs related to the TrustAtlantic acquisition. |
| (c) | Net interest margin is computed using total net interest income adjusted for FTE assuming a statutory federal income tax rate of 35 percent and, where applicable, state income taxes. |
FHN NON-STRATEGIC
Quarterly, Unaudited
| | | | | | | | | | | | | | | | | | 4Q15 Changes vs. |
| | | 4Q15 | | | 3Q15 | | | 2Q15 | | | 1Q15 | | | 4Q14 | | | 3Q15 | | | 4Q14 | |
| | | | | | | | | | | | | | | | | | | | | | | | | | | | | |
| Income Statement (thousands) | | | | | | | | | | | | | | | | | | | | | | | | | | | | |
| Net interest income | | $ | 12,371 | | | $ | 14,333 | | | $ | 13,811 | | | $ | 14,218 | | | $ | 15,856 | | | | (14 | )% | | | (22 | )% |
| Noninterest income (a) | | | 2,108 | | | | 2,015 | | | | 4,410 | | | | 2,535 | | | | 2,361 | | | | 5 | % | | | (11 | )% |
| Noninterest expense (b) | | | 23,988 | | | | 8,356 | | | | 9,207 | | | | 171,589 | | | | 9,528 | | | | NM | | | | NM | |
| Provision/(provision credit) for loan losses | | | (4,856 | ) | | | (5,696 | ) | | | (15,078 | ) | | | 85 | | | | 432 | | | | 15 | % | | | NM | |
| Income/(loss) before income taxes | | $ | (4,653 | ) | | $ | 13,688 | | | $ | 24,092 | | | $ | (154,921 | ) | | $ | 8,257 | | | | NM | | | | NM | |
| | | | | | | | | | | | | | | | | | | | | | | | | | | | | |
| Average Balance Sheet (millions) | | | | | | | | | | | | | | | | | | | | | | | | | | | | |
| Loans | | $ | 2,073 | | | $ | 2,201 | | | $ | 2,337 | | | $ | 2,472 | | | $ | 2,592 | | | | (6 | )% | | | (20 | )% |
| Loans held-for-sale | | | 109 | | | | 113 | | | | 115 | | | | 120 | | | | 125 | | | | (4 | )% | | | (13 | )% |
| Trading securities | | | 5 | | | | 5 | | | | 5 | | | | 5 | | | | 6 | | | | * | | | | (17 | )% |
| Allowance for loan losses | | | (76 | ) | | | (87 | ) | | | (99 | ) | | | (105 | ) | | | (110 | ) | | | (13 | )% | | | (31 | )% |
| Other assets | | | 13 | | | | 14 | | | | 51 | | | | 63 | | | | 72 | | | | (7 | )% | | | (82 | )% |
| Total assets | | | 2,124 | | | | 2,246 | | | | 2,409 | | | | 2,555 | | | | 2,685 | | | | (5 | )% | | | (21 | )% |
| Net interest margin (c) | | | 2.25 | % | | | 2.46 | % | | | 2.25 | % | | | 2.19 | % | | | 2.32 | % | | | | | | | | |
| Efficiency ratio (d) | | | NM | | | | 51.11 | % | | | 50.53 | % | | | NM | | | | 52.30 | % | | | | | | | | |
| | | | | | | | | | | | | | | | | | | | | | | | | | | | | |
| Mortgage Warehouse - Period-end (millions) | | | | | | | | | | | | | | | | | | | | | | | | | | | | |
| Ending warehouse balance (loans held-for-sale) | | $ | 101 | | | $ | 104 | | | $ | 106 | | | $ | 108 | | | $ | 115 | | | | (3 | )% | | | (12 | )% |
| Key Servicing Metric | | | | | | | | | | | | | | | | | | | | | | | | | | | | |
| Ending servicing portfolio (millions) (e) | | $ | 837 | | | $ | 879 | | | $ | 922 | | | $ | 966 | | | $ | 1,013 | | | | (5 | )% | | | (17 | )% |
NM - Not meaningful
* Amount is less than one percent.
| (a) | 2Q15 includes a $2.7 million pre-tax gain on sale of property. |
| (b) | 4Q15 includes $14.2 million of loss accruals related to legal matters; 1Q15 includes $162.5 million of loss accruals related to the settlement of potential claims related to FHN’s underwriting and origination of FHA-insured mortgage loans. |
| (c) | Net interest margin is computed using total net interest income adjusted for FTE assuming a statutory federal income tax rate of 35 percent and, where applicable, state income taxes. |
| (d) | Noninterest expense divided by total revenue excluding securities gains/(losses). |
| (e) | Includes mortgage loans serviced from FHN’s legacy mortgage banking business, legacy equity lending serviced for others, and mortgage loans in portfolio and warehouse. |
FHN ASSET QUALITY: CONSOLIDATED
Quarterly, Unaudited
| | | | | | | | | | | | | | | | | | 4Q15 Changes vs. |
| (Thousands) | | 4Q15 | | | 3Q15 | | | 2Q15 | | | 1Q15 | | | 4Q14 | | | 3Q15 | | | 4Q14 | |
| | | | | | | | | | | | | | | | | | | | | | |
| Allowance for Loan Losses Walk-Forward | | | | | | | | | | | | | | | | | | | | | |
| Beginning reserve | | $ | 210,814 | | | $ | 221,351 | | | $ | 228,328 | | | $ | 232,448 | | | $ | 238,641 | | | | (5 | )% | | | (12 | )% |
| Provision | | | 1,000 | | | | 1,000 | | | | 2,000 | | | | 5,000 | | | | 6,000 | | | | * | | | | (83 | )% |
| Charge-offs | | | (16,614 | ) | | | (21,810 | ) | | | (19,434 | ) | | | (17,999 | ) | | | (23,306 | ) | | | (24 | )% | | | (29 | )% |
| Recoveries | | | 15,042 | | | | 10,273 | | | | 10,457 | | | | 8,879 | | | | 11,113 | | | | 46 | % | | | 35 | % |
| Ending balance | | $ | 210,242 | | | $ | 210,814 | | | $ | 221,351 | | | $ | 228,328 | | | $ | 232,448 | | | | * | | | | (10 | )% |
| Reserve for unfunded commitments | | | 5,926 | | | | 6,231 | | | | 5,561 | | | | 4,135 | | | | 4,770 | | | | (5 | )% | | | 24 | % |
| Total allowance for loan losses plus reserve for unfunded commitments | | $ | 216,168 | | | $ | 217,045 | | | $ | 226,912 | | | $ | 232,463 | | | $ | 237,218 | | | | * | | | | (9 | )% |
| | | | | | | | | | | | | | | | | | | | | | | | | | | | | |
| Allowance for Loan Losses | | | | | | | | | | | | | | | | | | | | | | | | | | | | |
| Regional Banking | | $ | 137,586 | | | $ | 128,942 | | | $ | 132,741 | | | $ | 125,982 | | | $ | 126,812 | | | | 7 | % | | | 8 | % |
| Non-Strategic | | | 72,656 | | | | 81,872 | | | | 88,610 | | | | 102,346 | | | | 105,636 | | | | (11 | )% | | | (31 | )% |
| Total allowance for loan losses | | $ | 210,242 | | | $ | 210,814 | | | $ | 221,351 | | | $ | 228,328 | | | $ | 232,448 | | | | * | | | | (10 | )% |
| | | | | | | | | | | | | | | | | | | | | | | | | | | | | |
| Nonperforming Assets | | | | | | | | | | | | | | | | | | | | | | | | | | | | |
| Regional Banking | | | | | | | | | | | | | | | | | | | | | | | | | | | | |
| Nonperforming loans | | $ | 56,475 | | | $ | 50,986 | | | $ | 69,094 | | | $ | 63,620 | | | $ | 64,654 | | | | 11 | % | | | (13 | )% |
| Foreclosed real estate (a) | | | 16,298 | | | | 17,042 | | | | 19,230 | | | | 19,704 | | | | 20,451 | | | | (4 | )% | | | (20 | )% |
| Total Regional Banking | | $ | 72,773 | | | $ | 68,028 | | | $ | 88,324 | | | $ | 83,324 | | | $ | 85,105 | | | | 7 | % | | | (14 | )% |
| Non-Strategic | | | | | | | | | | | | | | | | | | | | | | | | | | | | |
| Nonperforming loans | | $ | 120,946 | | | $ | 129,951 | | | $ | 130,894 | | | $ | 133,804 | | | $ | 135,740 | | | | (7 | )% | | | (11 | )% |
| Nonperforming loans held-for-sale after fair value adjustments | | | 7,846 | | | | 7,347 | | | | 6,372 | | | | 6,888 | | | | 7,643 | | | | 7 | % | | | 3 | % |
| Foreclosed real estate (a) | | | 8,679 | | | | 8,830 | | | | 9,879 | | | | 9,977 | | | | 9,979 | | | | (2 | )% | | | (13 | )% |
| Total Non-Strategic | | $ | 137,471 | | | $ | 146,128 | | | $ | 147,145 | | | $ | 150,669 | | | $ | 153,362 | | | | (6 | )% | | | (10 | )% |
| Corporate | | | | | | | | | | | | | | | | | | | | | | | | | | | | |
| Nonperforming loans | | $ | 1,677 | | | $ | 3,043 | | | $ | 3,079 | | | $ | 2,805 | | | $ | 3,045 | | | | (45 | )% | | | (45 | )% |
| Total nonperforming assets | | $ | 211,921 | | | $ | 217,199 | | | $ | 238,548 | | | $ | 236,798 | | | $ | 241,512 | | | | (2 | )% | | | (12 | )% |
| | | | | | | | | | | | | | | | | | | | | | | | | | | | | |
| Net Charge-Offs | | | | | | | | | | | | | | | | | | | | | | | | | | | | |
| Regional Banking | | $ | (2,787 | ) | | $ | 10,495 | | | $ | 10,318 | | | $ | 5,745 | | | $ | 6,629 | | | | NM | | | | NM | |
| Non-Strategic | | | 4,359 | | | | 1,042 | | | | (1,341 | ) | | | 3,375 | | | | 5,564 | | | | NM | | | | (22 | )% |
| Total net charge-offs | | $ | 1,572 | | | $ | 11,537 | | | $ | 8,977 | | | $ | 9,120 | | | $ | 12,193 | | | | (86 | )% | | | (87 | )% |
| | | | | | | | | | | | | | | | | | | | | | | | | | | | | |
| Consolidated Key Ratios (b) | | | | | | | | | | | | | | | | | | | | | | | | | | | | |
| NPL % | | | 1.01 | % | | | 1.10 | % | | | 1.20 | % | | | 1.20 | % | | | 1.25 | % | | | | | | | | |
| NPA % | | | 1.15 | | | | 1.25 | | | | 1.37 | | | | 1.37 | | | | 1.44 | | | | | | | | | |
| Net charge-offs % | | | 0.04 | | | | 0.28 | | | | 0.21 | | | | 0.23 | | | | 0.30 | | | | | | | | | |
| Allowance / loans | | | 1.19 | | | | 1.26 | | | | 1.31 | | | | 1.36 | | | | 1.43 | | | | | | | | | |
| Allowance / NPL | | | 1.17 | x | | | 1.15 | x | | | 1.09 | x | | | 1.14 | x | | | 1.14 | x | | | | | | | | |
| Allowance / NPA | | | 1.03 | x | | | 1.00 | x | | | 0.95 | x | | | 0.99 | x | | | 0.99 | x | | | | | | | | |
| Allowance / net charge-offs | | | NM | | | | 4.61 | x | | | 6.15 | x | | | 6.17 | x | | | 4.81 | x | | | | | | | | |
| | | | | | | | | | | | | | | | | | | | | | | | | | | | | |
| Other | | | | | | | | | | | | | | | | | | | | | | | | | | | | |
| Loans past due 90 days or more (c) | | $ | 40,591 | | | $ | 38,455 | | | $ | 39,077 | | | $ | 46,889 | | | $ | 50,699 | | | | 6 | % | | | (20 | )% |
| Guaranteed portion (c) | | | 16,631 | | | | 16,856 | | | | 16,221 | | | | 18,552 | | | | 24,036 | | | | (1 | )% | | | (31 | )% |
| Foreclosed real estate from government insured loans | | | 8,606 | | | | 9,460 | | | | 11,159 | | | | 10,096 | | | | 9,492 | | | | (9 | )% | | | (9 | )% |
| Period-end loans, net of unearned income (millions) | | | 17,687 | | | | 16,725 | | | | 16,937 | | | | 16,732 | | | | 16,230 | | | | 6 | % | | | 9 | % |
| NM - Not meaningful |
| * Amount is less than one percent. |
| (a) | Excludes foreclosed real estate from government-insured mortgages. |
| (b) | See Glossary of Terms for definitions of Consolidated Key Ratios. |
| (c) | Includes loans held-for-sale. |
FHN ASSET QUALITY: CONSOLIDATED
Quarterly, Unaudited
| | | | | | | | | | | | | | | | | | 4Q15 Changes vs. |
| | | 4Q15 | | | 3Q15 | | | 2Q15 | | | 1Q15 | | | 4Q14 | | | 3Q15 | | | 4Q14 | |
| | | | | | | | | | | | | | | | | | | | | | |
| Key Portfolio Details | | | | | | | | | | | | | | | | | | | | | |
| C&I | | | | | | | | | | | | | | | | | | | | | | | | | | | | |
| Period-end loans ($ millions) | | $ | 10,436 | | | $ | 9,610 | | | $ | 9,833 | | | $ | 9,638 | | | $ | 9,007 | | | | 9 | % | | | 16 | % |
| 30+ Delinq. % (a) | | | 0.08 | % | | | 0.09 | % | | | 0.08 | % | | | 0.07 | % | | | 0.05 | % | | | | | | | | |
| NPL % | | | 0.25 | | | | 0.31 | | | | 0.44 | | | | 0.35 | | | | 0.36 | | | | | | | | | |
| Charge-offs % (qtr. annualized) | | | NM | | | | 0.26 | | | | 0.17 | | | | 0.07 | | | | 0.19 | | | | | | | | | |
| Allowance / loans % | | | 0.71 | % | | | 0.74 | % | | | 0.80 | % | | | 0.70 | % | | | 0.74 | % | | | | | | | | |
| Allowance / charge-offs | | | NM | | | | 2.83 | x | | | 4.85 | x | | | 10.41 | x | | | 4.05 | x | | | | | | | | |
| | | | | | | | | | | | | | | | | | | | | | | | | | | | | |
| Commercial Real Estate | | | | | | | | | | | | | | | | | | | | | | | | | | | | |
| Period-end loans ($ millions) | | $ | 1,675 | | | $ | 1,488 | | | $ | 1,401 | | | $ | 1,321 | | | $ | 1,278 | | | | 13 | % | | | 31 | % |
| 30+ Delinq. % (a) (b) | | | 0.27 | % | | | 0.43 | % | | | 0.23 | % | | | 0.33 | % | | | 0.14 | % | | | | | | | | |
| NPL % | | | 0.52 | | | | 0.54 | | | | 0.84 | | | | 1.01 | | | | 1.20 | | | | | | | | | |
| Charge-offs % (qtr. annualized) | | | 0.29 | | | | NM | | | | 0.22 | | | | 0.03 | | | | NM | | | | | | | | | |
| Allowance / loans % | | | 1.50 | % | | | 1.70 | % | | | 1.53 | % | | | 1.34 | % | | | 1.45 | % | | | | | | | | |
| Allowance / charge-offs | | | 5.39 | x | | | NM | | | | 7.29 | x | | | 45.37 | x | | | NM | | | | | | | | | |
| | | | | | | | | | | | | | | | | | | | | | | | | | | | | |
| Consumer Real Estate | | | | | | | | | | | | | | | | | | | | | | | | | | | | |
| Period-end loans ($ millions) | | $ | 4,767 | | | $ | 4,814 | | | $ | 4,870 | | | $ | 4,923 | | | $ | 5,048 | | | | (1 | )% | | | (6 | )% |
| 30+ Delinq. % (a) | | | 1.00 | % | | | 0.92 | % | | | 0.94 | % | | | 0.98 | % | | | 1.10 | % | | | | | | | | |
| NPL % | | | 2.33 | | | | 2.32 | | | | 2.35 | | | | 2.43 | | | | 2.39 | | | | | | | | | |
| Charge-offs % (qtr. annualized) | | | 0.09 | | | | 0.18 | | | | NM | | | | 0.31 | | | | 0.38 | | | | | | | | | |
| Allowance / loans % | | | 1.69 | % | | | 1.71 | % | | | 1.75 | % | | | 2.22 | % | | | 2.24 | % | | | | | | | | |
| Allowance / charge-offs | | | NM | | | | 9.41 | x | | | NM | | | | 7.06 | x | | | 5.85 | x | | | | | | | | |
| | | | | | | | | | | | | | | | | | | | | | | | | | | | | |
| Permanent Mortgage | | | | | | | | | | | | | | | | | | | | | | | | | | | | |
| Period-end loans ($ millions) | | $ | 454 | | | $ | 464 | | | $ | 488 | | | $ | 512 | | | $ | 539 | | | | (2 | )% | | | (16 | )% |
| 30+ Delinq. % (a) | | | 2.11 | % | | | 2.01 | % | | | 2.26 | % | | | 2.76 | % | | | 1.72 | % | | | | | | | | |
| NPL % | | | 6.97 | | | | 7.30 | | | | 6.66 | | | | 6.43 | | | | 6.32 | | | | | | | | | |
| Charge-offs % (qtr. annualized) | | | NM | | | | 0.67 | | | | 0.11 | | | | 0.44 | | | | 1.00 | | | | | | | | | |
| Allowance / loans % | | | 4.17 | % | | | 4.33 | % | | | 4.59 | % | | | 3.94 | % | | | 3.55 | % | | | | | | | | |
| Allowance / charge-offs | | | NM | | | | 6.25 | x | | | 40.53 | x | | | 8.79 | x | | | 3.46 | x | | | | | | | | |
| | | | | | | | | | | | | | | | | | | | | | | | | | | | | |
| Credit Card and Other | | | | | | | | | | | | | | | | | | | | | | | | | | | | |
| Period-end loans ($ millions) | | $ | 355 | | | $ | 349 | | | $ | 346 | | | $ | 338 | | | $ | 358 | | | | 2 | % | | | (1 | )% |
| 30+ Delinq. % (a) | | | 1.08 | % | | | 1.19 | % | | | 1.09 | % | | | 1.20 | % | | | 1.42 | % | | | | | | | | |
| NPL % | | | 0.38 | | | | 0.21 | | | | 0.22 | | | | 0.22 | | | | 0.21 | | | | | | | | | |
| Charge-offs % (qtr. annualized) | | | 2.56 | | | | 2.79 | | | | 5.73 | | | | 3.51 | | | | 3.33 | | | | | | | | | |
| Allowance / loans % | | | 3.35 | % | | | 3.28 | % | | | 3.84 | % | | | 4.01 | % | | | 4.11 | % | | | | | | | | |
| Allowance / charge-offs | | | 1.30 | x | | | 1.16 | x | | | 0.66 | x | | | 1.10 | x | | | 1.24 | x | | | | | | | | |
| NM - Not meaningful |
| (a) | 30+ Delinquency % includes all accounts delinquent more than one month and still accruing interest. |
| (b) | 3Q15 increase was due to 2 purchased credit impaired loans from the 2013 MNB acquisition. |
FHN ASSET QUALITY: REGIONAL BANKING
Quarterly, Unaudited
| | | | | | | | | | | | | | | | | | 4Q15 Changes vs. |
| | | 4Q15 | | | 3Q15 | | | 2Q15 | | | 1Q15 | | | 4Q14 | | | 3Q15 | | | 4Q14 | |
| | | | | | | | | | | | | | | | | | | | | | |
| Total Regional Banking | | | | | | | | | | | | | | | | | | | | | |
| Period-end loans ($ millions) | | $ | 15,571 | | | $ | 14,483 | | | $ | 14,556 | | | $ | 14,200 | | | $ | 13,568 | | | | 8 | % | | | 15 | % |
| 30+ Delinq. % (a) | | | 0.23 | % | | | 0.25 | % | | | 0.21 | % | | | 0.24 | % | | | 0.22 | % | | | | | | | | |
| NPL % | | | 0.36 | | | | 0.35 | | | | 0.47 | | | | 0.45 | | | | 0.48 | | | | | | | | | |
| Charge-offs % (qtr. annualized) | | | NM | | | | 0.29 | | | | 0.29 | | | | 0.17 | | | | 0.20 | | | | | | | | | |
| Allowance / loans % | | | 0.88 | % | | | 0.89 | % | | | 0.91 | % | | | 0.89 | % | | | 0.93 | % | | | | | | | | |
| Allowance / charge-offs | | | NM | | | | 3.10 | x | | | 3.21 | x | | | 5.41 | x | | | 4.82 | x | | | | | | | | |
| | | | | | | | | | | | | | | | | | | | | | | | | | | | | |
| Key Portfolio Details | | | | | | | | | | | | | | | | | | | | | | | | | | | | |
| C&I | | | | | | | | | | | | | | | | | | | | | | | | | | | | |
| Period-end loans ($ millions) | | $ | 10,015 | | | $ | 9,178 | | | $ | 9,398 | | | $ | 9,185 | | | $ | 8,553 | | | | 9 | % | | | 17 | % |
| 30+ Delinq. % (a) | | | 0.08 | % | | | 0.10 | % | | | 0.08 | % | | | 0.07 | % | | | 0.05 | % | | | | | | | | |
| NPL % | | | 0.23 | | | | 0.18 | | | | 0.32 | | | | 0.24 | | | | 0.24 | | | | | | | | | |
| Charge-offs % (qtr. annualized) | | | NM | | | | 0.33 | | | | 0.18 | | | | 0.08 | | | | 0.21 | | | | | | | | | |
| Allowance / loans % | | | 0.72 | % | | | 0.72 | % | | | 0.78 | % | | | 0.68 | % | | | 0.72 | % | | | | | | | | |
| Allowance / charge-offs | | | NM | | | | 2.21 | x | | | 4.48 | x | | | 9.42 | x | | | 3.62 | x | | | | | | | | |
| | | | | | | | | | | | | | | | | | | | | | | | | | | | | |
| Commercial Real Estate | | | | | | | | | | | | | | | | | | | | | | | | | | | | |
| Period-end loans ($ millions) | | $ | 1,675 | | | $ | 1,488 | | | $ | 1,400 | | | $ | 1,320 | | | $ | 1,273 | | | | 13 | % | | | 32 | % |
| 30+ Delinq. % (a) (b) | | | 0.27 | % | | | 0.43 | % | | | 0.23 | % | | | 0.32 | % | | | 0.14 | % | | | | | | | | |
| NPL % | | | 0.52 | | | | 0.54 | | | | 0.84 | | | | 1.00 | | | | 1.14 | | | | | | | | | |
| Charge-offs % (qtr. annualized) | | | 0.31 | | | | NM | | | | 0.22 | | | | 0.03 | | | | NM | | | | | | | | | |
| Allowance / loans % | | | 1.50 | % | | | 1.70 | % | | | 1.53 | % | | | 1.33 | % | | | 1.43 | % | | | | | | | | |
| Allowance / charge-offs | | | 4.99 x | | | | NM | | | | 7.22 | x | | | 52.33 | x | | | NM | | | | | | | | | |
| | | | | | | | | | | | | | | | | | | | | | | | | | | | | |
| Consumer Real Estate | | | | | | | | | | | | | | | | | | | | | | | | | | | | |
| Period-end loans ($ millions) | | $ | 3,515 | | | $ | 3,469 | | | $ | 3,413 | | | $ | 3,358 | | | $ | 3,385 | | | | 1 | % | | | 4 | % |
| 30+ Delinq. % (a) | | | 0.52 | % | | | 0.48 | % | | | 0.47 | % | | | 0.55 | % | | | 0.57 | % | | | | | | | | |
| NPL % | | | 0.68 | | | | 0.75 | | | | 0.78 | | | | 0.84 | | | | 0.86 | | | | | | | | | |
| Charge-offs % (qtr. annualized) | | | 0.11 | | | | 0.11 | | | | 0.08 | | | | 0.15 | | | | 0.11 | | | | | | | | | |
| Allowance / loans % | | | 0.83 | % | | | 0.79 | % | | | 0.73 | % | | | 0.97 | % | | | 0.95 | % | | | | | | | | |
| Allowance / charge-offs | | | 7.68 | x | | | 7.62 | x | | | 9.73 | x | | | 6.45 | x | | | 8.55 | x | | | | | | | | |
| | | | | | | | | | | | | | | | | | | | | | | | | | | | | |
| Credit Card, Permanent Mortgage, and Other | | | | | | | | | | | | | | | | | | | | | | | | | | | | |
| Period-end loans ($ millions) | | $ | 366 | | | $ | 348 | | | $ | 345 | | | $ | 337 | | | $ | 357 | | | | 5 | % | | | 3 | % |
| 30+ Delinq. % (a) | | | 1.13 | % | | | 1.33 | % | | | 1.18 | % | | | 1.29 | % | | | 1.51 | % | | | | | | | | |
| NPL % | | | 0.29 | | | | 0.14 | | | | 0.14 | | | | 0.15 | | | | 0.14 | | | | | | | | | |
| Charge-offs % (qtr. annualized) (c) | | | 2.40 | | | | 2.49 | | | | 5.57 | | | | 3.22 | | | | 3.00 | | | | | | | | | |
| Allowance / loans % | | | 3.04 | % | | | 3.00 | % | | | 3.72 | % | | | 3.88 | % | | | 4.06 | % | | | | | | | | |
| Allowance / charge-offs | | | 1.29 | x | | | 1.19 | x | | | 0.66 | x | | | 1.16 | x | | | 1.36 | x | | | | | | | | |
| | | | | | | | | | | | | | | | | | | | | | | | | | | | | |
| ASSET QUALITY: CORPORATE | | | | | | | | | | | | | | | | | | | | | | | | | | | | |
| | | | | | | | | | | | | | | | | | | | | | | | | | | | | |
| Permanent Mortgage | | | | | | | | | | | | | | | | | | | | | | | | | | | | |
| Period-end loans ($ millions) | | $ | 97 | | | $ | 107 | | | $ | 113 | | | $ | 123 | | | $ | 136 | | | | (9 | )% | | | (29 | )% |
| 30+ Delinq. % (a) | | | 2.92 | % | | | 2.95 | % | | | 2.51 | % | | | 3.41 | % | | | 2.32 | % | | | | | | | | |
| NPL % | | | 1.72 | | | | 2.85 | | | | 2.72 | | | | 2.29 | | | | 2.25 | | | | | | | | | |
| Charge-offs % (qtr. annualized) | | | NM | | | | NM | | | | NM | | | | NM | | | | NM | | | | | | | | | |
| Allowance / loans % | | | NM | | | | NM | | | | NM | | | | NM | | | | NM | | | | | | | | | |
| Allowance / charge-offs | | | NM | | | | NM | | | | NM | | | | NM | | | | NM | | | | | | | | | |
| NM - Not meaningful |
| (a) | 30+ Delinquency % includes all accounts delinquent more than one month and still accruing interest. |
| (b) | 3Q15 increase was due to 2 purchased credit impaired loans from the 2013 MNB acquisition. |
| (c) | 2Q15 increase was primarily driven by charge-offs in a sub segment of the credit card portfolio which had previously been reserved for. |
FHN ASSET QUALITY: NON-STRATEGIC
Quarterly, Unaudited
| | | | | | | | | | | | | | | | | | 4Q15 Changes vs. |
| | | 4Q15 | | | 3Q15 | | | 2Q15 | | | 1Q15 | | | 4Q14 | | | 3Q15 | | | 4Q14 | |
| | | | | | | | | | | | | | | | | | | | | | | | | | | | | |
| Total Non-Strategic | | | | | | | | | | | | | | | | | | | | | | | | | | | | |
| Period-end loans ($ millions) | | $ | 2,018 | | | $ | 2,135 | | | $ | 2,268 | | | $ | 2,409 | | | $ | 2,527 | | | | (5 | )% | | | (20 | )% |
| 30+ Delinq. % (a) | | | 1.77 | % | | | 1.57 | % | | | 1.67 | % | | | 1.67 | % | | | 1.67 | % | | | | | | | | |
| NPL % | | | 5.99 | | | | 6.08 | | | | 5.77 | | | | 5.55 | | | | 5.37 | | | | | | | | | |
| Charge-offs % (qtr. annualized) | | | 0.83 | | | | 0.19 | | | | NM | | | | 0.55 | | | | 0.85 | | | | | | | | | |
| Allowance / loans % | | | 3.60 | % | | | 3.83 | % | | | 3.91 | % | | | 4.25 | % | | | 4.18 | % | | | | | | | | |
| Allowance / charge-offs | | | 4.20 | x | | | 19.80 | x | | | NM | | | | 7.48 | x | | | 4.79 | x | | | | | | | | |
| | | | | | | | | | | | | | | | | | | | | | | | | | | | | |
| Key Portfolio Details | | | | | | | | | | | | | | | | | | | | | | | | | | | | |
| Commercial | | | | | | | | | | | | | | | | | | | | | | | | | | | | |
| Period-end loans ($ millions) | | $ | 422 | | | $ | 432 | | | $ | 435 | | | $ | 454 | | | $ | 459 | | | | (2 | )% | | | (8 | )% |
| 30+ Delinq. % (a) | | | 0.02 | % | | | 0.02 | % | | | 0.02 | % | | | 0.10 | % | | | 0.05 | % | | | | | | | | |
| NPL % | | | 0.83 | | | | 3.08 | | | | 3.07 | | | | 2.70 | | | | 2.78 | | | | | | | | | |
| Charge-offs % (qtr. annualized) | | | 3.87 | | | | NM | | | | NM | | | | NM | | | | NM | | | | | | | | | |
| Allowance / loans % | | | 0.34 | % | | | 1.35 | % | | | 1.24 | % | | | 1.10 | % | | | 1.18 | % | | | | | | | | |
| Allowance / charge-offs | | | 0.09 | x | | | NM | | | | NM | | | | NM | | | | NM | | | | | | | | | |
| | | | | | | | | | | | | | | | | | | | | | | | | | | | | |
| Consumer Real Estate | | | | | | | | | | | | | | | | | | | | | | | | | | | | |
| Period-end loans ($ millions) | | $ | 1,251 | | | $ | 1,345 | | | $ | 1,458 | | | $ | 1,565 | | | $ | 1,663 | | | | (7 | )% | | | (25 | )% |
| 30+ Delinq. % (a) | | | 2.34 | % | | | 2.07 | % | | | 2.06 | % | | | 1.92 | % | | | 2.17 | % | | | | | | | | |
| NPL % | | | 6.97 | | | | 6.36 | | | | 6.03 | | | | 5.83 | | | | 5.51 | | | | | | | | | |
| Charge-offs % (qtr. annualized) | | | 0.04 | | | | 0.37 | | | | NM | | | | 0.64 | | | | 0.91 | | | | | | | | | |
| Allowance / loans % | | | 4.12 | % | | | 4.09 | % | | | 4.14 | % | | | 4.90 | % | | | 4.86 | % | | | | | | | | |
| Allowance / charge-offs | | | NM | | | | 10.67 | x | | | NM | | | | 7.36 | x | | | 5.19 | x | | | | | | | | |
| | | | | | | | | | | | | | | | | | | | | | | | | | | | | |
| Permanent Mortgage | | | | | | | | | | | | | | | | | | | | | | | | | | | | |
| Period-end loans ($ millions) | | $ | 336 | | | $ | 348 | | | $ | 365 | | | $ | 379 | | | $ | 393 | | | | (3 | )% | | | (15 | )% |
| 30+ Delinq. % (a) | | | 1.88 | % | | | 1.58 | % | | | 2.12 | % | | | 2.50 | % | | | 1.40 | % | | | | | | | | |
| NPL % | | | 8.80 | | | | 8.71 | | | | 7.92 | | | | 7.82 | | | | 7.78 | | | | | | | | | |
| Charge-offs % (qtr. annualized) | | | NM | | | | 0.90 | | | | 0.14 | | | | 0.59 | | | | 1.44 | | | | | | | | | |
| Allowance / loans % | | | 5.61 | % | | | 5.75 | % | | | 6.11 | % | | | 5.32 | % | | | 4.83 | % | | | | | | | | |
| Allowance / charge-offs | | | NM | | | | 6.23 | x | | | 44.22 | x | | | 8.82 | x | | | 3.30 | x | | | | | | | | |
| | | | | | | | | | | | | | | | | | | | | | | | | | | | | |
| Other Consumer | | | | | | | | | | | | | | | | | | | | | | | | | | | | |
| Period-end loans ($ millions) | | $ | 9 | | | $ | 10 | | | $ | 10 | | | $ | 11 | | | $ | 12 | | | | (10 | )% | | | (25 | )% |
| 30+ Delinq. % (a) | | | 1.47 | % | | | 1.77 | % | | | 1.31 | % | | | 1.40 | % | | | 2.48 | % | | | | | | | | |
| NPL % | | | 7.28 | | | | 7.09 | | | | 6.86 | | | | 6.66 | | | | 6.22 | | | | | | | | | |
| Charge-offs % (qtr. annualized) | | | 5.37 | | | | 10.22 | | | | 5.97 | | | | 9.24 | | | | 8.21 | | | | | | | | | |
| Allowance / loans % | | | 9.07 | % | | | 10.34 | % | | | 4.95 | % | | | 4.69 | % | | | 3.43 | % | | | | | | | | |
| Allowance / charge-offs | | | 1.67 | x | | | 0.98 | x | | | 0.81 | x | | | 0.49 | x | | | 0.41 | x | | | | | | | | |
Certain previously reported amounts have been reclassified to agree with current presentation.
NM - Not meaningful
| (a) | 30+ Delinquency % includes all accounts delinquent more than one month and still accruing interest. |
FHN: PORTFOLIO METRICS
Unaudited
C&I Portfolio: $10.4 Billion (59.0% of Total Loans) as of December 31, 2015
| | | | | | % OS | |
| | General Corporate, Commercial, and Business Banking Loans | | | | | 79 | % | |
| | Loans to Mortgage Companies | | | | | 17 | % | |
| | Trust Preferred Loans | | | | | 3 | % | |
| | Bank Holding Company Loans | | | | | 1 | % | |
Consumer Real Estate (primarily Home Equity) Portfolio: $4.8 Billion (27.0% of Total Loans)
| Origination LTV and FICO for Portfolio as of December 31, 2015 | Loan-to-Value | |
| (excludes whole loan insurance) | <=60% | >60% - <=80% | >80% - 90% | | >90% | |
| | FICO score greater than or equal to 740 | 11% | | 23% | | 17% | | 11% | |
| | FICO score 720-739 | 1% | | 4% | | 4% | | 3% | |
| | FICO score 700-719 | 1% | | 3% | | 3% | | 2% | |
| | FICO score 660-699 | 1% | | 4% | | 3% | | 3% | |
| | FICO score 620-659 | 1% | | 1% | | 1% | | 1% | |
| | FICO score less than 620 | —% | | 1% | | —% | | 1% | |
| Origination LTV and FICO for Portfolio - Regional Bank as of December 31, 2015 | Loan-to-Value | |
| (excludes whole loan insurance) | <=60% | >60% - <=80% | >80% - 90% | | >90% | |
| | FICO score greater than or equal to 740 | 12% | | 24% | | 17% | | 13% | |
| | FICO score 720-739 | 1% | | 4% | | 4% | | 3% | |
| | FICO score 700-719 | 1% | | 3% | | 2% | | 2% | |
| | FICO score 660-699 | 1% | | 3% | | 3% | | 2% | |
| | FICO score 620-659 | 1% | | 1% | | 1% | | —% | |
| | FICO score less than 620 | —% | | 1% | | —% | | 1% | |
| Origination LTV and FICO for Portfolio - Non-Strategic as of December 31, 2015 | Loan-to-Value | |
| (excludes whole loan insurance) | <=60% | >60% - <=80% | >80% - 90% | | >90% | |
| | FICO score greater than or equal to 740 | 7% | | 21% | | 15% | | 5% | |
| | FICO score 720-739 | 2% | | 6% | | 6% | | 2% | |
| | FICO score 700-719 | 2% | | 6% | | 6% | | 2% | |
| | FICO score 660-699 | 2% | | 5% | | 4% | | 4% | |
| | FICO score 620-659 | —% | | 1% | | 2% | | 1% | |
| | FICO score less than 620 | —% | | —% | | —% | | 1% | |
Consumer Real Estate Portfolio Detail:
| | | | | Origination Characteristics | |
| | Vintage | Balances ($B) | | W/A Age (mo.) | | CLTV | | FICO | | % TN | | % 1st lien | |
| | pre-2003 | $0.1 | | 167 | | 77% | | 703 | | 40% | | 30% | |
| | 2003 | $0.1 | | 150 | | 77% | | 717 | | 29% | | 35% | |
| | 2004 | $0.2 | | 137 | | 80% | | 718 | | 19% | | 28% | |
| | 2005 | $0.4 | | 125 | | 82% | | 725 | | 15% | | 16% | |
| | 2006 | $0.4 | | 114 | | 79% | | 730 | | 21% | | 18% | |
| | 2007 | $0.5 | | 102 | | 81% | | 737 | | 26% | | 19% | |
| | 2008 | $0.2 | | 91 | | 75% | | 745 | | 73% | | 50% | |
| | 2009 | $0.1 | | 79 | | 72% | | 747 | | 86% | | 57% | |
| | 2010 | $0.2 | | 65 | | 79% | | 752 | | 92% | | 72% | |
| | 2011 | $0.3 | | 53 | | 77% | | 760 | | 89% | | 86% | |
| | 2012 | $0.6 | | 42 | | 77% | | 764 | | 90% | | 91% | |
| | 2013 | $0.5 | | 31 | | 78% | | 755 | | 86% | | 85% | |
| | 2014 | $0.5 | | 18 | | 81% | | 757 | | 86% | | 89% | |
| | 2015 | $0.7 | | 6 | | 80% | | 758 | | 81% | | 88% | |
| | Total | $4.8 | | 64 | | 79% | | 747 (a) | | 64% | | 62% | |
| (a) | 747 average portfolio origination FICO; 743 weighted average portfolio FICO (refreshed). |
FHN NON-GAAP TO GAAP RECONCILIATION
Quarterly, Unaudited
| | | | | | | | | | | | | | | | |
| (Dollars and shares in thousands, except per share data) | | 4Q15 | | | 3Q15 | | | 2Q15 | | | 1Q15 | | | 4Q14 | |
| Tangible Common Equity (Non-GAAP) | | | | | | | | | | | | | | | | | | | | |
| (A) Total equity (GAAP) | | $ | 2,639,586 | | | $ | 2,580,245 | | | $ | 2,517,905 | | | $ | 2,499,257 | | | $ | 2,581,590 | |
| Less: Noncontrolling interest (a) | | | 295,431 | | | | 295,431 | | | | 295,431 | | | | 295,431 | | | | 295,431 | |
| Less: Preferred stock | | | 95,624 | | | | 95,624 | | | | 95,624 | | | | 95,624 | | | | 95,624 | |
| (B) Total common equity | | $ | 2,248,531 | | | $ | 2,189,190 | | | $ | 2,126,850 | | | $ | 2,108,202 | | | $ | 2,190,535 | |
| Less: Intangible assets (GAAP) (b) | | | 217,522 | | | | 171,556 | | | | 172,854 | | | | 174,152 | | | | 175,450 | |
| (C) Tangible common equity (Non-GAAP) | | $ | 2,031,009 | | | $ | 2,017,634 | | | $ | 1,953,996 | | | $ | 1,934,050 | | | $ | 2,015,085 | |
| | | | | | | | | | | | | | | | | | | | | |
| Tangible Assets (Non-GAAP) | | | | | | | | | | | | | | | | | | | | |
| (D) Total assets (GAAP) | | $ | 26,195,136 | | | $ | 25,387,319 | | | $ | 25,239,767 | | | $ | 25,715,888 | | | $ | 25,668,187 | |
| Less: Intangible assets (GAAP) (b) | | | 217,522 | | | | 171,556 | | | | 172,854 | | | | 174,152 | | | | 175,450 | |
| (E) Tangible assets (Non-GAAP) | | $ | 25,977,614 | | | $ | 25,215,763 | | | $ | 25,066,913 | | | $ | 25,541,736 | | | $ | 25,492,737 | |
| | | | | | | | | | | | | | | | | | | | | |
| Average Tangible Common Equity (Non-GAAP) | | | | | | | | | | | | | | | | | | | | |
| (F) Average total equity (GAAP) | | $ | 2,659,575 | | | $ | 2,545,544 | | | $ | 2,511,929 | | | $ | 2,607,521 | | | $ | 2,651,729 | |
| Less: Average noncontrolling interest (a) | | | 295,431 | | | | 295,431 | | | | 295,431 | | | | 295,431 | | | | 295,431 | |
| Less: Average preferred stock | | | 95,624 | | | | 95,624 | | | | 95,624 | | | | 95,624 | | | | 95,624 | |
| (G) Total average common equity | | $ | 2,268,520 | | | $ | 2,154,489 | | | $ | 2,120,874 | | | $ | 2,216,466 | | | $ | 2,260,674 | |
| Less: Average intangible assets (GAAP) (b) | | | 211,757 | | | | 172,191 | | | | 173,486 | | | | 174,787 | | | | 165,769 | |
| (H) Average tangible common equity (Non-GAAP) | | $ | 2,056,763 | | | $ | 1,982,298 | | | $ | 1,947,388 | | | $ | 2,041,679 | | | $ | 2,094,905 | |
| | | | | | | | | | | | | | | | | | | | | |
| Annualized Net Income/(Loss) Available to Common Shareholders | | | | | | | | | | | | | | | | | | | | |
| (I) Net income/(loss) available to common shareholders (annualized) | | $ | 186,590 | | | $ | 233,302 | | | $ | 202,780 | | | $ | (311,114 | ) | | $ | 186,904 | |
| | | | | | | | | | | | | | | | | | | | | |
| Period-end Shares Outstanding | | | | | | | | | | | | | | | | | | | | |
| (J) Period-end shares outstanding | | | 238,587 | | | | 234,237 | | | | 234,021 | | | | 233,499 | | | | 234,220 | |
| | | | | | | | | | | | | | | | | | | | | |
| Tier 1 Common (Non-GAAP) | | | | | | | | | | | | | | | | | | | | |
| (K) Tier 1 capital (c) | | | (f) | | | | (f) | | | | (f) | | | | (f) | | | $ | 2,813,503 | |
| Less: Noncontrolling interest - FTBNA preferred stock (d) | | | (f) | | | | (f) | | | | (f) | | | | (f) | | | | 294,816 | |
| Less: Preferred Stock | | | (f) | | | | (f) | | | | (f) | | | | (f) | | | | 95,624 | |
| Less: Trust preferred (e) | | | (f) | | | | (f) | | | | (f) | | | | (f) | | | | 200,000 | |
| (L) Tier 1 common (Non-GAAP) | | | (f) | | | | (f) | | | | (f) | | | | (f) | | | $ | 2,223,063 | |
| | | | | | | | | | | | | | | | | | | | | |
| Risk Weighted Assets | | | | | | | | | | | | | | | | | | | | |
| (M) Risk weighted assets (c) | | | (f) | | | | (f) | | | | (f) | | | | (f) | | | $ | 19,452,656 | |
| | | | | | | | | | | | | | | | | | | | | |
| Ratios | | | | | | | | | | | | | | | | | | | | |
| (I)/(H) Return on average tangible common equity (“ROTCE”) (Non-GAAP) | | | 9.07 | % | | | 11.77 | % | | | 10.41 | % | | | (15.24 | )% | | | 8.92 | % |
| (I)/(G) Return on common equity (GAAP) | | | 8.23 | % | | | 10.83 | % | | | 9.56 | % | | | (14.04 | )% | | | 8.27 | % |
| (C)/(E) Tangible common equity to tangible assets (“TCE/TA”) (Non-GAAP) | | | 7.82 | % | | | 8.00 | % | | | 7.80 | % | | | 7.57 | % | | | 7.90 | % |
| (A)/(D) Total equity to total assets (GAAP) | | | 10.08 | % | | | 10.16 | % | | | 9.98 | % | | | 9.72 | % | | | 10.06 | % |
| (C)/(J) Tangible book value per common share (Non-GAAP) | | $ | 8.51 | | | $ | 8.61 | | | $ | 8.35 | | | $ | 8.28 | | | $ | 8.60 | |
| (B)/(J) Book value per common share (GAAP) | | $ | 9.42 | | | $ | 9.35 | | | $ | 9.09 | | | $ | 9.03 | | | $ | 9.35 | |
| (L)/(M) Tier 1 common to risk weighted assets (Non-GAAP) | | | (f) | | | | (f) | | | | (f) | | | | (f) | | | | 11.43 | % |
| (K)/(D) Tier 1 capital to total assets (GAAP) | | | (f) | | | | (f) | | | | (f) | | | | (f) | | | | 10.96 | % |
Certain previously reported amounts have been reclassified to agree with current presentation.
| (a) | Included in Total equity on the Consolidated Balance Sheet. |
| (b) | Includes goodwill and other intangible assets, net of amortization. |
| (c) | Defined by and calculated in conformity with bank regulations. |
| (d) | Represents FTBNA preferred stock included in noncontrolling interest. |
| (e) | Included in Term borrowings on the Consolidated Balance Sheet. |
| (f) | In periods prior to 1Q15, these measures were used to reconcile non-GAAP to GAAP information. |
FHN GLOSSARY OF TERMS
Average Assets for Leverage:The amount of assets a company uses to calculate the leverage ratio, which includes average total assets less disallowed portions of goodwill, other intangibles, and deferred tax assets, as well as certain other regulatory adjustments made to tier 1 capital.
Common Equity Tier 1:A measure of a company’s capital position under U.S. Basel III capital rules first applicable to FHN in 2015, which includes common equity less goodwill, other intangibles and certain other required regulatory deductions as defined in those rules. Common Equity Tier 1 capital under U.S. Basel III in 2015 is not the same as the non-regulatory Tier 1 Common capital commonly used prior to 2015; comparisons between the two are not meaningful.
Core Businesses:Management considers regional banking, fixed income, and corporate as FHN’s core businesses. Non-strategic has significant legacy assets and operations that are being wound down.
Fully Taxable Equivalent (“FTE”):Reflects the amount of tax-exempt income adjusted to a level that would yield the same after-tax income had that income been subject to taxation.
Tier 1 Capital Ratio: Ratio consisting of shareholders’ equity adjusted for certain unrealized gains/(losses) on available-for-sale securities, reduced by goodwill, certain other intangible assets, the disallowable portion of mortgage servicing rights and other disallowed assets divided by risk-adjusted assets. The components of Tier 1 capital, including the risk-adjustment of assets, changed significantly for FHN beginning in 2015 so that comparisons of a Tier 1 capital ratio after 2014 with a ratio prior to 2015 may not be meaningful.
Tier 1 Common: A measure of a company’s capital position associated with U.S. capital rules applicable to FHN prior to 2015, which includes Tier 1 capital as then defined less preferred stock amounts.
Troubled Debt Restructuring (“TDR”):A restructuring of debt whereby a creditor for economic or legal reasons related to the borrower’s financial difficulties grants a concession to the borrower that it would not otherwise consider. Such concession is granted in an attempt to protect as much of the creditor’s investment as possible by increasing the probability of repayment.
Key Ratios
Return on Average Assets:Ratio is annualized net income to average total assets.
Return on Average Common Equity: Ratio is annualized net income available to common shareholders to average common equity.
Return on Average Tangible Common Equity: Ratio is annualized net income available to common shareholders to average tangible common equity.
Fee Income to Total Revenue:Ratio is fee income excluding securities gains/(losses) to total revenue excluding securities gains/(losses).
Efficiency Ratio:Ratio is noninterest expense to total revenue excluding securities gains/(losses).
Leverage Ratio:Ratio is tier 1 capital to average assets for leverage.
Asset Quality - Consolidated Key Ratios
NPL %:Ratio is nonperforming loans in the loan portfolio to total period-end loans.
NPA %: Ratio is nonperforming assets related to the loan portfolio to total period-end loans plus foreclosed real estate and other assets.
Net charge-offs %:Ratio is annualized net charge-offs to total average loans.
Allowance / loans:Ratio is allowance for loan losses to total period-end loans.
Allowance / NPL:Ratio is allowance for loan losses to nonperforming loans in the loan portfolio.
Allowance / NPA: Ratio is allowance for loan losses to nonperforming assets related to the loan portfolio.
Allowance / charge-offs: Ratio is allowance for loan losses to annualized net charge-offs.

First Horizon National Corporation Fourth Quarter 2015 Earnings January 19, 2016
2 ▪ Portions of this presentation use non - GAAP financial information. Each of those portions is so noted, and a reconciliation of that non - GAAP information to comparable GAAP information is provided in a footnote or in the appendix at the end of this presentation. ▪ This presentation contains forward - looking statements, which may include guidance, involving significant risks and uncertainties which will be identified by words such as “ believe”,“expect”,“anticipate”,“intend”,“estimate ”, “ should”,“is likely”,“will”,“going forward” and other expressions that indicate future events and trends and may be followed by or reference cautionary statements. A number of factors could cause actual results to differ materially from those in the forward - looking statements. These factors are outlined in our recent earnings and other press releases and in more detail in the most current 10 - Q and 10 - K. FHN disclaims any obligation to update any such forward - looking statements or to publicly announce the result of any revisions to any of the forward - looking statements to reflect future events or developments.

3 2015 Accomplishments Building Franchise Value ▪ Increased dividend by 20% in 1Q15 ▪ Closed TrustAtlantic Financial acquisition in 4Q15 ▪ Repurchased $28mm or 2mm shares in 2015; $133mm authorization remaining Non - Strategic Headwind Abating Strong Core Businesses Performance All comparisons are from 2014 to 2015. Smartly Deploying Capital Regional Banking ▪ Regional Banking loans up 13% ▪ Regional Banking average core deposits up 13% ▪ Added 18 new bankers across all markets and specialty lending areas Fixed Income ▪ Average Daily Revenues increased 15% ▪ FTN finished 2015 as #1 global underwriter of callable GSE debt ▪ Continued expansion of fixed income sales force with 10 strategic new hires ▪ Settled DOJ/HUD litigation in April 2015 ▪ Non - strategic loans declined to 14% of total average loans from 18% in 2014 ▪ Non - strategic portfolio loan yield at 3.70% with net charge - offs of 33bps in 2015

FINANCIAL RESULTS 4
$ in millions Financial Results Actuals FY 2014 FY 2015 vs Financial Results 5 Numbers may not add to total due to rounding. * Amount is less than 1% 1 Adjusted Fee Income, Adjusted Expense and Adjusted Net Income Available to Common Shareholders are Non - GAAP numbers and are reco nciled in the appendix. Net Interest Income Fee Income Loan Loss Provision 4Q15 $167 Expense $132 $1 $244 4Q15 vs +5% +11% - 83% +18% FY 2015 $654 $517 $9 $1,054 3Q15 +2% +6% * +13% 4Q14 Net Income Available to Common Shareholders $47 $80 * - 20% Total Average Loans ($B) Total Average Core Deposits ($B) $16.9 $16.6 +7% +2% $19.0 $18.4 +14% +2% ▪ Balance sheet growth trends strong ▪ Revenue growth driven by regional bank loan growth and higher fixed income ▪ Expense growth driven by various notable items; core run rate trends solid ▪ Loan loss provision reflects lower charge - offs and continued stable credit quality +4% - 6% - 67% +27% - 63% +7% +15% Adjusted Expense 1 $132 $512 +11% +11% +6% Adjusted Net Income Available to Common Shareholders 1 $224 $866 +8% +6% +3% Adjusted Fee Income 1 $51 $191 +8% +5% +12%
2015 Adjusted Results Numbers may not add to total due to rounding. 1 Notable items after - tax impact calculated using ~39% incremental tax rate. EPS impacts calculated by dividing the after - tax impact by the 240 million diluted shares outstanding in 4Q15 and 236 million sh ares outstanding in 2015. 2 Adjusted NIAC and Adjusted EPS are Non - GAAP numbers and reconciled in the table. 3 2014 Adjusted, Adjusted Fee Income, Adjusted Expense and 2015 Adjusted are Non - GAAP numbers and are reconciled in the appendix. 6 Reported Results ($ in millions) Reported Net Income Available to Common Shareholders / EPS Litigation Settlements/Accruals Employee Benefit Plan Amendment Impairment of Tax Credit Investment Acquisition Related Expenses Adjusted Results Notable Items After - Tax Impact 1 Retirement of TRUPs Debt 4Q 15 $47 $(8.7) $(1.7) $(1.7) $0.20 Amounts $5.1 FY 20 15 $80 $(115.4) $(1.7) $(3.1) $3.6 $0.34 Amounts NIAC / EPS 2 $51 $0.21 $191 $0.81 Adjusted Pre - Tax Income Walk - Forward from 2014 to 2015 EPS EPS Effective Tax Rate Differential $8.1 $ 245 Net Interest Income $26 Adjusted Fee Income³ $29 Adjusted Expense³ $27 Loan Loss Provision $18 $290 $150 $200 $250 $300 $350 2014 Adjusted Pre-Tax Income³ 2015 Adjusted Pre-Tax Income³ 18% growth $(0.01) $(0.47) $350mm
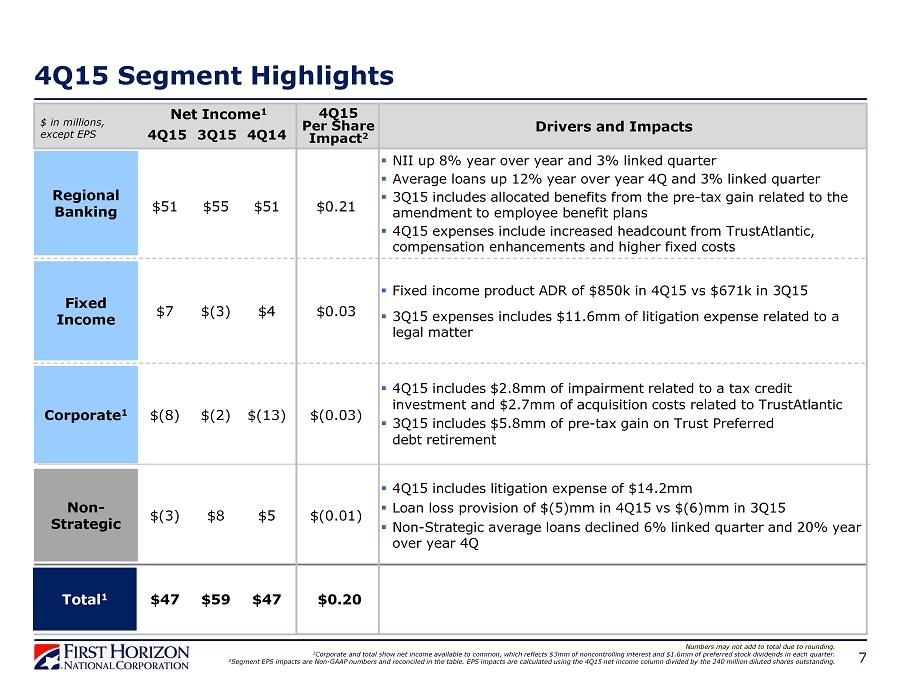
4Q15 Segment Highlights 7 Drivers and Impacts Net Income 1 $ in millions, except EPS 4Q15 Per Share Impact 2 Regional Banking Fixed Income Corporate 1 Non - Strategic Total 1 3Q15 $55 $(3) $(2) $8 $59 4Q14 $51 $4 $(13) $5 $47 4Q15 $51 $7 $(8) $(3) $47 $0.21 $0.03 $(0.03) $(0.01) $0.20 ▪ Fixed income product ADR of $850k in 4Q15 vs $671k in 3Q15 ▪ 3Q15 expenses includes $11.6mm of litigation expense related to a legal matter ▪ 4Q15 includes litigation expense of $14.2mm ▪ Loan loss provision of $(5)mm in 4Q15 vs $(6)mm in 3Q15 ▪ Non - Strategic average loans declined 6% linked quarter and 20% year over year 4Q ▪ NII up 8% year over year and 3% linked quarter ▪ Average loans up 12% year over year 4Q and 3% linked quarter ▪ 3Q15 includes allocated benefits from the pre - tax gain related to the amendment to employee benefit plans ▪ 4Q15 expenses include increased headcount from TrustAtlantic , compensation enhancements and higher fixed costs Numbers may not add to total due to rounding. 1 Corporate and total show net income available to common, which reflects $3mm of noncontrolling interest and $1.6mm of preferr ed stock dividends in each quarter. 2 Segment EPS impacts are Non - GAAP numbers and reconciled in the table. EPS impacts are calculated using the 4Q15 net income colum n divided by the 240 million diluted shares outstanding. ▪ 4Q15 includes $2.8mm of impairment related to a tax credit investment and $2.7mm of acquisition costs related to TrustAtlantic ▪ 3Q15 includes $5.8mm of pre - tax gain on Trust Preferred debt retirement
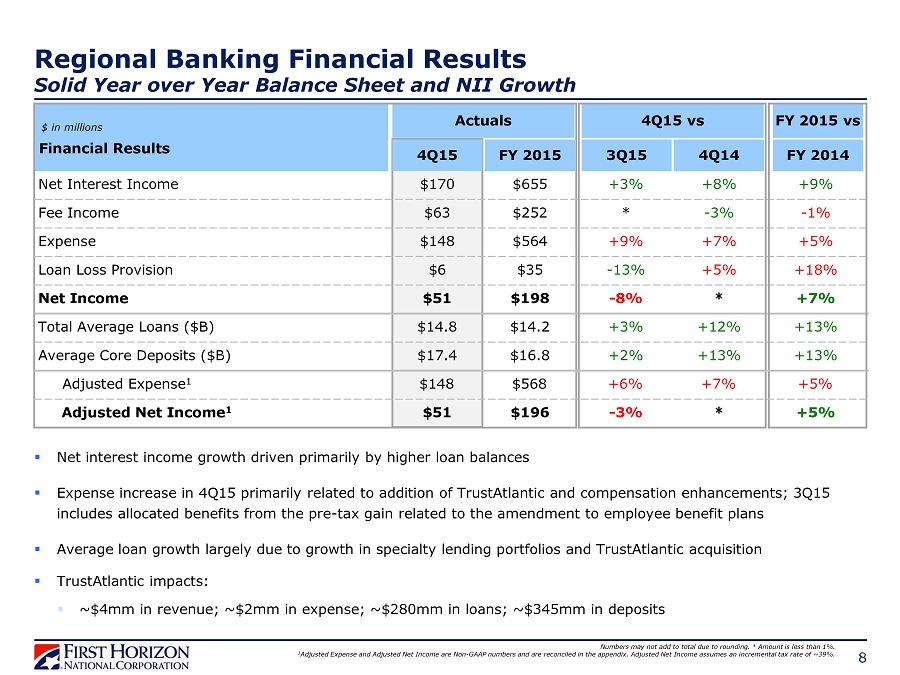
Regional Banking Financial Results Solid Year over Year Balance Sheet and NII Growth 8 ▪ Net interest income growth driven primarily by higher loan balances ▪ Expense increase in 4Q15 primarily related to addition of TrustAtlantic and compensation enhancements; 3Q15 includes allocated benefits from the pre - tax gain related to the amendment to employee benefit plans ▪ Average loan growth largely due to growth in specialty lending portfolios and TrustAtlantic acquisition ▪ TrustAtlantic impacts: ▪ ~$4mm in revenue; ~$2mm in expense; ~$280mm in loans; ~$345mm in deposits Numbers may not add to total due to rounding. * Amount is less than 1%. 1 Adjusted Expense and Adjusted Net Income are Non - GAAP numbers and are reconciled in the appendix. Adjusted Net Income assumes an incremental tax rate of ~39%. $ in millions Financial Results Actuals FY 2014 FY 2015 vs Net Interest Income Fee Income Expense 4Q15 $170 Loan Loss Provision $63 $148 $6 4Q15 vs +8% - 3% +7% +5% FY 2015 $655 $252 $564 $35 3Q15 +3% * +9% - 13% 4Q14 Net Income $51 $198 * - 8% Total Average Loans ($B) Average Core Deposits ($B) $14.8 $14.2 +12% +3% $17.4 $16.8 +13% +2% +9% - 1% +5% +18% +7% +13% +13% Adjusted Net Income 1 $51 * $196 - 3% +5% Adjusted Expense 1 $148 +7% $568 +6% +5%
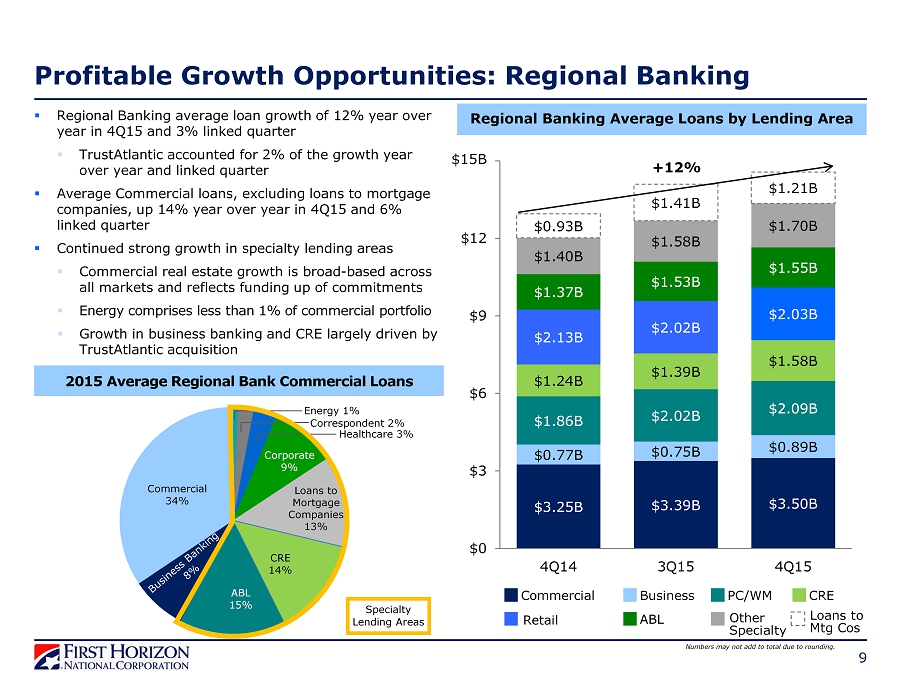
$3.25B $3.39B $3.50B $0.77B $0.75B $0.89B $1.86B $2.02B $2.09B $1.24B $1.39B $1.58B $2.13B $2.02B $2.03B $1.37B $1.53B $1.55B $1.40B $1.58B $1.70B $0.93B $1.41B $1.21B 4Q14 3Q15 4Q15 $0 $3 $6 $9 $12 $15 9 Profitable Growth Opportunities: Regional Banking Regional Banking Average Loans by Lending Area ▪ Regional Banking average loan growth of 12% year over year in 4Q15 and 3% linked quarter ▪ TrustAtlantic accounted for 2% of the growth year over year and linked quarter ▪ Average Commercial loans, excluding loans to mortgage companies, up 14% year over year in 4Q15 and 6% linked quarter ▪ Continued strong growth in specialty lending areas ▪ Commercial real estate growth is broad - based across all markets and reflects funding up of commitments ▪ Energy comprises less than 1% of commercial portfolio ▪ Growth in business banking and CRE largely driven by TrustAtlantic acquisition $15B Commercial Business PC/WM CRE Retail ABL Loans to Mtg Cos Numbers may not add to total due to rounding. Other Specialty 2015 Average Regional Bank Commercial Loans Corporate 9% CRE 14% ABL 15% Commercial 34% Healthcare 3% Correspondent 2% Energy 1% Specialty Lending Areas Loans to Mortgage Companies 13% +12%
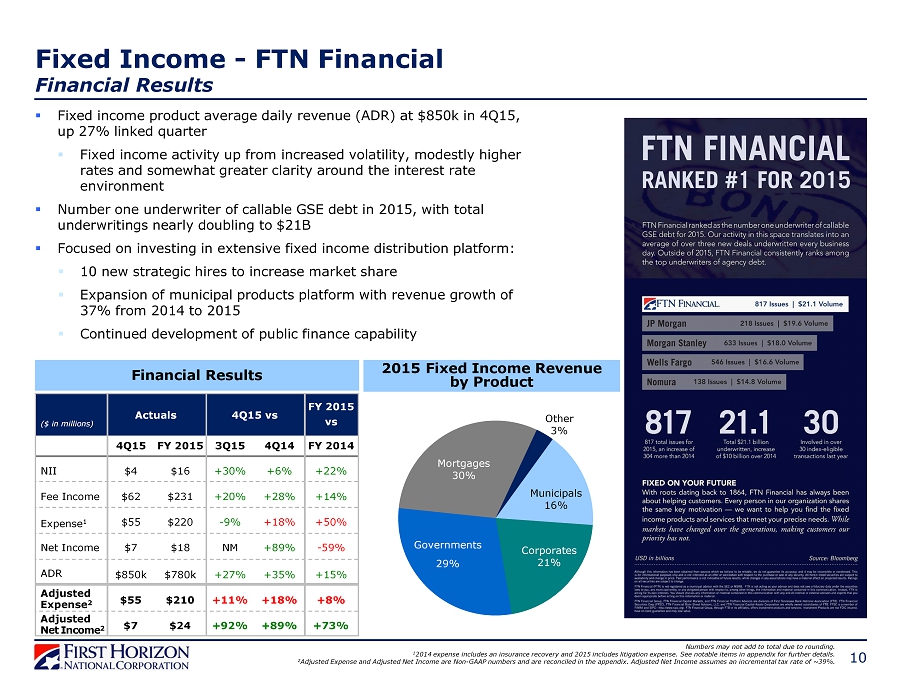
Adjusted Net Income 2 10 Fixed Income - FTN Financial Financial Results Numbers may not add to total due to rounding. 1 2014 expense includes an insurance recovery and 2015 includes litigation expense. See notable items in appendix for further d eta ils. 2 Adjusted Expense and Adjusted Net Income are Non - GAAP numbers and are reconciled in the appendix. Adjusted Net Income assumes an incremental tax rate of ~39%. ▪ Fixed income product average daily revenue (ADR) at $850k in 4Q15, up 27% linked quarter ▪ Fixed income activity up from increased volatility, modestly higher rates and somewhat greater clarity around the interest rate environment ▪ Number one underwriter of callable GSE debt in 2015, with total underwritings nearly doubling to $21B ▪ Focused on investing in extensive fixed income distribution platform: ▪ 10 new strategic hires to increase market share ▪ Expansion of municipal products platform with revenue growth of 37% from 2014 to 2015 ▪ Continued development of public finance capability 2015 Fixed Income Revenue by Product Financial Results Other 3% Municipals 16% Corporates 21% Mortgages 30% Governments 29% Fee Income ADR $850k Expense 1 Net Income $7 $55 $4 $62 ($ in millions) NII 4Q15 $780k $18 $220 $16 $231 FY 2015 +27% NM - 9% +30% +20% 3Q15 +35% +89% +18% +6% +28% 4Q14 +15% - 59% +50% +22% +14% FY 2014 FY 2015 vs 4Q15 vs Actuals Adjusted Expense 2 $55 $210 +11% +18% +8% $7 $24 +92% +89% +73%
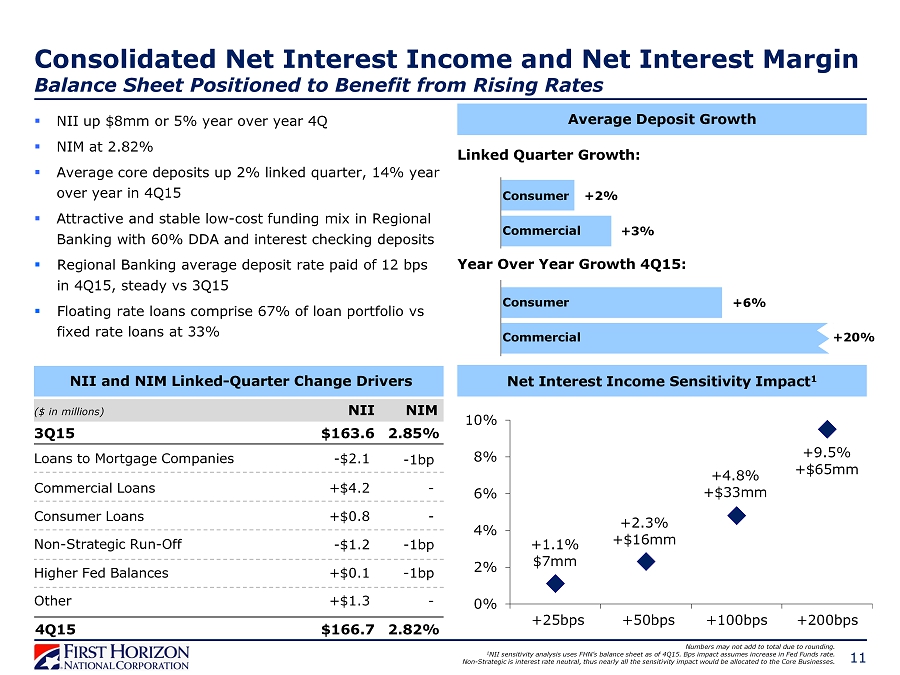
11 Net Interest Income Sensitivity Impact 1 Consolidated Net Interest Income and Net Interest Margin Balance Sheet Positioned to Benefit from Rising Rates +1.1% $7mm +2.3% +$16mm +4.8% +$33mm +9.5% +$65mm 0% 2% 4% 6% 8% 10% +25bps +50bps +100bps +200bps ▪ NII up $8mm or 5% year over year 4Q ▪ NIM at 2.82% ▪ Average core deposits up 2% linked quarter, 14% year over year in 4Q15 ▪ Attractive and stable low - cost funding mix in Regional Banking with 60% DDA and interest checking deposits ▪ Regional Banking average deposit rate paid of 12 bps in 4Q15, steady vs 3Q15 ▪ Floating rate loans comprise 67% of loan portfolio vs fixed rate loans at 33% Average Deposit Growth NII and NIM Linked - Quarter Change Drivers +3% +6% Linked Quarter Growth: Year Over Year Growth 4Q15: Consumer Commercial Commercial +20% Numbers may not add to total due to rounding. 1 NII sensitivity analysis uses FHN’s balance sheet as of 4Q15. Bps impact assumes increase in Fed Funds rate. Non - Strategic is interest rate neutral, thus nearly all the sensitivity impact would be allocated to the Core Businesses. Consumer +2% 4Q15 $166.7 2.82% 3Q15 $163.6 2.85% Loans to Mortgage Companies Non - Strategic Run - Off - $1.2 - 1bp Higher Fed Balances Commercial Loans - Consumer Loans +$0.8 - Other +$0.1 +$4.2 - 1bp - 1bp +$1.3 - $2.1 - NII NIM ($ in millions)

12 Improving Productivity & Efficiency 1 Peer data is from SNL Financial. Peer group listed in the appendix. 2 1Q15 to 3Q15 annualized for Peer. FHN excludes ~$4mm gain on Employee Benefit Plan Amendment in 3Q15. This number is Non - GAAP an d is reconciled in the appendix. 3 Notable Items are listed in the Appendix. 4 Core Expenses are Non - GAAP and reconciled to GAAP expenses in the table. In this slide ‘core’ is not a reference to core busines s segments. 5 Includes $5mm compensation increase from 3Q15 to 4Q15. Regional Bank Efficiency Ratio Outperforms Peers 55% 60% 65% 70% 2011 2012 2013 2014 2015² Regional Bank Peer Median¹ Efficiency Ratio 66% 63% 2015 Consolidated Expenses 2016 Expense Priorities ▪ Focused on positive operating leverage ▪ TrustAtlantic acquisition adds $7 - 8mm to annual expense ▪ Major expense efficiency efforts include: ▪ Wind - down of non - strategic costs ▪ Reduction in legal costs ▪ Branch network and non - branch real estate optimization ▪ End - to - end process improvements ▪ Ongoing investments in strategic hires, technology and growth markets Reported Notable Items 3 $ in millions 1 Q15 $376 $( 163) 2Q15 $218 - 3 Q15 $215 $( 3) 4Q15 $244 $(20) TrustAtlantic Ongoing Operating Expense - - - $(2) Core Expenses 4 $ 213 $218 $ 218 $222 5
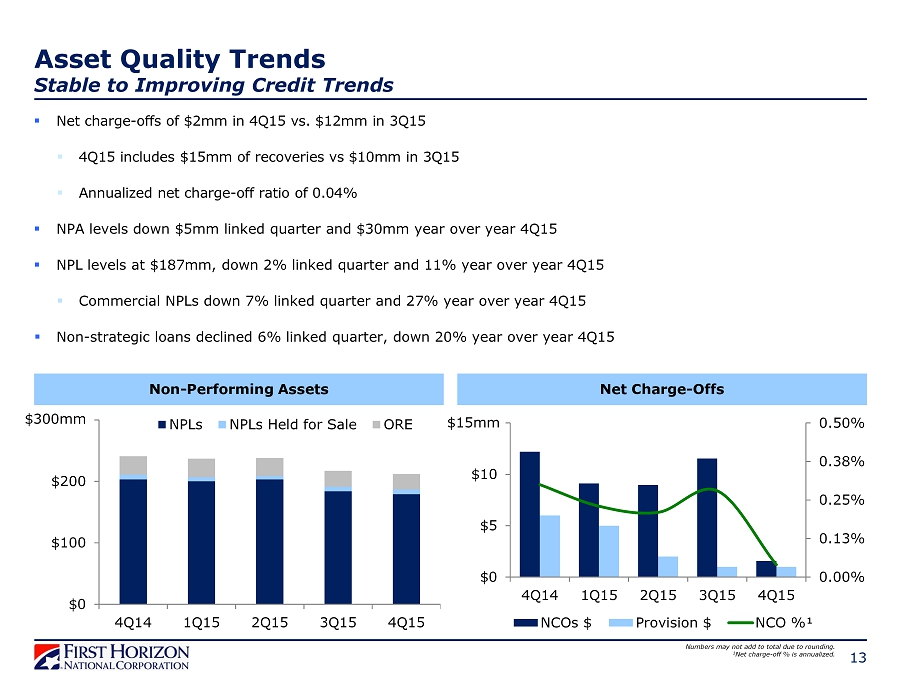
13 Non - Performing Assets $0 $100 $200 $300 4Q14 1Q15 2Q15 3Q15 4Q15 NPLs NPLs Held for Sale ORE $300mm Net Charge - Offs Asset Quality Trends Stable to Improving Credit Trends 0.00% 0.13% 0.25% 0.38% 0.50% $0 $5 $10 $15 4Q14 1Q15 2Q15 3Q15 4Q15 NCOs $ Provision $ NCO %¹ $15mm ▪ Net charge - offs of $2mm in 4Q15 vs. $12mm in 3Q15 ▪ 4Q15 includes $15mm of recoveries vs $10mm in 3Q15 ▪ Annualized net charge - off ratio of 0.04% ▪ NPA levels down $5mm linked quarter and $30mm year over year 4Q15 ▪ NPL levels at $187mm, down 2% linked quarter and 11% year over year 4Q15 ▪ Commercial NPLs down 7% linked quarter and 27% year over year 4Q15 ▪ Non - strategic loans declined 6% linked quarter, down 20% year over year 4Q15 Numbers may not add to total due to rounding. 1 Net charge - off % is annualized.
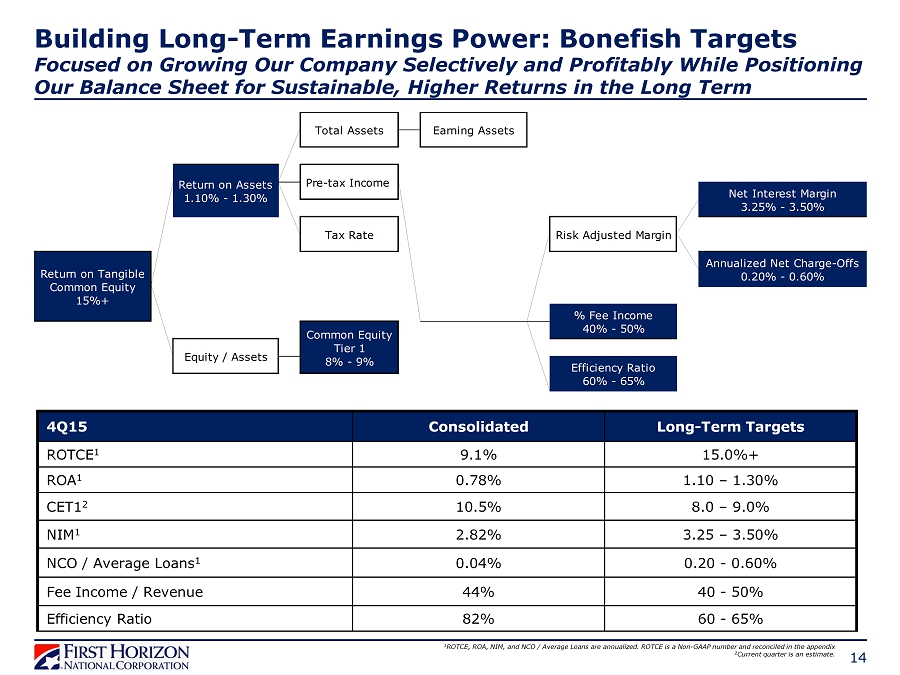
14 4Q15 Consolidated Long - Term Targets ROTCE 1 9.1% 15.0%+ ROA 1 0.78% 1.10 – 1.30% CET1 2 10.5% 8.0 – 9.0% NIM 1 2.82% 3.25 – 3.50% NCO / Average Loans 1 0.04% 0.20 - 0.60% Fee Income / Revenue 44% 40 - 50% Efficiency Ratio 82% 60 - 65% 1 ROTCE, ROA, NIM, and NCO / Average Loans are annualized. ROTCE is a Non - GAAP number and reconciled in the appendix 2 Current quarter is an estimate. Building Long - Term Earnings Power: Bonefish Targets Focused on Growing Our Company Selectively and Profitably While Positioning Our Balance Sheet for Sustainable, Higher Returns in the Long Term Risk Adjusted Margin Total Assets Earning Assets Pre-tax Income Tax Rate Annualized Net Charge-Offs 0.20% - 0.60% % Fee Income 40% - 50% Efficiency Ratio 60% - 65% Return on Tangible Common Equity 15%+ Equity / Assets Common Equity Tier 1 8% - 9% Return on Assets 1.10% - 1.30% Net Interest Margin 3.25% - 3.50%
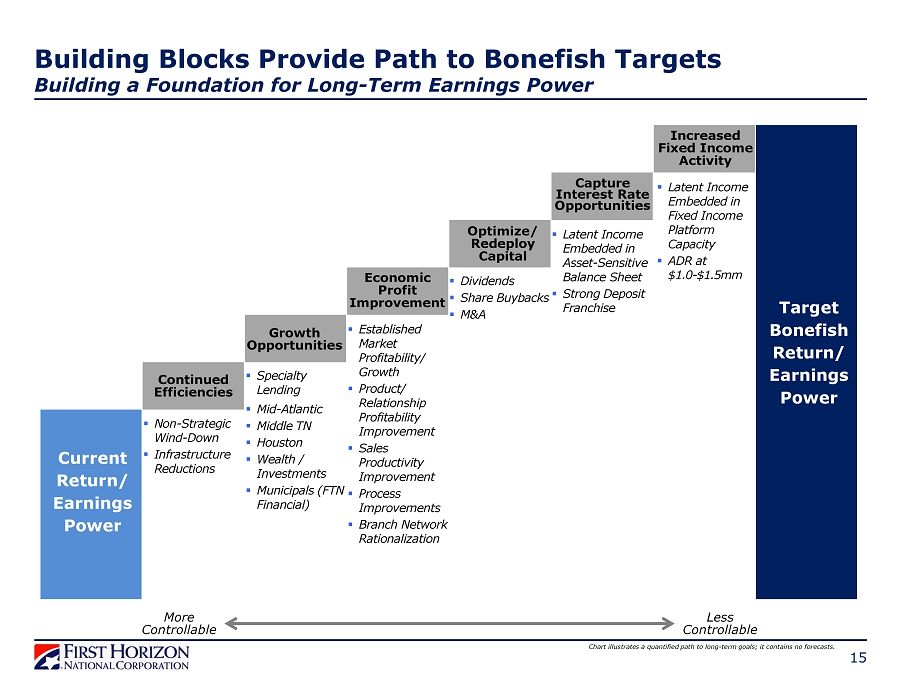
15 Building Blocks Provide Path to Bonefish Targets Building a Foundation for Long - Term Earnings Power Chart illustrates a quantified path to long - term goals; it contains no forecasts. Current Return/ Earnings Power Increased Fixed Income Activity Target Bonefish Return/ Earnings Power Growth Opportunities Economic Profit Improvement Optimize/ Redeploy Capital Continued Efficiencies ▪ Non - Strategic W ind - Down ▪ Infrastructure Reductions ▪ Established Market Profitability / Growth ▪ Product/ Relationship Profitability Improvement ▪ Sales Productivity Improvement ▪ Process Improvements ▪ Branch Network Rationalization ▪ Dividends ▪ Share Buybacks ▪ M&A ▪ Latent Income Embedded in Fixed Income Platform Capacity ▪ ADR at $ 1.0 - $1.5mm ▪ Specialty Lending ▪ Mid - Atlantic ▪ Middle TN ▪ Houston ▪ Wealth / Investments ▪ Municipals (FTN Financial) ▪ Latent Income Embedded in Asset - Sensitive Balance Sheet ▪ Strong Deposit Franchise Capture Interest Rate Opportunities More Controllable Less Controllable

16 Building a Foundation for Attractive Long - Term Earnings Power ▪ Proven execution capabilities ▪ Unique size, scope, and strengths ▪ Focused on efficiency, productivity, economic profitability, and growth opportunities ▪ Organizational alignment on the path to achieving long - term bonefish profitability ▪ Breadth and depth of talent that will be able to profitably run and grow the company Successfully Executing on Key Priorities FHN is Well Positioned for Attractive Long - Term Earnings Power
APPENDIX 17
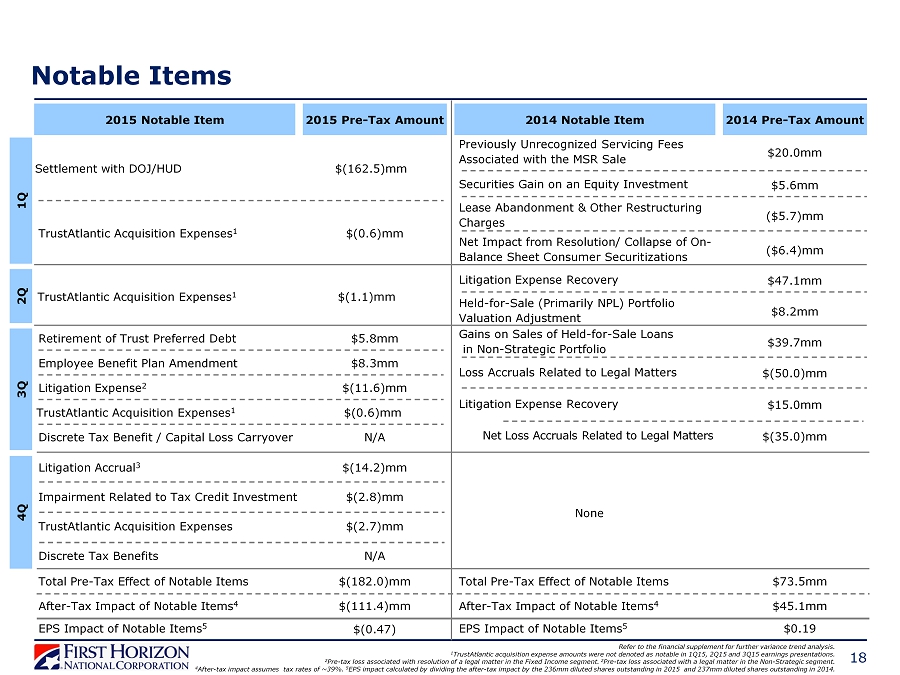
Notable Items 18 2015 Notable Item 2015 Pre - Tax Amount Employee Benefit Plan Amendment $8.3mm Retirement of Trust Preferred Debt $5.8mm 1Q 2Q Settlement with DOJ/HUD $(162.5)mm 3Q Refer to the financial supplement for further variance trend analysis. 1 TrustAtlantic acquisition expense amounts were not denoted as notable in 1Q15, 2Q15 and 3Q15 earnings presentations. 2 Pre - tax loss associated with resolution of a legal matter in the Fixed Income segment. 2 Pre - tax loss associated with a legal matter in the Non - Strategic segment. 4 After - tax impact assumes tax rates of ~39%. 5 EPS impact calculated by dividing the after - tax impact by the 236mm diluted shares outstanding in 2015 and 237mm diluted shares outstanding in 2014. Litigation Expense 2 $(11.6)mm Discrete Tax Benefit / Capital Loss Carryover N/A 4Q Litigation Accrual 3 $(14.2)mm Impairment Related to Tax Credit Investment $(2.8)mm $(2.7)mm TrustAtlantic Acquisition Expenses Discrete Tax Benefits N/A 2014 Notable Item 2014 Pre - Tax Amount Previously Unrecognized Servicing Fees Associated with the MSR Sale Securities Gain on an Equity Investment Lease Abandonment & Other Restructuring Charges Held - for - Sale (Primarily NPL) Portfolio Valuation Adjustment Net Impact from Resolution/ Collapse of On - Balance Sheet Consumer Securitizations Litigation Expense Recovery Gains on Sales of Held - for - Sale Loans in Non - Strategic Portfolio Loss Accruals Related to Legal Matters Litigation Expense Recovery Net Loss Accruals Related to Legal Matters $20.0mm $5.6mm ($5.7)mm ($6.4)mm $8.2mm $47.1mm $39.7mm $(50.0)mm $15.0mm $(35.0)mm None Total Pre - Tax Effect of Notable Items After - Tax Impact of Notable Items 4 EPS Impact of Notable Items 5 Total Pre - Tax Effect of Notable Items After - Tax Impact of Notable Items 4 EPS Impact of Notable Items 5 $(182.0)mm $(111.4)mm $(0.47) $73.5mm $45.1mm $0.19 $(0.6)mm TrustAtlantic Acquisition Expenses 1 $(1.1)mm TrustAtlantic Acquisition Expenses 1 $(0.6)mm TrustAtlantic Acquisition Expenses 1
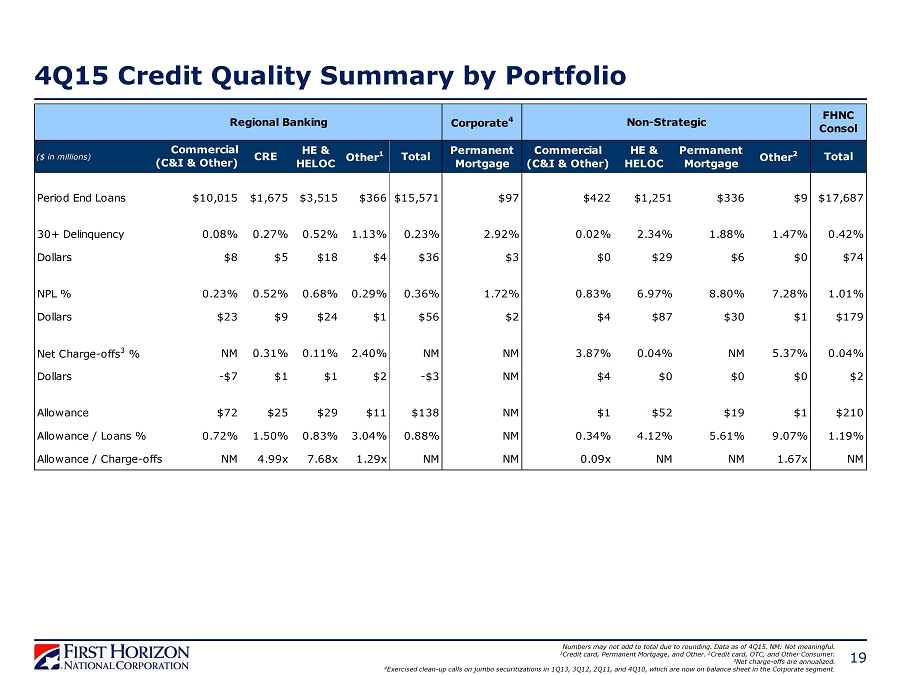
19 4Q15 Credit Quality Summary by Portfolio Numbers may not add to total due to rounding. Data as of 4Q15. NM: Not meaningful. 1 Credit card, Permanent Mortgage, and Other. 2 Credit card, OTC, and Other Consumer. 3 Net charge - offs are annualized. 4 Exercised clean - up calls on jumbo securitizations in 1Q13, 3Q12, 2Q11, and 4Q10, which are now on balance sheet in the Corporate segment. ($ in millions) CRE HE & HELOC Other 1 Total Permanent Mortgage Commercial (C&I & Other) HE & HELOC Permanent Mortgage Other 2 Total Period End Loans $10,015 $1,675 $3,515 $366 $15,571 $97 $422 $1,251 $336 $9 $17,687 30+ Delinquency 0.08% 0.27% 0.52% 1.13% 0.23% 2.92% 0.02% 2.34% 1.88% 1.47% 0.42% Dollars $8 $5 $18 $4 $36 $3 $0 $29 $6 $0 $74 NPL % 0.23% 0.52% 0.68% 0.29% 0.36% 1.72% 0.83% 6.97% 8.80% 7.28% 1.01% Dollars $23 $9 $24 $1 $56 $2 $4 $87 $30 $1 $179 Net Charge-offs 3 % NM 0.31% 0.11% 2.40% NM NM 3.87% 0.04% NM 5.37% 0.04% Dollars -$7 $1 $1 $2 -$3 NM $4 $0 $0 $0 $2 Allowance $72 $25 $29 $11 $138 NM $1 $52 $19 $1 $210 Allowance / Loans % 0.72% 1.50% 0.83% 3.04% 0.88% NM 0.34% 4.12% 5.61% 9.07% 1.19% Allowance / Charge-offs NM 4.99x 7.68x 1.29x NM NM 0.09x NM NM 1.67x NM FHNC Consol Regional Banking Corporate 4 Non-Strategic Commercial (C&I & Other)

Construction 26% Land 3% Mini - Perm/Non - Construction 71% 20 Select C&I and CRE Portfolio Metrics $1.2 $1.6 $1.8 $1.4 $1.7 $0.9 $1.0 $1.6 $1.4 $1.2 $0.0 $0.5 $1.0 $1.5 $2.0 4Q14 1Q15 2Q15 3Q15 4Q15 Period End Average ▪ $10.4B C&I portfolio , diversified by industry, managed primarily in Regional Banking ▪ $1.7B CRE portfolio, diversified by geography, comprising 9% of period - end consolidated loans ▪ Commercial (C&I and CRE) net charge - offs were ($2mm) for the quarter ▪ Gross charge - offs were $6.6mm with recoveries of $8.4mm Multi - Family 25% Retail 25% Office 14% CRE: Loan Type CRE: Collateral Type C&I: Loans to Mortgage Companies Data as of 4 Q15. Numbers may not add to total due to rounding. $2.0B

21 Core Banking Customers TN 64% CA 7% VA 3% GA 3% NC 3% Other 21% Consumer Portfolio Overview $1.4 $0.7 $0.0 $0.5 $1.0 $1.5 $2.0 In Draw In Repayment HELOC Draw vs Repayment Balances Percent of Home Equity Portfolio: Months Left in Draw Period 17% 19% 12% 6% 6% 40% 0% 5% 10% 15% 20% 25% 30% 35% 40% 45% 0-12 13-24 25-36 37-48 49-60 >60 Home Equity Portfolio Characteristics Home Equity Geographic Distribution 25% 28% 27% 28% 29% 15% 18% 21% 24% 27% 30% $0.0 $0.5 $1.0 $1.5 $2.0 4Q14 1Q15 2Q15 3Q15 4Q15 Period End Balance Constant Pre-Payment Rate (Right Axis) Non - Strategic Consumer Real Estate Run - Off $2.0B $2.0B Data as of 4Q15. Numbers may not add to total due to rounding. First Second Total Balance $3.0B $1.8B $4.8B Original FICO 754 736 747 Refreshed FICO 755 724 743 Original CLTV 77% 81% 79% Full Doc 94% 76% 87% Owner Occupied 95% 94% 94% HELOCs $0.6B $1.5B $2.1B Weighted Average HELOC Utilization 46% 55% 53%
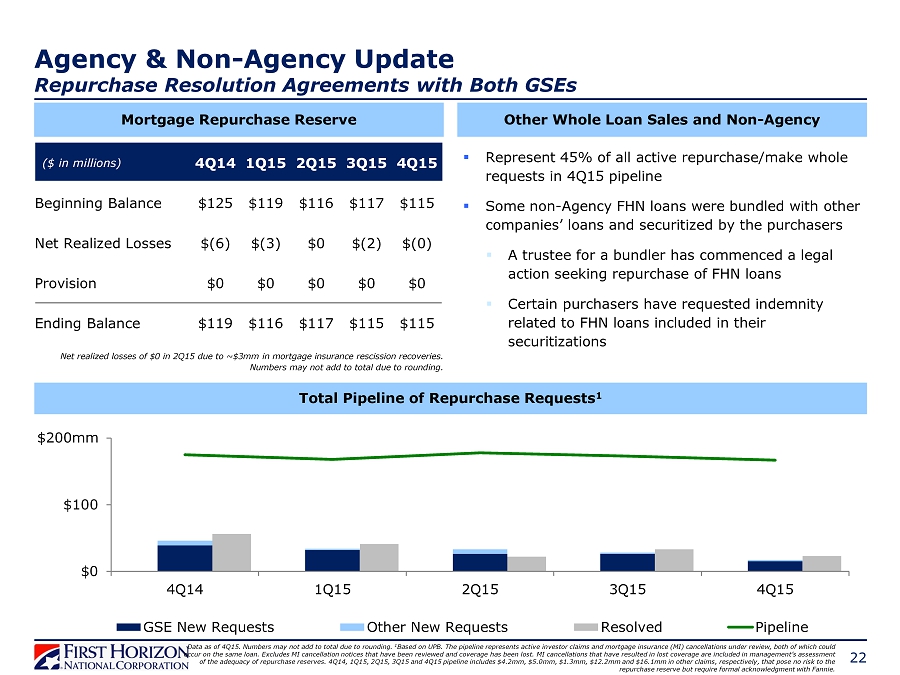
($ in millions) 4Q14 1Q15 2Q15 3Q15 4Q15 Beginning Balance $125 $119 $116 $117 $115 Net Realized Losses $(6) $(3) $0 $(2) $(0) Provision $0 $0 $0 $0 $0 Ending Balance $119 $116 $117 $115 $115 $0 $100 $200 4Q14 1Q15 2Q15 3Q15 4Q15 GSE New Requests Other New Requests Resolved Pipeline 22 Agency & Non - Agency Update Repurchase Resolution Agreements with Both GSEs Total Pipeline of Repurchase Requests 1 $200mm Mortgage Repurchase Reserve Other Whole Loan Sales and Non - Agency ▪ Represent 45% of all active repurchase/make whole requests in 4Q15 pipeline ▪ Some non - Agency FHN loans were bundled with other companies’ loans and securitized by the purchasers ▪ A trustee for a bundler has commenced a legal action seeking repurchase of FHN loans ▪ Certain purchasers have requested indemnity related to FHN loans included in their securitizations Data as of 4Q15. Numbers may not add to total due to rounding. 1 Based on UPB. The pipeline represents active investor claims and mortgage insurance (MI) cancellations under review, both of whi ch could occur on the same loan. Excludes MI cancellation notices that have been reviewed and coverage has been lost. MI cancellations th at have resulted in lost coverage are included in management’s assessment of the adequacy of repurchase reserves. 4Q14, 1Q15, 2Q15, 3Q15 and 4Q15 pipeline includes $4.2mm, $5.0mm, $1.3mm, $12.2mm and $1 6.1mm in other claims, respectively, that pose no risk to the repurchase reserve but require formal acknowledgment with Fannie. Net realized losses of $0 in 2Q15 due to ~$3mm in mortgage insurance rescission recoveries. Numbers may not add to total due to rounding.
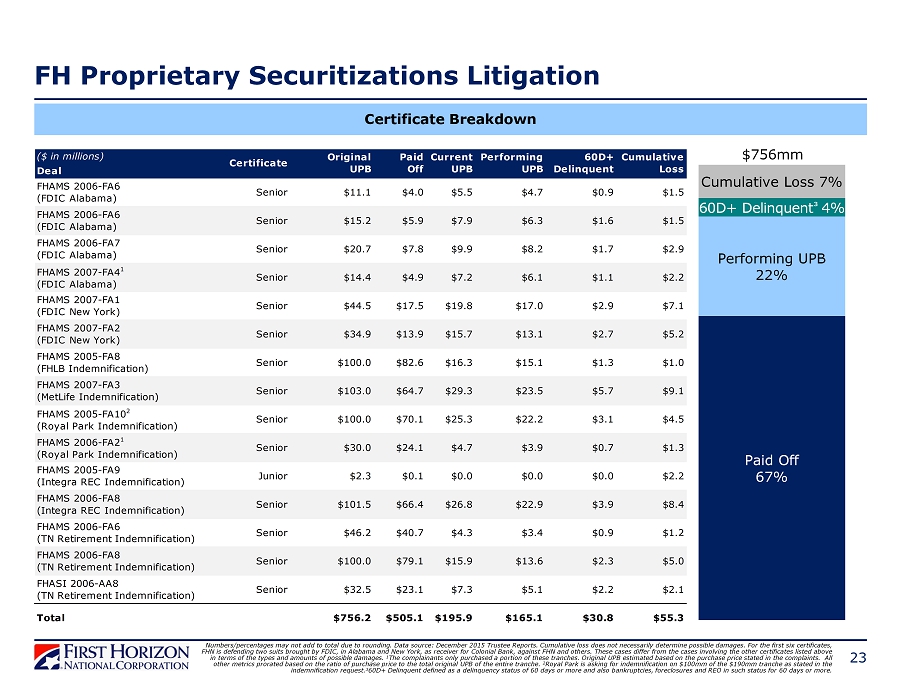
FH Proprietary Securitizations Litigation Certificate Breakdown 23 $756mm Numbers/percentages may not add to total due to rounding. Data source: December 2015 Trustee Reports. Cumulative loss does no t n ecessarily determine possible damages. For the first six certificates, FHN is defending two suits brought by FDIC, in Alabama and New York, as receiver for Colonial Bank, against FHN and others. T hes e cases differ from the cases involving the other certificates listed above in terms of the types and amounts of possible damages. 1 The complainants only purchased a portion of these tranches. Original UPB estimated based on the purchase price stated in the co mplaints. All other metrics prorated based on the ratio of purchase price to the total original UPB of the entire tranche. 2 Royal Park is asking for indemnification on $100mm of the $190mm tranche as stated in the indemnification request. 3 60D+ Delinquent defined as a delinquency status of 60 days or more and also bankruptcies, foreclosures and REO in such status fo r 60 days or more. Paid Off 67% Performing UPB 22% 60D+ Delinquent ³ 4% Cumulative Loss 7% ($ in millions) Deal FHAMS 2006-FA6 (FDIC Alabama) Senior $11.1 $4.0 $5.5 $4.7 $0.9 $1.5 FHAMS 2006-FA6 (FDIC Alabama) Senior $15.2 $5.9 $7.9 $6.3 $1.6 $1.5 FHAMS 2006-FA7 (FDIC Alabama) Senior $20.7 $7.8 $9.9 $8.2 $1.7 $2.9 FHAMS 2007-FA4 1 (FDIC Alabama) Senior $14.4 $4.9 $7.2 $6.1 $1.1 $2.2 FHAMS 2007-FA1 (FDIC New York) Senior $44.5 $17.5 $19.8 $17.0 $2.9 $7.1 FHAMS 2007-FA2 (FDIC New York) Senior $34.9 $13.9 $15.7 $13.1 $2.7 $5.2 FHAMS 2005-FA8 (FHLB Indemnification) Senior $100.0 $82.6 $16.3 $15.1 $1.3 $1.0 FHAMS 2007-FA3 (MetLife Indemnification) Senior $103.0 $64.7 $29.3 $23.5 $5.7 $9.1 FHAMS 2005-FA10 2 (Royal Park Indemnification) Senior $100.0 $70.1 $25.3 $22.2 $3.1 $4.5 FHAMS 2006-FA2 1 (Royal Park Indemnification) Senior $30.0 $24.1 $4.7 $3.9 $0.7 $1.3 FHAMS 2005-FA9 (Integra REC Indemnification) Junior $2.3 $0.1 $0.0 $0.0 $0.0 $2.2 FHAMS 2006-FA8 (Integra REC Indemnification) Senior $101.5 $66.4 $26.8 $22.9 $3.9 $8.4 FHAMS 2006-FA6 (TN Retirement Indemnification) Senior $46.2 $40.7 $4.3 $3.4 $0.9 $1.2 FHAMS 2006-FA8 (TN Retirement Indemnification) Senior $100.0 $79.1 $15.9 $13.6 $2.3 $5.0 FHASI 2006-AA8 (TN Retirement Indemnification) Senior $32.5 $23.1 $7.3 $5.1 $2.2 $2.1 Total $756.2 $505.1 $195.9 $165.1 $30.8 $55.3 Cumulative Loss Certificate Original UPB Paid Off Current UPB Performing UPB 60D+ Delinquent
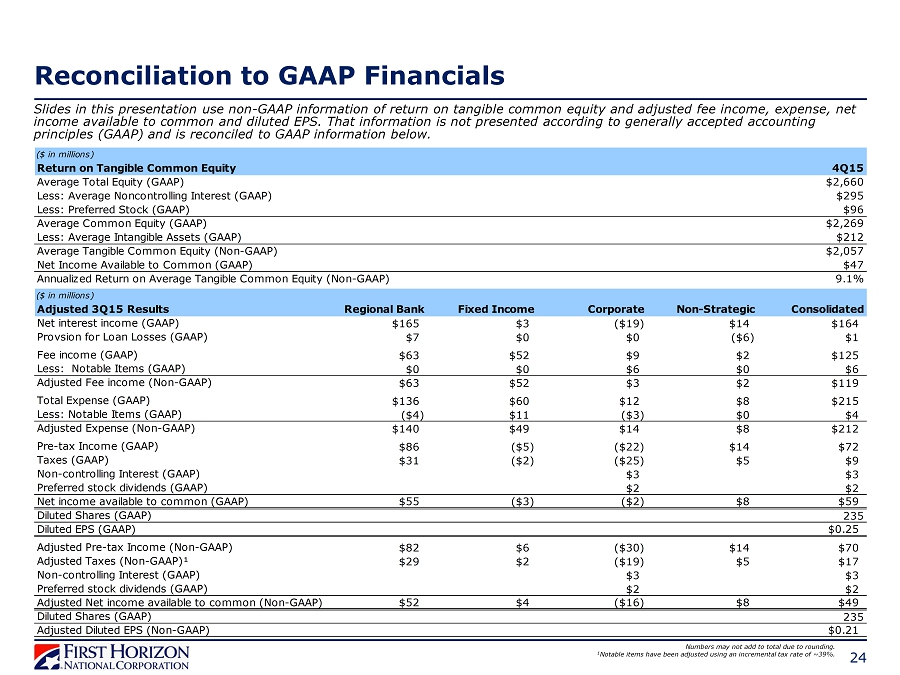
Reconciliation to GAAP Financials 24 Slides in this presentation use non - GAAP information of return on tangible common equity and adjusted fee income, expense, net income available to common and diluted EPS. That information is not presented according to generally accepted accounting principles (GAAP ) and is reconciled to GAAP information below. Numbers may not add to total due to rounding. 1 Notable items have been adjusted using an incremental tax rate of ~39%. ($ in millions) Return on Tangible Common Equity 4Q15 Average Total Equity (GAAP) $2,660 Less: Average Noncontrolling Interest (GAAP) $295 Less: Preferred Stock (GAAP) $96 Average Common Equity (GAAP) $2,269 Less: Average Intangible Assets (GAAP) $212 Average Tangible Common Equity (Non-GAAP) $2,057 Net Income Available to Common (GAAP) $47 Annualized Return on Average Tangible Common Equity (Non-GAAP) 9.1% ($ in millions) Adjusted 3Q15 Results Regional Bank Fixed Income Corporate Non-Strategic Consolidated Net interest income (GAAP) $165 $3 ($19) $14 $164 Provsion for Loan Losses (GAAP) $7 $0 $0 ($6) $1 Fee income (GAAP) $63 $52 $9 $2 $125 Less: Notable Items (GAAP) $0 $0 $6 $0 $6 Adjusted Fee income (Non-GAAP) $63 $52 $3 $2 $119 Total Expense (GAAP) $136 $60 $12 $8 $215 Less: Notable Items (GAAP) ($4) $11 ($3) $0 $4 Adjusted Expense (Non-GAAP) $140 $49 $14 $8 $212 Pre-tax Income (GAAP) $86 ($5) ($22) $14 $72 Taxes (GAAP) $31 ($2) ($25) $5 $9 Non-controlling Interest (GAAP) $3 $3 Preferred stock dividends (GAAP) $2 $2 Net income available to common (GAAP) $55 ($3) ($2) $8 $59 Diluted Shares (GAAP) $0 $0 $0 $0 $235 Diluted EPS (GAAP) $0 $0 $0 $0 $0.25 Adjusted Pre-tax Income (Non-GAAP) $82 $6 ($30) $14 $70 Adjusted Taxes (Non-GAAP)¹ $29 $2 ($19) $5 $17 Non-controlling Interest (GAAP) $0 $0 $3 $0 $3 Preferred stock dividends (GAAP) $0 $0 $2 $0 $2 Adjusted Net income available to common (Non-GAAP) $52 $4 ($16) $8 $49 Diluted Shares (GAAP) 235 Adjusted Diluted EPS (Non-GAAP) $0.21

Reconciliation to GAAP Financials 25 Slides in this presentation use non - GAAP information of adjusted Regional Banking efficiency ratio, fee income, expense, net income available to common and diluted EPS. That information is not presented according to generally accepted accounting principles (GAAP ) and is reconciled to GAAP information below. Numbers may not add to total due to rounding. 1 Notable items have been adjusted using an incremental tax rate of ~39%. ($ in millions) Regional Banking Efficiency Ratio 2015 Regional Bank Total Noninterest Expense (GAAP) $564 Plus: 3Q15 Allocated from Employee Benefit Plan Amendment (GAAP) $4 Adjusted Regional Bank Noninterest Expense (Non-GAAP) (a) $568 Regional Bank Total Revenue (GAAP) (b) $907 Adjusted Regional Bank Efficiency Ratio (Non-GAAP) (a/b) 63% ($ in millions) Adjusted 4Q15 Results Regional Bank Fixed Income Corporate Non-Strategic Consolidated Net interest income (GAAP) $170 $4 ($19) $12 $167 Provsion for Loan Losses (GAAP) $6 $0 $0 ($5) $1 Fee income (GAAP) $63 $62 $5 $2 $132 Less: Notable Items (GAAP) $0 $0 $0 $0 $0 Adjusted Fee income (Non-GAAP) $63 $62 $5 $2 $132 Total Expense (GAAP) $148 $55 $17 $24 $244 Less: Notable Items (GAAP) $0 $0 $6 $14 $20 Adjusted Expense (Non-GAAP) $148 $55 $12 $10 $224 Pre-tax Income (GAAP) $79 $11 ($31) ($5) $54 Taxes (GAAP) $28 $4 ($28) ($2) $3 Non-controlling Interest (GAAP) $3 $3 Preferred stock dividends (GAAP) $2 $2 Net income available to common (GAAP) $51 $7 ($8) ($3) $47 Diluted Shares (GAAP) $0 $0 $0 $0 $240 Diluted EPS (GAAP) $0 $0 $0 $0 $0 Adjusted Pre-tax Income (Non-GAAP) $79 $11 ($26) $10 $74 Adjusted Taxes (Non-GAAP)¹ $28 $4 ($17) $4 $19 Non-controlling Interest (GAAP) $3 $3 Preferred stock dividends (GAAP) $2 $2 Adjusted Net income available to common (Non-GAAP) $51 $7 ($13) $6 $51 Diluted Shares (GAAP) 240 Adjusted Diluted EPS (Non-GAAP) $0.21
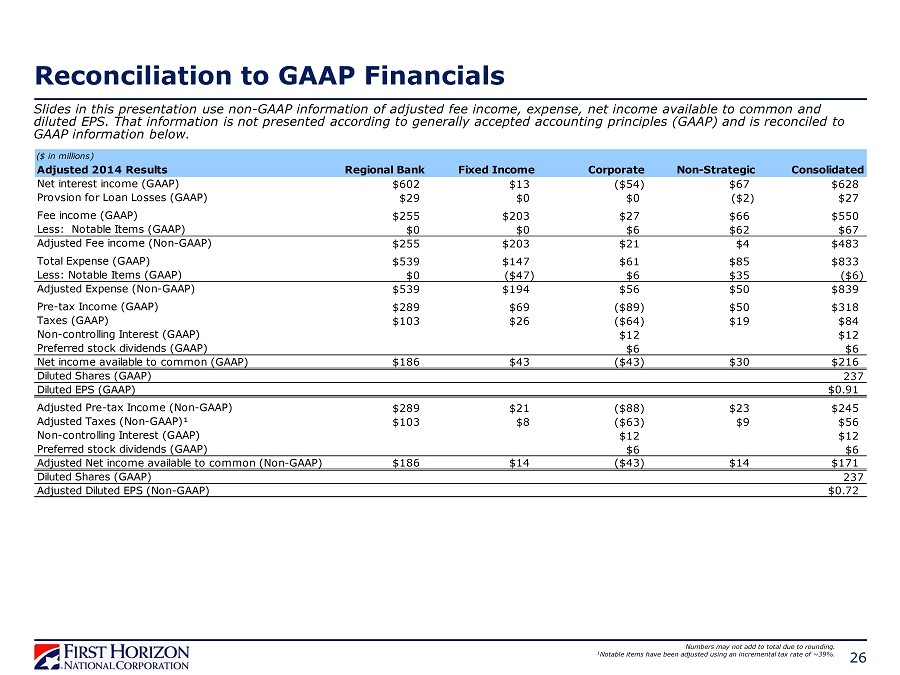
Reconciliation to GAAP Financials 26 Slides in this presentation use non - GAAP information of adjusted fee income, expense, net income available to common and diluted EPS. That information is not presented according to generally accepted accounting principles (GAAP ) and is reconciled to GAAP information below. Numbers may not add to total due to rounding. 1 Notable items have been adjusted using an incremental tax rate of ~39%. ($ in millions) Adjusted 2014 Results Regional Bank Fixed Income Corporate Non-Strategic Consolidated Net interest income (GAAP) $602 $13 ($54) $67 $628 Provsion for Loan Losses (GAAP) $29 $0 $0 ($2) $27 Fee income (GAAP) $255 $203 $27 $66 $550 Less: Notable Items (GAAP) $0 $0 $6 $62 $67 Adjusted Fee income (Non-GAAP) $255 $203 $21 $4 $483 Total Expense (GAAP) $539 $147 $61 $85 $833 Less: Notable Items (GAAP) $0 ($47) $6 $35 ($6) Adjusted Expense (Non-GAAP) $539 $194 $56 $50 $839 Pre-tax Income (GAAP) $289 $69 ($89) $50 $318 Taxes (GAAP) $103 $26 ($64) $19 $84 Non-controlling Interest (GAAP) $0 $0 $12 $0 $12 Preferred stock dividends (GAAP) $0 $0 $6 $0 $6 Net income available to common (GAAP) $186 $43 ($43) $30 $216 Diluted Shares (GAAP) $0 $0 $0 $0 $237 Diluted EPS (GAAP) $0 $0 $0 $0 $0 Adjusted Pre-tax Income (Non-GAAP) $289 $21 ($88) $23 $245 Adjusted Taxes (Non-GAAP)¹ $103 $8 ($63) $9 $56 Non-controlling Interest (GAAP) $12 $12 Preferred stock dividends (GAAP) $6 $6 Adjusted Net income available to common (Non-GAAP) $186 $14 ($43) $14 $171 Diluted Shares (GAAP) 237 Adjusted Diluted EPS (Non-GAAP) $0.72

Reconciliation to GAAP Financials 27 Slides in this presentation use non - GAAP information of adjusted fee income, expense, net income available to common and diluted EPS. That information is not presented according to generally accepted accounting principles (GAAP ) and is reconciled to GAAP information below. Numbers may not add to total due to rounding. 1 Notable items have been adjusted using an incremental tax rate of ~39%. Peer group includes UBSI, ONB, TRMK, IBKC, BXS, UMBF, BOH, VLY, FULT, FCNCA, WTFC, TCB, HBHC, WBS, CBSH, CFR, ASBC, SNV, BOKF, FNFG. ($ in millions) Adjusted 2015 Results Regional Bank Fixed Income Corporate Non-Strategic Consolidated Net interest income (GAAP) $655 $16 ($72) $55 $654 Provsion for Loan Losses (GAAP) $35 $0 $0 ($26) $9 Fee income (GAAP) $252 $231 $23 $11 $517 Less: Notable Items (GAAP) $0 $0 $6 $0 $6 Adjusted Fee income (Non-GAAP) $252 $231 $18 $11 $512 Total Expense (GAAP) $564 $220 $57 $213 $1,054 Less: Notable Items (GAAP) ($4) $11 $5 $177 $188 Adjusted Expense (Non-GAAP) $568 $210 $52 $36 $866 Pre-tax Income (GAAP) $309 $27 ($105) ($122) $108 Taxes (GAAP) $110 $9 ($80) ($28) $11 Non-controlling Interest (GAAP) $0 $0 $11 $0 $11 Preferred stock dividends (GAAP) $0 $0 $6 $0 $6 Net income available to common (GAAP) $198 $18 ($43) ($93) $80 Diluted Shares (GAAP) $0 $0 $0 $0 $236 Diluted EPS (GAAP) $0 $0 $0 $0 $0 Adjusted Pre-tax Income (Non-GAAP) $305 $37 ($107) $55 $290 Adjusted Taxes (Non-GAAP)¹ $109 $13 ($80) $40 $82 Non-controlling Interest (GAAP) $0 $0 $11 $0 $11 Preferred stock dividends (GAAP) $0 $0 $6 $0 $6 Adjusted Net income available to common (Non-GAAP) $196 $24 ($44) $15 $191 Diluted Shares (GAAP) $0 $0 $0 $0 236 Adjusted Diluted EPS (Non-GAAP) $0 $0 $0 $0 $0.81