Exhibit 99.1

SECOND QUARTER 2016
FINANCIAL SUPPLEMENT
If you need further information, please contact:
Aarti Bowman, Investor Relations
901-523-4017
aagoorha@firsthorizon.com
FHN TABLE OF CONTENTS
| | Page |
| | |
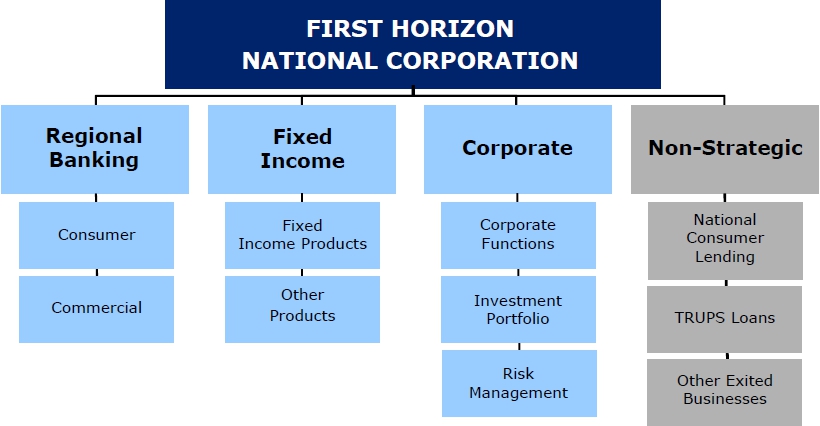
| First Horizon National Corporation Segment Structure | 3 |
| | |
| Performance Highlights | 4 |
| | |
| Consolidated Results | |
| Income Statement | |
| Income Statement | 6 |
| Other Income and Other Expense | 7 |
| Balance Sheet | |
| Period End Balance Sheet | 8 |
| Average Balance Sheet | 9 |
| Net Interest Income | 10 |
| Average Balance Sheet: Yields and Rates | 11 |
| | |
| Capital Highlights | 12 |
| | |
| Business Segment Detail | |
| Segment Highlights | 13 |
| Regional Banking | 14 |
| Fixed Income and Corporate | 15 |
| Non-Strategic | 16 |
| | |
| Asset Quality | |
| Asset Quality: Consolidated | 17 |
| Asset Quality: Regional Banking and Corporate | 19 |
| Asset Quality: Non-Strategic | 20 |
| Portfolio Metrics | 21 |
| | |
| Non-GAAP to GAAP Reconciliation | 22 |
| | |
| Glossary of Terms | 23 |
Other Information
This financial supplement contains forward-looking statements involving significant risks and uncertainties. A number of important factors could cause actual results to differ materially from those in the forward-looking information. Those factors include general economic and financial market conditions, including expectations of and actual timing and amount of interest rate movements including the slope of the yield curve, competition, customer and investor responses to these conditions, ability to execute business plans, geopolitical developments, recent and future legislative and regulatory developments, natural disasters, and items mentioned in this financial supplement and in First Horizon National Corporation’s (“FHN”) most recent press release, as well as critical accounting estimates and other factors described in FHN’s recent filings with the SEC. FHN disclaims any obligation to update any such forward-looking statements or to publicly announce the result of any revisions to any of the forward-looking statements to reflect future events or developments.
Use of Non-GAAP Measures and Regulatory Measures that are not GAAP
Certain measures are included in this financial supplement that are “non-GAAP,” meaning (under U.S. financial reporting rules) they are not presented in accordance with generally accepted accounting principles (“GAAP”) in the U.S. and also are not codified in U.S. banking regulations currently applicable to FHN. Although other entities may use calculation methods that differ from those used by FHN for non-GAAP measures, FHN’s management believes such measures are relevant to understanding the financial condition, capital position, and financial results of FHN and its business segments. Non-GAAP measures are reported to FHN’s management and Board of Directors through various internal reports.
Presentation of regulatory measures, some which follow regulatory definitions rather than GAAP, provides a meaningful base for comparability to other financial institutions subject to the same regulations as FHN. Such measures are used by the various banking regulators in reviewing the performance, stability, and capital adequacy of financial institutions they regulate. Although not GAAP terms, these regulatory measures are not considered “non-GAAP” under U.S. financial reporting rules as long as their presentation conforms to regulatory standards. Regulatory measures used in this financial supplement include: common equity tier 1 capital, generally defined as common equity less goodwill, other intangibles, and certain other required regulatory deductions; tier 1 capital, generally defined as the sum of core capital (including common equity and instruments that cannot be redeemed at the option of the holder) adjusted for certain items under risk based capital regulations; risk weighted assets (“RWA”), which is a measure of total on- and off-balance sheet assets adjusted for credit and market risk, used to determine regulatory capital ratios; and pre-provision net revenue (“PPNR”), calculated by adding the provision/(provision credit) for loan losses to income before income taxes.
The non-GAAP measures presented in this financial supplement are return on average tangible common equity (“ROTCE”), tangible common equity (“TCE”) to tangible assets (“TA”), and tangible book value per common share.
Refer to the tabular reconciliation of non-GAAP to GAAP measures and presentation of the most comparable GAAP items on page 22 of this financial supplement.
| FIRST HORIZON NATIONAL CORPORATION SEGMENT STRUCTURE |  |
| | |
FHN PERFORMANCE HIGHLIGHTS
Second Quarter 2016 Notable Items
| | Segment | | Item | | Income Statement | | Amount | | Comments | |
| | | | | | | | | | | |
| • | Non-Strategic | | Mortgage repurchase liability | | Repurchase and foreclosure provision | | $(31.4) million | | Favorable pre-tax expense reversal of repurchase and foreclosure provision as a result of the settlements of certain repurchase claims | |
| | | | | | | | | | | |
| • | Regional Banking & Non-Strategic | | Litigation expense | | Litigation and regulatory matters | | $26.0 million | | Pre-tax loss accruals related to litigation matters | |
| | | | | | | | | | | |
| • | Corporate | | Visa derivative valuation | | Noninterest Expense: Other | | $2.5 million | | Pre-tax negative valuation adjustments associated with derivatives related to prior sales of Visa Class B shares | |
| | | | | | | | | | | |
| | | | | | | | | | | |
| Second Quarter 2016 vs. First Quarter 2016 | |
| | | | | | | | | | | |
Consolidated
| • | Net income available to common shareholders was $56.5 million, or $.24 per diluted share in second quarter, compared to $47.8 million, or $.20 per diluted share in first quarter |
| • | Net Interest Income (“NII”) increased to $176.3 million in second quarter from $172.1 million in first quarter; Net Interest Margin (“NIM”) increased to 2.92 percent in second quarter from 2.88 percent in prior quarter |
| • | NII was favorably impacted by loan growth within the regional bank, partially offset by the continuing wind down of the non-strategic loan portfolios |
| • | The increase in NIM was largely the result of a decline in average balances held at the Fed, somewhat offset by higher average trading securities balances in second quarter |
| • | Noninterest income (including securities gains) increased to $145.5 million in second quarter from $134.3 million in prior quarter |
| • | The increase was primarily driven by increased Fixed Income revenue |
| • | Noninterest expense was $226.8 million in second quarter compared to $226.9 million in first quarter |
| • | Second quarter results include a $31.4 million reversal of repurchase and foreclosure provision as a result of the settlements of certain repurchase claims, partially offset by an increase in litigation accruals and higher Fixed Income variable compensation expenses relative to the prior quarter |
| • | Period-end loans were $18.6 billion and $17.6 billion in second quarter and first quarter, respectively; average loans increased 3 percent to $17.8 billion in second quarter |
| • | Period-end core deposits were $20.1 billion and $19.8 billion in second quarter and first quarter, respectively; average core deposits increased 1 percent linked quarter to $19.7 billion in second quarter |
Regional Banking
| • | Pre-tax income was $64.4 million in second quarter compared to $71.5 million in first quarter; pre-provision net revenue was $75.3 million and $86.2 million in second and first quarters, respectively |
| • | Average loans increased to $15.9 billion in second quarter from $15.2 billion in first quarter; Period-end loans increased 7 percent to $16.7 billion in second quarter |
| • | Increase in average and period-end loans primarily driven by increases in loans to mortgage companies and other commercial loan portfolios |
| • | Average core deposits increased to $17.9 billion in second quarter from $17.6 billion in first quarter; period-end core deposits increased 1 percent to $18.2 billion in second quarter |
| • | NII increased to $178.3 million in second quarter from $172.3 million in first quarter; NIM decreased 3 basis point to 4.57 percent in second quarter |
| • | The increase in NII was largely the result of higher average balances of commercial loans |
| • | Provision expense was $10.9 million in second quarter compared to $14.8 million in the prior quarter |
| • | The decrease in provision is driven by a number of factors, primarily within the commercial portfolio. Second quarter included lower loss rates and a linked-quarter decline in impaired loans which were somewhat offset by commercial loan growth and consideration of the current economic environment |
| • | Noninterest income increased to $61.3 million in second quarter from $59.3 million in first quarter |
| • | Noninterest expense increased to $164.3 million in second quarter from $145.4 million in first quarter |
| • | The increase in expenses was largely the result of $22.0 million of loss accruals recognized in second quarter related to legal matters, somewhat offset by a $3.3 million net decrease in impairment expense associated with branch closures |
Fixed Income
| • | Pre-tax income was $18.3 million in second quarter compared to $11.1 million in first quarter |
| • | Fixed income product revenue was $69.3 million in second quarter, up from $57.6 million in prior quarter |
| • | Fixed income product average daily revenue (“ADR”) increased to $1.1 million in second quarter from $944 thousand in first quarter |
| • | Noninterest expense increased to $62.9 million in second quarter from $58.7 million in the prior quarter |
| • | The increase was primarily due to an increase in variable compensation costs, partially offset by a decrease in FICA |
Corporate
| • | Pre-tax loss was $27.0 million in second quarter compared to pre-tax loss of $22.1 million in prior quarter |
| • | NII was negative $15.9 million and negative $14.4 million in second and first quarter, respectively |
| • | Estimated effective duration of the securities portfolio was 1.9 years in second quarter compared to 3.0 years in first quarter |
| • | Estimated modified duration of the securities portfolio was 3.4 years in second quarter compared to 4.2 years in first quarter |
| • | Noninterest income (including net securities gains) was $4.9 million in second quarter compared to $5.7 million in first quarter |
| • | First quarter noninterest income included a $1.7 million net gain from an exchange of available-for-sale debt securities |
| • | Noninterest expense was $16.1 million in second quarter compared to $13.5 million in first quarter |
| • | The expense increase was largely attributable to $2.5 million of negative valuation adjustments associated with derivatives related to prior sales of Visa Class B shares |
| FHN PERFORMANCE HIGHLIGHTS (continued) |
| | | | |
| | | | |
| Second Quarter 2016 vs. First Quarter 2016 (continued) |
| | | | |
Non-Strategic
| • | Pre-tax income was $35.2 million in second quarter compared to $16.0 million in first quarter |
| • | NII was $10.6 million in second quarter compared to $11.5 million in prior quarter |
| • | The provision credit was $6.9 million in second quarter compared to a provision credit of $11.8 million in first quarter |
| • | The level of provision continues to reflect declining balances combined with stable performance within the legacy portfolio |
| • | Noninterest expense decreased $25.9 million to negative $16.5 million in second quarter |
| • | Expense decrease primarily driven by a $31.4 million reversal of repurchase and foreclosure provision as a result of the settlements of certain repurchase claims, partially offset by $4.0 million in litigation accruals related to legal matters |
Asset Quality
| • | Allowance for loan losses declined to $199.8 million in second quarter from $204.0 million in first quarter; the allowance to loans ratio was 107 basis points in second quarter compared to 116 basis points in first quarter |
| • | Reserves for the consumer portfolio declined by $8.9 million which more than offset an increase in regional bank commercial reserves |
| • | Net charge-offs (“NCOs”) were $8.2 million in second quarter compared to $9.2 million in first quarter; annualized net charge-offs decreased to 19 basis points of average loans in second quarter from 21 basis points in prior quarter |
| • | The regional bank had net charge-offs of $7.6 million in second quarter compared to net charge-offs of $9.3 million in first quarter |
| • | Nonperforming loans (“NPLs”), excluding loans held-for-sale, decreased to $176.7 million in second quarter from $193.6 million in first quarter; a majority of the decrease was due to the resolution of a few credits within regional bank C&I and commercial real estate combined with declining balances in non-strategic consumer real estate |
| • | Nonperforming assets (“NPAs”), excluding loans held-for-sale, were $190.7 million compared to $211.0 million; the decline was due to decreases in both nonperforming loans and foreclosed assets. |
| • | 30+ delinquencies as a percentage of total loans was 32 basis points in second quarter compared to 54 basis points in first quarter |
| • | The linked-quarter decline was primarily driven by payments in regional bank C&I and commercial real estate |
| • | Troubled debt restructurings (“TDRs”) increased to $373.1 million in second quarter from $365.4 million in prior quarter |
Taxes
| • | The effective tax rates for second and first quarters were 33.00 percent and 31.71 percent, respectively. The rate difference was primarily attributable to a $.9 million change in discrete items |
| • | The rates reflect the favorable effect from permanent benefits. Permanent benefits primarily consist of tax credit investments, life insurance, and tax-exempt interest |
Capital and Liquidity
| • | Signed an agreement with GE Capital to purchase approximately $637 million in restaurant franchise loans; transaction is expected to close in third quarter |
| • | Declared $.07 per common share quarterly dividend in second quarter resulting in an aggregate of $16.2 million which was paid on July 1, 2016 |
| • | Declared aggregate preferred quarterly dividend of $1.6 million in second quarter which was paid on July 11, 2016 |
| • | Repurchased shares costing $11.4 million in second quarter; $196.8 million remaining authorization under the current share repurchase program at June 30, 2016 |
| • | Cumulative shares repurchased since October 2011 are $416.0 million with a volume weighted average price of $10.30 per share |
| • | Capital ratios (regulatory capital ratios calculated under the Basel III risk-based capital rules as phased-in; current quarter is an estimate) |
| • | Total equity to total assets (GAAP) of 9.77 percent in second quarter compared to 9.80 percent in prior quarter |
| • | Tangible common equity to tangible assets (Non-GAAP) of 7.63 percent in second quarter compared to 7.61 percent in prior quarter |
| • | Common Equity Tier 1 of 10.07 percent in second quarter compared to 10.33 percent in prior quarter |
| • | Tier 1 of 11.31 percent in second quarter compared to 11.56 percent in prior quarter |
| • | Total Capital of 12.42 percent in second quarter compared to 12.73 percent in prior quarter |
| • | Leverage of 9.50 percent in second quarter compared to 9.40 percent in prior quarter |
FHN CONSOLIDATED INCOME STATEMENT
Quarterly, Unaudited
| | | | | | | | | | | | | 2Q16 Changes vs. |
| (Dollars in thousands, except per share data) | | 2Q16 | | | 1Q16 | | | 4Q15 | | | 3Q15 | | | 2Q15 | | | 1Q16 | | 2Q15 |
| | | | | | | | | | | | | | | | | | | | | | |
| Interest income | | $197,376 | | | $193,664 | | | $187,620 | | | $183,687 | | | $187,030 | | | 2 | % | | 6 | % |
| Less: interest expense | | 21,112 | | | 21,590 | | | 20,968 | | | 20,125 | | | 20,390 | | | (2 | )% | | 4 | % |
| Net interest income | | 176,264 | | | 172,074 | | | 166,652 | | | 163,562 | | | 166,640 | | | 2 | % | | 6 | % |
| Provision for loan losses | | 4,000 | | | 3,000 | | | 1,000 | | | 1,000 | | | 2,000 | | | 33 | % | | NM | |
| Net interest income after provision for loan losses | | 172,264 | | | 169,074 | | | 165,652 | | | 162,562 | | | 164,640 | | | 2 | % | | 5 | % |
| Noninterest income: | | | | | | | | | | | | | | | | | | | | | |
| Fixed income | | 77,913 | | | 66,977 | | | 61,673 | | | 51,804 | | | 56,241 | | | 16 | % | | 39 | % |
| Deposit transactions and cash management | | 26,991 | | | 26,837 | | | 28,951 | | | 28,911 | | | 28,430 | | | 1 | % | | (5 | )% |
| Brokerage, management fees and commissions | | 10,665 | | | 10,415 | | | 11,021 | | | 11,620 | | | 12,456 | | | 2 | % | | (14 | )% |
| Trust services and investment management | | 7,224 | | | 6,565 | | | 6,873 | | | 6,590 | | | 7,416 | | | 10 | % | | (3 | )% |
| Bankcard income (a) | | 6,558 | | | 5,259 | | | 5,607 | | | 5,561 | | | 5,884 | | | 25 | % | | 11 | % |
| Bank-owned life insurance | | 3,743 | | | 3,389 | | | 3,738 | | | 4,135 | | | 3,391 | | | 10 | % | | 10 | % |
| Other service charges | | 2,996 | | | 2,713 | | | 2,751 | | | 2,968 | | | 3,043 | | | 10 | % | | (2 | )% |
| Insurance commissions | | 552 | | | 487 | | | 769 | | | 608 | | | 654 | | | 13 | % | | (16 | )% |
| Securities gains/(losses), net | | 99 | | | 1,574 | | | 1,439 | | | (345 | ) | | 8 | | | (94 | )% | | NM | |
| Other (b) | | 8,773 | | | 10,089 | | | 9,410 | | | 13,251 | | | 12,778 | | | (13 | )% | | (31 | )% |
| Total noninterest income | | 145,514 | | | 134,305 | | | 132,232 | | | 125,103 | | | 130,301 | | | 8 | % | | 12 | % |
| Adjusted gross income after provision for loan losses | | 317,778 | | | 303,379 | | | 297,884 | | | 287,665 | | | 294,941 | | | 5 | % | | 8 | % |
| Noninterest expense: | | | | | | | | | | | | | | | | | | | | | |
| Employee compensation, incentives, and benefits (c) | | 143,370 | | | 137,151 | | | 136,000 | | | 116,219 | | | 127,970 | | | 5 | % | | 12 | % |
| Repurchase and foreclosure provision (d) | | (31,400 | ) | | - | | | - | | | - | | | - | | | NM | | | NM | |
| Legal fees | | 5,891 | | | 4,879 | | | 4,601 | | | 3,626 | | | 4,509 | | | 21 | % | | 31 | % |
| Professional fees | | 4,284 | | | 5,199 | | | 4,859 | | | 5,139 | | | 5,218 | | | (18 | )% | | (18 | )% |
| Occupancy | | 12,736 | | | 12,604 | | | 13,853 | | | 13,282 | | | 11,764 | | | 1 | % | | 8 | % |
| Computer software | | 11,226 | | | 11,587 | | | 11,432 | | | 11,010 | | | 11,340 | | | (3 | )% | | (1 | )% |
| Contract employment and outsourcing | | 2,497 | | | 2,425 | | | 3,159 | | | 3,414 | | | 3,337 | | | 3 | % | | (25 | )% |
| Operations services | | 10,521 | | | 9,900 | | | 9,761 | | | 10,130 | | | 10,033 | | | 6 | % | | 5 | % |
| Equipment rentals, depreciation, and maintenance | | 7,182 | | | 6,159 | | | 8,568 | | | 7,093 | | | 7,983 | | | 17 | % | | (10 | )% |
| FDIC premium expense | | 4,848 | | | 4,921 | | | 5,098 | | | 4,529 | | | 4,952 | | | (1 | )% | | (2 | )% |
| Advertising and public relations | | 4,481 | | | 4,973 | | | 5,273 | | | 4,832 | | | 4,349 | | | (10 | )% | | 3 | % |
| Communications and courier | | 3,039 | | | 3,750 | | | 4,089 | | | 4,054 | | | 3,801 | | | (19 | )% | | (20 | )% |
| Other insurance and taxes | | 3,014 | | | 3,313 | | | 2,874 | | | 3,283 | | | 3,455 | | | (9 | )% | | (13 | )% |
| Foreclosed real estate | | (432 | ) | | (258 | ) | | 475 | | | 431 | | | 1,329 | | | (67 | )% | | NM | |
| Amortization of intangible assets | | 1,299 | | | 1,300 | | | 1,359 | | | 1,298 | | | 1,298 | | | * | | | * | |
| Other (b) | | 44,266 | | | 19,024 | | | 32,339 | | | 27,096 | | | 17,056 | | | NM | | | NM | |
| Total noninterest expense | | 226,822 | | | 226,927 | | | 243,740 | | | 215,436 | | | 218,394 | | | * | | | 4 | % |
| Income before income taxes | | 90,956 | | | 76,452 | | | 54,144 | | | 72,229 | | | 76,547 | | | 19 | % | | 19 | % |
| Provision for income taxes | | 30,016 | | | 24,239 | | | 2,715 | | | 8,897 | | | 21,590 | | | 24 | % | | 39 | % |
| Net income | | 60,940 | | | 52,213 | | | 51,429 | | | 63,332 | | | 54,957 | | | 17 | % | | 11 | % |
| Net income attributable to noncontrolling interest | | 2,852 | | | 2,851 | | | 2,848 | | | 2,977 | | | 2,851 | | | * | | | * | |
| Net income attributable to controlling interest | | 58,088 | | | 49,362 | | | 48,581 | | | 60,355 | | | 52,106 | | | 18 | % | | 11 | % |
| Preferred stock dividends | | 1,550 | | | 1,550 | | | 1,550 | | | 1,550 | | | 1,550 | | | * | | | * | |
| Net income available to common shareholders | | $56,538 | | | $47,812 | | | $47,031 | | | $58,805 | | | $50,556 | | | 18 | % | | 12 | % |
| Common Stock Data | | | | | | | | | | | | | | | | | | | | | |
| EPS | | $0.24 | | | $0.20 | | | $0.20 | | | $0.25 | | | $0.22 | | | 20 | % | | 9 | % |
| Basic shares (thousands) (e) | | 231,573 | | | 234,651 | | | 237,983 | | | 233,111 | | | 232,800 | | | (1 | )% | | (1 | )% |
| Diluted EPS | | $0.24 | | | $0.20 | | | $0.20 | | | $0.25 | | | $0.22 | | | 20 | % | | 9 | % |
| Diluted shares (thousands) (e) | | 233,576 | | | 236,666 | | | 240,072 | | | 235,058 | | | 234,669 | | | (1 | )% | | * | |
| Key Ratios & Other | | | | | | | | | | | | | | | | | | | | | |
| Return on average assets (annualized) (f) | | 0.91 | % | | 0.79 | % | | 0.78 | % | | 0.99 | % | | 0.87 | % | | | | | | |
| Return on average common equity (annualized) (f) | | 10.04 | % | | 8.53 | % | | 8.23 | % | | 10.83 | % | | 9.56 | % | | | | | | |
| Return on average tangible common equity (annualized) (f) (g) | | 11.10 | % | | 9.44 | % | | 9.07 | % | | 11.77 | % | | 10.41 | % | | | | | | |
| Fee income to total revenue (f) | | 45.21 | % | | 43.55 | % | | 43.97 | % | | 43.41 | % | | 43.88 | % | | | | | | |
| Efficiency ratio (f) | | 70.51 | % | | 74.45 | % | | 81.94 | % | | 74.54 | % | | 73.55 | % | | | | | | |
| Full time equivalent employees | | 4,228 | | | 4,241 | | | 4,260 | | | 4,202 | | | 4,212 | | | | | | | |
NM - Not meaningful
* Amount is less than one percent.
| (a) | 2Q16 increase driven by a significant new relationship. |
| (b) | Refer to the Other Income and Other Expense table on page 7 for additional information. |
| (c) | 3Q15 includes $8.3 million of gains associated with an employee benefit plan amendment. |
| (d) | 2Q16 expense reversal driven by the settlements of certain repurchase claims. |
| (e) | 2Q16 and 1Q16 decreases relate to shares repurchased under share repurchase programs; 4Q15 increase related to shares issued in connection with the TrustAtlantic acquisition, partially offset by shares purchased under share repurchase programs. |
| (f) | See Glossary of Terms for definitions of Key Ratios. |
| (g) | This non-GAAP measure is reconciled to return on common equity (GAAP) in the Non-GAAP to GAAP reconciliation on page 22 of this financial supplement. |
FHN OTHER INCOME AND OTHER EXPENSE
Quarterly, Unaudited
| | | | | | | | | | | | | 2Q16 Changes vs. |
| (Thousands) | | 2Q16 | | | 1Q16 | | | 4Q15 | | | 3Q15 | | | 2Q15 | | | 1Q16 | | 2Q15 |
| | | | | | | | | | | | | | | | | | | | | | |
| Other Income | | | | | | | | | | | | | | | | | | | | | |
| ATM and interchange fees | | $2,879 | | | $2,958 | | | $3,133 | | | $2,998 | | | $3,025 | | | (3 | )% | | (5 | )% |
| Electronic banking fees | | 1,381 | | | 1,397 | | | 1,474 | | | 1,479 | | | 1,459 | | | (1 | )% | | (5 | )% |
| Letter of credit fees | | 1,115 | | | 1,061 | | | 988 | | | 978 | | | 1,532 | | | 5 | % | | (27 | )% |
| Mortgage banking | | 598 | | | 1,273 | | | 1,149 | | | 761 | | | 376 | | | (53 | )% | | 59 | % |
| Deferred compensation (a) | | 795 | | | 329 | | | (58 | ) | | (2,309 | ) | | (35 | ) | | NM | | | NM | |
| Gain/(loss) on extinguishment of debt (b) | | - | | | - | | | (1 | ) | | 5,794 | | | - | | | NM | | | NM | |
| Other (c) | | 2,005 | | | 3,071 | | | 2,725 | | | 3,550 | | | 6,421 | | | (35 | )% | | (69 | )% |
| Total | | $8,773 | | | $10,089 | | | $9,410 | | | $13,251 | | | $12,778 | | | (13 | )% | | (31 | )% |
| | | | | | | | | | | | | | | | | | | | | | |
| Other Expense | | | | | | | | | | | | | | | | | | | | | |
| Litigation and regulatory matters | | $26,000 | | | $(475 | ) | | $14,185 | | | $10,922 | | | $- | | | NM | | | NM | |
| Tax credit investments (d) | | 831 | | | 706 | | | 3,199 | | | 439 | | | 549 | | | 18 | % | | 51 | % |
| Travel and entertainment | | 2,495 | | | 2,062 | | | 2,893 | | | 2,451 | | | 2,632 | | | 21 | % | | (5 | )% |
| Employee training and dues | | 1,338 | | | 1,390 | | | 1,537 | | | 1,272 | | | 1,449 | | | (4 | )% | | (8 | )% |
| Customer relations | | 1,483 | | | 1,879 | | | 1,086 | | | 1,477 | | | 1,505 | | | (21 | )% | | (1 | )% |
| Miscellaneous loan costs | | 565 | | | 717 | | | 835 | | | 726 | | | 734 | | | (21 | )% | | (23 | )% |
| Supplies | | 930 | | | 1,026 | | | 1,046 | | | 974 | | | 880 | | | (9 | )% | | 6 | % |
| Other (e) | | 10,624 | | | 11,719 | | | 7,558 | | | 8,835 | | | 9,307 | | | (9 | )% | | 14 | % |
| Total | | $44,266 | | | $19,024 | | | $32,339 | | | $27,096 | | | $17,056 | | | NM | | | NM | |
NM - Not meaningful
| (a) | Amounts driven by market conditions and are mirrored by changes in deferred compensation expense which is included in employee compensation expense. |
| (b) | 3Q15 gain related to the extinguishment of $206 million of junior subordinated notes underlying $200 million of trust preferred debt. |
| (c) | 2Q15 includes $2.9 million of pre-tax gains on the sale of properties. |
| (d) | 4Q15 includes $2.8 million of impairment related to a tax credit investment accounted for under the equity method. |
| (e) | 2Q16 includes $2.5 million of negative valuation adjustments associated with derivatives related to prior sales of Visa Class B shares; 1Q16 includes $3.7 million of impairment related to branch closures. |
FHN CONSOLIDATED PERIOD-END BALANCE SHEET
Quarterly, Unaudited
| | | | | | | | | | | | | 2Q16 Changes vs. |
| (Thousands) | | 2Q16 | | | 1Q16 | | | 4Q15 | | | 3Q15 | | | 2Q15 | | | 1Q16 | | 2Q15 |
| | | | | | | | | | | | | | | | | | | | | | |
| Assets: | | | | | | | | | | | | | | | | | | | | | |
| Investment securities | | $4,023,576 | | | $4,028,731 | | | $3,944,166 | | | $3,677,954 | | | $3,653,166 | | | * | | | 10 | % |
| Loans held-for-sale | | 117,976 | | | 116,270 | | | 126,342 | | | 124,308 | | | 127,196 | | | 1 | % | | (7 | )% |
| Loans, net of unearned income (a) | | 18,589,337 | | | 17,574,994 | | | 17,686,502 | | | 16,725,492 | | | 16,936,772 | | | 6 | % | | 10 | % |
| Federal funds sold | | 40,570 | | | 34,061 | | | 114,479 | | | 64,438 | | | 77,039 | | | 19 | % | | (47 | )% |
| Securities purchased under agreements to resell | | 881,732 | | | 767,483 | | | 615,773 | | | 793,098 | | | 816,991 | | | 15 | % | | 8 | % |
| Interest-bearing cash (b) | | 321,743 | | | 951,920 | | | 602,836 | | | 596,689 | | | 344,944 | | | (66 | )% | | (7 | )% |
| Trading securities | | 1,162,959 | | | 1,226,521 | | | 881,450 | | | 1,229,180 | | | 1,133,490 | | | (5 | )% | | 3 | % |
| Total earning assets | | 25,137,893 | | | 24,699,980 | | | 23,971,548 | | | 23,211,159 | | | 23,089,598 | | | 2 | % | | 9 | % |
| Cash and due from banks | | 283,648 | | | 280,625 | | | 300,811 | | | 256,342 | | | 274,256 | | | 1 | % | | 3 | % |
| Fixed income receivables (c) | | 219,939 | | | 114,854 | | | 63,660 | | | 83,547 | | | 91,069 | | | 91 | % | | NM | |
| Goodwill (d) | | 191,307 | | | 191,307 | | | 191,307 | | | 145,932 | | | 145,932 | | | * | | | 31 | % |
| Other intangible assets, net (d) | | 23,616 | | | 24,915 | | | 26,215 | | | 25,624 | | | 26,922 | | | (5 | )% | | (12 | )% |
| Premises and equipment, net | | 279,676 | | | 274,347 | | | 275,619 | | | 269,332 | | | 269,507 | | | 2 | % | | 4 | % |
| Real estate acquired by foreclosure | | 20,053 | | | 24,521 | | | 33,063 | | | 35,332 | | | 40,268 | | | (18 | )% | | (50 | )% |
| Allowance for loan losses | | (199,807 | ) | | (204,034 | ) | | (210,242 | ) | | (210,814 | ) | | (221,351 | ) | | (2 | )% | | (10 | )% |
| Derivative assets | | 196,989 | | | 165,007 | | | 104,365 | | | 152,548 | | | 115,230 | | | 19 | % | | 71 | % |
| Other assets | | 1,387,756 | | | 1,392,160 | | | 1,436,291 | | | 1,417,071 | | | 1,405,961 | | | * | | | (1 | )% |
| Total assets | | $27,541,070 | | | $26,963,682 | | | $26,192,637 | | | $25,386,073 | | | $25,237,392 | | | 2 | % | | 9 | % |
| | | | | | | | | | | | | | | | | | | | | | |
| Liabilities and Equity: | | | | | | | | | | | | | | | | | | | | | |
| Deposits: | | | | | | | | | | | | | | | | | | | | | |
| Savings | | $7,960,182 | | | $7,921,344 | | | $7,811,191 | | | $7,554,338 | | | $7,462,642 | | | * | | | 7 | % |
| Other interest-bearing deposits | | 5,720,628 | | | 5,371,864 | | | 5,388,526 | | | 4,885,601 | | | 4,675,742 | | | 6 | % | | 22 | % |
| Time deposits | | 741,992 | | | 763,897 | | | 788,487 | | | 743,158 | | | 769,132 | | | (3 | )% | | (4 | )% |
| Total interest-bearing core deposits | | 14,422,802 | | | 14,057,105 | | | 13,988,204 | | | 13,183,097 | | | 12,907,516 | | | 3 | % | | 12 | % |
| Noninterest-bearing deposits | | 5,684,732 | | | 5,717,195 | | | 5,535,885 | | | 5,391,385 | | | 5,366,936 | | | (1 | )% | | 6 | % |
| Total core deposits (e) | | 20,107,534 | | | 19,774,300 | | | 19,524,089 | | | 18,574,482 | | | 18,274,452 | | | 2 | % | | 10 | % |
| Certificates of deposit $100,000 and more | | 522,643 | | | 553,534 | | | 443,389 | | | 290,738 | | | 400,021 | | | (6 | )% | | 31 | % |
| Total deposits | | 20,630,177 | | | 20,327,834 | | | 19,967,478 | | | 18,865,220 | | | 18,674,473 | | | 1 | % | | 10 | % |
| Federal funds purchased | | 508,669 | | | 588,413 | | | 464,166 | | | 520,992 | | | 556,862 | | | (14 | )% | | (9 | )% |
| Securities sold under agreements to repurchase | | 451,129 | | | 425,217 | | | 338,133 | | | 332,329 | | | 311,760 | | | 6 | % | | 45 | % |
| Trading liabilities | | 789,540 | | | 738,653 | | | 566,019 | | | 788,563 | | | 732,564 | | | 7 | % | | 8 | % |
| Other short-term borrowings (f) | | 543,033 | | | 96,723 | | | 137,861 | | | 99,887 | | | 150,350 | | | NM | | | NM | |
| Term borrowings (g) | | 1,076,943 | | | 1,323,749 | | | 1,312,677 | | | 1,339,940 | | | 1,555,272 | | | (19 | )% | | (31 | )% |
| Fixed income payables (c) | | 90,400 | | | 56,399 | | | 23,072 | | | 95,346 | | | 54,301 | | | 60 | % | | 66 | % |
| Derivative liabilities | | 170,619 | | | 146,297 | | | 108,339 | | | 140,965 | | | 109,815 | | | 17 | % | | 55 | % |
| Other liabilities | | 588,636 | | | 617,449 | | | 635,306 | | | 622,586 | | | 574,090 | | | (5 | )% | | 3 | % |
| Total liabilities | | 24,849,146 | | | 24,320,734 | | | 23,553,051 | | | 22,805,828 | | | 22,719,487 | | | 2 | % | | 9 | % |
| Equity: | | | | | | | | | | | | | | | | | | | | | |
| Common stock (h) | | 145,012 | | | 145,342 | | | 149,117 | | | 146,398 | | | 146,263 | | | * | | | (1 | )% |
| Capital surplus (h) | | 1,362,528 | | | 1,371,397 | | | 1,439,303 | | | 1,377,731 | | | 1,371,712 | | | (1 | )% | | (1 | )% |
| Undivided profits | | 945,663 | | | 905,595 | | | 874,303 | | | 841,737 | | | 797,123 | | | 4 | % | | 19 | % |
| Accumulated other comprehensive loss, net | | (152,334 | ) | | (170,441 | ) | | (214,192 | ) | | (176,676 | ) | | (188,248 | ) | | (11 | )% | | (19 | )% |
| Preferred stock | | 95,624 | | | 95,624 | | | 95,624 | | | 95,624 | | | 95,624 | | | * | | | * | |
| Noncontrolling interest (i) | | 295,431 | | | 295,431 | | | 295,431 | | | 295,431 | | | 295,431 | | | * | | | * | |
| Total equity | | 2,691,924 | | | 2,642,948 | | | 2,639,586 | | | 2,580,245 | | | 2,517,905 | | | 2 | % | | 7 | % |
| Total liabilities and equity | | $27,541,070 | | | $26,963,682 | | | $26,192,637 | | | $25,386,073 | | | $25,237,392 | | | 2 | % | | 9 | % |
NM - Not meaningful
* Amount is less than one percent.
| (a) | 2Q16 increase primarily driven by increases in loans to mortgage companies and other commercial loan portfolios. |
| (b) | Includes excess balances held at Fed. |
| (c) | Period-end balances fluctuate based on the level of pending unsettled trades. |
| (d) | 4Q15 increase related to TrustAtlantic acquisition. |
| (e) | 2Q16 average core deposits were $19.7 billion. |
| (f) | 2Q16 increase related to higher FHLB borrowings as a result of increased loan demand. |
| (g) | In 3Q15 FHN called $206 million of junior subordinated notes underlying $200 million of trust preferred debt; In 2Q16 $250 million of FTBNA subordinated notes matured. |
| (h) | 2Q16 and 1Q16 decreases relate to shares repurchased under share repurchase programs; 4Q15 increase related to shares issued in connection with the TrustAtlantic acquisition, partially offset by shares purchased under share repurchase programs. |
| (i) | Consists of preferred stock of subsidiaries. |
FHN CONSOLIDATED AVERAGE BALANCE SHEET
Quarterly, Unaudited
| | | | | | | | | | | | | 2Q16 Changes vs. |
| (Thousands) | | 2Q16 | | | 1Q16 | | | 4Q15 | | | 3Q15 | | | 2Q15 | | | 1Q16 | | 2Q15 |
| | | | | | | | | | | | | | | | | | | | | | |
| Assets: | | | | | | | | | | | | | | | | | | | | | |
| Earning assets: | | | | | | | | | | | | | | | | | | | | | |
| Loans, net of unearned income: | | | | | | | | | | | | | | | | | | | | | |
| Commercial, financial, and industrial (C&I) | | $10,451,954 | | | $9,994,084 | | | $9,720,115 | | | $9,539,650 | | | $9,675,107 | | | 5 | % | | 8 | % |
| Commercial real estate | | 1,901,592 | | | 1,765,435 | | | 1,612,730 | | | 1,425,528 | | | 1,371,207 | | | 8 | % | | 39 | % |
| Consumer real estate | | 4,662,172 | | | 4,732,968 | | | 4,798,067 | | | 4,838,984 | | | 4,893,285 | | | (1 | )% | | (5 | )% |
| Permanent mortgage | | 435,521 | | | 447,800 | | | 455,299 | | | 475,684 | | | 500,093 | | | (3 | )% | | (13 | )% |
| Credit card and other | | 360,874 | | | 353,661 | | | 356,948 | | | 353,148 | | | 350,247 | | | 2 | % | | 3 | % |
| Total loans, net of unearned income (a) | | 17,812,113 | | | 17,293,948 | | | 16,943,159 | | | 16,632,994 | | | 16,789,939 | | | 3 | % | | 6 | % |
| Loans held-for-sale | | 114,859 | | | 122,146 | | | 122,046 | | | 126,072 | | | 129,519 | | | (6 | )% | | (11 | )% |
| Investment securities: | | | | | | | | | | | | | | | | | | | | | |
| U.S. treasuries | | 100 | | | 100 | | | 100 | | | 100 | | | 100 | | | * | | | * | |
| U.S. government agencies | | 3,814,059 | | | 3,790,568 | | | 3,619,334 | | | 3,482,658 | | | 3,505,033 | | | 1 | % | | 9 | % |
| States and municipalities | | 5,830 | | | 5,823 | | | 8,881 | | | 13,673 | | | 14,074 | | | * | | | (59 | )% |
| Corporate bonds | | 10,000 | | | 10,000 | | | 1,522 | | | – | | | – | | | * | | | NM | |
| Other | | 186,812 | | | 185,638 | | | 188,813 | | | 181,817 | | | 181,749 | | | 1 | % | | 3 | % |
| Total investment securities | | 4,016,801 | | | 3,992,129 | | | 3,818,650 | | | 3,678,248 | | | 3,700,956 | | | 1 | % | | 9 | % |
| Trading securities | | 1,269,909 | | | 1,142,215 | | | 1,307,102 | | | 1,137,877 | | | 1,363,165 | | | 11 | % | | (7 | )% |
| Other earning assets: | | | | | | | | | | | | | | | | | | | | | |
| Federal funds sold | | 20,825 | | | 25,454 | | | 19,832 | | | 35,191 | | | 31,765 | | | (18 | )% | | (34 | )% |
| Securities purchased under agreements to resell | | 891,973 | | | 817,963 | | | 804,000 | | | 762,744 | | | 760,338 | | | 9 | % | | 17 | % |
| Interest-bearing cash (b) | | 475,881 | | | 1,009,739 | | | 913,432 | | | 806,648 | | | 465,596 | | | (53 | )% | | 2 | % |
| Total other earning assets | | 1,388,679 | | | 1,853,156 | | | 1,737,264 | | | 1,604,583 | | | 1,257,699 | | | (25 | )% | | 10 | % |
| Total earning assets | | 24,602,361 | | | 24,403,594 | | | 23,928,221 | | | 23,179,774 | | | 23,241,278 | | | 1 | % | | 6 | % |
| Allowance for loan losses | | (201,622 | ) | | (208,884 | ) | | (208,804 | ) | | (216,833 | ) | | (227,765 | ) | | (3 | )% | | (11 | )% |
| Cash and due from banks | | 310,691 | | | 316,467 | | | 320,147 | | | 308,409 | | | 315,730 | | | (2 | )% | | (2 | )% |
| Fixed income receivables | | 73,029 | | | 74,495 | | | 91,510 | | | 59,470 | | | 51,913 | | | (2 | )% | | 41 | % |
| Premises and equipment, net (c) | | 275,206 | | | 275,764 | | | 273,365 | | | 268,061 | | | 292,874 | | | * | | | (6 | )% |
| Derivative assets | | 147,561 | | | 117,815 | | | 131,479 | | | 113,927 | | | 138,935 | | | 25 | % | | 6 | % |
| Other assets | | 1,621,322 | | | 1,639,443 | | | 1,639,256 | | | 1,600,095 | | | 1,598,613 | | | (1 | )% | | 1 | % |
| Total assets | | $26,828,548 | | | $26,618,694 | | | $26,175,174 | | | $25,312,903 | | | $25,411,578 | | | 1 | % | | 6 | % |
| | | | | | | | | | | | | | | | | | | | | | |
| Liabilities and equity: | | | | | | | | | | | | | | | | | | | | | |
| Interest-bearing liabilities: | | | | | | | | | | | | | | | | | | | | | |
| Interest-bearing deposits: | | | | | | | | | | | | | | | | | | | | | |
| Savings | | $7,865,977 | | | $7,898,580 | | | $7,589,314 | | | $7,578,288 | | | $7,437,016 | | | * | | | 6 | % |
| Other interest-bearing deposits | | 5,431,736 | | | 5,281,059 | | | 4,956,451 | | | 4,806,813 | | | 4,741,920 | | | 3 | % | | 15 | % |
| Time deposits | | 755,273 | | | 774,345 | | | 798,661 | | | 756,397 | | | 780,355 | | | (2 | )% | | (3 | )% |
| Total interest-bearing core deposits | | 14,052,986 | | | 13,953,984 | | | 13,344,426 | | | 13,141,498 | | | 12,959,291 | | | 1 | % | | 8 | % |
| Certificates of deposit $100,000 and more | | 545,436 | | | 511,975 | | | 389,682 | | | 354,376 | | | 405,696 | | | 7 | % | | 34 | % |
| Federal funds purchased | | 600,381 | | | 630,143 | | | 569,603 | | | 529,156 | | | 649,464 | | | (5 | )% | | (8 | )% |
| Securities sold under agreements to repurchase | | 490,449 | | | 445,964 | | | 337,893 | | | 330,114 | | | 339,874 | | | 10 | % | | 44 | % |
| Trading liabilities | | 828,629 | | | 758,739 | | | 768,721 | | | 722,031 | | | 713,133 | | | 9 | % | | 16 | % |
| Other short-term borrowings | | 184,602 | | | 112,498 | | | 128,740 | | | 138,698 | | | 227,650 | | | 64 | % | | (19 | )% |
| Term borrowings (d) | | 1,072,393 | | | 1,310,370 | | | 1,583,213 | | | 1,459,315 | | | 1,568,483 | | | (18 | )% | | (32 | )% |
| Total interest-bearing liabilities | | 17,774,876 | | | 17,723,673 | | | 17,122,278 | | | 16,675,188 | | | 16,863,591 | | | * | | | 5 | % |
| Noninterest-bearing deposits | | 5,654,446 | | | 5,470,855 | | | 5,627,935 | | | 5,392,294 | | | 5,189,939 | | | 3 | % | | 9 | % |
| Fixed income payables | | 30,872 | | | 53,004 | | | 52,034 | | | 26,220 | | | 27,608 | | | (42 | )% | | 12 | % |
| Derivative liabilities | | 129,260 | | | 122,378 | | | 120,728 | | | 105,644 | | | 123,397 | | | 6 | % | | 5 | % |
| Other liabilities | | 583,606 | | | 604,410 | | | 592,624 | | | 568,013 | | | 695,114 | | | (3 | )% | | (16 | )% |
| Total liabilities | | 24,173,060 | | | 23,974,320 | | | 23,515,599 | | | 22,767,359 | | | 22,899,649 | | | 1 | % | | 6 | % |
| Equity: | | | | | | | | | | | | | | | | | | | | | |
| Common stock (e) | | 145,226 | | | 147,287 | | | 149,401 | | | 146,324 | | | 146,146 | | | (1 | )% | | (1 | )% |
| Capital surplus (e) | | 1,367,468 | | | 1,405,996 | | | 1,443,988 | | | 1,374,195 | | | 1,370,653 | | | (3 | )% | | * | |
| Undivided profits | | 924,822 | | | 889,209 | | | 860,778 | | | 818,909 | | | 775,881 | | | 4 | % | | 19 | % |
| Accumulated other comprehensive loss, net | | (173,083 | ) | | (189,173 | ) | | (185,647 | ) | | (184,939 | ) | | (171,806 | ) | | (9 | )% | | 1 | % |
| Preferred stock | | 95,624 | | | 95,624 | | | 95,624 | | | 95,624 | | | 95,624 | | | * | | | * | |
| Noncontrolling interest (f) | | 295,431 | | | 295,431 | | | 295,431 | | | 295,431 | | | 295,431 | | | * | | | * | |
| Total equity | | 2,655,488 | | | 2,644,374 | | | 2,659,575 | | | 2,545,544 | | | 2,511,929 | | | * | | | 6 | % |
| Total liabilities and equity | | $26,828,548 | | | $26,618,694 | | | $26,175,174 | | | $25,312,903 | | | $25,411,578 | | | 1 | % | | 6 | % |
NM - Not meaningful
* Amount is less than one percent.
| (a) | Includes loans on nonaccrual status. |
| (b) | Includes excess balances held at Fed. |
| (c) | 3Q15 decrease related to sale of property in second quarter 2015. |
| (d) | In 3Q15 FHN called $206 million of junior subordinated notes underlying $200 million of trust preferred debt; In 2Q16 $250 million of FTBNA subordinated notes matured. |
| (e) | 2Q16 and 1Q16 decreases relate to shares repurchased under share repurchase programs; 4Q15 increase related to shares issued in connection with the TrustAtlantic acquisition, partially offset by shares purchased under share repurchase programs. |
| (f) | Consists of preferred stock of subsidiaries. |
FHN CONSOLIDATED NET INTEREST INCOME (a)
Quarterly, Unaudited
| | | | | | | | | | | | | 2Q16 Changes vs. |
| (Thousands) | | 2Q16 | | | 1Q16 | | | 4Q15 | | | 3Q15 | | | 2Q15 | | | 1Q16 | | 2Q15 |
| | | | | | | | | | | | | | | | | | | | | | |
| Interest Income: | | | | | | | | | | | | | | | | | | | | | |
| Loans, net of unearned income (b) | | $165,550 | | | $160,687 | | | $154,959 | | | $152,795 | | | $155,565 | | | 3 | % | | 6 | % |
| Loans held-for-sale | | 1,198 | | | 1,261 | | | 1,305 | | | 1,311 | | | 1,350 | | | (5 | )% | | (11 | )% |
| Investment securities: | | | | | | | | | | | | | | | | | | | | | |
| U.S. government agencies | | 22,801 | | | 23,273 | | | 22,349 | | | 21,366 | | | 21,432 | | | (2 | )% | | 6 | % |
| States and municipalities | | 106 | | | 97 | | | 129 | | | 97 | | | 97 | | | 9 | % | | 9 | % |
| Corporate bonds | | 132 | | | 131 | | | 19 | | | - | | | - | | | 1 | % | | NM | |
| Other | | 1,152 | | | 1,201 | | | 1,906 | | | 1,864 | | | 1,853 | | | (4 | )% | | (38 | )% |
| Total investment securities | | 24,191 | | | 24,702 | | | 24,403 | | | 23,327 | | | 23,382 | | | (2 | )% | | 3 | % |
| Trading securities | | 8,374 | | | 8,185 | | | 9,360 | | | 8,476 | | | 9,289 | | | 2 | % | | (10 | )% |
| Other earning assets: | | | | | | | | | | | | | | | | | | | | | |
| Federal funds sold | | 57 | | | 80 | | | 56 | | | 88 | | | 79 | | | (29 | )% | | (28 | )% |
| Securities purchased under agreements to resell (c) | | 322 | | | 226 | | | (277 | ) | | (112 | ) | | (254 | ) | | 42 | % | | NM | |
| Interest-bearing cash | | 574 | | | 1,252 | | | 636 | | | 490 | | | 267 | | | (54 | )% | | NM | |
| Total other earning assets | | 953 | | | 1,558 | | | 415 | | | 466 | | | 92 | | | (39 | )% | | NM | |
| Interest income | | $200,266 | | | $196,393 | | | $190,442 | | | $186,375 | | | $189,678 | | | 2 | % | | 6 | % |
| | | | | | | | | | | | | | | | | | | | | | |
| Interest Expense: | | | | | | | | | | | | | | | | | | | | | |
| Interest-bearing deposits: | | | | | | | | | | | | | | | | | | | | | |
| Savings | | $4,146 | | | $4,190 | | | $2,930 | | | $2,785 | | | $2,970 | | | (1 | )% | | 40 | % |
| Other interest-bearing deposits | | 2,526 | | | 2,304 | | | 1,312 | | | 1,118 | | | 1,104 | | | 10 | % | | NM | |
| Time deposits | | 1,148 | | | 1,112 | | | 1,200 | | | 1,230 | | | 1,324 | | | 3 | % | | (13 | )% |
| Total interest-bearing core deposits | | 7,820 | | | 7,606 | | | 5,442 | | | 5,133 | | | 5,398 | | | 3 | % | | 45 | % |
| Certificates of deposit $100,000 and more | | 1,326 | | | 1,211 | | | 1,013 | | | 756 | | | 830 | | | 9 | % | | 60 | % |
| Federal funds purchased | | 762 | | | 797 | | | 428 | | | 338 | | | 408 | | | (4 | )% | | 87 | % |
| Securities sold under agreements to repurchase | | 138 | | | 59 | | | 46 | | | 32 | | | 42 | | | NM | | | NM | |
| Trading liabilities | | 3,782 | | | 4,039 | | | 4,034 | | | 4,258 | | | 3,770 | | | (6 | )% | | * | |
| Other short-term borrowings | | 303 | | | 272 | | | 262 | | | 294 | | | 276 | | | 11 | % | | 10 | % |
| Term borrowings | | 6,981 | | | 7,606 | | | 9,743 | | | 9,314 | | | 9,666 | | | (8 | )% | | (28 | )% |
| Interest expense | | 21,112 | | | 21,590 | | | 20,968 | | | 20,125 | | | 20,390 | | | (2 | )% | | 4 | % |
| Net interest income - tax equivalent basis | | 179,154 | | | 174,803 | | | 169,474 | | | 166,250 | | | 169,288 | | | 2 | % | | 6 | % |
| Fully taxable equivalent adjustment | | (2,890 | ) | | (2,729 | ) | | (2,822 | ) | | (2,688 | ) | | (2,648 | ) | | (6 | )% | | (9 | )% |
| Net interest income | | $176,264 | | | $172,074 | | | $166,652 | | | $163,562 | | | $166,640 | | | 2 | % | | 6 | % |
NM - Not meaningful
* Amount is less than one percent.
| (a) | Net interest income adjusted to a fully taxable equivalent (“FTE”) basis assuming a statutory federal income tax of 35 percent and, where applicable, state income taxes. |
| (b) | Includes interest on loans in nonaccrual status. |
| (c) | Amounts in 2015 driven by negative market rates on reverse repurchase agreements. |
FHN CONSOLIDATED AVERAGE BALANCE SHEET: YIELDS AND RATES
Quarterly, Unaudited
| | | | | | | | | | | | | | | | |
| | 2Q16 | | | 1Q16 | | | 4Q15 | | | 3Q15 | | | 2Q15 | | |
| | | | | | | | | | | | | | | | |
| Assets: | | | | | | | | | | | | | | | |
| Earning assets (a): | | | | | | | | | | | | | | | |
| Loans, net of unearned income (b): | | | | | | | | | | | | | | | |
| Commercial loans | 3.58 | % | | 3.58 | % | | 3.46 | % | | 3.50 | % | | 3.60 | % | |
| Retail loans | 4.08 | | | 4.07 | | | 3.98 | | | 3.94 | | | 3.94 | | |
| Total loans, net of unearned income (c) | 3.74 | | | 3.73 | | | 3.63 | | | 3.65 | | | 3.71 | | |
| Loans held-for-sale | 4.17 | | | 4.13 | | | 4.28 | | | 4.16 | | | 4.17 | | |
| Investment securities: | | | | | | | | | | | | | | | |
| U.S. government agencies | 2.39 | | | 2.46 | | | 2.47 | | | 2.45 | | | 2.45 | | |
| States and municipalities | 7.27 | | | 6.70 | | | 5.81 | | | 2.84 | | | 2.77 | | |
| Corporate bonds | 5.25 | | | 5.25 | | | 4.98 | | | - | | | - | | |
| Other | 2.47 | | | 2.59 | | | 4.04 | | | 4.10 | | | 4.08 | | |
| Total investment securities | 2.41 | | | 2.48 | | | 2.56 | | | 2.54 | | | 2.53 | | |
| Trading securities | 2.64 | | | 2.87 | | | 2.86 | | | 2.98 | | | 2.73 | | |
| Other earning assets: | | | | | | | | | | | | | | | |
| Federal funds sold | 1.11 | | | 1.26 | | | 1.12 | | | 1.00 | | | 1.00 | | |
| Securities purchased under agreements to resell (d) | 0.15 | | | 0.11 | | | (0.14 | ) | | (0.06 | ) | | (0.13 | ) | |
| Interest-bearing cash | 0.48 | | | 0.50 | | | 0.28 | | | 0.24 | | | 0.23 | | |
| Total other earning assets | 0.28 | | | 0.34 | | | 0.09 | | | 0.12 | | | 0.03 | | |
| Interest income/total earning assets | 3.27 | % | | 3.23 | % | | 3.17 | % | | 3.20 | % | | 3.27 | % | |
| | | | | | | | | | | | | | | | |
| Liabilities: | | | | | | | | | | | | | | | |
| Interest-bearing liabilities: | | | | | | | | | | | | | | | |
| Interest-bearing deposits: | | | | | | | | | | | | | | | |
| Savings | 0.21 | % | | 0.21 | % | | 0.15 | % | | 0.15 | % | | 0.16 | % | |
| Other interest-bearing deposits | 0.19 | | | 0.18 | | | 0.10 | | | 0.09 | | | 0.09 | | |
| Time deposits | 0.61 | | | 0.58 | | | 0.60 | | | 0.65 | | | 0.68 | | |
| Total interest-bearing core deposits | 0.22 | | | 0.22 | | | 0.16 | | | 0.15 | | | 0.17 | | |
| Certificates of deposit $100,000 and more | 0.98 | | | 0.95 | | | 1.03 | | | 0.85 | | | 0.82 | | |
| Federal funds purchased | 0.51 | | | 0.51 | | | 0.30 | | | 0.25 | | | 0.25 | | |
| Securities sold under agreements to repurchase | 0.11 | | | 0.05 | | | 0.05 | | | 0.04 | | | 0.05 | | |
| Trading liabilities | 1.84 | | | 2.14 | | | 2.08 | | | 2.34 | | | 2.12 | | |
| Other short-term borrowings(e) | 0.66 | | | 0.97 | | | 0.81 | | | 0.84 | | | 0.49 | | |
| Term borrowings (f) | 2.60 | | | 2.32 | | | 2.46 | | | 2.55 | | | 2.47 | | |
| Interest expense/total interest-bearing liabilities | 0.48 | | | 0.49 | | | 0.49 | | | 0.48 | | | 0.48 | | |
| Net interest spread | 2.79 | % | | 2.74 | % | | 2.68 | % | | 2.72 | % | | 2.79 | % | |
| Effect of interest-free sources used to fund earning assets | 0.13 | | | 0.14 | | | 0.14 | | | 0.13 | | | 0.13 | | |
| Net interest margin | 2.92 | % | | 2.88 | % | | 2.82 | % | | 2.85 | % | | 2.92 | % | |
| Yields are adjusted to a FTE basis assuming a statutory federal income tax rate of 35 percent and, where applicable, state income taxes. |
| (a) | Earning assets yields are expressed net of unearned income. |
| (b) | Includes loan fees and cash basis interest income. |
| (c) | Includes loans on nonaccrual status. |
| (d) | Amounts in 2015 driven by negative market rates on reverse repurchase agreements. |
| (e) | 2Q16 rate decline driven by an increase in FHLB borrowings at a rate lower than other short-term borrowings. |
| (f) | Rates are expressed net of unamortized debenture cost for term borrowings. |
FHN CAPITAL HIGHLIGHTS
Quarterly, Unaudited
| | | | | | | | | | | | | | | | | | | | | | | 2Q16 Changes vs. |
| (Dollars and shares in thousands) | | | 2Q16 | | | | 1Q16 | | | | 4Q15 | | | | 3Q15 | | | | 2Q15 | | | | 1Q16 | | | 2Q15 |
| | | | | | | | | | | | | | | | | | | | | | | | | | | | | |
| Common equity tier 1 capital (a) (c) | | | $2,260,723 | | | | $2,226,621 | | | | $2,278,580 | | | | $2,226,189 | | | | $2,172,768 | | | | 2 | % | | | 4 | % |
| Tier 1 capital (a) (b) (c) | | | 2,538,773 | | | | 2,493,080 | | | | 2,572,141 | | | | 2,516,194 | | | | 2,500,612 | | | | 2 | % | | | 2 | % |
| Total capital (a) (d) | | | 2,788,420 | | | | 2,744,189 | | | | 2,836,715 | | | | 2,781,354 | | | | 2,922,582 | | | | 2 | % | | | (5 | )% |
| | | | | | | | | | | | | | | | | | | | | | | | | | | | | |
| Risk-weighted assets (“RWA”) (a) (c) | | | 22,451,670 | | | | 21,559,035 | | | | 21,812,015 | | | | 20,783,031 | | | | 20,869,862 | | | | 4 | % | | | 8 | % |
| Average assets for leverage (a) (c) | | | 26,716,255 | | | | 26,519,986 | | | | 26,109,449 | | | | 25,280,856 | | | | 25,347,048 | | | | 1 | % | | | 5 | % |
| | | | | | | | | | | | | | | | | | | | | | | | | | | | | |
| Common equity tier 1 ratio (a) (c) | | | 10.07 | % | | | 10.33 | % | | | 10.45 | % | | | 10.71 | % | | | 10.41 | % | | | | | | | | |
| Tier 1 ratio (a) (c) | | | 11.31 | | | | 11.56 | | | | 11.79 | | | | 12.11 | | | | 11.98 | | | | | | | | | |
| Total capital ratio (a) | | | 12.42 | | | | 12.73 | | | | 13.01 | | | | 13.38 | | | | 14.00 | | | | | | | | | |
| Leverage ratio (a) (c) | | | 9.50 | | | | 9.40 | | | | 9.85 | | | | 9.95 | | | | 9.87 | | | | | | | | | |
| | | | | | | | | | | | | | | | | | | | | | | | | | | | | |
| Total equity to total assets | | | 9.77 | % | | | 9.80 | % | | | 10.08 | % | | | 10.16 | % | | | 9.98 | % | | | | | | | | |
| Tangible common equity/tangible assets(“TCE/TA”) (e) | | | 7.63 | % | | | 7.61 | % | | | 7.82 | % | | | 8.00 | % | | | 7.80 | % | | | | | | | | |
| Period-end shares outstanding (f) | | | 232,019 | | | | 232,547 | | | | 238,587 | | | | 234,237 | | | | 234,021 | | | | * | | | | (1 | )% |
| Cash dividends declared per common share | | | $0.07 | | | | $0.07 | | | | $0.06 | | | | $0.06 | | | | $0.06 | | | | * | | | | 17 | % |
| Book value per common share | | | $9.92 | | | | $9.68 | | | | $9.42 | | | | $9.35 | | | | $9.09 | | | | | | | | | |
| Tangible book value per common share (e) | | | $8.99 | | | | $8.75 | | | | $8.51 | | | | $8.61 | | | | $8.35 | | | | | | | | | |
| Market capitalization (millions) | | | $3,197.2 | | | | $3,046.4 | | | | $3,464.3 | | | | $3,321.5 | | | | $3,667.1 | | | | | | | | | |
| Certain previously reported amounts have been reclassified to agree with current presentation. |
| * Amount is less than one percent. |
| (a) | Current quarter is an estimate. |
| (b) | FHN’s outstanding trust preferred securities were redeemed in 3Q15. 2Q15 includes $50 million of Tier 1 qualifying trust preferred securities. |
| (c) | See Glossary of Terms for definition. |
| (d) | FHN’s outstanding trust preferred securities were redeemed in 3Q15. 2Q15 includes $150 million of Tier 2 qualifying trust preferred securities. |
| (e) | These non-GAAP measures are reconciled to total equity to total assets (GAAP) and to book value per common share (GAAP), respectively, in the Non-GAAP to GAAP reconciliation on page 22 of this financial supplement. |
| (f) | 2Q16 and 1Q16 decreases relate to shares purchased under share repurchase programs; 4Q15 increase related to shares issued in connection with the TrustAtlantic acquisition, partially offset by shares purchased under share repurchase programs. |
FHN BUSINESS SEGMENT HIGHLIGHTS
Quarterly, Unaudited
| | | | | | | | | | | | | | | | | | | | | | | | 2Q16 Changes vs. |
| (Thousands) | | | 2Q16 | | | | 1Q16 | | | | 4Q15 | | | | 3Q15 | | | | 2Q15 | | | | 1Q16 | | | 2Q15 | |
| | | | | | | | | | | | | | | | | | | | | | | | | | | | | | |
| Regional Banking | | | | | | | | | | | | | | | | | | | | | | | | | | | | | |
| Net interest income | | | $178,321 | | | | $172,313 | | | | $169,600 | | | | $165,253 | | | | $165,903 | | | | 3 | % | | | 7 | % | |
| Noninterest income | | | 61,275 | | | | 59,276 | | | | 62,644 | | | | 62,763 | | | | 65,983 | | | | 3 | % | | | (7 | )% | |
| Total revenues | | | 239,596 | | | | 231,589 | | | | 232,244 | | | | 228,016 | | | | 231,886 | | | | 3 | % | | | 3 | % | |
| Provision for loan losses | | | 10,883 | | | | 14,767 | | | | 5,856 | | | | 6,696 | | | | 17,078 | | | | (26 | )% | | | (36 | )% | |
| Noninterest expense (a) | | | 164,315 | | | | 145,351 | | | | 147,546 | | | | 135,589 | | | | 143,960 | | | | 13 | % | | | 14 | % | |
| Income before income taxes | | | 64,398 | | | | 71,471 | | | | 78,842 | | | | 85,731 | | | | 70,848 | | | | (10 | )% | | | (9 | )% | |
| Provision for income taxes | | | 22,455 | | | | 25,426 | | | | 28,131 | | | | 30,876 | | | | 25,086 | | | | (12 | )% | | | (10 | )% | |
| Net income | | | $41,943 | | | | $46,045 | | | | $50,711 | | | | $54,855 | | | | $45,762 | | | | (9 | )% | | | (8 | )% | |
| | | | | | | | | | | | | | | | | | | | | | | | | | | | | | |
| Fixed Income | | | | | | | | | | | | | | | | | | | | | | | | | | | | | |
| Net interest income | | | $3,147 | | | | $2,666 | | | | $3,901 | | | | $3,003 | | | | $4,293 | | | | 18 | % | | | (27 | )% | |
| Noninterest income | | | 78,083 | | | | 67,122 | | | | 61,991 | | | | 51,757 | | | | 56,002 | | | | 16 | % | | | 39 | % | |
| Total revenues | | | 81,230 | | | | 69,788 | | | | 65,892 | | | | 54,760 | | | | 60,295 | | | | 16 | % | | | 35 | % | |
| Noninterest expense (b) | | | 62,881 | | | | 58,668 | | | | 54,605 | | | | 59,844 | | | | 51,253 | | | | 7 | % | | | 23 | % | |
| Income/(loss) before income taxes | | | 18,349 | | | | 11,120 | | | | 11,287 | | | | (5,084 | ) | | | 9,042 | | | | 65 | % | | | NM | | |
| Provision/(benefit) for income taxes | | | 6,755 | | | | 3,875 | | | | 3,971 | | | | (2,384 | ) | | | 3,154 | | | | 74 | % | | | NM | | |
| Net income/(loss) | | | $11,594 | | | | $7,245 | | | | $7,316 | | | | $(2,700 | ) | | | $5,888 | | | | 60 | % | | | 97 | % | |
| | | | | | | | | | | | | | | | | | | | | | | | | | | | | | |
| Corporate | | | | | | | | | | | | | | | | | | | | | | | | | | | | | |
| Net interest income/(expense) | | | $(15,850 | ) | | | $(14,364 | ) | | | $(19,221 | ) | | | $(19,027 | ) | | | $(17,366 | ) | | | (10 | )% | | | 9 | % | |
| Noninterest income | | | 4,909 | | | | 5,723 | | | | 5,486 | | | | 8,559 | | | | 3,901 | | | | (14 | )% | | | 26 | % | |
| Total revenues | | | (10,941 | ) | | | (8,641 | ) | | | (13,735 | ) | | | (10,468 | ) | | | (13,465 | ) | | | (27 | )% | | | 19 | % | |
| Noninterest expense | | | 16,072 | | | | 13,479 | | | | 17,736 | | | | 11,804 | | | | 14,061 | | | | 19 | % | | | 14 | % | |
| Loss before income taxes | | | (27,013 | ) | | | (22,120 | ) | | | (31,471 | ) | | | (22,272 | ) | | | (27,526 | ) | | | (22 | )% | | | 2 | % | |
| Benefit for income taxes | | | (12,840 | ) | | | (11,254 | ) | | | (27,636 | ) | | | (24,946 | ) | | | (15,991 | ) | | | (14 | )% | | | 20 | % | |
| Net income/(loss) | | | $(14,173 | ) | | | $(10,866 | ) | | | $(3,835 | ) | | | $2,674 | | | | $(11,535 | ) | | | (30 | )% | | | (23 | )% | |
| | | | | | | | | | | | | | | | | | | | | | | | | | | | | | |
| Non-Strategic | | | | | | | | | | | | | | | | | | | | | | | | | | | | | |
| Net interest income | | | $10,646 | | | | $11,459 | | | | $12,372 | | | | $14,333 | | | | $13,810 | | | | (7 | )% | | | (23 | )% | |
| Noninterest income | | | 1,247 | | | | 2,184 | | | | 2,111 | | | | 2,024 | | | | 4,415 | | | | (43 | )% | | | (72 | )% | |
| Total revenues | | | 11,893 | | | | 13,643 | | | | 14,483 | | | | 16,357 | | | | 18,225 | | | | (13 | )% | | | (35 | )% | |
| Provision/(provision credit) for loan losses | | | (6,883 | ) | | | (11,767 | ) | | | (4,856 | ) | | | (5,696 | ) | | | (15,078 | ) | | | 42 | % | | | 54 | % | |
| Noninterest expense (c) | | | (16,446 | ) | | | 9,429 | | | | 23,853 | | | | 8,199 | | | | 9,120 | | | | NM | | | | NM | | |
| Income/(loss) before income taxes | | | 35,222 | | | | 15,981 | | | | (4,514 | ) | | | 13,854 | | | | 24,183 | | | | NM | | | | 46 | % | |
| Provision/(benefit) for income taxes | | | 13,646 | | | | 6,192 | | | | (1,751 | ) | | | 5,351 | | | | 9,341 | | | | NM | | | | 46 | % | |
| Net income/(loss) | | | $21,576 | | | | $9,789 | | | | $(2,763 | ) | | | $8,503 | | | | $14,842 | | | | NM | | | | 45 | % | |
| | | | | | | | | | | | | | | | | | | | | | | | | | | | | | |
| Total Consolidated | | | | | | | | | | | | | | | | | | | | | | | | | | | | | |
| Net interest income | | | $176,264 | | | | $172,074 | | | | $166,652 | | | | $163,562 | | | | $166,640 | | | | 2 | % | | | 6 | % | |
| Noninterest income | | | 145,514 | | | | 134,305 | | | | 132,232 | | | | 125,103 | | | | 130,301 | | | | 8 | % | | | 12 | % | |
| Total revenues | | | 321,778 | | | | 306,379 | | | | 298,884 | | | | 288,665 | | | | 296,941 | | | | 5 | % | | | 8 | % | |
| Provision for loan losses | | | 4,000 | | | | 3,000 | | | | 1,000 | | | | 1,000 | | | | 2,000 | | | | 33 | % | | | NM | | |
| Noninterest expense | | | 226,822 | | | | 226,927 | | | | 243,740 | | | | 215,436 | | | | 218,394 | | | | * | | | | 4 | % | |
| Income before income taxes | | | 90,956 | | | | 76,452 | | | | 54,144 | | | | 72,229 | | | | 76,547 | | | | 19 | % | | | 19 | % | |
| Provision for income taxes | | | 30,016 | | | | 24,239 | | | | 2,715 | | | | 8,897 | | | | 21,590 | | | | 24 | % | | | 39 | % | |
| Net income | | | $60,940 | | | | $52,213 | | | | $51,429 | | | | $63,332 | | | | $54,957 | | | | 17 | % | | | 11 | % | |
| Certain previously reported amounts have been reclassified to agree with current presentation. |
| NM - Not meaningful |
| * Amount is less than one percent. |
| (a) | 2Q16 includes $22.0 million of loss accruals related to legal matters. |
| (b) | 3Q15 includes an $11.6 million charge to litigation and regulatory matters related to the resolution of a legal matter. |
| (c) | 2Q16 includes a $31.4 million reversal of repurchase and foreclosure provision as a result of the settlements of certain repurchase claims, somewhat offset by $4.0 million of loss accruals related to legal matters; 4Q15 includes $14.2 million of loss accruals related to legal matters. |
FHN REGIONAL BANKING
Quarterly, Unaudited
| | | | | | | | | | | | | | | | | | | | | | | | 2Q16 Changes vs. | | |
| | | | 2Q16 | | | | 1Q16 | | | | 4Q15 | | | | 3Q15 | | | | 2Q15 | | | | 1Q16 | | 2Q15 | |
| | | | | | | | | | | | | | | | | | | | | | | | | | | | | |
| Income Statement (thousands) | | | | | | | | | | | | | | | | | | | | | | | | | | | | |
| Net interest income | | | $178,321 | | | | $172,313 | | | | $169,600 | | | | $165,253 | | | | $165,903 | | | | 3 | % | | 7 | % | |
| Provision for loan losses | | | 10,883 | | | | 14,767 | | | | 5,856 | | | | 6,696 | | | | 17,078 | | | | (26 | )% | | (36 | )% | |
| Noninterest income: | | | | | | | | | | | | | | | | | | | | | | | | | | | | |
| NSF / Overdraft fees (a) | | | 8,905 | | | | 9,576 | | | | 11,630 | | | | 11,678 | | | | 10,664 | | | | (7 | )% | | (16 | )% | |
| Cash management fees | | | 8,612 | | | | 8,760 | | | | 8,637 | | | | 8,482 | | | | 8,884 | | | | (2 | )% | | (3 | )% | |
| Debit card income | | | 3,464 | | | | 3,221 | | | | 3,302 | | | | 3,313 | | | | 3,323 | | | | 8 | % | | 4 | % | |
| Other | | | 4,466 | | | | 4,288 | | | | 4,382 | | | | 4,398 | | | | 4,538 | | | | 4 | % | | (2 | )% | |
| Total deposit transactions and cash management | | | 25,447 | | | | 25,845 | | | | 27,951 | | | | 27,871 | | | | 27,409 | | | | (2 | )% | | (7 | )% | |
| Brokerage, management fees and commissions | | | 10,665 | | | | 10,415 | | | | 11,021 | | | | 11,620 | | | | 12,456 | | | | 2 | % | | (14 | )% | |
| Trust services and investment management | | | 7,239 | | | | 6,569 | | | | 6,889 | | | | 6,605 | | | | 7,432 | | | | 10 | % | | (3 | )% | |
| Bankcard income (b) | | | 6,432 | | | | 5,132 | | | | 5,423 | | | | 5,257 | | | | 5,587 | | | | 25 | % | | 15 | % | |
| Other service charges | | | 2,579 | | | | 2,318 | | | | 2,358 | | | | 2,562 | | | | 2,637 | | | | 11 | % | | (2 | )% | |
| Miscellaneous revenue | | | 8,913 | | | | 8,997 | | | | 9,002 | | | | 8,848 | | | | 10,462 | | | | (1 | )% | | (15 | )% | |
| Total noninterest income | | | 61,275 | | | | 59,276 | | | | 62,644 | | | | 62,763 | | | | 65,983 | | | | 3 | % | | (7 | )% | |
| Noninterest expense: | | | | | | | | | | | | | | | | | | | | | | | | | | | | |
| Employee compensation, incentives, and benefits | | | 53,413 | | | | 52,173 | | | | 51,507 | | | | 49,204 | | | | 49,819 | | | | 2 | % | | 7 | % | |
| Other (c) | | | 110,902 | | | | 93,178 | | | | 96,039 | | | | 86,385 | | | | 94,141 | | | | 19 | % | | 18 | % | |
| Total noninterest expense | | | 164,315 | | | | 145,351 | | | | 147,546 | | | | 135,589 | | | | 143,960 | | | | 13 | % | | 14 | % | |
| Income before income taxes | | | $64,398 | | | | $71,471 | | | | $78,842 | | | | $85,731 | | | | $70,848 | | | | (10 | )% | | (9 | )% | |
| PPNR (d) | | | 75,281 | | | | 86,238 | | | | 84,698 | | | | 92,427 | | | | 87,926 | | | | (13 | )% | | (14 | )% | |
| Efficiency ratio (e) | | | 68.58 | % | | | 62.76 | % | | | 63.53 | % | | | 59.46 | % | | | 62.08 | % | | | | | | | | |
| | | | | | | | | | | | | | | | | | | | | | | | | | | | | |
| Balance Sheet (millions) | | | | | | | | | | | | | | | | | | | | | | | | | | | | |
| Average loans | | | $15,859 | | | | $15,224 | | | | $14,760 | | | | $14,312 | | | | $14,326 | | | | 4 | % | | 11 | % | |
| Average other earning assets | | | 42 | | | | 47 | | | | 42 | | | | 58 | | | | 55 | | | | (11 | )% | | (24 | )% | |
| Total average earning assets | | | 15,901 | | | | 15,271 | | | | 14,802 | | | | 14,370 | | | | 14,381 | | | | 4 | % | | 11 | % | |
| Average core deposits | | | 17,869 | | | | 17,592 | | | | 17,351 | | | | 16,976 | | | | 16,752 | | | | 2 | % | | 7 | % | |
| Average other deposits | | | 498 | | | | 461 | | | | 338 | | | | 354 | | | | 406 | | | | 8 | % | | 23 | % | |
| Total average deposits | | | 18,367 | | | | 18,053 | | | | 17,689 | | | | 17,330 | | | | 17,158 | | | | 2 | % | | 7 | % | |
| Total period-end deposits | | | 18,674 | | | | 18,534 | | | | 18,077 | | | | 17,287 | | | | 17,226 | | | | 1 | % | | 8 | % | |
| Total period-end assets | | | 17,434 | | | | 16,280 | | | | 16,394 | | | | 15,163 | | | | 15,265 | | | | 7 | % | | 14 | % | |
| Net interest margin (f) | | | 4.57 | % | | | 4.60 | % | | | 4.61 | % | | | 4.63 | % | | | 4.69 | % | | | | | | | | |
| Net interest spread | | | 3.44 | | | | 3.42 | | | | 3.36 | | | | 3.33 | | | | 3.35 | | | | | | | | | |
| Loan yield | | | 3.59 | | | | 3.57 | | | | 3.48 | | | | 3.45 | | | | 3.48 | | | | | | | | | |
| Deposit average rate | | | 0.15 | | | | 0.15 | | | | 0.12 | | | | 0.12 | | | | 0.13 | | | | | | | | | |
| | | | | | | | | | | | | | | | | | | | | | | | | | | | | |
| Key Statistics | | | | | | | | | | | | | | | | | | | | | | | | | | | | |
| Financial center locations | | | 162 | | | | 174 | | | | 177 | | | | 174 | | | | 175 | | | | (7 | )% | | (7 | )% | |
| Certain previously reported amounts have been reclassified to agree with current presentation. |
| (a) | 2Q16 decline driven by changes in consumer behavior; 1Q16 level primarily attributable to seasonality in NSF fees. |
| (b) | 2Q16 increase driven by a significant new relationship. |
| (c) | 2Q16 includes $22.0 million of loss accruals related to legal matters; 1Q16 includes $3.7 million of impairment related to branch closures; 3Q15 decrease primarily driven by lower allocated personnel expenses due in large part to gains recognized in third quarter related to an employee benefit plan amendment. |
| (d) | Pre-provision net revenue is not a GAAP number but is used in regulatory stress test reporting. The presentation of PPNR in this Financial Supplement follows the regulatory definition. |
| (e) | Noninterest expense divided by total revenue. |
| (f) | Net interest margin is computed using total net interest income adjusted for FTE assuming a statutory federal income tax rate of 35 percent and, where applicable, state income taxes. |
FHN FIXED INCOME
Quarterly, Unaudited
| | | | | | | | | | | | | | | | | | 2Q16 Changes vs. |
| | | 2Q16 | | | 1Q16 | | | 4Q15 | | | 3Q15 | | | 2Q15 | | | 1Q16 | | 2Q15 | |
| | | | | | | | | | | | | | | | | | | | | | | |
| Income Statement (thousands) | | | | | | | | | | | | | | | | | | | | | |
| Net interest income | $3,147 | | | $2,666 | | | $3,901 | | | $3,003 | | | $4,293 | | | 18 | % | | (27) | % | |
| Noninterest income: | | | | | | | | | | | | | | | | | | | | | |
| | Fixed income product revenue | 69,279 | | | 57,583 | | | 52,713 | | | 42,969 | | | 46,685 | | | 20 | % | | 48 | % | |
| | Other | 8,804 | | | 9,539 | | | 9,278 | | | 8,788 | | | 9,317 | | | (8) | % | | (6) | % | |
| Total noninterest income | 78,083 | | | 67,122 | | | 61,991 | | | 51,757 | | | 56,002 | | | 16 | % | | 39 | % | |
| Noninterest expense (a) | 62,881 | | | 58,668 | | | 54,605 | | | 59,844 | | | 51,253 | | | 7 | % | | 23 | % | |
| | Income/(loss) before income taxes | $18,349 | | | $11,120 | | | $11,287 | | | $(5,084) | | | $9,042 | | | 65 | % | | NM | | |
| | | | | | | | | | | | | | | | | | | | | | | |
| Efficiency ratio (b) | 77.41 | % | | 84.07 | % | | 82.87 | % | | NM | | | 85.00 | % | | | | | | | |
| Fixed income product average daily revenue | $1,082 | | | $944 | | | $850 | | | $671 | | | $729 | | | 15 | % | | 48 | % | |
| | | | | | | | | | | | | | | | | | | | | | | |
| Balance Sheet (millions) | | | | | | | | | | | | | | | | | | | | | |
| | Average trading inventory | $1,267 | | | $1,138 | | | $1,303 | | | $1,133 | | | $1,358 | | | 11 | % | | (7) | % | |
| | Average other earning assets | 893 | | | 822 | | | 805 | | | 763 | | | 761 | | | 9 | % | | 17 | % | |
| Total average earning assets | 2,160 | | | 1,960 | | | 2,108 | | | 1,896 | | | 2,119 | | | 10 | % | | 2 | % | |
| Total period-end assets | 2,540 | | | 2,361 | | | 1,779 | | | 2,363 | | | 2,274 | | | 8 | % | | 12 | % | |
| Net interest margin (c) | 0.64 | % | | 0.63 | % | | 0.82 | % | | 0.73 | % | | 0.87 | % | | | | | | | |
| Certain previously reported amounts have been reclassified to agree with current presentation. |
| NM - Not meaningful |
| (a) | 3Q15 includes an $11.6 million charge to litigation and regulatory matters related to the resolution of a legal matter. |
| (b) | Noninterest expense divided by total revenue. |
| (c) | Net interest margin is computed using total net interest income adjusted for FTE assuming a statutory federal income tax rate of 35 percent and, where applicable, state income taxes. |
FHN CORPORATE
Quarterly, Unaudited
| | | | | | | | | | | | | | | | | | 2Q16 Changes vs. |
| | | 2Q16 | | | 1Q16 | | | 4Q15 | | | 3Q15 | | | 2Q15 | | | 1Q16 | | 2Q15 | |
| | | | | | | | | | | | | | | | | | | | | | | |
| Income Statement (thousands) | | | | | | | | | | | | | | | | | | | | | |
| Net interest income/(expense) | $(15,850) | | | $(14,364) | | | $(19,221) | | | $(19,027) | | | $(17,366) | | | (10) | % | | 9 | % | |
| Noninterest income excluding securities gains/(losses) (a) | 4,810 | | | 4,149 | | | 4,047 | | | 8,904 | | | 3,893 | | | 16 | % | | 24 | % | |
| Securities gains/(losses), net | 99 | | | 1,574 | | | 1,439 | | | (345) | | | 8 | | | (94) | % | | NM | | |
| Noninterest expense (b) | 16,072 | | | 13,479 | | | 17,736 | | | 11,804 | | | 14,061 | | | 19 | % | | 14 | % | |
| Loss before income taxes | $(27,013) | | | $(22,120) | | | $(31,471) | | | $(22,272) | | | $(27,526) | | | (22) | % | | 2 | % | |
| | | | | | | | | | | | | | | | | | | | | | | |
| Average Balance Sheet (millions) | | | | | | | | | | | | | | | | | | | | | |
| Average loans | $96 | | | $103 | | | $110 | | | $120 | | | $128 | | | (7) | % | | (25) | % | |
| Total earning assets | $4,576 | | | $5,093 | | | $4,830 | | | $4,592 | | | $4,282 | | | (10) | % | | 7 | % | |
| Net interest margin (c) | (1.46) | % | | (1.19) | % | | (1.56) | % | | (1.63) | % | | (1.63) | % | | | | | | | |
| Certain previously reported amounts have been reclassified to agree with current presentation. |
| NM - Not meaningful |
| (a) | 3Q15 includes a $5.8 million gain related to the extinguishment of debt. |
| (b) | 2Q16 includes $2.5 million of negative valuation adjustments associated with derivatives related to prior sales of Visa Class B shares; 4Q15 includes $2.8 million of impairment related to a tax credit investment accounted for under the equity method and $2.7 million of costs related to the TrustAtlantic acquisition. |
| (c) | Net interest margin is computed using total net interest income adjusted for FTE assuming a statutory federal income tax rate of 35 percent and, where applicable, state income taxes. |
FHN NON-STRATEGIC
Quarterly, Unaudited
| | | | | | | | | | | | | 2Q16 Changes vs. |
| | | 2Q16 | | 1Q16 | | 4Q15 | | 3Q15 | | 2Q15 | | 1Q16 | | 2Q15 |
| | | | | | | | | | | | | | | | | |
| Income Statement (thousands) | | | | | | | | | | | | | | | |
| Net interest income | $10,646 | | $11,459 | | $12,372 | | $14,333 | | $13,810 | | (7) | % | | (23) | % |
| Provision/(provision credit) for loan losses | (6,883) | | (11,767) | | (4,856) | | (5,696) | | (15,078) | | 42 | % | | 54 | % |
| Noninterest income (a) | 1,247 | | 2,184 | | 2,111 | | 2,024 | | 4,415 | | (43) | % | | (72) | % |
| Noninterest expense (b) | (16,446) | | 9,429 | | 23,853 | | 8,199 | | 9,120 | | NM | | | NM | |
| | Income/(loss) before income taxes | $35,222 | | $15,981 | | $(4,514) | | $13,854 | | $24,183 | | NM | | | 46 | % |
| | | | | | | | | | | | | | | | | |
| Average Balance Sheet (millions) | | | | | | | | | | | | | | | |
| | Loans | $1,856 | | $1,967 | | $2,073 | | $2,201 | | $2,337 | | (6) | % | | (21) | % |
| | Loans held-for-sale | 103 | | 106 | | 109 | | 113 | | 115 | | (3) | % | | (10) | % |
| | Trading securities | 3 | | 4 | | 5 | | 5 | | 5 | | (25) | % | | (40) | % |
| | Allowance for loan losses | (59) | | (69) | | (76) | | (87) | | (99) | | (14) | % | | (40) | % |
| | Other assets | 46 | | 34 | | 13 | | 14 | | 51 | | 35 | % | | (10) | % |
| Total assets | 1,949 | | 2,042 | | 2,124 | | 2,246 | | 2,409 | | (5) | % | | (19) | % |
| Net interest margin (c) | 2.30 | % | 2.33 | % | 2.25 | % | 2.46 | % | 2.25 | % | | | | | |
| Efficiency ratio (d) | NM | | 69.11 | % | NM | | 50.13 | % | 50.04 | % | | | | | |
| Certain previously reported amounts have been reclassified to agree with current presentation. |
| NM - Not meaningful |
| (a) | 2Q15 includes a $2.7 million pre-tax gain on sale of property. |
| (b) | 2Q16 includes a $31.4 million reversal of repurchase and foreclosure provision as a result of the settlements of certain repurchase claims, somewhat offset by $4.0 million of loss accruals related to legal matters; 4Q15 includes $14.2 million of loss accruals related to legal matters. |
| (c) | Net interest margin is computed using total net interest income adjusted for FTE assuming a statutory federal income tax rate of 35 percent and, where applicable, state income taxes. |
| (d) | Noninterest expense divided by total revenue excluding securities gains/(losses). |
FHN ASSET QUALITY: CONSOLIDATED
Quarterly, Unaudited
| | | | | | | | | | | | | | | | | | | 2Q16 Changes vs. |
| (Thousands) | 2Q16 | | | 1Q16 | | | 4Q15 | | | 3Q15 | | | 2Q15 | | | 1Q16 | | 2Q15 | |
| | | | | | | | | | | | | | | | | | | | | | | | |
| Allowance for Loan Losses Walk-Forward | | | | | | | | | | | | | | | | | | | |
| | Beginning reserve | $204,034 | | | $210,242 | | | $210,814 | | | $221,351 | | | $228,328 | | | (3) | % | | (11) | % | |
| | | Provision | 4,000 | | | 3,000 | | | 1,000 | | | 1,000 | | | 2,000 | | | 33 | % | | NM | | |
| | | Charge-offs | (18,296) | | | (17,612) | | | (16,614) | | | (21,810) | | | (19,434) | | | 4 | % | | (6) | % | |
| | | Recoveries | 10,069 | | | 8,404 | | | 15,042 | | | 10,273 | | | 10,457 | | | 20 | % | | (4) | % | |
| | Ending balance | $199,807 | | | $204,034 | | | $210,242 | | | $210,814 | | | $221,351 | | | (2) | % | | (10) | % | |
| | Reserve for unfunded commitments | 5,351 | | | 5,495 | | | 5,926 | | | 6,231 | | | 5,561 | | | (3) | % | | (4) | % | |
| Total allowance for loan losses plus reserve for unfunded commitments | $205,158 | | | $209,529 | | | $216,168 | | | $217,045 | | | $226,912 | | | (2) | % | | (10) | % | |
| | | | | | | | | | | | | | | | | | | | | | | | |
| Allowance for Loan Losses | | | | | | | | | | | | | | | | | | | | | |
| Regional Banking | $146,351 | | | $143,088 | | | $137,586 | | | $128,942 | | | $132,741 | | | 2 | % | | 10 | % | |
| Non-Strategic | 53,456 | | | 60,946 | | | 72,656 | | | 81,872 | | | 88,610 | | | (12) | % | | (40) | % | |
| | Total allowance for loan losses | $199,807 | | | $204,034 | | | $210,242 | | | $210,814 | | | $221,351 | | | (2) | % | | (10) | % | |
| | | | | | | | | | | | | | | | | | | | | | | | |
| Nonperforming Assets | | | | | | | | | | | | | | | | | | | | | |
| Regional Banking | | | | | | | | | | | | | | | | | | | | | |
| | Nonperforming loans | $60,754 | | | $72,323 | | | $56,475 | | | $50,986 | | | $69,094 | | | (16) | % | | (12) | % | |
| | Foreclosed real estate (a) | 7,031 | | | 11,045 | | | 16,298 | | | 17,042 | | | 19,230 | | | (36) | % | | (63) | % | |
| | | Total Regional Banking | $67,785 | | | $83,368 | | | $72,773 | | | $68,028 | | | $88,324 | | | (19) | % | | (23) | % | |
| Non-Strategic | | | | | | | | | | | | | | | | | | | | | |
| | Nonperforming loans | $114,947 | | | $120,335 | | | $120,946 | | | $129,951 | | | $130,894 | | | (4) | % | | (12) | % | |
| | Nonperforming loans held-for-sale after fair value adjustments | 8,195 | | | 8,568 | | | 7,846 | | | 7,347 | | | 6,372 | | | (4) | % | | 29 | % | |
| | Foreclosed real estate (a) | 7,119 | | | 6,415 | | | 8,679 | | | 8,830 | | | 9,879 | | | 11 | % | | (28) | % | |
| | | Total Non-Strategic | $130,261 | | | $135,318 | | | $137,471 | | | $146,128 | | | $147,145 | | | (4) | % | | (11) | % | |
| Corporate | | | | | | | | | | | | | | | | | | | | | |
| | Nonperforming loans | $897 | | | $927 | | | $1,677 | | | $3,043 | | | $3,079 | | | (3) | % | | (71) | % | |
| | | Total nonperforming assets | $198,943 | | | $219,613 | | | $211,921 | | | $217,199 | | | $238,548 | | | (9) | % | | (17) | % | |
| | | | | | | | | | | | | | | | | | | | | | | | |
| Net Charge-Offs | | | | | | | | | | | | | | | | | | | | | |
| Regional Banking | $7,620 | | | $9,265 | | | $(2,787) | | | $10,495 | | | $10,318 | | | (18) | % | | (26) | % | |
| Non-Strategic | 607 | | | (57) | | | 4,359 | | | 1,042 | | | (1,341) | | | NM | | | NM | | |
| | Total net charge-offs | $8,227 | | | $9,208 | | | $1,572 | | | $11,537 | | | $8,977 | | | (11) | % | | (8) | % | |
| | | | | | | | | | | | | | | | | | | | | | | | |
| Consolidated Key Ratios (b) | | | | | | | | | | | | | | | | | | | | | |
| NPL % | 0.95 | % | | 1.10 | % | | 1.01 | % | | 1.10 | % | | 1.20 | % | | | | | | | |
| NPA % | 1.03 | | | 1.20 | | | 1.15 | | | 1.25 | | | 1.37 | | | | | | | | |
| Net charge-offs % | 0.19 | | | 0.21 | | | 0.04 | | | 0.28 | | | 0.21 | | | | | | | | |
| Allowance / loans % | 1.07 | | | 1.16 | | | 1.19 | | | 1.26 | | | 1.31 | | | | | | | | |
| Allowance / NPL | 1.13 | x | | 1.05 | x | | 1.17 | x | | 1.15 | x | | 1.09 | x | | | | | | | |
| Allowance / NPA | 1.05 | x | | 0.97 | x | | 1.03 | x | | 1.00 | x | | 0.95 | x | | | | | | | |
| Allowance / net charge-offs | 6.04 | x | | 5.51 | x | | NM | | | 4.61 | x | | 6.15 | x | | | | | | | |
| | | | | | | | | | | | | | | | | | | | | | | | |
| Other | | | | | | | | | | | | | | | | | | | | | |
| Loans past due 90 days or more (c) | $34,175 | | | $36,958 | | | $40,591 | | | $38,455 | | | $39,077 | | | (8) | % | | (13) | % | |
| | Guaranteed portion (c) | 13,822 | | | 16,279 | | | 16,631 | | | 16,856 | | | 16,221 | | | (15) | % | | (15) | % | |
| Foreclosed real estate from government insured loans | 5,903 | | | 7,061 | | | 8,086 | | | 9,460 | | | 11,159 | | | (16) | % | | (47) | % | |
| Period-end loans, net of unearned income (millions) | 18,589 | | | 17,575 | | | 17,687 | | | 16,725 | | | 16,937 | | | 6 | % | | 10 | % | |
| Certain previously reported amounts have been reclassified to agree with current presentation. |
| NM - Not meaningful |
| (a) | Excludes foreclosed real estate from government-insured mortgages. |
| (b) | See Glossary of Terms for definitions of Consolidated Key Ratios. |
| (c) | Includes loans held-for-sale. |
FHN ASSET QUALITY: CONSOLIDATED
Quarterly, Unaudited
| | | | | | | | | | | | | | | | | 2Q16 Changes vs. |
| | | 2Q16 | | | 1Q16 | | | 4Q15 | | | 3Q15 | | | 2Q15 | | 1Q16 | | 2Q15 |
| | | | | | | | | | | | | | | | | | | | | |
| Key Portfolio Details | | | | | | | | | | | | | | | | | | | |
| C&I | | | | | | | | | | | | | | | | |
| Period-end loans ($ millions) | $11,179 | | | $10,239 | | | $10,436 | | | $9,610 | | | $9,833 | | 9 | % | | 14 | % |
| 30+ Delinq. % (a) (b) | 0.04 | % | | 0.37 | % | | 0.08 | % | | 0.09 | % | | 0.08 | % | | | | | |
| NPL % | 0.27 | | | 0.38 | | | 0.25 | | | 0.31 | | | 0.44 | | | | | | |
| Charge-offs % (qtr. annualized) | 0.24 | | | 0.23 | | | NM | | | 0.26 | | | 0.17 | | | | | | |
| Allowance / loans % | 0.72 | % | | 0.79 | % | | 0.71 | % | | 0.74 | % | | 0.80 | % | | | | | |
| Allowance / charge-offs | 3.21 | x | | 3.50 | x | | NM | | | 2.83 | x | | 4.85 | x | | | | | |
| | | | | | | | | | | | | | | | | | | | | |
| Commercial Real Estate | | | | | | | | | | | | | | | | | | | |
| Period-end loans ($ millions) | $1,969 | | | $1,849 | | | $1,675 | | | $1,488 | | | $1,401 | | 6 | % | | 41 | % |
| 30+ Delinq. % (a) (c) | 0.15 | % | | 0.18 | % | | 0.27 | % | | 0.43 | % | | 0.23 | % | | | | | |
| NPL % | 0.40 | | | 0.51 | | | 0.52 | | | 0.54 | | | 0.84 | | | | | | |
| Charge-offs % (qtr. annualized) | NM | | | 0.10 | | | 0.29 | | | NM | | | 0.22 | | | | | | |
| Allowance / loans % | 1.54 | % | | 1.39 | % | | 1.50 | % | | 1.70 | % | | 1.53 | % | | | | | |
| Allowance / charge-offs | NM | | | 15.16 | x | | 5.39 | x | | NM | | | 7.29 | x | | | | | |
| | | | | | | | | | | | | | | | | | | | | |
| Consumer Real Estate | | | | | | | | | | | | | | | | | | | |
| Period-end loans ($ millions) | $4,641 | | | $4,690 | | | $4,767 | | | $4,814 | | | $4,870 | | (1) | % | | (5) | % |
| 30+ Delinq. % (a) | 0.80 | % | | 0.82 | % | | 1.00 | % | | 0.92 | % | | 0.94 | % | | | | | |
| NPL % | 2.31 | | | 2.43 | | | 2.33 | | | 2.32 | | | 2.35 | | | | | | |
| Charge-offs % (qtr. annualized) | 0.04 | | | 0.10 | | | 0.09 | | | 0.18 | | | NM | | | | | | |
| Allowance / loans % | 1.27 | % | | 1.44 | % | | 1.69 | % | | 1.71 | % | | 1.75 | % | | | | | |
| Allowance / charge-offs | 29.40 | x | | 14.06 | x | | 18.49 | x | | 9.41 | x | | NM | | | | | | |
| | | | | | | | | | | | | | | | | | | | | |
| Permanent Mortgage | | | | | | | | | | | | | | | | | | | |
| Period-end loans ($ millions) | $439 | | | $443 | | | $454 | | | $464 | | | $488 | | (1) | % | | (10) | % |
| 30+ Delinq. % (a) | 2.21 | % | | 2.50 | % | | 2.11 | % | | 2.01 | % | | 2.26 | % | | | | | |
| NPL % | 6.97 | | | 6.83 | | | 6.97 | | | 7.30 | | | 6.66 | | | | | | |
| Charge-offs % (qtr. annualized) | NM | | | NM | | | NM | | | 0.67 | | | 0.11 | | | | | | |
| Allowance / loans % | 4.01 | % | | 4.24 | % | | 4.17 | % | | 4.33 | % | | 4.59 | % | | | | | |
| Allowance / charge-offs | NM | | | NM | | | NM | | | 6.25 | x | | 40.53 | x | | | | | |
| | | | | | | | | | | | | | | | | | | | | |
| Credit Card and Other | | | | | | | | | | | | | | | | | | | |
| Period-end loans ($ millions) | $361 | | | $354 | | | $355 | | | $349 | | | $346 | | 2 | % | | 4 | % |
| 30+ Delinq. % (a) | 1.19 | % | | 1.13 | % | | 1.08 | % | | 1.19 | % | | 1.09 | % | | | | | |
| NPL % | 0.20 | | | 0.38 | | | 0.38 | | | 0.21 | | | 0.22 | | | | | | |
| Charge-offs % (qtr. annualized) | 2.73 | | | 2.86 | | | 2.56 | | | 2.79 | | | 5.73 | | | | | | |
| Allowance / loans % | 3.30 | % | | 3.23 | % | | 3.35 | % | | 3.28 | % | | 3.84 | % | | | | | |
| Allowance / charge-offs | 1.21 | x | | 1.13 | x | | 1.30 | x | | 1.16 | x | | 0.66 | x | | | | | |
| NM - Not meaningful |
| (a) | 30+ Delinquency % includes all accounts delinquent more than one month and still accruing interest. |
| (b) | 1Q16 increase was driven by regional bank C&I but over half were favorably resolved in early second quarter 2016. |
| (c) | 3Q15 increase was due to 2 purchased credit impaired loans from the 2013 MNB acquisition. |
FHN ASSET QUALITY: REGIONAL BANKING
Quarterly, Unaudited
| | | | | | | | | | | | | | | | | | 2Q16 Changes vs. |
| | | 2Q16 | | | 1Q16 | | | 4Q15 | | | 3Q15 | | | 2Q15 | | | 1Q16 | | 2Q15 | |
| | | | | | | | | | | | | | | | | | | | | | | |
| Total Regional Banking | | | | | | | | | | | | | | | | | | |
| Period-end loans ($ millions) | $16,703 | | | $15,570 | | | $15,571 | | | $14,483 | | | $14,556 | | | 7 | % | | 15 | % | |
| 30+ Delinq. % (a) | 0.16 | % | | 0.39 | % | | 0.23 | % | | 0.25 | % | | 0.21 | % | | | | | | | |
| NPL % | 0.36 | | | 0.46 | | | 0.36 | | | 0.35 | | | 0.47 | | | | | | | | |
| Charge-offs % (qtr. annualized) | 0.19 | | | 0.24 | | | NM | | | 0.29 | | | 0.29 | | | | | | | | |
| Allowance / loans % | 0.88 | % | | 0.92 | % | | 0.88 | % | | 0.89 | % | | 0.91 | % | | | | | | | |
| Allowance / charge-offs | 4.78 | x | | 3.84 | x | | NM | | | 3.10 | x | | 3.21 | x | | | | | | | |
| | | | | | | | | | | | | | | | | | | | | | | |
Key Portfolio Details
C&I | | | | | | | | | | | | | | | | | | | | | |
| Period-end loans ($ millions) | $10,759 | | | $9,818 | | | $10,015 | | | $9,178 | | | $9,398 | | | 10 | % | | 14 | % | |
| 30+ Delinq. % (a) (b) | 0.04 | % | | 0.37 | % | | 0.08 | % | | 0.10 | % | | 0.08 | % | | | | | | | |
| NPL % | 0.24 | | | 0.36 | | | 0.23 | | | 0.18 | | | 0.32 | | | | | | | | |
| Charge-offs % (qtr. annualized) | 0.25 | | | 0.24 | | | NM | | | 0.33 | | | 0.18 | | | | | | | | |
| Allowance / loans % | 0.74 | % | | 0.81 | % | | 0.72 | % | | 0.72 | % | | 0.78 | % | | | | | | | |
| Allowance / charge-offs | 3.23 | x | | 3.48 | x | | NM | | | 2.21 | x | | 4.48 | x | | | | | | | |
| | | | | | | | | | | | | | | | | | | | | | | |
| Commercial Real Estate | | | | | | | | | | | | | | | | | | | | | |
| Period-end loans ($ millions) | $1,969 | | | $1,849 | | | $1,675 | | | $1,488 | | | $1,400 | | | 6 | % | | 41 | % | |
| 30+ Delinq. % (a) (c) | 0.15 | % | | 0.18 | % | | 0.27 | % | | 0.43 | % | | 0.23 | % | | | | | | | |
| NPL % | 0.40 | | | 0.51 | | | 0.52 | | | 0.54 | | | 0.84 | | | | | | | | |
| Charge-offs % (qtr. annualized) | NM | | | 0.10 | | | 0.31 | | | NM | | | 0.22 | | | | | | | | |
| Allowance / loans % | 1.54 | % | | 1.39 | % | | 1.50 | % | | 1.70 | % | | 1.53 | % | | | | | | | |
| Allowance / charge-offs | NM | | | 14.23 | x | | 4.99 | x | | NM | | | 7.22 | x | | | | | | | |
| | | | | | | | | | | | | | | | | | | | | | | |
| Consumer Real Estate | | | | | | | | | | | | | | | | | | | | | |
| Period-end loans ($ millions) | $3,577 | | | $3,531 | | | $3,515 | | | $3,469 | | | $3,413 | | | 1 | % | | 5 | % | |
| 30+ Delinq. % (a) | 0.40 | % | | 0.46 | % | | 0.52 | % | | 0.48 | % | | 0.47 | % | | | | | | | |
| NPL % | 0.73 | | | 0.76 | | | 0.68 | | | 0.75 | | | 0.78 | | | | | | | | |
| Charge-offs % (qtr. annualized) | NM | | | 0.06 | | | 0.11 | | | 0.11 | | | 0.08 | | | | | | | | |
| Allowance / loans % | 0.68 | % | | 0.75 | % | | 0.83 | % | | 0.79 | % | | 0.73 | % | | | | | | | |
| Allowance / charge-offs | NM | | | 11.78 | x | | 7.68 | x | | 7.62 | x | | 9.73 | x | | | | | | | |
| | | | | | | | | | | | | | | | | | | | | | | |
| Credit Card, Permanent Mortgage, and Other | | | | | | | | | | | | | | | | | | | | | |
| Period-end loans ($ millions) | $398 | | | $372 | | | $366 | | | $348 | | | $345 | | | 7 | % | | 15 | % | |
| 30+ Delinq. % (a) | 1.16 | % | | 1.18 | % | | 1.13 | % | | 1.33 | % | | 1.18 | % | | | | | | | |
| NPL % | 0.10 | | | 0.28 | | | 0.29 | | | 0.14 | | | 0.14 | | | | | | | | |
| Charge-offs % (qtr. annualized) (d) | 2.54 | | | 2.82 | | | 2.40 | | | 2.49 | | | 5.57 | | | | | | | | |
| Allowance / loans % | 3.07 | % | | 3.06 | % | | 3.04 | % | | 3.00 | % | | 3.72 | % | | | | | | | |
| Allowance / charge-offs | 1.25 | x | | 1.10 | x | | 1.29 | x | | 1.19 | x | | 0.66 | x | | | | | | | |
| | | | | | | | | | | | | | | | | | | | | | | |
| ASSET QUALITY: CORPORATE | | | | | | | | | | | | | | | | | | | | | |
| | | | | | | | | | | | | | | | | | | | | | | |
| Permanent Mortgage | | | | | | | | | | | | | | | | | | | | | |
| Period-end loans ($ millions) | $85 | | | $92 | | | $97 | | | $107 | | | $113 | | | (8) | % | | (25) | % | |
| 30+ Delinq. % (a) | 4.92 | % | | 3.66 | % | | 2.92 | % | | 2.95 | % | | 2.51 | % | | | | | | | |
| NPL % | 1.06 | | | 1.00 | | | 1.72 | | | 2.85 | | | 2.72 | | | | | | | | |
| Charge-offs % (qtr. annualized) | NM | | | NM | | | NM | | | NM | | | NM | | | | | | | | |
| Allowance / loans % | NM | | | NM | | | NM | | | NM | | | NM | | | | | | | | |
| Allowance / charge-offs | NM | | | NM | | | NM | | | NM | | | NM | | | | | | | | |
| NM - Not meaningful |
| (a) | 30+ Delinquency % includes all accounts delinquent more than one month and still accruing interest. |
| (b) | Over half of the loans driving the 1Q16 increase were favorably resolved in early second quarter 2016. |
| (c) | 3Q15 increase was due to 2 purchased credit impaired loans from the 2013 MNB acquisition. |
| (d) | 2Q15 was primarily driven by charge-offs in a sub segment of the credit card portfolio which had previously been reserved for. |
FHN ASSET QUALITY: NON-STRATEGIC
Quarterly, Unaudited
| | | | | | | | | | | | | | | | | | 2Q16 Changes vs. |
| | | 2Q16 | | | 1Q16 | | | 4Q15 | | | 3Q15 | | | 2Q15 | | | 1Q16 | | 2Q15 | |
| | | | | | | | | | | | | | | | | | | | | | | |
| Total Non-Strategic | | | | | | | | | | | | | | | | | | |
| Period-end loans ($ millions) | $1,801 | | | $1,913 | | | $2,018 | | | $2,135 | | | $2,268 | | | (6) | % | | (21) | % | |
| 30+ Delinq. % (a) | 1.56 | % | | 1.59 | % | | 1.77 | % | | 1.57 | % | | 1.67 | % | | | | | | | |
| NPL % | 6.38 | | | 6.29 | | | 5.99 | | | 6.08 | | | 5.77 | | | | | | | | |
| Charge-offs % (qtr. annualized) | 0.13 | | | NM | | | 0.83 | | | 0.19 | | | NM | | | | | | | | |
| Allowance / loans % | 2.97 | % | | 3.19 | % | | 3.60 | % | | 3.83 | % | | 3.91 | % | | | | | | | |
| Allowance / charge-offs | 21.90 | x | | NM | | | 4.20 | x | | 19.80 | x | | NM | | | | | | | | |
| | | | | | | | | | | | | | | | | | | | | | | |
| Key Portfolio Details | | | | | | | | | | | | | | | | | | | | | |
| Commercial | | | | | | | | | | | | | | | | | | | | | |
| Period-end loans ($ millions) | $420 | | | $421 | | | $422 | | | $432 | | | $435 | | | * | | | (3) | % | |
| 30+ Delinq. % (a) | 0.00 | % | | 0.23 | % | | 0.02 | % | | 0.02 | % | | 0.02 | % | | | | | | | |
| NPL % | 1.00 | | | 0.83 | | | 0.83 | | | 3.08 | | | 3.07 | | | | | | | | |
| Charge-offs % (qtr. annualized) | NM | | | 0.03 | | | 3.87 | | | NM | | | NM | | | | | | | | |
| Allowance / loans % | 0.33 | % | | 0.34 | % | | 0.34 | % | | 1.35 | % | | 1.24 | % | | | | | | | |
| Allowance / charge-offs | NM | | | 10.11 | x | | 0.09 | x | | NM | | | NM | | | | | | | | |
| | | | | | | | | | | | | | | | | | | | | | | |
| Consumer Real Estate | | | | | | | | | | | | | | | | | | | | | |
| Period-end loans ($ millions) | $1,064 | | | $1,160 | | | $1,251 | | | $1,345 | | | $1,458 | | | (8) | % | | (27) | % | |
| 30+ Delinq. % (a) | 2.16 | % | | 1.91 | % | | 2.34 | % | | 2.07 | % | | 2.06 | % | | | | | | | |
| NPL % | 7.59 | | | 7.52 | | | 6.97 | | | 6.36 | | | 6.03 | | | | | | | | |
| Charge-offs % (qtr. annualized) | 0.26 | | | 0.21 | | | 0.04 | | | 0.37 | | | NM | | | | | | | | |
| Allowance / loans % | 3.27 | % | | 3.51 | % | | 4.12 | % | | 4.09 | % | | 4.14 | % | | | | | | | |
| Allowance / charge-offs | 12.14 | x | | 16.09 | x | | NM | | | 10.67 | x | | NM | | | | | | | | |
| | | | | | | | | | | | | | | | | | | | | | | |
| Permanent Mortgage | | | | | | | | | | | | | | | | | | | | | |
| Period-end loans ($ millions) | $308 | | | $322 | | | $336 | | | $348 | | | $365 | | | (4) | % | | (16) | % | |
| 30+ Delinq. % (a) | 1.66 | % | | 2.22 | % | | 1.88 | % | | 1.58 | % | | 2.12 | % | | | | | | | |
| NPL % | 9.51 | | | 8.95 | | | 8.80 | | | 8.71 | | | 7.92 | | | | | | | | |
| Charge-offs % (qtr. annualized) | NM | | | NM | | | NM | | | 0.90 | | | 0.14 | | | | | | | | |
| Allowance / loans % | 5.53 | % | | 5.70 | % | | 5.61 | % | | 5.75 | % | | 6.11 | % | | | | | | | |
| Allowance / charge-offs | NM | | | NM | | | NM | | | 6.23 | x | | 44.22 | x | | | | | | | |
| | | | | | | | | | | | | | | | | | | | | | | |
| Other Consumer | | | | | | | | | | | | | | | | | | | | | |
| Period-end loans ($ millions) | $9 | | | $10 | | | $9 | | | $10 | | | $10 | | | (10) | % | | (10) | % | |
| 30+ Delinq. % (a) | 1.06 | % | | 1.23 | % | | 1.47 | % | | 1.77 | % | | 1.31 | % | | | | | | | |
| NPL % | 7.98 | | | 7.70 | | | 7.28 | | | 7.09 | | | 6.86 | | | | | | | | |
| Charge-offs % (qtr. annualized) | 1.15 | | | NM | | | 5.37 | | | 10.22 | | | 5.97 | | | | | | | | |
| Allowance / loans % | 2.83 | % | | 4.63 | % | | 9.07 | % | | 10.34 | % | | 4.95 | % | | | | | | | |
| Allowance / charge-offs | 2.41 | x | | NM | | | 1.67 | x | | 0.98 | x | | 0.81 | x | | | | | | | |
| NM - Not meaningful |
* Amount is less than one percent.
| (a) | 30+ Delinquency % includes all accounts delinquent more than one month and still accruing interest. |
FHN: PORTFOLIO METRICS
Unaudited
| C&I Portfolio: $11.2 Billion (60.1% of Total Loans) as of June 30, 2016 | | | | | |
| | | | | | | % OS |
| | General Corporate, Commercial, and Business Banking Loans | | | | | 75% |
| | Loans to Mortgage Companies | | | | | 20% |
| | Trust Preferred Loans | | | | | 3% |
| | Bank Holding Company Loans | | | | | 2% |
Consumer Real Estate (primarily Home Equity) Portfolio: $4.6 Billion (25.0% of Total Loans)
| Origination LTV and FICO for Portfolio as of June 30, 2016 | Loan-to-Value |
| (excludes whole loan insurance) | <=60% | >60% - <=80% | >80% - 90% | | >90% |
| | FICO score greater than or equal to 740 | 11% | | 23% | | 17% | | 12% |
| | FICO score 720-739 | 1% | | 4% | | 4% | | 3% |
| | FICO score 700-719 | 1% | | 3% | | 3% | | 2% |
| | FICO score 660-699 | 1% | | 3% | | 3% | | 3% |
| | FICO score 620-659 | 1% | | 1% | | 1% | | 1% |
| | FICO score less than 620 | -% | | 1% | | -% | | 1% |
| | | | | | | | | |
| Origination LTV and FICO for Portfolio - Regional Bank as of June 30, 2016 | Loan-to-Value |
| (excludes whole loan insurance) | <=60% | >60% - <=80% | >80% - 90% | | >90% |
| | FICO score greater than or equal to 740 | 11% | | 24% | | 17% | | 14% |
| | FICO score 720-739 | 1% | | 4% | | 3% | | 3% |
| | FICO score 700-719 | 1% | | 3% | | 2% | | 2% |
| | FICO score 660-699 | 1% | | 3% | | 3% | | 2% |
| | FICO score 620-659 | 1% | | 1% | | 1% | | 1% |
| | FICO score less than 620 | -% | | 1% | | -% | | 1% |
| | | | | | | | | |
| Origination LTV and FICO for Portfolio - Non-Strategic as of June 30, 2016 | Loan-to-Value |
| (excludes whole loan insurance) | <=60% | >60% - <=80% | >80% - 90% | | >90% |
| | FICO score greater than or equal to 740 | 8% | | 20% | | 15% | | 5% |
| | FICO score 720-739 | 2% | | 5% | | 6% | | 2% |
| | FICO score 700-719 | 2% | | 6% | | 6% | | 2% |
| | FICO score 660-699 | 2% | | 5% | | 4% | | 4% |
| | FICO score 620-659 | -% | | 1% | | 2% | | 1% |
| | FICO score less than 620 | -% | | -% | | -% | | 2% |
Consumer Real Estate Portfolio Detail:
| | | | | Origination Characteristics |
| | Vintage | Balances ($B) | | W/A Age (mo.) | | CLTV | | FICO | % TN | | % 1st lien |
| | pre-2003 | $- | | 173 | | 78% | | 702 | 39% | | 28% |
| | 2003 | $0.1 | | 156 | | 77% | | 715 | 29% | | 34% |
| | 2004 | $0.2 | | 143 | | 80% | | 718 | 18% | | 28% |
| | 2005 | $0.3 | | 131 | | 82% | | 724 | 15% | | 17% |
| | 2006 | $0.3 | | 120 | | 79% | | 729 | 20% | | 18% |
| | 2007 | $0.4 | | 108 | | 80% | | 737 | 26% | | 19% |
| | 2008 | $0.2 | | 97 | | 75% | | 745 | 73% | | 51% |
| | 2009 | $0.1 | | 85 | | 72% | | 748 | 86% | | 58% |
| | 2010 | $0.1 | | 71 | | 78% | | 752 | 92% | | 72% |
| | 2011 | $0.3 | | 59 | | 76% | | 760 | 88% | | 85% |
| | 2012 | $0.6 | | 48 | | 77% | | 764 | 90% | | 91% |
| | 2013 | $0.5 | | 37 | | 78% | | 755 | 86% | | 85% |
| | 2014 | $0.5 | | 24 | | 82% | | 757 | 86% | | 89% |
| | 2015 | $0.7 | | 11 | | 80% | | 758 | 82% | | 87% |
| | 2016 | $0.4 | | 3 | | 81% | | 762 | 84% | | 90% |
| | Total | $4.7 | | 62 | | 79% | | 749 (a) | 67% | | 66% |
| | | | | | | | | | | | |
| (a) | 749 average portfolio origination FICO; 745 weighted average portfolio FICO (refreshed). |
FHN NON-GAAP TO GAAP RECONCILIATION
Quarterly, Unaudited
| (Dollars and shares in thousands, except per share data) | 2Q16 | | | 1Q16 | | | 4Q15 | | | 3Q15 | | | 2Q15 | |
| Tangible Common Equity (Non-GAAP) | | | | | | | | | | | | | | |
| (A) Total equity (GAAP) | $2,691,924 | | | $2,642,948 | | | $2,639,586 | | | $2,580,245 | | | $2,517,905 | |
| Less: Noncontrolling interest (a) | 295,431 | | | 295,431 | | | 295,431 | | | 295,431 | | | 295,431 | |
| Less: Preferred stock | 95,624 | | | 95,624 | | | 95,624 | | | 95,624 | | | 95,624 | |
| (B) Total common equity | $2,300,869 | | | $2,251,893 | | | $2,248,531 | | | $2,189,190 | | | $2,126,850 | |
| Less: Intangible assets (GAAP) (b) | 214,923 | | | 216,222 | | | 217,522 | | | 171,556 | | | 172,854 | |
| (C) Tangible common equity (Non-GAAP) | $2,085,946 | | | $2,035,671 | | | $2,031,009 | | | $2,017,634 | | | $1,953,996 | |
| | | | | | | | | | | | | | | | |
| Tangible Assets (Non-GAAP) | | | | | | | | | | | | | | |
| (D) Total assets (GAAP) | $27,541,070 | | | $26,963,682 | | | $26,192,637 | | | $25,386,073 | | | $25,237,392 | |
| Less: Intangible assets (GAAP) (b) | 214,923 | | | 216,222 | | | 217,522 | | | 171,556 | | | 172,854 | |
| (E) Tangible assets (Non-GAAP) | $27,326,147 | | | $26,747,460 | | | $25,975,115 | | | $25,214,517 | | | $25,064,538 | |
| | | | | | | | | | | | | | | | |
| Average Tangible Common Equity (Non-GAAP) | | | | | | | | | | | | | | |
| (F) Average total equity (GAAP) | $2,655,488 | | | $2,644,374 | | | $2,659,575 | | | $2,545,544 | | | $2,511,929 | |
| Less: Average noncontrolling interest (a) | 295,431 | | | 295,431 | | | 295,431 | | | 295,431 | | | 295,431 | |
| Less: Average preferred stock | 95,624 | | | 95,624 | | | 95,624 | | | 95,624 | | | 95,624 | |
| (G) Total average common equity | $2,264,433 | | | $2,253,319 | | | $2,268,520 | | | $2,154,489 | | | $2,120,874 | |
| Less: Average intangible assets (GAAP) (b) | 215,556 | | | 216,855 | | | 211,757 | | | 172,191 | | | 173,486 | |
| (H) Average tangible common equity (Non-GAAP) | $2,048,877 | | | $2,036,464 | | | $2,056,763 | | | $1,982,298 | | | $1,947,388 | |
| | | | | | | | | | | | | | | | |
| Annualized Net Income Available to Common Shareholders | | | | | | | | | | | | | | |
| (I) Net income available to common shareholders (annualized) | $227,395 | | | $192,299 | | | $186,590 | | | $233,302 | | | $202,780 | |
| | | | | | | | | | | | | | | | |
| Period-end Shares Outstanding | | | | | | | | | | | | | | |
| (J) Period-end shares outstanding | 232,019 | | | 232,547 | | | 238,587 | | | 234,237 | | | 234,021 | |
| | | | | | | | | | | | | | | | |
| Ratios | | | | | | | | | | | | | | |
| (I)/(G) Return on common equity (GAAP) | 10.04 | % | | 8.53 | % | | 8.23 | % | | 10.83 | % | | 9.56 | % |
| (I)/(H) Return on average tangible common equity (“ROTCE”) (Non-GAAP) | 11.10 | % | | 9.44 | % | | 9.07 | % | | 11.77 | % | | 10.41 | % |
| (A)/(D) Total equity to total assets (GAAP) | 9.77 | % | | 9.80 | % | | 10.08 | % | | 10.16 | % | | 9.98 | % |
| (C)/(E) Tangible common equity to tangible assets (“TCE/TA”) (Non-GAAP) | 7.63 | % | | 7.61 | % | | 7.82 | % | | 8.00 | % | | 7.80 | % |
| (B)/(J) Book value per common share (GAAP) | $9.92 | | | $9.68 | | | $9.42 | | | $9.35 | | | $9.09 | |
| (C)/(J) Tangible book value per common share (Non-GAAP) | $8.99 | | | $8.75 | | | $8.51 | | | $8.61 | | | $8.35 | |
| (a) | Included in Total equity on the Consolidated Balance Sheet. |
| (b) | Includes goodwill and other intangible assets, net of amortization. |
| FHN GLOSSARY OF TERMS | |
| | |
| | |
| | |
| | |
| Average Assets for Leverage: The amount of assets a company uses to calculate the leverage ratio, which includes average total assets less disallowed portions of goodwill, other intangibles, and deferred tax assets, as well as certain other regulatory adjustments made to tier 1 capital. | |
| |
| | |
| Common Equity Tier 1 Ratio: Ratio consisting of common equity adjusted for certain unrealized gains/(losses) on available-for-sale securities, less disallowed portions of goodwill, other intangibles, and deferred tax assets as well as certain other regulatory deductions divided by risk-weighted assets. | |
| | |
| Core Businesses: Management considers regional banking, fixed income, and corporate as FHN’s core businesses. Non-strategic has significant legacy assets and operations that are being wound down. | |
| | |
| Fully Taxable Equivalent (“FTE”): Reflects the amount of tax-exempt income adjusted to a level that would yield the same after-tax income had that income been subject to taxation. | |
| | |
| Risk-Weighted Assets: A regulatory risk-based calculation that takes into account the broad differences in risks among a banking organization’s assets and off-balance sheet financial instruments. | |
| | |
| Tier 1 Capital Ratio: Ratio consisting of shareholders’ equity adjusted for certain unrealized gains/(losses) on available-for-sale securities, plus qualifying portions of noncontrolling interests, less disallowed portions of goodwill, other intangible assets, and deferred tax assets as well as certain other regulatory deductions divided by risk-weighted assets. | |
| | |
| Troubled Debt Restructuring (“TDR”): A restructuring of debt whereby a creditor for economic or legal reasons related to the borrower’s financial difficulties grants a concession to the borrower that it would not otherwise consider. Such concession is granted in an attempt to protect as much of the creditor’s investment as possible by increasing the probability of repayment. | |
| | |
| | |
| Key Ratios | |
| | |
| Return on Average Assets: Ratio is annualized net income to average total assets. | |
| | |
| Return on Average Common Equity: Ratio is annualized net income available to common shareholders to average common equity. | |
| | |
| Return on Average Tangible Common Equity: Ratio is annualized net income available to common shareholders to average tangible common equity. | |
| | |
| Fee Income to Total Revenue: Ratio is fee income excluding securities gains/(losses) to total revenue excluding securities gains/(losses). | |
| | |
| Efficiency Ratio: Ratio is noninterest expense to total revenue excluding securities gains/(losses). | |
| | |
| Leverage Ratio: Ratio is tier 1 capital to average assets for leverage. | |
| | |
| | |
| Asset Quality - Consolidated Key Ratios | |
| | |
| NPL %: Ratio is nonperforming loans in the loan portfolio to total period-end loans. | |
| | |
| NPA %: Ratio is nonperforming assets related to the loan portfolio to total period-end loans plus foreclosed real estate and other assets. | |
| | |
| Net charge-offs %: Ratio is annualized net charge-offs to total average loans. | |
| | |
| Allowance / loans: Ratio is allowance for loan losses to total period-end loans. | |
| | |
| Allowance / NPL: Ratio is allowance for loan losses to nonperforming loans in the loan portfolio. | |
| | |
| Allowance / NPA: Ratio is allowance for loan losses to nonperforming assets related to the loan portfolio. | |
| | |
| Allowance / charge-offs: Ratio is allowance for loan losses to annualized net charge-offs. | |
| | |

First Horizon National Corporation Second Quarter 2016 Earnings July 15, 2016
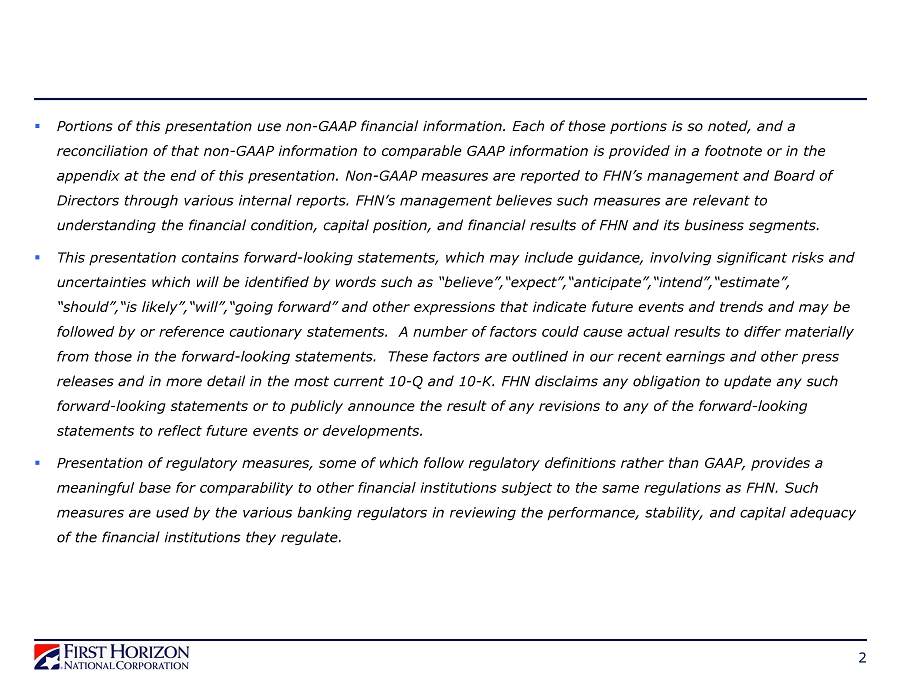
2 ▪ Portions of this presentation use non - GAAP financial information. Each of those portions is so noted, and a reconciliation of that non - GAAP information to comparable GAAP information is provided in a footnote or in the appendix at the end of this presentation. Non - GAAP measures are reported to FHN’s management and Board of Directors through various internal reports. FHN’s management believes such measures are relevant to understanding the financial condition, capital position, and financial results of FHN and its business segments. ▪ This presentation contains forward - looking statements, which may include guidance, involving significant risks and uncertainties which will be identified by words such as “ believe”,“expect”,“anticipate”,“intend”,“estimate ”, “ should”,“is likely”,“will”,“going forward” and other expressions that indicate future events and trends and may be followed by or reference cautionary statements. A number of factors could cause actual results to differ materially from those in the forward - looking statements. These factors are outlined in our recent earnings and other press releases and in more detail in the most current 10 - Q and 10 - K. FHN disclaims any obligation to update any such forward - looking statements or to publicly announce the result of any revisions to any of the forward - looking statements to reflect future events or developments. ▪ Presentation of regulatory measures, some of which follow regulatory definitions rather than GAAP, provides a meaningful base for comparability to other financial institutions subject to the same regulations as FHN. Such measures are used by the various banking regulators in reviewing the performance, stability, and capital adequacy of the financial institutions they regulate.
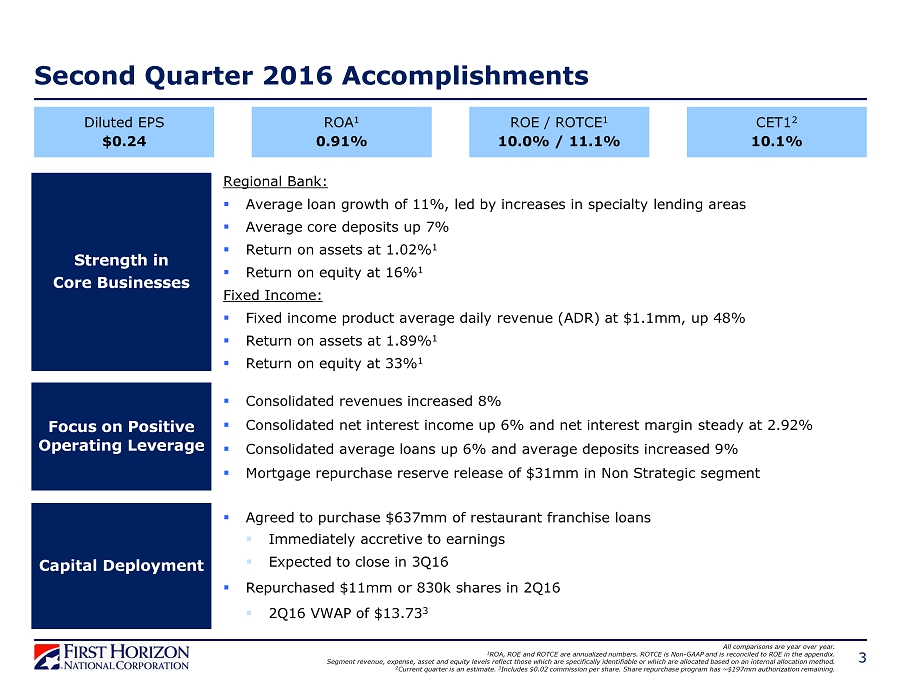
3 Second Quarter 2016 Accomplishments Strength in Core Businesses Focus on Positive Operating Leverage Capital Deployment Regional Bank: ▪ Average loan growth of 11%, led by increases in specialty lending areas ▪ Average core deposits up 7% ▪ Return on assets at 1.02% 1 ▪ Return on equity at 16% 1 Fixed Income: ▪ Fixed income product average daily revenue (ADR) at $1.1mm, up 48% ▪ Return on assets at 1.89% 1 ▪ Return on equity at 33% 1 ▪ Agreed to purchase $637mm of restaurant franchise loans ▪ Immediately accretive to earnings ▪ Expected to close in 3Q16 ▪ Repurchased $11mm or 830k shares in 2Q16 ▪ 2Q16 VWAP of $13.73 3 All comparisons are year over year. 1 ROA, ROE and ROTCE are annualized numbers. ROTCE is Non - GAAP and is reconciled to ROE in the appendix. Segment revenue, expense, asset and equity levels reflect those which are specifically identifiable or which are allocated ba se d on an internal allocation method. 2 Current quarter is an estimate. 3 Includes $0.02 commission per share. Share repurchase program has ~$197mm authorization remaining. ▪ Consolidated revenues increased 8% ▪ Consolidated net interest income up 6% and net interest margin steady at 2.92% ▪ Consolidated average loans up 6% and average deposits increased 9% ▪ Mortgage repurchase reserve release of $31mm in Non Strategic segment Diluted EPS $0.24 ROA 1 0.91% CET1 2 10.1% ROE / ROTCE 1 10.0% / 11.1%

FINANCIAL RESULTS 4

2Q16 Consolidated Financial Results 5 Net Interest Income Fee Income Expense $ in millions Financial Results 2Q16 $176 Pre - Provision Net Revenue (PPNR) 1 $146 $227 $95 $57 2Q16 vs +6% +12% +4% +21% +12% 1Q16 $172 $134 $227 $78 $48 2Q15 $167 $130 $218 $79 $51 1Q16 +2% +8% * +22% +18% 2Q15 Actuals ▪ Diluted EPS of $0.24 in 2Q16 ▪ Strong pre - provision net revenue growth of 22% LQ and 21% YOY ▪ Net interest income increase driven by commercial loan growth ▪ Fee income up primarily due to increased Fixed Income revenues ▪ Pre - tax impact of notable items: ▪ +$31.4mm mortgage repurchase reserve release ▪ - $26.0mm legal expense accrual ▪ - $2.5mm valuation adjustment for derivatives related to prior sales of Visa Class B shares ▪ Effective tax rate of 33% in 2Q16 Net Income Available to Common Shareholders (NIAC) Numbers may not add to total due to rounding. LQ – Linked Quarter. YOY - Year over Year. NM – Not Meaningful . * - less than 1%. 1 Pre - provision net revenue is not a GAAP number, but is used in regulatory stress test reporting. The presentation of PPNR follows the regulatory definition. $91 +19% $76 $77 +19% Pretax Income Total Revenue $322 +8% $306 $297 +5% Loan Loss Provision $4 NM $3 $2 NM $17.8 +6% $17.3 $16.8 +3% Total Average Loans ($B) $19.7 +9% $19.4 $18.1 +1% Total Average Core Deposits ($B)
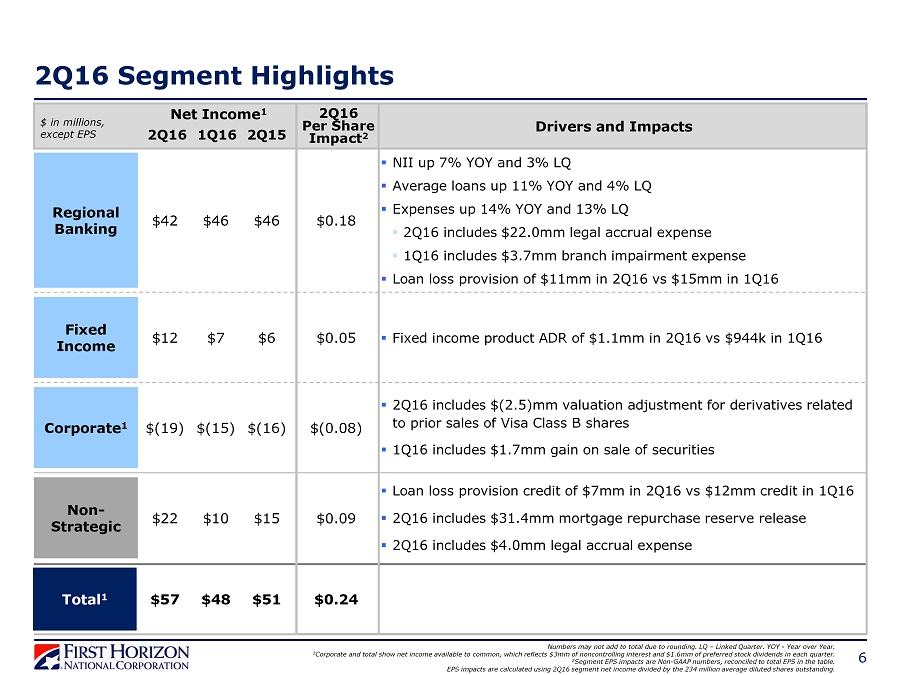
2Q16 Segment Highlights 6 Drivers and Impacts Net Income 1 $ in millions, except EPS 2Q16 Per Share Impact 2 Regional Banking Fixed Income Corporate 1 Non - Strategic Total 1 1Q16 $46 $7 $(15) $10 $48 2Q15 $46 $6 $(16) $15 $51 2Q16 $42 $12 $(19) $22 $57 $0.18 $0.05 $(0.08) $0.09 $0.24 ▪ Fixed income product ADR of $1.1mm in 2Q16 vs $944k in 1Q16 ▪ Loan loss provision credit of $7mm in 2Q16 vs $12mm credit in 1Q16 ▪ 2Q16 includes $31.4mm mortgage repurchase reserve release ▪ 2Q16 includes $4.0mm legal accrual expense ▪ NII up 7% YOY and 3% LQ ▪ Average loans up 11% YOY and 4% LQ ▪ Expenses up 14% YOY and 13% LQ ▪ 2Q16 includes $22.0mm legal accrual expense ▪ 1Q16 includes $3.7mm branch impairment expense ▪ Loan loss provision of $11mm in 2Q16 vs $15mm in 1Q16 Numbers may not add to total due to rounding. LQ – Linked Quarter. YOY - Year over Year. 1 Corporate and total show net income available to common, which reflects $3mm of noncontrolling interest and $1.6mm of preferr ed stock dividends in each quarter. 2 Segment EPS impacts are Non - GAAP numbers, reconciled to total EPS in the table. EPS impacts are calculated using 2Q16 segment net income divided by the 234 million average diluted shares outstanding. ▪ 2Q16 includes $(2.5)mm valuation adjustment for derivatives related to prior sales of Visa Class B shares ▪ 1Q16 includes $1.7mm gain on sale of securities
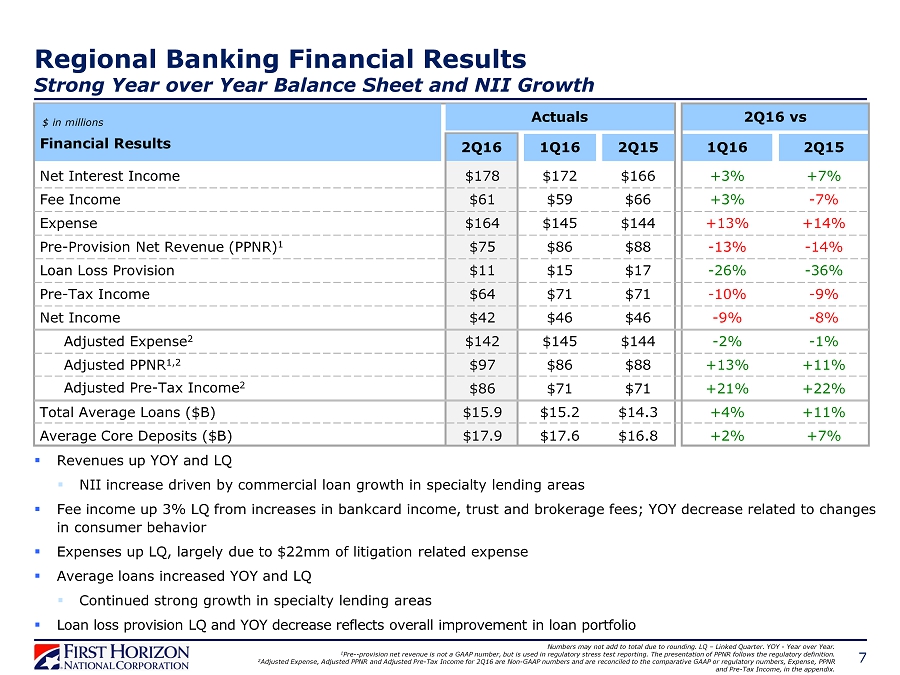
Adjusted Expense 2 Regional Banking Financial Results Strong Year over Year Balance Sheet and NII Growth 7 Net Interest Income Fee Income Expense $ in millions Financial Results 2Q16 $178 $61 $164 2Q16 vs +7% - 7% +14% 1Q16 $172 $59 $145 2Q15 $166 $66 $144 1Q16 +3% +3% +13% 2Q15 Actuals ▪ Revenues up YOY and LQ ▪ NII increase driven by commercial loan growth in specialty lending areas ▪ Fee income up 3% LQ from increases in bankcard income, trust and brokerage fees; YOY decrease related to changes in consumer behavior ▪ Expenses up LQ, largely due to $22mm of litigation related expense ▪ Average loans increased YOY and LQ ▪ Continued strong growth in specialty lending areas ▪ Loan loss provision LQ and YOY decrease reflects overall improvement in loan portfolio Numbers may not add to total due to rounding. LQ – Linked Quarter. YOY - Year over Year. 1 Pre - - provision net revenue is not a GAAP number, but is used in regulatory stress test reporting. The presentation of PPNR follows t he regulatory definition. 2 Adjusted Expense, Adjusted PPNR and Adjusted Pre - Tax Income for 2Q16 are Non - GAAP numbers and are reconciled to the comparative GAAP or regulatory numbers, Expense, PPNR and Pre - Tax Income, in the appendix. Net Income $42 $46 $46 - 8% - 9% Total Average Loans ($B) Average Core Deposits ($B) $15.9 $15.2 $14.3 +11% +4% $17.9 $17.6 $16.8 +7% +2% Loan Loss Provision $11 - 36% $15 $17 - 26% $142 $145 $144 - 1% - 2% Pre - Provision Net Revenue (PPNR) 1 $75 $86 $88 - 14% - 13% Pre - Tax Income $64 $71 $71 - 9% - 10% Adjusted PPNR 1,2 $97 $86 $88 +11% +13% Adjusted Pre - Tax Income 2 $86 $71 $71 +22% +21%
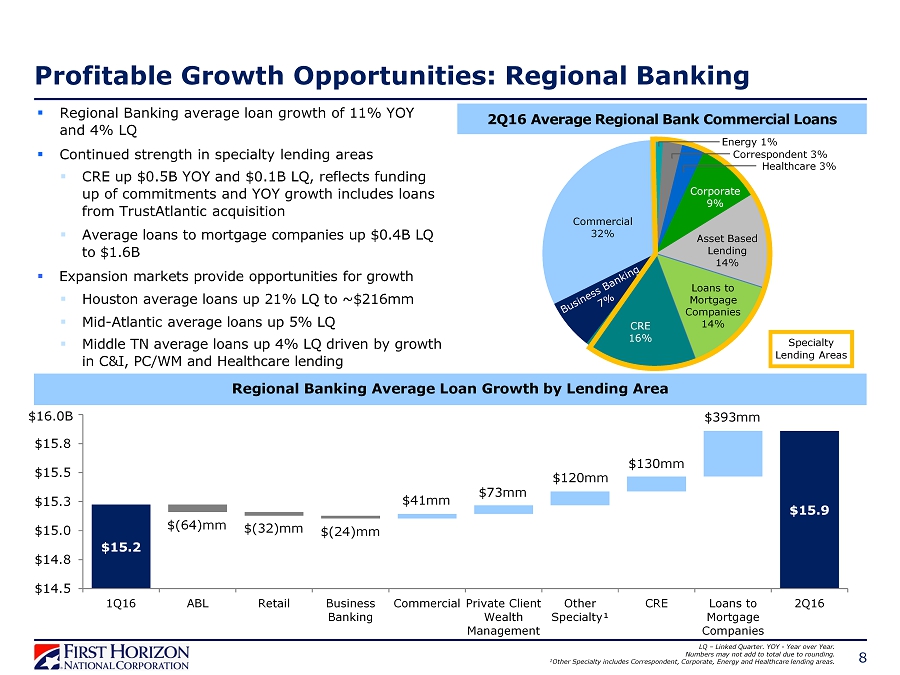
8 Profitable Growth Opportunities: Regional Banking LQ – Linked Quarter. YOY - Year over Year. Numbers may not add to total due to rounding. 1 Other Specialty includes Correspondent, Corporate, Energy and Healthcare lending areas. $15.2 $15.9 $14.5 $14.8 $15.0 $15.3 $15.5 $15.8 $16.0 1Q16 ABL Retail Business Banking Commercial Private Client Wealth Management Other Specialty¹ CRE Loans to Mortgage Companies 2Q16 $16.0B $41mm $(24)mm $73mm $130mm $(32)mm $(64)mm $120mm $393mm ▪ Regional Banking average loan growth of 11% YOY and 4% LQ ▪ Continued strength in specialty lending areas ▪ CRE up $0.5B YOY and $0.1B LQ, reflects funding up of commitments and YOY growth includes loans from TrustAtlantic acquisition ▪ Average loans to mortgage companies up $0.4B LQ to $1.6B ▪ Expansion markets provide opportunities for growth ▪ Houston average loans up 21% LQ to ~$216mm ▪ Mid - Atlantic average loans up 5% LQ ▪ Middle TN average loans up 4% LQ driven by growth in C&I, PC/WM and Healthcare lending 2Q16 Average Regional Bank Commercial Loans Corporate 9% CRE 16% Commercial 32% Healthcare 3% Correspondent 3% Energy 1% Specialty Lending Areas Asset Based Lending 14% Loans to Mortgage Companies 14% Regional Banking Average Loan Growth by Lending Area

Restaurant Franchise Loan Acquisition 9 ▪ Agreed to acquire $637mm of restaurant franchise loans in Southeast and Southwest ▪ Acquisition creates strategically compelling specialty restaurant franchise lending area with ~$800mm of outstanding loans at close ▪ Estimated NII impact of ~$4 - 6mm quarterly ▪ No expected tangible book value dilution ▪ Expected to close in 3Q16 Deal Summary Acquired Loan Portfolio Overview Average Relationship 1 ~$5mm Average Loan Size 1 ~$2mm Fix/Float 2 74/26% Weighted Average Yield 2 5.06% Weighted Average Maturity 2 ~4 years Numbers may not add to total due to rounding. 1 Average relationship and loan sizes are based on commitments as of May 2016. 2 Fix/float, weighted average yield and weighted average maturity are based on outstanding loans as of May 2016. 3 Other includes AR, CA, NM, NV, SC, and VA. Pro Forma Combined Loan Portfolio by Concept Taco Bell 14% Wendy’s 13% Hardee’s 6% Domino’s 6% Applebee’s 6% Popeyes 6% Burger King 5% Sonic Drive - In 5% Papa John’s 4% Other 35% Pro Forma Combined Loan Portfolio Geography TX 21% GA 10% AZ 9% AL 9% FL 8% KY 8% NC 7% MS 5% TN 5% OH 5% Other 3 13%
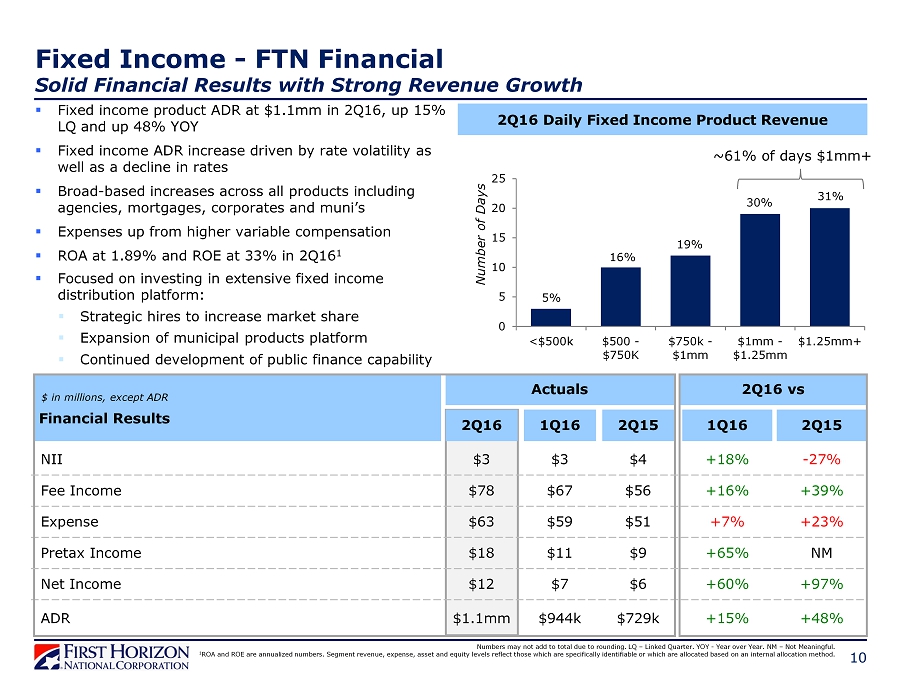
Fixed Income - FTN Financial Solid Financial Results with Strong Revenue Growth 2Q16 Daily Fixed Income Product Revenue ▪ Fixed income product ADR at $1.1mm in 2Q16, up 15% LQ and up 48% YOY ▪ Fixed income ADR increase driven by rate volatility as well as a decline in rates ▪ Broad - based increases across all products including agencies, mortgages, corporates and muni’s ▪ Expenses up from higher variable compensation ▪ ROA at 1.89% and ROE at 33% in 2Q16 1 ▪ Focused on investing in extensive fixed income distribution platform: ▪ Strategic hires to increase market share ▪ Expansion of municipal products platform ▪ Continued development of public finance capability 5% 16% 19% 30% 31% 0 5 10 15 20 25 <$500k $500 - $750K $750k - $1mm $1mm - $1.25mm $1.25mm+ Number of Days Numbers may not add to total due to rounding. LQ – Linked Quarter. YOY - Year over Year. NM – Not Meaningful. 1 ROA and ROE are annualized numbers. Segment revenue, expense, asset and equity levels reflect those which are specifically identifiable or which are allocated ba sed on an internal allocation method. ~61% of days $1mm+ NII Fee Income $ in millions, except ADR Financial Results 2 Q16 $3 Net Income $78 $12 2 Q16 vs - 27% +39% +97% 1Q16 $3 $67 $7 2Q15 $4 $ 56 $6 1Q16 +18 % +16% +60% 2 Q15 Actuals Expense $ 63 +23% $59 $51 +7 % ADR $1.1mm $944k $729k +48% +15% Pretax Income $18 NM $11 $9 +65 % 10
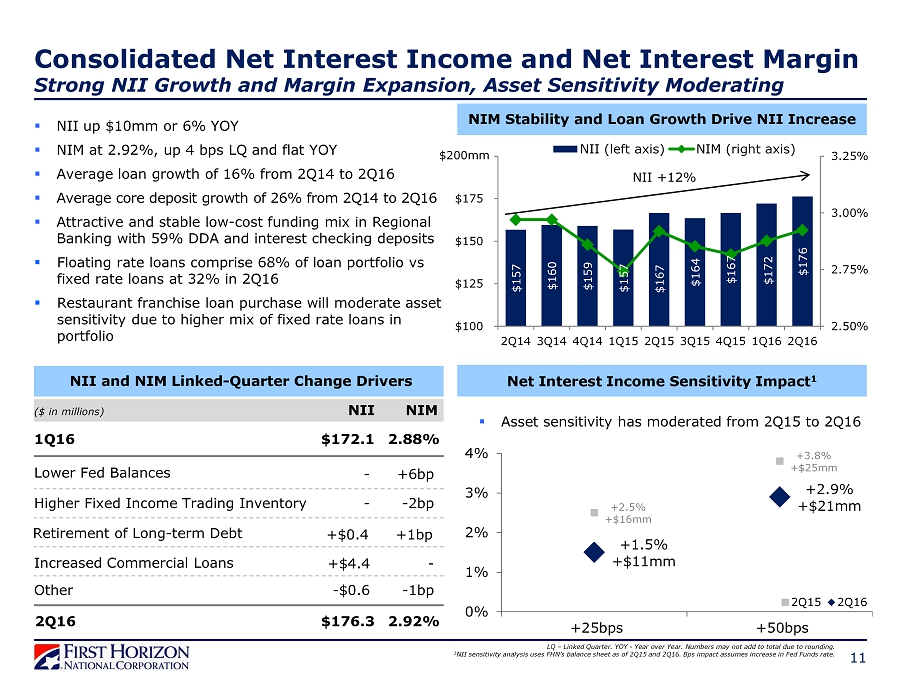
Increased Commercial Loans Other 11 Net Interest Income Sensitivity Impact 1 Consolidated Net Interest Income and Net Interest Margin Strong NII Growth and Margin Expansion, Asset Sensitivity Moderating +2.5% +$16mm +3.8% +$25mm +1.5% +$11mm +2.9% +$21mm 0% 1% 2% 3% 4% +25bps +50bps 2Q15 2Q16 ▪ NII up $10mm or 6% YOY ▪ NIM at 2.92%, up 4 bps LQ and flat YOY ▪ Average loan growth of 16% from 2Q14 to 2Q16 ▪ Average core deposit growth of 26% from 2Q14 to 2Q16 ▪ Attractive and stable low - cost funding mix in Regional Banking with 59% DDA and interest checking deposits ▪ Floating rate loans comprise 68% of loan portfolio vs fixed rate loans at 32% in 2Q16 ▪ Restaurant franchise loan purchase will moderate asset sensitivity due to higher mix of fixed rate loans in portfolio NIM Stability and Loan Growth Drive NII Increase NII and NIM Linked - Quarter Change Drivers LQ – Linked Quarter. YOY - Year over Year. Numbers may not add to total due to rounding. 1 NII sensitivity analysis uses FHN’s balance sheet as of 2Q15 and 2Q16. Bps impact assumes increase in Fed Funds rate. 2Q16 $176.3 2.92% 1Q16 $172.1 2.88% Lower Fed Balances - $0.6 - 1bp Higher Fixed Income Trading Inventory - 2bp +$4.4 - - +6bp - NII NIM ($ in millions) $157 $160 $159 $157 $167 $164 $167 $172 $176 2.50% 2.75% 3.00% 3.25% $100 $125 $150 $175 $200 2Q14 3Q14 4Q14 1Q15 2Q15 3Q15 4Q15 1Q16 2Q16 NII (left axis) NIM (right axis) $200mm NII +12% Retirement of Long - term Debt +1bp +$0.4 ▪ Asset sensitivity has moderated from 2Q15 to 2Q16
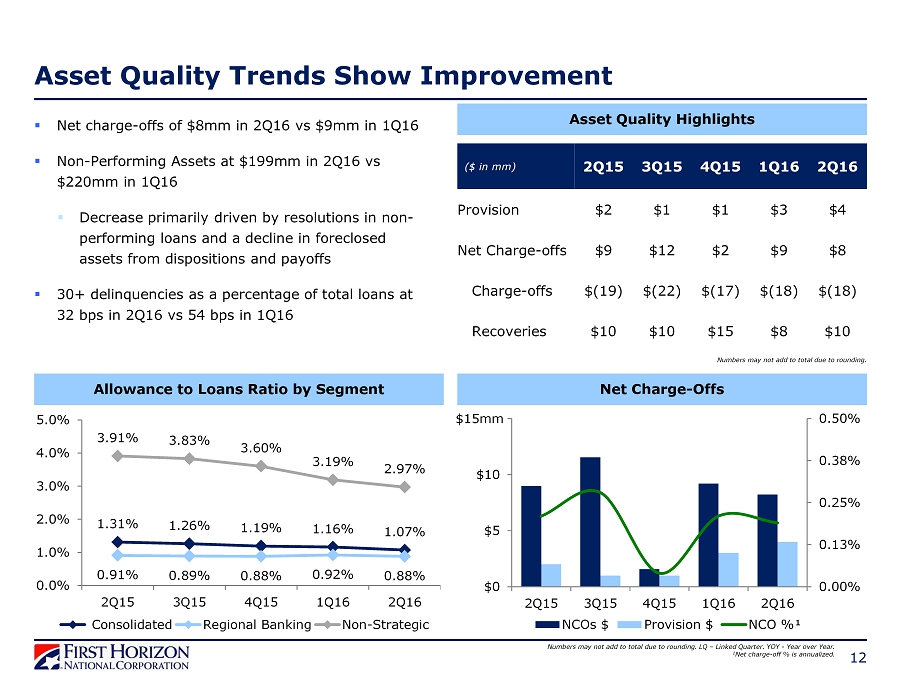
12 Allowance to Loans Ratio by Segment 1.31% 1.26% 1.19% 1.16% 1.07% 0.91% 0.89% 0.88% 0.92% 0.88% 3.91% 3.83% 3.60% 3.19% 2.97% 0.0% 1.0% 2.0% 3.0% 4.0% 5.0% 2Q15 3Q15 4Q15 1Q16 2Q16 Consolidated Regional Banking Non-Strategic Net Charge - Offs Asset Quality Trends Show Improvement 0.00% 0.13% 0.25% 0.38% 0.50% $0 $5 $10 $15 2Q15 3Q15 4Q15 1Q16 2Q16 NCOs $ Provision $ NCO %¹ $15mm ▪ Net charge - offs of $8mm in 2Q16 vs $9mm in 1Q16 ▪ Non - Performing Assets at $199mm in 2Q16 vs $220mm in 1Q16 ▪ Decrease primarily driven by resolutions in non - performing loans and a decline in foreclosed assets from dispositions and payoffs ▪ 30+ delinquencies as a percentage of total loans at 32 bps in 2Q16 vs 54 bps in 1Q16 Numbers may not add to total due to rounding. LQ – Linked Quarter. YOY - Year over Year. 1 Net charge - off % is annualized. ($ in mm) 2Q15 3Q15 4Q15 1Q16 2Q16 Provision $2 $1 $1 $3 $4 Net Charge - offs $9 $12 $2 $9 $8 Charge - offs $(19) $(22) $(17) $(18) $(18) Recoveries $10 $10 $15 $8 $10 Asset Quality Highlights Numbers may not add to total due to rounding.
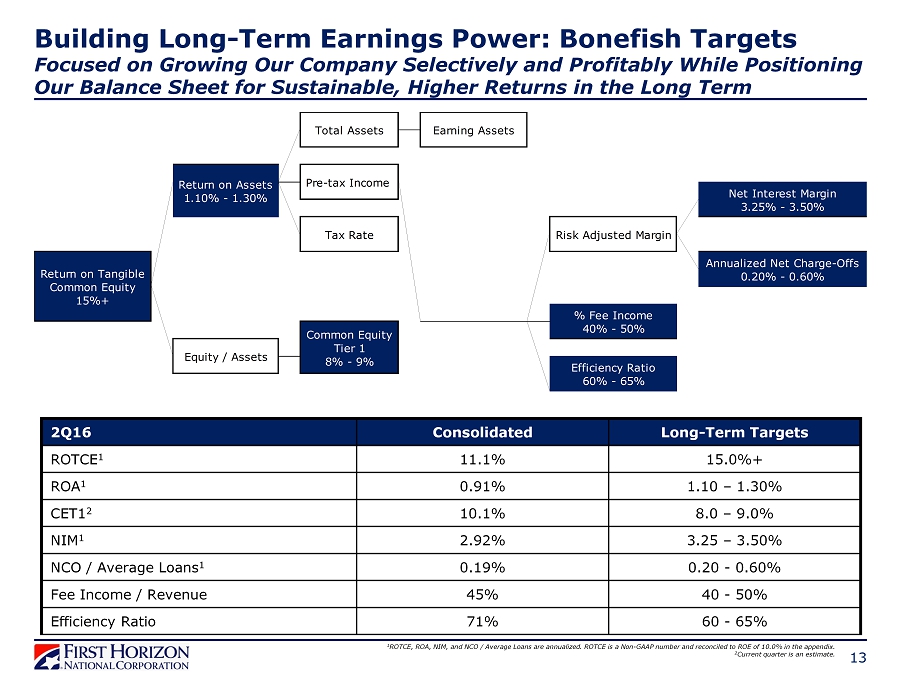
13 2Q16 Consolidated Long - Term Targets ROTCE 1 11.1% 15.0%+ ROA 1 0.91% 1.10 – 1.30% CET1 2 10.1% 8.0 – 9.0% NIM 1 2.92% 3.25 – 3.50% NCO / Average Loans 1 0.19% 0.20 - 0.60% Fee Income / Revenue 45% 40 - 50% Efficiency Ratio 71% 60 - 65% 1 ROTCE, ROA, NIM, and NCO / Average Loans are annualized. ROTCE is a Non - GAAP number and reconciled to ROE of 10.0% in the append ix. 2 Current quarter is an estimate. Building Long - Term Earnings Power: Bonefish Targets Focused on Growing Our Company Selectively and Profitably While Positioning Our Balance Sheet for Sustainable, Higher Returns in the Long Term Risk Adjusted Margin Total Assets Earning Assets Pre-tax Income Tax Rate Annualized Net Charge-Offs 0.20% - 0.60% % Fee Income 40% - 50% Efficiency Ratio 60% - 65% Return on Tangible Common Equity 15%+ Equity / Assets Common Equity Tier 1 8% - 9% Return on Assets 1.10% - 1.30% Net Interest Margin 3.25% - 3.50%
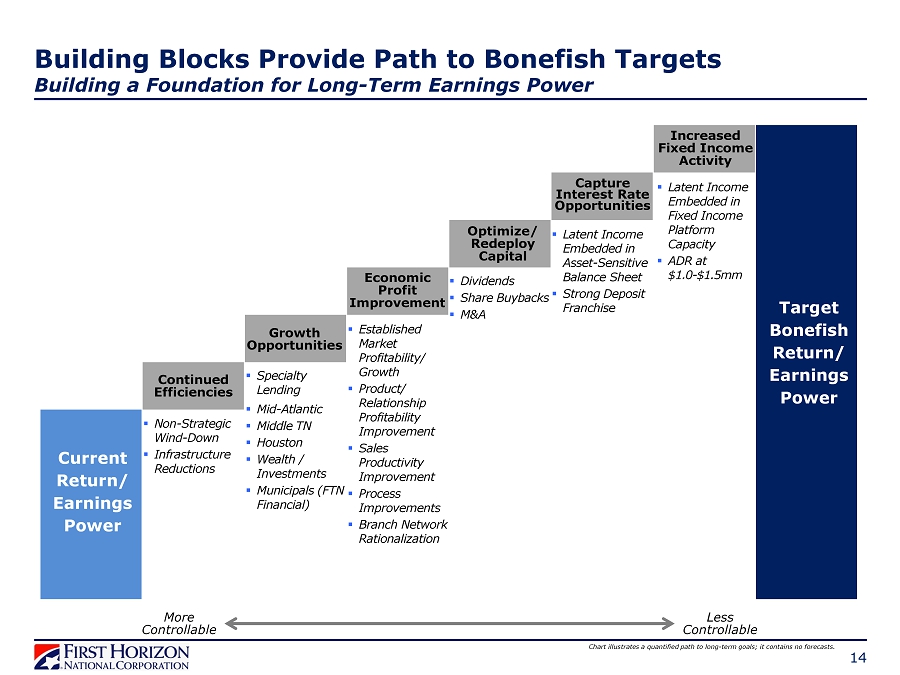
14 Building Blocks Provide Path to Bonefish Targets Building a Foundation for Long - Term Earnings Power Chart illustrates a quantified path to long - term goals; it contains no forecasts. Current Return/ Earnings Power Increased Fixed Income Activity Target Bonefish Return/ Earnings Power Growth Opportunities Economic Profit Improvement Optimize/ Redeploy Capital Continued Efficiencies ▪ Non - Strategic W ind - Down ▪ Infrastructure Reductions ▪ Established Market Profitability / Growth ▪ Product/ Relationship Profitability Improvement ▪ Sales Productivity Improvement ▪ Process Improvements ▪ Branch Network Rationalization ▪ Dividends ▪ Share Buybacks ▪ M&A ▪ Latent Income Embedded in Fixed Income Platform Capacity ▪ ADR at $ 1.0 - $1.5mm ▪ Specialty Lending ▪ Mid - Atlantic ▪ Middle TN ▪ Houston ▪ Wealth / Investments ▪ Municipals (FTN Financial) ▪ Latent Income Embedded in Asset - Sensitive Balance Sheet ▪ Strong Deposit Franchise Capture Interest Rate Opportunities More Controllable Less Controllable

15 Building a Foundation for Attractive Long - Term Earnings Power ▪ Proven execution capabilities ▪ Unique size, scope, and strengths ▪ Focused on efficiency, productivity, economic profitability, and growth opportunities ▪ Organizational alignment on the path to achieving long - term bonefish profitability ▪ Breadth and depth of talent that will be able to profitably run and grow the company Successfully Executing on Key Priorities FHN is Well Positioned for Attractive Long - Term Earnings Power
APPENDIX 16

Notable Items 17 2015 Pre - Tax Amount Employee Benefit Plan Amendment $8.3mm Retirement of Trust Preferred Debt $5.8mm 1Q 2Q 3Q Refer to the financial supplement for further variance trend analysis. 1 Pre - tax loss associated with resolution of a legal matter in the Fixed Income segment. 2 Pre - tax loss associated with legal matters in the Non - Strategic segment. 3 Pre - tax loss associated with legal matters in the Regional Bank and Non - Strategic segments. Litigation Expense 1 $(11.6)mm 4Q Litigation Accrual 2 $(14.2)mm Impairment Related to Tax Credit Investment $(2.8)mm $(2.7)mm TrustAtlantic Acquisition Expenses 2016 Pre - Tax Amount $(1.1)mm TrustAtlantic Acquisition Expenses $(0.6)mm TrustAtlantic Acquisition Expenses Branch Impairment $(3.7)mm $(26.0)mm Litigation Accrual 3 Valuation adjustment for derivatives related to prior sales of Visa Class B shares Mortgage Repurchase Reserve Release $(2.5)mm $31.4mm Settlement with DOJ/HUD $(162.5)mm TrustAtlantic Acquisition Expenses $(0.6)mm
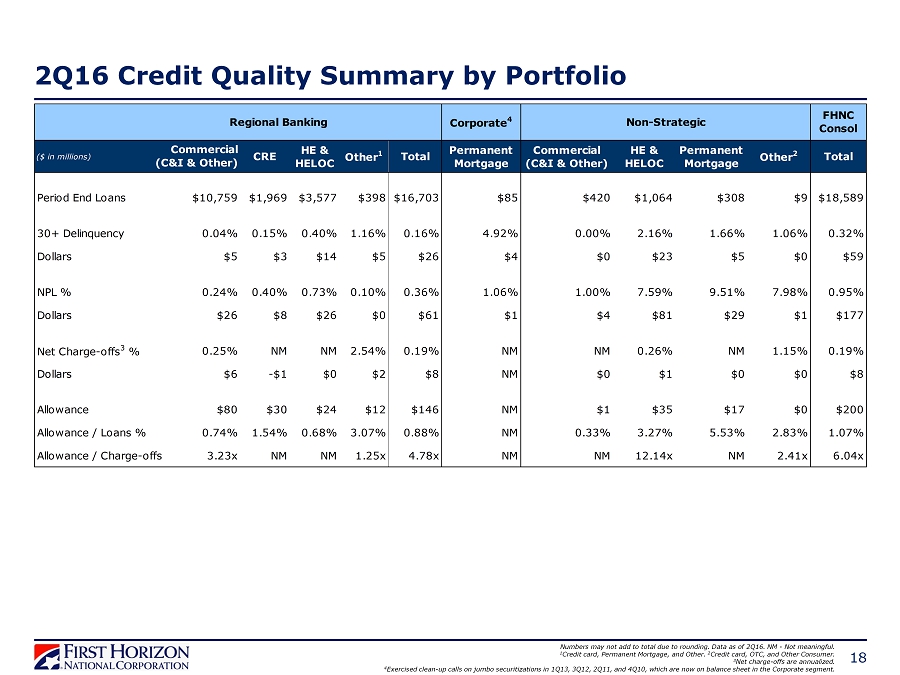
18 2Q16 Credit Quality Summary by Portfolio Numbers may not add to total due to rounding. Data as of 2Q16. NM - Not meaningful. 1 Credit card, Permanent Mortgage, and Other. 2 Credit card, OTC, and Other Consumer. 3 Net charge - offs are annualized. 4 Exercised clean - up calls on jumbo securitizations in 1Q13, 3Q12, 2Q11, and 4Q10, which are now on balance sheet in the Corporate segment. ($ in millions) CRE HE & HELOC Other 1 Total Permanent Mortgage Commercial (C&I & Other) HE & HELOC Permanent Mortgage Other 2 Total Period End Loans $10,759 $1,969 $3,577 $398 $16,703 $85 $420 $1,064 $308 $9 $18,589 30+ Delinquency 0.04% 0.15% 0.40% 1.16% 0.16% 4.92% 0.00% 2.16% 1.66% 1.06% 0.32% Dollars $5 $3 $14 $5 $26 $4 $0 $23 $5 $0 $59 NPL % 0.24% 0.40% 0.73% 0.10% 0.36% 1.06% 1.00% 7.59% 9.51% 7.98% 0.95% Dollars $26 $8 $26 $0 $61 $1 $4 $81 $29 $1 $177 Net Charge-offs 3 % 0.25% NM NM 2.54% 0.19% NM NM 0.26% NM 1.15% 0.19% Dollars $6 -$1 $0 $2 $8 NM $0 $1 $0 $0 $8 Allowance $80 $30 $24 $12 $146 NM $1 $35 $17 $0 $200 Allowance / Loans % 0.74% 1.54% 0.68% 3.07% 0.88% NM 0.33% 3.27% 5.53% 2.83% 1.07% Allowance / Charge-offs 3.23x NM NM 1.25x 4.78x NM NM 12.14x NM 2.41x 6.04x Commercial (C&I & Other) FHNC Consol Regional Banking Corporate 4 Non-Strategic
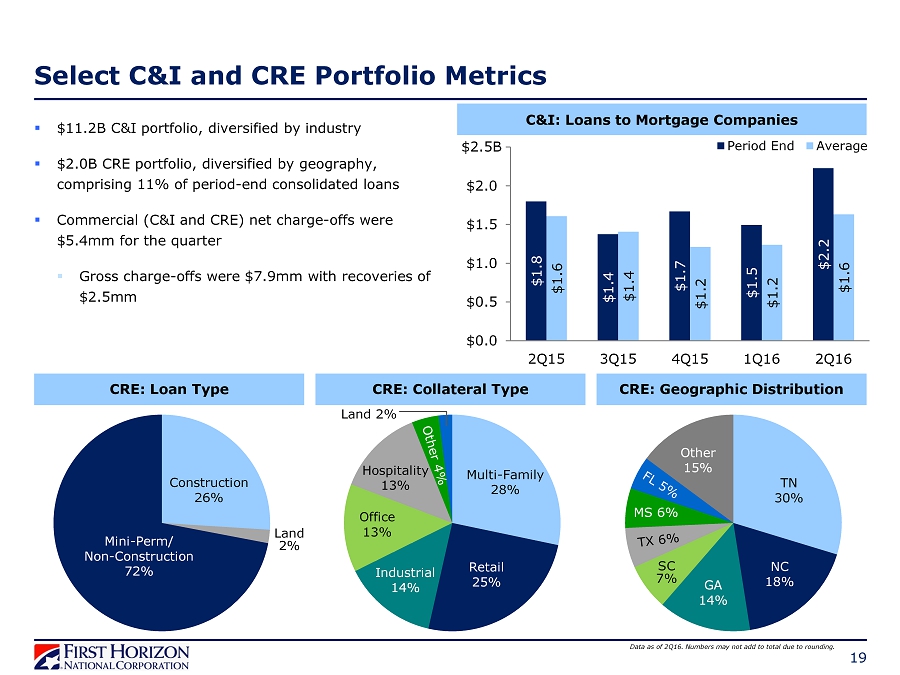
19 Select C&I and CRE Portfolio Metrics Data as of 2Q16. Numbers may not add to total due to rounding. ▪ $11.2B C&I portfolio , diversified by industry ▪ $2.0B CRE portfolio, diversified by geography, comprising 11% of period - end consolidated loans ▪ Commercial (C&I and CRE) net charge - offs were $5.4mm for the quarter ▪ Gross charge - offs were $7.9mm with recoveries of $2.5mm $1.8 $1.4 $1.7 $1.5 $2.2 $1.6 $1.4 $1.2 $1.2 $1.6 $0.0 $0.5 $1.0 $1.5 $2.0 $2.5 2Q15 3Q15 4Q15 1Q16 2Q16 Period End Average C&I: Loans to Mortgage Companies CRE: Loan Type CRE: Collateral Type CRE: Geographic Distribution Retail 25% Office 13% TN 30% NC 18% GA 14% Other 15% Construction 26% Land 2% Mini - Perm/ Non - Construction 72% Industrial 14% Hospitality 13% Land 2% Multi - Family 28% MS 6% SC 7% $2.5B
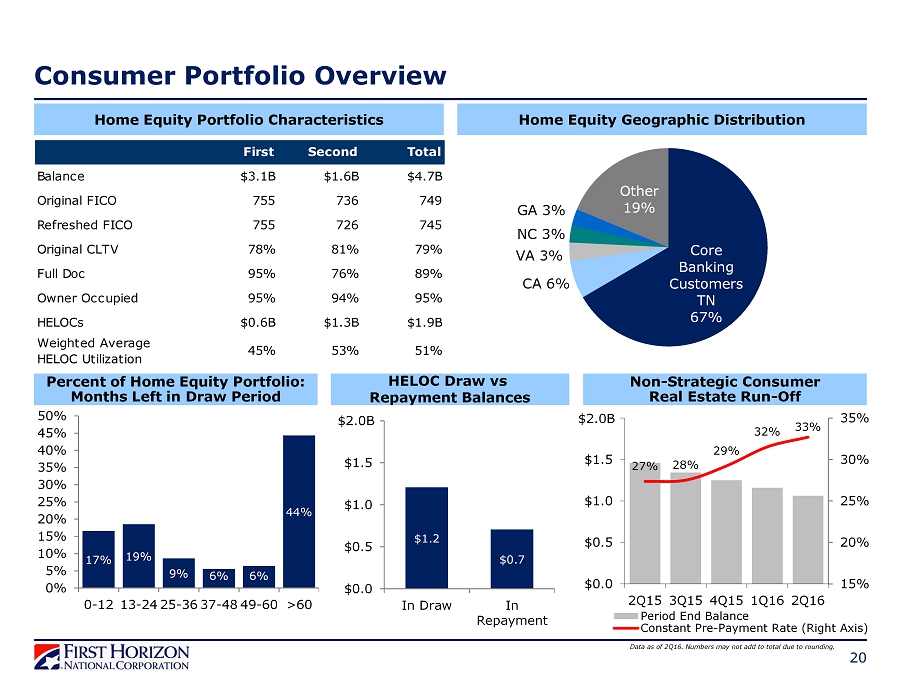
20 Core Banking Customers TN 67% CA 6% VA 3% NC 3% GA 3% Other 19% Consumer Portfolio Overview $1.2 $0.7 $0.0 $0.5 $1.0 $1.5 $2.0 In Draw In Repayment HELOC Draw vs Repayment Balances Percent of Home Equity Portfolio: Months Left in Draw Period 17% 19% 9% 6% 6% 44% 0% 5% 10% 15% 20% 25% 30% 35% 40% 45% 50% 0-12 13-24 25-36 37-48 49-60 >60 Home Equity Portfolio Characteristics Home Equity Geographic Distribution 27% 28% 29% 32% 33% 15% 20% 25% 30% 35% $0.0 $0.5 $1.0 $1.5 $2.0 2Q15 3Q15 4Q15 1Q16 2Q16 Period End Balance Constant Pre-Payment Rate (Right Axis) Non - Strategic Consumer Real Estate Run - Off $2.0B $2.0B Data as of 2Q16. Numbers may not add to total due to rounding. First Second Total Balance $3.1B $1.6B $4.7B Original FICO 755 736 749 Refreshed FICO 755 726 745 Original CLTV 78% 81% 79% Full Doc 95% 76% 89% Owner Occupied 95% 94% 95% HELOCs $0.6B $1.3B $1.9B Weighted Average HELOC Utilization 45% 53% 51%
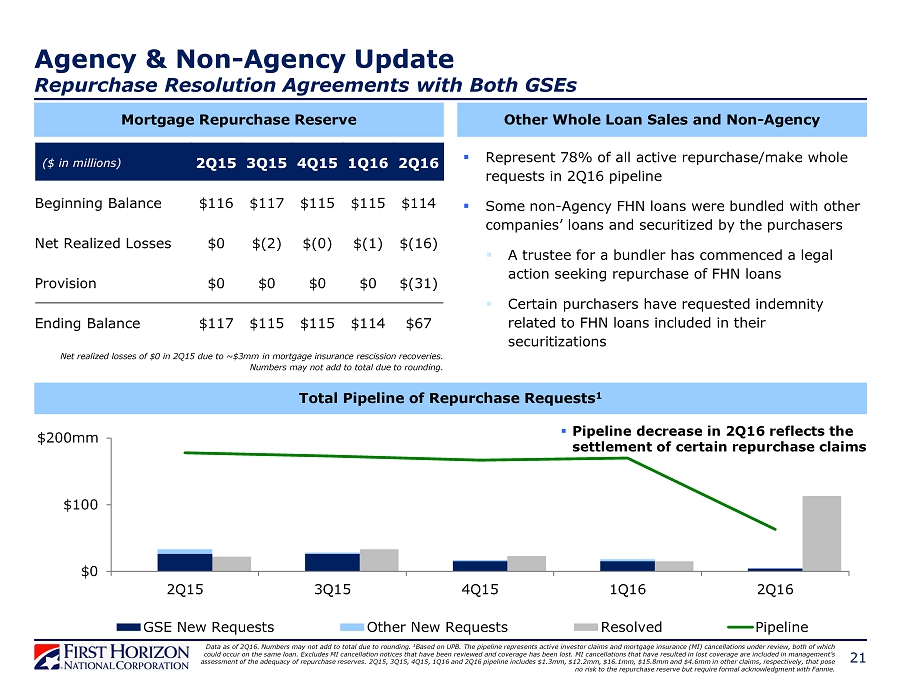
($ in millions) 2Q15 3Q15 4Q15 1Q16 2Q16 Beginning Balance $116 $117 $115 $115 $114 Net Realized Losses $0 $(2) $(0) $(1) $(16) Provision $0 $0 $0 $0 $(31) Ending Balance $117 $115 $115 $114 $67 $0 $100 $200 2Q15 3Q15 4Q15 1Q16 2Q16 GSE New Requests Other New Requests Resolved Pipeline 21 Agency & Non - Agency Update Repurchase Resolution Agreements with Both GSEs Total Pipeline of Repurchase Requests 1 $200mm Mortgage Repurchase Reserve Other Whole Loan Sales and Non - Agency ▪ Represent 78% of all active repurchase/make whole requests in 2Q16 pipeline ▪ Some non - Agency FHN loans were bundled with other companies’ loans and securitized by the purchasers ▪ A trustee for a bundler has commenced a legal action seeking repurchase of FHN loans ▪ Certain purchasers have requested indemnity related to FHN loans included in their securitizations Data as of 2Q16. Numbers may not add to total due to rounding. 1 Based on UPB. The pipeline represents active investor claims and mortgage insurance (MI) cancellations under review, both of whi ch could occur on the same loan. Excludes MI cancellation notices that have been reviewed and coverage has been lost. MI cancell ati ons that have resulted in lost coverage are included in management’s assessment of the adequacy of repurchase reserves. 2Q15, 3Q15, 4Q15, 1Q16 and 2Q16 pipeline includes $1.3mm, $12.2mm, $16.1mm , $ 15.8mm and $4.6mm in other claims, respectively, that pose no risk to the repurchase reserve but require formal acknowledgment with Fannie. Net realized losses of $0 in 2Q15 due to ~$3mm in mortgage insurance rescission recoveries. Numbers may not add to total due to rounding. ▪ Pipeline decrease in 2Q16 reflects the settlement of certain repurchase claims
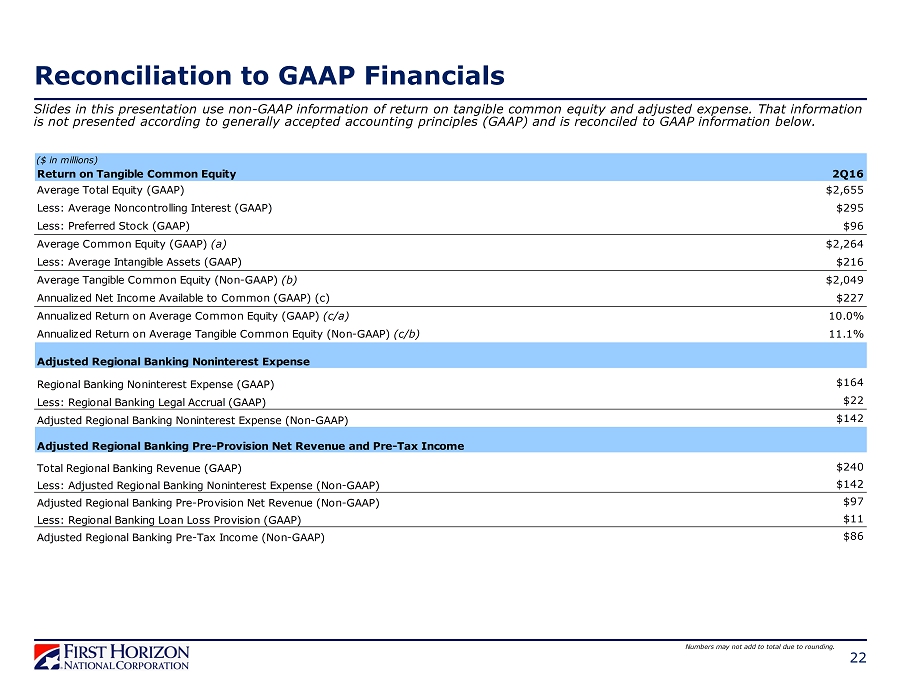
Reconciliation to GAAP Financials 22 Slides in this presentation use non - GAAP information of return on tangible common equity and adjusted expense. That information is not presented according to generally accepted accounting principles (GAAP ) and is reconciled to GAAP information below. Numbers may not add to total due to rounding. ($ in millions) Return on Tangible Common Equity 2Q16 Average Total Equity (GAAP) $2,655 Less: Average Noncontrolling Interest (GAAP) $295 Less: Preferred Stock (GAAP) $96 Average Common Equity (GAAP) (a) $2,264 Less: Average Intangible Assets (GAAP) $216 Average Tangible Common Equity (Non-GAAP) (b) $2,049 Annualized Net Income Available to Common (GAAP) (c) $227 Annualized Return on Average Common Equity (GAAP) (c/a) 10.0% Annualized Return on Average Tangible Common Equity (Non-GAAP) (c/b) 11.1% Adjusted Regional Banking Noninterest Expense Regional Banking Noninterest Expense (GAAP) $164 Less: Regional Banking Legal Accrual (GAAP) $22 Adjusted Regional Banking Noninterest Expense (Non-GAAP) $142 Adjusted Regional Banking Pre-Provision Net Revenue and Pre-Tax Income Total Regional Banking Revenue (GAAP) $240 Less: Adjusted Regional Banking Noninterest Expense (Non-GAAP) $142 Adjusted Regional Banking Pre-Provision Net Revenue (Non-GAAP) $97 Less: Regional Banking Loan Loss Provision (GAAP) $11 Adjusted Regional Banking Pre-Tax Income (Non-GAAP) $86