Exhibit 99.1
FIRST HORIZON NATIONAL
Fourth Quarter 2004
Analyst Visit
SAFE HARBOR STATEMENT
This document contains forward-looking statements involving significant risks and uncertainties. A number of factors could cause actual results to differ materially from those in the forward-looking information. These factors are outlined in the recent earnings press release and in more detail in the most current 10-Q and 10-K. First Horizon disclaims any obligation to update any of the forward-looking statements that are made from time to time to reflect future events or developments.
HISTORICAL PERFORMANCE
| Historical 5 Year Performance | Rank | |
| Return on Equity | 22.4% | 2nd |
| Return on Assets | 1.6% | 7th |
| Fee Income as a Percent of Revenue | 61.0% | 2nd |
* Rank among 16 Institutions (10 High Performers and 8 Industry Peers, with two overlaps)
Source: First Call/SNL Datasource
The following graph shows our earnings per share growth over the past five years beginning in 1999. The blue line represents our actual growth of 14.5%. The green line depicts what we would have grown at the high performers' level of 13.7%. The orange line portrays what our EPS growth would have been at the industry rate of 10.7%.

The following graph shows a 16% CAGR in dividends declared from $.79 in 1999 to $1.63 in 2004.

CURRENT PERFORMANCE
3RD QUARTER EARNINGS HIGHLIGHTS
- Retail/commercial banking continued strong growth from national expansion and asset quality improvements
- Challenging operating environment caused:
- Delayed purchases from all fixed income investors
- Increased impairment costs from 2Q04 with declining refi activity
- Competitive mortgage pricing
- Management identified technical error in documentation and pulled 3rd quarter HELOC securitization
- Investment portfolio gains from the sale of investment securities initiated primarily due to a delay in the closing of the HELOC securitization
The following graph shows 3Q03 business mix compared to 3Q04 business mix. In 3Q03, pre-tax income was split in the following manner: retail/commercial banking was 37%; mortgage was 57%; capital markets was 19%; and corporate was negative 13%. In 3Q04, pre-tax income was split in the following manner: retail/commercial banking was 61%; mortgage was 22%; capital markets was 10%; and corporate was 7%.

BENEFITS OF BUSINESS MIX
- Counter cyclical earnings
- Increased opportunities for expansion
- Enhanced cross-sell opportunities
- Working Together initiatives
STRATEGIC COMBINATION
FTN financial + SLK'S fixed income division
- Expands fixed income sales force
- Continues to diversify into non-depository customer base
- Broader product offerings with enhanced trading
- Enhances distribution platform
- Accretive in first year
STRATEGIC OBJECTIVES
- Maintain high-performing long-term EPS growth and industry-leading profitability levels
- Continue to develop our national franchise while reducing reliance on mortgage and fixed income
NATIONAL BANKING EXPANSION STRATEGY
NATIONAL EXPANSION OBJECTIVES
- Cross-sell our full array of financial products to existing mortgage and fixed income customers
- Continue to grow national customer base through increased sales force
- People first / bricks and mortar support
The following graph shows a 33% CAGR in the national financial services revenues of $101 million in 2001 to $240 million annualized in 2004.

The following chart shows five levels of financial centers, with FC 5 encompassing the most products and services. FC 1 includes mortgage originations. FC 2 includes mortgage originations and complimentary retail cross-sell products. FC 3 includes mortgage originations, complimentary retail cross-sell products and specialized sales forces.
FC 4 includes mortgage originations, complimentary retail cross-sell products, specialized sales forces and deposit-taking activities. FC 5 includes mortgage originations, complimentary retail cross-sell products, specialized sales forces, deposit-taking activities, and financial centers.

FIRST HORIZON NATIONAL EXPANSION
| 2001 | 2004* | Improvement | |||
| Mortgage RM's | 679 | 1,792 | 38% Growth | ||
| Specialized Sales Force | 0 | 176 | |||
| Banking HHs (000's) | 75 | 199 | 38% Growth | ||
| % of HHs with Banking Products | 16% | 35% | 19 Percentage Points | ||
| Consumer Loans (billions) | $2.0 | $4.7 | 54% Growth | ||
| Commercial Loans (billions) | $0.3 | $1.2 | 51% Growth | ||
| Deposits (billions) | $0.0 | $0.1 | 265% Growth |
*As of 9/30/04
Note: Growth reflects CAGR
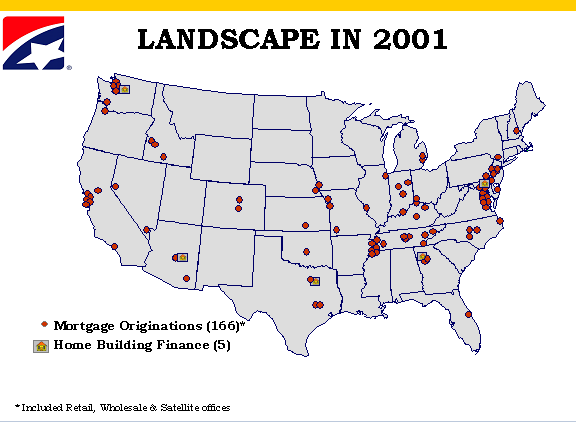
The following map shows our landscape in 2001 with 166 mortgage originations offices and 5 home building finance offices.
The following map shows our current landscape with 347 mortgage originations offices, 13 wealth management offices, 15 home builder finance offices and 16 small business lending offices.

The following map shows our expanding national bank landscape with 399 branch offices, 43 home builder finance offices, 42 small business offices, and 20 wealth management offices.

REVENUE GROWTH DRIVERS
Retail/Commercial Banking
- Continue national expansion through national customer base
- Capture opportunities from market disruption
Mortgage
- Grow mortgage relationship managers
- Expand servicing portfolio profitability
Capital Markets
- Draw on strength in niche markets/products in capital markets
- Target non-depository institutions to grow customer base
STRATEGIC ACQUISITIONS
SOLIDIFY STRATEGIC ADVANTAGE
Disciplined acquisition approach
- Broaden Product Mix
- Increase Sales Force
- Expand Geography
SUMMARY CONCLUSION
- Business mix rebalancing
- Platform for growth in place in all business segments
- Additional national expansion opportunities