Exhibit 99.1
THIRD QUARTER 2008
FINANCIAL SUPPLEMENT
If you need further information, please contact:
Dave Miller, Investor Relations
901-523-4162
dwmiller@firsthorizon.com
| TABLE OF CONTENTS | ||||
| �� | ||||
| Page | ||||
| First Horizon National Corporation Segment Structure | 3 | |||
| Performance Highlights | 4 | |||
| Efficiency and Restructuring Initiatives | 6 | |||
| Consolidated Results | ||||
| Income Statement | ||||
| Summary Income Statement | 7 | |||
| Income Statement | 8 | |||
| Other Income and Other Expense | 9 | |||
| Balance Sheet | ||||
| Period End Balance Sheet | 10 | |||
| Average and Period End Loans | 11 | |||
| Average Balance Sheet | 12 | |||
| Average Balance Sheet: Income & Expense | 13 | |||
| Average Balance Sheet: Yields & Rates | 14 | |||
| Mortgage Servicing Rights | 15 | |||
| Business Segment Detail | ||||
| Segment Highlights | 16 | |||
| Regional Banking | 17 | |||
| Capital Markets | 18 | |||
| National Specialty Lending | 19 | |||
| Mortgage Banking | 20 | |||
| Mortgage Banking: Origination Income | 21 | |||
| Mortgage Banking: Origination Metrics | 22 | |||
| Mortgage Banking: Servicing | 23 | |||
| Corporate | 24 | |||
| Capital Highlights | 25 | |||
| Asset Quality | ||||
| Asset Quality: Consolidated | 26 | |||
| Analysis of FAS 114 Loans, ORE, & NPL Rollforward | 28 | |||
| Asset Quality: Regional Banking | 29 | |||
| Asset Quality: National Specialty Lending | 30 | |||
| Asset Quality: Mortgage Banking & Capital Markets | 31 | |||
| Asset Quality Highlights: Key Portfolios - Commercial | 32 | |||
| Asset Quality Highlights: Key Portfolios - Consumer | 33 | |||
| Asset Quality Process | 34 | |||
| Glossary of Terms | 35 | |||
| Other Information | ||||
This financial supplement contains forward-looking statements involving significant risks and uncertainties. A number of important factors could cause actual results to differ materially from those in the forward-looking information. Those factors include general economic and financial market conditions, including expectations of and actual timing and amount of interest rate movements including the slope of the yield curve, competition, customer and investor responses to these conditions, ability to execute business plans, geopolitical developments, natural disasters, and items mentioned in this financial supplement and in FHN's most recent press release, as well as critical accounting estimates and other factors described in FHN’s recent filings with the SEC. FHN disclaims any obligation to update any such factors or to publicly announce the result of any revisions to any of the forward-looking statements included herein or therein to reflect future events or developments. | ||||
| FIRST HORIZON NATIONAL CORPORATION SEGMENT STRUCTURE | |

| Regional Banking | ||
| -Traditional banking services for consumers and business | ||
| -Activities include lending and deposit taking, investments, insurance, financial planning, trust services, asset management, | ||
| cash management, and health savings accounts | ||
| -Primarily southeastern US footprint, with approximately 200 financial centers in TN and nearby markets | ||
| -First Tennessee banking franchise and middle market lending are key businesses | ||
| -First Horizon Banks included for periods prior to divestiture | ||
| Capital Markets | ||
| -Fixed income sales, trading, and strategies for institutional clients in U.S. and abroad | ||
| -Other capital markets products include: | ||
| -Equity research, portfolio advisory, structured finance, and investment banking | ||
| -Correspondent banking provides credit, depository, and other banking related services to other financial institutions | ||
| National Specialty Lending | ||
| -Primarily portfolio lending activities such as consumer lending and construction lending outside Regional Banking footprint | ||
| -Construction lending includes national home builder, one-time close, and commercial real estate portfolios | ||
| -In January 2008, FHN announced the discontinuation of national home builder and commercial real estate | ||
| lending through its First Horizon Construction Lending offices | ||
| -Consumer lending consists mainly of national retail-originated home equity loans and lines | ||
| Mortgage Banking | ||
| -Primarily consists of first lien mortgage originations and servicing | ||
-In a transaction that closed on Aug. 31, 2008, First Horizon National Corp sold its mortgage servicing platform and origination offices outside Tennessee to MetLife Bank, N.A. | ||
| Corporate | ||
| -Includes executive management, enterprise-wide risk management, corporate finance, | ||
| corporate communications and legal functions | ||
| -Also includes funding function for the corporation and any impact from balance sheet positioning | ||
3
| PERFORMANCE HIGHLIGHTS | ||||||
| Summary of Third Quarter 2008 Significant Items (in millions) | ||||||
| Segment | Item | Income Statement | Pre-Tax | Comments | ||
| Regional Banking | Loan losses | Provision for loan losses | $(58.2) | Provisioning for deterioration in commercial portfolios. | ||
| Capital Markets | Loan losses | Provision for loan losses | $(38.5) | Provisioning for deterioration in correspondent banking loans. | ||
| National Specialty Lending | Loan losses | Provision for loan losses | $(240.5) | Provisioning for deterioration in national construction and home equity portfolios. | ||
| Mortgage Banking | Origination Income Adjustment | Noninterest income: Mortgage Banking | $(15.5) | Adjustment to reflect revised cash flow expectations related to mortgage origination activities | ||
| Corporate | Debt repurchases | Noninterest income: Other | $18.9 | Gains on repurchases of $91.7 million of debt. | ||
| Restructuring, Repositioning & Efficiency Initiatives | Noninterest expense: Various | $(15.8) | Expenses from severance, office closures and Mortgage divestiture. Detailed further on page 6. | |||
| Restructuring, Repositioning & Efficiency Initiatives | Noninterest income: Various | $(18.1) | Loss from Mortgage divestiture. Transaction costs for sales of MSR. Detailed further on page 6. | |||
| (Third Quarter 2008 vs. Second Quarter 2008) | ||
| Asset Quality | ||
| - Provision increased to $340.0 million in the third quarter compared to $220.0 million in second quarter 2008 | ||
| - Portfolio deterioration in third quarter due to declining economic conditions | ||
| - Continuing commercial portfolio grade deterioration | ||
| - Deterioration of homebuilder finance portfolio in national and Tennessee portfolios | ||
| - C&I deterioration, especially in loans to bank holding companies or secured by bank stock | ||
| - Consumer portfolios experiencing increased loss severities | ||
| - Continued wind down of OTC loans provides better visibility into inherent losses in remaining portfolio | ||
| - Home equity delinquencies increased | ||
| - Permanent mortgage portfolio experiencing increased deterioration | ||
| - Net charge-offs were 284 annualized basis points of average loans driven by national construction, home equity and C&I portfolios | ||
| - Net charge-offs of $154.7 million in third quarter compared to $127.7 million in prior quarter | ||
| - Charging off almost all impaired commercial loan balances down to most likely estimate of collateral value net of costs to sell | ||
| - NPAs increased to 463 basis points from 388 basis points reflecting portfolio deterioration from current economic conditions | ||
| - Total NPAs increased to $1.0 billion from $.9 billion primarily from deterioration in national construction portfolios | ||
| - Allowance as a percentage of loans ratio increased to 352 basis points from 259 basis points in prior quarter | ||
| Capital | ||
| - Initiated quarterly dividend payable in common stock | ||
- Current ratios significantly benefit from equity issuance in second quarter and balance sheet contraction (estimated based on period end balances) | ||
| - 7.2% for tangible common equity to tangible assets | ||
| - 10.9% for Tier I | ||
| - 15.8% for Total Capital | ||
4
| PERFORMANCE HIGHLIGHTS (continued) | |||||
| (Third Quarter 2008 vs. Second Quarter 2008) | |||||
| Regional Banking | |||||
| - Net interest margin increased to 4.43% compared to 4.38% in second quarter | |||||
| - Reflects decision to not compete for non-relationship deposits | |||||
| - Noninterest income declined to $87.9 million from $92.5 million | |||||
| - Reduced foreclosure gains, cash management fees and wealth management fees in third quarter | |||||
| - Provision expense in third quarter primarily reflects downward grade migration in commercial loans | |||||
| - Noninterest expense increased to $158.6 million compared to $150.3 million in prior quarter | |||||
- Marketing efforts in the third quarter, expenses for improvements to online banking platform and higher losses on foreclosed properties | |||||
| Capital Markets | |||||
| - Fixed income revenues were $80.1 million in third quarter compared to $105.0 million in prior quarter | |||||
| - Federal Reserve paused its rate reductions in third quarter | |||||
| - Other product revenues remained relatively stable at $18.4 million in third quarter compared to $19.6 million in second quarter | |||||
| - Provision increased to $38.5 million from $18.5 million to reflect deterioration of correspondent banking loans | |||||
| - Current stress in financial system impacted these credits | |||||
| - Decrease in noninterest expense resulted from lower production levels | |||||
| National Specialty Lending | |||||
| - Sequential decline in net interest income as loan portfolios continue to wind down | |||||
| - Net interest margin decreased to 2.14% compared to 2.40% in second quarter | |||||
| - Primarily results from an increase in nonaccrual loans | |||||
| - Provision for loan losses continues to reflect deterioration within national construction portfolios | |||||
| - Contraction of portfolios will continue since origination activity was significantly curtailed in first quarter | |||||
| - Noninterest income increased sequentially | |||||
| - Charge of $8.7 million recognized in prior quarter as repurchase reserves were increased | |||||
| - $1.7 million charge recognized in third quarter | |||||
| - $7.2 million reduction in residual valuation recognized in second quarter | |||||
| - Noninterest expense decreased primarily due to the effects of winding down operations | |||||
| Mortgage Banking | |||||
| - Decreased origination income | |||||
| - Deliveries and originations both decline significantly due to completion of MetLife transaction | |||||
| - Gain on sale margin declined to 21 basis points from 125 basis points | |||||
| - Net effect of adopting new accounting standards negatively affected pre-tax earnings by $14.4 million | |||||
| - $7.2 million negative effect on second quarter 2008 | |||||
| - Third quarter adjustment of $15.5 million to reflect revised cash flow expectations related to mortgage origination activities | |||||
| - Gains from favorable rate moves at the end of the prior quarter | |||||
| - Hedging results positively impacted earnings by $50.8 million vs. $16.5 million in second quarter | |||||
- Resulted from positive carry on swaps due to the steepness of the yield curve and a market volatility benefit on swaps and options | |||||
| - Foreclosure reserves expense of $15.9 million in prior quarter related to increased repurchase activity | |||||
| - Servicing runoff declined to $20.1 million for third quarter from $37.1 million in prior quarter | |||||
| - Structural barriers to refinance activity developed in third quarter | |||||
| - Net interest income declines consistent with decrease in warehouse | |||||
| - Noninterest expense declined to $89.0 million in third quarter compared to $149.1 million in prior quarter | |||||
| - Due to sale of national mortgage offices and servicing platform at the end of August | |||||
| - Provision of $2.9 million in third quarter due to deterioration in permanent mortgage portfolio | |||||
| - $4.0 million of provision in prior quarter | |||||
| Taxes | |||||
| - Approximate $8 million positive quarterly effect from permanent tax credits | |||||
| Corporate Segment | |||||
| - $18.9 million of gains recognized in third quarter related to repurchases of debt | |||||
| - $91.7 million of debt repurchased with maturity dates ranging from October 2008 to February 2011 | |||||
| - Prior quarter included $12.6 million of gains on repurchase of $152.1 million of debt | |||||
| - Net charges of $33.9 million recognized for restructuring, repositioning and efficiency initiatives (detail on next page) | |||||
| - Third quarter included $15.8 million of expenses | |||||
| - $17.5 million of losses related to Mortgage sale presented in (Losses)/Gains on Divestitures | |||||
| - $0.6 million of transaction costs from sale of mortgage servicing rights presented as reduction of Mortgage Banking income | |||||
| - Prior quarter included $26.0 million of net charges for these initiatives | |||||
5
| EFFICIENCY AND RESTRUCTURING INITIATIVES | |||||||||||||||||||||
| Unaudited | |||||||||||||||||||||
| Charges for Restructuring, Repositioning, and Efficiency | |||||||||||||||||||||
By Income Statement Impact (Thousands, rounded) | 3Q08 | 2Q08 | 1Q08 | 4Q07 | 3Q07 | ||||||||||||||||
| Noninterest income | |||||||||||||||||||||
| Mortgage banking | $ | (700 | ) | $ | (9,300 | ) | $ | (2,700 | ) | $ | (6,400 | ) | - | ||||||||
| Losses/gains on divestitures | (17,500 | ) | (400 | ) | (1,000 | ) | 15,700 | - | |||||||||||||
| Noninterest expense | |||||||||||||||||||||
| Employee compensation, incentives, and benefits | 10,700 | 5,700 | 7,400 | 8,400 | 9,300 | ||||||||||||||||
| Occupancy | 3,900 | 3,400 | 1,000 | 5,500 | 5,100 | ||||||||||||||||
| Operations services | - | - | - | 400 | - | ||||||||||||||||
| Equipment rentals, depreciation, and maintenance | 100 | 4,200 | - | 500 | 800 | ||||||||||||||||
| All other expense | 1,000 | 3,000 | 9,200 | 21,100 | 17,600 | ||||||||||||||||
| Total Income before income taxes | $ | (33,900 | ) | $ | (26,000 | ) | $ | (21,300 | ) | $ | (26,600 | ) | $ | (32,800 | ) | ||||||
Expect $5 to $15 million additional charges in fourth quarter 2008.
6
| CONSOLIDATED SUMMARY INCOME STATEMENT | ||||||||||||||||||||||||||||
| Quarterly, Unaudited | ||||||||||||||||||||||||||||
| 3Q08 Change vs. | ||||||||||||||||||||||||||||
| (Thousands) | 3Q08 | 2Q08 | 1Q08 | 4Q07 | 3Q07 | 2Q08 | 3Q07 | |||||||||||||||||||||
| Net interest income | $ | 223,147 | $ | 238,895 | $ | 228,092 | $ | 225,987 | $ | 237,804 | (7 | )% | (6 | )% | ||||||||||||||
| Noninterest income | 305,383 | 400,018 | 383,130 | 103,429 | 203,475 | (24 | )% | 50 | % | |||||||||||||||||||
| Securities gains/(losses), net | (210 | ) | (972 | ) | 65,946 | (10,442 | ) | - | ( 78 | )% | NM | |||||||||||||||||
| Total revenue | 528,320 | 637,941 | 677,168 | 318,974 | 441,279 | (17 | )% | 20 | % | |||||||||||||||||||
| Noninterest expense | 391,274 | 465,843 | 438,277 | 561,559 | 421,622 | (16 | )% | (7 | )% | |||||||||||||||||||
| Provision | 340,000 | 220,000 | 240,000 | 156,519 | 43,352 | 55 | % | 684 | % | |||||||||||||||||||
| Pretax income/(loss) | (202,954 | ) | (47,902 | ) | (1,109 | ) | (399,104 | ) | (23,695 | ) | NM | NM | ||||||||||||||||
| Provision/(benefit) for income taxes | (84,664 | ) | (28,821 | ) | (8,146 | ) | (146,342 | ) | (9,330 | ) | NM | NM | ||||||||||||||||
| Income/(loss) from continuing operations | (118,290 | ) | (19,081 | ) | 7,037 | (252,762 | ) | (14,365 | ) | NM | NM | |||||||||||||||||
| Income from discontinued operations, net of tax | - | - | 883 | 4,137 | 209 | NM | NM | |||||||||||||||||||||
| Net (loss)/income | $ | (118,290 | ) | $ | (19,081 | ) | $ | 7,920 | $ | (248,625 | ) | $ | (14,156 | ) | NM | NM | ||||||||||||
| Common Stock Data | ||||||||||||||||||||||||||||
| Diluted EPS from continuing operations (a) | $ | (.59 | ) | $ | (.11 | ) | $ | .05 | $ | (1.95 | ) | $ | (.11 | ) | NM | NM | ||||||||||||
| Diluted EPS (a) | (.59 | ) | (.11 | ) | .06 | (1.91 | ) | (.11 | ) | NM | NM | |||||||||||||||||
| Diluted shares (a) | 201,184 | 176,936 | 130,532 | 129,949 | 129,917 | 14 | % | 55 | % | |||||||||||||||||||
| Period-end shares outstanding (a) | 201,594 | 201,744 | 130,668 | 130,235 | 130,257 | * | 55 | % | ||||||||||||||||||||
| Dividends declared per share (b) | (c) | $ | .20 | $ | .20 | $ | .45 | $ | .45 | NM | NM | |||||||||||||||||
| Key Ratios & Other | ||||||||||||||||||||||||||||
| Return on average assets | (1.41 | )% | (.21 | )% | .09 | % | (2.65 | )% | (.15 | )% | ||||||||||||||||||
| Return on average equity | (17.30 | )% | (3.02 | )% | 1.47 | % | (42.52 | )% | (2.31 | )% | ||||||||||||||||||
| Net interest margin | 3.01 | % | 3.01 | % | 2.81 | % | 2.77 | % | 2.87 | % | ||||||||||||||||||
| Tax rate | NM | NM | NM | NM | NM | |||||||||||||||||||||||
| Efficiency ratio | 74.06 | % | 73.02 | % | 64.72 | % | 176.05 | % | 95.55 | % | ||||||||||||||||||
| FTE employees | 6,091 | 9,245 | 9,555 | 9,941 | 11,052 | (34 | )% | (45 | )% | |||||||||||||||||||
| * Amount is less than one percent |
| NM - Not meaningful |
| (a) Shares reflect the effect of the stock dividend. |
| (b) Third quarter 2008 dividend declared was paid in shares. |
(c) Stock dividend rate of 3.0615% per share. |
7
| CONSOLIDATED INCOME STATEMENT | ||||||||||||||||||||||||||||
| Quarterly, Unaudited | ||||||||||||||||||||||||||||
| 3Q08 Change vs. | ||||||||||||||||||||||||||||
| (Thousands) | 3Q08 | 2Q08 | 1Q08 | 4Q07 | 3Q07 | 2Q08 | 3Q07 | |||||||||||||||||||||
| Interest income | $ | 383,243 | $ | 415,485 | $ | 476,443 | $ | 545,136 | $ | 582,735 | (8 | )% | (34 | )% | ||||||||||||||
| Less interest expense | 160,096 | 176,590 | 248,351 | 319,149 | 344,931 | (9 | )% | (54 | )% | |||||||||||||||||||
| Net interest income | 223,147 | 238,895 | 228,092 | 225,987 | 237,804 | (7 | )% | (6 | )% | |||||||||||||||||||
| Provision for loan losses | 340,000 | 220,000 | 240,000 | 156,519 | 43,352 | 55 | % | 684 | % | |||||||||||||||||||
| Net interest income/(loss) after | ||||||||||||||||||||||||||||
| provision for loan losses | (116,853 | ) | 18,895 | (11,908 | ) | 69,468 | 194,452 | (718 | )% | (160 | )% | |||||||||||||||||
| Noninterest income: | ||||||||||||||||||||||||||||
| Capital markets | 95,954 | 122,338 | 131,457 | 98,482 | 63,722 | (22 | )% | 51 | % | |||||||||||||||||||
| Deposit transactions | ||||||||||||||||||||||||||||
| and cash management | 45,802 | 46,797 | 42,553 | 47,971 | 44,863 | (2 | )% | 2 | % | |||||||||||||||||||
| Mortgage banking (a) (b) (c) (d) (e) | 106,817 | 172,418 | 158,712 | (113,965 | ) | 39,022 | (38 | )% | 174 | % | ||||||||||||||||||
| Trust services and investment | ||||||||||||||||||||||||||||
| management | 8,154 | 8,883 | 9,109 | 10,097 | 9,922 | (8 | )% | (18 | )% | |||||||||||||||||||
| Insurance commissions | 7,332 | 6,822 | 8,144 | 7,529 | 6,747 | 7 | % | 9 | % | |||||||||||||||||||
| Revenue from loan sales and securitizations | 3,238 | (6,984 | ) | (4,097 | ) | (171 | ) | 4,774 | (146 | )% | (32 | )% | ||||||||||||||||
| Securities (losses)/gains, net | (210 | ) | (972 | ) | 65,946 | (10,442 | ) | - | (78 | )% | - | |||||||||||||||||
| Gains/(losses) on divestitures (a) | (17,489 | ) | (429 | ) | (995 | ) | 15,695 | - | NM | - | ||||||||||||||||||
| Other (f) | 55,575 | 50,173 | 38,247 | 37,791 | 34,425 | 11 | % | 61 | % | |||||||||||||||||||
| Total noninterest income | 305,173 | 399,046 | 449,076 | 92,987 | 203,475 | (24 | )% | 50 | % | |||||||||||||||||||
| Adjusted gross income after | ||||||||||||||||||||||||||||
| provision for loan losses | 188,320 | 417,941 | 437,168 | 162,455 | 397,927 | (55 | )% | (53 | )% | |||||||||||||||||||
| Noninterest expense: | ||||||||||||||||||||||||||||
| Employee compensation, | ||||||||||||||||||||||||||||
| incentives and benefits (a) (d) | 215,498 | 277,078 | 287,470 | 226,905 | 236,683 | (22 | )% | (9 | )% | |||||||||||||||||||
| Occupancy (a) | 27,210 | 30,018 | 28,591 | 34,209 | 34,778 | (9 | )% | (22 | )% | |||||||||||||||||||
| Operations services (a) | 20,041 | 19,124 | 18,964 | 20,148 | 18,774 | 5 | % | 7 | % | |||||||||||||||||||
| Equipment rentals, depreciation | ||||||||||||||||||||||||||||
| and maintenance (a) | 12,336 | 18,268 | 15,011 | 16,252 | 17,270 | (32 | )% | (29 | )% | |||||||||||||||||||
| Communications and courier (d) | 9,628 | 11,477 | 11,004 | 10,664 | 10,959 | (16 | )% | (12 | )% | |||||||||||||||||||
| Amortization of intangible assets | 1,802 | 2,182 | 2,440 | 2,864 | 2,647 | (17 | )% | (32 | )% | |||||||||||||||||||
| Goodwill impairment | - | - | - | 71,074 | 13,010 | NM | NM | |||||||||||||||||||||
| Other (a) (d) | 104,759 | 107,696 | 74,797 | 179,443 | 87,501 | (3 | )% | 20 | % | |||||||||||||||||||
| Total noninterest expense | 391,274 | 465,843 | 438,277 | 561,559 | 421,622 | (16 | )% | (7 | )% | |||||||||||||||||||
| Pretax Income/(loss) | (202,954 | ) | (47,902 | ) | (1,109 | ) | (399,104 | ) | (23,695 | ) | NM | NM | ||||||||||||||||
| Provision/(benefit) for income taxes | (84,664 | ) | (28,821 | ) | (8,146 | ) | (146,342 | ) | (9,330 | ) | NM | NM | ||||||||||||||||
| Income/(loss) from continuing operations | $ | (118,290 | ) | $ | (19,081 | ) | 7,037 | (252,762 | ) | (14,365 | ) | NM | NM | |||||||||||||||
| Income from discontinued operations, | ||||||||||||||||||||||||||||
| net of tax | - | - | 883 | 4,137 | 209 | NM | NM | |||||||||||||||||||||
| Net income/(loss) | $ | (118,290 | ) | $ | (19,081 | ) | $ | 7,920 | $ | (248,625 | ) | $ | (14,156 | ) | NM | NM | ||||||||||||
NM - Not meaningful
| 3Q08 Key Impacts | |
| (a) | Includes a portion of net charges for $33.9 million, see Restructuring, Repositioning and Efficiency Initiatives page for further details. |
| (b) | Includes LOCOM and other loan sale adjustments. |
| (c) | Include effects of electing fair value for mortgage warehouse loans. |
| (d) | Includes effect of adopting new accounting standards. |
| (e) | Includes effect of adjustment to reflect revised cash flow expectations related to mortgage origination activities. |
| (f) | Includes gains from repurchases of debt. |
8
| OTHER INCOME AND OTHER EXPENSE | ||||||||||||||||||||||||||||
| Quarterly, Unaudited | ||||||||||||||||||||||||||||
| 3Q08 Change vs. | ||||||||||||||||||||||||||||
| (Thousands) | 3Q08 | 2Q08 | 1Q08 | 4Q07 | 3Q07 | 2Q08 | 3Q07 | |||||||||||||||||||||
| Other Income | ||||||||||||||||||||||||||||
| Brokerage management fees and | ||||||||||||||||||||||||||||
| commissions | $ | 7,824 | $ | 8,690 | $ | 8,413 | $ | 8,747 | $ | 9,189 | (10 | )% | (15 | )% | ||||||||||||||
| Bank owned life insurance | 6,731 | 6,343 | 6,962 | 6,697 | 6,260 | 6 | % | 8 | % | |||||||||||||||||||
| Bankcard income | 5,587 | 5,728 | 5,540 | 6,221 | 6,329 | (2 | )% | (12 | )% | |||||||||||||||||||
| Other service charges | 3,043 | 3,189 | 3,396 | 3,357 | 3,581 | (5 | )% | (15 | )% | |||||||||||||||||||
| Remittance processing | 3,314 | 3,206 | 3,273 | 3,450 | 3,171 | 3 | % | 5 | % | |||||||||||||||||||
| Reinsurance fees | 2,830 | 3,320 | 3,145 | 2,794 | 2,418 | (15 | )% | 17 | % | |||||||||||||||||||
| ATM interchange fees | 2,263 | 2,238 | 2,238 | 2,224 | 2,200 | 1 | % | 3 | % | |||||||||||||||||||
| Deferred compensation | (5,145 | ) | 1,325 | (6,550 | ) | (1,667 | ) | 526 | NM | NM | ||||||||||||||||||
| Letter of credit | 1,603 | 1,274 | 1,458 | 1,759 | 1,864 | 26 | % | (14 | )% | |||||||||||||||||||
| Electronic banking fees | 1,535 | 1,572 | 1,618 | 1,636 | 1,631 | (2 | )% | (6 | )% | |||||||||||||||||||
| Check clearing fees | 838 | 887 | 862 | 1,125 | 1,275 | (6 | )% | (34 | )% | |||||||||||||||||||
| Federal flood certifications | 863 | 1,259 | 1,523 | 1,084 | 1,207 | (31 | )% | (29 | )% | |||||||||||||||||||
| Other | 24,289 | 11,142 | 6,369 | 364 | (5,226 | ) | 118 | % | (565 | )% | ||||||||||||||||||
| Total | $ | 55,575 | $ | 50,173 | $ | 38,247 | $ | 37,791 | $ | 34,425 | 11 | % | 61 | % | ||||||||||||||
| Other Expense | ||||||||||||||||||||||||||||
| Legal and professional fees (a) | $ | 16,955 | $ | 14,030 | $ | 15,022 | $ | 17,629 | $ | 13,532 | 21 | % | 25 | % | ||||||||||||||
| Computer software (a) | 7,162 | 8,120 | 7,956 | 26,185 | 9,334 | (12 | )% | (23 | )% | |||||||||||||||||||
| Advertising and public relations (a) | 9,142 | 7,179 | 9,327 | 10,297 | 10,475 | 27 | % | (13 | )% | |||||||||||||||||||
| Travel and entertainment (a) | 3,358 | 5,672 | 5,027 | 5,829 | 7,065 | (41 | )% | (52 | )% | |||||||||||||||||||
| Low income housing expense | 5,064 | 4,815 | 4,566 | 6,605 | 4,483 | 5 | % | 13 | % | |||||||||||||||||||
| Contract employment (a) | 9,033 | 7,359 | 5,584 | 5,202 | 5,770 | 23 | % | 57 | % | |||||||||||||||||||
| Distributions on preferred stock | ||||||||||||||||||||||||||||
| of subsidiary | 2,875 | 2,844 | 4,061 | 4,679 | 4,761 | 1 | % | (40 | )% | |||||||||||||||||||
| Foreclosed real estate | 4,979 | 10,720 | 6,362 | 8,871 | 1,393 | (54 | )% | 257 | % | |||||||||||||||||||
| Supplies (a) | 2,725 | 2,942 | 3,020 | 3,496 | 3,382 | (7 | )% | (19 | )% | |||||||||||||||||||
| Loan closing costs (b) | 10,314 | 11,718 | 13,060 | 1,279 | 4,857 | (12 | )% | 112 | % | |||||||||||||||||||
| Customer relations | 2,727 | 2,544 | 1,707 | 2,834 | 2,605 | 7 | % | 5 | % | |||||||||||||||||||
| Other insurance and taxes | 749 | 2,036 | 1,758 | 2,684 | 1,751 | (63 | )% | (57 | )% | |||||||||||||||||||
| Employee training and dues | 1,485 | 1,632 | 1,398 | 1,183 | 1,729 | (9 | )% | (14 | )% | |||||||||||||||||||
| Fed services fees | 1,975 | 1,941 | 1,611 | 1,463 | 1,540 | 2 | % | 28 | % | |||||||||||||||||||
| Complimentary check expense | 1,259 | 1,154 | 1,298 | 1,206 | 1,237 | 9 | % | 2 | % | |||||||||||||||||||
| Loan insurance expense | 1,477 | 1,198 | 1,113 | 1,073 | 1,123 | 23 | % | 32 | % | |||||||||||||||||||
| Bank examination costs | 1,523 | 1,054 | 1,053 | 1,142 | 1,141 | 44 | % | 33 | % | |||||||||||||||||||
| Deposit insurance premium | 4,146 | 3,403 | 2,827 | 1,223 | 615 | 22 | % | 574 | % | |||||||||||||||||||
| Other (a) | 17,811 | 17,335 | (11,953 | ) | 76,563 | 10,708 | 3 | % | 66 | % | ||||||||||||||||||
| Total | $ | 104,759 | $ | 107,696 | $ | 74,797 | $ | 179,443 | $ | 87,501 | (3 | )% | 20 | % | ||||||||||||||
NM - Not meaningful
| 3Q08 Key Impacts | |
| (a) | Includes a portion of net charges for $33.9 million, see Efficiency and Restructuring Initiatives. |
| (b) | Includes effect of electing fair value for mortgage warehouse loans. |
9
| CONSOLIDATED PERIOD-END BALANCE SHEET | ||||||||||||||||||||||||||||
| Quarterly, Unaudited | ||||||||||||||||||||||||||||
| 3Q08 Change vs. | ||||||||||||||||||||||||||||
| (Thousands) | 3Q08 | 2Q08 | 1Q08 | 4Q07 | 3Q07 | 2Q08 | 3Q07 | |||||||||||||||||||||
| Assets | ||||||||||||||||||||||||||||
| Investment securities | $ | 2,840,739 | $ | 2,896,928 | $ | 3,034,798 | $ | 3,032,791 | $ | 3,076,360 | (2 | )% | (8 | )% | ||||||||||||||
| Loans held for sale | 718,029 | 2,554,030 | 3,616,018 | 3,461,712 | 2,900,464 | (72 | )% | (75 | )% | |||||||||||||||||||
| Loans held for sale-divestiture (a) | - | - | 207,672 | 289,878 | 565,492 | NM | (100 | )% | ||||||||||||||||||||
| Loans, net of unearned income | 21,601,898 | 22,225,232 | 21,932,020 | 22,103,516 | 21,973,004 | (3 | )% | (2 | )% | |||||||||||||||||||
| Federal funds sold and securities | ||||||||||||||||||||||||||||
| purchased under agreements to resell | 921,295 | 1,166,982 | 898,615 | 1,089,495 | 1,096,624 | (21 | )% | (16 | )% | |||||||||||||||||||
| Interest bearing deposits with other financial institutions | 37,546 | 39,829 | 46,382 | 39,422 | 30,993 | (6 | )% | 21 | % | |||||||||||||||||||
| Trading securities | 1,561,024 | 1,473,815 | 1,553,053 | 1,768,763 | 1,734,653 | 6 | % | (10 | )% | |||||||||||||||||||
| Trading securities-divestiture (a) | - | 89,239 | - | - | - | (100 | )% | NM | ||||||||||||||||||||
| Total earning assets | 27,680,531 | 30,446,055 | 31,288,558 | 31,785,577 | 31,377,590 | (9 | )% | (12 | )% | |||||||||||||||||||
| Cash and due from banks | 815,935 | 838,376 | 851,875 | 1,170,220 | 936,707 | (3 | )% | (13 | )% | |||||||||||||||||||
| Capital markets receivables | 1,651,547 | 994,571 | 1,680,057 | 524,419 | 1,219,720 | 66 | % | 35 | % | |||||||||||||||||||
| Mortgage servicing rights, net | 798,491 | 903,634 | 895,923 | 1,159,820 | 1,470,589 | (12 | )% | (46 | )% | |||||||||||||||||||
| Mortgage servicing rights, net-divestiture (a) | - | 235,761 | - | - | - | (100 | )% | NM | ||||||||||||||||||||
| Goodwill | 192,408 | 192,408 | 192,408 | 192,408 | 267,228 | - | (28 | )% | ||||||||||||||||||||
| Other intangible assets, net | 46,887 | 48,615 | 52,017 | 56,907 | 58,738 | (4 | )% | (20 | )% | |||||||||||||||||||
| Premises and equipment, net | 336,078 | 344,410 | 382,488 | 399,305 | 411,515 | (2 | )% | (18 | )% | |||||||||||||||||||
| Real estate acquired by foreclosure (b) | 151,461 | 141,857 | 106,018 | 103,982 | 75,656 | 7 | % | 100 | % | |||||||||||||||||||
| Allowance for loan losses | (760,456 | ) | (575,149 | ) | (483,203 | ) | (342,341 | ) | (236,611 | ) | 32 | % | 221 | % | ||||||||||||||
| Other assets | 1,891,494 | 1,908,795 | 2,293,045 | 1,949,308 | 1,874,497 | (1 | )% | 1 | % | |||||||||||||||||||
| Other assets-divestiture (a) | - | 70,628 | 8,759 | 15,856 | 22,623 | (100 | )% | (100 | )% | |||||||||||||||||||
| Total assets | $ | 32,804,376 | $ | 35,549,961 | $ | 37,267,945 | $ | 37,015,461 | $ | 37,478,252 | (8 | )% | (12 | )% | ||||||||||||||
| Liabilities and Shareholders' Equity | ||||||||||||||||||||||||||||
| Deposits | ||||||||||||||||||||||||||||
| Savings | $ | 4,350,832 | $ | 4,041,352 | $ | 4,217,215 | $ | 3,872,684 | $ | 3,592,732 | 8 | % | 21 | % | ||||||||||||||
| Other interest-bearing deposits | 1,638,731 | 1,880,678 | 1,986,556 | 1,946,933 | 1,674,624 | (13 | )% | (2 | )% | |||||||||||||||||||
| Time deposits | 2,510,344 | 2,468,521 | 2,648,339 | 2,826,301 | 2,822,792 | 2 | % | (11 | )% | |||||||||||||||||||
| Interest bearing deposits-divestiture (a) | - | - | 99,370 | 189,051 | 361,368 | NM | (100 | )% | ||||||||||||||||||||
| Total interest-bearing core deposits | 8,499,907 | 8,390,551 | 8,951,480 | 8,834,969 | 8,451,516 | 1 | % | 1 | % | |||||||||||||||||||
| Noninterest-bearing deposits | 3,808,239 | 4,453,332 | 4,995,696 | 5,026,417 | 4,928,233 | (14 | )% | (23 | )% | |||||||||||||||||||
| Noninterest-bearing deposits-divestiture (a) | - | 296,632 | 18,197 | 28,750 | 72,404 | (100 | )% | (100 | )% | |||||||||||||||||||
| Total core deposits | 12,308,146 | 13,140,515 | 13,965,373 | 13,890,136 | 13,452,153 | (6 | )% | (9 | )% | |||||||||||||||||||
| Certificates of deposit $100,000 and more | 1,470,089 | 1,953,432 | 2,222,016 | 3,129,532 | 5,142,169 | (25 | )% | (71 | )% | |||||||||||||||||||
| Certificates of deposit $100,000 and more-divestiture (a) | - | - | 1,153 | 12,617 | 41,037 | NM | (100 | )% | ||||||||||||||||||||
| Total deposits | 13,778,235 | 15,093,947 | 16,188,542 | 17,032,285 | 18,635,359 | (9 | )% | (26 | )% | |||||||||||||||||||
| Federal funds purchased and securities | ||||||||||||||||||||||||||||
| sold under agreements to repurchase | 1,890,681 | 2,620,014 | 3,678,217 | 4,829,597 | 4,039,827 | (28 | )% | (53 | )% | |||||||||||||||||||
| Federal funds purchased and securities | ||||||||||||||||||||||||||||
| sold under agreements to repurchase-divestiture (a) | - | - | 11,572 | 20,999 | - | NM | NM | |||||||||||||||||||||
| Trading liabilities | 380,896 | 464,225 | 531,259 | 556,144 | 543,060 | (18 | )% | (30 | )% | |||||||||||||||||||
| Other short term borrowings and commercial paper (c) | 6,149,073 | 5,998,810 | 4,753,582 | 3,422,995 | 2,396,316 | 3 | % | 157 | % | |||||||||||||||||||
| Term borrowings | 4,545,791 | 5,783,407 | 6,060,795 | 6,027,967 | 6,015,954 | (21 | )% | (24 | )% | |||||||||||||||||||
| Other collateralized borrowings | 749,797 | 767,010 | 809,273 | 800,450 | 784,599 | (2 | )% | (4 | )% | |||||||||||||||||||
| Total long-term debt | 5,295,588 | 6,550,417 | 6,870,068 | 6,828,417 | 6,800,553 | (19 | )% | (22 | )% | |||||||||||||||||||
| Capital markets payables | 1,645,118 | 868,883 | 1,688,870 | 586,358 | 1,053,349 | 89 | % | 56 | % | |||||||||||||||||||
| Other liabilities | 785,061 | 959,476 | 1,136,461 | 1,305,868 | 1,253,295 | (18 | )% | (37 | )% | |||||||||||||||||||
| Other liabilities-divestiture (a) | - | 1,466 | 1,870 | 1,925 | 39,389 | (100 | )% | (100 | )% | |||||||||||||||||||
| Total liabilities | 29,924,652 | 32,557,238 | 34,860,441 | 34,584,588 | 34,761,148 | (8 | )% | (14 | )% | |||||||||||||||||||
| Preferred stock of subsidiary | 295,277 | 295,277 | 295,277 | 295,277 | 295,277 | NM | NM | |||||||||||||||||||||
| Shareholders' Equity | ||||||||||||||||||||||||||||
| Common stock | 125,996 | 122,345 | 79,242 | 78,979 | 78,992 | 3 | % | 60 | % | |||||||||||||||||||
| Capital surplus | 1,016,498 | 980,428 | 362,823 | 361,826 | 360,016 | 4 | % | 182 | % | |||||||||||||||||||
| Undivided profits | 1,489,990 | 1,646,272 | 1,704,559 | 1,742,892 | 2,048,689 | (9 | )% | (27 | )% | |||||||||||||||||||
| Accumulated other comprehensive loss, net | (48,037 | ) | (51,599 | ) | (34,397 | ) | (48,101 | ) | (65,870 | ) | (7 | )% | (27 | )% | ||||||||||||||
| Total shareholders' equity | 2,584,447 | 2,697,446 | 2,112,227 | 2,135,596 | 2,421,827 | (4 | )% | 7 | % | |||||||||||||||||||
| Total liabilities and shareholders' equity | $ | 32,804,376 | $ | 35,549,961 | $ | 37,267,945 | $ | 37,015,461 | $ | 37,478,252 | (8 | )% | (12 | )% | ||||||||||||||
| NM - Not meaningful | |
| Certain previously reported amounts have been reclassified to agree with current presentation. | |
| (a) | Second quarter 2008 associated with the sale of certain mortgage operations, prior periods associated with the sale of First Horizon Bank branches. |
| (b) | Includes $35.9 million of foreclosed assets related to government insured mortgages. |
| (c) | Third quarter 2008 includes $2.5 billion of FRB Term Auction Facility borrowings, $3.5 billion of FHLB borrowings, and $1.9 million of commercial paper. |
10
| CONSOLIDATED AVERAGE AND PERIOD-END LOANS | ||||||||||||||||||||||||||||
| Quarterly, Unaudited | ||||||||||||||||||||||||||||
| 3Q08 Change vs. | ||||||||||||||||||||||||||||
| (Thousands) | 3Q08 | 2Q08 | 1Q08 | 4Q07 | 3Q07 | 2Q08 | 3Q07 | |||||||||||||||||||||
| Average Loans (Net) | ||||||||||||||||||||||||||||
| Commercial | ||||||||||||||||||||||||||||
| Commercial, financial and industrial | $ | 7,530,724 | $ | 7,212,907 | $ | 7,121,890 | $ | 6,957,498 | $ | 7,061,103 | 4 | % | 7 | % | ||||||||||||||
| Real estate commercial (a) | 1,497,773 | 1,401,267 | 1,347,377 | 1,301,866 | 1,363,363 | 7 | % | 10 | % | |||||||||||||||||||
| Real estate construction (b) | 2,162,817 | 2,481,680 | 2,713,253 | 2,825,210 | 2,875,296 | (13 | )% | (25 | )% | |||||||||||||||||||
| Total commercial loans | 11,191,314 | 11,095,854 | 11,182,520 | 11,084,574 | 11,299,762 | 1 | % | (1 | )% | |||||||||||||||||||
| Retail | ||||||||||||||||||||||||||||
| Real estate residential (c) | 8,166,295 | 7,878,845 | 7,774,415 | 7,605,345 | 7,601,422 | 4 | % | 7 | % | |||||||||||||||||||
| Real estate construction (d) | 1,350,092 | 1,666,007 | 1,909,061 | 2,096,561 | 2,144,902 | (19 | )% | (37 | )% | |||||||||||||||||||
| Other retail | 138,848 | 138,242 | 141,961 | 144,116 | 149,714 | * | (7 | )% | ||||||||||||||||||||
| Credit card receivables | 193,517 | 193,850 | 195,081 | 201,153 | 194,376 | * | * | |||||||||||||||||||||
| Real estate loans pledged against | ||||||||||||||||||||||||||||
| other collateralized borrowings (e) | 721,760 | 735,828 | 755,071 | 779,013 | 808,247 | (2 | )% | (11 | )% | |||||||||||||||||||
| Total retail loans | 10,570,512 | 10,612,772 | 10,775,589 | 10,826,188 | 10,898,661 | * | (3 | )% | ||||||||||||||||||||
| Total loans, net of unearned income | $ | 21,761,826 | $ | 21,708,626 | $ | 21,958,109 | $ | 21,910,762 | $ | 22,198,423 | * | (2 | )% | |||||||||||||||
| Period-End Loans (Net) | ||||||||||||||||||||||||||||
| Commercial | ||||||||||||||||||||||||||||
| Commercial, financial and industrial | $ | 7,642,684 | $ | 7,717,110 | $ | 7,238,630 | $ | 7,140,087 | $ | 6,978,643 | (1 | )% | 10 | % | ||||||||||||||
| Real estate commercial (a) | 1,492,323 | 1,463,726 | 1,345,526 | 1,294,922 | 1,326,261 | 2 | % | 13 | % | |||||||||||||||||||
| Real estate construction (b) | 2,020,455 | 2,271,533 | 2,602,968 | 2,753,475 | 2,828,545 | (11 | )% | (29 | )% | |||||||||||||||||||
| Total commercial loans | 11,155,462 | 11,452,369 | 11,187,124 | 11,188,484 | 11,133,449 | (3 | )% | * | ||||||||||||||||||||
| Retail | ||||||||||||||||||||||||||||
| Real estate residential (c) | 8,192,926 | 8,196,622 | 7,858,109 | 7,791,885 | 7,544,048 | * | 9 | % | ||||||||||||||||||||
| Real estate construction (d) | 1,201,911 | 1,513,845 | 1,814,863 | 2,008,289 | 2,160,593 | (21 | )% | (44 | )% | |||||||||||||||||||
| Other retail | 139,441 | 138,970 | 138,253 | 144,019 | 144,526 | * | (4 | )% | ||||||||||||||||||||
| Credit card receivables | 194,966 | 195,703 | 191,119 | 204,812 | 196,967 | * | (1 | )% | ||||||||||||||||||||
| Real estate loans pledged against | ||||||||||||||||||||||||||||
| other collateralized borrowings (e) | 717,192 | 727,723 | 742,552 | 766,027 | 793,421 | (1 | )% | (10 | )% | |||||||||||||||||||
| Total retail loans | 10,446,436 | 10,772,863 | 10,744,896 | 10,915,032 | 10,839,555 | (3 | )% | (4 | )% | |||||||||||||||||||
| Total loans, net of unearned income | $ | 21,601,898 | $ | 22,225,232 | $ | 21,932,020 | $ | 22,103,516 | $ | 21,973,004 | (3 | )% | (2 | )% | ||||||||||||||
| * Amount is less than one percent | |
| (a) | Includes nonconstruction income property loans |
| (b) | Includes home builder, condominium, and income property construction loans |
| (c) | Includes home equity loans, home equity lines of credit and permanent mortgages |
| (d) | Includes one-time close product |
| (e) | Includes on balance sheet securitizations of home equity loans |
11
| CONSOLIDATED AVERAGE BALANCE SHEET | ||||||||||||||||||||||||||||
| Quarterly, Unaudited | ||||||||||||||||||||||||||||
| 3Q08 Change vs. | ||||||||||||||||||||||||||||
| (Thousands) | 3Q08 | 2Q08 | 1Q08 | 4Q07 | 3Q07 | 2Q08 | 3Q07 | |||||||||||||||||||||
| Assets: | ||||||||||||||||||||||||||||
| Earning assets: | ||||||||||||||||||||||||||||
| Loans, net of unearned income* | $ | 21,761,826 | $ | 21,708,626 | $ | 21,958,109 | $ | 21,910,762 | $ | 22,198,423 | ** | (2 | )% | |||||||||||||||
| Loans held for sale | 1,950,831 | 3,606,621 | 3,728,008 | 3,337,237 | 3,963,650 | (46 | )% | (51 | )% | |||||||||||||||||||
| Loans held for sale-divestiture (a) | - | 195,175 | 248,751 | 467,424 | - | (100 | )% | NM | ||||||||||||||||||||
| Investment securities: | ||||||||||||||||||||||||||||
| U.S. Treasuries | 47,843 | 47,123 | 43,305 | 36,062 | 151,831 | 2 | % | (68 | )% | |||||||||||||||||||
| U.S. government agencies | 2,524,895 | 2,649,651 | 2,725,948 | 2,787,078 | 2,836,619 | (5 | )% | (11 | )% | |||||||||||||||||||
| States and municipalities | 31,682 | 31,347 | 12,847 | 1,740 | 1,750 | 1 | % | NM | ||||||||||||||||||||
| Other | 268,939 | 257,907 | 232,472 | 230,808 | 237,291 | 4 | % | 13 | % | |||||||||||||||||||
| Total investment securities | 2,873,359 | 2,986,028 | 3,014,572 | 3,055,688 | 3,227,491 | (4 | )% | (11 | )% | |||||||||||||||||||
| Capital markets securities inventory | 1,355,501 | 1,630,501 | 1,961,964 | 1,934,055 | 1,810,703 | (17 | )% | (25 | )% | |||||||||||||||||||
| Mortgage banking trading securities | 304,278 | 387,469 | 405,579 | 527,453 | 545,201 | (21 | )% | (44 | )% | |||||||||||||||||||
| Mortgage banking trading securities-divestiture (a) | 62,131 | 981 | - | - | - | NM | NM | |||||||||||||||||||||
| Other earning assets: | ||||||||||||||||||||||||||||
| Federal funds sold and securities | ||||||||||||||||||||||||||||
| purchased under agreements to resell | 1,213,510 | 1,275,548 | 1,304,707 | 1,237,957 | 1,224,193 | (5 | )% | (1 | )% | |||||||||||||||||||
| Interest bearing deposits with other financial institutions | 39,666 | 36,573 | 46,093 | 28,968 | 41,118 | 8 | % | (4 | )% | |||||||||||||||||||
| Total other earning assets | 1,253,176 | 1,312,121 | 1,350,800 | 1,266,925 | 1,265,311 | (4 | )% | (1 | )% | |||||||||||||||||||
| Total earning assets | 29,561,102 | 31,827,522 | 32,667,783 | 32,499,544 | 33,010,779 | (7 | )% | (10 | )% | |||||||||||||||||||
| Allowance for loan losses | (619,977 | ) | (529,124 | ) | (359,600 | ) | (246,916 | ) | (236,188 | ) | 17 | % | 162 | % | ||||||||||||||
| Cash and due from banks | 638,467 | 697,013 | 786,693 | 846,793 | 788,636 | (8 | )% | (19 | )% | |||||||||||||||||||
| Capital markets receivables | 196,285 | 251,667 | 297,908 | 182,358 | 141,519 | (22 | )% | 39 | % | |||||||||||||||||||
| Premises and equipment, net | 339,575 | 373,403 | 390,291 | 407,212 | 435,480 | (9 | )% | (22 | )% | |||||||||||||||||||
| Other assets | 3,219,952 | 3,517,017 | 3,367,729 | 3,540,575 | 3,613,812 | (8 | )% | (11 | )% | |||||||||||||||||||
| Other assets-divestiture (a) | 46,091 | 8,603 | 11,581 | 20,868 | - | 436 | % | NM | ||||||||||||||||||||
| Total assets | $ | 33,381,495 | $ | 36,146,101 | $ | 37,162,385 | $ | 37,250,434 | $ | 37,754,038 | (8 | )% | (12 | )% | ||||||||||||||
| Liabilities and shareholders' equity: | ||||||||||||||||||||||||||||
| Interest-bearing liabilities: | ||||||||||||||||||||||||||||
| Interest-bearing deposits: | ||||||||||||||||||||||||||||
| Interest bearing deposits-divestiture (a) | $ | - | $ | 30,695 | $ | 127,352 | $ | 292,615 | $ | - | (100 | )% | NM | |||||||||||||||
| Other interest-bearing deposits | 1,724,504 | 1,911,341 | 1,922,506 | 1,685,749 | 1,777,982 | (10 | )% | (3 | )% | |||||||||||||||||||
| Savings | 4,002,907 | 4,180,739 | 4,134,308 | 3,749,222 | 3,475,981 | (4 | )% | 15 | % | |||||||||||||||||||
| Time deposits | 2,422,189 | 2,530,300 | 2,763,335 | 2,850,719 | 2,913,872 | (4 | )% | (17 | )% | |||||||||||||||||||
| Total interest-bearing core deposits | 8,149,600 | 8,653,075 | 8,947,501 | 8,578,305 | 8,167,835 | (6 | )% | ** | ||||||||||||||||||||
| Certificates of deposit $100,000 and more | 1,839,651 | 2,022,972 | 2,696,781 | 4,464,070 | 6,802,371 | (9 | )% | (73 | )% | |||||||||||||||||||
| Certificates of deposit $100,000 and more-divestiture (a) | - | 279 | 4,770 | 30,499 | - | (100 | )% | NM | ||||||||||||||||||||
| Federal funds purchased and securities | ||||||||||||||||||||||||||||
| sold under agreements to repurchase | 2,593,485 | 3,810,955 | 5,236,736 | 4,936,968 | 4,964,072 | (32 | )% | (48 | )% | |||||||||||||||||||
| Federal funds purchased and securities | ||||||||||||||||||||||||||||
| sold under agreements to repurchase-divestiture (a) | - | 3,102 | 16,171 | 33,370 | - | (100 | )% | NM | ||||||||||||||||||||
| Capital markets trading liabilities | 708,875 | 768,565 | 846,369 | 812,969 | 773,576 | (8 | )% | (8 | )% | |||||||||||||||||||
| Other short-term borrowings and commercial paper (b) | 6,083,691 | 5,513,454 | 3,850,704 | 2,651,882 | 1,165,801 | 10 | % | 422 | % | |||||||||||||||||||
| Long term debt: | ||||||||||||||||||||||||||||
| Term borrowings | 5,193,319 | 5,886,694 | 6,013,433 | 5,981,215 | 5,837,370 | (12 | )% | (11 | )% | |||||||||||||||||||
| Other collateralized borrowings | 756,999 | 792,388 | 790,811 | 813,075 | 807,143 | (4 | )% | (6 | )% | |||||||||||||||||||
| Total long-term debt | 5,950,318 | 6,679,082 | 6,804,244 | 6,794,290 | 6,644,513 | (11 | )% | (10 | )% | |||||||||||||||||||
| Total interest-bearing liabilities | 25,325,620 | 27,451,484 | 28,403,276 | 28,302,353 | 28,518,168 | (8 | )% | (11 | )% | |||||||||||||||||||
| Noninterest-bearing deposits | 4,031,157 | 4,619,333 | 4,743,479 | 4,838,363 | 5,096,766 | (13 | )% | (21 | )% | |||||||||||||||||||
| Other noninterest-bearing deposits-divestiture (a) | 3,038 | 8,902 | 21,327 | 54,928 | - | (66 | )% | NM | ||||||||||||||||||||
| Capital markets payables | 178,289 | 232,282 | 292,846 | 173,351 | 139,170 | (23 | )% | 28 | % | |||||||||||||||||||
| Other liabilities | 827,244 | 995,931 | 1,234,695 | 1,262,345 | 1,276,262 | (17 | )% | (35 | )% | |||||||||||||||||||
| Other liabilities-divestiture (a) | 1,397 | 1,022 | 2,335 | 3,885 | - | 37 | % | NM | ||||||||||||||||||||
| Preferred stock of subsidiary | 295,277 | 295,277 | 295,277 | 295,277 | 295,277 | ** | ** | |||||||||||||||||||||
| Shareholders' equity | 2,719,473 | 2,541,870 | 2,169,150 | 2,319,932 | 2,428,395 | 7 | % | 12 | % | |||||||||||||||||||
| Total liabilities and shareholders' equity | $ | 33,381,495 | $ | 36,146,101 | $ | 37,162,385 | $ | 37,250,434 | $ | 37,754,038 | (8 | )% | (12 | )% | ||||||||||||||
| * | Includes loans on nonaccrual status |
| ** | Amount is less than one percent |
| NM - Not meaningful | |
| Certain previously reported amounts have been reclassified to agree with current presentation. | |
| (a) | Third and second quarters 2008 associated with the sale of certain mortgage operations, prior periods associated with the sale of First Horizon Bank branches. |
| (b) | In third quarter 2008, FRB Term Auction Facility borrowings averaged $2.2 billion, FHLB borrowings averaged $3.4 billion, and commercial paper averaged $2.9 million. |
12
| CONSOLIDATED AVERAGE BALANCE SHEET: INCOME & EXPENSE | ||||||||||||||||||||||||||||
| Quarterly, Unaudited | ||||||||||||||||||||||||||||
| 3Q08 Change vs. | ||||||||||||||||||||||||||||
| (Thousands) | 3Q08 | 2Q08 | 1Q08 | 4Q07 | 3Q07 | 2Q08 | 3Q07 | |||||||||||||||||||||
| Assets: | ||||||||||||||||||||||||||||
| Earning assets: | ||||||||||||||||||||||||||||
| Loans, net of unearned income* | $ | 281,777 | $ | 285,539 | $ | 331,803 | $ | 385,027 | $ | 413,376 | (1 | )% | (32 | )% | ||||||||||||||
| Loans held for sale | 29,078 | 54,217 | 58,438 | 62,249 | 66,570 | (46 | )% | (56 | )% | |||||||||||||||||||
| Investment securities: | ||||||||||||||||||||||||||||
| U.S. Treasuries | 250 | 249 | 340 | 434 | 1,856 | * | (87 | )% | ||||||||||||||||||||
| U.S. government agencies | 34,886 | 36,573 | 37,954 | 39,027 | 40,293 | (5 | )% | (13 | )% | |||||||||||||||||||
| States and municipalities | 372 | 324 | 220 | 4 | 4 | 15 | % | NM | ||||||||||||||||||||
| Other | 3,336 | 2,159 | 2,290 | 2,904 | 2,838 | 55 | % | 18 | % | |||||||||||||||||||
| Total investment securities | 38,844 | 39,305 | 40,804 | 42,369 | 44,991 | (1 | )% | (14 | )% | |||||||||||||||||||
| Capital markets securities inventory | 15,898 | 18,131 | 22,652 | 25,261 | 25,321 | (12 | )% | (37 | )% | |||||||||||||||||||
| Mortgage banking trading securities | 11,781 | 12,120 | 13,363 | 16,436 | 16,647 | (3 | )% | (29 | )% | |||||||||||||||||||
| Other earning assets: | ||||||||||||||||||||||||||||
| Federal funds sold and securities | ||||||||||||||||||||||||||||
| purchased under agreements to resell | 5,944 | 6,266 | 9,341 | 13,485 | 15,297 | (5 | )% | (61 | )% | |||||||||||||||||||
| Interest bearing deposits with other financial institutions | 253 | 189 | 357 | 450 | 705 | 34 | % | (64 | )% | |||||||||||||||||||
| Total other earning assets | 6,197 | 6,455 | 9,698 | 13,935 | 16,002 | (4 | )% | (61 | )% | |||||||||||||||||||
| Total earning assets/interest income | $ | 383,575 | $ | 415,767 | $ | 476,758 | $ | 545,277 | $ | 582,907 | (8 | )% | (34 | )% | ||||||||||||||
| Liabilities and shareholders' equity: | ||||||||||||||||||||||||||||
| Interest-bearing liabilities: | ||||||||||||||||||||||||||||
| Interest-bearing deposits: | ||||||||||||||||||||||||||||
| Other interest-bearing deposits | $ | 2,849 | $ | 3,556 | $ | 5,906 | $ | 5,976 | $ | 6,179 | (20 | )% | (54 | )% | ||||||||||||||
| Savings | 17,005 | 18,362 | 25,888 | 30,864 | 29,140 | (7 | )% | (42 | )% | |||||||||||||||||||
| Time deposits | 22,443 | 25,540 | 31,502 | 35,234 | 34,745 | (12 | )% | (35 | )% | |||||||||||||||||||
| Total interest-bearing core deposits | 42,297 | 47,458 | 63,296 | 72,074 | 70,064 | (11 | )% | (40 | )% | |||||||||||||||||||
| Certificates of deposit $100,000 and more | 15,184 | 17,361 | 31,069 | 59,851 | 92,556 | (13 | )% | (84 | )% | |||||||||||||||||||
| Federal funds purchased and securities | ||||||||||||||||||||||||||||
| sold under agreements to repurchase | 10,696 | 17,834 | 38,521 | 52,635 | 60,287 | (40 | )% | (82 | )% | |||||||||||||||||||
| Capital markets trading liabilities | 8,304 | 9,400 | 9,615 | 10,588 | 10,295 | (12 | )% | (19 | )% | |||||||||||||||||||
| Other short-term borrowings and commercial paper | 36,496 | 31,591 | 31,527 | 30,229 | 14,827 | 16 | % | 146 | % | |||||||||||||||||||
| Long term debt: | ||||||||||||||||||||||||||||
| Term borrowings | 41,598 | 47,129 | 66,303 | 82,870 | 85,241 | (12 | )% | (51 | )% | |||||||||||||||||||
| Other collateralized borrowings | 5,521 | 5,817 | 8,020 | 10,902 | 11,661 | (5 | )% | (53 | )% | |||||||||||||||||||
| Total long-term debt | 47,119 | 52,946 | 74,323 | 93,772 | 96,902 | (11 | )% | (51 | )% | |||||||||||||||||||
| Total interest-bearing liabilities/interest expense | $ | 160,096 | $ | 176,590 | $ | 248,351 | $ | 319,149 | $ | 344,931 | (9 | )% | (54 | )% | ||||||||||||||
| Net interest income-tax equivalent basis | $ | 223,479 | $ | 239,177 | $ | 228,407 | $ | 226,128 | $ | 237,976 | (7 | )% | (6 | )% | ||||||||||||||
| Fully taxable equivalent adjustment | (332 | ) | (282 | ) | (315 | ) | (141 | ) | (172 | ) | NM | NM | ||||||||||||||||
| Net interest income | $ | 223,147 | $ | 238,895 | $ | 228,092 | $ | 225,987 | $ | 237,804 | (7 | )% | (6 | )% | ||||||||||||||
* Includes loans on nonaccrual status
Income amounts are adjusted to a fully taxable equivalent. Earning assets income is expressed net of unearned income.
NM - Not meaningful
13
| CONSOLIDATED AVERAGE BALANCE SHEET: YIELDS & RATES | ||||||||||||||||||||
| Quarterly, Unaudited | ||||||||||||||||||||
| (Thousands) | 3Q08 | 2Q08 | 1Q08 | 4Q07 | 3Q07 | |||||||||||||||
| Assets: | ||||||||||||||||||||
| Earning assets: | ||||||||||||||||||||
| Loans, net of unearned income* | 5.16 | % | 5.29 | % | 6.07 | % | 6.98 | % | 7.39 | % | ||||||||||
| Loans held for sale | 5.96 | 5.70 | 5.88 | 6.54 | 6.72 | |||||||||||||||
| Investment securities: | ||||||||||||||||||||
| U.S. Treasuries | 2.08 | 2.13 | 3.15 | 4.77 | 4.85 | |||||||||||||||
| U.S. government agencies | 5.53 | 5.52 | 5.57 | 5.60 | 5.68 | |||||||||||||||
| States and municipalities | 4.70 | 4.14 | 6.87 | .82 | .83 | |||||||||||||||
| Other | 4.96 | 3.35 | 3.94 | 5.03 | 4.78 | |||||||||||||||
| Total investment securities | 5.41 | 5.27 | 5.41 | 5.55 | 5.57 | |||||||||||||||
| Capital markets securities inventory | 4.69 | 4.45 | 4.62 | 5.22 | 5.59 | |||||||||||||||
| Mortgage banking trading securities | 12.86 | 12.48 | 13.18 | 12.46 | 12.21 | |||||||||||||||
| Other earning assets: | ||||||||||||||||||||
| Federal funds sold and securities | ||||||||||||||||||||
| purchased under agreements to resell | 1.95 | 1.98 | 2.88 | 4.32 | 4.96 | |||||||||||||||
| Interest bearing deposits with other financial institutions | 2.54 | 2.08 | 3.11 | 6.17 | 6.80 | |||||||||||||||
| Total other earning assets | 1.97 | 1.98 | 2.89 | 4.36 | 5.02 | |||||||||||||||
| Total earning assets/interest income | 5.17 | % | 5.24 | % | 5.86 | % | 6.67 | % | 7.02 | % | ||||||||||
| Liabilities and shareholders' equity: | ||||||||||||||||||||
| Interest-bearing liabilities: | ||||||||||||||||||||
| Interest-bearing deposits: | ||||||||||||||||||||
| Other interest-bearing deposits | .66 | % | .74 | % | 1.19 | % | 1.33 | % | 1.38 | % | ||||||||||
| Savings | 1.69 | 1.76 | 2.50 | 3.19 | 3.33 | |||||||||||||||
| Time deposits | 3.69 | 4.06 | 4.55 | 4.73 | 4.73 | |||||||||||||||
| Total interest-bearing core deposits | 2.06 | 2.21 | 2.85 | 3.33 | 3.40 | |||||||||||||||
| Certificates of deposit $100,000 and more | 3.28 | 3.45 | 4.63 | 5.28 | 5.40 | |||||||||||||||
| Federal funds purchased and securities | ||||||||||||||||||||
| sold under agreements to repurchase | 1.64 | 1.88 | 2.95 | 4.20 | 4.82 | |||||||||||||||
| Capital markets trading liabilities | 4.66 | 4.92 | 4.57 | 5.17 | 5.28 | |||||||||||||||
| Other short-term borrowings and commercial paper | 2.39 | 2.30 | 3.29 | 4.52 | 5.05 | |||||||||||||||
| Long term debt: | ||||||||||||||||||||
| Term borrowings | 3.21 | 3.20 | 4.41 | 5.55 | 5.85 | |||||||||||||||
| Other collateralized borrowings | 2.92 | 2.94 | 4.06 | 5.36 | 5.78 | |||||||||||||||
| Total long-term debt | 3.17 | 3.17 | 4.37 | 5.52 | 5.84 | |||||||||||||||
| Total interest-bearing liabilities/interest expense | 2.52 | % | 2.58 | % | 3.51 | % | 4.49 | % | 4.81 | % | ||||||||||
| Net interest spread | 2.65 | % | 2.66 | % | 2.35 | % | 2.18 | % | 2.21 | % | ||||||||||
| Effect of interest-free sources used to fund | ||||||||||||||||||||
| earning assets | .36 | .35 | .46 | .59 | .66 | |||||||||||||||
| Net interest margin | 3.01 | % | 3.01 | % | 2.81 | % | 2.77 | % | 2.87 | % | ||||||||||
| * Includes loans on nonaccrual status |
| Yields are adjusted to a fully taxable equivalent. Earning assets yields are expressed net of unearned income. |
| Rates are expressed net of unamortized debenture cost for long-term debt. Net interest margin is computed using total net interest income. |
14
| MORTGAGE SERVICING RIGHTS | ||||||||||||||||||||||||||||
| Quarterly, Unaudited | ||||||||||||||||||||||||||||
| 3Q08 Change vs. | ||||||||||||||||||||||||||||
| (Thousands) | 3Q08 | 2Q08 | 1Q08 | 4Q07 | 3Q07 | 2Q08 | 3Q07 | |||||||||||||||||||||
| First Liens | ||||||||||||||||||||||||||||
| Fair value beginning balance | $ | 1,111,204 | $ | 865,855 | $ | 1,122,415 | $ | 1,429,245 | $ | 1,481,727 | 28 | % | (25 | )% | ||||||||||||||
| Addition of mortgage servicing rights | 61,500 | 100,305 | 78,871 | 67,300 | 97,084 | |||||||||||||||||||||||
| Reductions due to loan payments | (20,091 | ) | (38,598 | ) | (37,448 | ) | (40,930 | ) | (48,964 | ) | �� | |||||||||||||||||
| Reductions due to sale | (320,482 | ) | (72,271 | ) | (43,842 | ) | (96,502 | ) | - | |||||||||||||||||||
| Changes in fair value due to: | ||||||||||||||||||||||||||||
| Changes in valuation model inputs | ||||||||||||||||||||||||||||
| or assumptions (a) | (39,194 | ) | 255,890 | (254,076 | ) | (236,695 | ) | (100,602 | ) | |||||||||||||||||||
| Other changes in fair value | (22,316 | ) | 23 | (65 | ) | (3 | ) | - | ||||||||||||||||||||
| Fair value ending balance | $ | 770,621 | $ | 1,111,204 | $ | 865,855 | $ | 1,122,415 | $ | 1,429,245 | (31 | )% | (46 | )% | ||||||||||||||
| Second Liens | ||||||||||||||||||||||||||||
| Fair value beginning balance | $ | 18,138 | $ | 20,126 | $ | 25,832 | $ | 28,747 | $ | 27,608 | (10 | )% | (34 | )% | ||||||||||||||
| Addition of mortgage servicing rights | - | - | - | - | 3,587 | |||||||||||||||||||||||
| Reductions due to loan payments | (614 | ) | (1,737 | ) | (2,617 | ) | (2,097 | ) | (2,559 | ) | ||||||||||||||||||
| Changes in fair value due to: | ||||||||||||||||||||||||||||
| Changes in valuation model inputs | ||||||||||||||||||||||||||||
| or assumptions (a) | - | (254 | ) | (3,089 | ) | (834 | ) | 32 | ||||||||||||||||||||
| Other changes in fair value | 3 | 3 | - | 16 | 79 | |||||||||||||||||||||||
| Fair value ending balance | $ | 17,527 | $ | 18,138 | $ | 20,126 | $ | 25,832 | $ | 28,747 | (3 | )% | (39 | )% | ||||||||||||||
| HELOC | ||||||||||||||||||||||||||||
| Fair value beginning balance | $ | 10,053 | $ | 9,942 | $ | 11,573 | $ | 12,597 | $ | 13,631 | 1 | % | (26 | )% | ||||||||||||||
| Addition of mortgage servicing rights | 43 | 215 | 887 | 174 | 87 | |||||||||||||||||||||||
| Reductions due to loan payments | (483 | ) | (491 | ) | (707 | ) | (736 | ) | (1,124 | ) | ||||||||||||||||||
| Changes in fair value due to: | ||||||||||||||||||||||||||||
| Changes in valuation model inputs | ||||||||||||||||||||||||||||
| or assumptions (a) | - | (230 | ) | (1,935 | ) | (462 | ) | (39 | ) | |||||||||||||||||||
| Other changes in fair value | 730 | 617 | 124 | - | 42 | |||||||||||||||||||||||
| Fair value ending balance | $ | 10,343 | $ | 10,053 | $ | 9,942 | $ | 11,573 | $ | 12,597 | 3 | % | (18 | )% | ||||||||||||||
| Total Consolidated | ||||||||||||||||||||||||||||
| Fair value beginning balance | $ | 1,139,395 | $ | 895,923 | $ | 1,159,820 | $ | 1,470,589 | $ | 1,522,966 | 27 | % | (25 | )% | ||||||||||||||
| Addition of mortgage servicing rights | 61,543 | 100,520 | 79,758 | 67,474 | 100,758 | |||||||||||||||||||||||
| Reductions due to loan payments | (21,188 | ) | (40,826 | ) | (40,772 | ) | (43,763 | ) | (52,647 | ) | ||||||||||||||||||
| Reductions due to sale | (320,482 | ) | (72,271 | ) | (43,842 | ) | (96,502 | ) | - | |||||||||||||||||||
| Changes in fair value due to: | ||||||||||||||||||||||||||||
| Changes in valuation model inputs | ||||||||||||||||||||||||||||
| or assumptions (a) | (39,194 | ) | 255,406 | (259,100 | ) | (237,991 | ) | (100,609 | ) | |||||||||||||||||||
| Other changes in fair value | (21,583 | ) | 643 | 59 | 13 | 121 | ||||||||||||||||||||||
| Fair value ending balance | $ | 798,491 | $ | 1,139,395 | $ | 895,923 | $ | 1,159,820 | $ | 1,470,589 | (30 | )% | (46 | )% | ||||||||||||||
(a) Principally reflects changes in discount rates and prepayment speed assumptions, mostly due to changes in interest rates
15
| BUSINESS SEGMENT HIGHLIGHTS | ||||||||||||||||||||||||||||
| Quarterly, Unaudited | ||||||||||||||||||||||||||||
| 3Q08 Change vs. | ||||||||||||||||||||||||||||
| (Thousands) | 3Q08 | 2Q08 | 1Q08 | 4Q07 | 3Q07 | 2Q08 | 3Q07 | |||||||||||||||||||||
| Regional Banking | ||||||||||||||||||||||||||||
| Total revenues(a) | $ | 210,298 | $ | 212,920 | $ | 207,636 | $ | 229,125 | $ | 228,578 | (1 | )% | (8 | )% | ||||||||||||||
| Provision for loan losses | 58,201 | 89,477 | 75,264 | 15,831 | 18,523 | (35 | )% | 214 | % | |||||||||||||||||||
| Noninterest expenses | 158,628 | 150,294 | 150,523 | 159,882 | 153,816 | 6 | % | 3 | % | |||||||||||||||||||
| Pre-tax income/(loss) | (6,531 | ) | (26,851 | ) | (18,151 | ) | 53,412 | 56,239 | (76 | )% | NM | |||||||||||||||||
| Provision/(benefit) for income taxes | (11,670 | ) | (19,838 | ) | (13,541 | ) | 27,026 | 19,798 | (41 | )% | NM | |||||||||||||||||
| Net income/(loss) from continuing operations | 5,139 | (7,013 | ) | (4,610 | ) | 26,386 | 36,441 | NM | (86 | )% | ||||||||||||||||||
| Income from discontinued operations, net of tax | - | - | 883 | 4,137 | 209 | NM | NM | |||||||||||||||||||||
| Net income/(loss) | $ | 5,139 | $ | (7,013 | ) | $ | (3,727 | ) | $ | 30,523 | $ | 36,650 | NM | (86 | )% | |||||||||||||
| National Specialty Lending | ||||||||||||||||||||||||||||
| Total revenues(a) | $ | 49,417 | $ | 39,052 | $ | 55,040 | $ | 54,321 | $ | 62,413 | 27 | % | (21 | )% | ||||||||||||||
| Provision for loan losses | 240,470 | 108,000 | 149,483 | 139,398 | 22,807 | 123 | % | 954 | % | |||||||||||||||||||
| Noninterest expenses | 23,487 | 26,675 | 25,146 | 31,067 | 33,622 | (12 | )% | (30 | )% | |||||||||||||||||||
| Pre-tax income/(loss) | (214,540 | ) | (95,623 | ) | (119,589 | ) | (116,144 | ) | 5,984 | NM | NM | |||||||||||||||||
| Provision/(benefit) for income taxes | (79,491 | ) | (33,528 | ) | (46,359 | ) | (43,859 | ) | 1,810 | 137 | % | NM | ||||||||||||||||
| Net income/(loss) | $ | (135,049 | ) | $ | (62,095 | ) | $ | (73,230 | ) | $ | (72,285 | ) | $ | 4,174 | NM | NM | ||||||||||||
| Mortgage Banking | ||||||||||||||||||||||||||||
| Total revenues(a) | $ | 138,344 | $ | 222,297 | $ | 198,066 | $ | (79,826 | ) | $ | 69,059 | (38 | )% | 100 | % | |||||||||||||
| Provision for loan losses | 2,878 | 4,001 | 222 | 46 | 4 | (28 | )% | NM | ||||||||||||||||||||
| Noninterest expenses | 89,040 | 149,062 | 147,543 | 174,203 | 108,303 | (40 | )% | (18 | )% | |||||||||||||||||||
| Pre-tax income/(loss) | 46,426 | 69,234 | 50,301 | (254,075 | ) | (39,248 | ) | (33 | )% | NM | ||||||||||||||||||
| Provision/(benefit) for income taxes | 16,648 | 22,960 | 18,129 | (99,185 | ) | (13,984 | ) | (27 | )% | NM | ||||||||||||||||||
| Net income/(loss) | $ | 29,778 | $ | 46,274 | $ | 32,172 | $ | (154,890 | ) | $ | (25,264 | ) | (36 | )% | NM | |||||||||||||
| Capital Markets | ||||||||||||||||||||||||||||
| Total revenues(a) | $ | 117,527 | $ | 143,150 | $ | 153,579 | $ | 119,191 | $ | 78,622 | (18 | )% | 49 | % | ||||||||||||||
| Provision for loan losses | 38,451 | 18,522 | 15,031 | 1,244 | 2,018 | 108 | % | NM | ||||||||||||||||||||
| Noninterest expenses | 87,674 | 100,559 | 115,728 | 87,042 | 73,921 | (13 | )% | 19 | % | |||||||||||||||||||
| Pre-tax income/(loss) | (8,598 | ) | 24,069 | 22,820 | 30,905 | 2,683 | NM | NM | ||||||||||||||||||||
| Provision/(benefit) for income taxes | (3,375 | ) | 8,960 | 8,437 | 11,572 | 900 | NM | NM | ||||||||||||||||||||
| Net income/(loss) | $ | (5,223 | ) | $ | 15,109 | $ | 14,383 | $ | 19,333 | $ | 1,783 | NM | NM | |||||||||||||||
| Corporate | ||||||||||||||||||||||||||||
| Total revenues(a) | $ | 12,734 | $ | 20,522 | $ | 62,847 | $ | (3,837 | ) | $ | 2,607 | (38 | )% | 388 | % | |||||||||||||
| Provision for loan losses | - | - | - | - | - | - | - | |||||||||||||||||||||
| Noninterest expenses | 32,445 | 39,253 | (663 | ) | 109,365 | 51,960 | (17 | )% | (38 | )% | ||||||||||||||||||
| Pre-tax income/(loss) | (19,711 | ) | (18,731 | ) | 63,510 | (113,202 | ) | (49,353 | ) | NM | NM | |||||||||||||||||
| Provision/(benefit) for income taxes | (6,776 | ) | (7,375 | ) | 25,188 | (41,896 | ) | (17,854 | ) | NM | NM | |||||||||||||||||
| Net income/(loss) | $ | (12,935 | ) | $ | (11,356 | ) | $ | 38,322 | $ | (71,306 | ) | $ | (31,499 | ) | NM | NM | ||||||||||||
| Total Consolidated | ||||||||||||||||||||||||||||
| Total revenues(a) | $ | 528,320 | $ | 637,941 | $ | 677,168 | $ | 318,974 | $ | 441,279 | (17 | )% | 20 | % | ||||||||||||||
| Provision for loan losses | 340,000 | 220,000 | 240,000 | 156,519 | 43,352 | 55 | % | 684 | % | |||||||||||||||||||
| Noninterest expenses | 391,274 | 465,843 | 438,277 | 561,559 | 421,622 | (16 | )% | (7 | )% | |||||||||||||||||||
| Pre-tax income/(loss) | (202,954 | ) | (47,902 | ) | (1,109 | ) | (399,104 | ) | (23,695 | ) | NM | NM | ||||||||||||||||
| Provision/(benefit) for income taxes | (84,664 | ) | (28,821 | ) | (8,146 | ) | (146,342 | ) | (9,330 | ) | 194 | % | 807 | % | ||||||||||||||
| Net income/(loss) from continuing operations | (118,290 | ) | (19,081 | ) | 7,037 | (252,762 | ) | (14,365 | ) | NM | NM | |||||||||||||||||
| Income from discontinued operations, net of tax | - | - | 883 | 4,137 | 209 | - | NM | |||||||||||||||||||||
| Net income/(loss) | $ | (118,290 | ) | $ | (19,081 | ) | $ | 7,920 | $ | (248,625 | ) | $ | (14,156 | ) | NM | NM | ||||||||||||
| (a) Includes noninterest income and net interest income/(expense) |
| NM - Not meaningful |
16
| REGIONAL BANKING | ||||||||||||||||||||||||||||
| Quarterly, Unaudited | ||||||||||||||||||||||||||||
| 3Q08 Change vs. | ||||||||||||||||||||||||||||
| (Thousands) | 3Q08 | 2Q08 | 1Q08 | 4Q07 | 3Q07 | 2Q08 | 3Q07 | |||||||||||||||||||||
| Income Statement | ||||||||||||||||||||||||||||
| Net interest income | $ | 122,379 | $ | 120,384 | $ | 120,565 | $ | 133,613 | $ | 136,935 | 2 | % | (11 | )% | ||||||||||||||
| Noninterest income | 87,919 | 92,536 | 87,071 | 95,511 | 91,644 | (5 | )% | (4 | )% | |||||||||||||||||||
| Securities gains/(losses), net | - | - | - | 1 | (1 | ) | - | (100 | )% | |||||||||||||||||||
| Total revenue | 210,298 | 212,920 | 207,636 | 229,125 | $ | 228,578 | (1 | )% | (8 | )% | ||||||||||||||||||
| Total noninterest expense | 158,628 | 150,294 | 150,523 | 159,882 | 153,816 | 6 | % | 3 | % | |||||||||||||||||||
| Provision | 58,201 | 89,477 | 75,264 | 15,831 | 18,523 | (35 | )% | 214 | % | |||||||||||||||||||
| Pretax (loss)/income | $ | (6,531 | ) | $ | (26,851 | ) | $ | (18,151 | ) | $ | 53,412 | $ | 56,239 | (76 | )% | (112 | )% | |||||||||||
| Efficiency ratio | 75.43 | % | 70.59 | % | 72.49 | % | 69.78 | % | 67.29 | % | ||||||||||||||||||
| Balance Sheet (millions) | ||||||||||||||||||||||||||||
| Average loans | $ | 10,915 | $ | 10,801 | $ | 10,705 | $ | 10,667 | $ | 11,162 | 1 | % | (2 | )% | ||||||||||||||
| Other earning assets | 65 | 242 | 339 | 525 | 35 | (73 | )% | 86 | % | |||||||||||||||||||
| Total earning assets | 10,980 | 11,043 | 11,044 | 11,192 | 11,197 | (1 | )% | (2 | )% | |||||||||||||||||||
| Core deposits | 9,564 | 9,970 | 10,059 | 9,854 | 10,153 | (4 | )% | (6 | )% | |||||||||||||||||||
| Other deposits | 976 | 1,053 | 1,160 | 1,369 | 1,368 | (7 | )% | (29 | )% | |||||||||||||||||||
| Deposits - divestiture | - | 37 | 153 | 378 | - | (100 | )% | - | ||||||||||||||||||||
| Total deposits | 10,540 | 11,060 | 11,372 | 11,601 | 11,521 | (5 | )% | (9 | )% | |||||||||||||||||||
| Total period end deposits | 10,621 | 11,035 | 11,370 | 11,679 | 11,598 | (4 | )% | (8 | )% | |||||||||||||||||||
| Total period end assets | $ | 12,301 | $ | 12,234 | $ | 12,172 | $ | 12,674 | $ | 12,688 | 1 | % | (3 | )% | ||||||||||||||
| Net interest margin | 4.43 | % | 4.38 | % | 4.39 | % | 4.74 | % | 4.85 | % | ||||||||||||||||||
| Noninterest Income Detail | ||||||||||||||||||||||||||||
| Deposit transactions & cash mgmt | $ | 44,470 | $ | 45,404 | $ | 41,230 | $ | 46,648 | $ | 43,631 | (2 | )% | 2 | % | ||||||||||||||
| Insurance commissions | 7,160 | 7,033 | 7,854 | 7,485 | 6,507 | 2 | % | 10 | % | |||||||||||||||||||
| Trust services & investment mgmt | 8,192 | 8,915 | 9,147 | 10,137 | 9,972 | (8 | )% | (18 | )% | |||||||||||||||||||
| Bankcard Income | 4,706 | 4,752 | 4,491 | 5,035 | 5,065 | (1 | )% | (7 | )% | |||||||||||||||||||
| Other service charges | 3,556 | 3,780 | 4,037 | 4,152 | 4,185 | (6 | )% | (15 | )% | |||||||||||||||||||
| Miscellaneous revenue | 19,835 | 22,652 | 20,312 | 22,054 | 22,284 | (12 | )% | (11 | )% | |||||||||||||||||||
| Total noninterest income | $ | 87,919 | $ | 92,536 | $ | 87,071 | $ | 95,511 | $ | 91,644 | (5 | )% | (4 | )% | ||||||||||||||
| Key Statistics | ||||||||||||||||||||||||||||
| Locations | ||||||||||||||||||||||||||||
| Full-Service Financial Centers | 200 | 198 | 206 | 216 | 233 | 1 | % | (14 | )% | |||||||||||||||||||
| First Tennessee | 200 | 198 | 197 | 197 | 199 | 1 | % | 1 | % | |||||||||||||||||||
| First Horizon Bank | - | - | 9 | 19 | 34 | - | NM | |||||||||||||||||||||
| Trust Assets | ||||||||||||||||||||||||||||
| Total assets (millions) | $ | 11,015 | $ | 11,291 | $ | 11,681 | $ | 12,300 | $ | 12,954 | (2 | )% | (15 | )% | ||||||||||||||
| Total managed assets (millions) | 5,089 | 5,373 | 5,641 | 5,880 | 6,645 | (5 | )% | (23 | )% | |||||||||||||||||||
| NM - Not meaningful |
| * Amount is less than one percent. |
| Certain previously reported amounts have been reclassified to agree with current presentation. |
17
| CAPITAL MARKETS | ||||||||||||||||||||||||||||
| Quarterly, Unaudited | ||||||||||||||||||||||||||||
| 3Q08 Change vs. | ||||||||||||||||||||||||||||
| (Thousands) | 3Q08 | 2Q08 | 1Q08 | 4Q07 | 3Q07 | 2Q08 | 3Q07 | |||||||||||||||||||||
| Income Statement | ||||||||||||||||||||||||||||
| Net interest income | ||||||||||||||||||||||||||||
| Correspondent Banking | $ | 11,841 | $ | 12,399 | $ | 12,808 | $ | 11,437 | $ | 12,483 | (5 | )% | (5 | )% | ||||||||||||||
| Capital Markets | 7,151 | 6,094 | 6,841 | 4,389 | 1,655 | 17 | % | 332 | % | |||||||||||||||||||
| Total net interest income | 18,992 | 18,493 | 19,649 | 15,826 | 14,138 | 3 | % | 34 | % | |||||||||||||||||||
| Noninterest income: | ||||||||||||||||||||||||||||
| Fixed income | 80,104 | 105,002 | 152,208 | 77,126 | 46,003 | (24 | )% | 74 | % | |||||||||||||||||||
| Other | 18,431 | 19,655 | (18,278 | ) | 26,239 | 18,481 | (6 | )% | * | |||||||||||||||||||
| Total noninterest income | 98,535 | 124,657 | 133,930 | 103,365 | 64,484 | (21 | )% | 53 | % | |||||||||||||||||||
| Total revenue | 117,527 | 143,150 | 153,579 | 119,191 | 78,622 | (18 | )% | 49 | % | |||||||||||||||||||
| Noninterest expense | 87,674 | 100,559 | 115,728 | 87,042 | 73,921 | (13 | )% | 19 | % | |||||||||||||||||||
| Provision | 38,451 | 18,522 | 15,031 | 1,244 | 2,018 | 108 | % | NM | ||||||||||||||||||||
| Pretax (loss)/income | $ | (8,598 | ) | $ | 24,069 | $ | 22,820 | $ | 30,905 | $ | 2,683 | (136 | )% | (420 | )% | |||||||||||||
| Efficiency ratio | 74.60 | % | 70.25 | % | 75.35 | % | 73.03 | % | 94.02 | % | ||||||||||||||||||
| Balance Sheet (millions) | ||||||||||||||||||||||||||||
| Trading inventory | $ | 1,356 | $ | 1,631 | $ | 1,962 | $ | 1,934 | $ | 1,810 | (17 | )% | (25 | )% | ||||||||||||||
| Average Loans (a) | 1,759 | 1,491 | 1,465 | 1,402 | 1,291 | 18 | % | 36 | % | |||||||||||||||||||
| Other earning assets | 1,275 | 1,656 | 1,728 | 1,708 | 1,532 | (23 | )% | (17 | )% | |||||||||||||||||||
| Total earning assets | 4,390 | 4,778 | 5,155 | 5,044 | 4,633 | (8 | )% | (5 | )% | |||||||||||||||||||
| Total period end assets | $ | 5,968 | $ | 5,602 | $ | 6,154 | $ | 5,265 | $ | 5,868 | 7 | % | 2 | % | ||||||||||||||
| Net interest margin: | ||||||||||||||||||||||||||||
| Correspondent Banking | 2.97 | % | 3.06 | % | 3.28 | % | 3.01 | % | 3.17 | % | (3 | )% | (6 | )% | ||||||||||||||
| Capital Markets | 1.01 | % | .78 | % | .77 | % | .49 | % | .21 | % | 29 | % | 381 | % | ||||||||||||||
| Total Capital Markets | 1.72 | % | 1.56 | % | 1.53 | % | 1.24 | % | 1.21 | % | ||||||||||||||||||
| NM - Not meaningful |
| * Amount is less than one percent. |
| Certain previously reported amounts have been reclassified to agree with current presentation. |
| (a) Includes trust preferred warehouse loans moved from loans held for sale to loans held to maturity in 2Q08. |
18
| NATIONAL SPECIALTY LENDING | ||||||||||||||||||||||||||||
| Quarterly, Unaudited | ||||||||||||||||||||||||||||
| 3Q08 Change vs. | ||||||||||||||||||||||||||||
| (Thousands) | 3Q08 | 2Q08 | 1Q08 | 4Q07 | 3Q07 | 2Q08 | 3Q07 | |||||||||||||||||||||
| Income Statement | ||||||||||||||||||||||||||||
| Net interest income | $ | 45,236 | $ | 53,555 | $ | 54,389 | $ | 58,698 | $ | 61,218 | (16 | )% | (26 | )% | ||||||||||||||
| Noninterest income | 4,181 | (14,503 | ) | 651 | (4,377 | ) | 1,195 | NM | 250 | % | ||||||||||||||||||
| Total revenue | 49,417 | 39,052 | 55,040 | 54,321 | 62,413 | 27 | % | (21 | )% | |||||||||||||||||||
| Total noninterest expense | 23,487 | 26,675 | 25,146 | 31,067 | 33,622 | (12 | )% | (30 | )% | |||||||||||||||||||
| Provision | 240,470 | 108,000 | 149,483 | 139,398 | 22,807 | 123 | % | 954 | % | |||||||||||||||||||
| Pretax (loss)/income | $ | (214,540 | ) | $ | (95,623 | ) | $ | (119,589 | ) | $ | (116,144 | ) | $ | 5,984 | NM | NM | ||||||||||||
| Efficiency ratio | 47.53 | % | 68.31 | % | 45.69 | % | 57.19 | % | 53.87 | % | ||||||||||||||||||
| Balance Sheet (millions) | ||||||||||||||||||||||||||||
| Average loans | $ | 8,407 | $ | 8,953 | $ | 9,384 | $ | 9,450 | $ | 9,345 | (6 | )% | (10 | )% | ||||||||||||||
| Other earning assets | 8 | 17 | 21 | 175 | 355 | (53 | )% | (98 | )% | |||||||||||||||||||
| Total earning assets | 8,415 | 8,970 | 9,405 | 9,625 | 9,700 | (6 | )% | (13 | )% | |||||||||||||||||||
| Total deposits | 181 | 240 | 291 | 353 | 423 | (25 | )% | (57 | )% | |||||||||||||||||||
| Total period end deposits | 156 | 208 | 260 | 317 | 368 | (25 | )% | (58 | )% | |||||||||||||||||||
| Net interest margin | 2.14 | % | 2.40 | % | 2.33 | % | 2.42 | % | 2.50 | % | ||||||||||||||||||
| NM - Not meaningful |
| * Amount is less than one percent. |
| Certain previously reported amounts have been reclassified to agree with current presentation. |
19
| MORTGAGE BANKING | ||||||||||||||||||||||||||||
| Quarterly, Unaudited | ||||||||||||||||||||||||||||
| 3Q08 Change vs. | ||||||||||||||||||||||||||||
| (Thousands) | 3Q08 | 2Q08 | 1Q08 | 4Q07 | 3Q07 | 2Q08 | 3Q07 | |||||||||||||||||||||
| Income Statement | ||||||||||||||||||||||||||||
| Net interest income | $ | 22,524 | $ | 31,835 | $ | 30,052 | $ | 22,852 | $ | 26,939 | NM | NM | ||||||||||||||||
| Noninterest income | ||||||||||||||||||||||||||||
| Net origination fees (a) | 19,829 | 134,095 | 84,056 | 5,008 | (17,494 | ) | NM | NM | ||||||||||||||||||||
| Net servicing fees | 80,603 | 42,614 | 69,343 | (118,107 | ) | 49,738 | NM | NM | ||||||||||||||||||||
| Other fees | 15,388 | 13,753 | 14,615 | 10,421 | 9,876 | NM | NM | |||||||||||||||||||||
| Total noninterest income | 115,820 | 190,462 | 168,014 | (102,678 | ) | 42,120 | NM | NM | ||||||||||||||||||||
| Total revenue | 138,344 | 222,297 | 198,066 | (79,826 | ) | 69,059 | NM | NM | ||||||||||||||||||||
| Noninterest expense (b) | 89,040 | 149,062 | 147,543 | 174,203 | 108,303 | NM | NM | |||||||||||||||||||||
| Provision | 2,878 | 4,001 | 222 | 46 | 4 | NM | NM | |||||||||||||||||||||
| Pretax income/(loss) | $ | 46,426 | $ | 69,234 | $ | 50,301 | $ | (254,075 | ) | $ | (39,248 | ) | NM | NM | ||||||||||||||
| Efficiency ratio | 64.36 | % | 67.06 | % | 74.49 | % | (218.23 | )% | 156.83 | % | ||||||||||||||||||
| Average Balance Sheet (millions) | ||||||||||||||||||||||||||||
| Warehouse | $ | 1,810 | $ | 3,182 | $ | 3,230 | $ | 2,672 | $ | 3,311 | NM | NM | ||||||||||||||||
| Trading securities | 359 | 372 | 387 | 511 | 524 | NM | NM | |||||||||||||||||||||
| Mortgage servicing rights | 1,003 | 974 | 1,020 | 1,354 | 1,465 | NM | NM | |||||||||||||||||||||
| Permanent Mortgages & other assets | 1,719 | 1,706 | 1,482 | 1,348 | 1,326 | NM | NM | |||||||||||||||||||||
| Total assets | 4,891 | 6,234 | 6,119 | 5,885 | 6,626 | NM | NM | |||||||||||||||||||||
| Escrow balances | 989 | 1,516 | 1,691 | 1,709 | 1,894 | NM | NM | |||||||||||||||||||||
| Net interest margin | 3.05 | % | 3.15 | % | 2.98 | % | 2.48 | % | 2.47 | % | ||||||||||||||||||
| Warehouse Spread | 3.83 | % | 3.14 | % | 2.63 | % | 1.54 | % | 1.34 | % | ||||||||||||||||||
| Noninterest Expense Detail | ||||||||||||||||||||||||||||
| Commissions & incentives (a) | $ | 18,415 | $ | 41,369 | $ | 45,956 | $ | 39,359 | $ | 45,112 | ||||||||||||||||||
| FAS 91 cost deferral (a) | 1,097 | 1,789 | 764 | (3,878 | ) | 6,392 | ||||||||||||||||||||||
| Other salaries & benefits | 22,011 | 39,228 | 35,700 | 38,727 | 49,147 | |||||||||||||||||||||||
| Total salaries & benefits | 41,523 | 82,386 | 82,420 | 74,208 | 100,651 | NM | NM | |||||||||||||||||||||
| Contract labor & outsourcing | 5,207 | 3,654 | 2,781 | 1,968 | 2,941 | |||||||||||||||||||||||
| Equipment & occupancy | 8,882 | 13,513 | 14,895 | 14,814 | 17,177 | |||||||||||||||||||||||
| Foreclosure provision | 849 | 5,535 | 2,395 | 4,872 | (241 | ) | ||||||||||||||||||||||
| Other expenses (a) | 32,636 | 43,536 | 45,115 | 120,155 | 44,327 | |||||||||||||||||||||||
| Total expenses before FAS 91 reclass | 89,097 | 148,624 | 147,606 | 216,017 | 164,855 | NM | NM | |||||||||||||||||||||
| FAS 91 reclassification (a)(c) | (3,064 | ) | (4,520 | ) | (3,962 | ) | (46,133 | ) | (61,505 | ) | ||||||||||||||||||
| Total noninterest expense before | ||||||||||||||||||||||||||||
| segment allocations | 86,033 | 144,104 | 143,644 | 169,884 | 103,350 | |||||||||||||||||||||||
| Segment allocations | 3,007 | 4,958 | 3,899 | 4,319 | 4,953 | |||||||||||||||||||||||
| Total noninterest expense | $ | 89,040 | $ | 149,062 | $ | 147,543 | $ | 174,203 | $ | 108,303 | NM | NM | ||||||||||||||||
| NM - Not meaningful due to mortgage sale in Q3 2008. |
| * Amount is less than one percent. |
| (a) 3Q08, 2Q08, and 1Q08 include effect of adopting accounting standards, including fair value election for warehouse loans |
| (b) 4Q07 includes $71.1 million of goodwill impairment |
| (c) See Glossary of Terms |
| Certain previously reported amounts have been reclassified to agree with current presentation. |
20
| MORTGAGE BANKING: ORIGINATION INCOME | ||||||||||||||||||||||||||||
| Quarterly, Unaudited | ||||||||||||||||||||||||||||
| 3Q08 Change vs. | ||||||||||||||||||||||||||||
| (Thousands) | 3Q08 | 2Q08 | 1Q08 | 4Q07 | 3Q07 | 2Q08 | 3Q07 | |||||||||||||||||||||
| Origination Income | ||||||||||||||||||||||||||||
| Origination fees | $ | 22,995 | $ | 48,555 | $ | 54,636 | $ | 47,789 | $ | 56,042 | ||||||||||||||||||
| FAS 91 fee deferral (a) | 937 | 1,381 | - | (4,818 | ) | 5,563 | ||||||||||||||||||||||
| Appraisal, final inspection, | ||||||||||||||||||||||||||||
| credit report fees | 2,824 | 5,537 | 5,953 | 5,387 | 6,864 | |||||||||||||||||||||||
| Total origination fees | 26,756 | 55,473 | 60,589 | 48,358 | 68,469 | NM | NM | |||||||||||||||||||||
| Secondary marketing income | ||||||||||||||||||||||||||||
| Prime | ||||||||||||||||||||||||||||
| OMSR, SRP | 60,590 | 98,787 | 77,899 | 66,443 | 96,527 | |||||||||||||||||||||||
| Marketing G/L (Trading Gains) | (28,547 | ) | 39,447 | (33,243 | ) | (17,247 | ) | (57,655 | ) | |||||||||||||||||||
| Concessions | (20,218 | ) | (36,016 | ) | (41,146 | ) | (26,174 | ) | (49,551 | ) | ||||||||||||||||||
| LOCOM | (878 | ) | (4,566 | ) | (16,582 | ) | (17,631 | ) | (11,530 | ) | ||||||||||||||||||
| Subtotal Prime | 10,947 | 97,652 | (13,072 | ) | 5,391 | (22,209 | ) | NM | NM | |||||||||||||||||||
| Non-Prime | ||||||||||||||||||||||||||||
| OMSR, SRP | 10 | (6,824 | ) | (1,482 | ) | (1,430 | ) | 727 | ||||||||||||||||||||
| LOCOM | (462 | ) | (458 | ) | (433 | ) | (1,178 | ) | (2,976 | ) | ||||||||||||||||||
| Subtotal Non-Prime | (452 | ) | (7,282 | ) | (1,915 | ) | (2,608 | ) | (2,249 | ) | NM | NM | ||||||||||||||||
| Total Secondary Marketing income | 10,495 | 90,370 | (14,987 | ) | 2,783 | (24,458 | ) | NM | NM | |||||||||||||||||||
| FAS 91 Reclassification (a) | (3,064 | ) | (4,520 | ) | (3,962 | ) | (46,133 | ) | (61,505 | ) | NM | NM | ||||||||||||||||
| Accounting Standards Adoption (b) | (14,359 | ) | (7,228 | ) | 42,416 | - | - | |||||||||||||||||||||
| Total Origination Income | $ | 19,829 | $ | 134,095 | $ | 84,056 | $ | 5,008 | $ | ( 17,494 | ) | NM | NM | |||||||||||||||
| Margins | ||||||||||||||||||||||||||||
| Marketing margin on deliveries (bps): | ||||||||||||||||||||||||||||
| OMSR, SRP | 121 | 127 | 104 | 118 | 132 | |||||||||||||||||||||||
| Marketing G/L (Trading Gains) | (57 | ) | 55 | (45 | ) | (31 | ) | (78 | ) | |||||||||||||||||||
| Concessions | (40 | ) | (50 | ) | (56 | ) | (48 | ) | (67 | ) | ||||||||||||||||||
| LOCOM | (3 | ) | (7 | ) | (23 | ) | (34 | ) | (20 | ) | ||||||||||||||||||
| Total Marketing Margin on Deliveries | 21 | 125 | (20 | ) | 5 | (33 | ) | |||||||||||||||||||||
| NM - Not meaningful due to mortgage sale in Q3 2008. |
| (a) 1Q08 decrease due to effects of fair value election for warehouse loans. |
| (b) Net effect of adopting SFAS 157, SFAS 159, and SAB 109. |
| Certain previously reported amounts have been reclassified to agree with current presentation. |
21
| MORTGAGE BANKING: ORIGINATION METRICS | ||||||||||||||||||||||||||||
| Quarterly, Unaudited | ||||||||||||||||||||||||||||
| 3Q08 Change vs. | ||||||||||||||||||||||||||||
| ($ in millions) | 3Q08 | 2Q08 | 1Q08 | 4Q07 | 3Q07 | 2Q08 | 3Q07 | |||||||||||||||||||||
| Production | ||||||||||||||||||||||||||||
| First lien production | $ | 3,107 | $ | 6,826 | $ | 7,510 | $ | 6,308 | $ | 6,672 | (54 | )% | (53 | )% | ||||||||||||||
| Breakdown by Product Type | ||||||||||||||||||||||||||||
| Prime | ||||||||||||||||||||||||||||
| Conventional Fixed | 39 | % | 53 | % | 65 | % | 63 | % | 58 | % | ||||||||||||||||||
| Conventional ARM | 2 | % | 1 | % | 7 | % | 3 | % | 5 | % | ||||||||||||||||||
| Jumbo Fixed | 3 | % | 2 | % | 2 | % | 6 | % | 7 | % | ||||||||||||||||||
| Jumbo ARM | - | - | 2 | % | 3 | % | 6 | % | ||||||||||||||||||||
| Alt A | - | - | 2 | % | 6 | % | 12 | % | ||||||||||||||||||||
| Government | 53 | % | 42 | % | 21 | % | 17 | % | 9 | % | ||||||||||||||||||
| Non Prime | - | - | - | - | - | |||||||||||||||||||||||
| Other | 3 | % | 2 | % | 1 | % | 2 | % | 3 | % | ||||||||||||||||||
| Breakdown by Payment Type | ||||||||||||||||||||||||||||
| Fully amortizing | 98 | % | 97 | % | 92 | % | 89 | % | 78 | % | ||||||||||||||||||
| Interest only - fixed | - | 2 | % | 3 | % | 7 | % | 13 | % | |||||||||||||||||||
| Interest only - ARM | 2 | % | 1 | % | 5 | % | 4 | % | 9 | % | ||||||||||||||||||
| Option ARMs | - | - | - | - | - | |||||||||||||||||||||||
| Production Refinanced % | 29 | % | 48 | % | 64 | % | 47 | % | 31 | % | ||||||||||||||||||
| Production Purchased % | 71 | % | 52 | % | 36 | % | 53 | % | 69 | % | ||||||||||||||||||
| ARMs % (Excluding Gov't ARMS) | 2 | % | 1 | % | 9 | % | 6 | % | 13 | % | ||||||||||||||||||
| Warehouse/Pipeline | ||||||||||||||||||||||||||||
| Ending Warehouse Balance | $ | 537 | $ | 2,433 | $ | 3,130 | $ | 2,971 | $ | 2,083 | NM | NM | ||||||||||||||||
| Ending Pipeline Balance (Locked) | 65 | 1,913 | 5,293 | 3,363 | 4,088 | NM | NM | |||||||||||||||||||||
| Loan Sales (Deliveries) | ||||||||||||||||||||||||||||
| Prime | 5,043 | 7,247 | 7,410 | 5,504 | 7,398 | NM | NM | |||||||||||||||||||||
| Non-Prime | - | - | - | - | 1 | NM | NM | |||||||||||||||||||||
| Total Loan Sales | $ | 5,043 | $ | 7,247 | $ | 7,410 | $ | 5,504 | $ | 7,399 | NM | NM | ||||||||||||||||
| Definitions: | ||
| Prime: | Mortgages made to borrowers who typically have good credit history, full documentation, and standard structures; | |
| "A" market conventional loans have limited credit and other risks. | ||
| Alt-A & GSE Expanded Approval: Resembles prime mortgages but lack full documentation or have non-standard structures. | ||
| They have more potential risks than prime, but less than non-prime mortgages. | ||
| Non-Prime: | Mortgage loans made to borrowers who typically have derogatory information in their credit history; | |
| non-prime loans are also made to borrowers with acceptable credit history but have other non-standard loan features. | ||
| Government: | FHA/VA loans that are eligible for GNMA securitizations and government guarantees. | |
| NM - Not meaningful | ||
| * Amount is less than one percent. | ||
22
| MORTGAGE BANKING: SERVICING | ||||||||||||||||||||||||||||
| Quarterly, Unaudited | ||||||||||||||||||||||||||||
| 3Q08 Change vs. | ||||||||||||||||||||||||||||
| (Thousands) | 3Q08 | 2Q08 | 1Q08 | 4Q07 | 3Q07 | 2Q08 | 3Q07 | |||||||||||||||||||||
| Servicing Income | ||||||||||||||||||||||||||||
| Gross Service Fees | $ | 57,326 | $ | 74,941 | $ | 88,891 | $ | 90,153 | $ | 90,694 | ||||||||||||||||||
| Guarantee Fees | (11,073 | ) | (16,762 | ) | (18,791 | ) | (19,775 | ) | (19,312 | ) | ||||||||||||||||||
| Sub-Service Fee Income | 394 | 504 | 243 | 244 | 1 | |||||||||||||||||||||||
| Lender Paid MI | (1,029 | ) | (3 | ) | (4 | ) | (21 | ) | (9 | ) | ||||||||||||||||||
| Net Service Fees | 45,618 | 58,680 | 70,339 | 70,601 | 71,374 | (22 | )% | (36 | )% | |||||||||||||||||||
| Early Payoff Interest Expense | (1,733 | ) | (4,477 | ) | (5,446 | ) | (3,626 | ) | (3,409 | ) | ||||||||||||||||||
| Ancillary Fees | 5,994 | 8,991 | 9,214 | 9,192 | 8,696 | |||||||||||||||||||||||
| Total Service Fees | 49,879 | 63,194 | 74,107 | 76,167 | 76,661 | (21 | )% | (35 | )% | |||||||||||||||||||
| Change in MSR Value - Runoff | (20,091 | ) | (37,079 | ) | (37,449 | ) | (40,930 | ) | (48,963 | ) | NM | NM | ||||||||||||||||
| Net hedging results: | ||||||||||||||||||||||||||||
| Change in MSR Value - Other than Runoff** | (39,180 | ) | 237,816 | (255,485 | ) | (234,998 | ) | (102,887 | ) | |||||||||||||||||||
| MSR Hedge Gains/(Losses) | 91,804 | (219,454 | ) | 280,935 | 119,651 | 126,742 | ||||||||||||||||||||||
| Change in Trading Asset Value** | (11,198 | ) | 83,543 | (74,136 | ) | (73,496 | ) | (24,046 | ) | |||||||||||||||||||
| Trading Asset Hedge Gains/(Losses) | 21,505 | (78,832 | ) | 86,322 | 59,022 | 29,343 | ||||||||||||||||||||||
| Option Expense on Servicing Hedges | (12,116 | ) | (6,574 | ) | (4,950 | ) | (23,523 | ) | (7,112 | ) | ||||||||||||||||||
| Total net hedging results | 50,815 | 16,499 | 32,686 | (153,344 | ) | 22,040 | 208 | % | 131 | % | ||||||||||||||||||
| Total Servicing Income | $ | 80,603 | $ | 42,614 | $ | 69,344 | $ | ( 118,107 | ) | $ | 49,738 | �� | 89 | % | 62 | % | ||||||||||||
| Key Servicing Metrics (millions) | ||||||||||||||||||||||||||||
| Beginning Servicing Portfolio | $ | 98,385 | $ | 99,022 | $ | 103,709 | $ | 108,401 | $ | 105,652 | ||||||||||||||||||
| Additions to portfolio | 3,107 | 6,991 | 7,650 | 6,399 | 6,484 | |||||||||||||||||||||||
| Prepayments | (1,350 | ) | (2,811 | ) | (4,144 | ) | (2,931 | ) | (2,829 | ) | ||||||||||||||||||
| Amortization | (550 | ) | (672 | ) | (675 | ) | (725 | ) | (707 | ) | ||||||||||||||||||
| Service Release Sales | (117 | ) | (76 | ) | (69 | ) | (166 | ) | (199 | ) | ||||||||||||||||||
| Bulk Sale | (34,129 | ) | (4,069 | ) | (7,449 | ) | (7,269 | ) | - | |||||||||||||||||||
| Ending Servicing Portfolio (Owned) | $ | 65,346 | $ | 98,385 | $ | 99,022 | $ | 103,709 | $ | 108,401 | (34 | )% | (40 | )% | ||||||||||||||
| Avg. Servicing Portfolio (Owned) | $ | 81,130 | $ | 95,124 | $ | 103,794 | $ | 107,259 | $ | 107,073 | (15 | )% | (24 | )% | ||||||||||||||
| Average Loans Serviced (#) | 450,651 | 547,828 | 618,505 | 632,482 | 652,479 | (18 | )% | (31 | )% | |||||||||||||||||||
| Portfolio Product Mix (Average) | ||||||||||||||||||||||||||||
| GNMA | 5 | % | 10 | % | 8 | % | 8 | % | 7 | % | ||||||||||||||||||
| FNMA/FHLMC | 64 | % | 63 | % | 64 | % | 65 | % | 65 | % | ||||||||||||||||||
| Private | 30 | % | 24 | % | 25 | % | 24 | % | 25 | % | ||||||||||||||||||
| Sub-Total | 99 | % | 97 | % | 97 | % | 97 | % | 97 | % | ||||||||||||||||||
| Warehouse | 1 | % | 3 | % | 3 | % | 3 | % | 3 | % | ||||||||||||||||||
| Total | 100 | % | 100 | % | 100 | % | 100 | % | 100 | % | ||||||||||||||||||
| Other Portfolio Statistics | ||||||||||||||||||||||||||||
| Net Service Fees - Annualized (bps) | 22 | 25 | 27 | 26 | 27 | |||||||||||||||||||||||
| Total Service Fees - Annualized (bps) | 25 | 27 | 29 | 28 | 29 | |||||||||||||||||||||||
| Ancillary Income per Loan (Annualized) | $ | 53.20 | $ | 65.65 | $ | 59.59 | $ | 58.13 | $ | 53.31 | (19 | )% | * | |||||||||||||||
| Servicing Cost per Loan (Annualized) | $ | 62.45 | $ | 61.22 | $ | 56.39 | $ | 50.56 | $ | 48.15 | 2 | % | 30 | % | ||||||||||||||
| Average Servicing Asset (millions)*** | 1,002 | 973 | 1,019 | 1,353 | 1,465 | |||||||||||||||||||||||
| Servicing Book Value (bps) | 124 | 102 | 98 | 126 | 137 | |||||||||||||||||||||||
| 90+ Delinquency Rate, excluding foreclosures | 2.58 | % | 2.08 | % | 1.73 | % | 1.48 | % | 1.18 | % | ||||||||||||||||||
| Change in MSR Asset / | ||||||||||||||||||||||||||||
| Average Servicing Asset | (13 | )% | 8 | % | 5 | % | 46 | % | 7 | % | ||||||||||||||||||
| Run-Off Rate - Annualized | 10 | % | 14 | % | 18 | % | 14 | % | 13 | % | ||||||||||||||||||
| NM - Not meaningful |
| * Amount is less than one percent. |
| ** 4Q07 includes a portion of the $135 million valuation adjustment |
| *** Includes valuation reserve/MSRs only |
| Certain previously reported amounts have been reclassified to agree with current presentation. |
23
| CORPORATE | ||||||||||||||||||||||||||||
| Quarterly, Unaudited | ||||||||||||||||||||||||||||
| 3Q08 Change vs. | ||||||||||||||||||||||||||||
| (Thousands) | 3Q08 | 2Q08 | 1Q08 | 4Q07 | 3Q07 | 2Q08 | 3Q07 | |||||||||||||||||||||
| Income Statement | ||||||||||||||||||||||||||||
| Net interest income/(expense) | $ | 14,382 | $ | 14,771 | $ | 3,558 | $ | (4,795 | ) | $ | (1,224 | ) | (3 | )% | NM | |||||||||||||
| Net interest expense from | ||||||||||||||||||||||||||||
| deferred compensation | (366 | ) | (143 | ) | (121 | ) | (207 | ) | (202 | ) | 156 | % | 81 | % | ||||||||||||||
| Total net interest income/(expense) | 14,016 | 14,628 | 3,437 | (5,002 | ) | (1,426 | ) | (4 | )% | NM | ||||||||||||||||||
| Noninterest income | 4,073 | 5,541 | 14 | 13,275 | 3,506 | (26 | )% | 16 | % | |||||||||||||||||||
| Noninterest income from | ||||||||||||||||||||||||||||
| deferred compensation | (5,145 | ) | 1,325 | (6,550 | ) | (1,667 | ) | 526 | (488 | )% | NM | |||||||||||||||||
| Total noninterest income | (1,072 | ) | 6,866 | (6,536 | ) | 11,608 | 4,032 | (116 | )% | (127 | )% | |||||||||||||||||
| Securities (losses)/gains, net | (210 | ) | (972 | ) | 65,946 | (10,443 | ) | 1 | (78 | )% | NM | |||||||||||||||||
| Total revenue | 12,734 | 20,522 | 62,847 | (3,837 | ) | 2,607 | (38 | )% | 388 | % | ||||||||||||||||||
| Noninterest expense | 39,900 | 37,433 | 7,414 | 110,753 | 51,345 | 7 | % | (22 | )% | |||||||||||||||||||
| Deferred compensation expense | (7,455 | ) | 1,820 | (8,077 | ) | (1,388 | ) | 615 | (510 | )% | NM | |||||||||||||||||
| Total noninterest expense | 32,445 | 39,253 | (663 | ) | 109,365 | 51,960 | (17 | )% | (38 | )% | ||||||||||||||||||
| Pretax (loss)/income | $ | (19,711 | ) | $ | (18,731 | ) | $ | 63,510 | $ | (113,202 | ) | $ | (49,353 | ) | NM | NM | ||||||||||||
| Average Balance Sheet (millions) | ||||||||||||||||||||||||||||
| Total earning assets | 2,835 | 2,974 | 3,001 | 2,986 | 3,163 | (5 | )% | (10 | )% | |||||||||||||||||||
| Net interest margin | 1.97 | % | 1.98 | % | .46 | % | (.66 | )% | (.18 | )% | ||||||||||||||||||
| NM - Not meaningful |
| * Amount is less than one percent. |
| Certain previously reported amounts have been reclassified to agree with current presentation. |
24
| CAPITAL HIGHLIGHTS | ||||||||||||||||||||||||||||
| Quarterly, Unaudited | ||||||||||||||||||||||||||||
| 3Q08 Change vs. | ||||||||||||||||||||||||||||
| (Dollars in millions, except per share amounts) | 3Q08 | 2Q08 | 1Q08 | 4Q07 | 3Q07 | 2Q08 | 3Q07 | |||||||||||||||||||||
| Tier 1 Capital (a) | $ | 2,940.8 | $ | 3,034.7 | $ | 2,443.9 | $ | 2,459.5 | $ | 2,666.8 | (3 | )% | 10 | % | ||||||||||||||
| Tier 2 Capital (a) | 1,319.9 | 1,341.7 | 1,421.0 | 1,400.5 | 1,321.4 | (2 | )% | * | ||||||||||||||||||||
| Total Capital (a) | $ | 4,260.7 | $ | 4,376.4 | $ | 3,864.9 | $ | 3,860.0 | $ | 3,988.2 | (3 | )% | 7 | % | ||||||||||||||
| Risk-Adjusted Assets (a) | $ | 26,933.7 | $ | 28,884.7 | $ | 29,709.3 | $ | 30,271.9 | $ | 31,041.9 | (7 | )% | (13 | )% | ||||||||||||||
| Tier 1 Ratio (a) | 10.92 | % | 10.51 | % | 8.23 | % | 8.12 | % | 8.59 | % | ||||||||||||||||||
| Tier 2 Ratio (a) | 4.90 | 4.64 | 4.78 | 4.63 | 4.26 | |||||||||||||||||||||||
| Total Capital Ratio (a) | 15.82 | % | 15.15 | % | 13.01 | % | 12.75 | % | 12.85 | % | ||||||||||||||||||
| Leverage Ratio (a) | 8.86 | % | 8.45 | % | 6.62 | % | 6.64 | % | 7.12 | % | ||||||||||||||||||
| Shareholders' Equity/Assets Ratio (b) | 7.88 | 7.59 | 5.67 | 5.77 | 6.46 | |||||||||||||||||||||||
| Tangible Equity/RWA (a) | 8.64 | 8.45 | 6.17 | 6.16 | 6.75 | |||||||||||||||||||||||
| Tangible Common Equity/Tangible Assets | 7.20 | 6.96 | 5.04 | 5.13 | 5.64 | |||||||||||||||||||||||
| Tangible Book Value (c) | $ | 11.60 | $ | 12.14 | $ | 14.23 | $ | 14.42 | $ | 16.02 | ||||||||||||||||||
| Book Value (c) | 12.79 | 13.34 | 16.10 | 16.33 | 18.51 | |||||||||||||||||||||||
| NM - Not meaningful |
| * Amount is less than one percent. |
| (a) Current quarter is an estimate |
| (b) Calculated on period-end balances |
| (c) Current and prior periods reflect the effect of the stock dividend |
| Certain previously reported amounts have been reclassified to agree with current presentation. |
25
| ASSET QUALITY: CONSOLIDATED | ||||||||||||||||||||||||||||
| Quarterly, Unaudited | ||||||||||||||||||||||||||||
| 3Q08 Change vs. | ||||||||||||||||||||||||||||
| (Thousands) | 3Q08 | 2Q08 | 1Q08 | 4Q07 | 3Q07 | 2Q08 | 3Q07 | |||||||||||||||||||||
| Allowance for Loan Losses Walk-Forward | ||||||||||||||||||||||||||||
| Beginning Reserve | $ | 575,149 | $ | 483,203 | $ | 342,341 | $ | 236,611 | $ | 229,919 | 19 | % | 150 | % | ||||||||||||||
| Provision | 340,000 | 220,000 | 240,000 | 156,519 | 43,352 | 55 | % | 684 | % | |||||||||||||||||||
| Divestitures/acquisitions/transfers | - | (382 | ) | - | 4 | (5,276 | ) | NM | NM | |||||||||||||||||||
| Charge-offs | (160,200 | ) | (131,385 | ) | (101,756 | ) | (54,891 | ) | (35,858 | ) | 22 | % | 347 | % | ||||||||||||||
| Recoveries | 5,507 | 3,713 | 2,618 | 4,098 | 4,474 | 48 | % | 23 | % | |||||||||||||||||||
| Ending Balance | $ | 760,456 | $ | 575,149 | $ | 483,203 | $ | 342,341 | $ | 236,611 | 32 | % | 221 | % | ||||||||||||||
| Reserve for off-balance sheet commitments | 19,109 | 22,303 | 11,786 | 10,726 | 9,002 | (14 | )% | 112 | % | |||||||||||||||||||
| Total allowance for loan losses plus reserve | $ | 779,565 | $ | 597,452 | $ | 494,989 | $ | 353,067 | $ | 245,613 | 30 | % | 217 | % | ||||||||||||||
| Allowance for Loan Losses | ||||||||||||||||||||||||||||
| Regional Banking | $ | 269,397 | $ | 240,507 | $ | 184,472 | $ | 139,150 | $ | 135,736 | 12 | % | 98 | % | ||||||||||||||
| Capital Markets | 63,654 | 42,745 | 24,338 | 13,522 | 15,072 | 49 | % | 322 | % | |||||||||||||||||||
| National Specialty Lending | 420,220 | 287,212 | 273,127 | 188,550 | 84,787 | 46 | % | 396 | % | |||||||||||||||||||
| Mortgage Banking | 7,185 | 4,685 | 1,266 | 1,119 | 1,016 | 53 | % | 607 | % | |||||||||||||||||||
| Total allowance for loan losses | $ | 760,456 | $ | 575,149 | $ | 483,203 | $ | 342,341 | $ | 236,611 | 32 | % | 221 | % | ||||||||||||||
| Non-Performing Assets | ||||||||||||||||||||||||||||
| Regional Banking | ||||||||||||||||||||||||||||
| Nonperforming loans | $ | 133,138 | $ | 115,264 | $ | 81,244 | $ | 30,608 | $ | 37,102 | 16 | % | 259 | % | ||||||||||||||
| Foreclosed real estate | 32,078 | 37,594 | 38,019 | 35,026 | 27,214 | (15 | )% | 18 | % | |||||||||||||||||||
| Total Regional Banking | 165,216 | 152,858 | 119,263 | 65,634 | 64,316 | 8 | % | 157 | % | |||||||||||||||||||
| Capital Markets | ||||||||||||||||||||||||||||
| Nonperforming loans | 27,284 | 41,527 | 13,030 | 8,970 | 10,051 | (34 | )% | 171 | % | |||||||||||||||||||
| Foreclosed real estate | 600 | 600 | 600 | 810 | 810 | - | (26 | )% | ||||||||||||||||||||
| Total Capital Markets | 27,884 | 42,127 | 13,630 | 9,780 | 10,861 | (34 | )% | 157 | % | |||||||||||||||||||
| National Specialty Lending | ||||||||||||||||||||||||||||
| Nonperforming loans | 718,624 | 582,523 | 433,285 | 243,711 | 142,645 | 23 | % | 404 | % | |||||||||||||||||||
| Foreclosed real estate | 57,251 | 45,384 | 29,680 | 34,120 | 18,030 | 26 | % | 218 | % | |||||||||||||||||||
| Total National Specialty Lending | 775,875 | 627,907 | 462,965 | 277,831 | 160,675 | 24 | % | 383 | % | |||||||||||||||||||
| Mortgage Banking | ||||||||||||||||||||||||||||
| Nonperforming loans - including held for sale (i) | 20,930 | 30,704 | 9,693 | 23,797 | 18,508 | (32 | )% | 13 | % | |||||||||||||||||||
| Foreclosed real estate | 25,589 | 22,542 | 15,373 | 15,385 | 13,992 | 14 | % | 83 | % | |||||||||||||||||||
| Total Mortgage Banking | 46,519 | 53,246 | 25,066 | 39,182 | 32,500 | (13 | )% | 43 | % | |||||||||||||||||||
| Total nonperforming assets | $ | 1,015,494 | $ | 876,138 | $ | 620,924 | $ | 392,427 | $ | 268,352 | 16 | % | 278 | % | ||||||||||||||
| Net Charge-Offs | ||||||||||||||||||||||||||||
| Regional Banking | $ | 29,310 | $ | 33,337 | $ | 29,942 | $ | 12,421 | $ | 14,748 | (12 | )% | 99 | % | ||||||||||||||
| Capital Markets | 17,543 | 114 | 4,215 | 2,794 | 2,684 | NM | 554 | % | ||||||||||||||||||||
| National Specialty Lending | 107,462 | 93,640 | 64,906 | 35,635 | 13,961 | 15 | % | 670 | % | |||||||||||||||||||
| Mortgage Banking | 378 | �� | 581 | 75 | (57 | ) | (9 | ) | (35 | )% | NM | |||||||||||||||||
| Total net charge-offs | $ | 154,693 | $ | 127,672 | $ | 99,138 | $ | 50,793 | $ | 31,384 | 21 | % | 393 | % | ||||||||||||||
| Consolidated Key Ratios | ||||||||||||||||||||||||||||
| NPL % (a) | 4.12 | % | 3.42 | % | 2.41 | % | 1.28 | % | .86 | % | ||||||||||||||||||
| NPA % (b) | 4.63 | 3.88 | 2.78 | 1.66 | 1.13 | |||||||||||||||||||||||
| Net charge-offs % (c) | 2.84 | 2.35 | 1.81 | .93 | .57 | |||||||||||||||||||||||
| Allowance / Loans | 3.52 | 2.59 | 2.20 | 1.55 | 1.08 | |||||||||||||||||||||||
| Allowance to loans excluding insured loans | 3.63 | 2.68 | 2.26 | 1.62 | 1.12 | |||||||||||||||||||||||
| Allowance / NPL (d) | .85 | x | .76 | x | .92 | x | 1.21 | x | 1.25 | x | ||||||||||||||||||
| Allowance / NPA (e) | .76 | x | .66 | x | .79 | x | .93 | x | .95 | x | ||||||||||||||||||
| Allowance / Charge-offs (f) | 1.23 | x | 1.13 | x | 1.22 | x | 1.68 | x | 1.88 | x | ||||||||||||||||||
| Other | ||||||||||||||||||||||||||||
| Loans past due 90 days or more (g) | $ | 119,588 | $ | 157,277 | $ | 300,185 | $ | 251,509 | $ | 206,660 | (24) | % | (42 | )% | ||||||||||||||
| Guaranteed portion (g) | 50,419 | 64,696 | 223,572 | 190,899 | 158,780 | (22 | )% | (68 | )% | |||||||||||||||||||
| Foreclosed real estate from GNMA loans | 35,943 | 35,737 | 22,346 | 18,642 | 15,610 | 1 | % | 130 | % | |||||||||||||||||||
| Period-end loans, net of unearned income (millions) | $ | 21,602 | $ | 22,225 | $ | 21,932 | $ | 22,104 | $ | 21,973 | (3 | )% | (2 | )% | ||||||||||||||
| Insured loans (millions) | 652 | 739 | 809 | 913 | 928 | (12 | )% | (30 | )% | |||||||||||||||||||
| Total loans excluding insured loans (millions) | $ | 20,950 | $ | 21,486 | $ | 21,123 | $ | 21,191 | $ | 21,045 | (2 | )% | * | |||||||||||||||
| Off-balance sheet commitments (millions) (h) | $ | 6,746 | $ | 6,444 | $ | 6,826 | $ | 6,929 | $ | 7,106 | 5 | % | (5 | )% | ||||||||||||||
| Certain previously reported amounts have been reclassified to agree with current presentation. |
| NM - Not meaningful |
| * Amount is less than one percent |
| (a) Ratio is nonperforming loans in the loan portfolio to total loans |
| (b) Ratio is nonperforming assets related to the loan portfolio to total loans plus foreclosed real estate and other assets |
| (c) Ratio is annualized net charge-offs to average total loans |
| (d) Ratio is allowance to nonperforming loans in the loan portfolio |
| (e) Ratio is allowance to nonperforming assets related to the loan portfolio |
| (f) Ratio is allowance to annualized net charge-offs |
| (g) Includes loans held for sale. |
| (h) Amount of off-balance sheet commitments for which a reserve has been provided. |
| (i) 3Q 2008 includes $11,829 of loans held-to-maturity. |
26
| ASSET QUALITY: CONSOLIDATED | ||||||||||||||||||||||||||||
| Quarterly, Unaudited | ||||||||||||||||||||||||||||
| 3Q08 Change vs. | ||||||||||||||||||||||||||||
| 3Q08 | 2Q08 | 1Q08 | 4Q07 | 3Q07 | 2Q08 | 3Q07 | ||||||||||||||||||||||
| Key Portfolio Details | ||||||||||||||||||||||||||||
| Commercial (C&I & Other) | ||||||||||||||||||||||||||||
| Period-end loans ($ millions) | $ | 7,618 | $ | 7,721 | $ | 7,225 | $ | 6,969 | $ | 7,189 | (1 | )% | 6 | % | ||||||||||||||
| 30+ Delinq. % | 1.15 | % | 1.46 | % | .93 | % | .50 | % | .41 | % | ||||||||||||||||||
| NPL % | 1.05 | 1.20 | .64 | .24 | .33 | |||||||||||||||||||||||
| Charge-offs % (qtr. annualized) | 1.64 | .84 | .83 | .20 | .57 | |||||||||||||||||||||||
| Allowance / Loans % | 2.29 | % | 1.90 | % | 1.59 | % | ||||||||||||||||||||||
| Allowance / Charge-offs | 1.41 | x | 2.46 | x | 2.31 | x | ||||||||||||||||||||||
| Income CRE (Income-producing Commercial Real Estate) | ||||||||||||||||||||||||||||
| Period-end loans ($ millions) | $ | 2,038 | $ | 2,039 | $ | 1,982 | $ | 1,948 | $ | 1,970 | * | 3 | % | |||||||||||||||
| 30+ Delinq. % | 3.47 | % | 1.43 | % | .57 | % | 1.96 | % | .86 | % | ||||||||||||||||||
| NPL % | 3.72 | 3.54 | 2.01 | .27 | .06 | |||||||||||||||||||||||
| Charge-offs % (qtr. annualized) | .24 | .63 | 1.94 | .13 | .12 | |||||||||||||||||||||||
| Allowance / Loans % | 3.73 | % | 2.89 | % | 2.47 | % | ||||||||||||||||||||||
| Allowance / Charge-offs | 15.48 | x | 4.82 | x | 1.28 | x | ||||||||||||||||||||||
| Residential CRE (Homebuilder and Condominium Construction) | ||||||||||||||||||||||||||||
| Period-end loans ($ millions) | $ | 1,480 | $ | 1,739 | $ | 1,980 | $ | 2,093 | $ | 2,211 | (15 | )% | (33 | )% | ||||||||||||||
| 30+ Delinq. % | 5.73 | % | 6.36 | % | 2.73 | % | 3.56 | % | 1.25 | % | ||||||||||||||||||
| NPL % | 23.64 | 16.65 | 12.07 | 6.43 | 3.93 | |||||||||||||||||||||||
| Charge-offs % (qtr. annualized) | 11.95 | 6.23 | 5.93 | 3.82 | .51 | |||||||||||||||||||||||
| Allowance / Loans % | 7.55 | % | 5.26 | % | 3.64 | % | ||||||||||||||||||||||
| Allowance / Charge-offs | .58 | x | .76 | x | .58 | x | ||||||||||||||||||||||
| Consumer Real Estate (Home Equity Installment and HELOC) | ||||||||||||||||||||||||||||
| Period-end loans ($ millions) | $ | 7,830 | $ | 7,909 | $ | 7,964 | $ | 8,182 | $ | 7,648 | (1 | )% | 2 | % | ||||||||||||||
| 30+ Delinq. % | 1.49 | % | 1.27 | % | 1.55 | % | 1.43 | % | 1.25 | % | ||||||||||||||||||
| NPL % | .07 | .09 | .11 | .09 | .09 | |||||||||||||||||||||||
| Charge-offs % (qtr. annualized) | 1.41 | 1.78 | .93 | .62 | .37 | |||||||||||||||||||||||
| Allowance / Loans % | 1.58 | % | 1.70 | % | 1.19 | % | ||||||||||||||||||||||
| Allowance / Charge-offs | 1.12 | x | 0.95 | x | 1.28 | x | ||||||||||||||||||||||
| OTC (Consumer Residential Construction Loans) | ||||||||||||||||||||||||||||
| Period-end loans ($ millions) | $ | 1,202 | $ | 1,522 | $ | 1,815 | $ | 2,008 | $ | 2,160 | (21 | )% | (44 | )% | ||||||||||||||
| 30+ Delinq. % | 4.92 | % | 2.69 | % | 2.67 | % | 2.50 | % | 1.91 | % | ||||||||||||||||||
| NPL % | 28.94 | 17.61 | 11.01 | 5.68 | 3.21 | |||||||||||||||||||||||
| Charge-offs % (qtr. annualized) | 12.29 | 9.90 | 4.63 | 2.18 | 1.16 | |||||||||||||||||||||||
| Allowance / Loans % | 20.16 | % | 7.75 | % | 6.49 | % | ||||||||||||||||||||||
| Allowance / Charge-offs | 1.46 | x | 0.78 | x | 1.33 | x | ||||||||||||||||||||||
| Permanent Mortgage | ||||||||||||||||||||||||||||
| Period-end loans ($ millions) | $ | 1,080 | $ | 1,004 | $ | 647 | $ | 562 | $ | 459 | 8 | % | 135 | % | ||||||||||||||
| 30+ Delinq. % | 7.38 | % | 6.36 | % | 7.73 | % | 5.59 | % | 1.29 | % | ||||||||||||||||||
| NPL % | 2.94 | 3.04 | - | - | - | |||||||||||||||||||||||
| Charge-offs % (qtr. annualized) | .22 | 1.15 | .41 | .55 | .47 | |||||||||||||||||||||||
| Allowance / Loans % | 1.17 | % | 1.24 | % | .20 | % | ||||||||||||||||||||||
| Allowance / Charge-offs | 5.48 | x | 1.12 | x | 1.75 | x | ||||||||||||||||||||||
| Credit Card and Other Consumer | ||||||||||||||||||||||||||||
| Period-end loans ($ millions) | $ | 354 | $ | 291 | $ | 319 | $ | 342 | $ | 336 | 22 | % | 5 | % | ||||||||||||||
| 30+ Delinq. % | 2.08 | % | 2.11 | % | 2.37 | % | 2.17 | % | 2.19 | % | ||||||||||||||||||
| NPL % | - | - | - | - | - | |||||||||||||||||||||||
| Charge-offs % (qtr. annualized) | 5.30 | % | 3.29 | % | 5.14 | % | 2.45 | % | 2.05 | % | ||||||||||||||||||
| Allowance / Loans % | 5.52 | % | 5.43 | % | 4.58 | % | ||||||||||||||||||||||
| Allowance / Charge-offs | 1.06 | x | 1.45 | x | .89 | x | ||||||||||||||||||||||
| Certain previously reported amounts have been reclassified to agree with current presentation. |
| * Amount is less than one percent |
27
| Analysis of FAS 114 Loans, ORE, & NPL Rollforward | |||||||
| Unaudited | |||||||
| ($ in millions) | |||||||
| Commercial Portfolio | |||||||
| Reserves | Reserves | Balances | % | ||||
| FAS 114 Impaired Loans w/ Reserves | $17.7 | $40.4 | 43.81% | ||||
| FAS 114 Impaired Loans w/o Reserves | - | 364.1 | - | ||||
| All Other Loans | 344.4 | 10,731.4 | 3.21% | ||||
| Total | $362.1 | $11,135.9 | 3.25% | ||||
| NRV Assessment of Commercial FAS 114 Impaired Assets with no Reserves | |||||||
| # | Appraised Value | Legal Balance | Cumulative C/O | Book Balance | Book Bal / Appraised Val | ||
| FAS114 Relationships with No Reserves | 133 | $631.9 | $511.8 | $119.9 | $391.9 | 62.0% | |
| ORE Inventory Rollforward | |||||||
| Q3 | Q2 | ||||||
| Beginning ORE | $106.1 | $83.7 | |||||
| - Dispositions | (28.2) | (12.9) | |||||
| + Additions | 37.6 | 35.3 | |||||
| Ending ORE | $115.5 | $106.1 | |||||
| NPL-Rollforward (a) | |||||||
| Q3 | Q2 | ||||||
| Beginning NPLs | $ 722 | 501 | |||||
| New | 356 | 365 | |||||
| Principal Increase | 4 | 3 | |||||
| Payments | (75) | (36) | |||||
| Charge Offs | (122) | (86) | |||||
| Transfer to OREO | (30) | (24) | |||||
| Upgrade to Accrual | (1) | (1) | |||||
| Ending NPLs | 854 | 722 | |||||
| (a) Includes commercial & One-Time Close portfolios only | |||||||
28
| ASSET QUALITY: REGIONAL BANKING | ||||||||||||||||||||||||||||
| Quarterly, Unaudited | ||||||||||||||||||||||||||||
| 3Q08 Change vs. | ||||||||||||||||||||||||||||
| 3Q08 | 2Q08 | 1Q08 | 4Q07 | 3Q07 | 2Q08 | 3Q07 | ||||||||||||||||||||||
| Total Regional Banking | ||||||||||||||||||||||||||||
| Period-end loans ($ millions) | $ | 11,008 | $ | 11,037 | $ | 10,803 | $ | 10,631 | $ | 11,161 | * | (1 | )% | |||||||||||||||
| 30+ Delinq. % | 1.45 | % | 1.50 | % | 1.23 | % | 1.16 | % | .73 | % | ||||||||||||||||||
| NPL % | 1.21 | 1.04 | .75 | .29 | .33 | |||||||||||||||||||||||
| Charge-offs % (qtr. annualized) | 1.07 | 1.23 | 1.16 | .50 | .51 | |||||||||||||||||||||||
| Allowance / Loans % | 2.45 | % | 2.18 | % | 1.71 | % | 1.31 | % | 1.22 | % | ||||||||||||||||||
| Allowance / Charge-offs | 2.30 | x | 1.80 | x | 1.54 | x | 2.80 | x | 2.30 | x | ||||||||||||||||||
| Key Portfolio Details | ||||||||||||||||||||||||||||
| Commercial (C&I & Other) | ||||||||||||||||||||||||||||
| Period-end loans ($ millions) | $ | 6,064 | $ | 6,107 | $ | 6,134 | $ | 5,940 | $ | 6,264 | (1 | )% | (3 | )% | ||||||||||||||
| 30+ Delinq. % | 1.37 | % | 1.40 | % | .98 | % | .50 | % | .41 | % | ||||||||||||||||||
| NPL % | 1.09 | .92 | .62 | .30 | .28 | |||||||||||||||||||||||
| Charge-offs % (qtr. annualized) | .96 | 1.03 | .75 | .31 | .67 | |||||||||||||||||||||||
| Allowance / Loans % | 2.10 | % | 1.92 | % | 1.59 | % | ||||||||||||||||||||||
| Allowance / Charge-offs | 2.21 | x | 1.98 | x | 2.29 | x | ||||||||||||||||||||||
| Income CRE (Income-producing Commercial Real Estate) | ||||||||||||||||||||||||||||
| Period-end loans ($ millions) | $ | 1,504 | $ | 1,484 | $ | 1,365 | $ | 1,320 | $ | 1,350 | 1 | % | 11 | % | ||||||||||||||
| 30+ Delinq. % | 1.21 | % | .99 | % | .52 | % | 2.60 | % | .91 | % | ||||||||||||||||||
| NPL % | 1.73 | 1.60 | 1.42 | .04 | .08 | |||||||||||||||||||||||
| Charge-offs % (qtr. annualized) | .07 | .46 | 2.57 | .04 | .07 | |||||||||||||||||||||||
| Allowance / Loans % | 3.45 | % | 2.80 | % | 2.35 | % | ||||||||||||||||||||||
| Allowance / Charge-offs | 49.80 | x | 6.68 | x | .93 | x | ||||||||||||||||||||||
| Residential CRE (Homebuilder and Condominium Construction) | ||||||||||||||||||||||||||||
| Period-end loans ($ millions) | $ | 473 | $ | 528 | $ | 526 | $ | 570 | $ | 622 | (10 | )% | (24 | )% | ||||||||||||||
| 30+ Delinq. % | 3.94 | % | 5.43 | % | 2.61 | % | 2.10 | % | .59 | % | ||||||||||||||||||
| NPL % | 8.71 | 6.68 | 4.68 | 2.14 | 2.98 | |||||||||||||||||||||||
| Charge-offs % (qtr. annualized) | 4.55 | 2.02 | 2.30 | 2.30 | .02 | |||||||||||||||||||||||
| Allowance / Loans % | 8.52 | % | 5.61 | % | 3.92 | % | ||||||||||||||||||||||
| Allowance / Charge-offs | 1.75 | x | 2.93 | x | 1.65 | x | ||||||||||||||||||||||
| Consumer Real Estate (Home Equity Installment and HELOC) | ||||||||||||||||||||||||||||
| Period-end loans ($ millions) | $ | 2,606 | $ | 2,614 | $ | 2,486 | $ | 2,491 | $ | 2,616 | * | * | ||||||||||||||||
| 30+ Delinq. % | 1.32 | % | 1.22 | % | 1.83 | % | 1.70 | % | 1.33 | % | ||||||||||||||||||
| Charge-offs % (qtr. annualized) | .81 | 1.50 | .76 | .64 | .40 | |||||||||||||||||||||||
| Allowance / Loans % | 1.26 | % | 1.36 | % | .70 | % | ||||||||||||||||||||||
| Allowance / Charge-offs | 1.57 | x | .90 | x | .92 | x | ||||||||||||||||||||||
| Credit Card, Permanent Mortgage and Other Consumer | ||||||||||||||||||||||||||||
| Period-end loans ($ millions) | $ | 361 | $ | 304 | $ | 293 | $ | 310 | $ | 309 | 19 | % | 17 | % | ||||||||||||||
| 30+ Delinq. % | 1.66 | % | 1.71 | % | 1.89 | % | 1.77 | % | 1.82 | % | ||||||||||||||||||
| Charge-offs % (qtr. annualized) | 4.69 | 2.37 | 4.69 | 1.71 | 1.53 | |||||||||||||||||||||||
| Allowance / Loans % | 5.31 | % | 5.55 | % | 4.43 | % | ||||||||||||||||||||||
| Allowance / Charge-offs | 1.16 | x | 2.34 | x | .95 | x | ||||||||||||||||||||||
| Certain previously reported amounts have been reclassified to agree with current presentation. |
| * Amount is less than one percent |
29
| ASSET QUALITY: NATIONAL SPECIALTY LENDING | ||||||||||||||||||||||||||||
| Quarterly, Unaudited | ||||||||||||||||||||||||||||
| 3Q08 Change vs. | ||||||||||||||||||||||||||||
| 3Q08 | 2Q08 | 1Q08 | 4Q07 | 3Q07 | 2Q08 | 3Q07 | ||||||||||||||||||||||
| Total National Specialty Lending | ||||||||||||||||||||||||||||
| Period-end loans ($ millions) | $ | 8,058 | $ | 8,622 | $ | 9,114 | $ | 9,554 | $ | 9,079 | (7 | )% | (11 | )% | ||||||||||||||
| 30+ Delinq. % | 7.72 | % | 2.67 | % | 1.85 | % | 2.02 | % | 1.38 | % | ||||||||||||||||||
| NPL % | 8.92 | 6.76 | 4.75 | 2.55 | 1.57 | |||||||||||||||||||||||
| Charge-offs % (qtr. annualized) | 5.14 | 4.18 | 2.80 | 1.50 | .61 | |||||||||||||||||||||||
| Allowance / Loans % | 5.21 | % | 3.33 | % | 3.00 | % | 1.97 | % | .93 | % | ||||||||||||||||||
| Allowance / Charge-offs | .98 | x | .77 | x | 1.05 | x | 1.32 | x | 1.52 | x | ||||||||||||||||||
| Key Portfolio Details | ||||||||||||||||||||||||||||
| Income CRE (Income-producing Commercial Real Estate) | ||||||||||||||||||||||||||||
| Period-end loans ($ millions) | $ | 378 | $ | 395 | $ | 428 | $ | 393 | $ | 376 | (4 | )% | 1 | % | ||||||||||||||
| 30+ Delinq. % | 13.37 | % | .80 | % | .55 | % | .76 | % | 1.37 | % | ||||||||||||||||||
| NPL % | 12.77 | 12.15 | 4.65 | 1.18 | - | |||||||||||||||||||||||
| Charge-offs % (qtr. annualized) | .91 | 1.43 | .87 | - | .49 | |||||||||||||||||||||||
| Allowance / Loans % | 4.28 | % | 2.63 | % | 3.07 | % | ||||||||||||||||||||||
| Allowance / Charge-offs | 4.53 | x | 1.72 | x | 3.67 | x | ||||||||||||||||||||||
| Residential CRE (Homebuilder and Condominium Construction) | ||||||||||||||||||||||||||||
| Period-end loans ($ millions) | $ | 927 | $ | 1,133 | $ | 1,363 | $ | 1,431 | $ | 1,479 | (18 | )% | (37 | )% | ||||||||||||||
| 30+ Delinq. % | 5.05 | % | 6.62 | % | 2.78 | % | 4.28 | % | 1.13 | % | ||||||||||||||||||
| NPL % | 32.03 | 22.02 | 15.36 | 7.80 | 4.18 | |||||||||||||||||||||||
| Charge-offs % (qtr. annualized) | 16.06 | 8.18 | 7.45 | 4.01 | .63 | |||||||||||||||||||||||
| Allowance / Loans % | 6.79 | % | 4.90 | % | 3.53 | % | ||||||||||||||||||||||
| Allowance / Charge-offs | .38 | x | .50 | x | .46 | x | ||||||||||||||||||||||
| Consumer Real Estate (Home Equity Installment and HELOC) | ||||||||||||||||||||||||||||
| Period-end loans ($ millions) | $ | 5,223 | $ | 5,295 | $ | 5,478 | $ | 5,691 | $ | 5,032 | (1 | )% | 4 | % | ||||||||||||||
| 30+ Delinq. % | 1.57 | % | 1.30 | % | 1.44 | % | 1.33 | % | 1.14 | % | ||||||||||||||||||
| NPL % | .11 | .13 | .12 | .09 | .09 | |||||||||||||||||||||||
| Charge-offs % (qtr. annualized) | 1.70 | 1.91 | 1.02 | .62 | .34 | |||||||||||||||||||||||
| Allowance / Loans % | 1.74 | % | 1.84 | % | 1.43 | % | ||||||||||||||||||||||
| Allowance / Charge-offs | 1.01 | x | .96 | x | 1.41 | x | ||||||||||||||||||||||
| OTC (Consumer Residential Construction Loans) | ||||||||||||||||||||||||||||
| Period-end loans ($ millions) | $ | 1,202 | $ | 1,522 | $ | 1,815 | $ | 2,008 | $ | 2,160 | (21 | )% | (44 | )% | ||||||||||||||
| 30+ Delinq. % | 4.92 | % | 2.69 | % | 2.67 | % | 2.50 | % | 1.91 | % | ||||||||||||||||||
| NPL % | 28.94 | 17.61 | 11.01 | 5.68 | 3.21 | |||||||||||||||||||||||
| Charge-offs % (qtr. annualized) | 12.29 | 9.90 | 4.63 | 2.18 | 1.16 | |||||||||||||||||||||||
| Allowance / Loans % | 20.16 | % | 7.75 | % | 6.49 | % | ||||||||||||||||||||||
| Allowance / Charge-offs | 1.46 | x | .78 | x | 1.33 | x | ||||||||||||||||||||||
| Permanent Mortgage (a) | ||||||||||||||||||||||||||||
| Period-end loans ($ millions) | $ | 297 | $ | 249 | n/a | n/a | n/a | 19 | % | NM | ||||||||||||||||||
| 30+ Delinq. % | 18.39 | % | 16.43 | % | n/a | n/a | n/a | |||||||||||||||||||||
| NPL % | 6.71 | 7.14 | n/a | n/a | n/a | |||||||||||||||||||||||
| Charge-offs % (qtr. annualized) | - | - | n/a | n/a | n/a | |||||||||||||||||||||||
| Allowance / Loans % | 1.84 | % | 2.38 | % | n/a | |||||||||||||||||||||||
| Allowance / Charge-offs | - | - | n/a | |||||||||||||||||||||||||
| Other Consumer | ||||||||||||||||||||||||||||
| Period-end loans ($ millions) | $ | 30 | $ | 28 | $ | 29 | $ | 32 | $ | 32 | 7 | % | (6 | )% | ||||||||||||||
| 30+ Delinq. % | 6.65 | % | 6.39 | % | 6.90 | % | 6.00 | % | 5.56 | % | ||||||||||||||||||
| NPL % | - | - | - | - | - | |||||||||||||||||||||||
| Charge-offs % (qtr. annualized) | 11.66 | % | 13.26 | 9.13 | 9.61 | 6.91 | ||||||||||||||||||||||
| Allowance / Loans % | 7.84 | % | 4.06 | % | 5.46 | % | ||||||||||||||||||||||
| Allowance / Charge-offs | .66 | x | .31 | x | .60 | x | ||||||||||||||||||||||
Certain previously reported amounts have been reclassified to agree with current presentation.
(a) 3Q08 includes approximately $19.8 million of loans repurchased due to suspected fraud.
30
ASSET QUALITY: MORTGAGE BANKING & CAPITAL MARKETS | ||||||||||||||||||||||||||||
| Quarterly, Unaudited | ||||||||||||||||||||||||||||
| 3Q08 Change vs. | ||||||||||||||||||||||||||||
| 3Q08 | 2Q08 | 1Q08 | 4Q07 | 3Q07 | 2Q08 | 3Q07 | ||||||||||||||||||||||
| Total Mortgage Banking | ||||||||||||||||||||||||||||
| Period-end loans ($ millions) | $ | 746 | $ | 715 | $ | 647 | $ | 562 | $ | 459 | 4 | % | 63 | % | ||||||||||||||
| 30+ Delinq. % | 10.07 | % | 2.88 | % | 7.73 | % | 5.59 | % | 1.29 | % | ||||||||||||||||||
| Allowance / Loans % | .96 | % | .66 | % | .20 | % | .20 | % | .22 | % | ||||||||||||||||||
| Total Capital Markets | ||||||||||||||||||||||||||||
| Period-end loans ($ millions) | $ | 1,790 | $ | 1,851 | $ | 1,368 | $ | 1,356 | $ | 1,274 | (3 | )% | 41 | % | ||||||||||||||
| 30+ Delinq. % | 1.45 | % | 2.44 | % | .82 | % | .99 | % | .56 | % | ||||||||||||||||||
| NPL % | 1.52 | 2.24 | .95 | .66 | .79 | |||||||||||||||||||||||
| Charge-offs % (qtr. annualized) | 3.99 | .03 | 1.23 | .86 | .85 | |||||||||||||||||||||||
| Allowance / Loans % | 3.56 | % | 2.31 | % | 1.78 | % | 1.00 | % | 1.18 | % | ||||||||||||||||||
| Allowance / Charge-offs | .91 | x | 93.74 | x | 1.44 | x | 1.21 | x | 1.40 | x | ||||||||||||||||||
31
ASSET QUALITY HIGHLIGHTS: KEY PORTFOLIOS - COMMERCIAL | |||||||||||
| Unaudited | |||||||||||
| C&I Portfolio: $7.6 Billion (35% of Total Loans) | |||||||||||
| - Impacted by deterioration in economic conditions and impacts of housing market | |||||||||||
| - Diverse and granular portfolio | |||||||||||
| - Mostly relationship customers in TN and regional middle market lending efforts | |||||||||||
| Homebuilder Portfolio: $1.5 Billion (7% of Total Loans) | Top 10 States | ||||||||||
| % OS | % NPL | ||||||||||
| - Loans to residential builders and developers | TN | 21.19% | 7.68% | ||||||||
| - Performance under pressure from housing market (oversupply & lack of mortgage availability) | FL | 11.47% | 44.04% | ||||||||
| - Most severe market conditions in Florida, California, Virginia/DC, Texas, Arizona, and Colorado | WA | 10.31% | 12.75% | ||||||||
| - Condominium construction balances small ($199 million) but individual commitments tend to be larger | CA | 7.27% | 24.52% | ||||||||
| - Managing existing relationships (shrinking business into 2008) | NC | 5.80% | 6.52% | ||||||||
| - Devoting additional resources to manage problem loans | VA | 4.68% | 36.20% | ||||||||
| - Ceased originations for national CRE business in January: wind-down portfolio | MD | 4.31% | 16.97% | ||||||||
| TX | 3.98% | 14.32% | |||||||||
| CO | 3.86% | 33.27% | |||||||||
| AZ | 3.59% | 35.91% | |||||||||
| As of 09/30/08 | |||||||||||
| Income CRE Portfolio: $2.0 Billion (9% of Total Loans) | Top 10 States | ||||||||||
| % OS | % NPL | ||||||||||
| - Traditional commercial real estate construction and mini-permanent loans | TN | 42.02% | 1.48% | ||||||||
| - Three-fourths managed by Regional Banking segment (approx) | NC | 9.80% | - | ||||||||
| - One-fourth in national CRE business: wind-down portfolio (approx) | FL | 8.05% | 25.02% | ||||||||
| - Performance showing spillover impact from housing market | GA | 6.19% | .44% | ||||||||
| WA | 3.89% | 1.11% | |||||||||
| MS | 3.83% | .28% | |||||||||
| SC | 3.33% | - | |||||||||
| TX | 2.75% | - | |||||||||
| AZ | 2.51% | 11.82% | |||||||||
| CA | 2.02% | 18.61% | |||||||||
| As of 09/30/08 | |||||||||||
32
ASSET QUALITY HIGHLIGHTS: KEY PORTFOLIOS - CONSUMER | |||||||||||
| Unaudited | |||||||||||
| Consumer Real Estate (primarily Home Equity) Portfolio: $7.8 Billion (36% of Total Loans) | |||||||||||
| - Performance continues to show stress in Q3 primarily related to areas with significant | |||||||||||
| home price depreciation. | Top 10 States | ||||||||||
| - Geographically diverse | % OS | Del. % | C/O % | ||||||||
| - Top States (TN= 27%, CA = 14%, VA = 4%, WA = 4%, MD = 3%, FL = 3%, GA = 3%) | TN | 27% | 1.41% | .64% | |||||||
| - Strong borrower quality | CA | 14% | 1.46% | 2.02% | |||||||
| - 734 avg. portfolio origination FICO; 732 avg. portfolio FICO (refreshed) | VA | 4% | 1.96% | 1.64% | |||||||
| - Good collateral position | WA | 4% | .69% | .66% | |||||||
| - High LTV loans managed through whole loan insurance | MD | 3% | 1.39% | 1.74% | |||||||
| - 27% 1st lien and 73% second lien | FL | 3% | 2.84% | 4.91% | |||||||
| - 86.5% of uninsured portfolio <90 CLTV | GA | 3% | 2.01% | 1.32% | |||||||
| - 14.5% of uninsured portfolio is HLTV, 64% of which (or 9.3%) have FICO >700 | AZ | 2% | 2.72% | .85% | |||||||
| - No longer originating loans >89.9% CLTV | PA | 2% | 1.45% | 1.06% | |||||||
| - Good borrower capacity (37% avg. DTI) | NJ | 2% | 1.31% | 1.96% | |||||||
| - Primarily retail-sourced (85% retail) | As of 09/30/08 | ||||||||||
| - Mix of older vintage loans | |||||||||||
| - 53% originated prior to 2006 | Retail vs. Wholesale Originations | ||||||||||
| % OS | Del. % | C/O % | |||||||||
| Retail | 85.03% | 1.33% | 1.05% | ||||||||
| Wholesale | 12.48% | 2.62% | 3.70% | ||||||||
| Other | 2.49% | 1.68% | 4.67% | ||||||||
| As of 09/30/08 | |||||||||||
| Portfolio Breakdown by LTV and FICO | |||||||||||
| <=80% | 80% - 90% | >90% | |||||||||
| >=740 | 31.4% | 13.7% | 5.3% | ||||||||
| 720-739 | 7.1% | 4.5% | 2.0% | ||||||||
| 700-719 | 7.1% | 4.5% | 2.0% | ||||||||
| 660-699 | 8.0% | 4.0% | 3.3% | ||||||||
| 620-659 | 2.6% | 1.4% | 1.4% | ||||||||
| <620 | .9% | .3% | .4% | ||||||||
| *excludes whole loan insurance | |||||||||||
| As of 09/30/08 | |||||||||||
| Balance | Origination Characteristics | QTD | YTD | |||||
| Vintage | % | CLTV | FICO | % Broker * | % TN | % 1st lien | NCO's % | NCO's % |
| pre-2002 | 6% | 76% | 716 | 17% | 50% | 37% | 2.49% | 2.17% |
| 2003 | 10% | 73% | 730 | 14% | 38% | 48% | .68% | .56% |
| 2004 | 14% | 79% | 728 | 21% | 26% | 29% | 1.37% | 1.24% |
| 2005 | 22% | 80% | 731 | 20% | 20% | 17% | 1.79% | 2.39% |
| 2006 | 18% | 77% | 734 | 6% | 26% | 18% | 2.35% | 2.30% |
| 2007 | 21% | 79% | 741 | 15% | 22% | 20% | .96% | .84% |
| 2008 | 8% | 76% | 748 | 12% | 29% | 51% | .27% | .09% |
| Total | 100% | 78% | 734 | 15% | 27% | 27% | 1.47% | 1.50% |
| * Correspondent and Wholesale | ||||||||
| One-Time Close (OTC) Portfolio: $1.2 Billion (6% of Total Loans) | Top 10 States | ||||||||||
| % OS | % NPL | ||||||||||
| - Construction-to-perm loans with short duration | CA | 24% | 34% | ||||||||
| - Performance under pressure from housing market, borrower stress | TX | 13% | 19% | ||||||||
| and lack of product salability in the secondary market | UT | 10% | 34% | ||||||||
| - Actively identifying and remediating problem accounts | ID | 7% | 54% | ||||||||
| - Devoting additional resources to manage problem loans | WA | 7% | 18% | ||||||||
| - Ceased originations for national OTC lending: wind-down portfolio | FL | 6% | 84% | ||||||||
| AZ | 5% | 47% | |||||||||
| OR | 4% | 14% | |||||||||
| VA | 2% | 21% | |||||||||
| NC | 2% | 36% | |||||||||
| As of 09/30/08 | |||||||||||
33
| ASSET QUALITY: PROCESS HIGHLIGHTS |
| Product | Current Process |
| Commercial Loans (Real Estate / C&I) | |
| Risk Grading | |
| Reserves are established using historical loss factors by grade level. Relationship managers risk rate each loan using grades that reflect both the probability of default and estimated loss in the event of default. Loans with emerging weaknesses receive increased oversight through our Watch List process. | |
| Portfolio Reviews are conducted regularly to provide oversight of risk grading decisions for larger credits. | |
| Watch List Process | |
| For new Watch List loans, senior credit management reviews risk grade appropriateness and action plans. After initial identification, relationship managers prepare regular updates for review and discussion by more senior business line and credit officers. This oversight is intended to bring consistent grading and allow timely identification of loans that need to be further downgraded or placed on non-accrual status. | |
| Classified & Non-Accruals | |
| When a loan becomes classified, the asset generally transfers to the specialists in our Loan Rehab and Recovery group where the accounts receive more detailed monitoring; at this time, new appraisals are typically ordered for real estate collateral dependent credits. | |
| Loans are placed on non-accrual status if it becomes evident that full collection of principal and interest is at risk or if the loans become 90 days or more past due. | |
| Impairment Assessment | |
| Generally, classified non-accrual loans over $1 million are deemed to be impaired in accordance with SFAS 114 and are assessed for impairment measurement. For impaired assets viewed as collateral dependent, fair value estimates are obtained from a recently received and reviewed appraisal. Appraised values are adjusted down for costs associated with asset disposal and for our estimate of any further deterioration in values since the most recent appraisal. Upon the determination of impairment, we charge off the full difference between book value and our best estimate of the asset’s net realizable value. | |
| One-Time Close (OTC) Loans | |
For OTC real estate construction loans, reserve levels are established based on portfolio modeling and monthly portfolio reviews conducted with business line managers and credit officers. The inherent risk in credits is examined and evaluated based on factors such as draw inactivity and borrower conditions, often recognizing problems prior to delinquency. In addition, OTC loans that reach 90 days past due are placed on non-accrual. A new appraisal is ordered for loans that reach 90 days past due or are classified as substandard during the monthly portfolio review. Loans are initially written down to current appraised value. Loans are then assessed for charge down again when they reach 180 days past due, and again when they are taken into OREO. | |
| Home Equity Loans & Lines | |
| For home equity loans and lines, reserve levels are established through the use of several models that look at historical losses, cumulative vintage performance, and roll rates. Loans are classified substandard at 90 days delinquent. Our collateral position is assessed prior to the asset becoming 180 days delinquent. If the value does not support foreclosure, balances are charged-off and other avenues of recovery are pursued. If the value supports foreclosure, the loan is charged down to net realizable value and is placed on non-accrual status. When collateral is taken to OREO, the asset is assessed for further write down to appraised value. | |
34
| GLOSSARY OF TERMS |
Appraisal Fees: A fee charged to the borrower for the cost of appraising a property. |
Concessions: The net amount of the discount or premium pricing charged to borrowers upon loan origination. This also includes the servicing release premium paid to correspondents to purchase loans. Discount pricing is used to competitively price mortgage loans. |
Credit Report Fee: A fee charged to the borrower for the cost of obtaining the borrower’s credit report. |
FAS 91 Fee Deferral: The timing difference between collecting and recognizing origination fees on a loan not carried at elected fair value. For loans held for sale not carried at elected fair value, origination fees are recognized at the time the loan is sold, not at the time the loan is originated. |
FAS 91 Reclassification: The reclassification of the cost of originating mortgage warehouse loans, not carried at elected fair value, sold during the period. |
FAS 114 Loans: Commercial loans over $1 million that are not expected to pay all contractually due principal and interest and consumer loans that have experienced a troubled debt restructuring. These loans are generally written down to an estimate of collateral value less cost to sell. |
Final Inspection Fee: A fee charged to the borrower to inspect a property. |
Lower of Cost or Market (LOCOM): A method of accounting for certain assets by recording them at the lower of their historical cost or their current market value. |
Marketing G/L (Trading Gains): The net result of hedging activities. |
Originated Mortgage Servicing Rights (OMSR): The retained right to service a mortgage loan when a mortgage loan is sold on a servicing-retained basis. Represents the present value of the amount by which the estimated future net cash flows from servicing mortgage loans exceeds the cost of servicing mortgage loans. |
Origination Fees: A fee charged to the borrower by the lender to originate a loan. Usually stated as a percentage of the face value of the loan. |
Servicing Released Premium (SRP): The premium received for selling loans on a servicing released basis. |
Tangible Equity/RWA: Shareholders' equity excluding intangible assets and unrealized gains/losses on available for sale securities and cash flow hedges divided by risk weighted assets. |
35

1
First Horizon National Corporation
Third Quarter 2008 Earnings
October 17, 2008

2
§ Portions of this presentation use non-GAAP financial information. Each of those portions
is so noted, and a reconciliation of that non-GAAP information to comparable GAAP
information is provided in a footnote or in the Appendix at the end of this presentation.
§ This presentation contains forward-looking statements, which may include guidance,
involving significant risks and uncertainties which will be identified by words such as
“believe” “expect” “anticipate” “intend” “estimate” “should” “is likely” “will” “going
forward” and other expressions that indicate future events and trends and may
be followed by or reference cautionary statements. A number of factors could cause
actual results to differ materially from those in the forward-looking information.
These factors are outlined in our recent earnings and other press releases and in more
detail in the most current 10-Q and 10-K. First Horizon disclaims any obligation to
update any of the forward-looking statements that are made from time to time to
reflect future events or developments.

3
Financial Highlights: Third Quarter 2008
1Pretax, pre-provision is a non-GAAP number and is pretax income excluding provision. Pretax loss was $203mm
and provision was $340mm at 3Q08.
2Current Quarter is estimate.
2Current Quarter is estimate.
§ Earnings per share of $(0.59)
§ Net loss of $(118) million
§ Loan loss reserve increased to 3.52% of total loans, as provision of $340 million
exceeded $155 million in net charge-offs
§ Solid financial performance with pretax, pre-provision income1 of $137 million
§ Includes ($31) million of significant items, net of gains
§ Net interest margin stable at 3.01%
§ Tier I capital ratio improved to 10.9%2

4
Strategic Actions Overview
Reducing Balance
Sheet
Sheet
Proactive on
Asset Quality
Improving Liquidity
§ Reduced assets by $2.7B in 3Q08
§ Completed sale of national mortgage platform
§ Reduced construction portfolios by approximately $600 million in 3Q08
§ Reduced unsecured wholesale funding
§ Retired $1.5 billion in maturing debt through asset reduction
§ Customer funding (deposits and repos) remained stable
Strong Capital
Position
Position
§ Tier 1 ratio improved to 10.9%, TCE/TA to 7.2%1
§ Continued balance sheet shrinkage should further improve ratios
§ Capital position sufficient to withstand higher than expected credit losses
Strength in Core
Businesses
Businesses
§ Pretax, pre-provision earnings from Regional Bank/Capital Markets
remained solid at $82mm for 3Q082
§ Good customer and account growth in Tennessee
§ Fixed income business remains strong
1 Current Quarter is estimate 2Pretax, pre-provision is a non-GAAP number and is pretax income excluding provision.
Regional banking pretax loss was $7mm and provision was $58mm at 3Q08;
Capital markets pretax loss was $9mm and provision was $38mm.
§ Increased reserves/loans to 3.52%
§ OTC reserves reflect identifiable inherent loss content in portfolio
§ 2008 outlook for net charge-offs remains within upper end of $485-$585
million forecast range

5
Customer Deposits Stable, Account Growth Improving
3Q08 Customer Funding1 by Day
2008 Net Primary Accounts2
Customer Deposits
Customer Repos
1Includes customer-related deposits and repurchase agreements net of float. Excludes custodial balances and wholesale deposits.
2Consumer: checking & money market savings; Business: checking, savings, repos, analyzed accounts
$12.0
$12.2
$11.8
666,260
656,156
646,090
§ Deposits stable over quarter in face of industry events, rate competition
§ Favorable trends in August and September resulting from proactive efforts
§ Customer communication and education
§ CDARS program introduction
§ Money market savings promotion for relationship customers - record 5,500 new accounts
opened in month of September
§ Primary deposit accounts up 6.2% annualized in quarter
520,000
540,000
560,000
580,000
600,000
620,000
640,000
660,000
680,000
Jan
Feb
Mar
Apr
May
Jun
Jul
Aug
Sep
Consumer
Business
6.0
7.0
8.0
9.0
10.0
11.0
12.0
13.0

6
§ Strong capital position - among the best in the industry
§ Improved liquidity
§ Reducing risk & balance sheet by winding down national real estate businesses
§ OTC balances down 40% YTD
§ National Residential CRE balances down 35% YTD
§ Remaining proactive on asset quality
§ Majority of NPLs written down to net realizable values, increasing disposition opportunity
§ Substantial loan loss reserve built over the last four quarters
§ Refocusing on regional banking and capital markets
§ First Horizon well positioned to manage through industry challenges
Summary

7
Asset Quality

8

9
Portfolio Characteristics
Geographic Distribution
<= 2004
31%
Channel Mix
Vintage Profile
1Broker includes wholesale and correspondent
First
Second
Total
Balance
$2.1B
$5.7B
$7.8B
Original FICO
731
735
734
Original CLTV
70%
81%
78%
Full Doc
76%
69%
71%
Owner Occupied
85%
98%
94%
HELOCs
$0.7B
$3.7B
$4.4B
Weighted Avg.
HELOC Utilization
47%
55%
54%
Retail
85%
Broker
1
15%
2008
8%
Core Banking
Customers
2006
18%
2005
22%
2007
21%
WA
4%
Other
36%
TN
27%
CA
14%
VA
4%
MD
3%
FL
3%
GA
3%
AZ
2%
PA
2%
NJ 2%
Home Equity - Differentiated Portfolio Characteristics

10
Home Equity - Delinquency & Severity Trends
30-59 Day Delinquency
60-89 Day Delinquency
90+ Day Delinquency
Net-Charge Offs
0.33%
0.53%
0.68%
0.33%
0.67%
$0
$10
$20
$30
$40
$50
$60
$0
$10
$20
$30
$40
$50
$60
$0
$10
$20
$30
$40
$50
$60
1.02%
1.91%
1.70%
0.81%
1.50%
0.76%
0.64%
0.40%
0.62%
0.34%
0.0%
0.5%
1.0%
1.5%
2.0%
3Q07
4Q07
1Q08
2Q08
3Q08
Regional Banking
National Specialty
11
§ Approximately $90mm of OTC loans modified into permanent loans in 3Q082
§ By year-end 2008, construction balances are expected to decline to less than $1B
§ Identified problem loans and built reserves for inherent losses in 3Q08
§ Increased reserves to $242mm
§ Reflects view of inherent loss content
One-Time Close1 - - Performance Overview
1OTC loans are consumer construction to perm loans with short duration
2Loans remained in balance sheet of National Specialty Lending segment. 3Annualized.
3
3Q07
4Q07
1Q08
2Q08
3Q08
Total Commitment
$3.4 B
$3.0 B
$2.6 B
$2.0 B
$1.5 B
Total Balance
$2.2 B
$2.0 B
$1.8 B
$1.5 B
$1.2 B
% Funded
65%
66%
70%
75%
80%
30+ Delinquency %
1.91%
2.50%
2.67%
2.69%
4.92%
NPL %
3.21%
5.68%
11.01%
17.61%
28.94%
Net Charge-offs %
1.16%
2.18%
4.63%
9.90%
12.29%
12
§ 3Q08 losses reflect ongoing weakness in housing market
§ Expect residential CRE portfolio to shrink to ~$1.3 billion by year-end 2008, with
the majority of the reduction to occur in the national portfolio
1Annualized
Total Commitment
$3.4 B
$3.2 B
$2.8 B
$2.4 B
$1.9 B
Total Balance
$2.2 B
$2.1 B
$2.0 B
$1.7 B
$1.5 B
National Balance
$1.5 B
$1.4 B
$1.4 B
$1.1 B
$0.9 B
% Funded
65%
66%
70%
70%
79%
30+ Delinquency %
1.25%
3.56%
2.73%
6.36%
5.73%
NPL %
3.93%
6.43%
12.07%
16.65%
23.64%
Net Charge-offs %
1
0.51%
3.82%
5.93%
6.23%
11.95%
Residential CRE - Performance Overview

13
C & I and Income CRE Summary
§ 3Q08 losses impacted by weakening economic
conditions, especially in businesses correlated
conditions, especially in businesses correlated
with the housing industry
§ C&I net charge-offs at $30mm
§ Driven by three sizeable individual credits,
each impacted by real estate market stress
§ Comprehensive review of correspondent banking
portfolio ($1.2B), trust preferred loans ($0.5B)
§ Relationship based approach
§ Ongoing stress in financial industry likely to
create pressure on credits
§ Factored into loan grading
1 Loans of approximately $1.2B on consolidated balance sheet are held in capital markets segment
Correspondent Loan Portfolio1
Res &
Income
CRE
20%
C&I
35%
Loans to
Financial
Institutions
25%
Mortgage
Warehouse
Lending
20%

14
Problem Loans Written Down to Net Realizable Value
FAS 114 Charge-Downs1
FAS 114 Loan Reserves
632
512
392
23%
write-down
(120)
38% below
appraised
value
1 Approximation based on appraisals
Reserves /
($ mm)
Reserves
Loans
Loans
FAS114 Impaired Loans w/o
Reserves
$0
$364
0.00%
FAS114 Impaired Loans w/
Reserves
$18
$40
43.81%
Other Commercial Loans
$344
$10,731
3.21%
Total
$362
$11,136
3.25%
$0
$100
$200
$300
$400
$500
$600
$700
Appraised
Value
Pre-Charge
Down Balance
Cumulative
Charge Down
Book Balance
(9/30/08)
§ All classified non-accrual loans over $1mm are assessed for impairment in
accordance with FAS-114
§ Loans typically charged-down to net realizable value rather than holding reserves
§ OTC loans 90 days past due or classified substandard initially written-down to current
appraised value (based on new appraisals)
§ Loans are then charged-down to 85% of appraised value when they reach 180 days past
due and to 78% of value when they are taken into OREO

15
Problem Loans Inflows Stable, Resolutions Increasing
ORE Flows
NPL Flows1
Non-Performing Assets
+$255
+$139
1Includes Commercial & One Time Close Portfolios only
$0
$200
$400
$600
$800
$1,000
$1,200
3Q07
4Q07
1Q08
2Q08
3Q08
NPLs
ORE
$ Millions
2Q08
3Q08
Beginning NPLs
$501
$722
+ Additions
$365
$356
+ Principal Increase
$3
$4
-Payments
($36)
($75)
- Charge-Offs
($86)
($122)
-Transfer to OREO
($24)
($30)
-Upgrade to Accrual
($1)
($1)
$ Millions
2Q08
3Q08
Beginning ORE
$84
$106
+ Additions
$35
$37
- Dispositions
($13)
($28)
Ending ORE
$106
$115
§ New inflows of NPLs/ORE stable over
prior quarter
§ NPL resolutions increased to $76 million
in 3Q08
§ Pricing supportive of carrying valuation
§ Workout resources actively pursuing asset
disposition opportunities

16
Expectations and Risks Summary
1Source: First Horizon public disclosure: Analyst Packet, 5/7/2008
2Other includes permanent mortgage, other consumer and credit card
§ Prior expectations and current outlook assume continued slow economic conditions
and continued home price declines into 2009
§ Better visibility into loss content of maturing OTC portfolio
§ Reserves reflect identifiable inherent loss content in portfolio
§ 2008 charge-off outlook towards the upper end of $485mm to $585mm forecast range
Balance
Allowance
Portfolio
at 9/30/08
($B)
at 9/30/08
($mm)
1Q08
(Actual)
2Q08
(Actual)
3Q08
(Actual)
Low End
High End
Current Outlook
(Range)
Residential CRE
$1.5
$112
$29
$30
$49
$99
$129
Moderately Above
One-Time Close
1.2
242
22
38
41
112
162
In Range
Home Equity
7.8
124
19
36
27
79
99
Moderately Above
Commercial
7.6
174
15
15
30
60
60
Moderately Above
Income CRE
2.0
76
10
3
1
20
20
In Range
Other
2
1.5
32
4
6
7
14
14
Moderately Above
Total
$21.6
$760
$99
$128
$155
$384
$484
$100mm Above
Range
Prior Expectations ($mm)
1
2008 Net Charge-Offs
($mm)
Net Charge-Offs

17
Financial Results

18
1Pretax, pre-provision is a non-GAAP number and is pretax income excluding provision
2Estimated capital ratios at 9/30/08
Numbers may not add to total due to rounding.
($ Millions)
3Q07
2Q08
3Q08
NII
238
$
239
$
223
$
Fee income
203
400
305
Revenue before sec. G/(L)
441
639
528
Securities G/(L)
-
(1)
0
Total revenue
441
638
528
Noninterest expense
(422)
(466)
(391)
Pretax pre-provision
1
20
172
137
Provision
(43)
(220)
(340)
Pretax income/(Loss)
(24)
(48)
(203)
Taxes
9
29
85
Disc. ops.
1
-
-
Net income/(loss)
(14)
$
(19)
$
(119)
$
Diluted shares
130
177
201
Diluted EPS
(0.11)
$
(0.11)
$
(0.59)
$
Consolidated Financial Results
§ NIM stable linked quarter at 3.01%
§ Fee income, expenses impacted by sale
of national mortgage business
§ Provision up linked quarter to $340mm
§ Reflects $185mm increase in reserves
§ Period-end shares increased to 201mm
§ Shares have been restated for previous
quarters to reflect stock dividend
§ Capital ratios improved significantly2
§ TCE/TA = 7.2%
§ Tier 1 = 10.9%

19
3Q08
Pre-tax Impact
($ mm)
Restructuring, repositioning, & efficiency related initiatives
Loss from mortgage divestiture
(17.5)
Employee & other costs
(16.4)
Other
Mortgage origination income adjustment
(15.5)
Item
Repurchase of debt
18.9
Other Significant Items
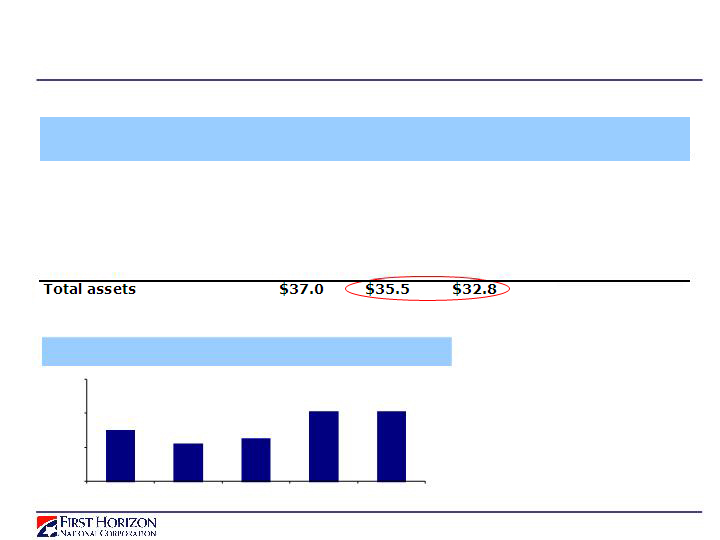
20
Consolidated Net Interest Margin
1Includes divestiture balances. Mortgage I/O assets included in Trading Securities. Mortgage hedge assets included in Other
Period-End Assets
Expected Changes
($ Billions)
4Q07
2Q08
3Q08
in 4Q08
Total loans
22.1
$
22.2
$
21.6
$
$(0.6 - 1.0)
Loans HFS
1
3.7
2.6
0.7
(0.0 - 0.1)
Trading securities
1
1.8
1.6
1.6
(0.0 - 0.1)
MSR
1
1.2
1.1
0.8
(0.0 - 0.1)
Other
1
8.3
8.0
8.1
(0.4 - 0.5)
$(1.0 - - 1.8)
2.87%
2.77%
2.81%
3.01%
3.01%
2.50%
2.75%
3.00%
3.25%
3Q07
4Q07
1Q08
2Q08
3Q08
Further Balance Sheet Reductions Expected
§ NIM stable in 3Q08
§ Short-term margin pressure may
result from deposit competition,
elevated LIBOR
§ Long-term, NIM should expand as
lower margin businesses reduced

21
Wholesale Funding1 Period-End Balances
($ Billions)
Source: First Horizon Internal Information
1Excluding Securities Sold Repos, Trading Liabilities and sub-debt and other collateralized borrowings of $4.0B
§ Expected balance sheet reduction adequate to offset debt maturities
§ Sources of excess liquidity estimated to remain ~$4B through 2009
§ FHLB availability, term MMDAs, repos, unpledged securities and Fed TAF
§ Credit sensitive funding replaced with secured, non-credit sensitive sources
§ Participating in CDARs program
Effectively $11.2
3Q07
4Q07
2Q08
3Q08
Fed Funds Purchased (Net of Sold)
2.4
3.3
0.8
0.2
Street CDs Short-term
2.8
4.3
-
-
Street CDs Long-term
1.0
1.0
0.9
0.5
Bank Notes
3.1
2.4
3.0
2.9
X-Notes
1.3
1.3
0.9
0.1
Insured Network Deposits
0.9
-
1.2
1.5
CDARs
-
-
-
0.2
Borrowings from FRB (TAF)
-
-
2.4
2.5
Borrowings from FHLB
2.0
0.5
3.5
3.5
Other Borrowings
0.2
0.1
0.5
0.1
13.6
12.9
13.2
11.4
Wholesale Funding Sources Less Credit Sensitive

22
§ Capital ratios improved in 3Q081
§ Ratios expected to build further through
end of 2008
§ $1B of balance sheet shrinkage would
improve TCE/TA ratio by 25 bps
Summary
Pro-Forma Assumptions
§ Q4 pre-tax pre-provision earnings of
$129.2mm based on median broker estimates2
§ Dividend paid in stock
§ Asset reduction assumed to be $1B
(60% risk-weighting) in 4Q08
§ 35% tax rate
§ Illustrates excess capital to regulatory
minimums
1 3Q08 & 4Q08 are estimates.
2 Based on broker estimates available to FHN as of Oct. 10, 2008. FHN has not announced
earnings estimates and has not endorsed these or any other broker estimates. Includes Fox Pitt, Merrill Lynch, Janney
Montgomery, Sterne Agee, SunTrust, Stifel Nicholas..
Regulatory
3 TCE/TA of 5% is a benchmark, rather than a regulatory minimum
Excess Capital to
Tier 1 RBC
6.0%
8.2%
10.5%
10.9%
11.1%
$1,324
Total Capital
10.0%
13.0%
15.2%
15.8%
16.1%
$1,596
TCE/TA
5.0%
5.0%
7.0%
7.2%
7.3%
$734
Tangible Book Value Per Share
$14.23
$12.14
$11.60
$11.38
12/31/2008 Proforma Assuming
Capital Position Strengthened

23
1Pretax, pre-provision is a non-GAAP number and is pretax income excluding provision
2Deposits change from 2Q08-3Q08 impacted by ($220) million from float timing
Numbers may not add to total due to rounding
($ Millions)
3Q07
2Q08
3Q08
NII
137
$
120
$
122
$
Deposit fees / cash mgmt
44
45
44
Other fees
48
48
44
Fee income
92
93
88
Total revenue
229
213
210
Noninterest expense
(154)
(150)
(159)
Pretax pre-provision
1
75
63
52
Provision
(19)
(90)
(58)
Pretax income (loss)
56
$
(27)
$
(7)
$
Balance Sheet
(Period End, $ Millions) 3Q07 2Q08 3Q08
Loans
$11,161
$11,037
$11,008
Core Deposits
(2)
10,281
10,033
9,664
Total Deposits
(2)
11,598
11,035
10,621
Repos
1,209
1,064
1,168
NIM
4.85%
4.38%
4.43%
Segment Results: Regional Banking
§ Continued customer growth
§ Targeted marketing investments
§��New branches in key TN-area metro areas
§ Customer accounts up 6% year over year
§ NIM increased by 5bps in 3Q08
§ Increase in funding costs
§ More competitive environment with deposits
§ Expenses up 6% linked quarter
§ Higher expenses from marketing efforts
and investments in new branches
§ Higher foreclosure expense in regional
bank
§ Pretax pre-provision income of $52mm
§ Elevated provision drove pre-tax loss of
$(7)mm
$(7)mm
§ Commercial loan grade migration
§ Reserves increased to 2.45% of loans

24
1Pretax, pre-provision is a non-GAAP number and is pretax income excluding provision
Numbers may not add to total due to rounding
($ Millions)
3Q07
2Q08
3Q08
NII
Fixed Income
46
105
80
Other fees
19
20
18
Fee income
Total revenue
79
143
118
Noninterest expense
Pretax pre-provision
1
5
43
30
Provision
Pretax income (loss)
3
$
24
$
(8)
$
2Q08
Balance Sheet
(Average, $ Millions)
Trading inventory
$1,810
3Q08
$1,631
3Q07
$1,356
Loans
1,291
1,491
1,759
Other earning assets
Total earning assets
4,633
4,778
4,391
Segment Results: Capital Markets
§ Fixed income sales remained strong,
although down from 1H08 very strong levels
§ Expenses down 12% linked quarter
§ Provision increased $19mm linked quarter
§ Deep review of correspondent banking
portfolio exposures
§ Impacted by single, large credit
§ Avg. loans of $1.8B includes Trust Preferred
loans moved from HFS to HTM in prior quarters
§ Managing loan portfolio, emphasizing
correspondent banking relationships
§ Relationship-based approach
§ P/E loans are flat linked quarter
25
1Other includes mortgage hedging assets and permanent mortgage
($ Millions)
Origination
Servicing
NII
18
$
5
$
Fees
Revenue
44
95
Expense
(76)
(13)
Provision
-
(3)
Pretax
(32)
$
79
$
Pre-Tax Income by Activity
(3Q08 Estimated)
($ Millions)
3Q07
2Q08
3Q08
NII
27
$
32
$
22
$
Net origination fees
(18)
134
20
Net servicing fees
50
42
81
Other fees
10
14
15
Fee income
42
190
116
Total revenue
69
222
138
Noninterest expense
(108)
(149)
(89)
Provision
0
(4)
(3)
Pretax income (loss)
(39)
$
69
$
46
$
Balance Sheet
(Period end, $ Millions)
Warehouse
$2,083
3Q07
$2,433
$537
2Q08
3Q08
Trading securities
539
407
279
MSR
1,431
877
772
Other
1
1,414
1,986
1,626
Segment Results: Mortgage Banking
§ 3Q08 originations reflect:
§ $(14)mm from adoption of accounting standards
§ $(16)mm of origination income adjustment
§ Two months of national activity (July/August)
§ Origination income will be limited to small Tennessee
operation: originations ~$0.5-1.0B annually
operation: originations ~$0.5-1.0B annually
§ Favorable hedging of $50mm
§ Servicing portfolio ended quarter at $65B
§ Servicing income expected to decline from run-off

26
§ Strong capital position - among the best in the industry
§ Improved liquidity
§ Reducing risk & balance sheet by winding down national real estate businesses
§ OTC balances down 40% YTD
§ National Residential CRE balances down 35% YTD
§ Remaining proactive on asset quality
§ Majority of NPLs written down to net realizable values, increasing disposition opportunity
§ Substantial loan loss reserve built over the last four quarters
§ Refocusing on regional banking and capital markets
§ First Horizon well positioned to manage through industry challenges
Summary